Pepin County, WI
Pepin County Map
Pepin County Overview
7,363
TOTAL POPULATION
3,781
MALE POPULATION
3,582
FEMALE POPULATION
105.56
MALES / 100 FEMALES
94.74
FEMALES / 100 MALES
46.3
MEDIAN AGE
2.9
AVG FAMILY SIZE
2.4
AVG HOUSEHOLD SIZE
$38,730
PER CAPITA INCOME
$83,788
AVG FAMILY INCOME
$70,833
AVG HOUSEHOLD INCOME
29.6%
WAGE / INCOME GAP [ % ]
70.4¢/ $1
WAGE / INCOME GAP [ $ ]
$9,083
FAMILY INCOME DEFICIT
0.42
INEQUALITY / GINI INDEX
3,703
LABOR FORCE [ PEOPLE ]
62.2%
PERCENT IN LABOR FORCE
2.2%
UNEMPLOYMENT RATE
Pepin County Area Codes
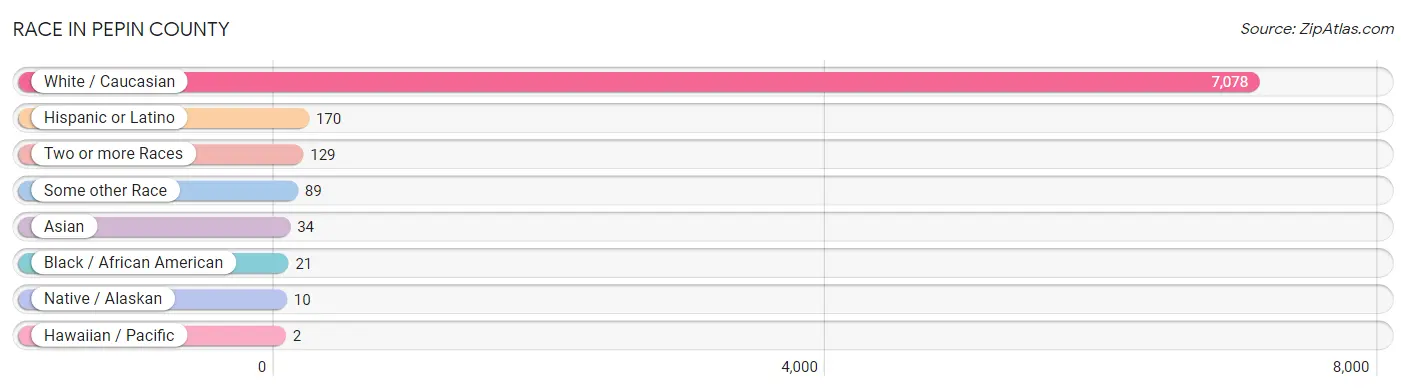
Race in Pepin County
The most populous races in Pepin County are White / Caucasian (7,078 | 96.1%), Hispanic or Latino (170 | 2.3%), and Two or more Races (129 | 1.8%).
| Race | # Population | % Population |
| Asian | 34 | 0.5% |
| Black / African American | 21 | 0.3% |
| Hawaiian / Pacific | 2 | 0.0% |
| Hispanic or Latino | 170 | 2.3% |
| Native / Alaskan | 10 | 0.1% |
| White / Caucasian | 7,078 | 96.1% |
| Two or more Races | 129 | 1.8% |
| Some other Race | 89 | 1.2% |
| Total | 7,363 | 100.0% |
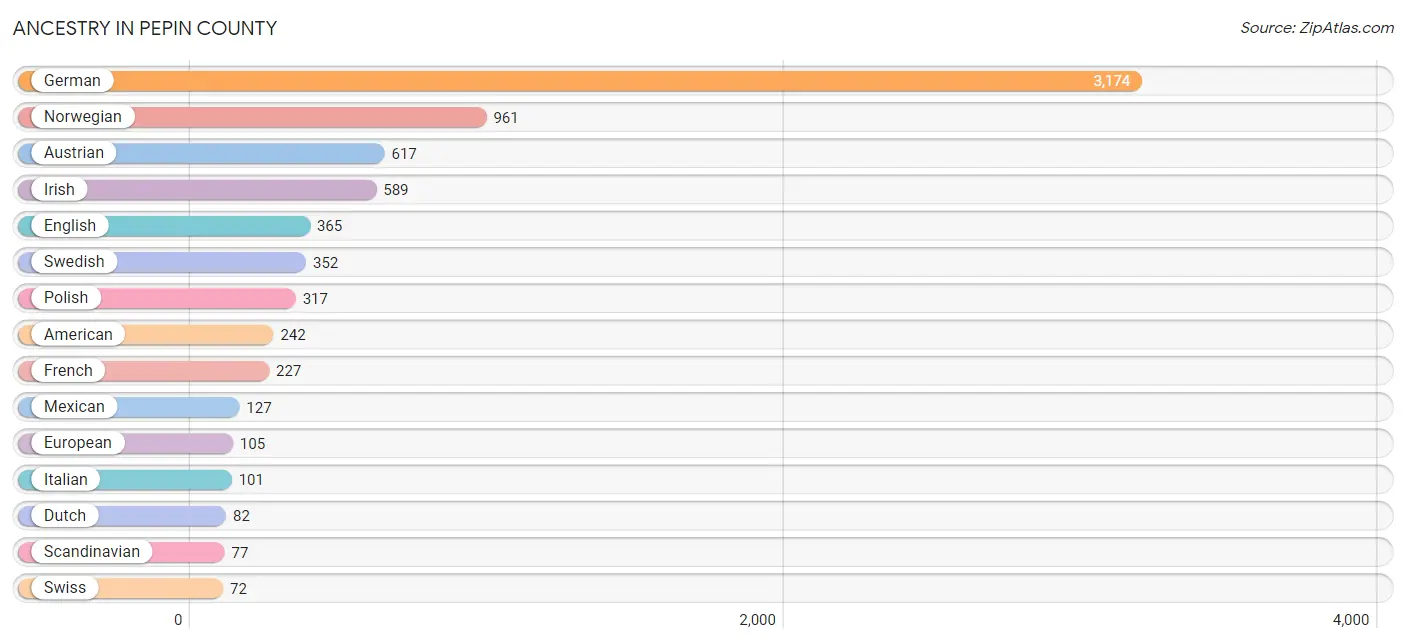
Ancestry in Pepin County
The most populous ancestries reported in Pepin County are German (3,174 | 43.1%), Norwegian (961 | 13.1%), Austrian (617 | 8.4%), Irish (589 | 8.0%), and English (365 | 5.0%), together accounting for 77.5% of all Pepin County residents.
| Ancestry | # Population | % Population |
| American | 242 | 3.3% |
| Arab | 1 | 0.0% |
| Austrian | 617 | 8.4% |
| Brazilian | 3 | 0.0% |
| British | 12 | 0.2% |
| Burmese | 13 | 0.2% |
| Canadian | 7 | 0.1% |
| Central American | 17 | 0.2% |
| Chippewa | 16 | 0.2% |
| Croatian | 2 | 0.0% |
| Czech | 39 | 0.5% |
| Czechoslovakian | 6 | 0.1% |
| Danish | 48 | 0.6% |
| Dutch | 82 | 1.1% |
| Eastern European | 15 | 0.2% |
| English | 365 | 5.0% |
| Ethiopian | 2 | 0.0% |
| European | 105 | 1.4% |
| Finnish | 27 | 0.4% |
| French | 227 | 3.1% |
| French American Indian | 1 | 0.0% |
| French Canadian | 36 | 0.5% |
| German | 3,174 | 43.1% |
| Greek | 3 | 0.0% |
| Guamanian / Chamorro | 2 | 0.0% |
| Guatemalan | 14 | 0.2% |
| Honduran | 3 | 0.0% |
| Icelander | 4 | 0.1% |
| Indian (Asian) | 9 | 0.1% |
| Iranian | 2 | 0.0% |
| Irish | 589 | 8.0% |
| Italian | 101 | 1.4% |
| Jamaican | 7 | 0.1% |
| Korean | 22 | 0.3% |
| Laotian | 16 | 0.2% |
| Lithuanian | 9 | 0.1% |
| Mexican | 127 | 1.7% |
| Moroccan | 1 | 0.0% |
| Northern European | 4 | 0.1% |
| Norwegian | 961 | 13.1% |
| Pennsylvania German | 67 | 0.9% |
| Peruvian | 2 | 0.0% |
| Polish | 317 | 4.3% |
| Puerto Rican | 4 | 0.1% |
| Russian | 9 | 0.1% |
| Scandinavian | 77 | 1.1% |
| Scotch-Irish | 20 | 0.3% |
| Scottish | 59 | 0.8% |
| Sioux | 8 | 0.1% |
| South American | 2 | 0.0% |
| Spaniard | 3 | 0.0% |
| Spanish | 1 | 0.0% |
| Subsaharan African | 2 | 0.0% |
| Swedish | 352 | 4.8% |
| Swiss | 72 | 1.0% |
| Thai | 2 | 0.0% |
| Ukrainian | 6 | 0.1% |
| Welsh | 14 | 0.2% |
| Yugoslavian | 13 | 0.2% | View All 59 Rows |
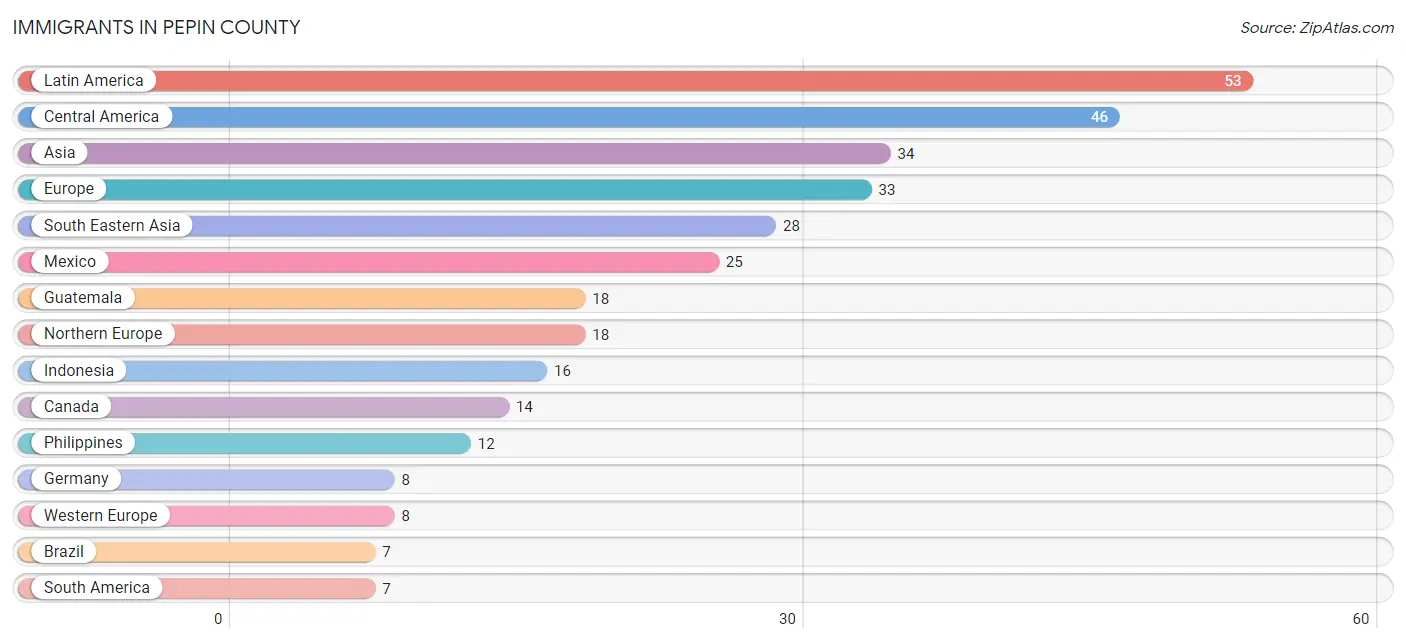
Immigrants in Pepin County
The most numerous immigrant groups reported in Pepin County came from Latin America (53 | 0.7%), Central America (46 | 0.6%), Asia (34 | 0.5%), Europe (33 | 0.4%), and South Eastern Asia (28 | 0.4%), together accounting for 2.6% of all Pepin County residents.
| Immigration Origin | # Population | % Population |
| Africa | 1 | 0.0% |
| Asia | 34 | 0.5% |
| Bosnia and Herzegovina | 1 | 0.0% |
| Brazil | 7 | 0.1% |
| Canada | 14 | 0.2% |
| Central America | 46 | 0.6% |
| China | 4 | 0.1% |
| Eastern Asia | 4 | 0.1% |
| Eastern Europe | 1 | 0.0% |
| England | 2 | 0.0% |
| Europe | 33 | 0.4% |
| Germany | 8 | 0.1% |
| Guatemala | 18 | 0.2% |
| Honduras | 3 | 0.0% |
| India | 2 | 0.0% |
| Indonesia | 16 | 0.2% |
| Latin America | 53 | 0.7% |
| Mexico | 25 | 0.3% |
| Morocco | 1 | 0.0% |
| Northern Africa | 1 | 0.0% |
| Northern Europe | 18 | 0.2% |
| Philippines | 12 | 0.2% |
| Scotland | 6 | 0.1% |
| South America | 7 | 0.1% |
| South Central Asia | 2 | 0.0% |
| South Eastern Asia | 28 | 0.4% |
| Southern Europe | 6 | 0.1% |
| Spain | 6 | 0.1% |
| Western Europe | 8 | 0.1% | View All 29 Rows |
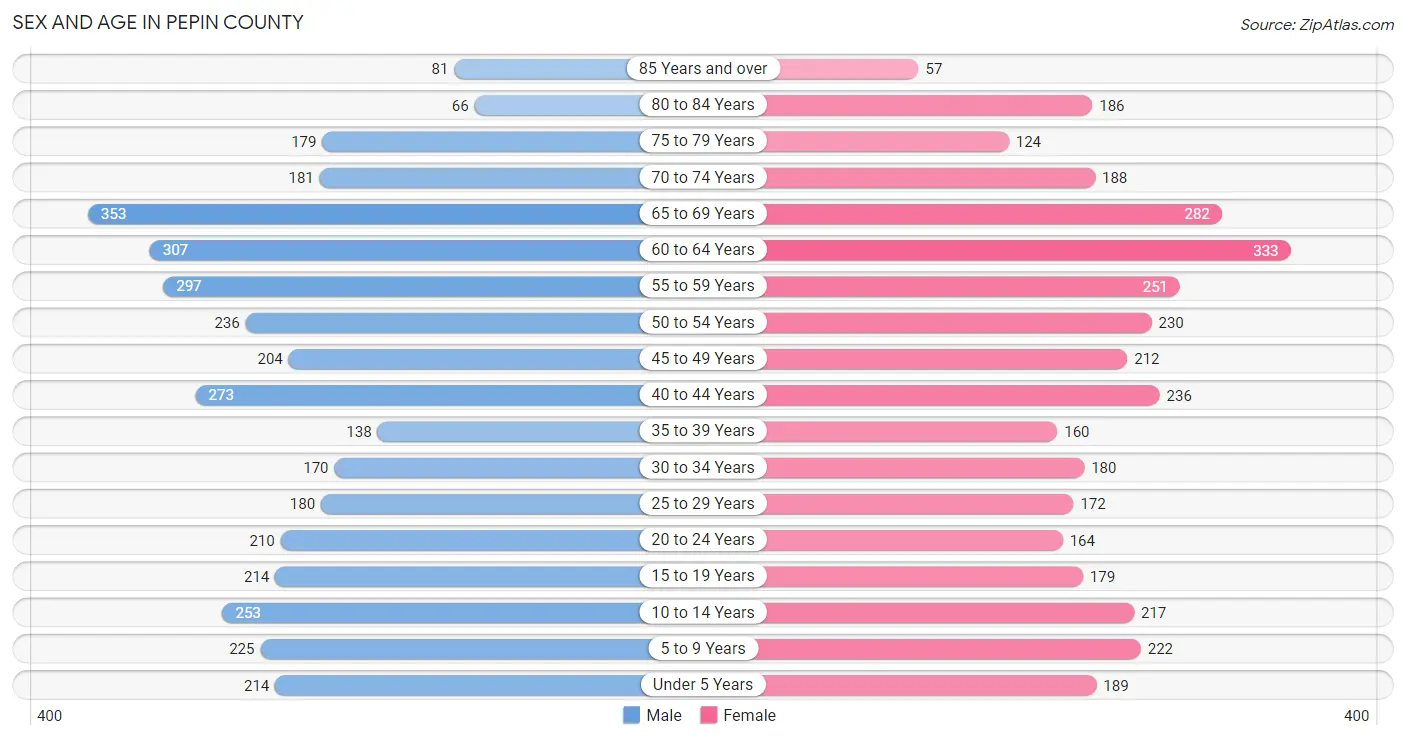
Sex and Age in Pepin County
Sex and Age in Pepin County
The most populous age groups in Pepin County are 65 to 69 Years (353 | 9.3%) for men and 60 to 64 Years (333 | 9.3%) for women.
| Age Bracket | Male | Female |
| Under 5 Years | 214 (5.7%) | 189 (5.3%) |
| 5 to 9 Years | 225 (5.9%) | 222 (6.2%) |
| 10 to 14 Years | 253 (6.7%) | 217 (6.1%) |
| 15 to 19 Years | 214 (5.7%) | 179 (5.0%) |
| 20 to 24 Years | 210 (5.6%) | 164 (4.6%) |
| 25 to 29 Years | 180 (4.8%) | 172 (4.8%) |
| 30 to 34 Years | 170 (4.5%) | 180 (5.0%) |
| 35 to 39 Years | 138 (3.6%) | 160 (4.5%) |
| 40 to 44 Years | 273 (7.2%) | 236 (6.6%) |
| 45 to 49 Years | 204 (5.4%) | 212 (5.9%) |
| 50 to 54 Years | 236 (6.2%) | 230 (6.4%) |
| 55 to 59 Years | 297 (7.9%) | 251 (7.0%) |
| 60 to 64 Years | 307 (8.1%) | 333 (9.3%) |
| 65 to 69 Years | 353 (9.3%) | 282 (7.9%) |
| 70 to 74 Years | 181 (4.8%) | 188 (5.2%) |
| 75 to 79 Years | 179 (4.7%) | 124 (3.5%) |
| 80 to 84 Years | 66 (1.8%) | 186 (5.2%) |
| 85 Years and over | 81 (2.1%) | 57 (1.6%) |
| Total | 3,781 (100.0%) | 3,582 (100.0%) |
Families and Households in Pepin County
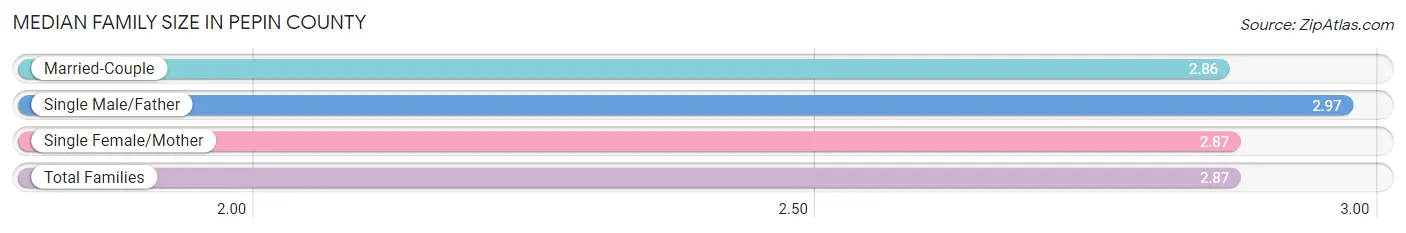
Median Family Size in Pepin County
The median family size in Pepin County is 2.87 persons per family, with single male/father families (155 | 7.5%) accounting for the largest median family size of 2.97 persons per family. On the other hand, married-couple families (1,764 | 85.3%) represent the smallest median family size with 2.86 persons per family.
| Family Type | # Families | Family Size |
| Married-Couple | 1,764 (85.3%) | 2.86 |
| Single Male/Father | 155 (7.5%) | 2.97 |
| Single Female/Mother | 149 (7.2%) | 2.87 |
| Total Families | 2,068 (100.0%) | 2.87 |
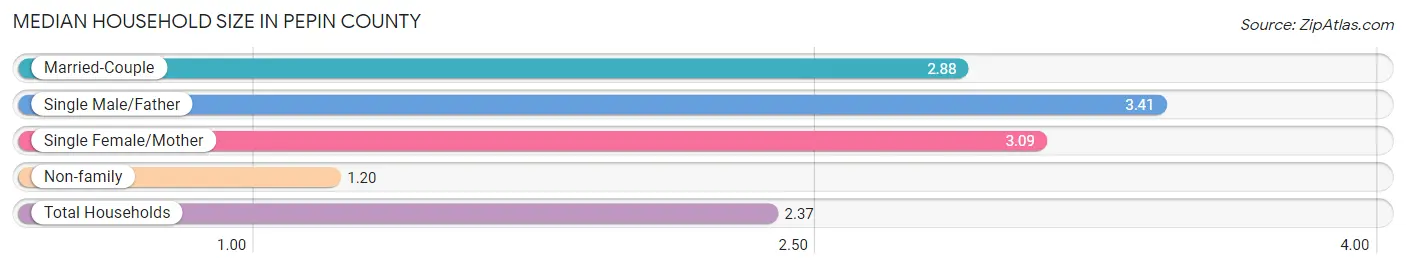
Median Household Size in Pepin County
The median household size in Pepin County is 2.37 persons per household, with single male/father households (155 | 5.0%) accounting for the largest median household size of 3.41 persons per household. non-family households (1,010 | 32.8%) represent the smallest median household size with 1.20 persons per household.
| Household Type | # Households | Household Size |
| Married-Couple | 1,764 (57.3%) | 2.88 |
| Single Male/Father | 155 (5.0%) | 3.41 |
| Single Female/Mother | 149 (4.8%) | 3.09 |
| Non-family | 1,010 (32.8%) | 1.20 |
| Total Households | 3,078 (100.0%) | 2.37 |
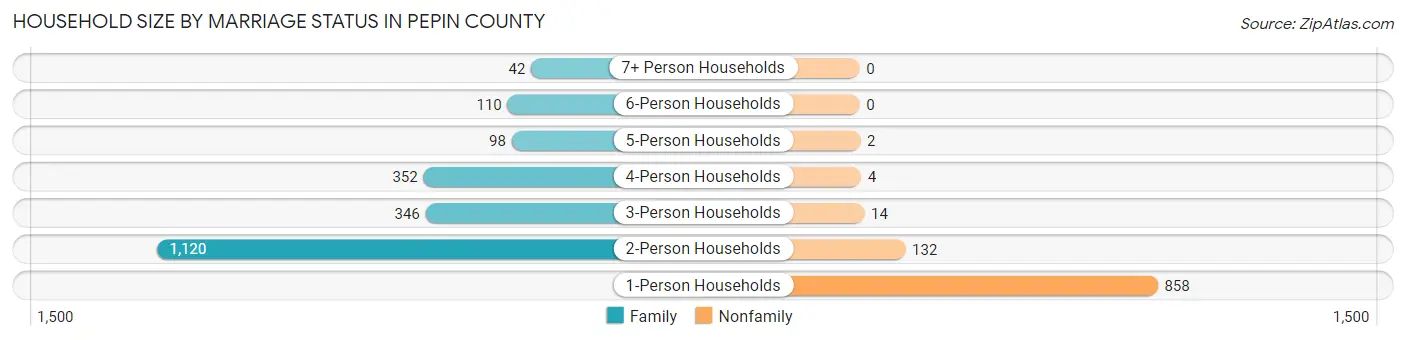
Household Size by Marriage Status in Pepin County
Out of a total of 3,078 households in Pepin County, 2,068 (67.2%) are family households, while 1,010 (32.8%) are nonfamily households. The most numerous type of family households are 2-person households, comprising 1,120, and the most common type of nonfamily households are 1-person households, comprising 858.
| Household Size | Family Households | Nonfamily Households |
| 1-Person Households | - | 858 (27.9%) |
| 2-Person Households | 1,120 (36.4%) | 132 (4.3%) |
| 3-Person Households | 346 (11.2%) | 14 (0.4%) |
| 4-Person Households | 352 (11.4%) | 4 (0.1%) |
| 5-Person Households | 98 (3.2%) | 2 (0.1%) |
| 6-Person Households | 110 (3.6%) | 0 (0.0%) |
| 7+ Person Households | 42 (1.4%) | 0 (0.0%) |
| Total | 2,068 (67.2%) | 1,010 (32.8%) |
Female Fertility in Pepin County
Fertility by Age in Pepin County
Average fertility rate in Pepin County is 65.0 births per 1,000 women. Women in the age bracket of 20 to 34 years have the highest fertility rate with 159.0 births per 1,000 women. Women in the age bracket of 20 to 34 years acount for 92.1% of all women with births.
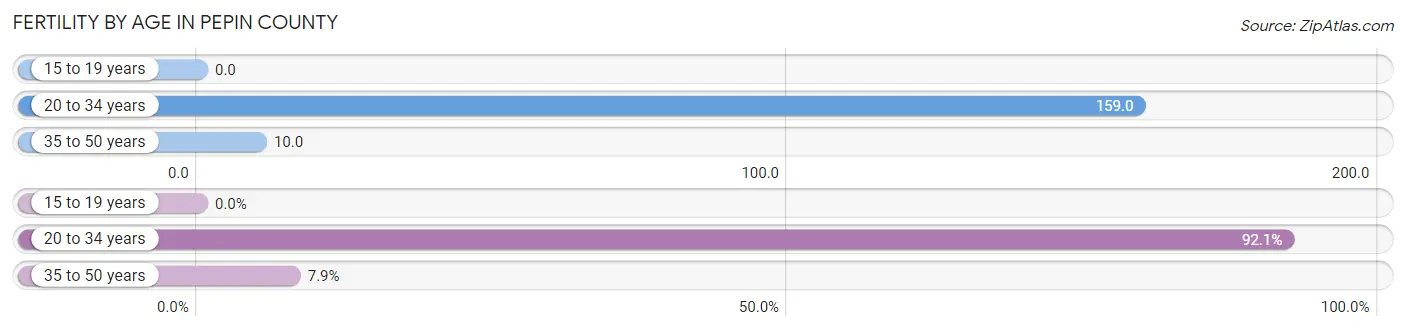
| Age Bracket | Women with Births | Births / 1,000 Women |
| 15 to 19 years | 0 (0.0%) | 0.0 |
| 20 to 34 years | 82 (92.1%) | 159.0 |
| 35 to 50 years | 7 (7.9%) | 10.0 |
| Total | 89 (100.0%) | 65.0 |
Fertility by Age by Marriage Status in Pepin County
76.4% of women with births (89) in Pepin County are married. The highest percentage of unmarried women with births falls into 20 to 34 years age bracket with 25.6% of them unmarried at the time of birth, while the lowest percentage of unmarried women with births belong to 35 to 50 years age bracket with 0.0% of them unmarried.
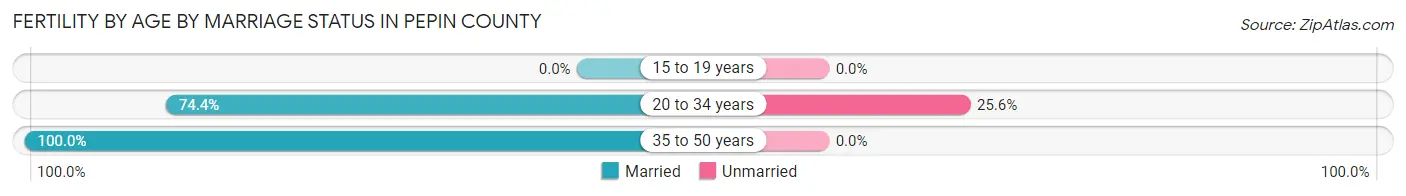
| Age Bracket | Married | Unmarried |
| 15 to 19 years | 0 (0.0%) | 0 (0.0%) |
| 20 to 34 years | 61 (74.4%) | 21 (25.6%) |
| 35 to 50 years | 7 (100.0%) | 0 (0.0%) |
| Total | 68 (76.4%) | 21 (23.6%) |
Fertility by Education in Pepin County
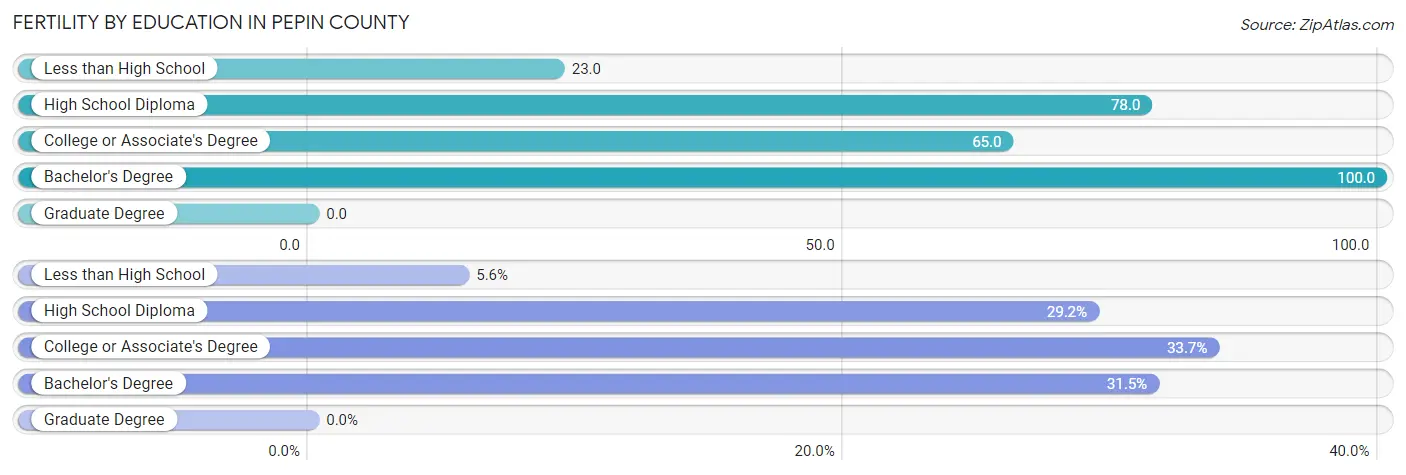
| Educational Attainment | Women with Births | Births / 1,000 Women |
| Less than High School | 5 (5.6%) | 23.0 |
| High School Diploma | 26 (29.2%) | 78.0 |
| College or Associate's Degree | 30 (33.7%) | 65.0 |
| Bachelor's Degree | 28 (31.5%) | 100.0 |
| Graduate Degree | 0 (0.0%) | 0.0 |
| Total | 89 (100.0%) | 65.0 |
Fertility by Education by Marriage Status in Pepin County
23.6% of women with births in Pepin County are unmarried. Women with the educational attainment of less than high school are most likely to be married with 100.0% of them married at childbirth, while women with the educational attainment of high school diploma are least likely to be married with 42.3% of them unmarried at childbirth.
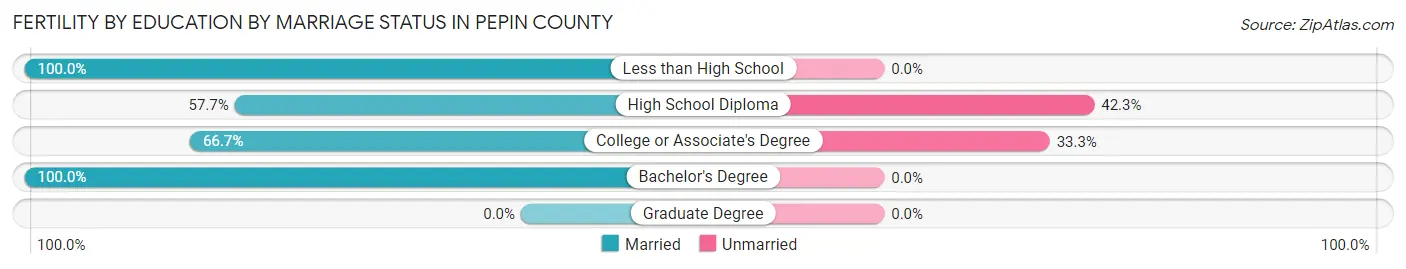
| Educational Attainment | Married | Unmarried |
| Less than High School | 5 (100.0%) | 0 (0.0%) |
| High School Diploma | 15 (57.7%) | 11 (42.3%) |
| College or Associate's Degree | 20 (66.7%) | 10 (33.3%) |
| Bachelor's Degree | 28 (100.0%) | 0 (0.0%) |
| Graduate Degree | 0 (0.0%) | 0 (0.0%) |
| Total | 68 (76.4%) | 21 (23.6%) |
Income in Pepin County
Income Overview in Pepin County
Per Capita Income in Pepin County is $38,730, while median incomes of families and households are $83,788 and $70,833 respectively.
| Characteristic | Number | Measure |
| Per Capita Income | 7,363 | $38,730 |
| Median Family Income | 2,068 | $83,788 |
| Mean Family Income | 2,068 | $104,780 |
| Median Household Income | 3,078 | $70,833 |
| Mean Household Income | 3,078 | $90,108 |
| Income Deficit | 2,068 | $9,083 |
| Wage / Income Gap (%) | 7,363 | 29.56% |
| Wage / Income Gap ($) | 7,363 | 70.44¢ per $1 |
| Gini / Inequality Index | 7,363 | 0.42 |
Earnings by Sex in Pepin County
Average Earnings in Pepin County are $41,751, $48,556 for men and $34,204 for women, a difference of 29.6%.
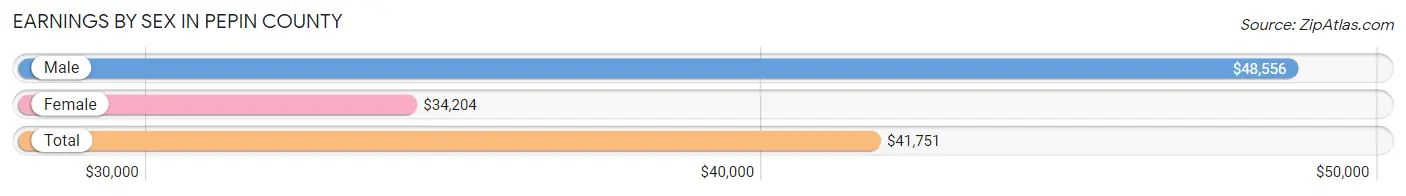
| Sex | Number | Average Earnings |
| Male | 2,125 (52.7%) | $48,556 |
| Female | 1,910 (47.3%) | $34,204 |
| Total | 4,035 (100.0%) | $41,751 |
Earnings by Sex by Income Bracket in Pepin County
The most common earnings brackets in Pepin County are $55,000 to $64,999 for men (263 | 12.4%) and $30,000 to $34,999 for women (231 | 12.1%).
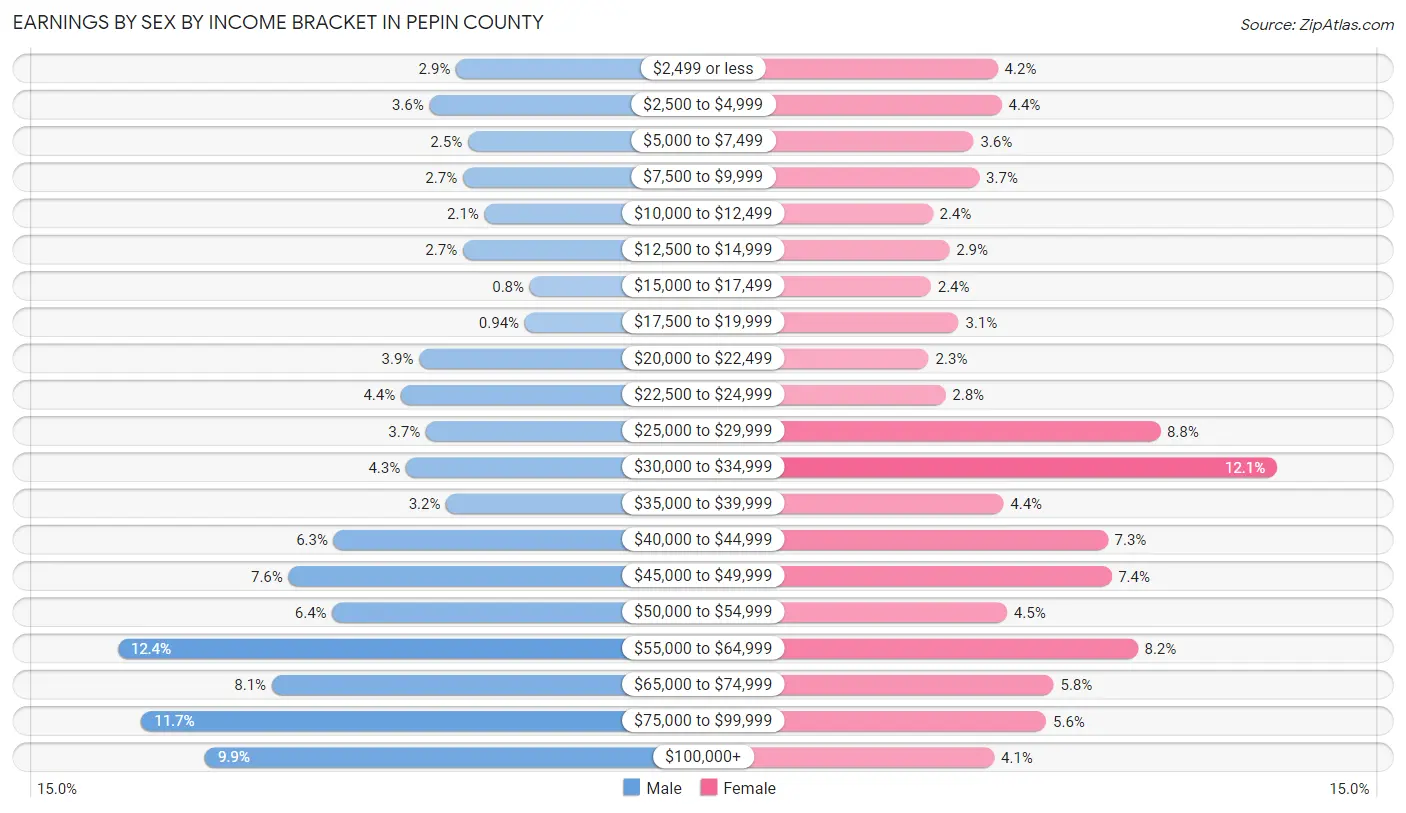
| Income | Male | Female |
| $2,499 or less | 61 (2.9%) | 81 (4.2%) |
| $2,500 to $4,999 | 77 (3.6%) | 83 (4.3%) |
| $5,000 to $7,499 | 54 (2.5%) | 68 (3.6%) |
| $7,500 to $9,999 | 57 (2.7%) | 71 (3.7%) |
| $10,000 to $12,499 | 44 (2.1%) | 46 (2.4%) |
| $12,500 to $14,999 | 57 (2.7%) | 55 (2.9%) |
| $15,000 to $17,499 | 17 (0.8%) | 45 (2.4%) |
| $17,500 to $19,999 | 20 (0.9%) | 60 (3.1%) |
| $20,000 to $22,499 | 83 (3.9%) | 44 (2.3%) |
| $22,500 to $24,999 | 94 (4.4%) | 53 (2.8%) |
| $25,000 to $29,999 | 79 (3.7%) | 168 (8.8%) |
| $30,000 to $34,999 | 91 (4.3%) | 231 (12.1%) |
| $35,000 to $39,999 | 67 (3.2%) | 84 (4.4%) |
| $40,000 to $44,999 | 134 (6.3%) | 140 (7.3%) |
| $45,000 to $49,999 | 161 (7.6%) | 142 (7.4%) |
| $50,000 to $54,999 | 135 (6.4%) | 86 (4.5%) |
| $55,000 to $64,999 | 263 (12.4%) | 156 (8.2%) |
| $65,000 to $74,999 | 171 (8.1%) | 111 (5.8%) |
| $75,000 to $99,999 | 249 (11.7%) | 107 (5.6%) |
| $100,000+ | 211 (9.9%) | 79 (4.1%) |
| Total | 2,125 (100.0%) | 1,910 (100.0%) |
Earnings by Sex by Educational Attainment in Pepin County
Average earnings in Pepin County are $53,163 for men and $38,506 for women, a difference of 27.6%. Men with an educational attainment of graduate degree enjoy the highest average annual earnings of $69,375, while those with high school diploma education earn the least with $47,400. Women with an educational attainment of graduate degree earn the most with the average annual earnings of $65,781, while those with less than high school education have the smallest earnings of $18,750.
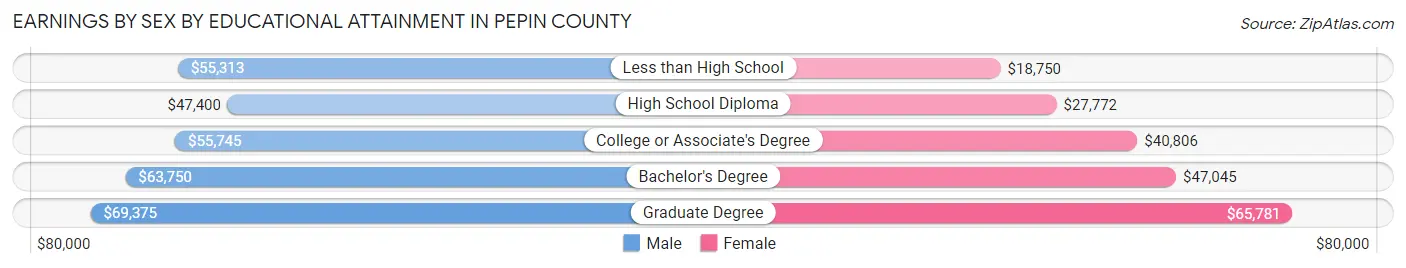
| Educational Attainment | Male Income | Female Income |
| Less than High School | $55,313 | $18,750 |
| High School Diploma | $47,400 | $27,772 |
| College or Associate's Degree | $55,745 | $40,806 |
| Bachelor's Degree | $63,750 | $47,045 |
| Graduate Degree | $69,375 | $65,781 |
| Total | $53,163 | $38,506 |
Family Income in Pepin County
Family Income Brackets in Pepin County
According to the Pepin County family income data, there are 513 families falling into the $100,000 to $149,999 income range, which is the most common income bracket and makes up 24.8% of all families. Conversely, the $10,000 to $14,999 income bracket is the least frequent group with only 17 families (0.8%) belonging to this category.
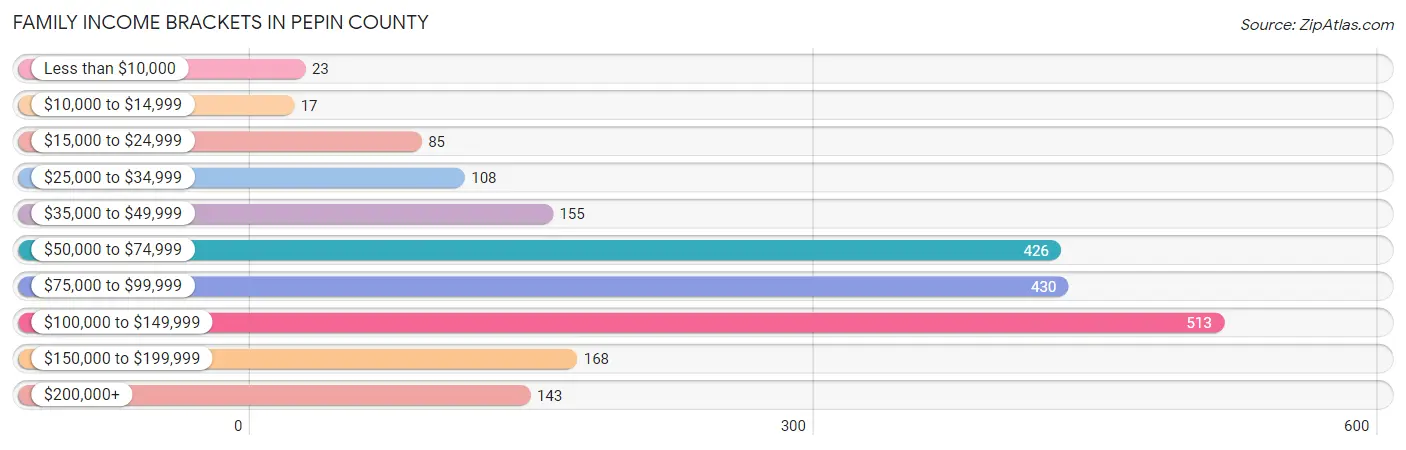
| Income Bracket | # Families | % Families |
| Less than $10,000 | 23 | 1.1% |
| $10,000 to $14,999 | 17 | 0.8% |
| $15,000 to $24,999 | 85 | 4.1% |
| $25,000 to $34,999 | 108 | 5.2% |
| $35,000 to $49,999 | 155 | 7.5% |
| $50,000 to $74,999 | 426 | 20.6% |
| $75,000 to $99,999 | 430 | 20.8% |
| $100,000 to $149,999 | 513 | 24.8% |
| $150,000 to $199,999 | 168 | 8.1% |
| $200,000+ | 143 | 6.9% |
Family Income by Famaliy Size in Pepin County
5-person families (96 | 4.6%) account for the highest median family income in Pepin County with $128,750 per family, while 2-person families (1,168 | 56.5%) have the highest median income of $39,584 per family member.
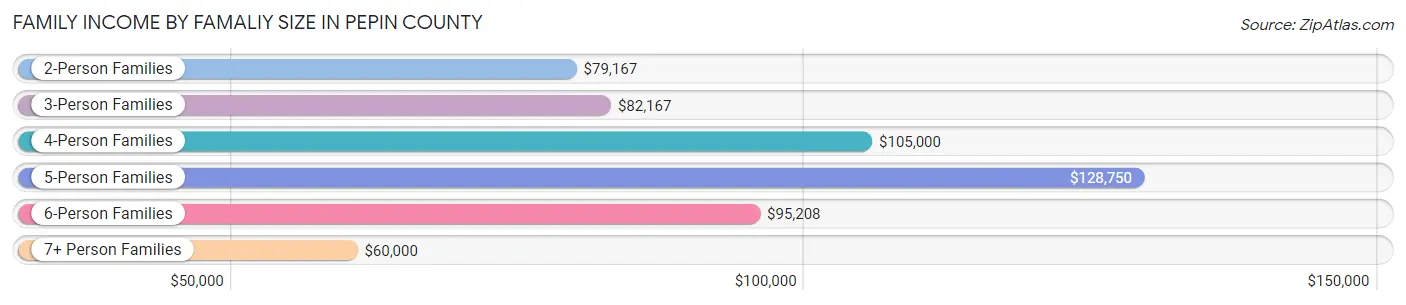
| Income Bracket | # Families | Median Income |
| 2-Person Families | 1,168 (56.5%) | $79,167 |
| 3-Person Families | 336 (16.3%) | $82,167 |
| 4-Person Families | 336 (16.3%) | $105,000 |
| 5-Person Families | 96 (4.6%) | $128,750 |
| 6-Person Families | 94 (4.5%) | $95,208 |
| 7+ Person Families | 38 (1.8%) | $60,000 |
| Total | 2,068 (100.0%) | $83,788 |
Family Income by Number of Earners in Pepin County
The median family income in Pepin County is $83,788, with families comprising 3+ earners (190) having the highest median family income of $125,833, while families with no earners (328) have the lowest median family income of $55,500, accounting for 9.2% and 15.9% of families, respectively.
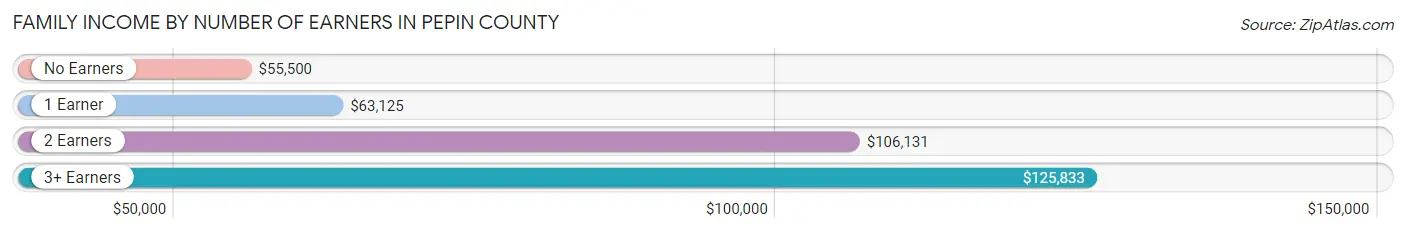
| Number of Earners | # Families | Median Income |
| No Earners | 328 (15.9%) | $55,500 |
| 1 Earner | 590 (28.5%) | $63,125 |
| 2 Earners | 960 (46.4%) | $106,131 |
| 3+ Earners | 190 (9.2%) | $125,833 |
| Total | 2,068 (100.0%) | $83,788 |
Household Income in Pepin County
Household Income Brackets in Pepin County
With 628 households falling in the category, the $50,000 to $74,999 income range is the most frequent in Pepin County, accounting for 20.4% of all households. In contrast, only 58 households (1.9%) fall into the less than $10,000 income bracket, making it the least populous group.
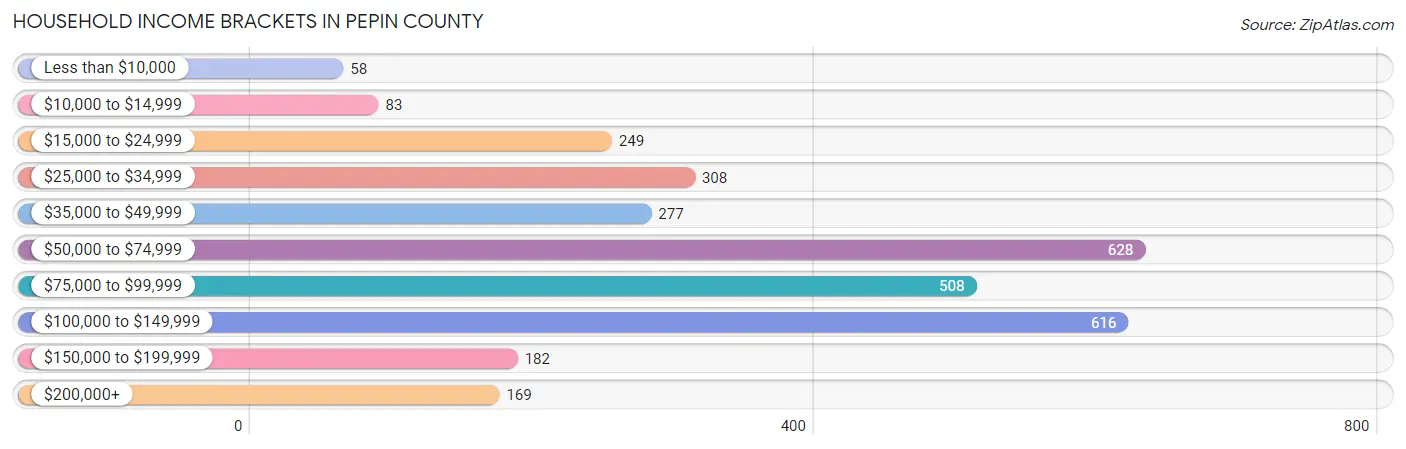
| Income Bracket | # Households | % Households |
| Less than $10,000 | 58 | 1.9% |
| $10,000 to $14,999 | 83 | 2.7% |
| $15,000 to $24,999 | 249 | 8.1% |
| $25,000 to $34,999 | 308 | 10.0% |
| $35,000 to $49,999 | 277 | 9.0% |
| $50,000 to $74,999 | 628 | 20.4% |
| $75,000 to $99,999 | 508 | 16.5% |
| $100,000 to $149,999 | 616 | 20.0% |
| $150,000 to $199,999 | 182 | 5.9% |
| $200,000+ | 169 | 5.5% |
Household Income by Householder Age in Pepin County
The median household income in Pepin County is $70,833, with the highest median household income of $87,917 found in the 25 to 44 years age bracket for the primary householder. A total of 784 households (25.5%) fall into this category. Meanwhile, the 15 to 24 years age bracket for the primary householder has the lowest median household income of $50,625, with 117 households (3.8%) in this group.
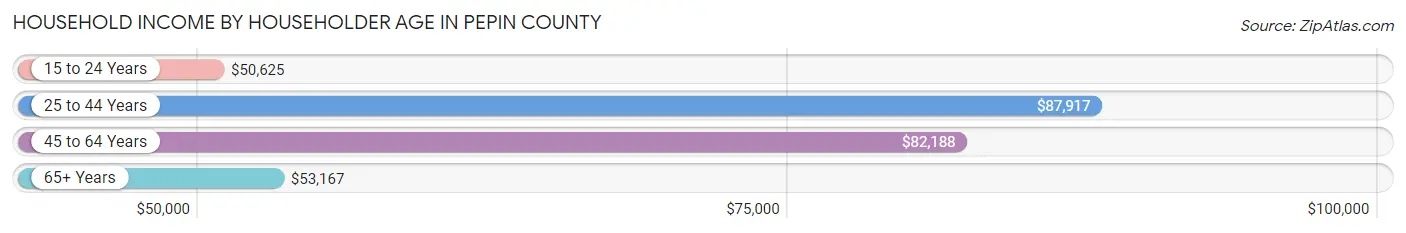
| Income Bracket | # Households | Median Income |
| 15 to 24 Years | 117 (3.8%) | $50,625 |
| 25 to 44 Years | 784 (25.5%) | $87,917 |
| 45 to 64 Years | 1,117 (36.3%) | $82,188 |
| 65+ Years | 1,060 (34.4%) | $53,167 |
| Total | 3,078 (100.0%) | $70,833 |
Poverty in Pepin County
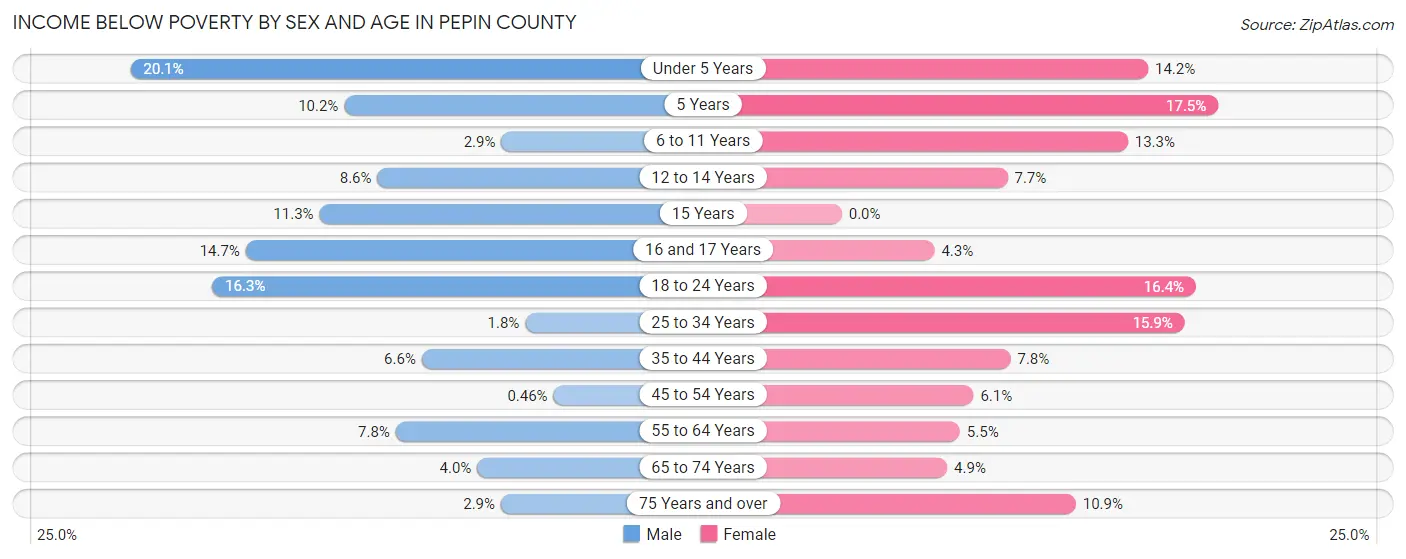
Income Below Poverty by Sex and Age in Pepin County
With 6.6% poverty level for males and 9.1% for females among the residents of Pepin County, under 5 year old males and 5 year old females are the most vulnerable to poverty, with 43 males (20.1%) and 11 females (17.5%) in their respective age groups living below the poverty level.
| Age Bracket | Male | Female |
| Under 5 Years | 43 (20.1%) | 26 (14.2%) |
| 5 Years | 6 (10.2%) | 11 (17.5%) |
| 6 to 11 Years | 8 (2.9%) | 30 (13.3%) |
| 12 to 14 Years | 12 (8.6%) | 11 (7.7%) |
| 15 Years | 6 (11.3%) | 0 (0.0%) |
| 16 and 17 Years | 14 (14.7%) | 4 (4.3%) |
| 18 to 24 Years | 45 (16.3%) | 35 (16.4%) |
| 25 to 34 Years | 6 (1.8%) | 56 (15.9%) |
| 35 to 44 Years | 27 (6.6%) | 31 (7.8%) |
| 45 to 54 Years | 2 (0.5%) | 27 (6.1%) |
| 55 to 64 Years | 47 (7.8%) | 32 (5.5%) |
| 65 to 74 Years | 21 (4.0%) | 23 (4.9%) |
| 75 Years and over | 9 (2.9%) | 38 (10.9%) |
| Total | 246 (6.6%) | 324 (9.1%) |
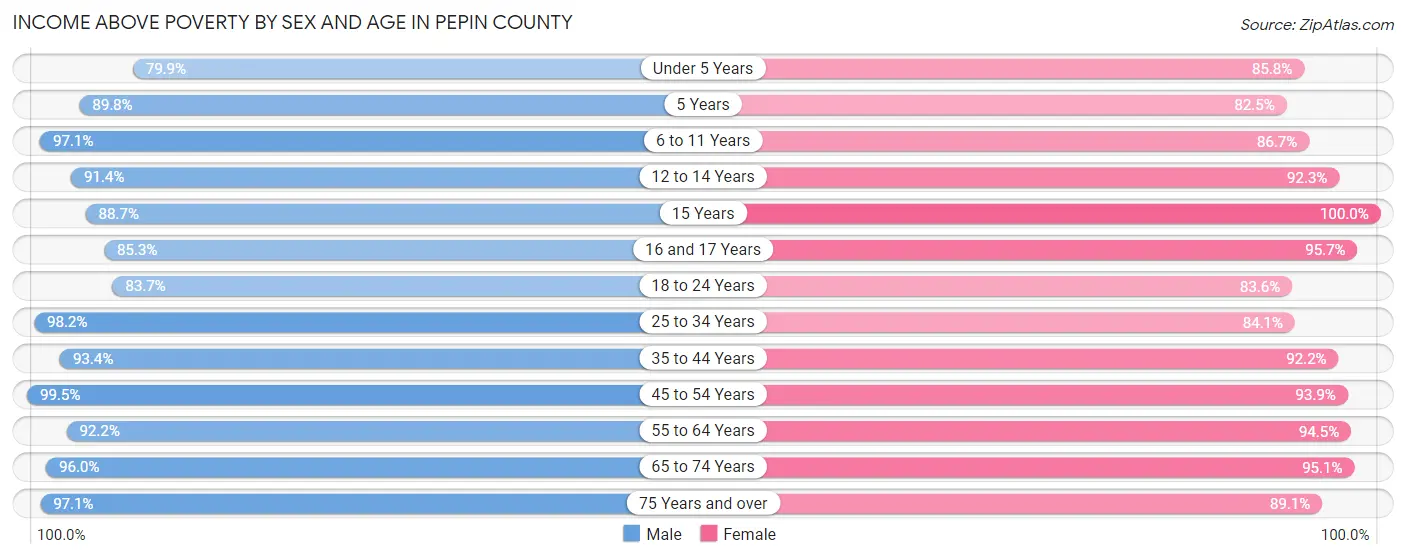
Income Above Poverty by Sex and Age in Pepin County
According to the poverty statistics in Pepin County, males aged 45 to 54 years and females aged 15 years are the age groups that are most secure financially, with 99.5% of males and 100.0% of females in these age groups living above the poverty line.
| Age Bracket | Male | Female |
| Under 5 Years | 171 (79.9%) | 157 (85.8%) |
| 5 Years | 53 (89.8%) | 52 (82.5%) |
| 6 to 11 Years | 270 (97.1%) | 196 (86.7%) |
| 12 to 14 Years | 127 (91.4%) | 132 (92.3%) |
| 15 Years | 47 (88.7%) | 37 (100.0%) |
| 16 and 17 Years | 81 (85.3%) | 89 (95.7%) |
| 18 to 24 Years | 231 (83.7%) | 178 (83.6%) |
| 25 to 34 Years | 333 (98.2%) | 296 (84.1%) |
| 35 to 44 Years | 384 (93.4%) | 365 (92.2%) |
| 45 to 54 Years | 429 (99.5%) | 415 (93.9%) |
| 55 to 64 Years | 557 (92.2%) | 552 (94.5%) |
| 65 to 74 Years | 504 (96.0%) | 447 (95.1%) |
| 75 Years and over | 301 (97.1%) | 312 (89.1%) |
| Total | 3,488 (93.4%) | 3,228 (90.9%) |
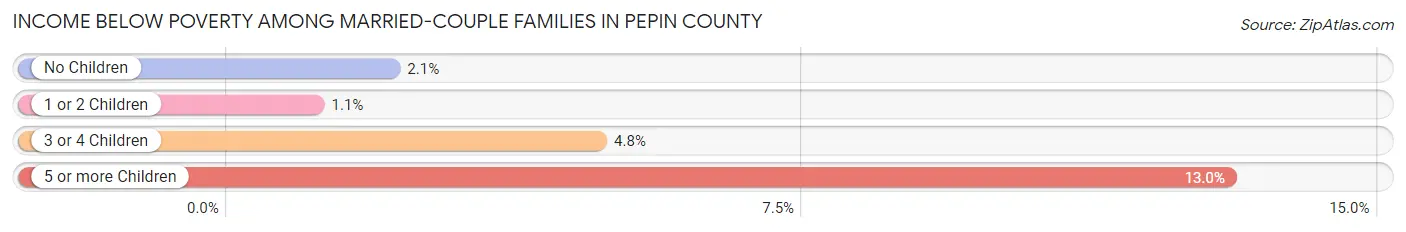
Income Below Poverty Among Married-Couple Families in Pepin County
The poverty statistics for married-couple families in Pepin County show that 2.3% or 40 of the total 1,764 families live below the poverty line. Families with 5 or more children have the highest poverty rate of 13.0%, comprising of 3 families. On the other hand, families with 1 or 2 children have the lowest poverty rate of 1.1%, which includes 5 families.
| Children | Above Poverty | Below Poverty |
| No Children | 1,110 (97.9%) | 24 (2.1%) |
| 1 or 2 Children | 436 (98.9%) | 5 (1.1%) |
| 3 or 4 Children | 158 (95.2%) | 8 (4.8%) |
| 5 or more Children | 20 (87.0%) | 3 (13.0%) |
| Total | 1,724 (97.7%) | 40 (2.3%) |
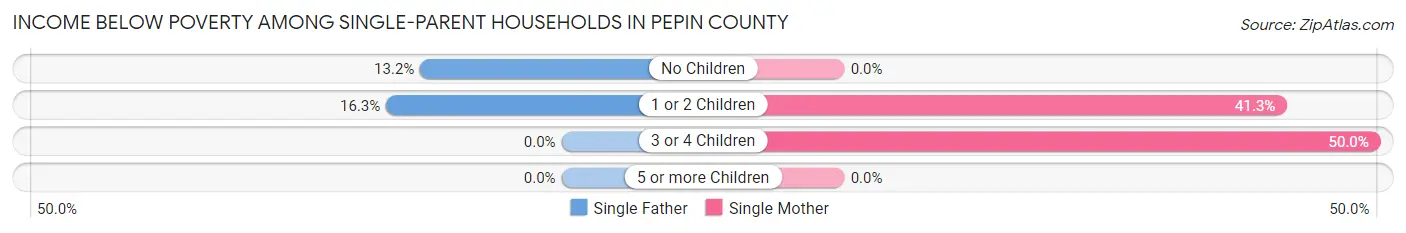
Income Below Poverty Among Single-Parent Households in Pepin County
According to the poverty data in Pepin County, 13.6% or 21 single-father households and 34.2% or 51 single-mother households are living below the poverty line. Among single-father households, those with 1 or 2 children have the highest poverty rate, with 16 households (16.3%) experiencing poverty. Likewise, among single-mother households, those with 3 or 4 children have the highest poverty rate, with 13 households (50.0%) falling below the poverty line.
| Children | Single Father | Single Mother |
| No Children | 5 (13.2%) | 0 (0.0%) |
| 1 or 2 Children | 16 (16.3%) | 38 (41.3%) |
| 3 or 4 Children | 0 (0.0%) | 13 (50.0%) |
| 5 or more Children | 0 (0.0%) | 0 (0.0%) |
| Total | 21 (13.6%) | 51 (34.2%) |
Income Below Poverty Among Married-Couple vs Single-Parent Households in Pepin County
The poverty data for Pepin County shows that 40 of the married-couple family households (2.3%) and 72 of the single-parent households (23.7%) are living below the poverty level. Within the married-couple family households, those with 5 or more children have the highest poverty rate, with 3 households (13.0%) falling below the poverty line. Among the single-parent households, those with 3 or 4 children have the highest poverty rate, with 13 household (30.9%) living below poverty.
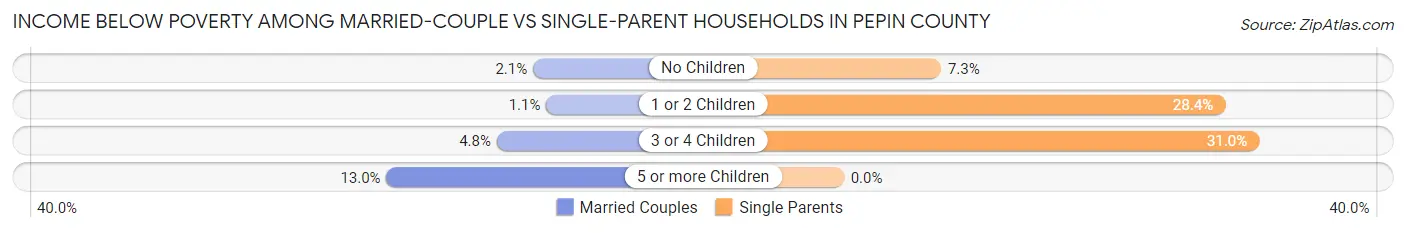
| Children | Married-Couple Families | Single-Parent Households |
| No Children | 24 (2.1%) | 5 (7.2%) |
| 1 or 2 Children | 5 (1.1%) | 54 (28.4%) |
| 3 or 4 Children | 8 (4.8%) | 13 (30.9%) |
| 5 or more Children | 3 (13.0%) | 0 (0.0%) |
| Total | 40 (2.3%) | 72 (23.7%) |
Employment Characteristics in Pepin County
Employment by Class of Employer in Pepin County
Among the 3,533 employed individuals in Pepin County, private company employees (2,206 | 62.4%), local government employees (365 | 10.3%), and self-employed (not incorporated) (334 | 9.5%) make up the most common classes of employment.
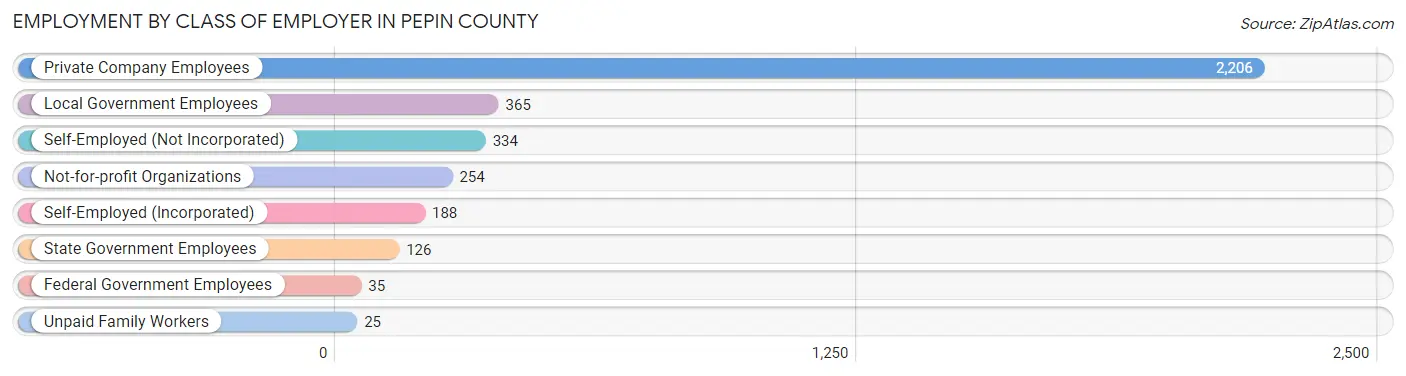
| Employer Class | # Employees | % Employees |
| Private Company Employees | 2,206 | 62.4% |
| Self-Employed (Incorporated) | 188 | 5.3% |
| Self-Employed (Not Incorporated) | 334 | 9.5% |
| Not-for-profit Organizations | 254 | 7.2% |
| Local Government Employees | 365 | 10.3% |
| State Government Employees | 126 | 3.6% |
| Federal Government Employees | 35 | 1.0% |
| Unpaid Family Workers | 25 | 0.7% |
| Total | 3,533 | 100.0% |
Employment Status by Age in Pepin County
According to the labor force statistics for Pepin County, out of the total population over 16 years of age (5,953), 62.2% or 3,703 individuals are in the labor force, with 2.2% or 81 of them unemployed. The age group with the highest labor force participation rate is 25 to 29 years, with 92.6% or 326 individuals in the labor force. Within the labor force, the 65 to 74 years age range has the highest percentage of unemployed individuals, with 8.8% or 22 of them being unemployed.
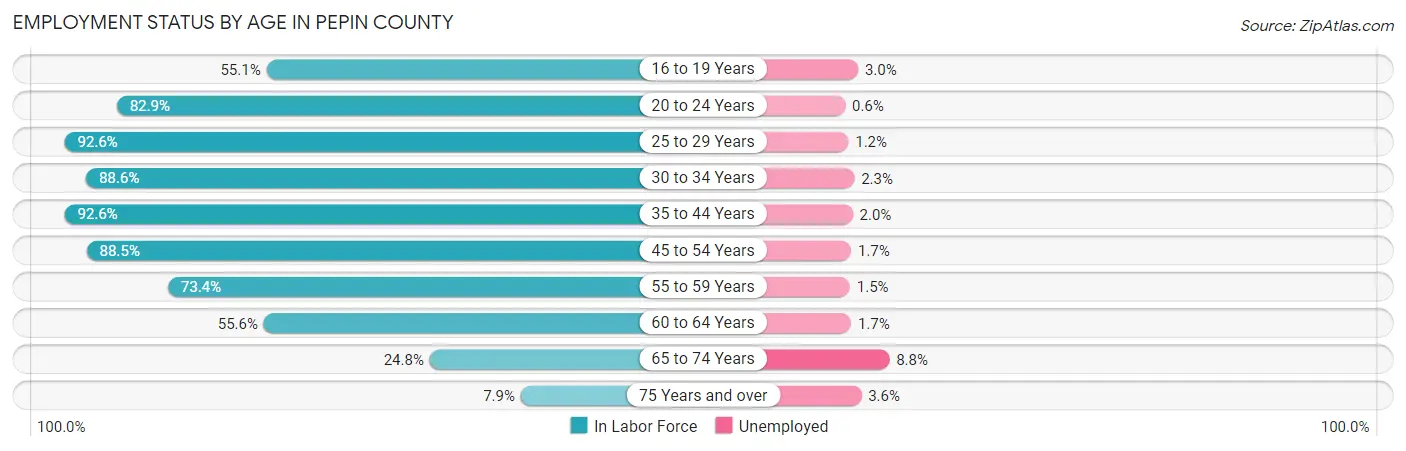
| Age Bracket | In Labor Force | Unemployed |
| 16 to 19 Years | 167 (55.1%) | 5 (3.0%) |
| 20 to 24 Years | 310 (82.9%) | 2 (0.6%) |
| 25 to 29 Years | 326 (92.6%) | 4 (1.2%) |
| 30 to 34 Years | 310 (88.6%) | 7 (2.3%) |
| 35 to 44 Years | 747 (92.6%) | 15 (2.0%) |
| 45 to 54 Years | 781 (88.5%) | 13 (1.7%) |
| 55 to 59 Years | 402 (73.4%) | 6 (1.5%) |
| 60 to 64 Years | 356 (55.6%) | 6 (1.7%) |
| 65 to 74 Years | 249 (24.8%) | 22 (8.8%) |
| 75 Years and over | 55 (7.9%) | 2 (3.6%) |
| Total | 3,703 (62.2%) | 81 (2.2%) |
Employment Status by Educational Attainment in Pepin County
According to labor force statistics for Pepin County, 81.6% of individuals (2,920) out of the total population between 25 and 64 years of age (3,579) are in the labor force, with 1.7% or 50 of them being unemployed. The group with the highest labor force participation rate are those with the educational attainment of bachelor's degree or higher, with 89.7% or 695 individuals in the labor force. Within the labor force, individuals with college / associate degree education have the highest percentage of unemployment, with 3.8% or 42 of them being unemployed.
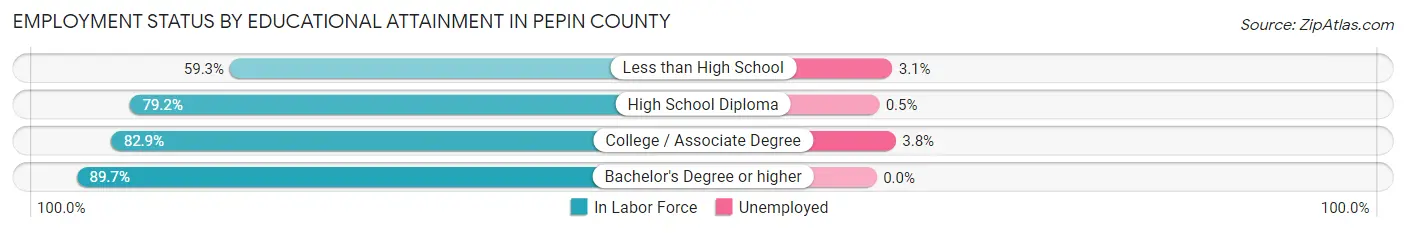
| Educational Attainment | In Labor Force | Unemployed |
| Less than High School | 128 (59.3%) | 7 (3.1%) |
| High School Diploma | 993 (79.2%) | 6 (0.5%) |
| College / Associate Degree | 1,106 (82.9%) | 51 (3.8%) |
| Bachelor's Degree or higher | 695 (89.7%) | 0 (0.0%) |
| Total | 2,920 (81.6%) | 61 (1.7%) |
Employment Occupations by Sex in Pepin County
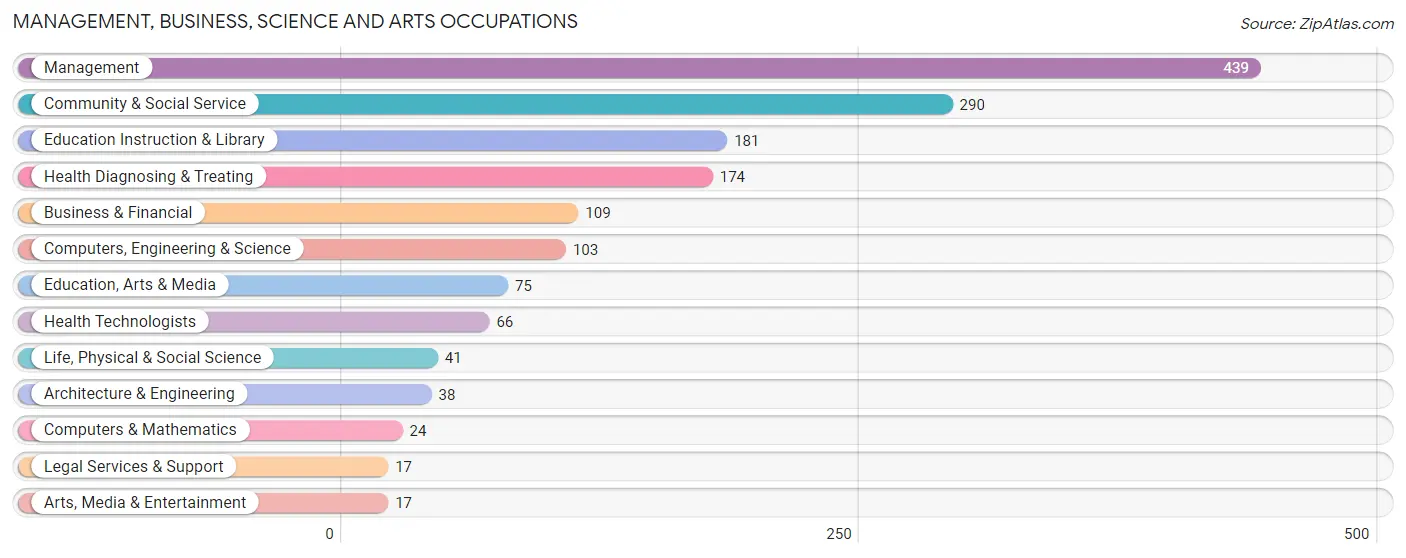
Management, Business, Science and Arts Occupations
The most common Management, Business, Science and Arts occupations in Pepin County are Management (439 | 12.1%), Community & Social Service (290 | 8.0%), Education Instruction & Library (181 | 5.0%), Health Diagnosing & Treating (174 | 4.8%), and Business & Financial (109 | 3.0%).
Management, Business, Science and Arts Occupations by Sex
Within the Management, Business, Science and Arts occupations in Pepin County, the most male-oriented occupations are Computers & Mathematics (70.8%), Architecture & Engineering (68.4%), and Computers, Engineering & Science (66.0%), while the most female-oriented occupations are Education, Arts & Media (96.0%), Health Technologists (87.9%), and Health Diagnosing & Treating (79.3%).

| Occupation | Male | Female |
| Management | 289 (65.8%) | 150 (34.2%) |
| Business & Financial | 23 (21.1%) | 86 (78.9%) |
| Computers, Engineering & Science | 68 (66.0%) | 35 (34.0%) |
| Computers & Mathematics | 17 (70.8%) | 7 (29.2%) |
| Architecture & Engineering | 26 (68.4%) | 12 (31.6%) |
| Life, Physical & Social Science | 25 (61.0%) | 16 (39.0%) |
| Community & Social Service | 69 (23.8%) | 221 (76.2%) |
| Education, Arts & Media | 3 (4.0%) | 72 (96.0%) |
| Legal Services & Support | 6 (35.3%) | 11 (64.7%) |
| Education Instruction & Library | 55 (30.4%) | 126 (69.6%) |
| Arts, Media & Entertainment | 5 (29.4%) | 12 (70.6%) |
| Health Diagnosing & Treating | 36 (20.7%) | 138 (79.3%) |
| Health Technologists | 8 (12.1%) | 58 (87.9%) |
| Total (Category) | 485 (43.5%) | 630 (56.5%) |
| Total (Overall) | 1,921 (53.0%) | 1,700 (46.9%) |
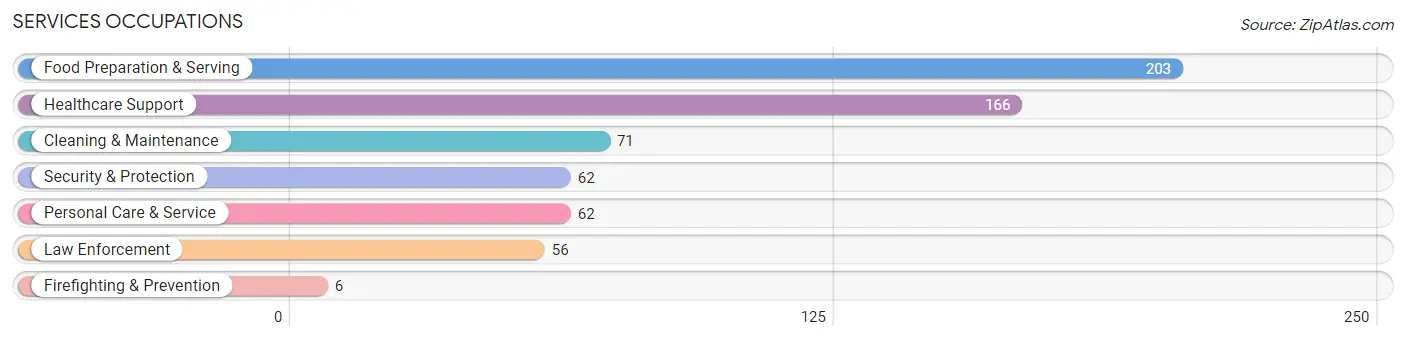
Services Occupations
The most common Services occupations in Pepin County are Food Preparation & Serving (203 | 5.6%), Healthcare Support (166 | 4.6%), Cleaning & Maintenance (71 | 2.0%), Security & Protection (62 | 1.7%), and Personal Care & Service (62 | 1.7%).
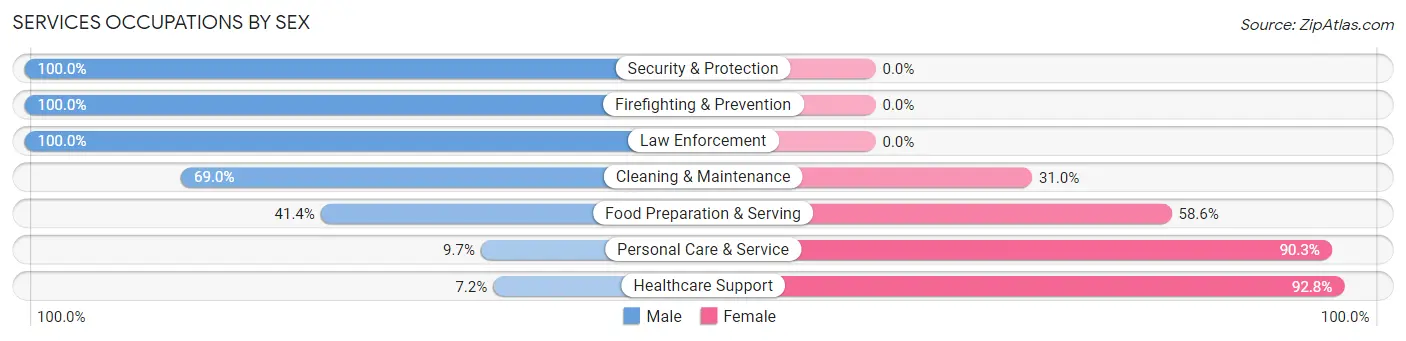
Services Occupations by Sex
Within the Services occupations in Pepin County, the most male-oriented occupations are Security & Protection (100.0%), Firefighting & Prevention (100.0%), and Law Enforcement (100.0%), while the most female-oriented occupations are Healthcare Support (92.8%), Personal Care & Service (90.3%), and Food Preparation & Serving (58.6%).
| Occupation | Male | Female |
| Healthcare Support | 12 (7.2%) | 154 (92.8%) |
| Security & Protection | 62 (100.0%) | 0 (0.0%) |
| Firefighting & Prevention | 6 (100.0%) | 0 (0.0%) |
| Law Enforcement | 56 (100.0%) | 0 (0.0%) |
| Food Preparation & Serving | 84 (41.4%) | 119 (58.6%) |
| Cleaning & Maintenance | 49 (69.0%) | 22 (31.0%) |
| Personal Care & Service | 6 (9.7%) | 56 (90.3%) |
| Total (Category) | 213 (37.8%) | 351 (62.2%) |
| Total (Overall) | 1,921 (53.0%) | 1,700 (46.9%) |
Sales and Office Occupations
The most common Sales and Office occupations in Pepin County are Office & Administration (476 | 13.2%), and Sales & Related (245 | 6.8%).

Sales and Office Occupations by Sex

| Occupation | Male | Female |
| Sales & Related | 125 (51.0%) | 120 (49.0%) |
| Office & Administration | 90 (18.9%) | 386 (81.1%) |
| Total (Category) | 215 (29.8%) | 506 (70.2%) |
| Total (Overall) | 1,921 (53.0%) | 1,700 (46.9%) |
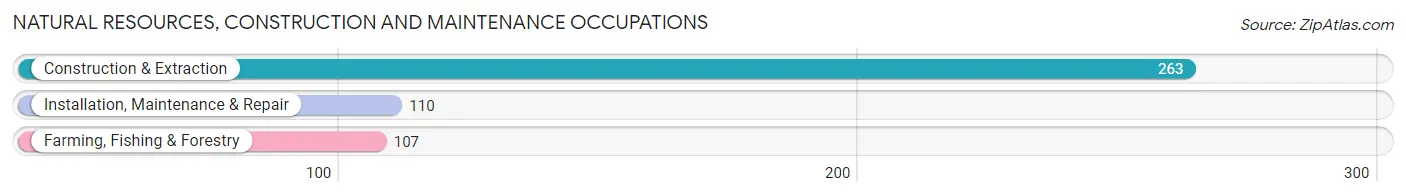
Natural Resources, Construction and Maintenance Occupations
The most common Natural Resources, Construction and Maintenance occupations in Pepin County are Construction & Extraction (263 | 7.3%), Installation, Maintenance & Repair (110 | 3.0%), and Farming, Fishing & Forestry (107 | 2.9%).
Natural Resources, Construction and Maintenance Occupations by Sex
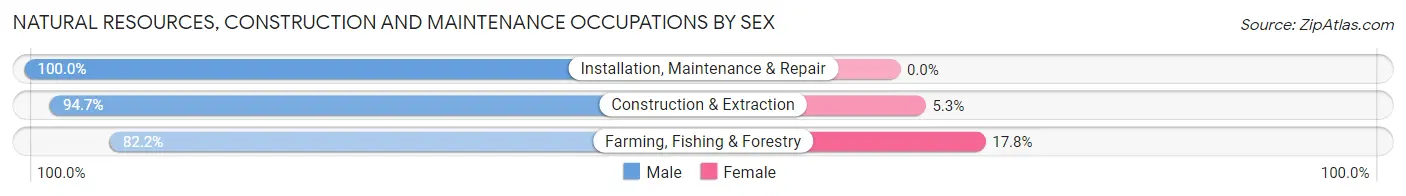
| Occupation | Male | Female |
| Farming, Fishing & Forestry | 88 (82.2%) | 19 (17.8%) |
| Construction & Extraction | 249 (94.7%) | 14 (5.3%) |
| Installation, Maintenance & Repair | 110 (100.0%) | 0 (0.0%) |
| Total (Category) | 447 (93.1%) | 33 (6.9%) |
| Total (Overall) | 1,921 (53.0%) | 1,700 (46.9%) |
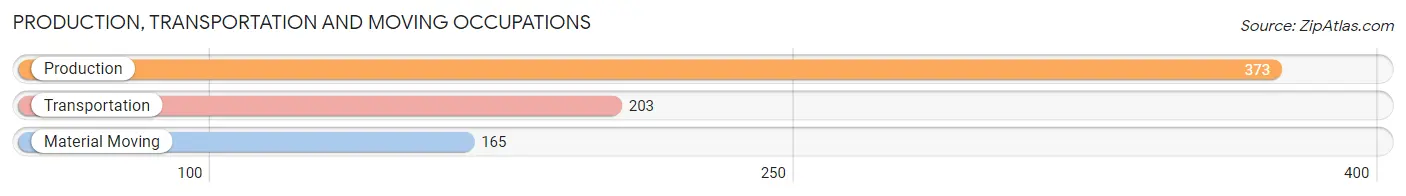
Production, Transportation and Moving Occupations
The most common Production, Transportation and Moving occupations in Pepin County are Production (373 | 10.3%), Transportation (203 | 5.6%), and Material Moving (165 | 4.6%).
Production, Transportation and Moving Occupations by Sex
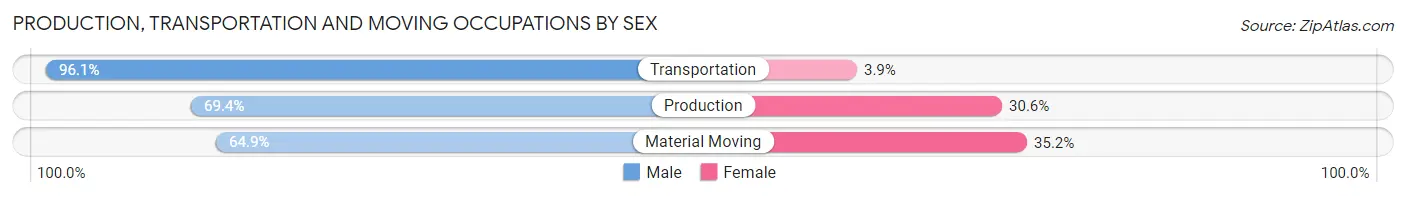
| Occupation | Male | Female |
| Production | 259 (69.4%) | 114 (30.6%) |
| Transportation | 195 (96.1%) | 8 (3.9%) |
| Material Moving | 107 (64.8%) | 58 (35.1%) |
| Total (Category) | 561 (75.7%) | 180 (24.3%) |
| Total (Overall) | 1,921 (53.0%) | 1,700 (46.9%) |
Employment Industries by Sex in Pepin County
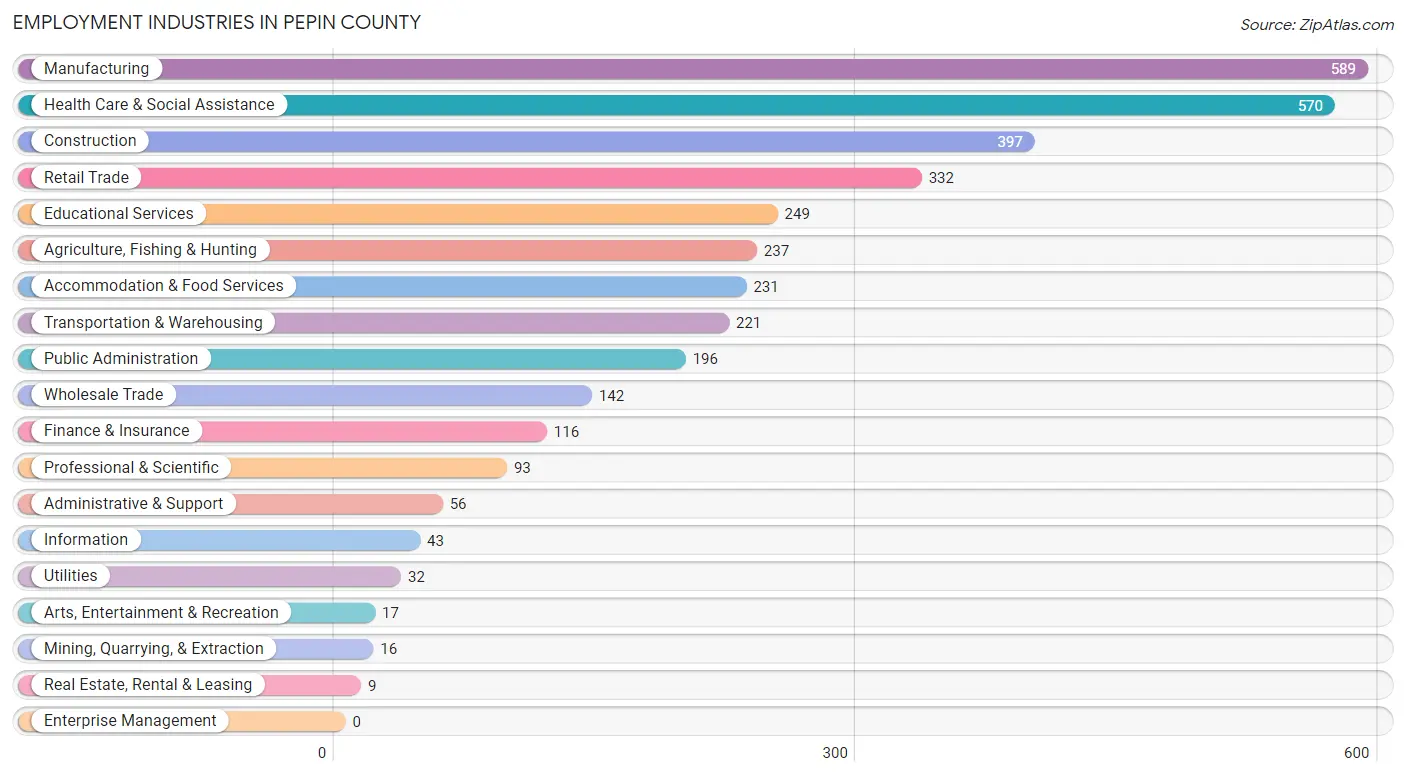
Employment Industries in Pepin County
The major employment industries in Pepin County include Manufacturing (589 | 16.3%), Health Care & Social Assistance (570 | 15.7%), Construction (397 | 11.0%), Retail Trade (332 | 9.2%), and Educational Services (249 | 6.9%).
Employment Industries by Sex in Pepin County
The Pepin County industries that see more men than women are Mining, Quarrying, & Extraction (100.0%), Construction (86.7%), and Agriculture, Fishing & Hunting (79.3%), whereas the industries that tend to have a higher number of women are Health Care & Social Assistance (87.9%), Finance & Insurance (82.8%), and Arts, Entertainment & Recreation (82.4%).
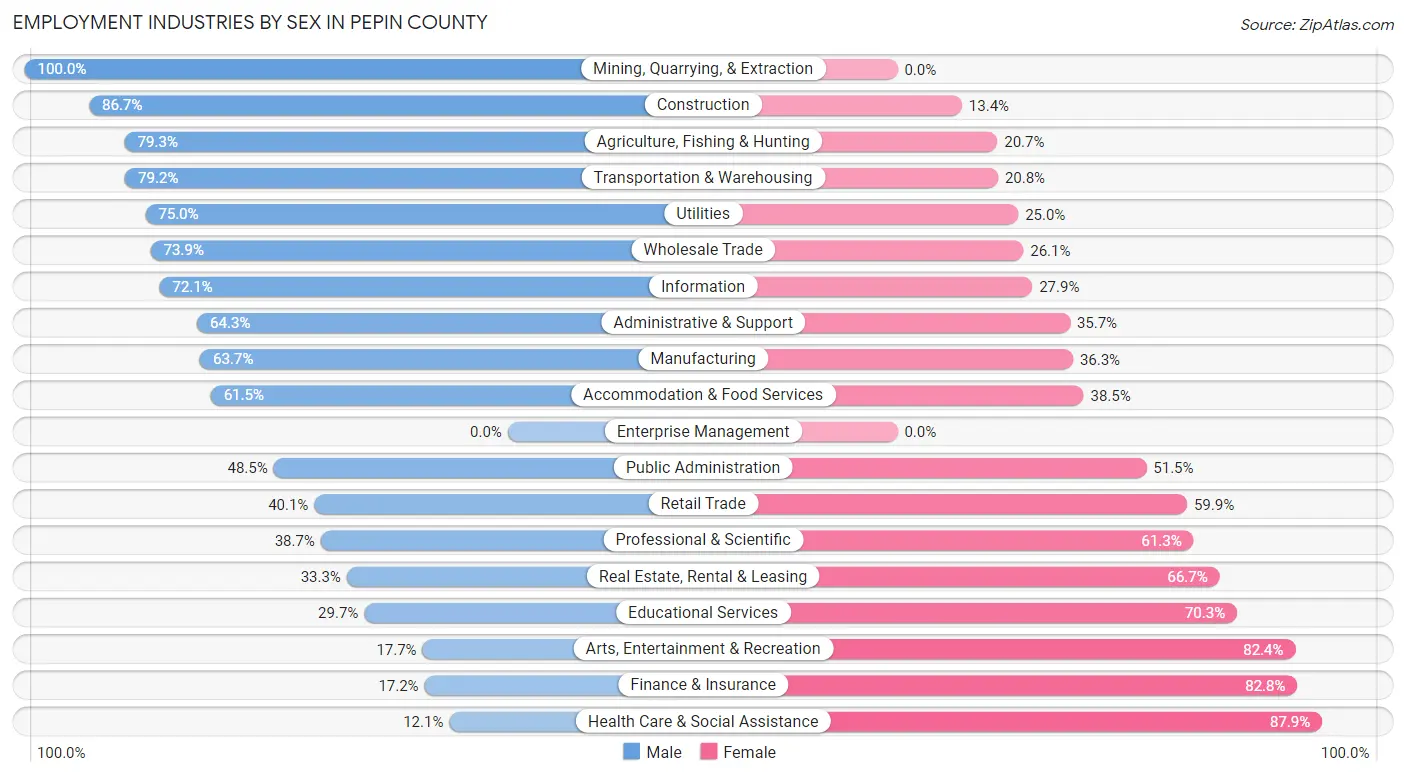
| Industry | Male | Female |
| Agriculture, Fishing & Hunting | 188 (79.3%) | 49 (20.7%) |
| Mining, Quarrying, & Extraction | 16 (100.0%) | 0 (0.0%) |
| Construction | 344 (86.7%) | 53 (13.4%) |
| Manufacturing | 375 (63.7%) | 214 (36.3%) |
| Wholesale Trade | 105 (73.9%) | 37 (26.1%) |
| Retail Trade | 133 (40.1%) | 199 (59.9%) |
| Transportation & Warehousing | 175 (79.2%) | 46 (20.8%) |
| Utilities | 24 (75.0%) | 8 (25.0%) |
| Information | 31 (72.1%) | 12 (27.9%) |
| Finance & Insurance | 20 (17.2%) | 96 (82.8%) |
| Real Estate, Rental & Leasing | 3 (33.3%) | 6 (66.7%) |
| Professional & Scientific | 36 (38.7%) | 57 (61.3%) |
| Enterprise Management | 0 (0.0%) | 0 (0.0%) |
| Administrative & Support | 36 (64.3%) | 20 (35.7%) |
| Educational Services | 74 (29.7%) | 175 (70.3%) |
| Health Care & Social Assistance | 69 (12.1%) | 501 (87.9%) |
| Arts, Entertainment & Recreation | 3 (17.6%) | 14 (82.4%) |
| Accommodation & Food Services | 142 (61.5%) | 89 (38.5%) |
| Public Administration | 95 (48.5%) | 101 (51.5%) |
| Total | 1,921 (53.0%) | 1,700 (46.9%) |
Education in Pepin County
School Enrollment in Pepin County
The most common levels of schooling among the 1,462 students in Pepin County are high school (381 | 26.1%), middle school (368 | 25.2%), and elementary school (349 | 23.9%).
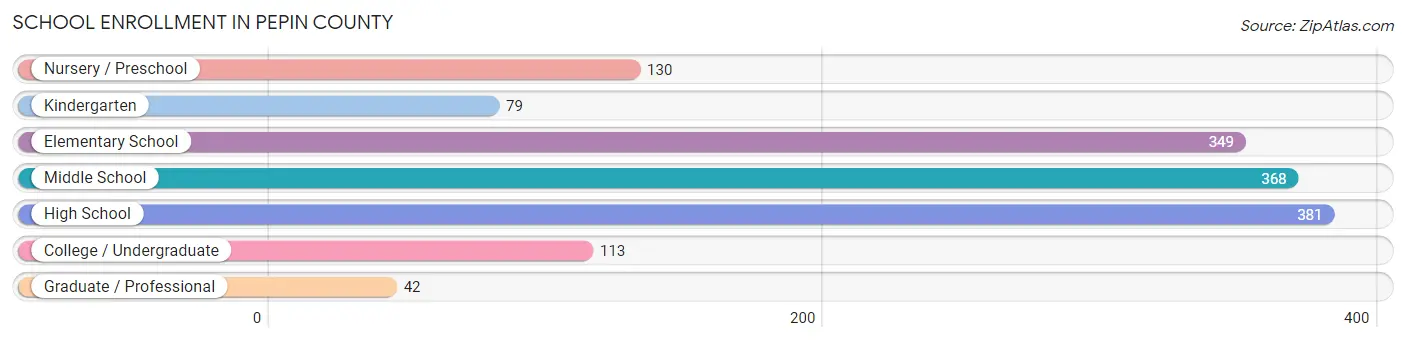
| School Level | # Students | % Students |
| Nursery / Preschool | 130 | 8.9% |
| Kindergarten | 79 | 5.4% |
| Elementary School | 349 | 23.9% |
| Middle School | 368 | 25.2% |
| High School | 381 | 26.1% |
| College / Undergraduate | 113 | 7.7% |
| Graduate / Professional | 42 | 2.9% |
| Total | 1,462 | 100.0% |
School Enrollment by Age by Funding Source in Pepin County
Out of a total of 1,462 students who are enrolled in schools in Pepin County, 132 (9.0%) attend a private institution, while the remaining 1,330 (91.0%) are enrolled in public schools. The age group of 3 to 4 year olds has the highest likelihood of being enrolled in private schools, with 21 (33.3% in the age bracket) enrolled. Conversely, the age group of 18 to 19 year olds has the lowest likelihood of being enrolled in a private school, with 63 (100.0% in the age bracket) attending a public institution.
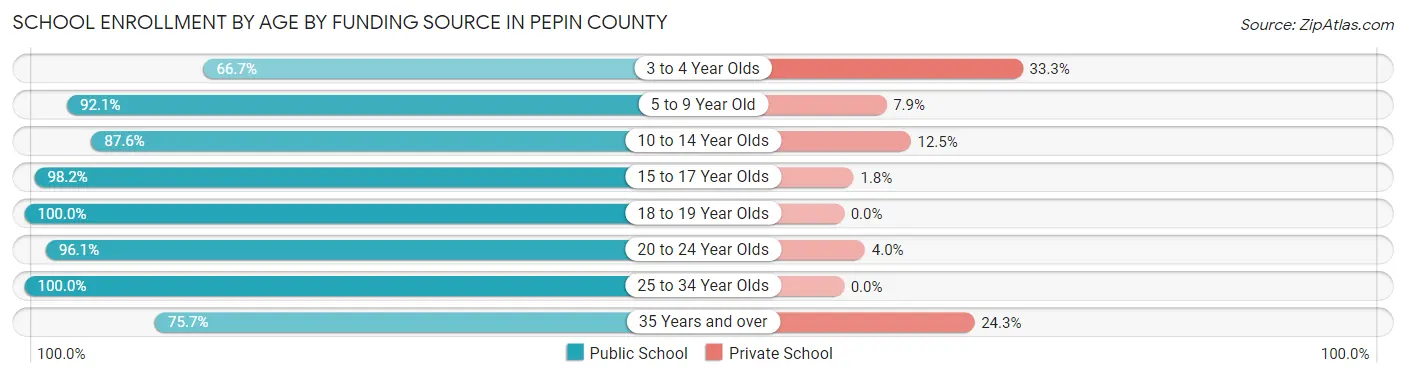
| Age Bracket | Public School | Private School |
| 3 to 4 Year Olds | 42 (66.7%) | 21 (33.3%) |
| 5 to 9 Year Old | 407 (92.1%) | 35 (7.9%) |
| 10 to 14 Year Olds | 408 (87.5%) | 58 (12.4%) |
| 15 to 17 Year Olds | 267 (98.2%) | 5 (1.8%) |
| 18 to 19 Year Olds | 63 (100.0%) | 0 (0.0%) |
| 20 to 24 Year Olds | 73 (96.1%) | 3 (4.0%) |
| 25 to 34 Year Olds | 43 (100.0%) | 0 (0.0%) |
| 35 Years and over | 28 (75.7%) | 9 (24.3%) |
| Total | 1,330 (91.0%) | 132 (9.0%) |
Educational Attainment by Field of Study in Pepin County
Business (286 | 21.4%), education (227 | 17.0%), science & technology (211 | 15.8%), bio, nature & agricultural (117 | 8.8%), and arts & humanities (90 | 6.7%) are the most common fields of study among 1,335 individuals in Pepin County who have obtained a bachelor's degree or higher.
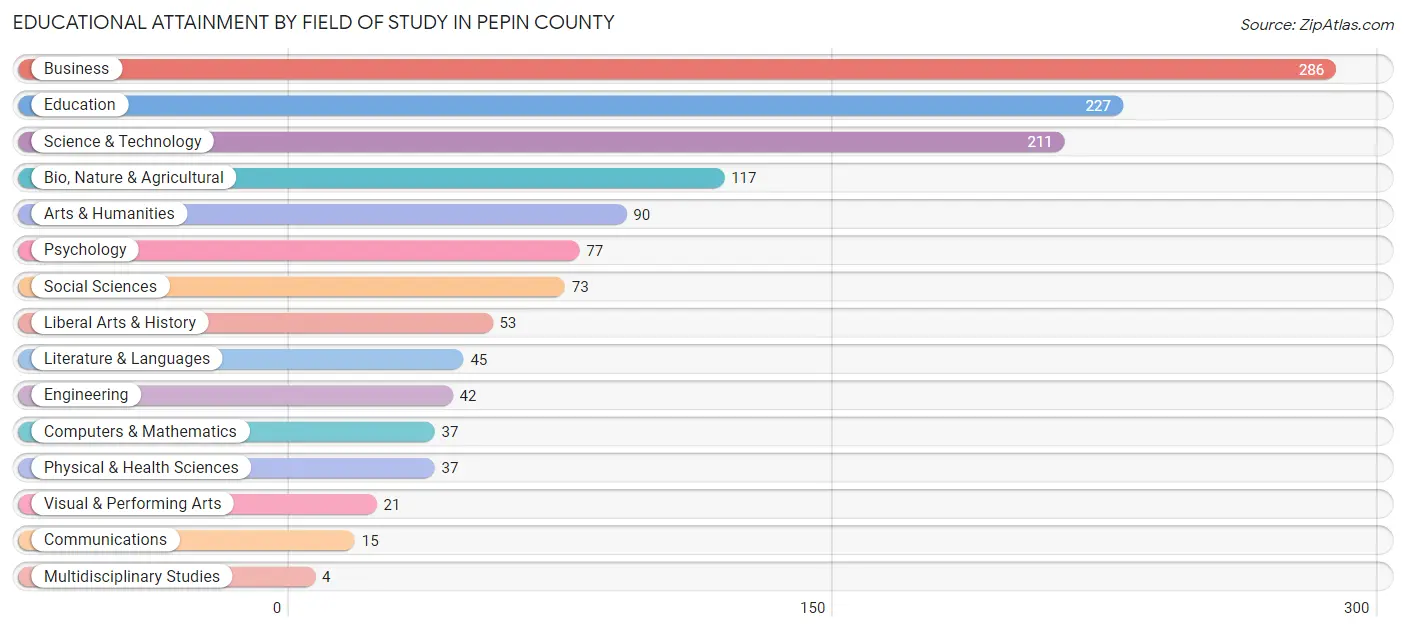
| Field of Study | # Graduates | % Graduates |
| Computers & Mathematics | 37 | 2.8% |
| Bio, Nature & Agricultural | 117 | 8.8% |
| Physical & Health Sciences | 37 | 2.8% |
| Psychology | 77 | 5.8% |
| Social Sciences | 73 | 5.5% |
| Engineering | 42 | 3.2% |
| Multidisciplinary Studies | 4 | 0.3% |
| Science & Technology | 211 | 15.8% |
| Business | 286 | 21.4% |
| Education | 227 | 17.0% |
| Literature & Languages | 45 | 3.4% |
| Liberal Arts & History | 53 | 4.0% |
| Visual & Performing Arts | 21 | 1.6% |
| Communications | 15 | 1.1% |
| Arts & Humanities | 90 | 6.7% |
| Total | 1,335 | 100.0% |
Transportation & Commute in Pepin County
Vehicle Availability by Sex in Pepin County
The most prevalent vehicle ownership categories in Pepin County are males with 2 vehicles (608, accounting for 32.8%) and females with 2 vehicles (556, making up 36.3%).
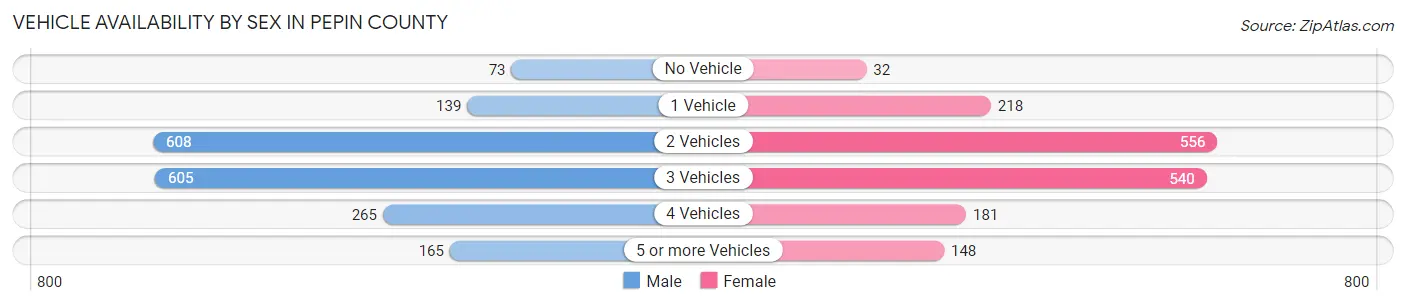
| Vehicles Available | Male | Female |
| No Vehicle | 73 (3.9%) | 32 (1.9%) |
| 1 Vehicle | 139 (7.5%) | 218 (13.0%) |
| 2 Vehicles | 608 (32.8%) | 556 (33.2%) |
| 3 Vehicles | 605 (32.6%) | 540 (32.2%) |
| 4 Vehicles | 265 (14.3%) | 181 (10.8%) |
| 5 or more Vehicles | 165 (8.9%) | 148 (8.8%) |
| Total | 1,855 (100.0%) | 1,675 (100.0%) |
Commute Time in Pepin County
The most frequently occuring commute durations in Pepin County are 5 to 9 minutes (481 commuters, 15.7%), 10 to 14 minutes (380 commuters, 12.4%), and 30 to 34 minutes (345 commuters, 11.3%).

| Commute Time | # Commuters | % Commuters |
| Less than 5 Minutes | 262 | 8.5% |
| 5 to 9 Minutes | 481 | 15.7% |
| 10 to 14 Minutes | 380 | 12.4% |
| 15 to 19 Minutes | 293 | 9.6% |
| 20 to 24 Minutes | 209 | 6.8% |
| 25 to 29 Minutes | 181 | 5.9% |
| 30 to 34 Minutes | 345 | 11.3% |
| 35 to 39 Minutes | 145 | 4.7% |
| 40 to 44 Minutes | 183 | 6.0% |
| 45 to 59 Minutes | 293 | 9.6% |
| 60 to 89 Minutes | 186 | 6.1% |
| 90 or more Minutes | 109 | 3.5% |
Commute Time by Sex in Pepin County
The most common commute times in Pepin County are 5 to 9 minutes (294 commuters, 17.4%) for males and 5 to 9 minutes (187 commuters, 13.6%) for females.
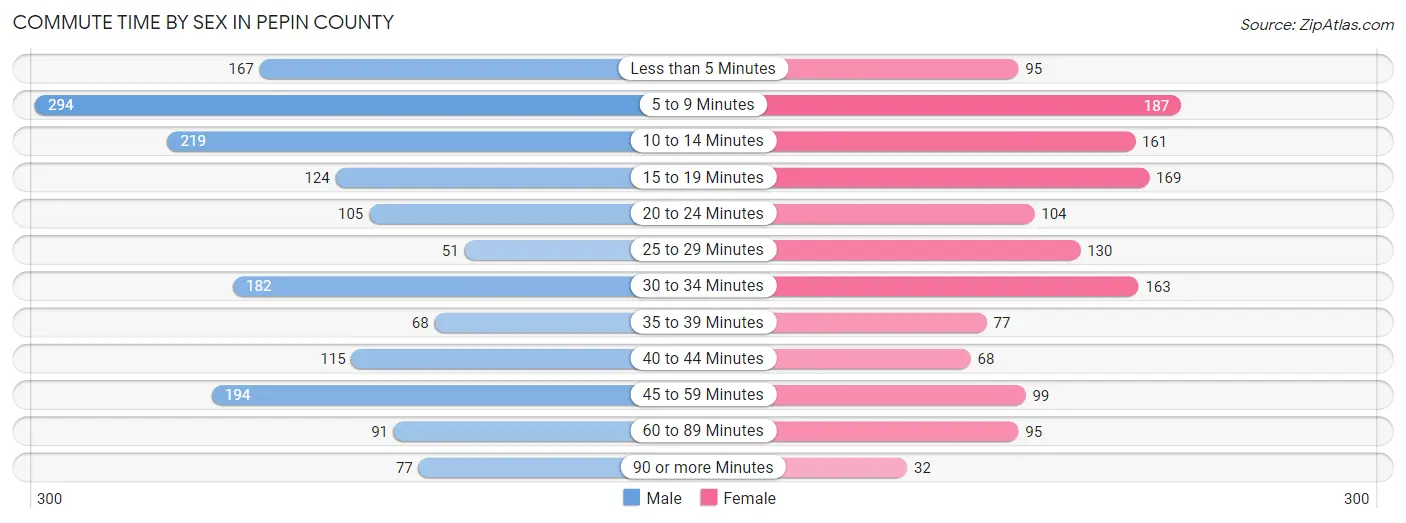
| Commute Time | Male | Female |
| Less than 5 Minutes | 167 (9.9%) | 95 (6.9%) |
| 5 to 9 Minutes | 294 (17.4%) | 187 (13.6%) |
| 10 to 14 Minutes | 219 (13.0%) | 161 (11.7%) |
| 15 to 19 Minutes | 124 (7.3%) | 169 (12.2%) |
| 20 to 24 Minutes | 105 (6.2%) | 104 (7.5%) |
| 25 to 29 Minutes | 51 (3.0%) | 130 (9.4%) |
| 30 to 34 Minutes | 182 (10.8%) | 163 (11.8%) |
| 35 to 39 Minutes | 68 (4.0%) | 77 (5.6%) |
| 40 to 44 Minutes | 115 (6.8%) | 68 (4.9%) |
| 45 to 59 Minutes | 194 (11.5%) | 99 (7.2%) |
| 60 to 89 Minutes | 91 (5.4%) | 95 (6.9%) |
| 90 or more Minutes | 77 (4.6%) | 32 (2.3%) |
Time of Departure to Work by Sex in Pepin County
The most frequent times of departure to work in Pepin County are 12:00 AM to 4:59 AM (280, 16.6%) for males and 7:30 AM to 7:59 AM (239, 17.3%) for females.
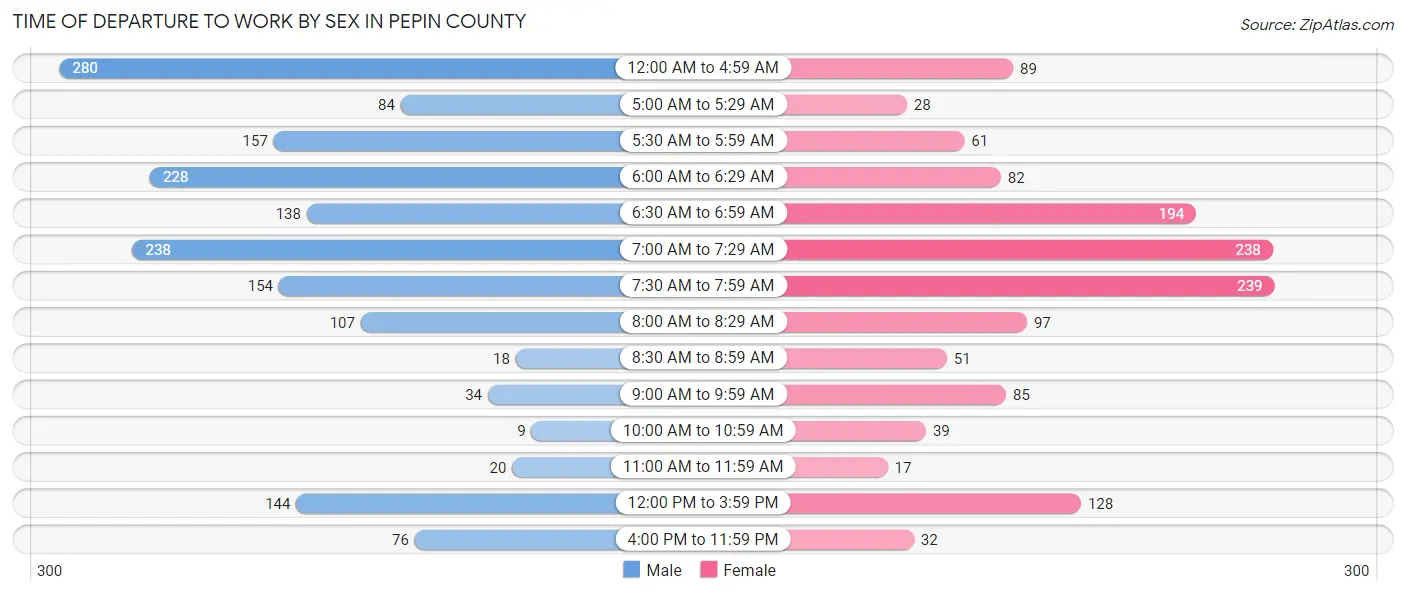
| Time of Departure | Male | Female |
| 12:00 AM to 4:59 AM | 280 (16.6%) | 89 (6.5%) |
| 5:00 AM to 5:29 AM | 84 (5.0%) | 28 (2.0%) |
| 5:30 AM to 5:59 AM | 157 (9.3%) | 61 (4.4%) |
| 6:00 AM to 6:29 AM | 228 (13.5%) | 82 (5.9%) |
| 6:30 AM to 6:59 AM | 138 (8.2%) | 194 (14.1%) |
| 7:00 AM to 7:29 AM | 238 (14.1%) | 238 (17.2%) |
| 7:30 AM to 7:59 AM | 154 (9.1%) | 239 (17.3%) |
| 8:00 AM to 8:29 AM | 107 (6.3%) | 97 (7.0%) |
| 8:30 AM to 8:59 AM | 18 (1.1%) | 51 (3.7%) |
| 9:00 AM to 9:59 AM | 34 (2.0%) | 85 (6.2%) |
| 10:00 AM to 10:59 AM | 9 (0.5%) | 39 (2.8%) |
| 11:00 AM to 11:59 AM | 20 (1.2%) | 17 (1.2%) |
| 12:00 PM to 3:59 PM | 144 (8.5%) | 128 (9.3%) |
| 4:00 PM to 11:59 PM | 76 (4.5%) | 32 (2.3%) |
| Total | 1,687 (100.0%) | 1,380 (100.0%) |
Housing Occupancy in Pepin County
Occupancy by Ownership in Pepin County
Of the total 3,078 dwellings in Pepin County, owner-occupied units account for 2,525 (82.0%), while renter-occupied units make up 553 (18.0%).
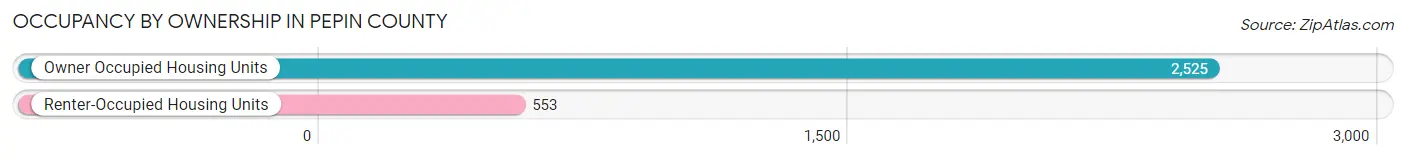
| Occupancy | # Housing Units | % Housing Units |
| Owner Occupied Housing Units | 2,525 | 82.0% |
| Renter-Occupied Housing Units | 553 | 18.0% |
| Total Occupied Housing Units | 3,078 | 100.0% |
Occupancy by Household Size in Pepin County
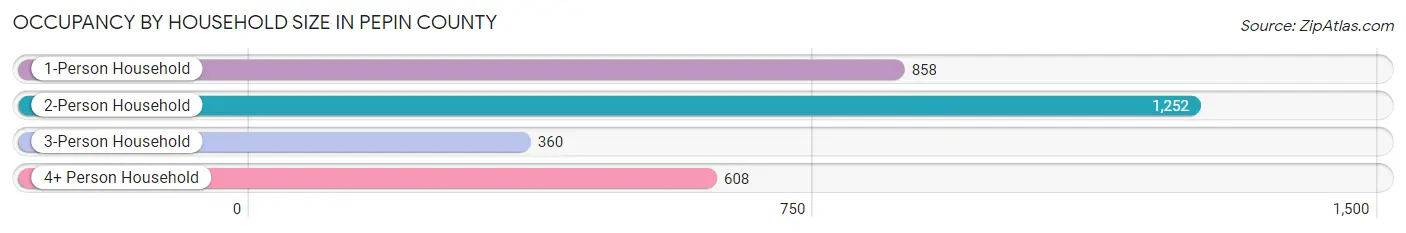
| Household Size | # Housing Units | % Housing Units |
| 1-Person Household | 858 | 27.9% |
| 2-Person Household | 1,252 | 40.7% |
| 3-Person Household | 360 | 11.7% |
| 4+ Person Household | 608 | 19.8% |
| Total Housing Units | 3,078 | 100.0% |
Occupancy by Ownership by Household Size in Pepin County
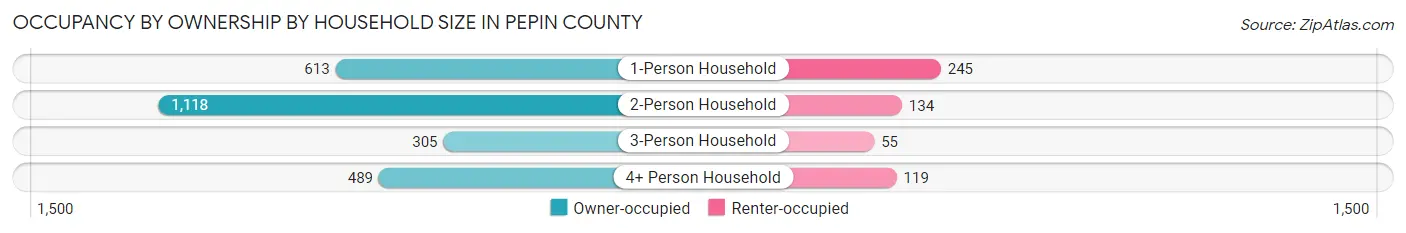
| Household Size | Owner-occupied | Renter-occupied |
| 1-Person Household | 613 (71.5%) | 245 (28.5%) |
| 2-Person Household | 1,118 (89.3%) | 134 (10.7%) |
| 3-Person Household | 305 (84.7%) | 55 (15.3%) |
| 4+ Person Household | 489 (80.4%) | 119 (19.6%) |
| Total Housing Units | 2,525 (82.0%) | 553 (18.0%) |
Occupancy by Educational Attainment in Pepin County
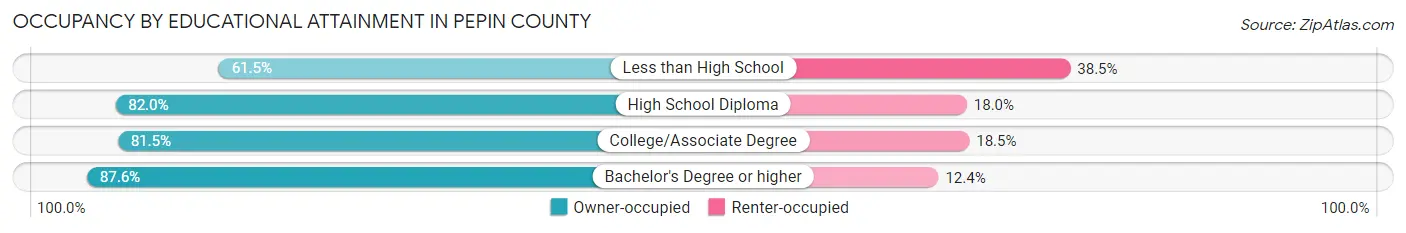
| Household Size | Owner-occupied | Renter-occupied |
| Less than High School | 115 (61.5%) | 72 (38.5%) |
| High School Diploma | 917 (82.0%) | 201 (18.0%) |
| College/Associate Degree | 812 (81.5%) | 184 (18.5%) |
| Bachelor's Degree or higher | 681 (87.6%) | 96 (12.4%) |
Occupancy by Age of Householder in Pepin County
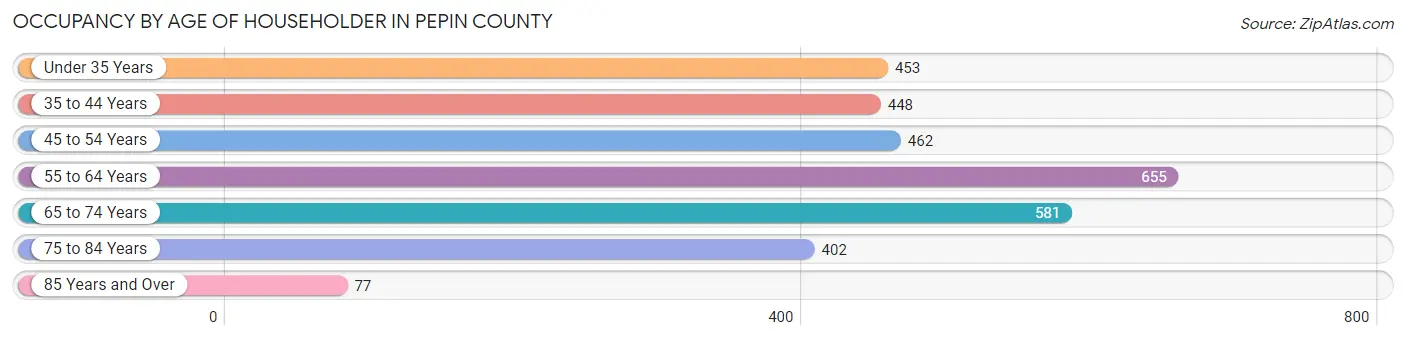
| Age Bracket | # Households | % Households |
| Under 35 Years | 453 | 14.7% |
| 35 to 44 Years | 448 | 14.5% |
| 45 to 54 Years | 462 | 15.0% |
| 55 to 64 Years | 655 | 21.3% |
| 65 to 74 Years | 581 | 18.9% |
| 75 to 84 Years | 402 | 13.1% |
| 85 Years and Over | 77 | 2.5% |
| Total | 3,078 | 100.0% |
Housing Finances in Pepin County
Median Income by Occupancy in Pepin County
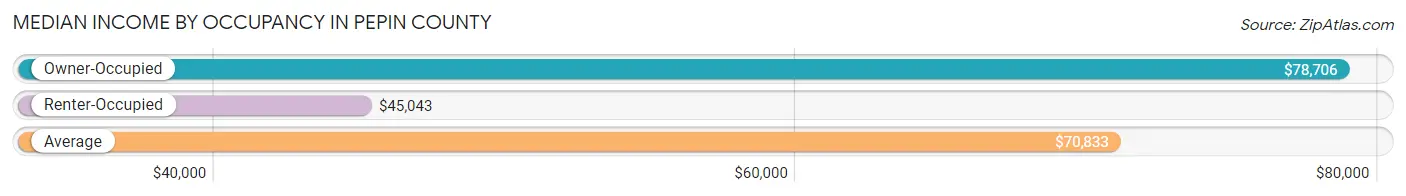
| Occupancy Type | # Households | Median Income |
| Owner-Occupied | 2,525 (82.0%) | $78,706 |
| Renter-Occupied | 553 (18.0%) | $45,043 |
| Average | 3,078 (100.0%) | $70,833 |
Occupancy by Householder Income Bracket in Pepin County
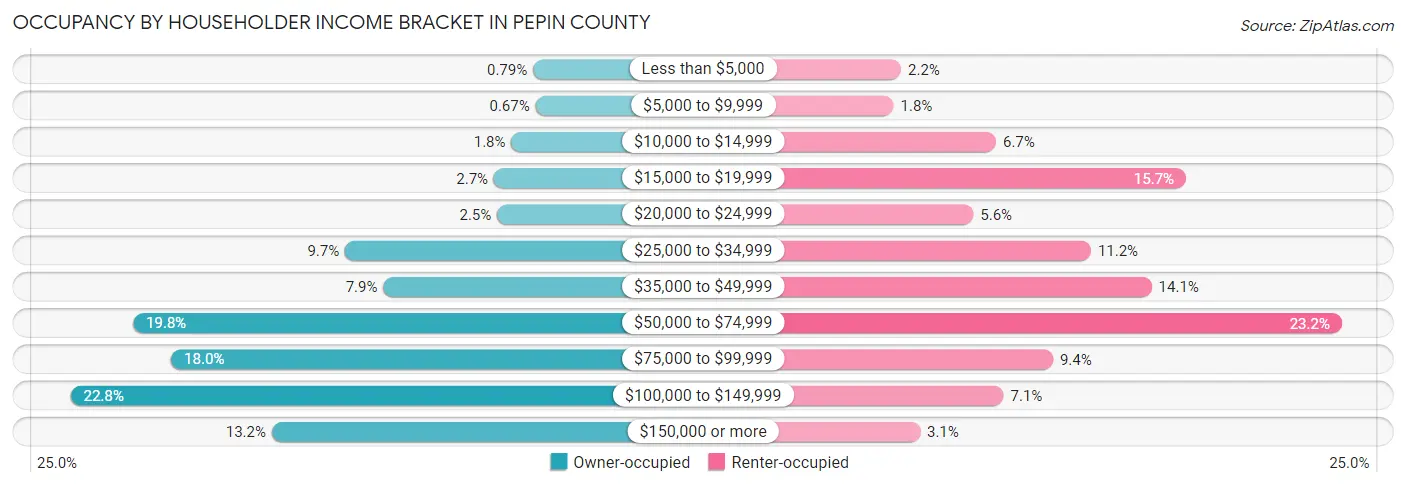
| Income Bracket | Owner-occupied | Renter-occupied |
| Less than $5,000 | 20 (0.8%) | 12 (2.2%) |
| $5,000 to $9,999 | 17 (0.7%) | 10 (1.8%) |
| $10,000 to $14,999 | 46 (1.8%) | 37 (6.7%) |
| $15,000 to $19,999 | 67 (2.6%) | 87 (15.7%) |
| $20,000 to $24,999 | 63 (2.5%) | 31 (5.6%) |
| $25,000 to $34,999 | 246 (9.7%) | 62 (11.2%) |
| $35,000 to $49,999 | 200 (7.9%) | 78 (14.1%) |
| $50,000 to $74,999 | 501 (19.8%) | 128 (23.2%) |
| $75,000 to $99,999 | 455 (18.0%) | 52 (9.4%) |
| $100,000 to $149,999 | 576 (22.8%) | 39 (7.0%) |
| $150,000 or more | 334 (13.2%) | 17 (3.1%) |
| Total | 2,525 (100.0%) | 553 (100.0%) |
Monthly Housing Cost Tiers in Pepin County
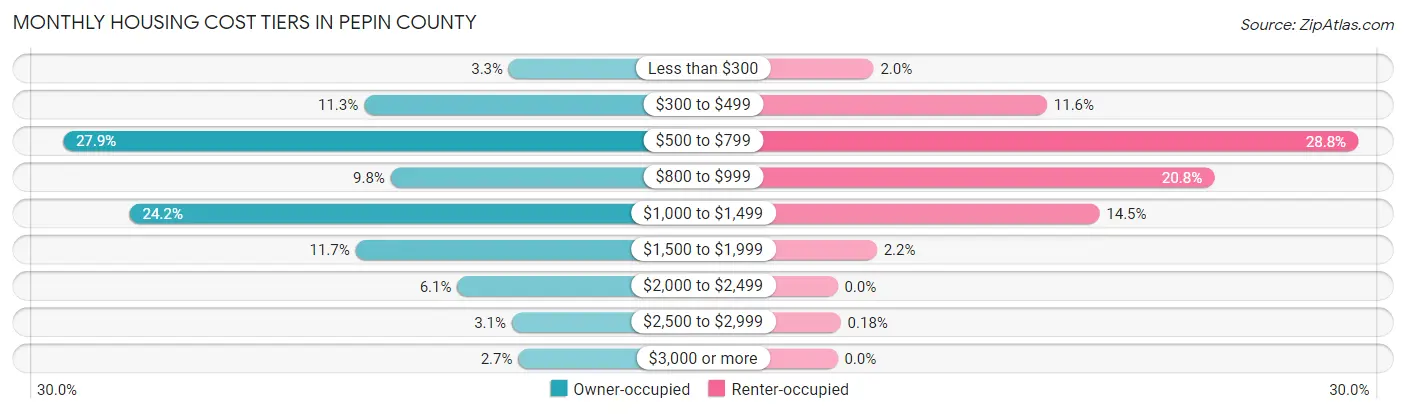
| Monthly Cost | Owner-occupied | Renter-occupied |
| Less than $300 | 82 (3.3%) | 11 (2.0%) |
| $300 to $499 | 284 (11.3%) | 64 (11.6%) |
| $500 to $799 | 704 (27.9%) | 159 (28.7%) |
| $800 to $999 | 247 (9.8%) | 115 (20.8%) |
| $1,000 to $1,499 | 611 (24.2%) | 80 (14.5%) |
| $1,500 to $1,999 | 296 (11.7%) | 12 (2.2%) |
| $2,000 to $2,499 | 154 (6.1%) | 0 (0.0%) |
| $2,500 to $2,999 | 78 (3.1%) | 1 (0.2%) |
| $3,000 or more | 69 (2.7%) | 0 (0.0%) |
| Total | 2,525 (100.0%) | 553 (100.0%) |
Physical Housing Characteristics in Pepin County
Housing Structures in Pepin County
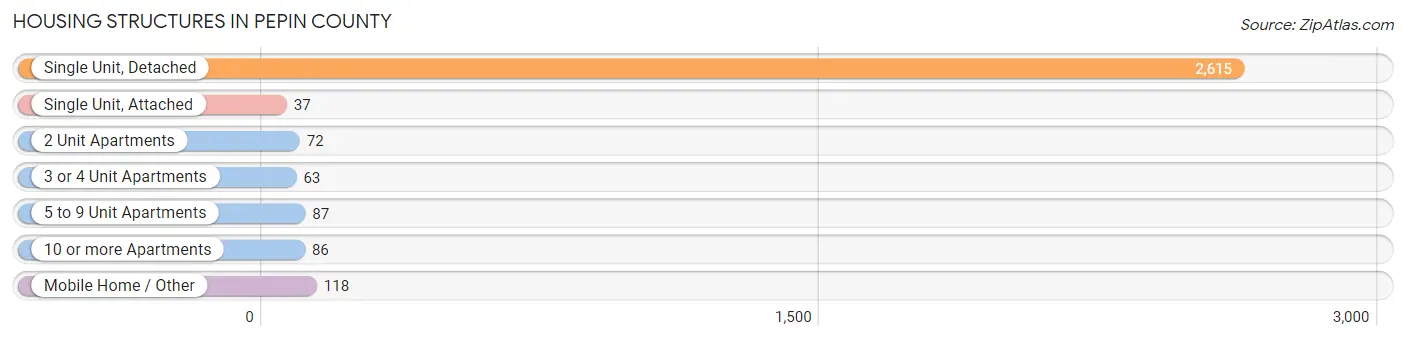
| Structure Type | # Housing Units | % Housing Units |
| Single Unit, Detached | 2,615 | 85.0% |
| Single Unit, Attached | 37 | 1.2% |
| 2 Unit Apartments | 72 | 2.3% |
| 3 or 4 Unit Apartments | 63 | 2.1% |
| 5 to 9 Unit Apartments | 87 | 2.8% |
| 10 or more Apartments | 86 | 2.8% |
| Mobile Home / Other | 118 | 3.8% |
| Total | 3,078 | 100.0% |
Housing Structures by Occupancy in Pepin County
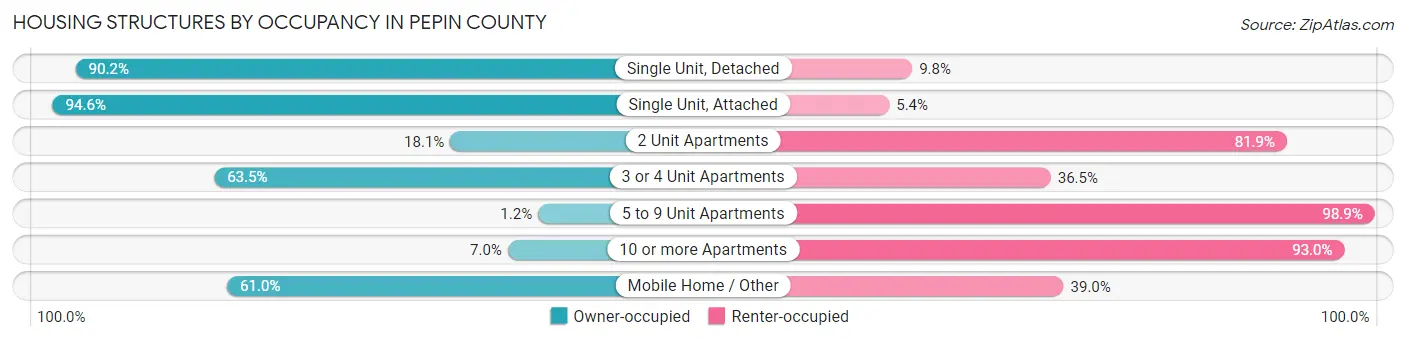
| Structure Type | Owner-occupied | Renter-occupied |
| Single Unit, Detached | 2,358 (90.2%) | 257 (9.8%) |
| Single Unit, Attached | 35 (94.6%) | 2 (5.4%) |
| 2 Unit Apartments | 13 (18.1%) | 59 (81.9%) |
| 3 or 4 Unit Apartments | 40 (63.5%) | 23 (36.5%) |
| 5 to 9 Unit Apartments | 1 (1.1%) | 86 (98.9%) |
| 10 or more Apartments | 6 (7.0%) | 80 (93.0%) |
| Mobile Home / Other | 72 (61.0%) | 46 (39.0%) |
| Total | 2,525 (82.0%) | 553 (18.0%) |
Housing Structures by Number of Rooms in Pepin County
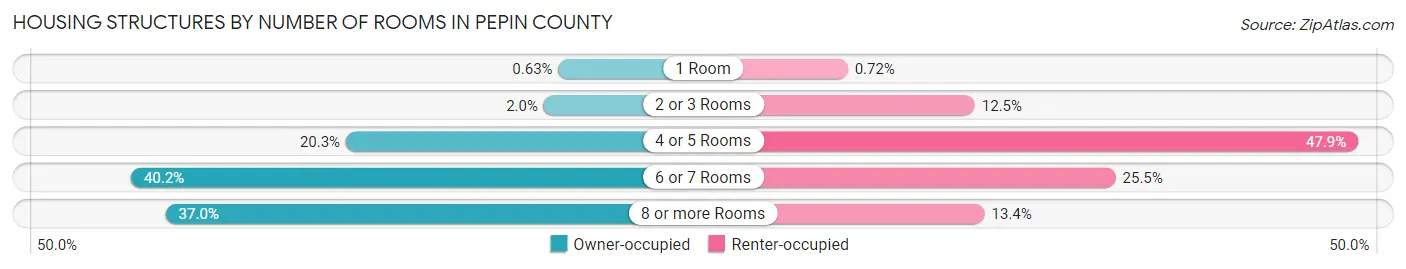
| Number of Rooms | Owner-occupied | Renter-occupied |
| 1 Room | 16 (0.6%) | 4 (0.7%) |
| 2 or 3 Rooms | 50 (2.0%) | 69 (12.5%) |
| 4 or 5 Rooms | 512 (20.3%) | 265 (47.9%) |
| 6 or 7 Rooms | 1,014 (40.2%) | 141 (25.5%) |
| 8 or more Rooms | 933 (36.9%) | 74 (13.4%) |
| Total | 2,525 (100.0%) | 553 (100.0%) |
Housing Structure by Heating Type in Pepin County
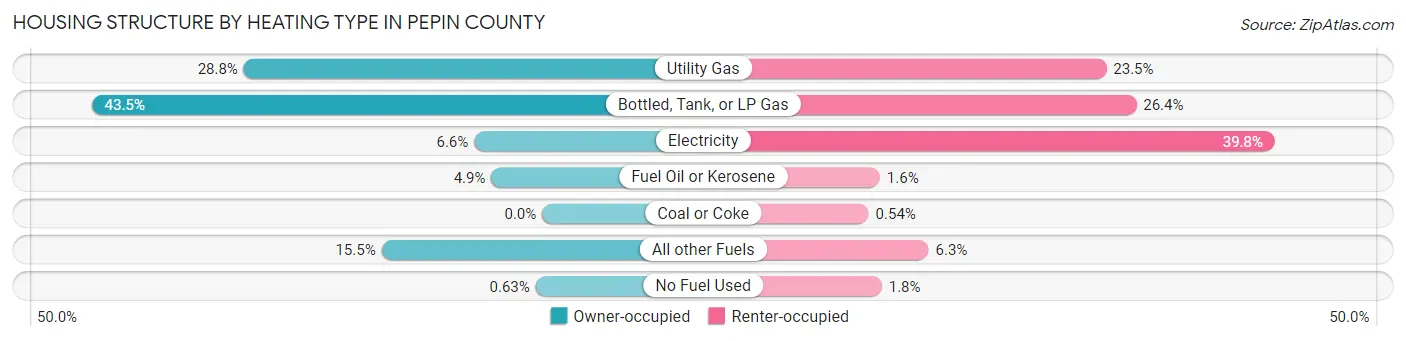
| Heating Type | Owner-occupied | Renter-occupied |
| Utility Gas | 728 (28.8%) | 130 (23.5%) |
| Bottled, Tank, or LP Gas | 1,099 (43.5%) | 146 (26.4%) |
| Electricity | 166 (6.6%) | 220 (39.8%) |
| Fuel Oil or Kerosene | 124 (4.9%) | 9 (1.6%) |
| Coal or Coke | 0 (0.0%) | 3 (0.5%) |
| All other Fuels | 392 (15.5%) | 35 (6.3%) |
| No Fuel Used | 16 (0.6%) | 10 (1.8%) |
| Total | 2,525 (100.0%) | 553 (100.0%) |
Household Vehicle Usage in Pepin County
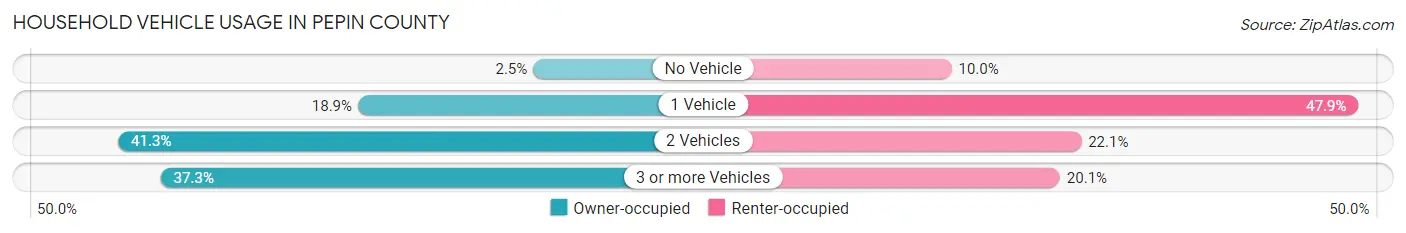
| Vehicles per Household | Owner-occupied | Renter-occupied |
| No Vehicle | 64 (2.5%) | 55 (10.0%) |
| 1 Vehicle | 477 (18.9%) | 265 (47.9%) |
| 2 Vehicles | 1,042 (41.3%) | 122 (22.1%) |
| 3 or more Vehicles | 942 (37.3%) | 111 (20.1%) |
| Total | 2,525 (100.0%) | 553 (100.0%) |
Real Estate & Mortgages in Pepin County
Real Estate and Mortgage Overview in Pepin County
| Characteristic | Without Mortgage | With Mortgage |
| Housing Units | 1,216 | 1,309 |
| Median Property Value | $169,600 | $185,200 |
| Median Household Income | $60,926 | $207 |
| Monthly Housing Costs | $601 | $58 |
| Real Estate Taxes | $2,783 | $40 |
Property Value by Mortgage Status in Pepin County
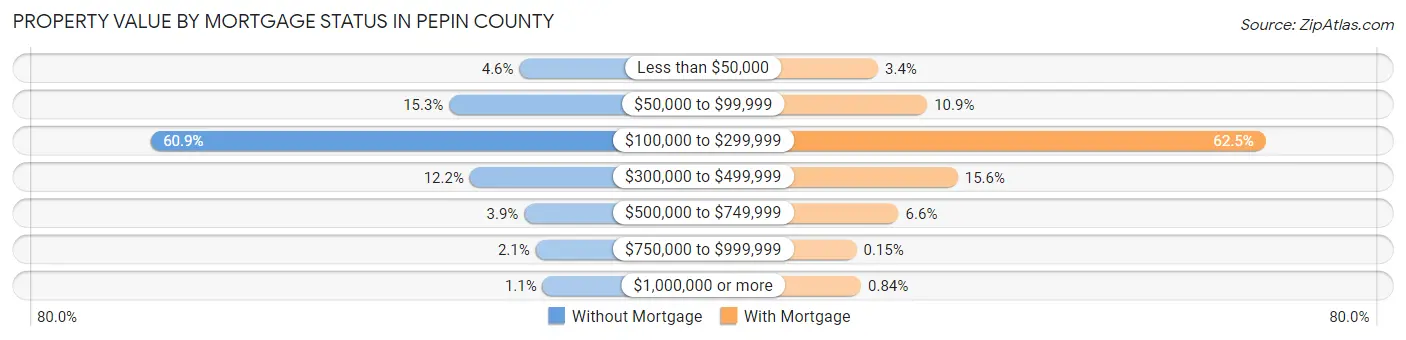
| Property Value | Without Mortgage | With Mortgage |
| Less than $50,000 | 56 (4.6%) | 45 (3.4%) |
| $50,000 to $99,999 | 186 (15.3%) | 143 (10.9%) |
| $100,000 to $299,999 | 740 (60.9%) | 818 (62.5%) |
| $300,000 to $499,999 | 148 (12.2%) | 204 (15.6%) |
| $500,000 to $749,999 | 47 (3.9%) | 86 (6.6%) |
| $750,000 to $999,999 | 26 (2.1%) | 2 (0.2%) |
| $1,000,000 or more | 13 (1.1%) | 11 (0.8%) |
| Total | 1,216 (100.0%) | 1,309 (100.0%) |
Household Income by Mortgage Status in Pepin County
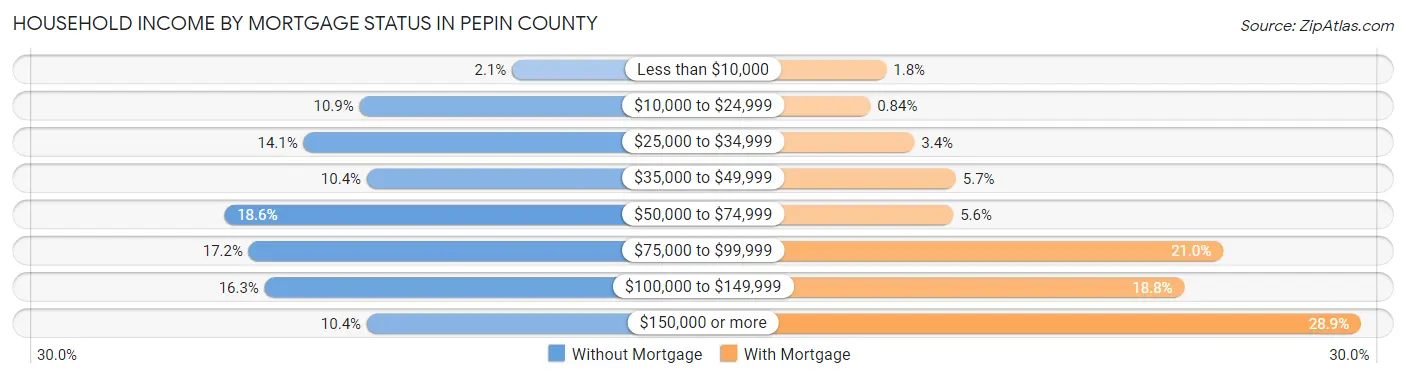
| Household Income | Without Mortgage | With Mortgage |
| Less than $10,000 | 26 (2.1%) | 23 (1.8%) |
| $10,000 to $24,999 | 132 (10.9%) | 11 (0.8%) |
| $25,000 to $34,999 | 171 (14.1%) | 44 (3.4%) |
| $35,000 to $49,999 | 127 (10.4%) | 75 (5.7%) |
| $50,000 to $74,999 | 226 (18.6%) | 73 (5.6%) |
| $75,000 to $99,999 | 209 (17.2%) | 275 (21.0%) |
| $100,000 to $149,999 | 198 (16.3%) | 246 (18.8%) |
| $150,000 or more | 127 (10.4%) | 378 (28.9%) |
| Total | 1,216 (100.0%) | 1,309 (100.0%) |
Property Value to Household Income Ratio in Pepin County
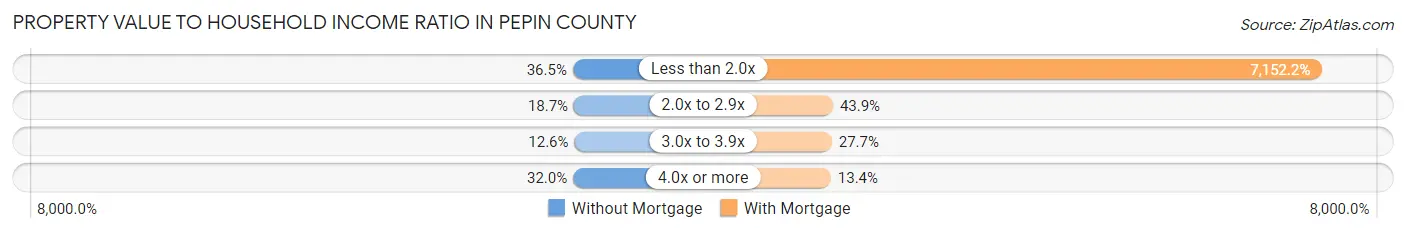
| Value-to-Income Ratio | Without Mortgage | With Mortgage |
| Less than 2.0x | 444 (36.5%) | 93,622 (7,152.2%) |
| 2.0x to 2.9x | 227 (18.7%) | 575 (43.9%) |
| 3.0x to 3.9x | 153 (12.6%) | 362 (27.7%) |
| 4.0x or more | 389 (32.0%) | 175 (13.4%) |
| Total | 1,216 (100.0%) | 1,309 (100.0%) |
Real Estate Taxes by Mortgage Status in Pepin County

| Property Taxes | Without Mortgage | With Mortgage |
| Less than $800 | 34 (2.8%) | 2 (0.2%) |
| $800 to $1,499 | 115 (9.5%) | 35 (2.7%) |
| $800 to $1,499 | 1,032 (84.9%) | 98 (7.5%) |
| Total | 1,216 (100.0%) | 1,309 (100.0%) |
Health & Disability in Pepin County
Health Insurance Coverage by Age in Pepin County
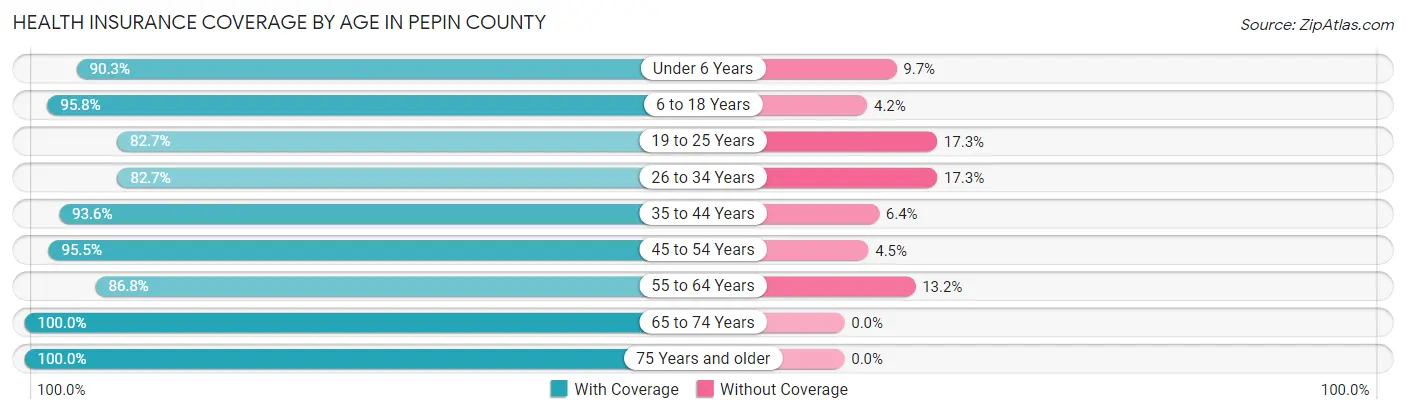
| Age Bracket | With Coverage | Without Coverage |
| Under 6 Years | 474 (90.3%) | 51 (9.7%) |
| 6 to 18 Years | 1,083 (95.8%) | 48 (4.2%) |
| 19 to 25 Years | 388 (82.7%) | 81 (17.3%) |
| 26 to 34 Years | 540 (82.7%) | 113 (17.3%) |
| 35 to 44 Years | 755 (93.6%) | 52 (6.4%) |
| 45 to 54 Years | 834 (95.5%) | 39 (4.5%) |
| 55 to 64 Years | 1,031 (86.8%) | 157 (13.2%) |
| 65 to 74 Years | 995 (100.0%) | 0 (0.0%) |
| 75 Years and older | 660 (100.0%) | 0 (0.0%) |
| Total | 6,760 (92.6%) | 541 (7.4%) |
Health Insurance Coverage by Citizenship Status in Pepin County
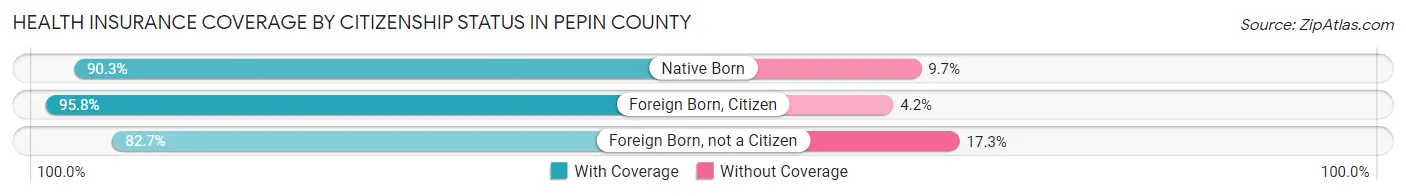
| Citizenship Status | With Coverage | Without Coverage |
| Native Born | 474 (90.3%) | 51 (9.7%) |
| Foreign Born, Citizen | 1,083 (95.8%) | 48 (4.2%) |
| Foreign Born, not a Citizen | 388 (82.7%) | 81 (17.3%) |
Health Insurance Coverage by Household Income in Pepin County
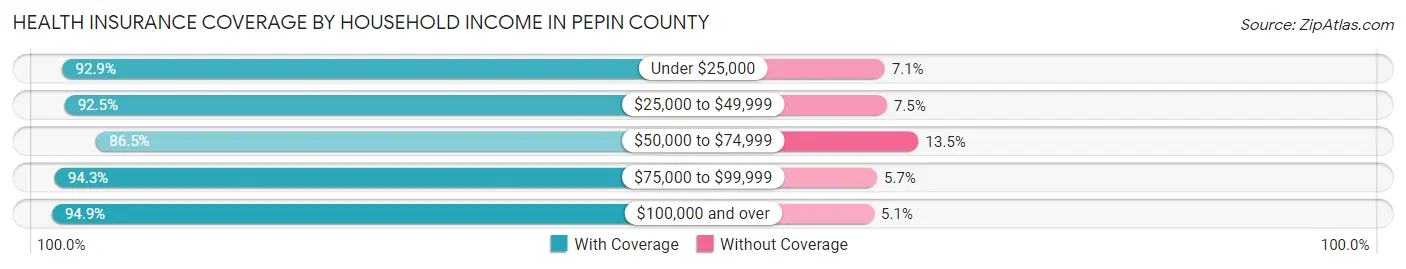
| Household Income | With Coverage | Without Coverage |
| Under $25,000 | 547 (92.9%) | 42 (7.1%) |
| $25,000 to $49,999 | 946 (92.5%) | 77 (7.5%) |
| $50,000 to $74,999 | 1,286 (86.5%) | 200 (13.5%) |
| $75,000 to $99,999 | 1,262 (94.3%) | 76 (5.7%) |
| $100,000 and over | 2,699 (94.9%) | 146 (5.1%) |
Public vs Private Health Insurance Coverage by Age in Pepin County
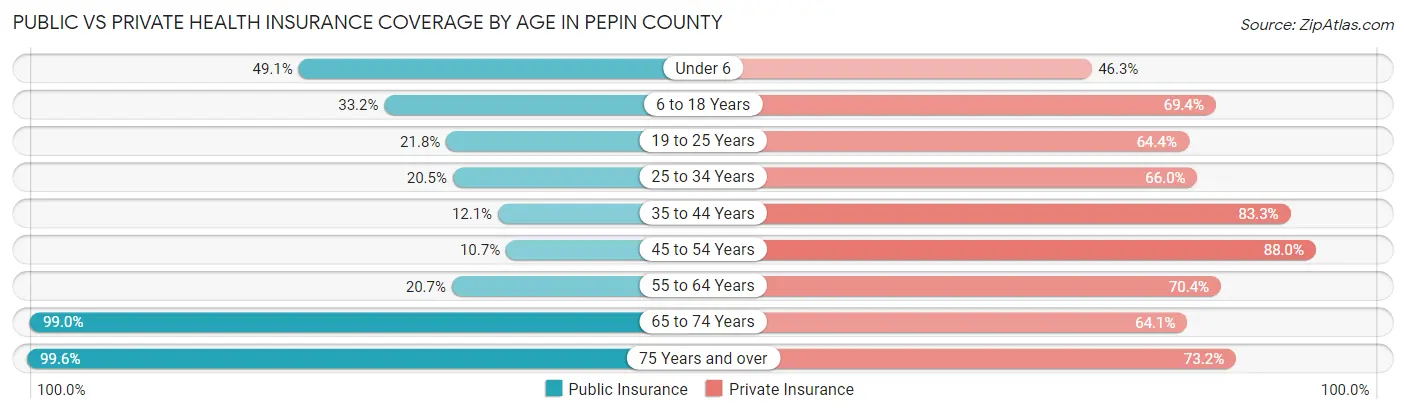
| Age Bracket | Public Insurance | Private Insurance |
| Under 6 | 258 (49.1%) | 243 (46.3%) |
| 6 to 18 Years | 376 (33.2%) | 785 (69.4%) |
| 19 to 25 Years | 102 (21.7%) | 302 (64.4%) |
| 25 to 34 Years | 134 (20.5%) | 431 (66.0%) |
| 35 to 44 Years | 98 (12.1%) | 672 (83.3%) |
| 45 to 54 Years | 93 (10.6%) | 768 (88.0%) |
| 55 to 64 Years | 246 (20.7%) | 836 (70.4%) |
| 65 to 74 Years | 985 (99.0%) | 638 (64.1%) |
| 75 Years and over | 657 (99.6%) | 483 (73.2%) |
| Total | 2,949 (40.4%) | 5,158 (70.7%) |
Disability Status by Sex by Age in Pepin County
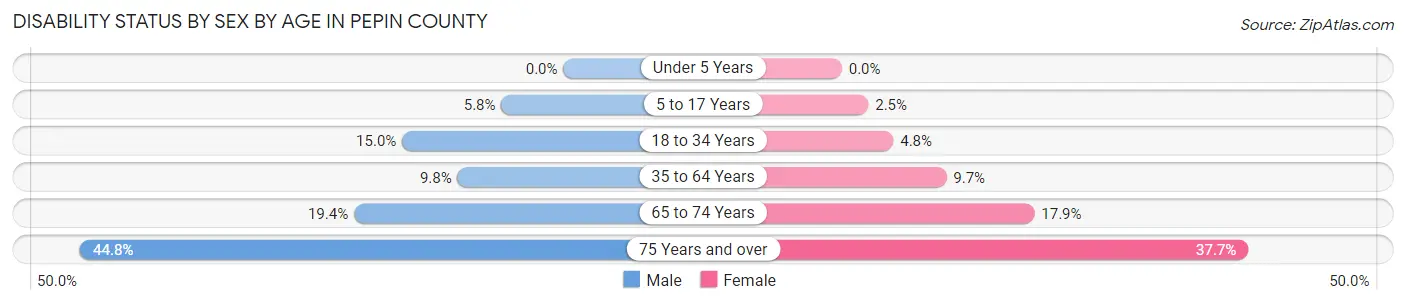
| Age Bracket | Male | Female |
| Under 5 Years | 0 (0.0%) | 0 (0.0%) |
| 5 to 17 Years | 36 (5.8%) | 14 (2.5%) |
| 18 to 34 Years | 92 (15.0%) | 27 (4.8%) |
| 35 to 64 Years | 142 (9.8%) | 138 (9.7%) |
| 65 to 74 Years | 102 (19.4%) | 84 (17.9%) |
| 75 Years and over | 139 (44.8%) | 132 (37.7%) |
Disability Class by Sex by Age in Pepin County
Disability Class: Hearing Difficulty
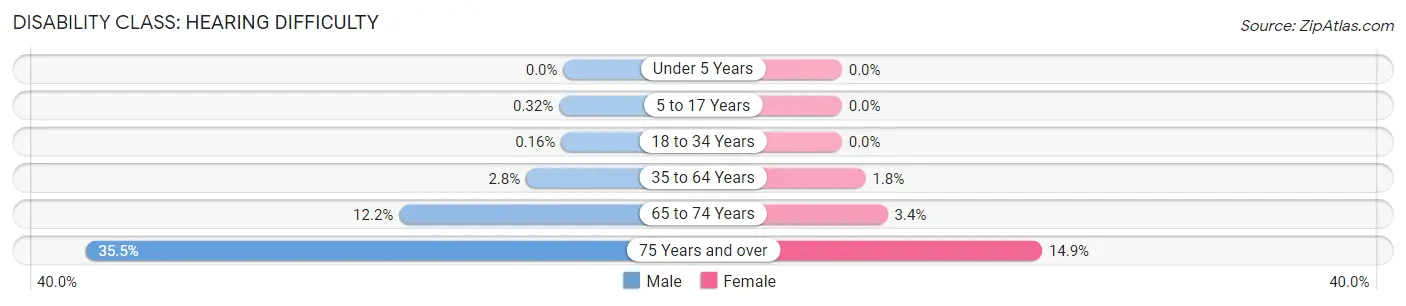
| Age Bracket | Male | Female |
| Under 5 Years | 0 (0.0%) | 0 (0.0%) |
| 5 to 17 Years | 2 (0.3%) | 0 (0.0%) |
| 18 to 34 Years | 1 (0.2%) | 0 (0.0%) |
| 35 to 64 Years | 40 (2.8%) | 25 (1.8%) |
| 65 to 74 Years | 64 (12.2%) | 16 (3.4%) |
| 75 Years and over | 110 (35.5%) | 52 (14.9%) |
Disability Class: Vision Difficulty
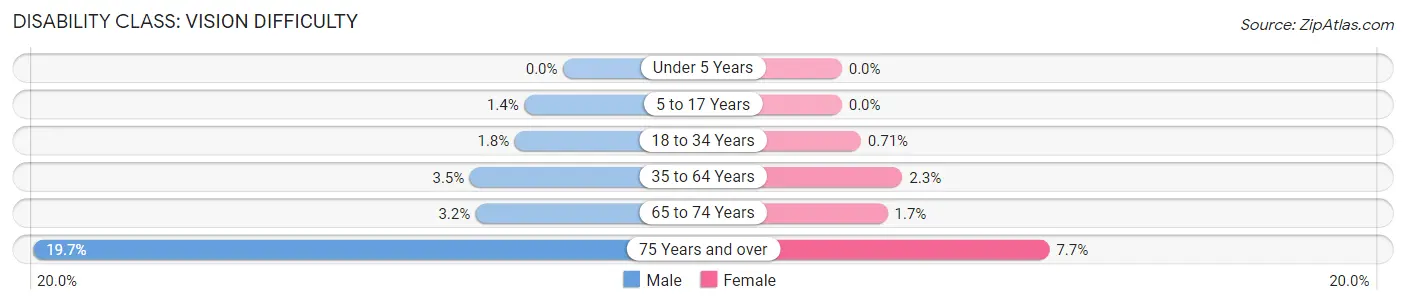
| Age Bracket | Male | Female |
| Under 5 Years | 0 (0.0%) | 0 (0.0%) |
| 5 to 17 Years | 9 (1.4%) | 0 (0.0%) |
| 18 to 34 Years | 11 (1.8%) | 4 (0.7%) |
| 35 to 64 Years | 50 (3.5%) | 32 (2.2%) |
| 65 to 74 Years | 17 (3.2%) | 8 (1.7%) |
| 75 Years and over | 61 (19.7%) | 27 (7.7%) |
Disability Class: Cognitive Difficulty
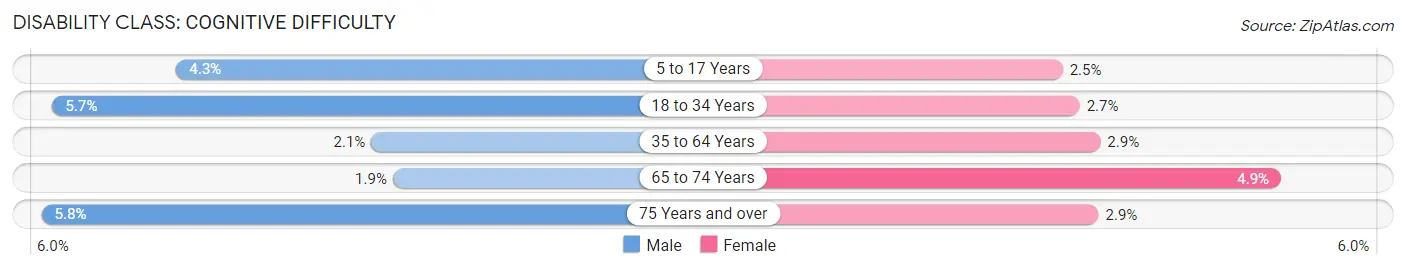
| Age Bracket | Male | Female |
| 5 to 17 Years | 27 (4.3%) | 14 (2.5%) |
| 18 to 34 Years | 35 (5.7%) | 15 (2.6%) |
| 35 to 64 Years | 31 (2.1%) | 41 (2.9%) |
| 65 to 74 Years | 10 (1.9%) | 23 (4.9%) |
| 75 Years and over | 18 (5.8%) | 10 (2.9%) |
Disability Class: Ambulatory Difficulty
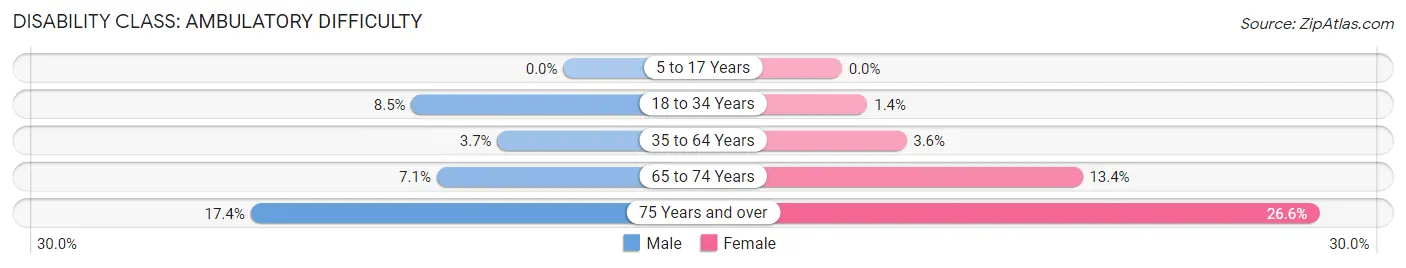
| Age Bracket | Male | Female |
| 5 to 17 Years | 0 (0.0%) | 0 (0.0%) |
| 18 to 34 Years | 52 (8.5%) | 8 (1.4%) |
| 35 to 64 Years | 53 (3.7%) | 51 (3.6%) |
| 65 to 74 Years | 37 (7.0%) | 63 (13.4%) |
| 75 Years and over | 54 (17.4%) | 93 (26.6%) |
Disability Class: Self-Care Difficulty
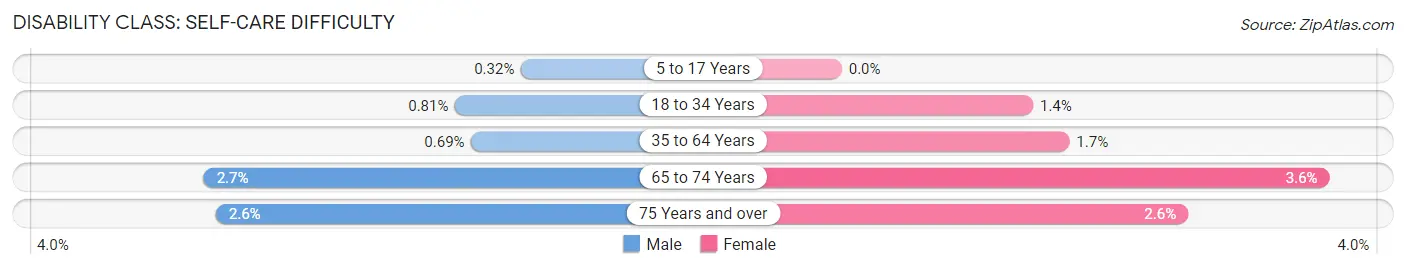
| Age Bracket | Male | Female |
| 5 to 17 Years | 2 (0.3%) | 0 (0.0%) |
| 18 to 34 Years | 5 (0.8%) | 8 (1.4%) |
| 35 to 64 Years | 10 (0.7%) | 24 (1.7%) |
| 65 to 74 Years | 14 (2.7%) | 17 (3.6%) |
| 75 Years and over | 8 (2.6%) | 9 (2.6%) |
Technology Access in Pepin County
Computing Device Access in Pepin County
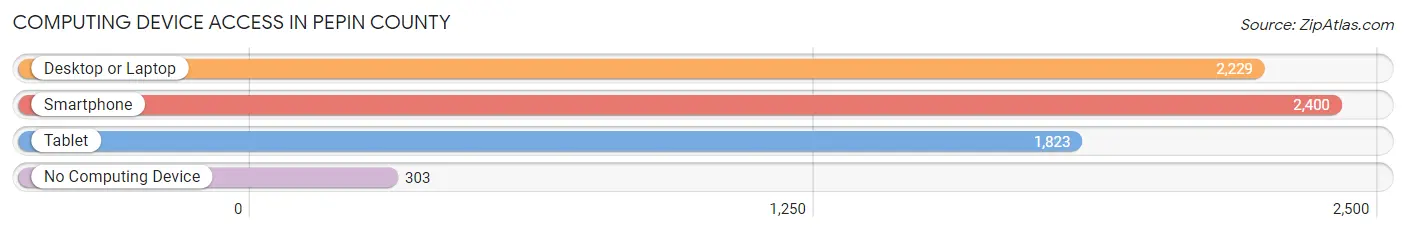
| Device Type | # Households | % Households |
| Desktop or Laptop | 2,229 | 72.4% |
| Smartphone | 2,400 | 78.0% |
| Tablet | 1,823 | 59.2% |
| No Computing Device | 303 | 9.8% |
| Total | 3,078 | 100.0% |
Internet Access in Pepin County
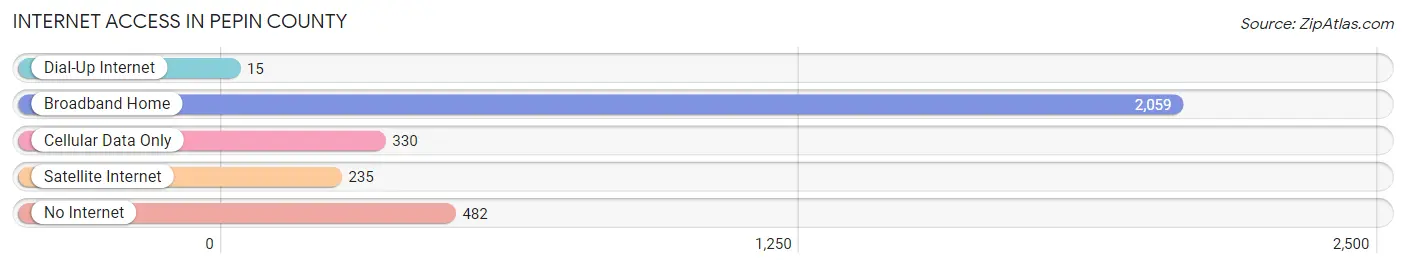
| Internet Type | # Households | % Households |
| Dial-Up Internet | 15 | 0.5% |
| Broadband Home | 2,059 | 66.9% |
| Cellular Data Only | 330 | 10.7% |
| Satellite Internet | 235 | 7.6% |
| No Internet | 482 | 15.7% |
| Total | 3,078 | 100.0% |
Pepin County Summary
Pepin County is located in the western part of Wisconsin, along the Mississippi River. It is bordered by Buffalo County to the north, Dunn County to the east, Pierce County to the south, and Chippewa County to the west. The county seat is Durand, and the largest city is Durand. The county was named after the French explorer, Pierre-Esprit Radisson, who explored the area in the 1600s.
Pepin County has a total area of 545 square miles, of which 537 square miles is land and 8 square miles is water. The county is mostly rural, with rolling hills and valleys. The terrain is mostly flat, with some areas of higher elevation. The highest point in the county is located in the town of Pepin, at an elevation of 1,068 feet.
The population of Pepin County was estimated to be 19,845 in 2019. The population has been steadily increasing since 2000, when it was 17,945. The population is spread out across the county, with the largest concentrations in the cities of Durand and Pepin. The median age in the county is 43.2 years, and the median household income is $50,945.
The economy of Pepin County is largely based on agriculture. The county is home to many dairy farms, as well as beef and poultry farms. The county also has a strong manufacturing sector, with many companies producing furniture, paper products, and other goods. Tourism is also an important part of the economy, with many visitors coming to the area to enjoy the natural beauty of the Mississippi River and the surrounding countryside.
Pepin County is home to many historical sites, including the National Register of Historic Places-listed Durand Union Station, the historic Pepin County Courthouse, and the historic Durand City Hall. The county is also home to several parks, including the Pepin County Park, the Durand City Park, and the Buffalo County Park.
Pepin County is a great place to live, work, and play. With its beautiful scenery, strong economy, and rich history, it is a great place to call home.
Common Questions
What is the Total Population of Pepin County?
Total Population of Pepin County is 7,363.
What is the Total Male Population of Pepin County?
Total Male Population of Pepin County is 3,781.
What is the Total Female Population of Pepin County?
Total Female Population of Pepin County is 3,582.
What is the Ratio of Males per 100 Females in Pepin County?
There are 105.56 Males per 100 Females in Pepin County.
What is the Ratio of Females per 100 Males in Pepin County?
There are 94.74 Females per 100 Males in Pepin County.
What is the Median Population Age in Pepin County?
Median Population Age in Pepin County is 46.3 Years.
What is the Average Family Size in Pepin County
Average Family Size in Pepin County is 2.9 People.
What is the Average Household Size in Pepin County
Average Household Size in Pepin County is 2.4 People.
What is Per Capita Income in Pepin County?
Per Capita income in Pepin County is $38,730.
What is the Median Family Income in Pepin County?
Median Family Income in Pepin County is $83,788.
What is the Median Household income in Pepin County?
Median Household Income in Pepin County is $70,833.
What is Income or Wage Gap in Pepin County?
Income or Wage Gap in Pepin County is 29.6%.
Women in Pepin County earn 70.4 cents for every dollar earned by a man.
What is Family Income Deficit in Pepin County?
Family Income Deficit in Pepin County is $9,083.
Families that are below poverty line in Pepin County earn $9,083 less on average than the poverty threshold level.
What is Inequality or Gini Index in Pepin County?
Inequality or Gini Index in Pepin County is 0.42.
How Large is the Labor Force in Pepin County?
There are 3,703 People in the Labor Forcein in Pepin County.
What is the Percentage of People in the Labor Force in Pepin County?
62.2% of People are in the Labor Force in Pepin County.
What is the Unemployment Rate in Pepin County?
Unemployment Rate in Pepin County is 2.2%.