Ozaukee County, WI
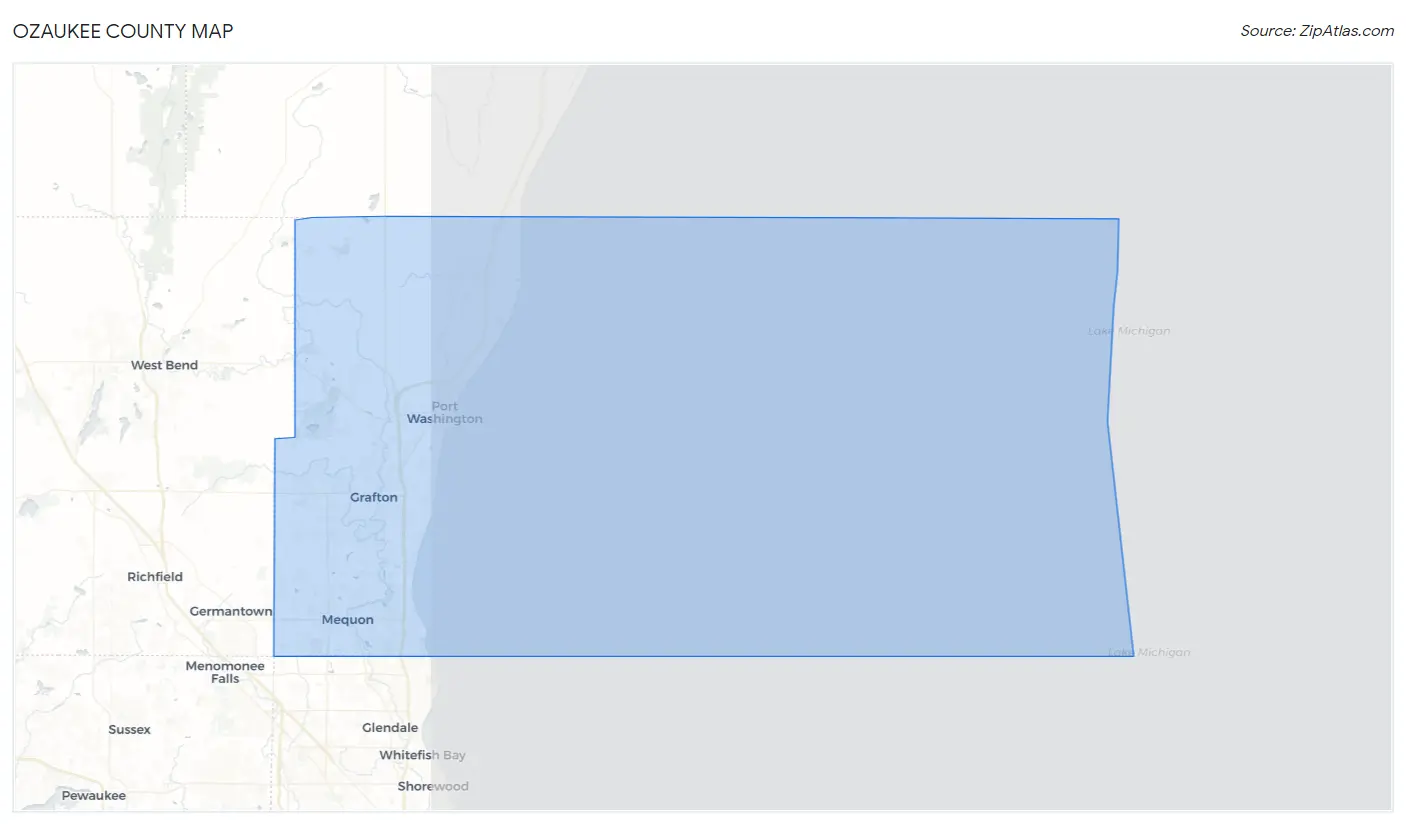
Ozaukee County Map
Ozaukee County Overview
91,745
TOTAL POPULATION
45,566
MALE POPULATION
46,179
FEMALE POPULATION
98.67
MALES / 100 FEMALES
101.35
FEMALES / 100 MALES
43.8
MEDIAN AGE
2.9
AVG FAMILY SIZE
2.4
AVG HOUSEHOLD SIZE
$55,948
PER CAPITA INCOME
$117,113
AVG FAMILY INCOME
$92,258
AVG HOUSEHOLD INCOME
42.8%
WAGE / INCOME GAP [ % ]
57.2¢/ $1
WAGE / INCOME GAP [ $ ]
$10,739
FAMILY INCOME DEFICIT
0.48
INEQUALITY / GINI INDEX
50,077
LABOR FORCE [ PEOPLE ]
66.9%
PERCENT IN LABOR FORCE
2.6%
UNEMPLOYMENT RATE
Ozaukee County Area Codes
Race in Ozaukee County
The most populous races in Ozaukee County are White / Caucasian (83,861 | 91.4%), Two or more Races (3,702 | 4.0%), and Hispanic or Latino (3,086 | 3.4%).
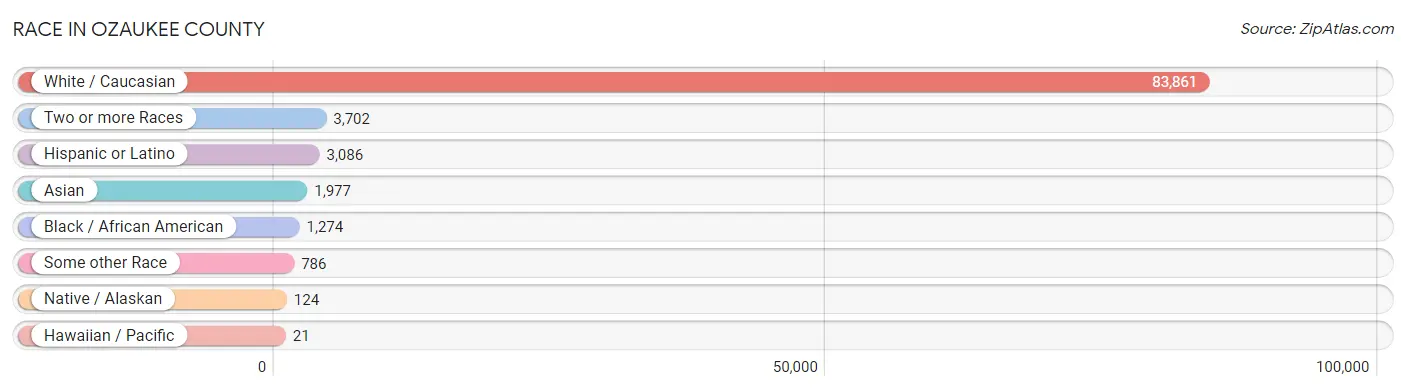
| Race | # Population | % Population |
| Asian | 1,977 | 2.1% |
| Black / African American | 1,274 | 1.4% |
| Hawaiian / Pacific | 21 | 0.0% |
| Hispanic or Latino | 3,086 | 3.4% |
| Native / Alaskan | 124 | 0.1% |
| White / Caucasian | 83,861 | 91.4% |
| Two or more Races | 3,702 | 4.0% |
| Some other Race | 786 | 0.9% |
| Total | 91,745 | 100.0% |
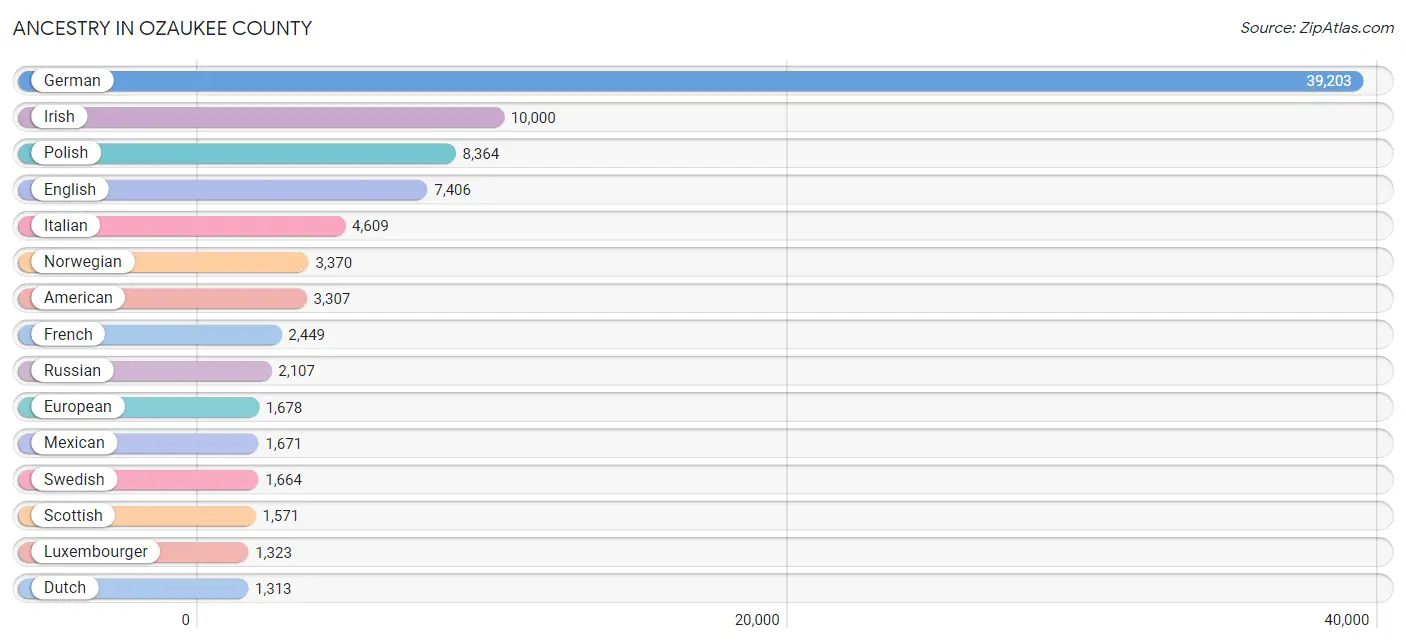
Ancestry in Ozaukee County
The most populous ancestries reported in Ozaukee County are German (39,203 | 42.7%), Irish (10,000 | 10.9%), Polish (8,364 | 9.1%), English (7,406 | 8.1%), and Italian (4,609 | 5.0%), together accounting for 75.8% of all Ozaukee County residents.
| Ancestry | # Population | % Population |
| African | 15 | 0.0% |
| Alsatian | 26 | 0.0% |
| American | 3,307 | 3.6% |
| Arab | 327 | 0.4% |
| Argentinean | 78 | 0.1% |
| Armenian | 194 | 0.2% |
| Australian | 57 | 0.1% |
| Austrian | 473 | 0.5% |
| Bangladeshi | 97 | 0.1% |
| Basque | 20 | 0.0% |
| Belgian | 370 | 0.4% |
| Belizean | 16 | 0.0% |
| Bhutanese | 242 | 0.3% |
| Blackfeet | 2 | 0.0% |
| Brazilian | 22 | 0.0% |
| British | 514 | 0.6% |
| Burmese | 263 | 0.3% |
| Cambodian | 2 | 0.0% |
| Canadian | 58 | 0.1% |
| Central American | 167 | 0.2% |
| Cherokee | 95 | 0.1% |
| Cheyenne | 26 | 0.0% |
| Chilean | 48 | 0.1% |
| Chippewa | 62 | 0.1% |
| Choctaw | 74 | 0.1% |
| Colombian | 131 | 0.1% |
| Costa Rican | 16 | 0.0% |
| Croatian | 635 | 0.7% |
| Cuban | 80 | 0.1% |
| Czech | 936 | 1.0% |
| Czechoslovakian | 281 | 0.3% |
| Danish | 609 | 0.7% |
| Dominican | 48 | 0.1% |
| Dutch | 1,313 | 1.4% |
| Eastern European | 590 | 0.6% |
| English | 7,406 | 8.1% |
| Ethiopian | 182 | 0.2% |
| European | 1,678 | 1.8% |
| Filipino | 108 | 0.1% |
| Finnish | 398 | 0.4% |
| French | 2,449 | 2.7% |
| French American Indian | 21 | 0.0% |
| French Canadian | 358 | 0.4% |
| German | 39,203 | 42.7% |
| Greek | 349 | 0.4% |
| Guamanian / Chamorro | 9 | 0.0% |
| Guatemalan | 132 | 0.1% |
| Honduran | 16 | 0.0% |
| Hungarian | 493 | 0.5% |
| Icelander | 30 | 0.0% |
| Indian (Asian) | 477 | 0.5% |
| Inupiat | 10 | 0.0% |
| Iranian | 124 | 0.1% |
| Iraqi | 184 | 0.2% |
| Irish | 10,000 | 10.9% |
| Iroquois | 39 | 0.0% |
| Israeli | 54 | 0.1% |
| Italian | 4,609 | 5.0% |
| Jamaican | 136 | 0.2% |
| Korean | 373 | 0.4% |
| Latvian | 76 | 0.1% |
| Lebanese | 125 | 0.1% |
| Lithuanian | 235 | 0.3% |
| Luxembourger | 1,323 | 1.4% |
| Macedonian | 34 | 0.0% |
| Malaysian | 65 | 0.1% |
| Menominee | 13 | 0.0% |
| Mexican | 1,671 | 1.8% |
| Native Hawaiian | 30 | 0.0% |
| New Zealander | 1 | 0.0% |
| Nicaraguan | 3 | 0.0% |
| Nigerian | 15 | 0.0% |
| Northern European | 134 | 0.2% |
| Norwegian | 3,370 | 3.7% |
| Pakistani | 80 | 0.1% |
| Pennsylvania German | 6 | 0.0% |
| Peruvian | 49 | 0.1% |
| Polish | 8,364 | 9.1% |
| Portuguese | 121 | 0.1% |
| Puerto Rican | 431 | 0.5% |
| Romanian | 345 | 0.4% |
| Russian | 2,107 | 2.3% |
| Scandinavian | 577 | 0.6% |
| Scotch-Irish | 237 | 0.3% |
| Scottish | 1,571 | 1.7% |
| Serbian | 293 | 0.3% |
| Sioux | 3 | 0.0% |
| Slavic | 57 | 0.1% |
| Slovak | 161 | 0.2% |
| Slovene | 301 | 0.3% |
| South American | 341 | 0.4% |
| Soviet Union | 12 | 0.0% |
| Spaniard | 39 | 0.0% |
| Spanish | 212 | 0.2% |
| Sri Lankan | 252 | 0.3% |
| Subsaharan African | 212 | 0.2% |
| Swedish | 1,664 | 1.8% |
| Swiss | 604 | 0.7% |
| Syrian | 108 | 0.1% |
| Thai | 806 | 0.9% |
| Ukrainian | 156 | 0.2% |
| Venezuelan | 35 | 0.0% |
| Welsh | 592 | 0.6% |
| Yugoslavian | 60 | 0.1% | View All 104 Rows |
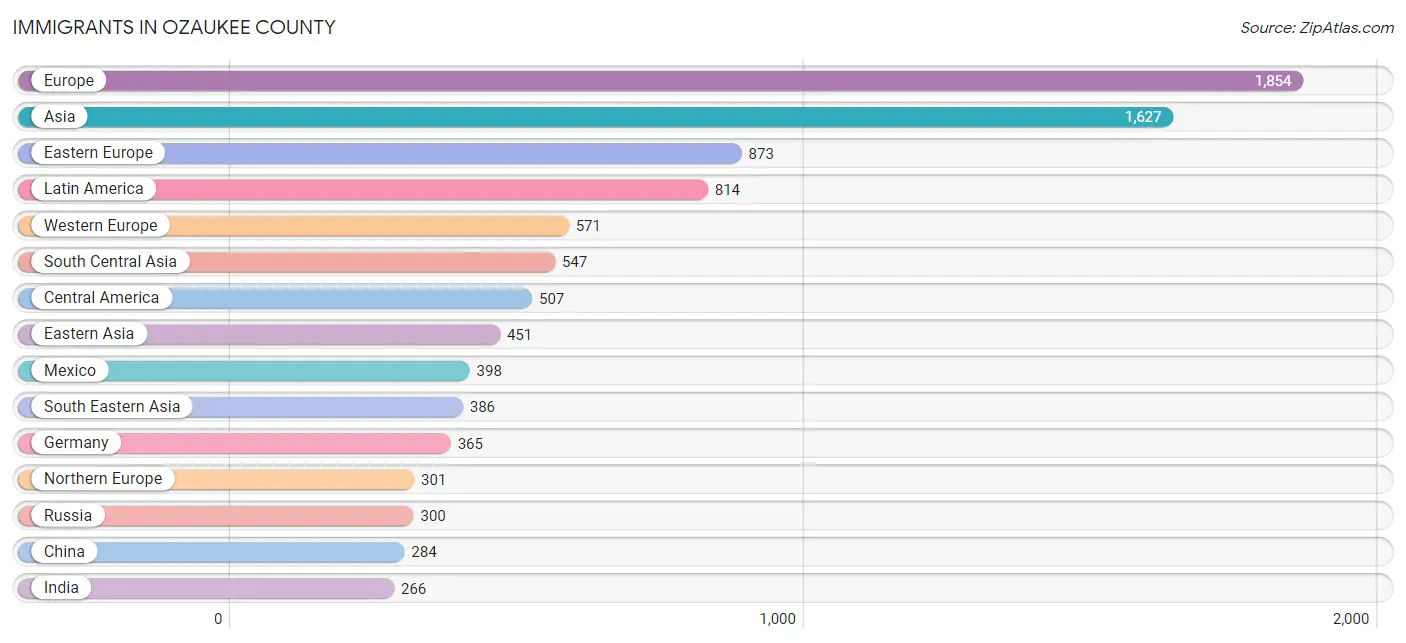
Immigrants in Ozaukee County
The most numerous immigrant groups reported in Ozaukee County came from Europe (1,854 | 2.0%), Asia (1,627 | 1.8%), Eastern Europe (873 | 0.9%), Latin America (814 | 0.9%), and Western Europe (571 | 0.6%), together accounting for 6.2% of all Ozaukee County residents.
| Immigration Origin | # Population | % Population |
| Africa | 144 | 0.2% |
| Argentina | 8 | 0.0% |
| Asia | 1,627 | 1.8% |
| Australia | 53 | 0.1% |
| Belarus | 83 | 0.1% |
| Belgium | 93 | 0.1% |
| Bosnia and Herzegovina | 14 | 0.0% |
| Brazil | 44 | 0.1% |
| Canada | 118 | 0.1% |
| Caribbean | 65 | 0.1% |
| Central America | 507 | 0.5% |
| Chile | 27 | 0.0% |
| China | 284 | 0.3% |
| Colombia | 123 | 0.1% |
| Costa Rica | 12 | 0.0% |
| Czechoslovakia | 23 | 0.0% |
| Denmark | 28 | 0.0% |
| Dominican Republic | 38 | 0.0% |
| Eastern Africa | 107 | 0.1% |
| Eastern Asia | 451 | 0.5% |
| Eastern Europe | 873 | 0.9% |
| England | 44 | 0.1% |
| Ethiopia | 107 | 0.1% |
| Europe | 1,854 | 2.0% |
| France | 37 | 0.0% |
| Germany | 365 | 0.4% |
| Ghana | 1 | 0.0% |
| Greece | 22 | 0.0% |
| Guatemala | 96 | 0.1% |
| Guyana | 9 | 0.0% |
| Hong Kong | 8 | 0.0% |
| Hungary | 66 | 0.1% |
| India | 266 | 0.3% |
| Iran | 31 | 0.0% |
| Iraq | 73 | 0.1% |
| Israel | 125 | 0.1% |
| Italy | 33 | 0.0% |
| Jamaica | 27 | 0.0% |
| Japan | 26 | 0.0% |
| Korea | 139 | 0.2% |
| Laos | 13 | 0.0% |
| Latin America | 814 | 0.9% |
| Latvia | 20 | 0.0% |
| Lebanon | 27 | 0.0% |
| Mexico | 398 | 0.4% |
| Morocco | 2 | 0.0% |
| Nepal | 23 | 0.0% |
| Netherlands | 55 | 0.1% |
| Nicaragua | 1 | 0.0% |
| Nigeria | 15 | 0.0% |
| Northern Africa | 2 | 0.0% |
| Northern Europe | 301 | 0.3% |
| Norway | 24 | 0.0% |
| Oceania | 93 | 0.1% |
| Pakistan | 105 | 0.1% |
| Peru | 7 | 0.0% |
| Philippines | 145 | 0.2% |
| Poland | 47 | 0.1% |
| Portugal | 17 | 0.0% |
| Romania | 20 | 0.0% |
| Russia | 300 | 0.3% |
| Scotland | 58 | 0.1% |
| Serbia | 64 | 0.1% |
| Singapore | 12 | 0.0% |
| South Africa | 19 | 0.0% |
| South America | 242 | 0.3% |
| South Central Asia | 547 | 0.6% |
| South Eastern Asia | 386 | 0.4% |
| Southern Europe | 80 | 0.1% |
| Spain | 8 | 0.0% |
| Sweden | 19 | 0.0% |
| Switzerland | 21 | 0.0% |
| Syria | 18 | 0.0% |
| Taiwan | 43 | 0.1% |
| Thailand | 95 | 0.1% |
| Ukraine | 185 | 0.2% |
| Uzbekistan | 68 | 0.1% |
| Venezuela | 24 | 0.0% |
| Vietnam | 121 | 0.1% |
| Western Africa | 16 | 0.0% |
| Western Asia | 243 | 0.3% |
| Western Europe | 571 | 0.6% | View All 82 Rows |
Sex and Age in Ozaukee County
Sex and Age in Ozaukee County
The most populous age groups in Ozaukee County are 60 to 64 Years (3,641 | 8.0%) for men and 60 to 64 Years (3,906 | 8.5%) for women.
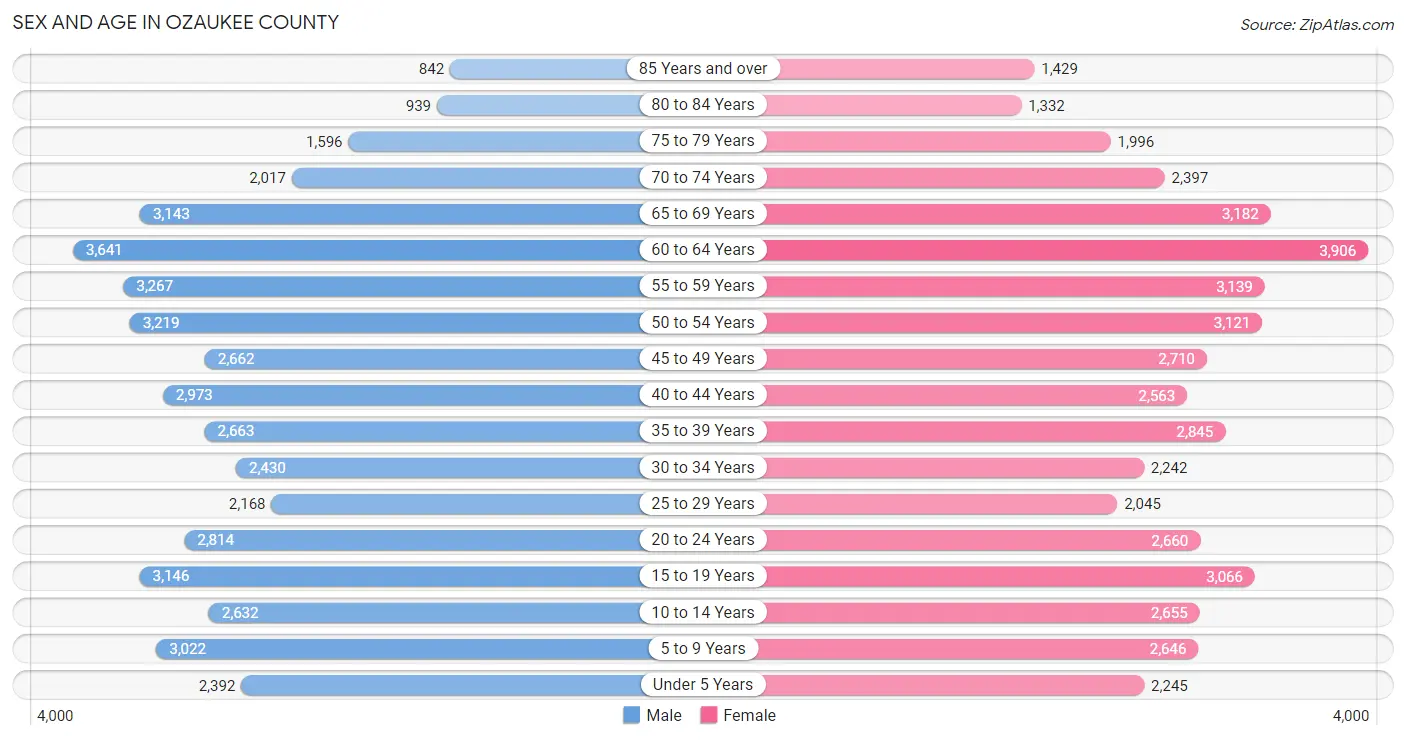
| Age Bracket | Male | Female |
| Under 5 Years | 2,392 (5.2%) | 2,245 (4.9%) |
| 5 to 9 Years | 3,022 (6.6%) | 2,646 (5.7%) |
| 10 to 14 Years | 2,632 (5.8%) | 2,655 (5.8%) |
| 15 to 19 Years | 3,146 (6.9%) | 3,066 (6.6%) |
| 20 to 24 Years | 2,814 (6.2%) | 2,660 (5.8%) |
| 25 to 29 Years | 2,168 (4.8%) | 2,045 (4.4%) |
| 30 to 34 Years | 2,430 (5.3%) | 2,242 (4.9%) |
| 35 to 39 Years | 2,663 (5.8%) | 2,845 (6.2%) |
| 40 to 44 Years | 2,973 (6.5%) | 2,563 (5.6%) |
| 45 to 49 Years | 2,662 (5.8%) | 2,710 (5.9%) |
| 50 to 54 Years | 3,219 (7.1%) | 3,121 (6.8%) |
| 55 to 59 Years | 3,267 (7.2%) | 3,139 (6.8%) |
| 60 to 64 Years | 3,641 (8.0%) | 3,906 (8.5%) |
| 65 to 69 Years | 3,143 (6.9%) | 3,182 (6.9%) |
| 70 to 74 Years | 2,017 (4.4%) | 2,397 (5.2%) |
| 75 to 79 Years | 1,596 (3.5%) | 1,996 (4.3%) |
| 80 to 84 Years | 939 (2.1%) | 1,332 (2.9%) |
| 85 Years and over | 842 (1.8%) | 1,429 (3.1%) |
| Total | 45,566 (100.0%) | 46,179 (100.0%) |
Families and Households in Ozaukee County
Median Family Size in Ozaukee County
The median family size in Ozaukee County is 2.94 persons per family, with married-couple families (21,254 | 84.3%) accounting for the largest median family size of 2.98 persons per family. On the other hand, single male/father families (1,542 | 6.1%) represent the smallest median family size with 2.66 persons per family.
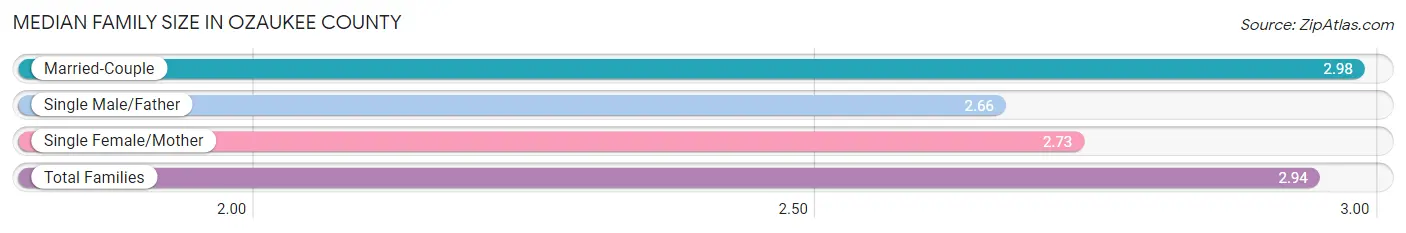
| Family Type | # Families | Family Size |
| Married-Couple | 21,254 (84.3%) | 2.98 |
| Single Male/Father | 1,542 (6.1%) | 2.66 |
| Single Female/Mother | 2,404 (9.5%) | 2.73 |
| Total Families | 25,200 (100.0%) | 2.94 |
Median Household Size in Ozaukee County
The median household size in Ozaukee County is 2.39 persons per household, with single male/father households (1,542 | 4.1%) accounting for the largest median household size of 3.06 persons per household. non-family households (12,278 | 32.8%) represent the smallest median household size with 1.17 persons per household.
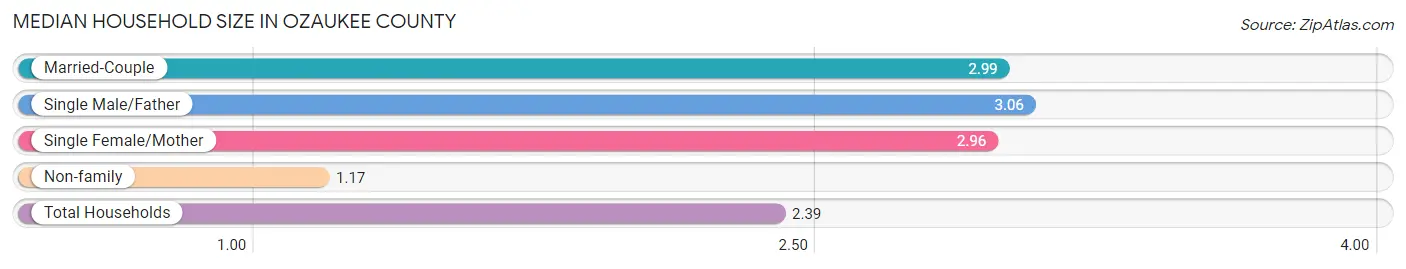
| Household Type | # Households | Household Size |
| Married-Couple | 21,254 (56.7%) | 2.99 |
| Single Male/Father | 1,542 (4.1%) | 3.06 |
| Single Female/Mother | 2,404 (6.4%) | 2.96 |
| Non-family | 12,278 (32.8%) | 1.17 |
| Total Households | 37,478 (100.0%) | 2.39 |
Household Size by Marriage Status in Ozaukee County
Out of a total of 37,478 households in Ozaukee County, 25,200 (67.2%) are family households, while 12,278 (32.8%) are nonfamily households. The most numerous type of family households are 2-person households, comprising 12,540, and the most common type of nonfamily households are 1-person households, comprising 10,603.
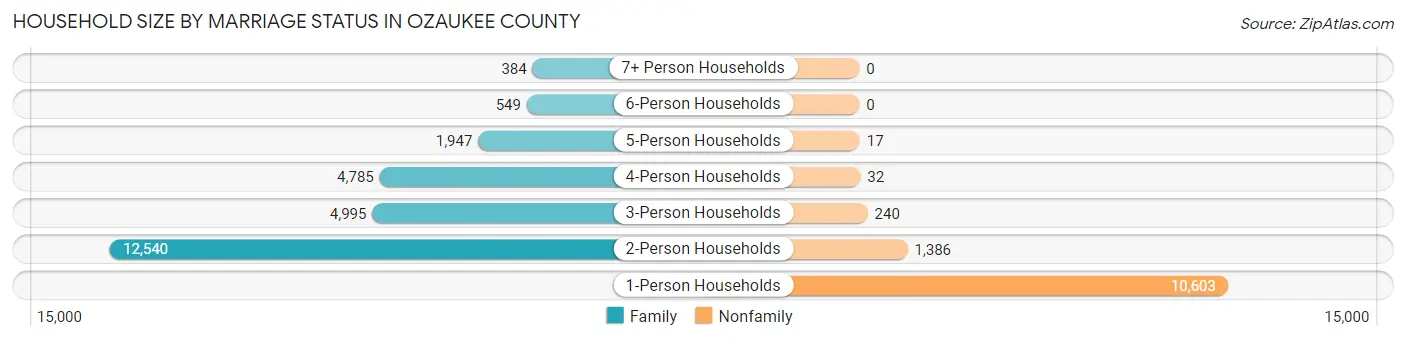
| Household Size | Family Households | Nonfamily Households |
| 1-Person Households | - | 10,603 (28.3%) |
| 2-Person Households | 12,540 (33.5%) | 1,386 (3.7%) |
| 3-Person Households | 4,995 (13.3%) | 240 (0.6%) |
| 4-Person Households | 4,785 (12.8%) | 32 (0.1%) |
| 5-Person Households | 1,947 (5.2%) | 17 (0.1%) |
| 6-Person Households | 549 (1.5%) | 0 (0.0%) |
| 7+ Person Households | 384 (1.0%) | 0 (0.0%) |
| Total | 25,200 (67.2%) | 12,278 (32.8%) |
Female Fertility in Ozaukee County
Fertility by Age in Ozaukee County
Average fertility rate in Ozaukee County is 52.0 births per 1,000 women. Women in the age bracket of 20 to 34 years have the highest fertility rate with 89.0 births per 1,000 women. Women in the age bracket of 20 to 34 years acount for 63.6% of all women with births.
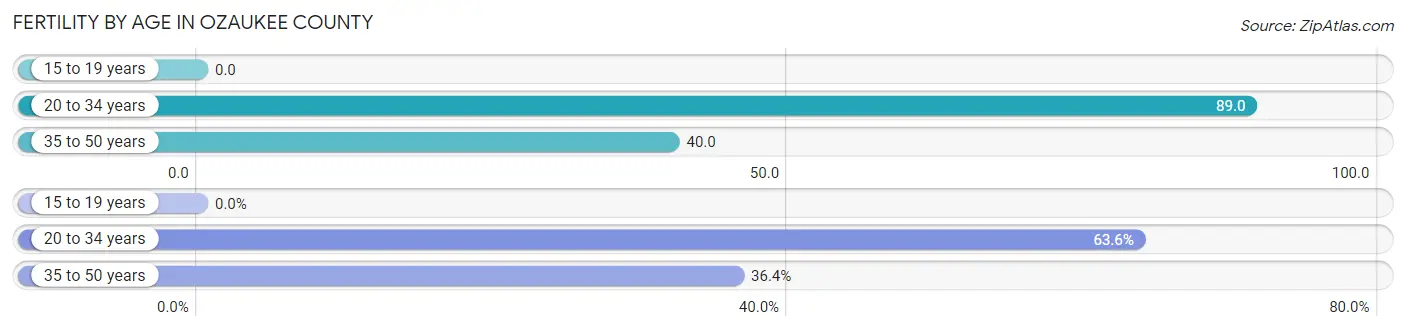
| Age Bracket | Women with Births | Births / 1,000 Women |
| 15 to 19 years | 0 (0.0%) | 0.0 |
| 20 to 34 years | 619 (63.6%) | 89.0 |
| 35 to 50 years | 354 (36.4%) | 40.0 |
| Total | 973 (100.0%) | 52.0 |
Fertility by Age by Marriage Status in Ozaukee County
90.8% of women with births (973) in Ozaukee County are married. The highest percentage of unmarried women with births falls into 20 to 34 years age bracket with 11.5% of them unmarried at the time of birth, while the lowest percentage of unmarried women with births belong to 35 to 50 years age bracket with 5.4% of them unmarried.
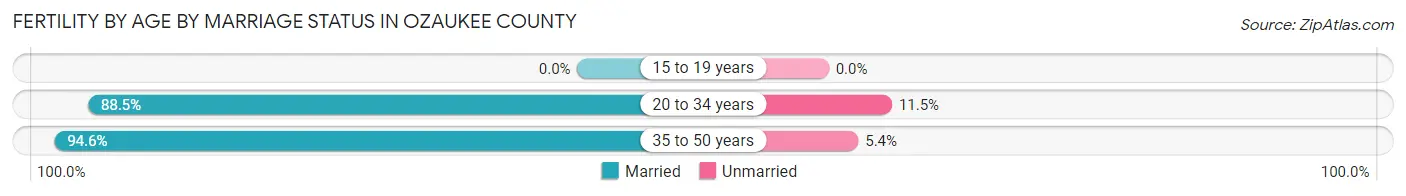
| Age Bracket | Married | Unmarried |
| 15 to 19 years | 0 (0.0%) | 0 (0.0%) |
| 20 to 34 years | 548 (88.5%) | 71 (11.5%) |
| 35 to 50 years | 335 (94.6%) | 19 (5.4%) |
| Total | 883 (90.7%) | 90 (9.2%) |
Fertility by Education in Ozaukee County

| Educational Attainment | Women with Births | Births / 1,000 Women |
| Less than High School | 0 (0.0%) | 0.0 |
| High School Diploma | 69 (7.1%) | 23.0 |
| College or Associate's Degree | 103 (10.6%) | 22.0 |
| Bachelor's Degree | 489 (50.3%) | 82.0 |
| Graduate Degree | 312 (32.1%) | 107.0 |
| Total | 973 (100.0%) | 52.0 |
Fertility by Education by Marriage Status in Ozaukee County
9.2% of women with births in Ozaukee County are unmarried. Women with the educational attainment of bachelor's degree are most likely to be married with 100.0% of them married at childbirth, while women with the educational attainment of high school diploma are least likely to be married with 59.4% of them unmarried at childbirth.
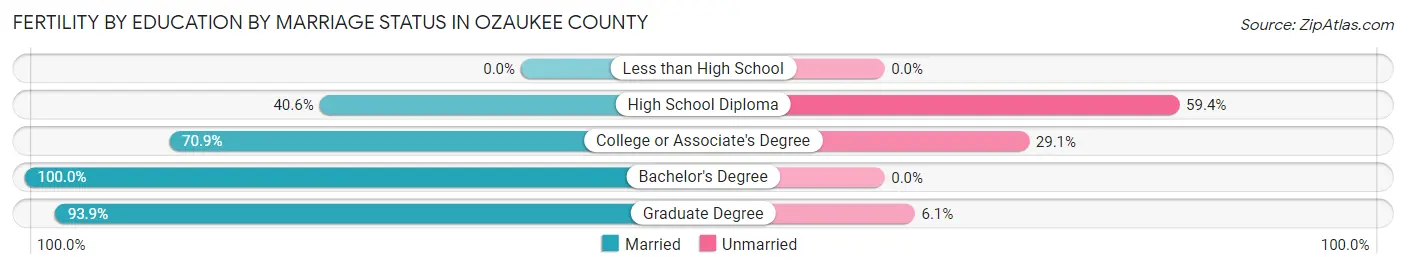
| Educational Attainment | Married | Unmarried |
| Less than High School | 0 (0.0%) | 0 (0.0%) |
| High School Diploma | 28 (40.6%) | 41 (59.4%) |
| College or Associate's Degree | 73 (70.9%) | 30 (29.1%) |
| Bachelor's Degree | 489 (100.0%) | 0 (0.0%) |
| Graduate Degree | 293 (93.9%) | 19 (6.1%) |
| Total | 883 (90.7%) | 90 (9.2%) |
Income in Ozaukee County
Income Overview in Ozaukee County
Per Capita Income in Ozaukee County is $55,948, while median incomes of families and households are $117,113 and $92,258 respectively.
| Characteristic | Number | Measure |
| Per Capita Income | 91,745 | $55,948 |
| Median Family Income | 25,200 | $117,113 |
| Mean Family Income | 25,200 | $161,650 |
| Median Household Income | 37,478 | $92,258 |
| Mean Household Income | 37,478 | $132,648 |
| Income Deficit | 25,200 | $10,739 |
| Wage / Income Gap (%) | 91,745 | 42.75% |
| Wage / Income Gap ($) | 91,745 | 57.25¢ per $1 |
| Gini / Inequality Index | 91,745 | 0.48 |
Earnings by Sex in Ozaukee County
Average Earnings in Ozaukee County are $50,801, $64,700 for men and $37,039 for women, a difference of 42.7%.
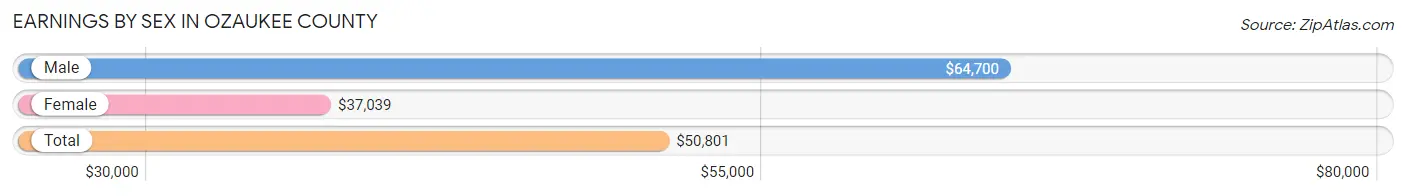
| Sex | Number | Average Earnings |
| Male | 28,489 (53.4%) | $64,700 |
| Female | 24,859 (46.6%) | $37,039 |
| Total | 53,348 (100.0%) | $50,801 |
Earnings by Sex by Income Bracket in Ozaukee County
The most common earnings brackets in Ozaukee County are $100,000+ for men (8,801 | 30.9%) and $100,000+ for women (2,650 | 10.7%).
| Income | Male | Female |
| $2,499 or less | 1,259 (4.4%) | 1,955 (7.9%) |
| $2,500 to $4,999 | 982 (3.5%) | 1,226 (4.9%) |
| $5,000 to $7,499 | 795 (2.8%) | 1,180 (4.8%) |
| $7,500 to $9,999 | 438 (1.5%) | 1,047 (4.2%) |
| $10,000 to $12,499 | 527 (1.8%) | 787 (3.2%) |
| $12,500 to $14,999 | 523 (1.8%) | 639 (2.6%) |
| $15,000 to $17,499 | 663 (2.3%) | 567 (2.3%) |
| $17,500 to $19,999 | 513 (1.8%) | 592 (2.4%) |
| $20,000 to $22,499 | 355 (1.3%) | 506 (2.0%) |
| $22,500 to $24,999 | 606 (2.1%) | 737 (3.0%) |
| $25,000 to $29,999 | 757 (2.7%) | 1,537 (6.2%) |
| $30,000 to $34,999 | 652 (2.3%) | 1,049 (4.2%) |
| $35,000 to $39,999 | 731 (2.6%) | 1,326 (5.3%) |
| $40,000 to $44,999 | 842 (3.0%) | 1,030 (4.1%) |
| $45,000 to $49,999 | 1,237 (4.3%) | 1,174 (4.7%) |
| $50,000 to $54,999 | 1,143 (4.0%) | 1,329 (5.3%) |
| $55,000 to $64,999 | 2,280 (8.0%) | 1,547 (6.2%) |
| $65,000 to $74,999 | 1,669 (5.9%) | 1,415 (5.7%) |
| $75,000 to $99,999 | 3,716 (13.0%) | 2,566 (10.3%) |
| $100,000+ | 8,801 (30.9%) | 2,650 (10.7%) |
| Total | 28,489 (100.0%) | 24,859 (100.0%) |
Earnings by Sex by Educational Attainment in Ozaukee County
Average earnings in Ozaukee County are $77,108 for men and $45,895 for women, a difference of 40.5%. Men with an educational attainment of graduate degree enjoy the highest average annual earnings of $139,821, while those with less than high school education earn the least with $43,295. Women with an educational attainment of graduate degree earn the most with the average annual earnings of $71,614, while those with less than high school education have the smallest earnings of $20,625.
| Educational Attainment | Male Income | Female Income |
| Less than High School | $43,295 | $20,625 |
| High School Diploma | $52,719 | $32,578 |
| College or Associate's Degree | $62,931 | $37,679 |
| Bachelor's Degree | $90,545 | $54,026 |
| Graduate Degree | $139,821 | $71,614 |
| Total | $77,108 | $45,895 |
Family Income in Ozaukee County
Family Income Brackets in Ozaukee County
According to the Ozaukee County family income data, there are 5,695 families falling into the $200,000+ income range, which is the most common income bracket and makes up 22.6% of all families. Conversely, the $10,000 to $14,999 income bracket is the least frequent group with only 101 families (0.4%) belonging to this category.

| Income Bracket | # Families | % Families |
| Less than $10,000 | 353 | 1.4% |
| $10,000 to $14,999 | 101 | 0.4% |
| $15,000 to $24,999 | 529 | 2.1% |
| $25,000 to $34,999 | 529 | 2.1% |
| $35,000 to $49,999 | 2,243 | 8.9% |
| $50,000 to $74,999 | 3,251 | 12.9% |
| $75,000 to $99,999 | 3,352 | 13.3% |
| $100,000 to $149,999 | 5,242 | 20.8% |
| $150,000 to $199,999 | 3,906 | 15.5% |
| $200,000+ | 5,695 | 22.6% |
Family Income by Famaliy Size in Ozaukee County
7+ person families (245 | 1.0%) account for the highest median family income in Ozaukee County with $195,298 per family, while 2-person families (12,907 | 51.2%) have the highest median income of $48,250 per family member.
| Income Bracket | # Families | Median Income |
| 2-Person Families | 12,907 (51.2%) | $96,499 |
| 3-Person Families | 5,084 (20.2%) | $142,425 |
| 4-Person Families | 4,561 (18.1%) | $151,507 |
| 5-Person Families | 1,936 (7.7%) | $159,063 |
| 6-Person Families | 467 (1.8%) | $161,094 |
| 7+ Person Families | 245 (1.0%) | $195,298 |
| Total | 25,200 (100.0%) | $117,113 |
Family Income by Number of Earners in Ozaukee County
The median family income in Ozaukee County is $117,113, with families comprising 3+ earners (3,087) having the highest median family income of $178,688, while families with no earners (3,909) have the lowest median family income of $64,856, accounting for 12.2% and 15.5% of families, respectively.
| Number of Earners | # Families | Median Income |
| No Earners | 3,909 (15.5%) | $64,856 |
| 1 Earner | 6,237 (24.7%) | $85,502 |
| 2 Earners | 11,967 (47.5%) | $143,970 |
| 3+ Earners | 3,087 (12.2%) | $178,688 |
| Total | 25,200 (100.0%) | $117,113 |
Household Income in Ozaukee County
Household Income Brackets in Ozaukee County
With 6,746 households falling in the category, the $100,000 to $149,999 income range is the most frequent in Ozaukee County, accounting for 18.0% of all households. In contrast, only 562 households (1.5%) fall into the $10,000 to $14,999 income bracket, making it the least populous group.
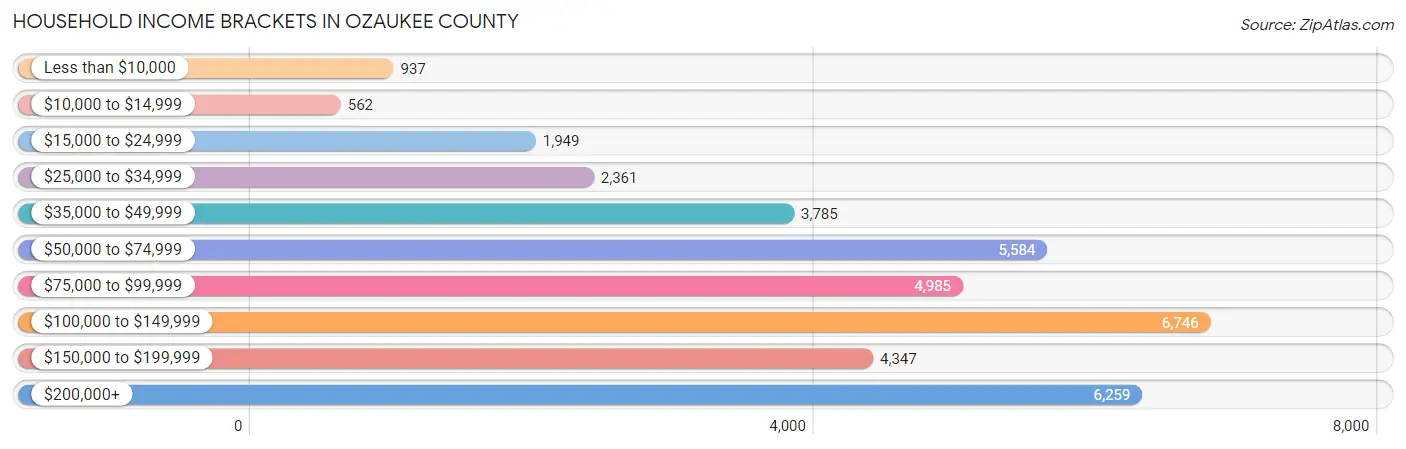
| Income Bracket | # Households | % Households |
| Less than $10,000 | 937 | 2.5% |
| $10,000 to $14,999 | 562 | 1.5% |
| $15,000 to $24,999 | 1,949 | 5.2% |
| $25,000 to $34,999 | 2,361 | 6.3% |
| $35,000 to $49,999 | 3,785 | 10.1% |
| $50,000 to $74,999 | 5,584 | 14.9% |
| $75,000 to $99,999 | 4,985 | 13.3% |
| $100,000 to $149,999 | 6,746 | 18.0% |
| $150,000 to $199,999 | 4,347 | 11.6% |
| $200,000+ | 6,259 | 16.7% |
Household Income by Householder Age in Ozaukee County
The median household income in Ozaukee County is $92,258, with the highest median household income of $125,356 found in the 45 to 64 years age bracket for the primary householder. A total of 14,259 households (38.1%) fall into this category. Meanwhile, the 15 to 24 years age bracket for the primary householder has the lowest median household income of $39,260, with 952 households (2.5%) in this group.
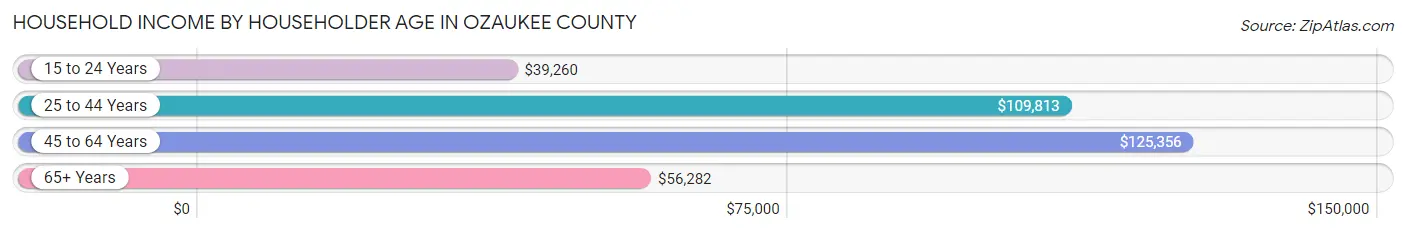
| Income Bracket | # Households | Median Income |
| 15 to 24 Years | 952 (2.5%) | $39,260 |
| 25 to 44 Years | 9,894 (26.4%) | $109,813 |
| 45 to 64 Years | 14,259 (38.1%) | $125,356 |
| 65+ Years | 12,373 (33.0%) | $56,282 |
| Total | 37,478 (100.0%) | $92,258 |
Poverty in Ozaukee County
Income Below Poverty by Sex and Age in Ozaukee County
With 3.4% poverty level for males and 5.6% for females among the residents of Ozaukee County, 12 to 14 year old males and 18 to 24 year old females are the most vulnerable to poverty, with 120 males (6.8%) and 503 females (16.9%) in their respective age groups living below the poverty level.
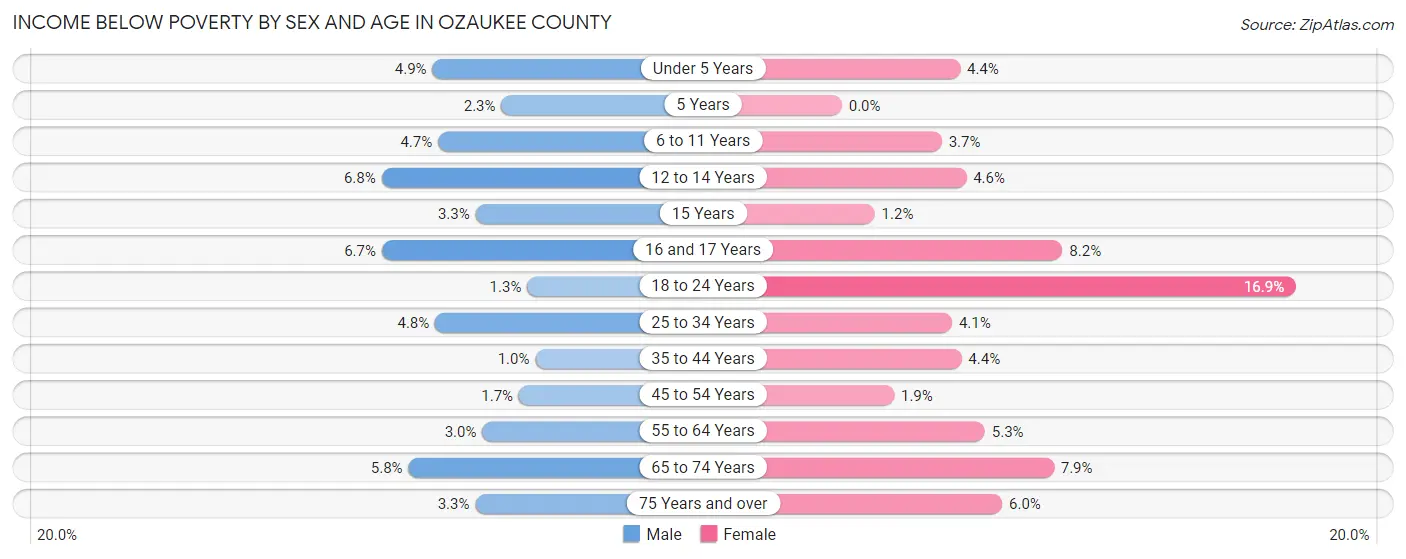
| Age Bracket | Male | Female |
| Under 5 Years | 111 (4.9%) | 98 (4.4%) |
| 5 Years | 11 (2.3%) | 0 (0.0%) |
| 6 to 11 Years | 156 (4.6%) | 119 (3.7%) |
| 12 to 14 Years | 120 (6.8%) | 67 (4.6%) |
| 15 Years | 21 (3.3%) | 8 (1.2%) |
| 16 and 17 Years | 86 (6.7%) | 92 (8.2%) |
| 18 to 24 Years | 48 (1.3%) | 503 (16.9%) |
| 25 to 34 Years | 217 (4.8%) | 175 (4.1%) |
| 35 to 44 Years | 58 (1.0%) | 240 (4.4%) |
| 45 to 54 Years | 97 (1.7%) | 113 (1.9%) |
| 55 to 64 Years | 207 (3.0%) | 374 (5.3%) |
| 65 to 74 Years | 296 (5.8%) | 438 (7.9%) |
| 75 Years and over | 108 (3.3%) | 273 (5.9%) |
| Total | 1,536 (3.4%) | 2,500 (5.6%) |
Income Above Poverty by Sex and Age in Ozaukee County
According to the poverty statistics in Ozaukee County, males aged 35 to 44 years and females aged 5 years are the age groups that are most secure financially, with 99.0% of males and 100.0% of females in these age groups living above the poverty line.
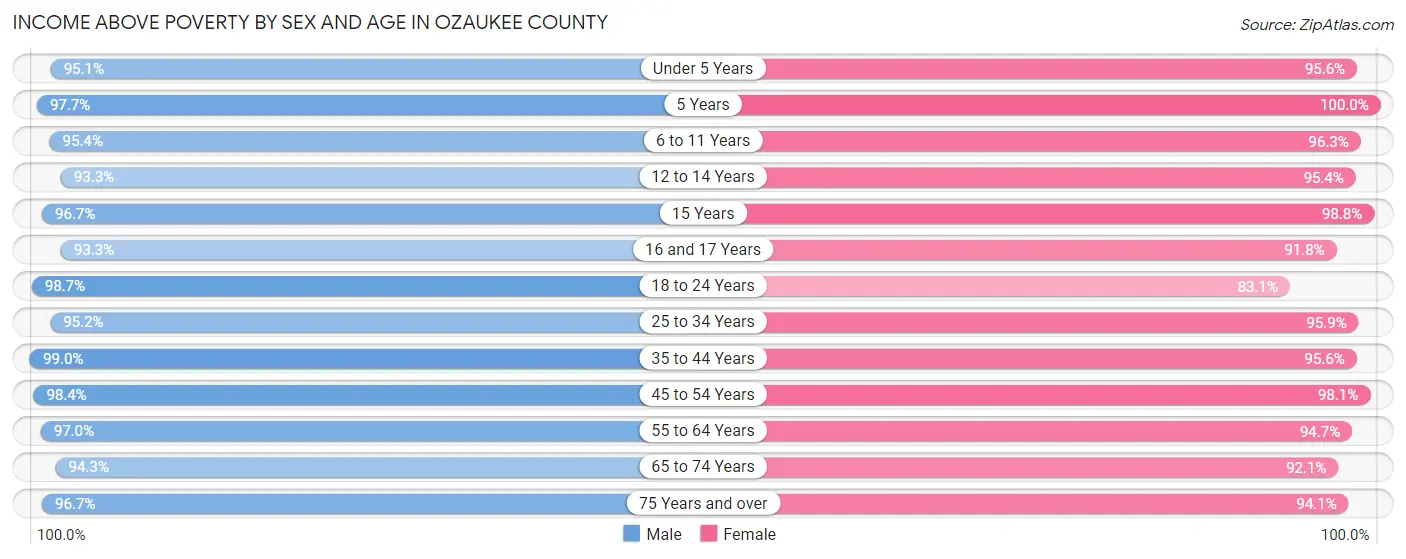
| Age Bracket | Male | Female |
| Under 5 Years | 2,173 (95.1%) | 2,132 (95.6%) |
| 5 Years | 468 (97.7%) | 630 (100.0%) |
| 6 to 11 Years | 3,201 (95.4%) | 3,086 (96.3%) |
| 12 to 14 Years | 1,658 (93.2%) | 1,383 (95.4%) |
| 15 Years | 624 (96.7%) | 647 (98.8%) |
| 16 and 17 Years | 1,190 (93.3%) | 1,031 (91.8%) |
| 18 to 24 Years | 3,534 (98.7%) | 2,480 (83.1%) |
| 25 to 34 Years | 4,340 (95.2%) | 4,099 (95.9%) |
| 35 to 44 Years | 5,532 (99.0%) | 5,162 (95.6%) |
| 45 to 54 Years | 5,765 (98.4%) | 5,718 (98.1%) |
| 55 to 64 Years | 6,664 (97.0%) | 6,667 (94.7%) |
| 65 to 74 Years | 4,851 (94.3%) | 5,127 (92.1%) |
| 75 Years and over | 3,191 (96.7%) | 4,316 (94.1%) |
| Total | 43,191 (96.6%) | 42,478 (94.4%) |
Income Below Poverty Among Married-Couple Families in Ozaukee County
The poverty statistics for married-couple families in Ozaukee County show that 1.8% or 393 of the total 21,254 families live below the poverty line. Families with 3 or 4 children have the highest poverty rate of 2.3%, comprising of 39 families. On the other hand, families with 5 or more children have the lowest poverty rate of 0.0%, which includes 0 families.
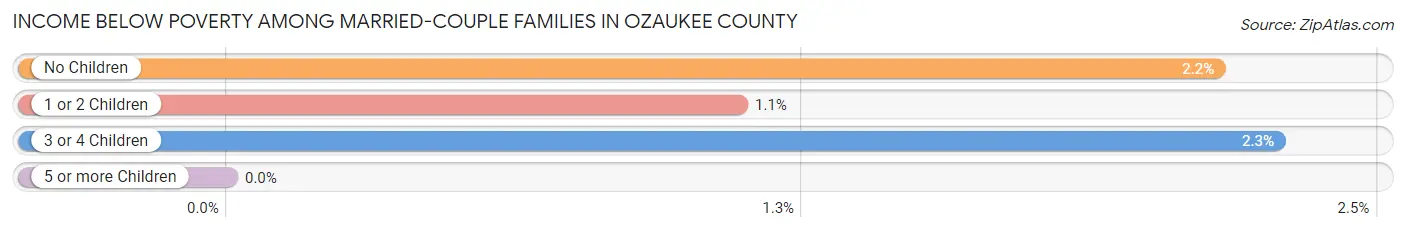
| Children | Above Poverty | Below Poverty |
| No Children | 12,989 (97.9%) | 286 (2.1%) |
| 1 or 2 Children | 6,067 (98.9%) | 68 (1.1%) |
| 3 or 4 Children | 1,674 (97.7%) | 39 (2.3%) |
| 5 or more Children | 131 (100.0%) | 0 (0.0%) |
| Total | 20,861 (98.2%) | 393 (1.8%) |
Income Below Poverty Among Single-Parent Households in Ozaukee County
According to the poverty data in Ozaukee County, 4.7% or 73 single-father households and 12.4% or 299 single-mother households are living below the poverty line. Among single-father households, those with 1 or 2 children have the highest poverty rate, with 49 households (5.8%) experiencing poverty. Likewise, among single-mother households, those with 5 or more children have the highest poverty rate, with 8 households (100.0%) falling below the poverty line.
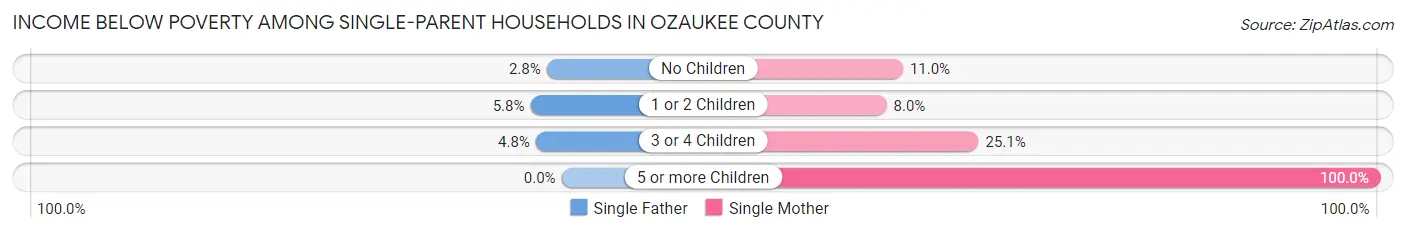
| Children | Single Father | Single Mother |
| No Children | 13 (2.8%) | 108 (11.0%) |
| 1 or 2 Children | 49 (5.8%) | 81 (8.0%) |
| 3 or 4 Children | 11 (4.8%) | 102 (25.1%) |
| 5 or more Children | 0 (0.0%) | 8 (100.0%) |
| Total | 73 (4.7%) | 299 (12.4%) |
Income Below Poverty Among Married-Couple vs Single-Parent Households in Ozaukee County
The poverty data for Ozaukee County shows that 393 of the married-couple family households (1.8%) and 372 of the single-parent households (9.4%) are living below the poverty level. Within the married-couple family households, those with 3 or 4 children have the highest poverty rate, with 39 households (2.3%) falling below the poverty line. Among the single-parent households, those with 5 or more children have the highest poverty rate, with 8 household (100.0%) living below poverty.
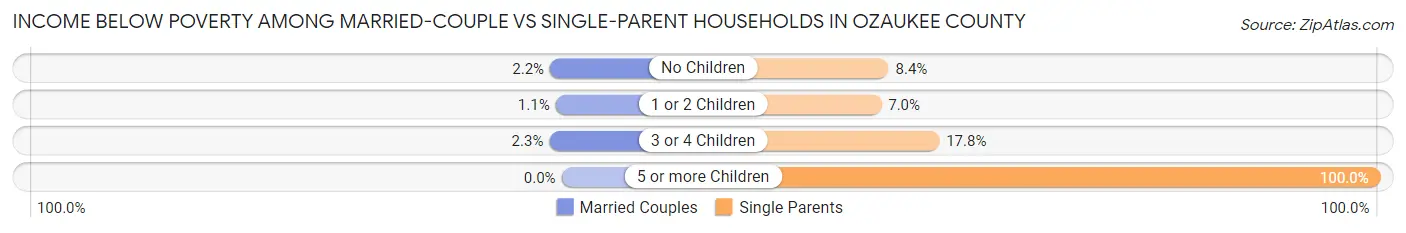
| Children | Married-Couple Families | Single-Parent Households |
| No Children | 286 (2.1%) | 121 (8.4%) |
| 1 or 2 Children | 68 (1.1%) | 130 (7.0%) |
| 3 or 4 Children | 39 (2.3%) | 113 (17.8%) |
| 5 or more Children | 0 (0.0%) | 8 (100.0%) |
| Total | 393 (1.8%) | 372 (9.4%) |
Employment Characteristics in Ozaukee County
Employment by Class of Employer in Ozaukee County
Among the 48,123 employed individuals in Ozaukee County, private company employees (33,590 | 69.8%), not-for-profit organizations (5,240 | 10.9%), and local government employees (2,963 | 6.2%) make up the most common classes of employment.
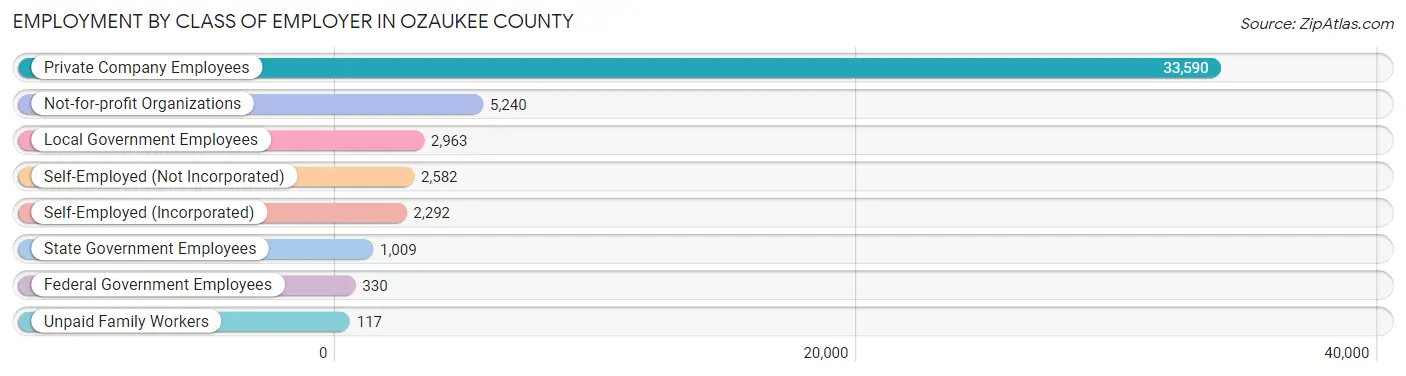
| Employer Class | # Employees | % Employees |
| Private Company Employees | 33,590 | 69.8% |
| Self-Employed (Incorporated) | 2,292 | 4.8% |
| Self-Employed (Not Incorporated) | 2,582 | 5.4% |
| Not-for-profit Organizations | 5,240 | 10.9% |
| Local Government Employees | 2,963 | 6.2% |
| State Government Employees | 1,009 | 2.1% |
| Federal Government Employees | 330 | 0.7% |
| Unpaid Family Workers | 117 | 0.2% |
| Total | 48,123 | 100.0% |
Employment Status by Age in Ozaukee County
According to the labor force statistics for Ozaukee County, out of the total population over 16 years of age (74,853), 66.9% or 50,077 individuals are in the labor force, with 2.6% or 1,302 of them unemployed. The age group with the highest labor force participation rate is 25 to 29 years, with 90.0% or 3,792 individuals in the labor force. Within the labor force, the 20 to 24 years age range has the highest percentage of unemployed individuals, with 9.4% or 429 of them being unemployed.
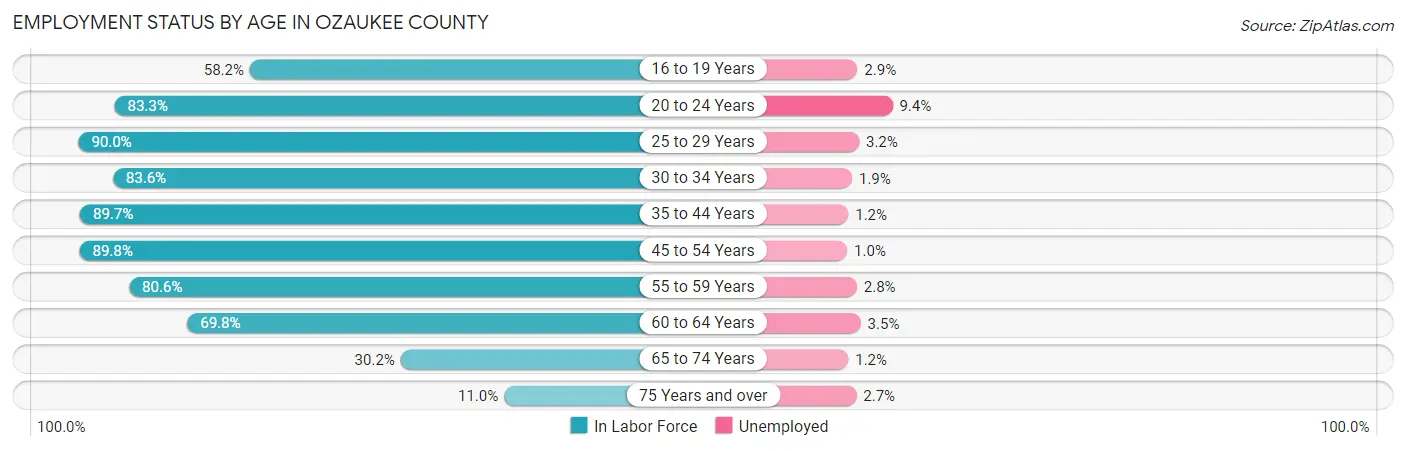
| Age Bracket | In Labor Force | Unemployed |
| 16 to 19 Years | 2,859 (58.2%) | 83 (2.9%) |
| 20 to 24 Years | 4,560 (83.3%) | 429 (9.4%) |
| 25 to 29 Years | 3,792 (90.0%) | 121 (3.2%) |
| 30 to 34 Years | 3,906 (83.6%) | 74 (1.9%) |
| 35 to 44 Years | 9,906 (89.7%) | 119 (1.2%) |
| 45 to 54 Years | 10,517 (89.8%) | 105 (1.0%) |
| 55 to 59 Years | 5,163 (80.6%) | 145 (2.8%) |
| 60 to 64 Years | 5,268 (69.8%) | 184 (3.5%) |
| 65 to 74 Years | 3,243 (30.2%) | 39 (1.2%) |
| 75 Years and over | 895 (11.0%) | 24 (2.7%) |
| Total | 50,077 (66.9%) | 1,302 (2.6%) |
Employment Status by Educational Attainment in Ozaukee County
According to labor force statistics for Ozaukee County, 84.6% of individuals (38,573) out of the total population between 25 and 64 years of age (45,594) are in the labor force, with 1.9% or 733 of them being unemployed. The group with the highest labor force participation rate are those with the educational attainment of bachelor's degree or higher, with 87.7% or 21,386 individuals in the labor force. Within the labor force, individuals with less than high school education have the highest percentage of unemployment, with 8.0% or 37 of them being unemployed.
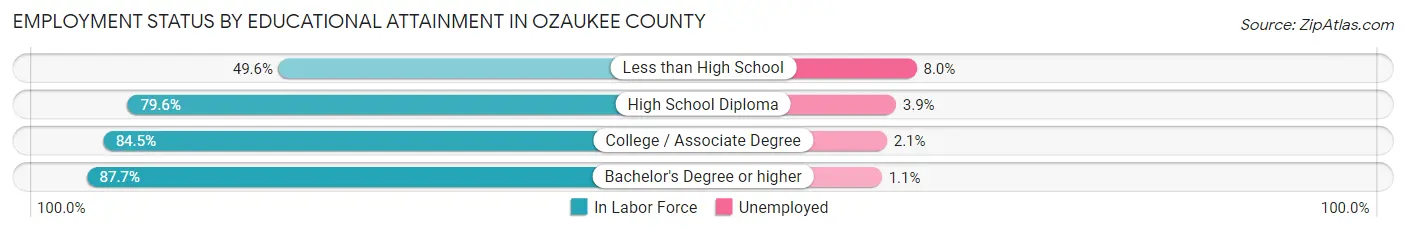
| Educational Attainment | In Labor Force | Unemployed |
| Less than High School | 460 (49.6%) | 74 (8.0%) |
| High School Diploma | 6,745 (79.6%) | 330 (3.9%) |
| College / Associate Degree | 9,978 (84.5%) | 248 (2.1%) |
| Bachelor's Degree or higher | 21,386 (87.7%) | 268 (1.1%) |
| Total | 38,573 (84.6%) | 866 (1.9%) |
Employment Occupations by Sex in Ozaukee County
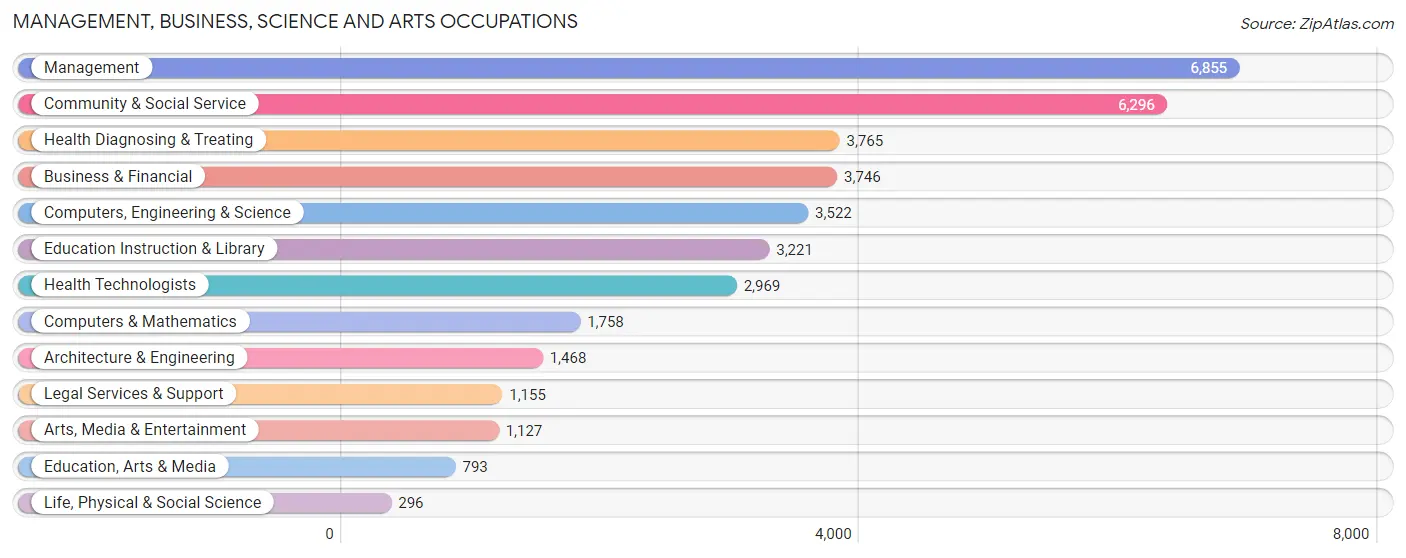
Management, Business, Science and Arts Occupations
The most common Management, Business, Science and Arts occupations in Ozaukee County are Management (6,855 | 14.1%), Community & Social Service (6,296 | 12.9%), Health Diagnosing & Treating (3,765 | 7.7%), Business & Financial (3,746 | 7.7%), and Computers, Engineering & Science (3,522 | 7.2%).
Management, Business, Science and Arts Occupations by Sex
Within the Management, Business, Science and Arts occupations in Ozaukee County, the most male-oriented occupations are Architecture & Engineering (88.8%), Computers, Engineering & Science (75.3%), and Legal Services & Support (71.4%), while the most female-oriented occupations are Education, Arts & Media (76.4%), Education Instruction & Library (74.2%), and Health Diagnosing & Treating (73.4%).
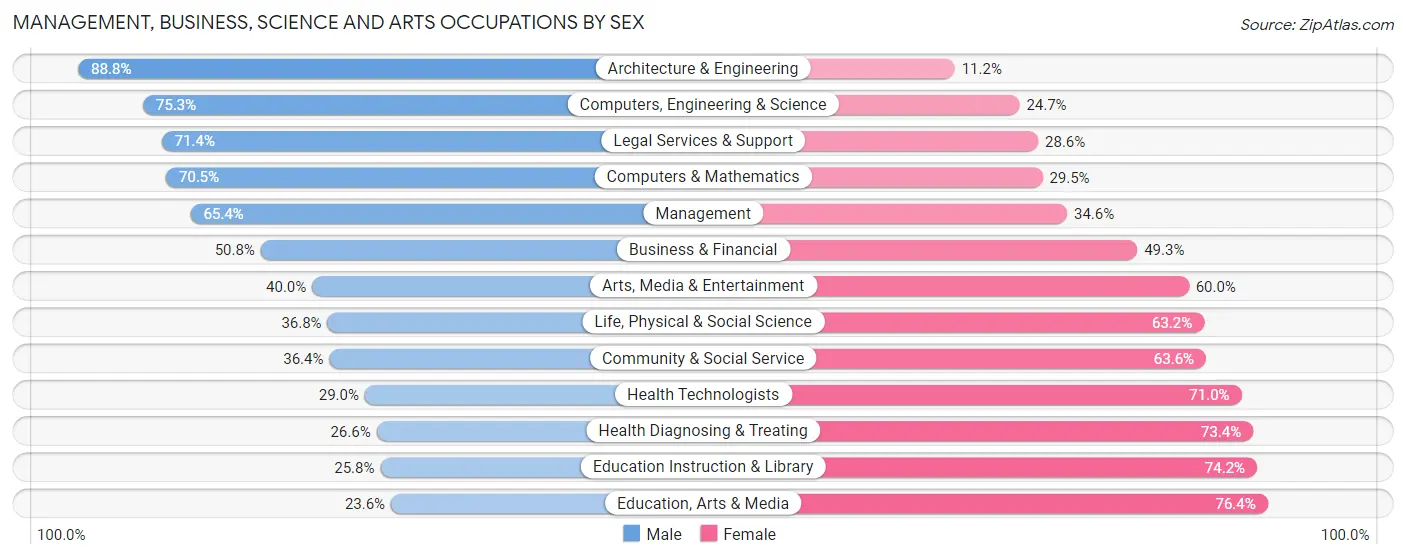
| Occupation | Male | Female |
| Management | 4,483 (65.4%) | 2,372 (34.6%) |
| Business & Financial | 1,901 (50.7%) | 1,845 (49.2%) |
| Computers, Engineering & Science | 2,653 (75.3%) | 869 (24.7%) |
| Computers & Mathematics | 1,240 (70.5%) | 518 (29.5%) |
| Architecture & Engineering | 1,304 (88.8%) | 164 (11.2%) |
| Life, Physical & Social Science | 109 (36.8%) | 187 (63.2%) |
| Community & Social Service | 2,294 (36.4%) | 4,002 (63.6%) |
| Education, Arts & Media | 187 (23.6%) | 606 (76.4%) |
| Legal Services & Support | 825 (71.4%) | 330 (28.6%) |
| Education Instruction & Library | 831 (25.8%) | 2,390 (74.2%) |
| Arts, Media & Entertainment | 451 (40.0%) | 676 (60.0%) |
| Health Diagnosing & Treating | 1,001 (26.6%) | 2,764 (73.4%) |
| Health Technologists | 862 (29.0%) | 2,107 (71.0%) |
| Total (Category) | 12,332 (51.0%) | 11,852 (49.0%) |
| Total (Overall) | 26,283 (53.9%) | 22,496 (46.1%) |
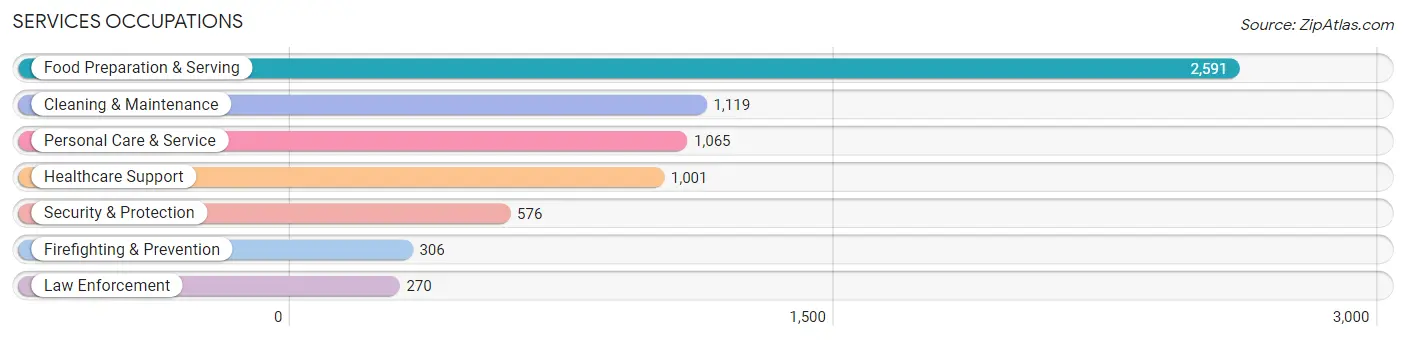
Services Occupations
The most common Services occupations in Ozaukee County are Food Preparation & Serving (2,591 | 5.3%), Cleaning & Maintenance (1,119 | 2.3%), Personal Care & Service (1,065 | 2.2%), Healthcare Support (1,001 | 2.1%), and Security & Protection (576 | 1.2%).
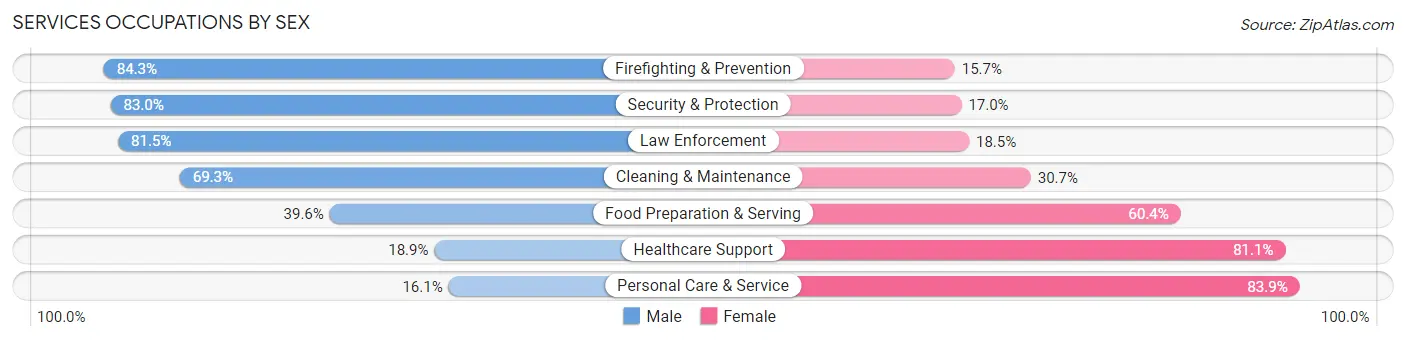
Services Occupations by Sex
Within the Services occupations in Ozaukee County, the most male-oriented occupations are Firefighting & Prevention (84.3%), Security & Protection (83.0%), and Law Enforcement (81.5%), while the most female-oriented occupations are Personal Care & Service (83.9%), Healthcare Support (81.1%), and Food Preparation & Serving (60.4%).
| Occupation | Male | Female |
| Healthcare Support | 189 (18.9%) | 812 (81.1%) |
| Security & Protection | 478 (83.0%) | 98 (17.0%) |
| Firefighting & Prevention | 258 (84.3%) | 48 (15.7%) |
| Law Enforcement | 220 (81.5%) | 50 (18.5%) |
| Food Preparation & Serving | 1,026 (39.6%) | 1,565 (60.4%) |
| Cleaning & Maintenance | 775 (69.3%) | 344 (30.7%) |
| Personal Care & Service | 171 (16.1%) | 894 (83.9%) |
| Total (Category) | 2,639 (41.5%) | 3,713 (58.5%) |
| Total (Overall) | 26,283 (53.9%) | 22,496 (46.1%) |
Sales and Office Occupations
The most common Sales and Office occupations in Ozaukee County are Sales & Related (4,803 | 9.9%), and Office & Administration (4,297 | 8.8%).

Sales and Office Occupations by Sex
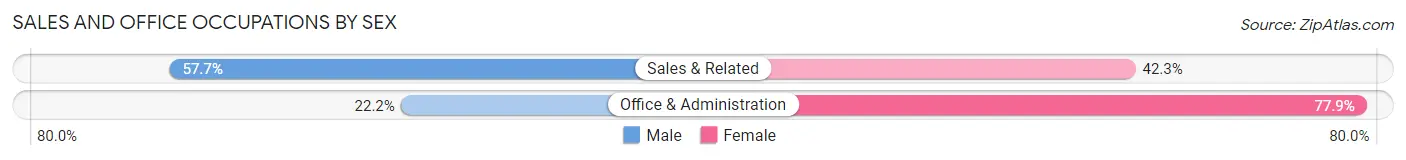
| Occupation | Male | Female |
| Sales & Related | 2,771 (57.7%) | 2,032 (42.3%) |
| Office & Administration | 952 (22.2%) | 3,345 (77.8%) |
| Total (Category) | 3,723 (40.9%) | 5,377 (59.1%) |
| Total (Overall) | 26,283 (53.9%) | 22,496 (46.1%) |
Natural Resources, Construction and Maintenance Occupations
The most common Natural Resources, Construction and Maintenance occupations in Ozaukee County are Construction & Extraction (1,678 | 3.4%), Installation, Maintenance & Repair (1,111 | 2.3%), and Farming, Fishing & Forestry (141 | 0.3%).
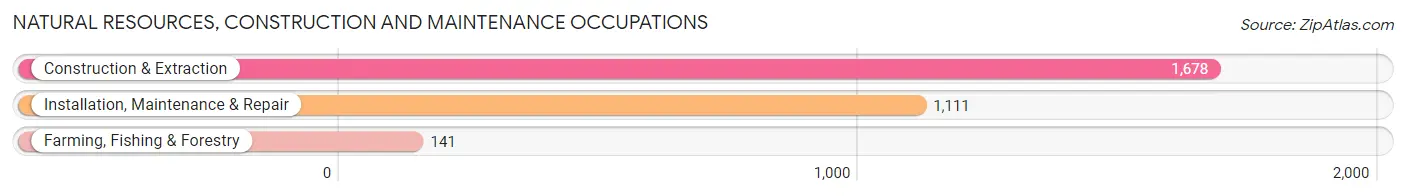
Natural Resources, Construction and Maintenance Occupations by Sex
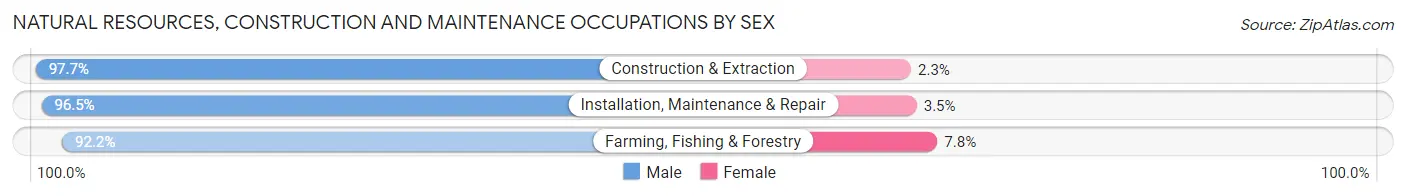
| Occupation | Male | Female |
| Farming, Fishing & Forestry | 130 (92.2%) | 11 (7.8%) |
| Construction & Extraction | 1,639 (97.7%) | 39 (2.3%) |
| Installation, Maintenance & Repair | 1,072 (96.5%) | 39 (3.5%) |
| Total (Category) | 2,841 (97.0%) | 89 (3.0%) |
| Total (Overall) | 26,283 (53.9%) | 22,496 (46.1%) |
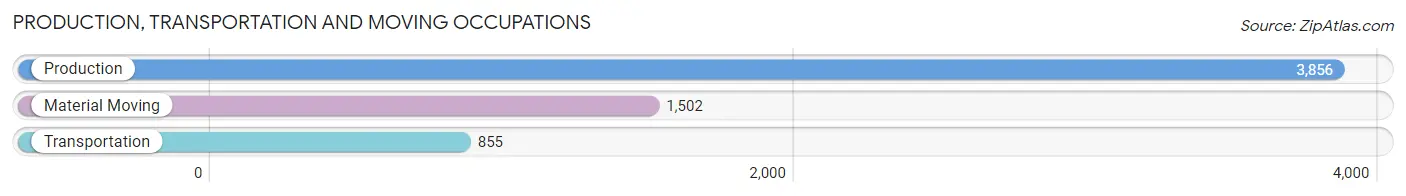
Production, Transportation and Moving Occupations
The most common Production, Transportation and Moving occupations in Ozaukee County are Production (3,856 | 7.9%), Material Moving (1,502 | 3.1%), and Transportation (855 | 1.8%).
Production, Transportation and Moving Occupations by Sex
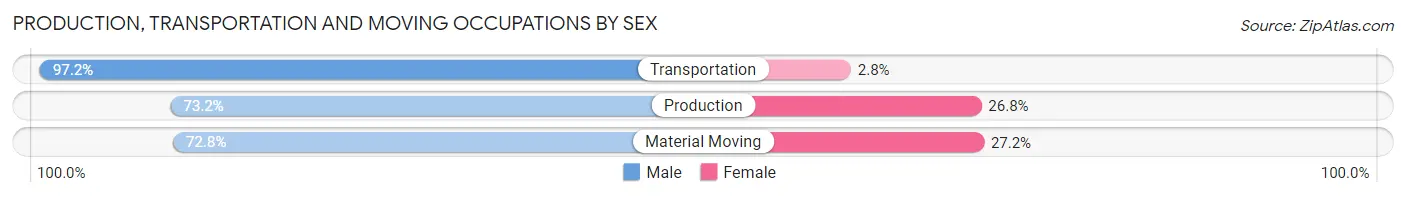
| Occupation | Male | Female |
| Production | 2,824 (73.2%) | 1,032 (26.8%) |
| Transportation | 831 (97.2%) | 24 (2.8%) |
| Material Moving | 1,093 (72.8%) | 409 (27.2%) |
| Total (Category) | 4,748 (76.4%) | 1,465 (23.6%) |
| Total (Overall) | 26,283 (53.9%) | 22,496 (46.1%) |
Employment Industries by Sex in Ozaukee County
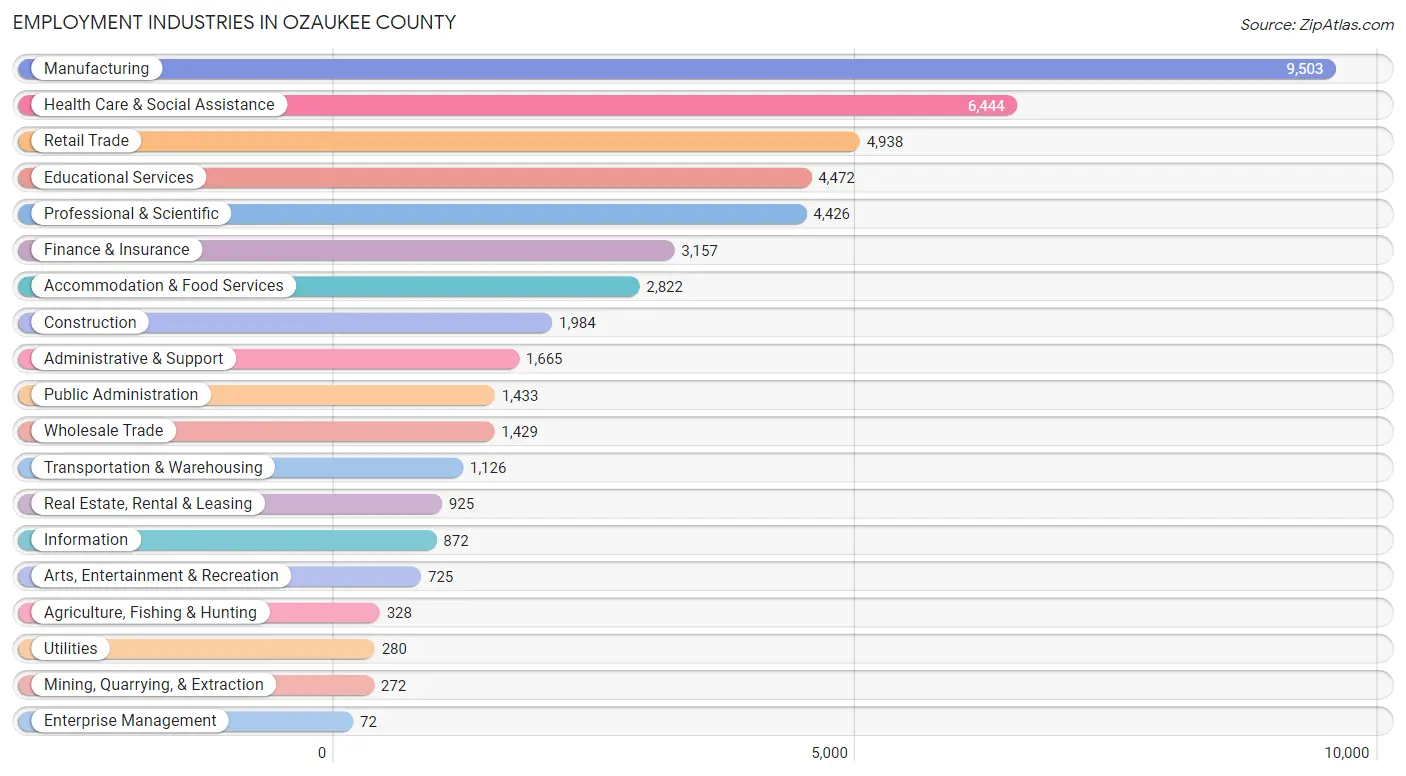
Employment Industries in Ozaukee County
The major employment industries in Ozaukee County include Manufacturing (9,503 | 19.5%), Health Care & Social Assistance (6,444 | 13.2%), Retail Trade (4,938 | 10.1%), Educational Services (4,472 | 9.2%), and Professional & Scientific (4,426 | 9.1%).
Employment Industries by Sex in Ozaukee County
The Ozaukee County industries that see more men than women are Mining, Quarrying, & Extraction (94.1%), Construction (89.0%), and Utilities (86.1%), whereas the industries that tend to have a higher number of women are Health Care & Social Assistance (76.0%), Educational Services (68.4%), and Accommodation & Food Services (57.8%).
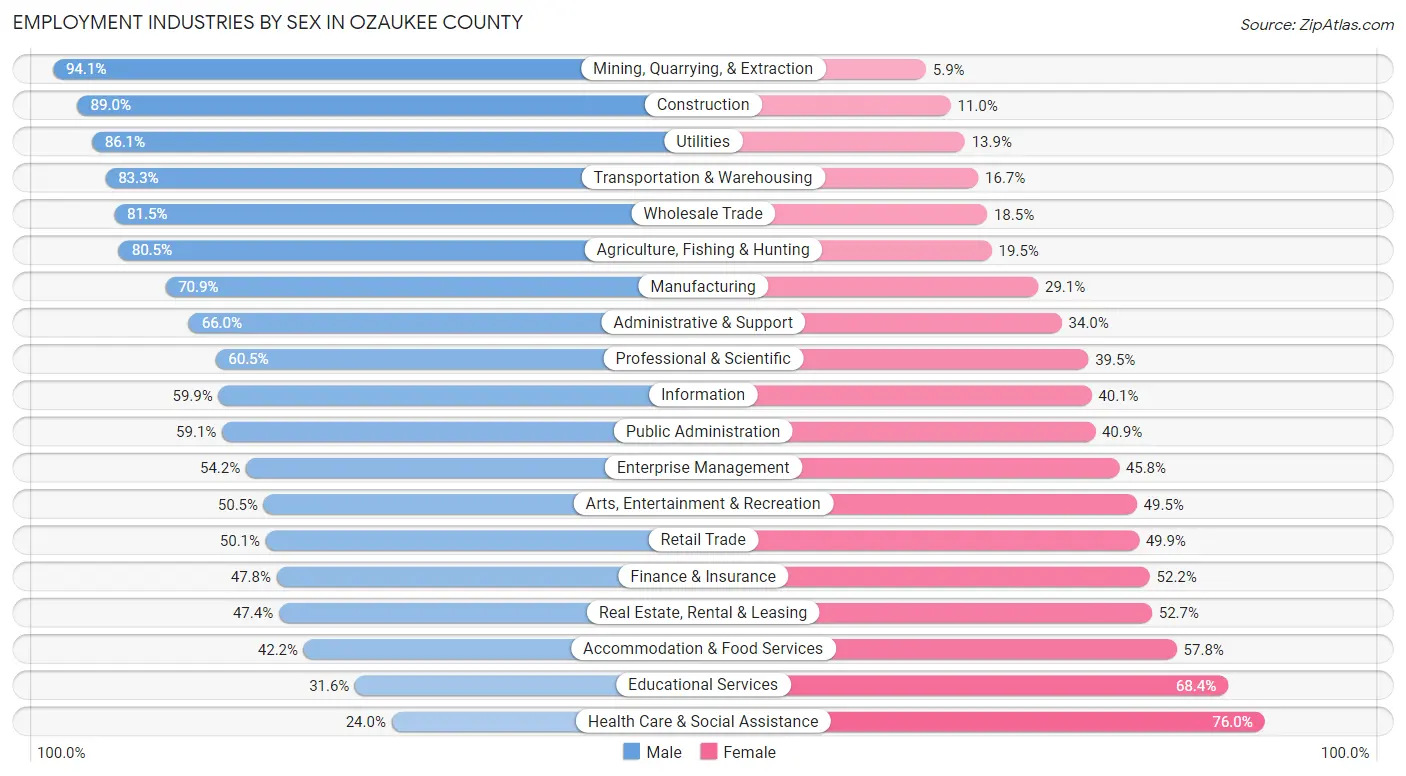
| Industry | Male | Female |
| Agriculture, Fishing & Hunting | 264 (80.5%) | 64 (19.5%) |
| Mining, Quarrying, & Extraction | 256 (94.1%) | 16 (5.9%) |
| Construction | 1,766 (89.0%) | 218 (11.0%) |
| Manufacturing | 6,737 (70.9%) | 2,766 (29.1%) |
| Wholesale Trade | 1,164 (81.5%) | 265 (18.5%) |
| Retail Trade | 2,472 (50.1%) | 2,466 (49.9%) |
| Transportation & Warehousing | 938 (83.3%) | 188 (16.7%) |
| Utilities | 241 (86.1%) | 39 (13.9%) |
| Information | 522 (59.9%) | 350 (40.1%) |
| Finance & Insurance | 1,509 (47.8%) | 1,648 (52.2%) |
| Real Estate, Rental & Leasing | 438 (47.3%) | 487 (52.6%) |
| Professional & Scientific | 2,678 (60.5%) | 1,748 (39.5%) |
| Enterprise Management | 39 (54.2%) | 33 (45.8%) |
| Administrative & Support | 1,099 (66.0%) | 566 (34.0%) |
| Educational Services | 1,412 (31.6%) | 3,060 (68.4%) |
| Health Care & Social Assistance | 1,547 (24.0%) | 4,897 (76.0%) |
| Arts, Entertainment & Recreation | 366 (50.5%) | 359 (49.5%) |
| Accommodation & Food Services | 1,191 (42.2%) | 1,631 (57.8%) |
| Public Administration | 847 (59.1%) | 586 (40.9%) |
| Total | 26,283 (53.9%) | 22,496 (46.1%) |
Education in Ozaukee County
School Enrollment in Ozaukee County
The most common levels of schooling among the 21,876 students in Ozaukee County are high school (5,119 | 23.4%), elementary school (4,583 | 20.9%), and college / undergraduate (4,331 | 19.8%).
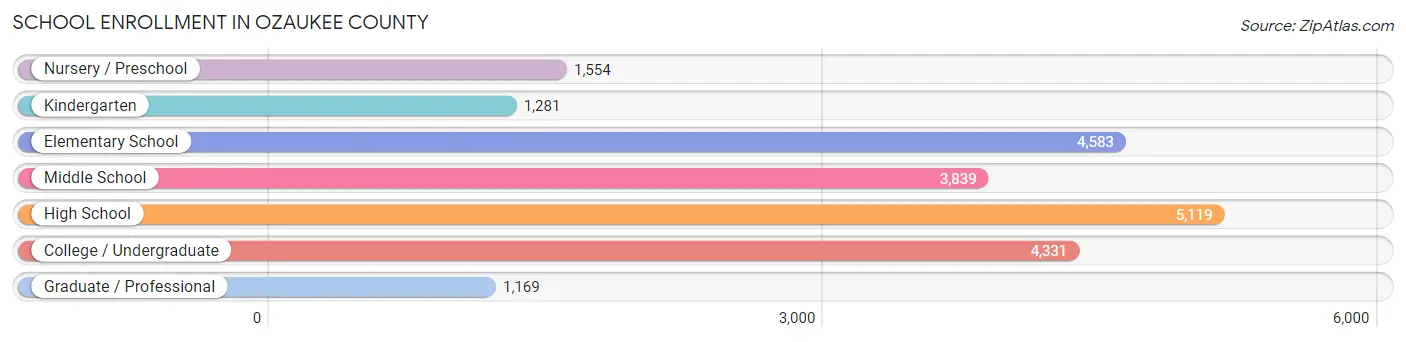
| School Level | # Students | % Students |
| Nursery / Preschool | 1,554 | 7.1% |
| Kindergarten | 1,281 | 5.9% |
| Elementary School | 4,583 | 20.9% |
| Middle School | 3,839 | 17.5% |
| High School | 5,119 | 23.4% |
| College / Undergraduate | 4,331 | 19.8% |
| Graduate / Professional | 1,169 | 5.3% |
| Total | 21,876 | 100.0% |
School Enrollment by Age by Funding Source in Ozaukee County
Out of a total of 21,876 students who are enrolled in schools in Ozaukee County, 6,672 (30.5%) attend a private institution, while the remaining 15,204 (69.5%) are enrolled in public schools. The age group of 20 to 24 year olds has the highest likelihood of being enrolled in private schools, with 1,339 (53.0% in the age bracket) enrolled. Conversely, the age group of 15 to 17 year olds has the lowest likelihood of being enrolled in a private school, with 3,156 (86.6% in the age bracket) attending a public institution.
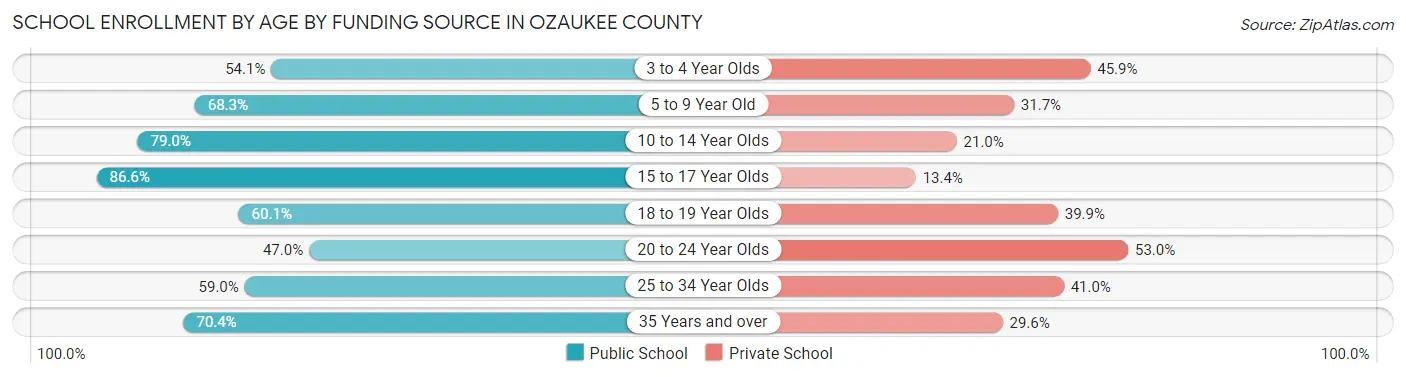
| Age Bracket | Public School | Private School |
| 3 to 4 Year Olds | 652 (54.1%) | 554 (45.9%) |
| 5 to 9 Year Old | 3,700 (68.3%) | 1,718 (31.7%) |
| 10 to 14 Year Olds | 4,071 (79.0%) | 1,085 (21.0%) |
| 15 to 17 Year Olds | 3,156 (86.6%) | 489 (13.4%) |
| 18 to 19 Year Olds | 1,268 (60.1%) | 841 (39.9%) |
| 20 to 24 Year Olds | 1,189 (47.0%) | 1,339 (53.0%) |
| 25 to 34 Year Olds | 566 (59.0%) | 393 (41.0%) |
| 35 Years and over | 602 (70.4%) | 253 (29.6%) |
| Total | 15,204 (69.5%) | 6,672 (30.5%) |
Educational Attainment by Field of Study in Ozaukee County
Business (8,407 | 23.8%), education (4,493 | 12.7%), science & technology (3,708 | 10.5%), social sciences (2,561 | 7.2%), and engineering (2,507 | 7.1%) are the most common fields of study among 35,384 individuals in Ozaukee County who have obtained a bachelor's degree or higher.
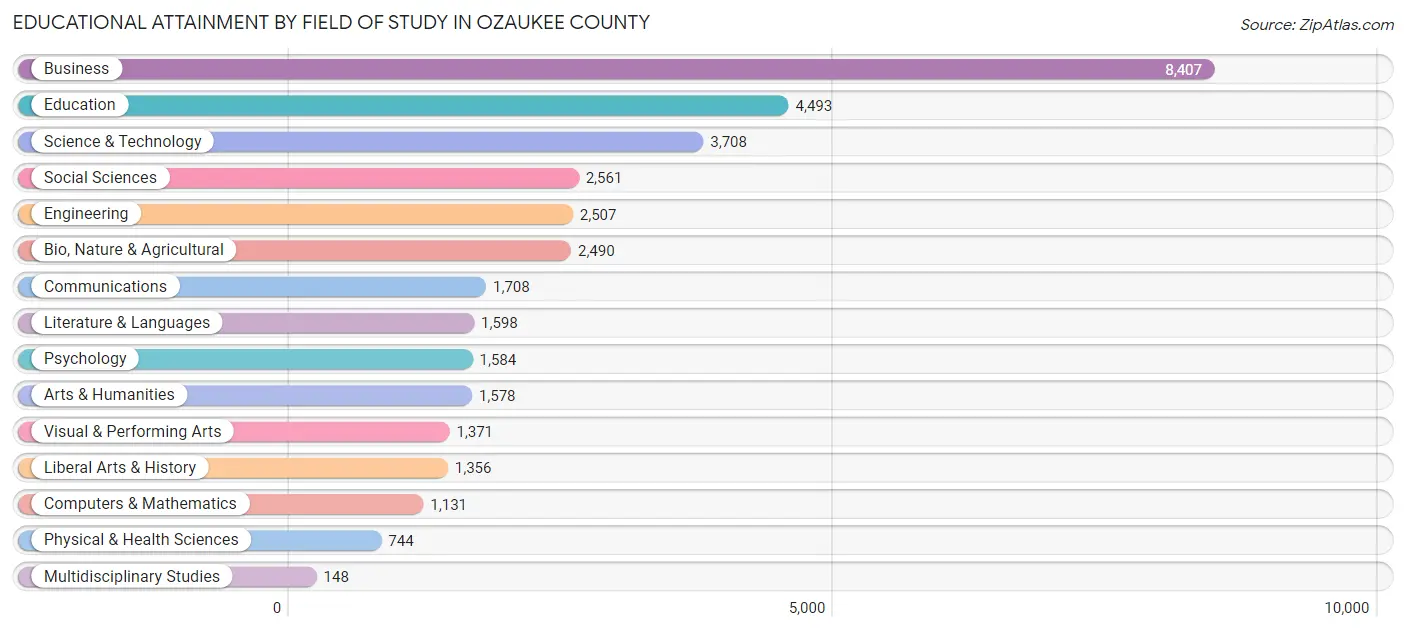
| Field of Study | # Graduates | % Graduates |
| Computers & Mathematics | 1,131 | 3.2% |
| Bio, Nature & Agricultural | 2,490 | 7.0% |
| Physical & Health Sciences | 744 | 2.1% |
| Psychology | 1,584 | 4.5% |
| Social Sciences | 2,561 | 7.2% |
| Engineering | 2,507 | 7.1% |
| Multidisciplinary Studies | 148 | 0.4% |
| Science & Technology | 3,708 | 10.5% |
| Business | 8,407 | 23.8% |
| Education | 4,493 | 12.7% |
| Literature & Languages | 1,598 | 4.5% |
| Liberal Arts & History | 1,356 | 3.8% |
| Visual & Performing Arts | 1,371 | 3.9% |
| Communications | 1,708 | 4.8% |
| Arts & Humanities | 1,578 | 4.5% |
| Total | 35,384 | 100.0% |
Transportation & Commute in Ozaukee County
Vehicle Availability by Sex in Ozaukee County
The most prevalent vehicle ownership categories in Ozaukee County are males with 2 vehicles (13,267, accounting for 51.3%) and females with 2 vehicles (9,949, making up 61.7%).
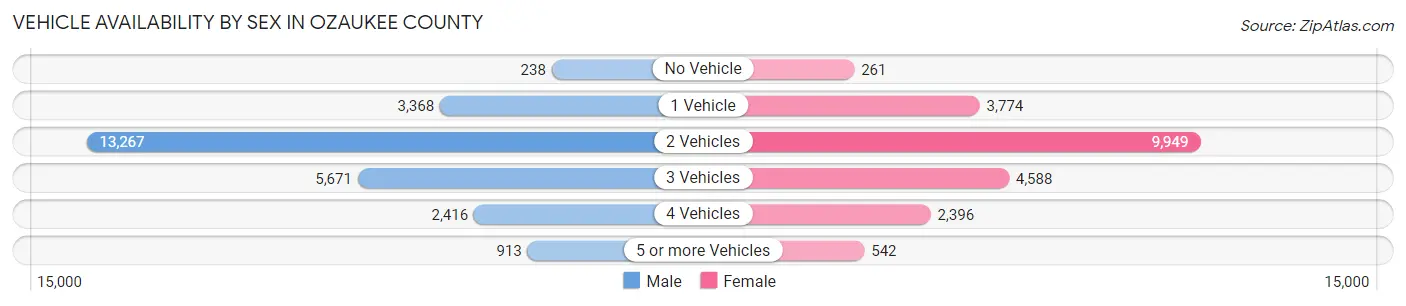
| Vehicles Available | Male | Female |
| No Vehicle | 238 (0.9%) | 261 (1.2%) |
| 1 Vehicle | 3,368 (13.0%) | 3,774 (17.5%) |
| 2 Vehicles | 13,267 (51.3%) | 9,949 (46.3%) |
| 3 Vehicles | 5,671 (21.9%) | 4,588 (21.3%) |
| 4 Vehicles | 2,416 (9.3%) | 2,396 (11.1%) |
| 5 or more Vehicles | 913 (3.5%) | 542 (2.5%) |
| Total | 25,873 (100.0%) | 21,510 (100.0%) |
Commute Time in Ozaukee County
The most frequently occuring commute durations in Ozaukee County are 30 to 34 minutes (6,224 commuters, 14.9%), 20 to 24 minutes (5,714 commuters, 13.7%), and 15 to 19 minutes (5,706 commuters, 13.7%).
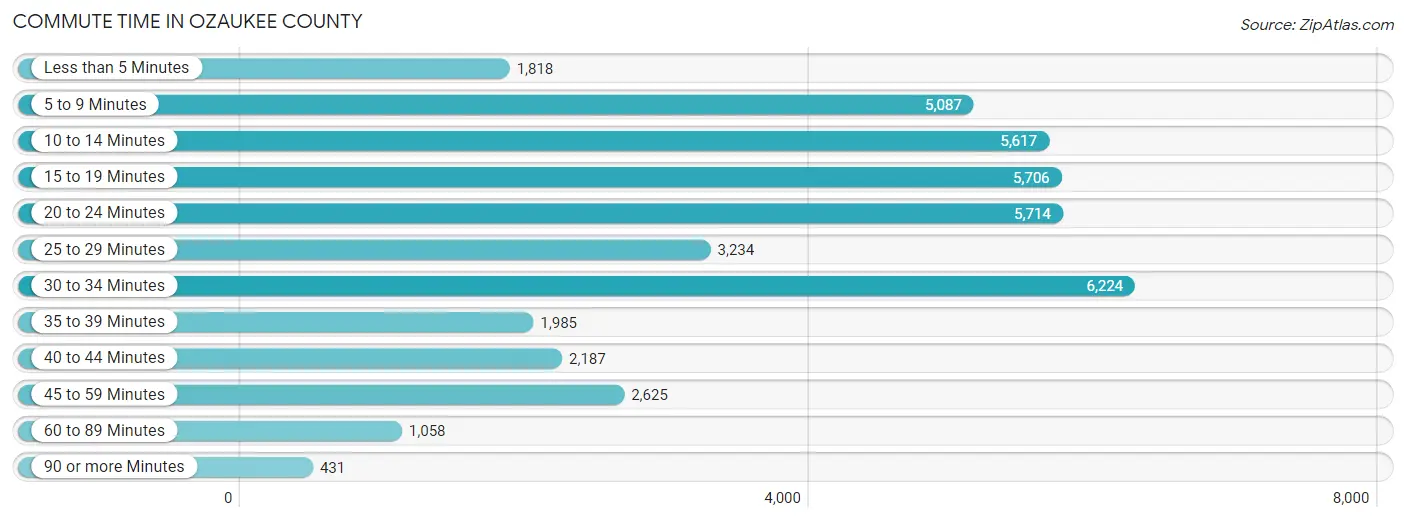
| Commute Time | # Commuters | % Commuters |
| Less than 5 Minutes | 1,818 | 4.4% |
| 5 to 9 Minutes | 5,087 | 12.2% |
| 10 to 14 Minutes | 5,617 | 13.5% |
| 15 to 19 Minutes | 5,706 | 13.7% |
| 20 to 24 Minutes | 5,714 | 13.7% |
| 25 to 29 Minutes | 3,234 | 7.8% |
| 30 to 34 Minutes | 6,224 | 14.9% |
| 35 to 39 Minutes | 1,985 | 4.8% |
| 40 to 44 Minutes | 2,187 | 5.2% |
| 45 to 59 Minutes | 2,625 | 6.3% |
| 60 to 89 Minutes | 1,058 | 2.5% |
| 90 or more Minutes | 431 | 1.0% |
Commute Time by Sex in Ozaukee County
The most common commute times in Ozaukee County are 30 to 34 minutes (3,813 commuters, 16.7%) for males and 10 to 14 minutes (2,899 commuters, 15.4%) for females.
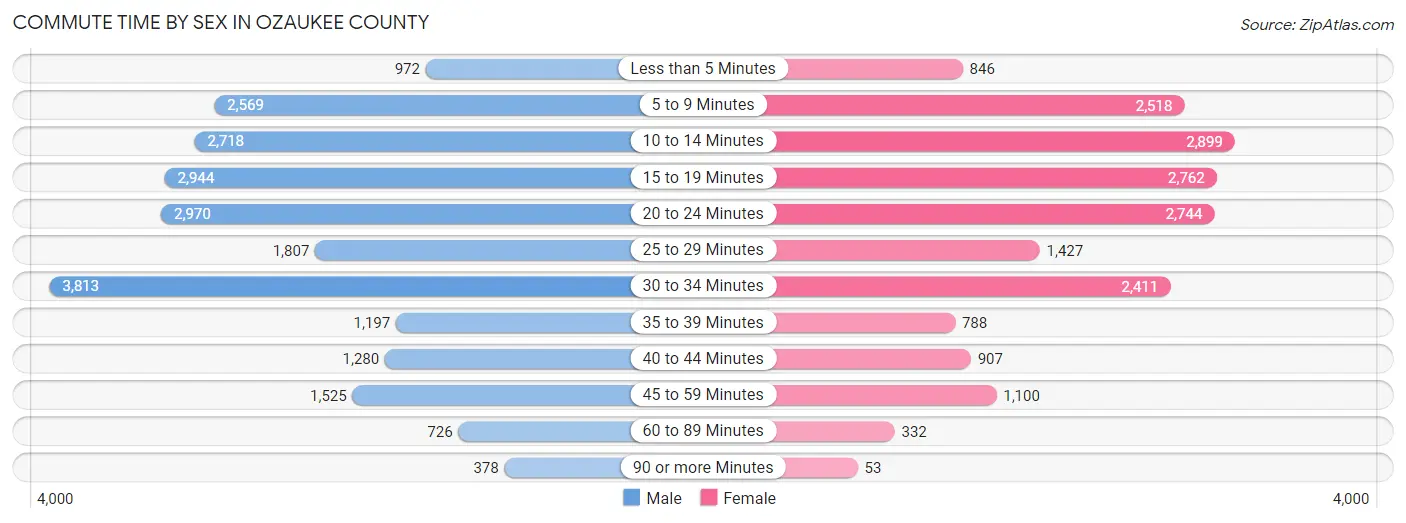
| Commute Time | Male | Female |
| Less than 5 Minutes | 972 (4.2%) | 846 (4.5%) |
| 5 to 9 Minutes | 2,569 (11.2%) | 2,518 (13.4%) |
| 10 to 14 Minutes | 2,718 (11.9%) | 2,899 (15.4%) |
| 15 to 19 Minutes | 2,944 (12.9%) | 2,762 (14.7%) |
| 20 to 24 Minutes | 2,970 (13.0%) | 2,744 (14.6%) |
| 25 to 29 Minutes | 1,807 (7.9%) | 1,427 (7.6%) |
| 30 to 34 Minutes | 3,813 (16.7%) | 2,411 (12.8%) |
| 35 to 39 Minutes | 1,197 (5.2%) | 788 (4.2%) |
| 40 to 44 Minutes | 1,280 (5.6%) | 907 (4.8%) |
| 45 to 59 Minutes | 1,525 (6.7%) | 1,100 (5.9%) |
| 60 to 89 Minutes | 726 (3.2%) | 332 (1.8%) |
| 90 or more Minutes | 378 (1.7%) | 53 (0.3%) |
Time of Departure to Work by Sex in Ozaukee County
The most frequent times of departure to work in Ozaukee County are 7:00 AM to 7:29 AM (3,651, 15.9%) for males and 7:00 AM to 7:29 AM (3,021, 16.1%) for females.
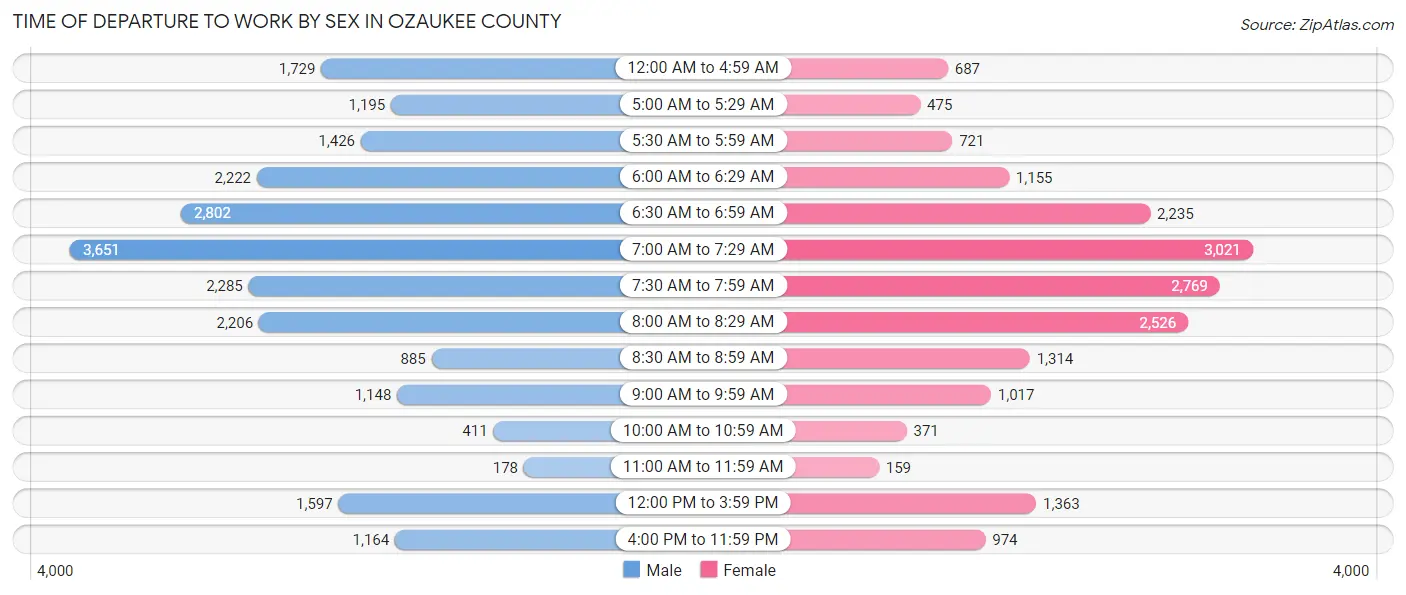
| Time of Departure | Male | Female |
| 12:00 AM to 4:59 AM | 1,729 (7.5%) | 687 (3.7%) |
| 5:00 AM to 5:29 AM | 1,195 (5.2%) | 475 (2.5%) |
| 5:30 AM to 5:59 AM | 1,426 (6.2%) | 721 (3.8%) |
| 6:00 AM to 6:29 AM | 2,222 (9.7%) | 1,155 (6.1%) |
| 6:30 AM to 6:59 AM | 2,802 (12.2%) | 2,235 (11.9%) |
| 7:00 AM to 7:29 AM | 3,651 (15.9%) | 3,021 (16.1%) |
| 7:30 AM to 7:59 AM | 2,285 (10.0%) | 2,769 (14.7%) |
| 8:00 AM to 8:29 AM | 2,206 (9.6%) | 2,526 (13.5%) |
| 8:30 AM to 8:59 AM | 885 (3.9%) | 1,314 (7.0%) |
| 9:00 AM to 9:59 AM | 1,148 (5.0%) | 1,017 (5.4%) |
| 10:00 AM to 10:59 AM | 411 (1.8%) | 371 (2.0%) |
| 11:00 AM to 11:59 AM | 178 (0.8%) | 159 (0.9%) |
| 12:00 PM to 3:59 PM | 1,597 (7.0%) | 1,363 (7.3%) |
| 4:00 PM to 11:59 PM | 1,164 (5.1%) | 974 (5.2%) |
| Total | 22,899 (100.0%) | 18,787 (100.0%) |
Housing Occupancy in Ozaukee County
Occupancy by Ownership in Ozaukee County
Of the total 37,478 dwellings in Ozaukee County, owner-occupied units account for 27,515 (73.4%), while renter-occupied units make up 9,963 (26.6%).

| Occupancy | # Housing Units | % Housing Units |
| Owner Occupied Housing Units | 27,515 | 73.4% |
| Renter-Occupied Housing Units | 9,963 | 26.6% |
| Total Occupied Housing Units | 37,478 | 100.0% |
Occupancy by Household Size in Ozaukee County
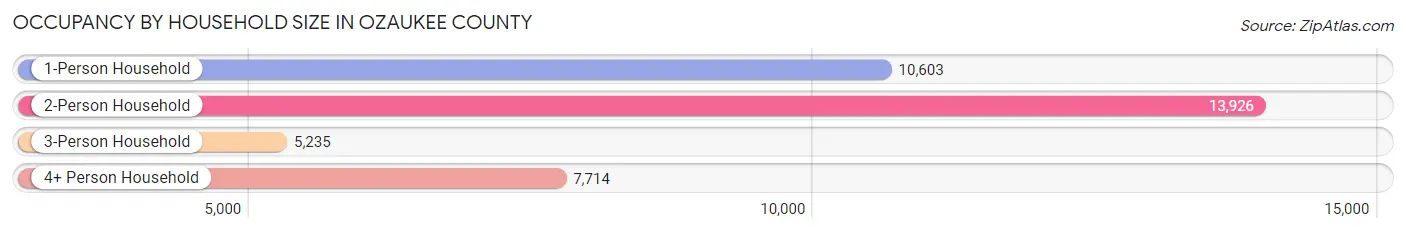
| Household Size | # Housing Units | % Housing Units |
| 1-Person Household | 10,603 | 28.3% |
| 2-Person Household | 13,926 | 37.2% |
| 3-Person Household | 5,235 | 14.0% |
| 4+ Person Household | 7,714 | 20.6% |
| Total Housing Units | 37,478 | 100.0% |
Occupancy by Ownership by Household Size in Ozaukee County
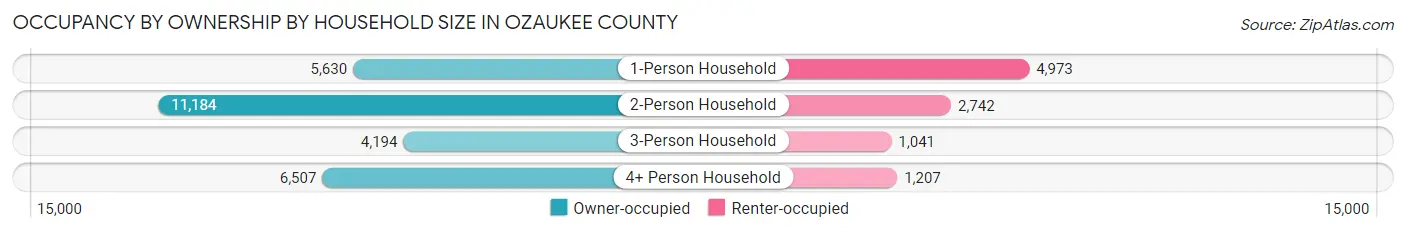
| Household Size | Owner-occupied | Renter-occupied |
| 1-Person Household | 5,630 (53.1%) | 4,973 (46.9%) |
| 2-Person Household | 11,184 (80.3%) | 2,742 (19.7%) |
| 3-Person Household | 4,194 (80.1%) | 1,041 (19.9%) |
| 4+ Person Household | 6,507 (84.4%) | 1,207 (15.7%) |
| Total Housing Units | 27,515 (73.4%) | 9,963 (26.6%) |
Occupancy by Educational Attainment in Ozaukee County
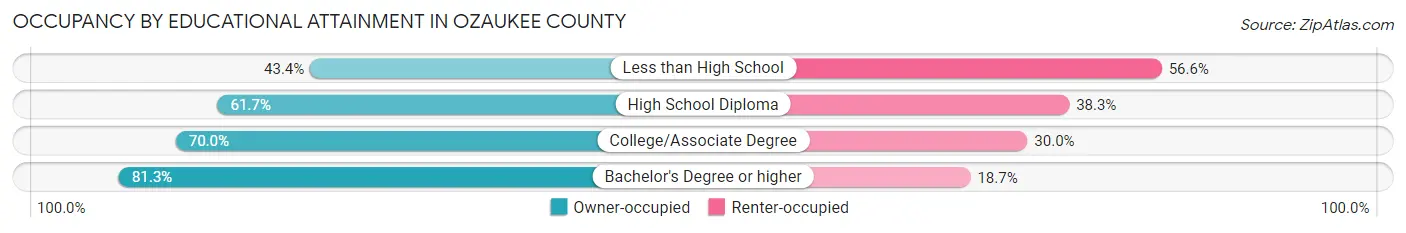
| Household Size | Owner-occupied | Renter-occupied |
| Less than High School | 302 (43.4%) | 394 (56.6%) |
| High School Diploma | 4,840 (61.7%) | 3,000 (38.3%) |
| College/Associate Degree | 7,185 (70.0%) | 3,076 (30.0%) |
| Bachelor's Degree or higher | 15,188 (81.3%) | 3,493 (18.7%) |
Occupancy by Age of Householder in Ozaukee County
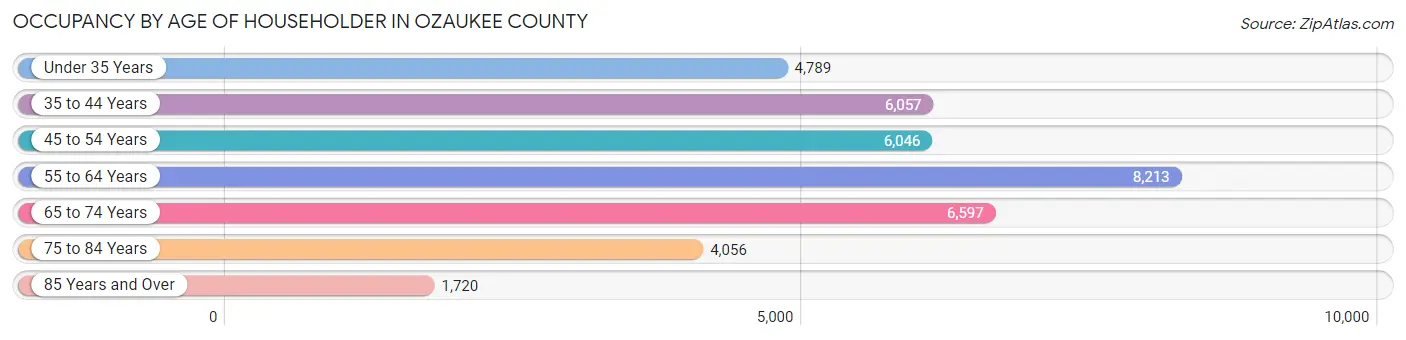
| Age Bracket | # Households | % Households |
| Under 35 Years | 4,789 | 12.8% |
| 35 to 44 Years | 6,057 | 16.2% |
| 45 to 54 Years | 6,046 | 16.1% |
| 55 to 64 Years | 8,213 | 21.9% |
| 65 to 74 Years | 6,597 | 17.6% |
| 75 to 84 Years | 4,056 | 10.8% |
| 85 Years and Over | 1,720 | 4.6% |
| Total | 37,478 | 100.0% |
Housing Finances in Ozaukee County
Median Income by Occupancy in Ozaukee County
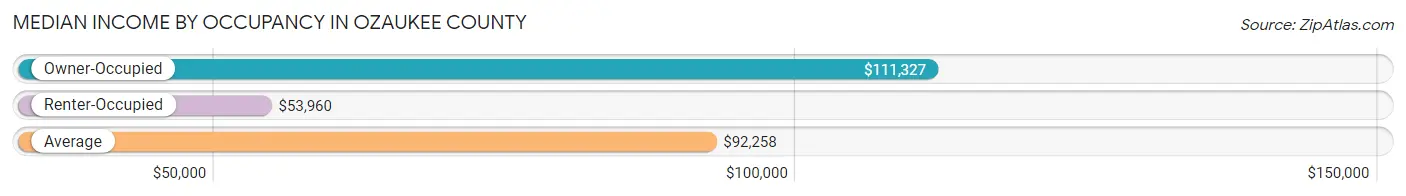
| Occupancy Type | # Households | Median Income |
| Owner-Occupied | 27,515 (73.4%) | $111,327 |
| Renter-Occupied | 9,963 (26.6%) | $53,960 |
| Average | 37,478 (100.0%) | $92,258 |
Occupancy by Householder Income Bracket in Ozaukee County
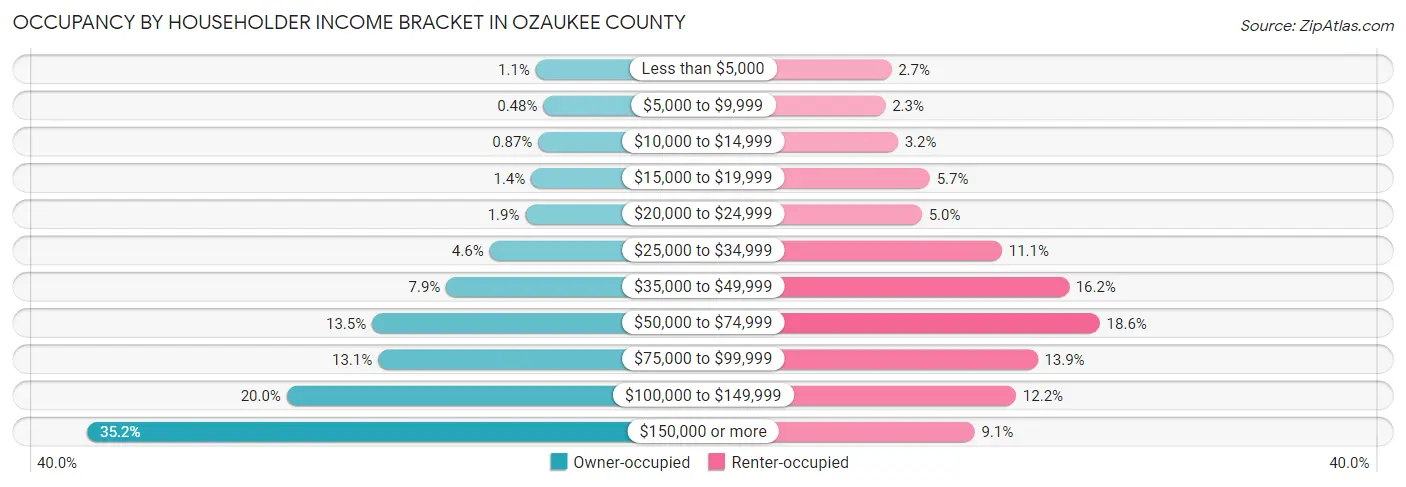
| Income Bracket | Owner-occupied | Renter-occupied |
| Less than $5,000 | 293 (1.1%) | 271 (2.7%) |
| $5,000 to $9,999 | 131 (0.5%) | 225 (2.3%) |
| $10,000 to $14,999 | 240 (0.9%) | 320 (3.2%) |
| $15,000 to $19,999 | 387 (1.4%) | 563 (5.7%) |
| $20,000 to $24,999 | 508 (1.8%) | 502 (5.0%) |
| $25,000 to $34,999 | 1,261 (4.6%) | 1,110 (11.1%) |
| $35,000 to $49,999 | 2,169 (7.9%) | 1,618 (16.2%) |
| $50,000 to $74,999 | 3,722 (13.5%) | 1,853 (18.6%) |
| $75,000 to $99,999 | 3,596 (13.1%) | 1,381 (13.9%) |
| $100,000 to $149,999 | 5,511 (20.0%) | 1,217 (12.2%) |
| $150,000 or more | 9,697 (35.2%) | 903 (9.1%) |
| Total | 27,515 (100.0%) | 9,963 (100.0%) |
Monthly Housing Cost Tiers in Ozaukee County
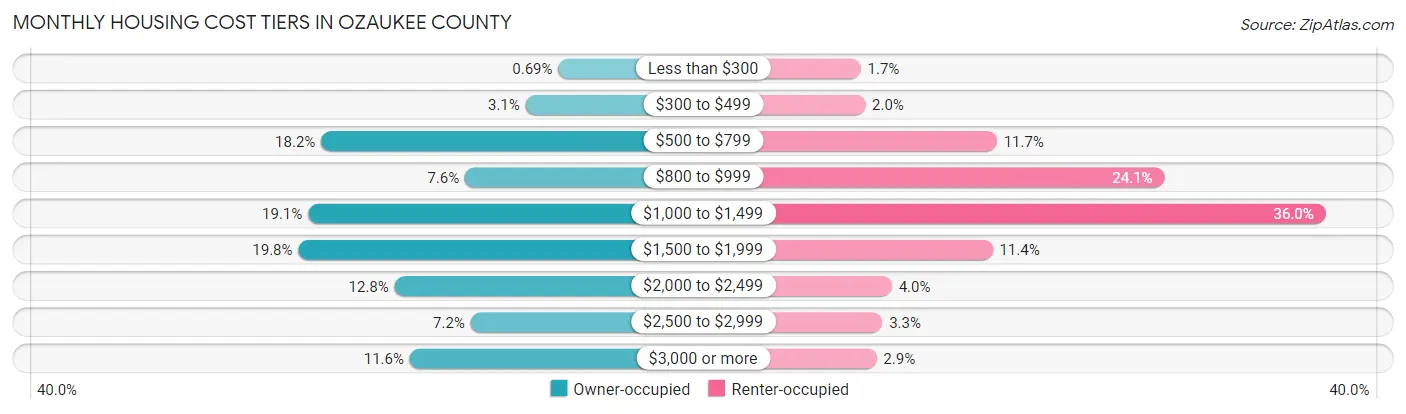
| Monthly Cost | Owner-occupied | Renter-occupied |
| Less than $300 | 191 (0.7%) | 170 (1.7%) |
| $300 to $499 | 852 (3.1%) | 203 (2.0%) |
| $500 to $799 | 4,998 (18.2%) | 1,169 (11.7%) |
| $800 to $999 | 2,079 (7.6%) | 2,399 (24.1%) |
| $1,000 to $1,499 | 5,261 (19.1%) | 3,582 (35.9%) |
| $1,500 to $1,999 | 5,459 (19.8%) | 1,138 (11.4%) |
| $2,000 to $2,499 | 3,508 (12.8%) | 399 (4.0%) |
| $2,500 to $2,999 | 1,967 (7.1%) | 329 (3.3%) |
| $3,000 or more | 3,200 (11.6%) | 286 (2.9%) |
| Total | 27,515 (100.0%) | 9,963 (100.0%) |
Physical Housing Characteristics in Ozaukee County
Housing Structures in Ozaukee County
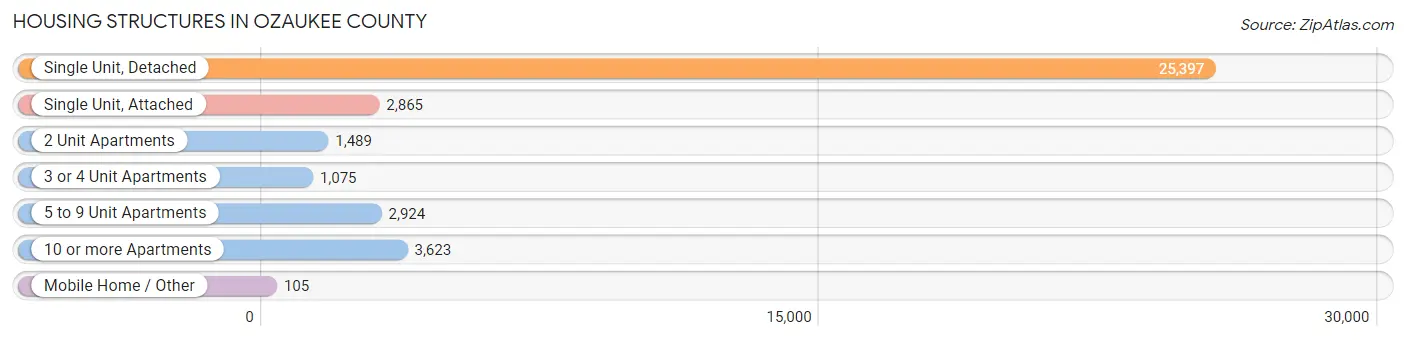
| Structure Type | # Housing Units | % Housing Units |
| Single Unit, Detached | 25,397 | 67.8% |
| Single Unit, Attached | 2,865 | 7.6% |
| 2 Unit Apartments | 1,489 | 4.0% |
| 3 or 4 Unit Apartments | 1,075 | 2.9% |
| 5 to 9 Unit Apartments | 2,924 | 7.8% |
| 10 or more Apartments | 3,623 | 9.7% |
| Mobile Home / Other | 105 | 0.3% |
| Total | 37,478 | 100.0% |
Housing Structures by Occupancy in Ozaukee County
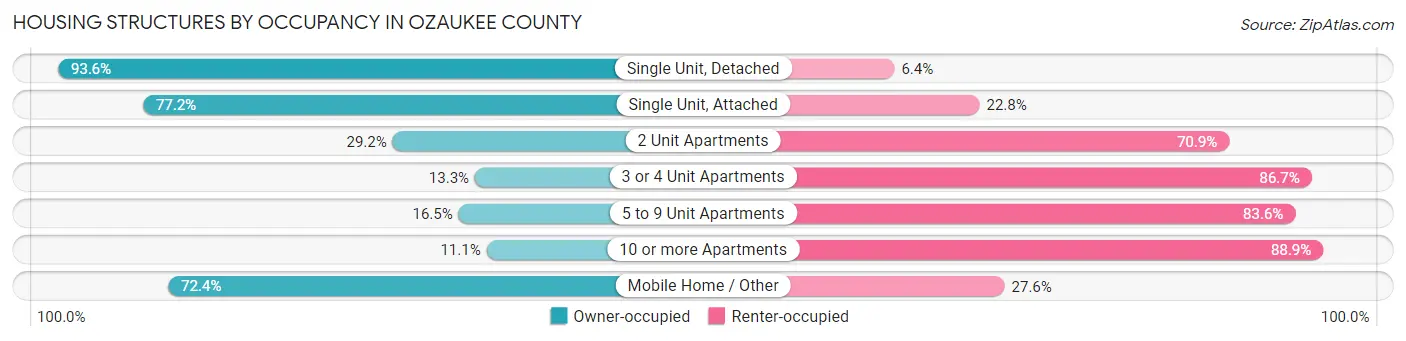
| Structure Type | Owner-occupied | Renter-occupied |
| Single Unit, Detached | 23,768 (93.6%) | 1,629 (6.4%) |
| Single Unit, Attached | 2,212 (77.2%) | 653 (22.8%) |
| 2 Unit Apartments | 434 (29.1%) | 1,055 (70.9%) |
| 3 or 4 Unit Apartments | 143 (13.3%) | 932 (86.7%) |
| 5 to 9 Unit Apartments | 481 (16.5%) | 2,443 (83.6%) |
| 10 or more Apartments | 401 (11.1%) | 3,222 (88.9%) |
| Mobile Home / Other | 76 (72.4%) | 29 (27.6%) |
| Total | 27,515 (73.4%) | 9,963 (26.6%) |
Housing Structures by Number of Rooms in Ozaukee County
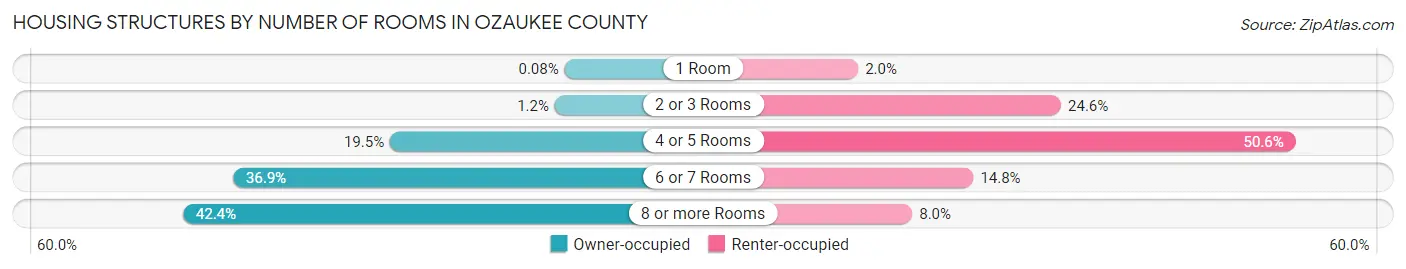
| Number of Rooms | Owner-occupied | Renter-occupied |
| 1 Room | 22 (0.1%) | 202 (2.0%) |
| 2 or 3 Rooms | 318 (1.2%) | 2,446 (24.5%) |
| 4 or 5 Rooms | 5,353 (19.5%) | 5,038 (50.6%) |
| 6 or 7 Rooms | 10,147 (36.9%) | 1,477 (14.8%) |
| 8 or more Rooms | 11,675 (42.4%) | 800 (8.0%) |
| Total | 27,515 (100.0%) | 9,963 (100.0%) |
Housing Structure by Heating Type in Ozaukee County
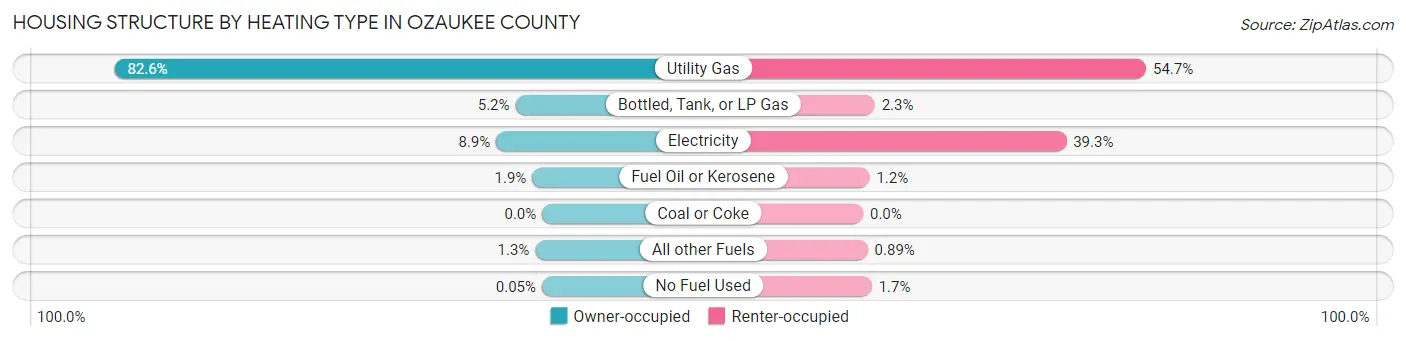
| Heating Type | Owner-occupied | Renter-occupied |
| Utility Gas | 22,737 (82.6%) | 5,448 (54.7%) |
| Bottled, Tank, or LP Gas | 1,423 (5.2%) | 225 (2.3%) |
| Electricity | 2,445 (8.9%) | 3,911 (39.3%) |
| Fuel Oil or Kerosene | 529 (1.9%) | 124 (1.2%) |
| Coal or Coke | 0 (0.0%) | 0 (0.0%) |
| All other Fuels | 367 (1.3%) | 89 (0.9%) |
| No Fuel Used | 14 (0.1%) | 166 (1.7%) |
| Total | 27,515 (100.0%) | 9,963 (100.0%) |
Household Vehicle Usage in Ozaukee County
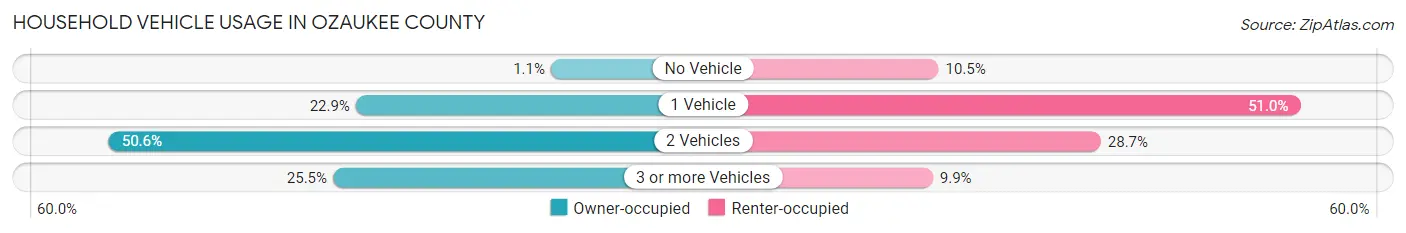
| Vehicles per Household | Owner-occupied | Renter-occupied |
| No Vehicle | 292 (1.1%) | 1,045 (10.5%) |
| 1 Vehicle | 6,303 (22.9%) | 5,081 (51.0%) |
| 2 Vehicles | 13,912 (50.6%) | 2,856 (28.7%) |
| 3 or more Vehicles | 7,008 (25.5%) | 981 (9.9%) |
| Total | 27,515 (100.0%) | 9,963 (100.0%) |
Real Estate & Mortgages in Ozaukee County
Real Estate and Mortgage Overview in Ozaukee County
| Characteristic | Without Mortgage | With Mortgage |
| Housing Units | 9,671 | 17,844 |
| Median Property Value | $319,700 | $357,700 |
| Median Household Income | $80,908 | $7,276 |
| Monthly Housing Costs | $739 | $3,186 |
| Real Estate Taxes | $4,379 | $53 |
Property Value by Mortgage Status in Ozaukee County
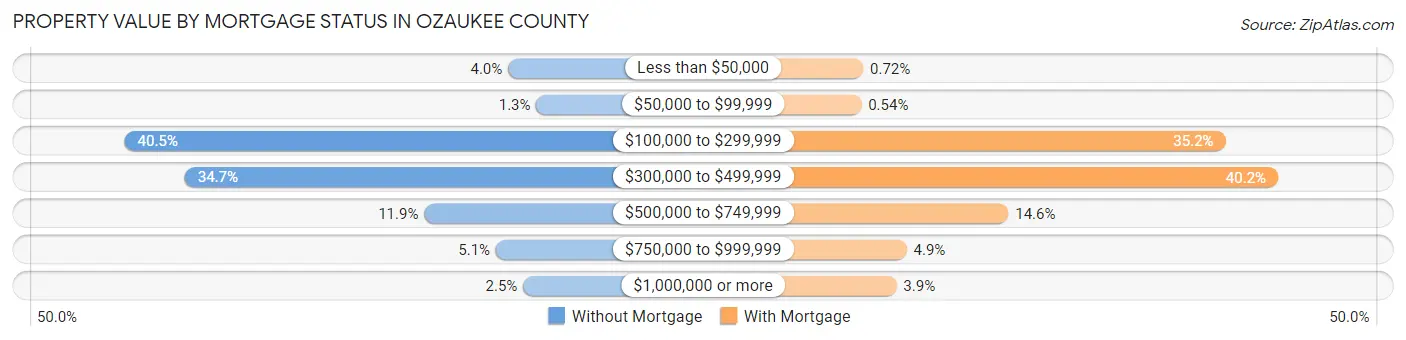
| Property Value | Without Mortgage | With Mortgage |
| Less than $50,000 | 382 (4.0%) | 128 (0.7%) |
| $50,000 to $99,999 | 122 (1.3%) | 97 (0.5%) |
| $100,000 to $299,999 | 3,914 (40.5%) | 6,284 (35.2%) |
| $300,000 to $499,999 | 3,360 (34.7%) | 7,176 (40.2%) |
| $500,000 to $749,999 | 1,155 (11.9%) | 2,596 (14.5%) |
| $750,000 to $999,999 | 494 (5.1%) | 868 (4.9%) |
| $1,000,000 or more | 244 (2.5%) | 695 (3.9%) |
| Total | 9,671 (100.0%) | 17,844 (100.0%) |
Household Income by Mortgage Status in Ozaukee County
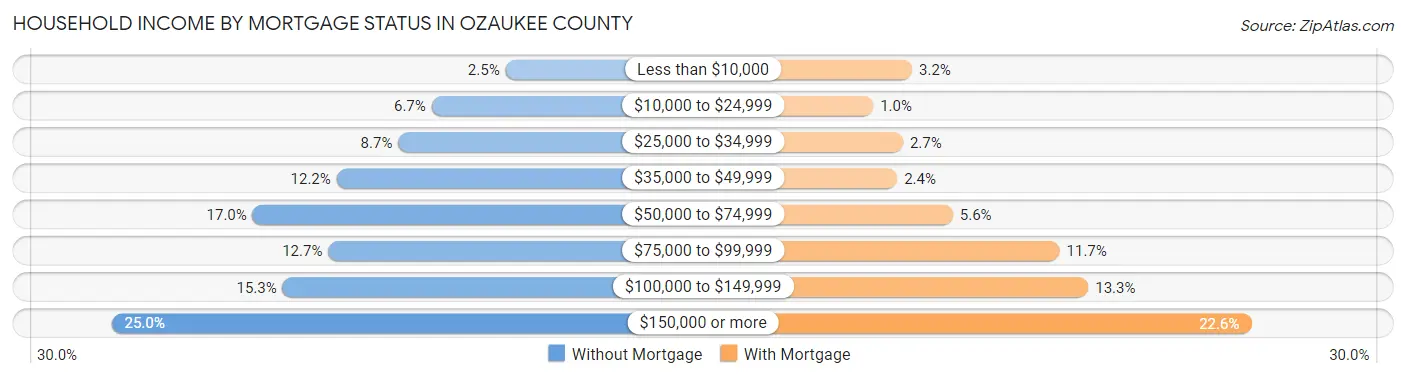
| Household Income | Without Mortgage | With Mortgage |
| Less than $10,000 | 244 (2.5%) | 576 (3.2%) |
| $10,000 to $24,999 | 652 (6.7%) | 180 (1.0%) |
| $25,000 to $34,999 | 837 (8.6%) | 483 (2.7%) |
| $35,000 to $49,999 | 1,177 (12.2%) | 424 (2.4%) |
| $50,000 to $74,999 | 1,641 (17.0%) | 992 (5.6%) |
| $75,000 to $99,999 | 1,223 (12.7%) | 2,081 (11.7%) |
| $100,000 to $149,999 | 1,476 (15.3%) | 2,373 (13.3%) |
| $150,000 or more | 2,421 (25.0%) | 4,035 (22.6%) |
| Total | 9,671 (100.0%) | 17,844 (100.0%) |
Property Value to Household Income Ratio in Ozaukee County
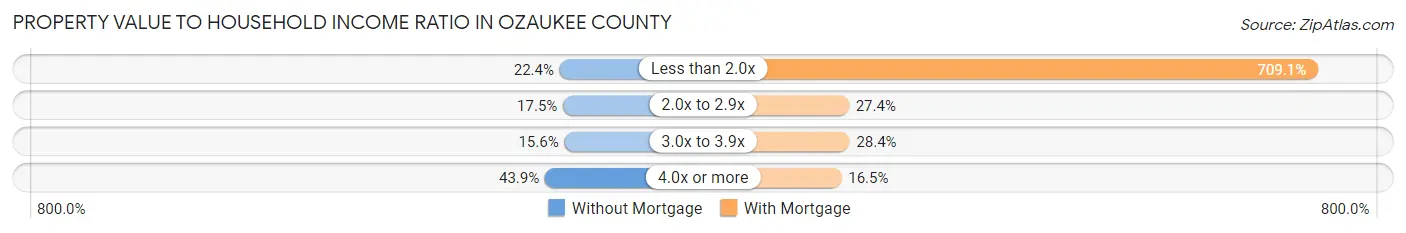
| Value-to-Income Ratio | Without Mortgage | With Mortgage |
| Less than 2.0x | 2,165 (22.4%) | 126,533 (709.1%) |
| 2.0x to 2.9x | 1,693 (17.5%) | 4,881 (27.4%) |
| 3.0x to 3.9x | 1,510 (15.6%) | 5,065 (28.4%) |
| 4.0x or more | 4,245 (43.9%) | 2,944 (16.5%) |
| Total | 9,671 (100.0%) | 17,844 (100.0%) |
Real Estate Taxes by Mortgage Status in Ozaukee County
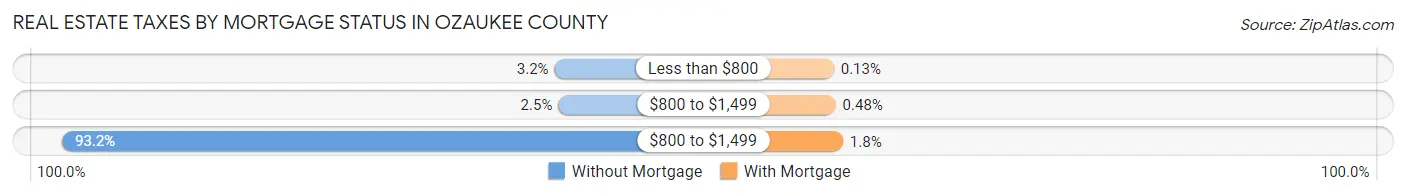
| Property Taxes | Without Mortgage | With Mortgage |
| Less than $800 | 312 (3.2%) | 24 (0.1%) |
| $800 to $1,499 | 245 (2.5%) | 85 (0.5%) |
| $800 to $1,499 | 9,010 (93.2%) | 322 (1.8%) |
| Total | 9,671 (100.0%) | 17,844 (100.0%) |
Health & Disability in Ozaukee County
Health Insurance Coverage by Age in Ozaukee County
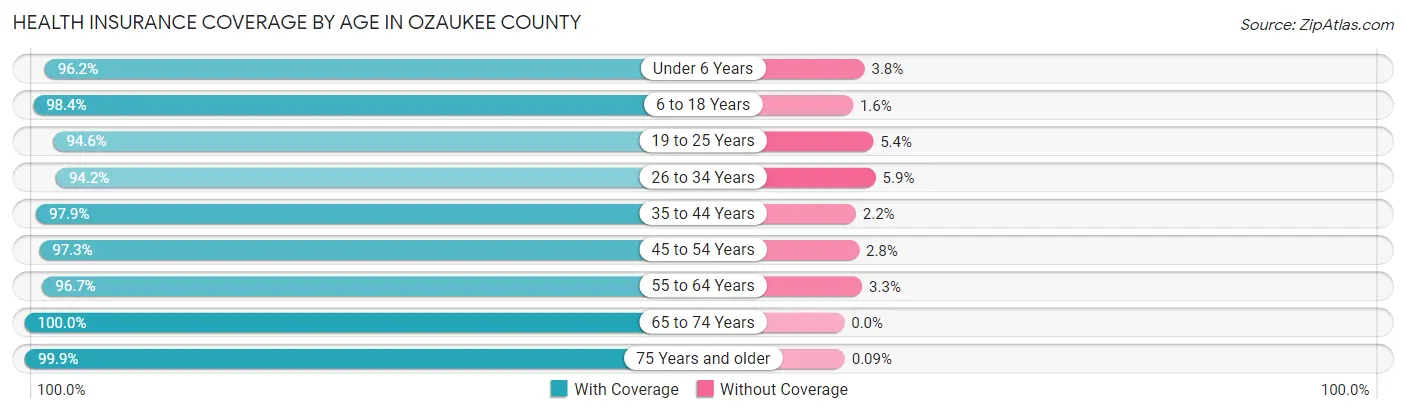
| Age Bracket | With Coverage | Without Coverage |
| Under 6 Years | 5,529 (96.2%) | 217 (3.8%) |
| 6 to 18 Years | 14,796 (98.4%) | 244 (1.6%) |
| 19 to 25 Years | 6,998 (94.6%) | 399 (5.4%) |
| 26 to 34 Years | 7,421 (94.2%) | 461 (5.9%) |
| 35 to 44 Years | 10,756 (97.9%) | 236 (2.1%) |
| 45 to 54 Years | 11,372 (97.3%) | 321 (2.8%) |
| 55 to 64 Years | 13,449 (96.7%) | 463 (3.3%) |
| 65 to 74 Years | 10,712 (100.0%) | 0 (0.0%) |
| 75 Years and older | 7,881 (99.9%) | 7 (0.1%) |
| Total | 88,914 (97.4%) | 2,348 (2.6%) |
Health Insurance Coverage by Citizenship Status in Ozaukee County
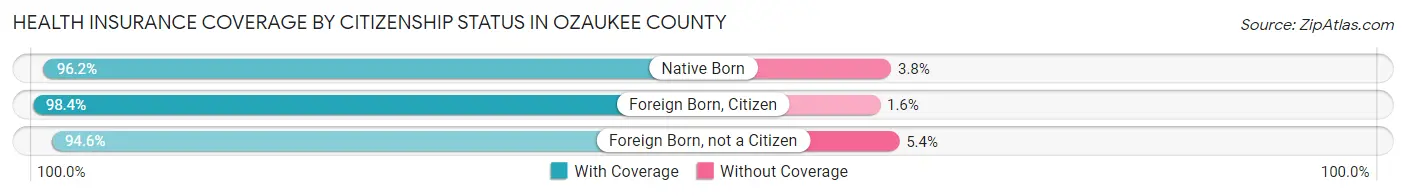
| Citizenship Status | With Coverage | Without Coverage |
| Native Born | 5,529 (96.2%) | 217 (3.8%) |
| Foreign Born, Citizen | 14,796 (98.4%) | 244 (1.6%) |
| Foreign Born, not a Citizen | 6,998 (94.6%) | 399 (5.4%) |
Health Insurance Coverage by Household Income in Ozaukee County
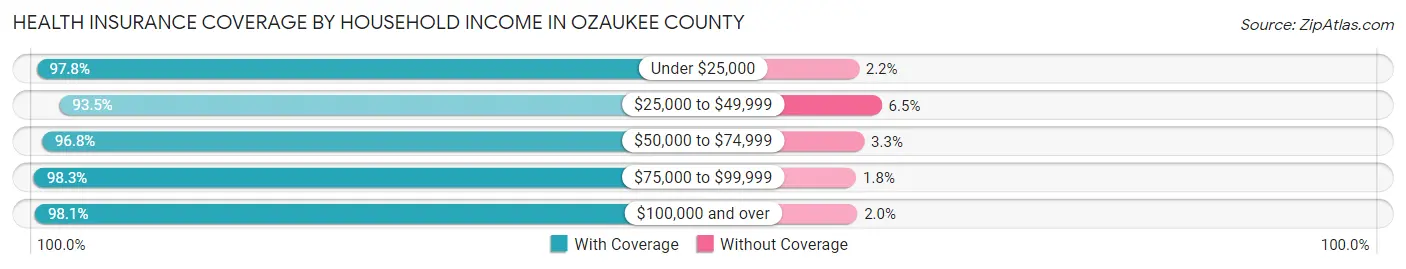
| Household Income | With Coverage | Without Coverage |
| Under $25,000 | 4,747 (97.8%) | 109 (2.2%) |
| $25,000 to $49,999 | 9,094 (93.5%) | 635 (6.5%) |
| $50,000 to $74,999 | 10,400 (96.8%) | 349 (3.3%) |
| $75,000 to $99,999 | 11,241 (98.3%) | 200 (1.8%) |
| $100,000 and over | 51,899 (98.1%) | 1,034 (1.9%) |
Public vs Private Health Insurance Coverage by Age in Ozaukee County
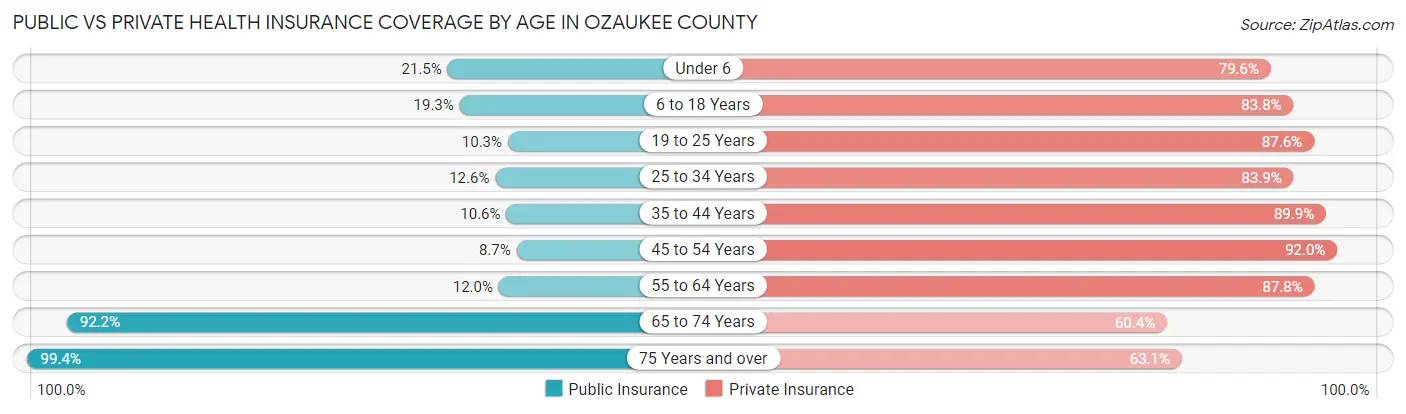
| Age Bracket | Public Insurance | Private Insurance |
| Under 6 | 1,235 (21.5%) | 4,575 (79.6%) |
| 6 to 18 Years | 2,897 (19.3%) | 12,607 (83.8%) |
| 19 to 25 Years | 762 (10.3%) | 6,481 (87.6%) |
| 25 to 34 Years | 996 (12.6%) | 6,611 (83.9%) |
| 35 to 44 Years | 1,163 (10.6%) | 9,878 (89.9%) |
| 45 to 54 Years | 1,014 (8.7%) | 10,752 (91.9%) |
| 55 to 64 Years | 1,666 (12.0%) | 12,209 (87.8%) |
| 65 to 74 Years | 9,872 (92.2%) | 6,469 (60.4%) |
| 75 Years and over | 7,843 (99.4%) | 4,977 (63.1%) |
| Total | 27,448 (30.1%) | 74,559 (81.7%) |
Disability Status by Sex by Age in Ozaukee County
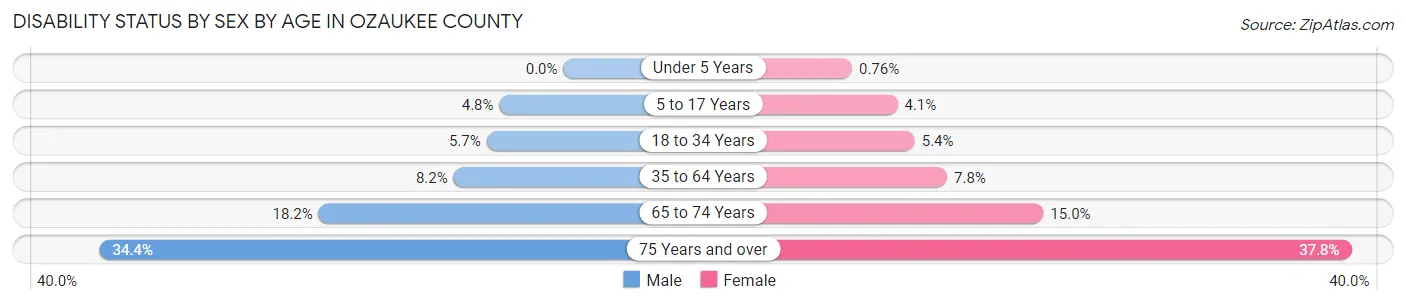
| Age Bracket | Male | Female |
| Under 5 Years | 0 (0.0%) | 17 (0.8%) |
| 5 to 17 Years | 360 (4.8%) | 293 (4.1%) |
| 18 to 34 Years | 488 (5.7%) | 445 (5.4%) |
| 35 to 64 Years | 1,493 (8.2%) | 1,429 (7.8%) |
| 65 to 74 Years | 935 (18.2%) | 833 (15.0%) |
| 75 Years and over | 1,136 (34.4%) | 1,736 (37.8%) |
Disability Class by Sex by Age in Ozaukee County
Disability Class: Hearing Difficulty
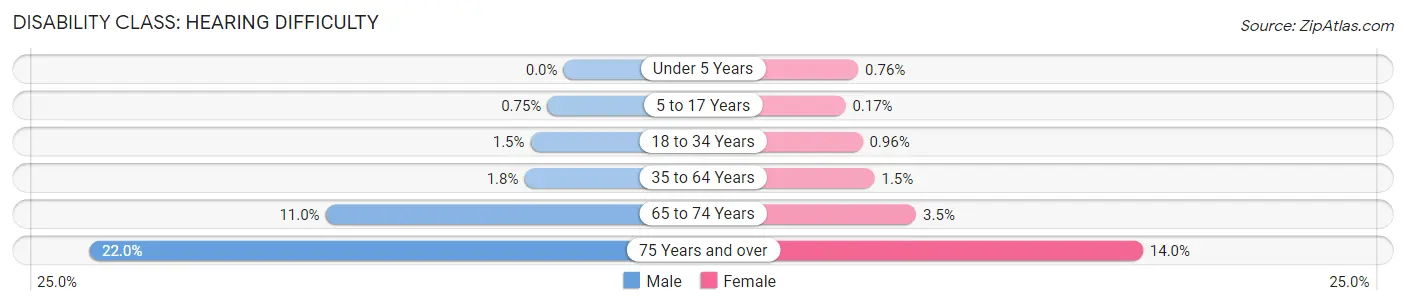
| Age Bracket | Male | Female |
| Under 5 Years | 0 (0.0%) | 17 (0.8%) |
| 5 to 17 Years | 57 (0.7%) | 12 (0.2%) |
| 18 to 34 Years | 131 (1.5%) | 79 (1.0%) |
| 35 to 64 Years | 331 (1.8%) | 278 (1.5%) |
| 65 to 74 Years | 568 (11.0%) | 192 (3.5%) |
| 75 Years and over | 726 (22.0%) | 641 (14.0%) |
Disability Class: Vision Difficulty
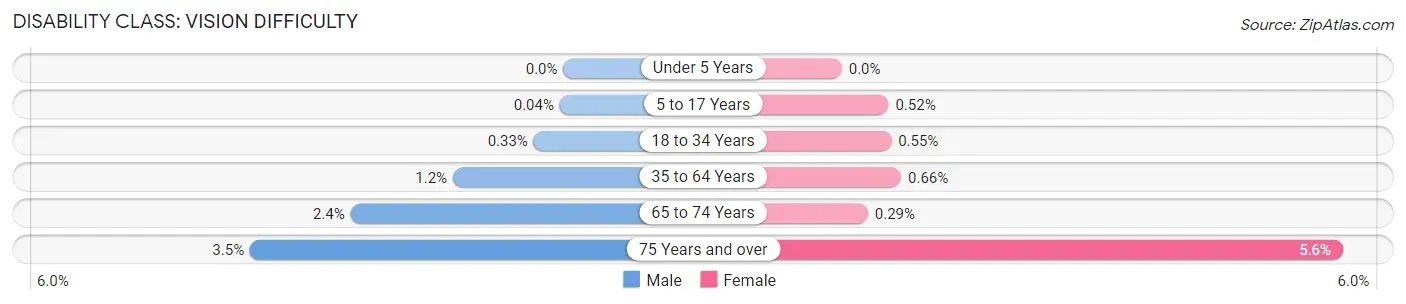
| Age Bracket | Male | Female |
| Under 5 Years | 0 (0.0%) | 0 (0.0%) |
| 5 to 17 Years | 3 (0.0%) | 37 (0.5%) |
| 18 to 34 Years | 28 (0.3%) | 45 (0.5%) |
| 35 to 64 Years | 225 (1.2%) | 121 (0.7%) |
| 65 to 74 Years | 122 (2.4%) | 16 (0.3%) |
| 75 Years and over | 115 (3.5%) | 256 (5.6%) |
Disability Class: Cognitive Difficulty
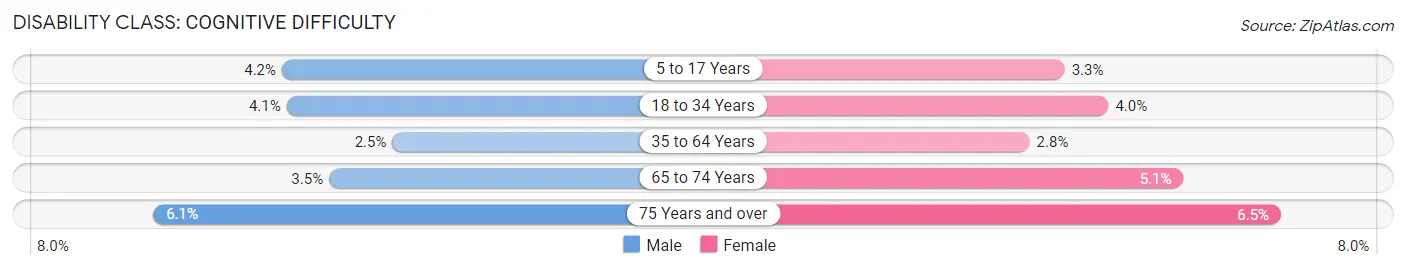
| Age Bracket | Male | Female |
| 5 to 17 Years | 317 (4.2%) | 234 (3.3%) |
| 18 to 34 Years | 352 (4.1%) | 325 (4.0%) |
| 35 to 64 Years | 466 (2.5%) | 510 (2.8%) |
| 65 to 74 Years | 179 (3.5%) | 282 (5.1%) |
| 75 Years and over | 201 (6.1%) | 299 (6.5%) |
Disability Class: Ambulatory Difficulty
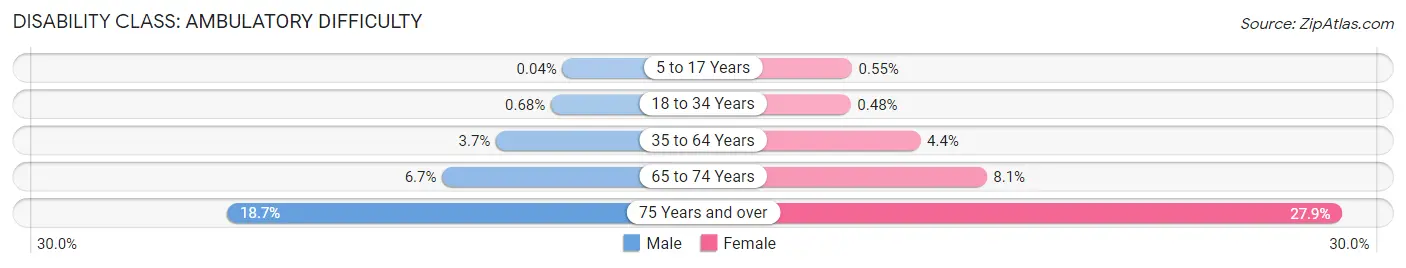
| Age Bracket | Male | Female |
| 5 to 17 Years | 3 (0.0%) | 39 (0.5%) |
| 18 to 34 Years | 58 (0.7%) | 39 (0.5%) |
| 35 to 64 Years | 685 (3.7%) | 796 (4.4%) |
| 65 to 74 Years | 347 (6.7%) | 448 (8.1%) |
| 75 Years and over | 618 (18.7%) | 1,279 (27.9%) |
Disability Class: Self-Care Difficulty
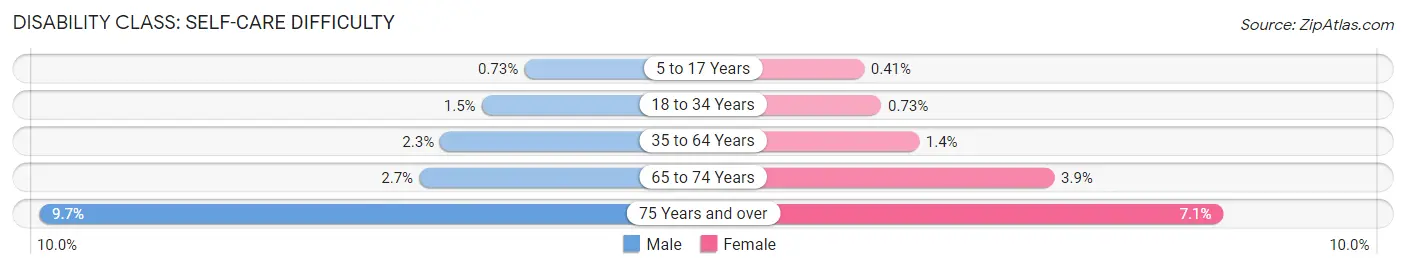
| Age Bracket | Male | Female |
| 5 to 17 Years | 55 (0.7%) | 29 (0.4%) |
| 18 to 34 Years | 130 (1.5%) | 60 (0.7%) |
| 35 to 64 Years | 420 (2.3%) | 261 (1.4%) |
| 65 to 74 Years | 138 (2.7%) | 219 (3.9%) |
| 75 Years and over | 321 (9.7%) | 325 (7.1%) |
Technology Access in Ozaukee County
Computing Device Access in Ozaukee County
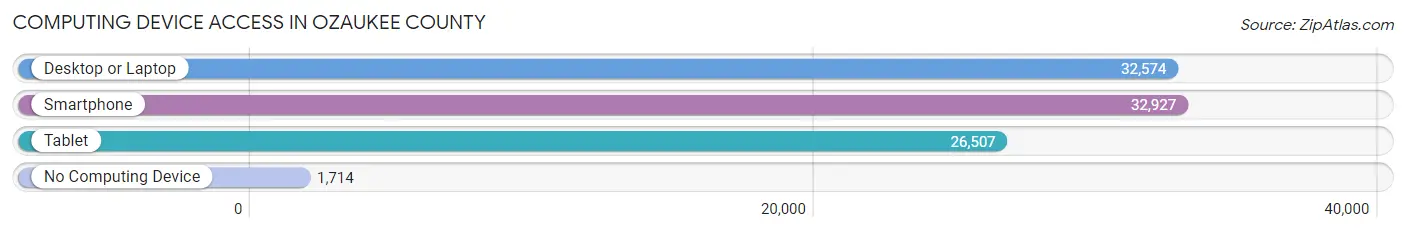
| Device Type | # Households | % Households |
| Desktop or Laptop | 32,574 | 86.9% |
| Smartphone | 32,927 | 87.9% |
| Tablet | 26,507 | 70.7% |
| No Computing Device | 1,714 | 4.6% |
| Total | 37,478 | 100.0% |
Internet Access in Ozaukee County
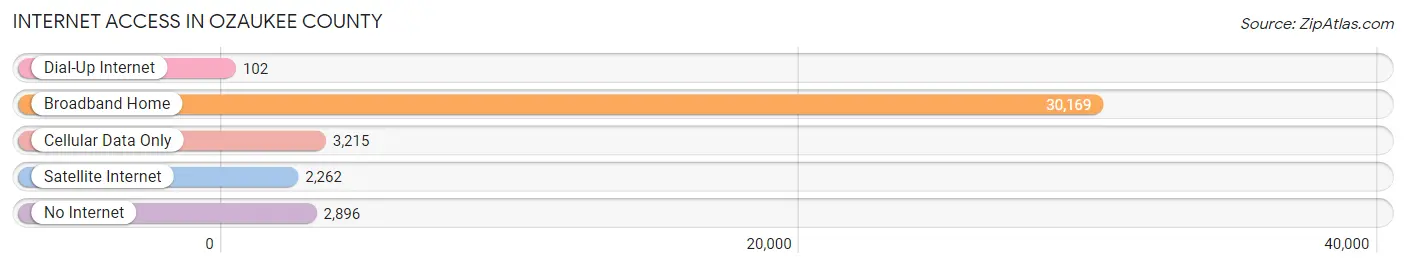
| Internet Type | # Households | % Households |
| Dial-Up Internet | 102 | 0.3% |
| Broadband Home | 30,169 | 80.5% |
| Cellular Data Only | 3,215 | 8.6% |
| Satellite Internet | 2,262 | 6.0% |
| No Internet | 2,896 | 7.7% |
| Total | 37,478 | 100.0% |
Ozaukee County Summary
Ozaukee County is located in the southeastern corner of Wisconsin, and is part of the Milwaukee metropolitan area. It is bordered by Lake Michigan to the east, Sheboygan County to the north, Washington County to the west, and Milwaukee County to the south. The county seat is Port Washington. Ozaukee County has a total area of 233 square miles, of which 229 square miles is land and 4 square miles is water.
History
Ozaukee County was established in 1853, and was named after the Sauk Indian tribe. The county was originally part of Milwaukee County, but was split off in 1853. The first settlers in the area were German immigrants, who began arriving in the 1840s. The first county seat was Saukville, but it was moved to Port Washington in 1858.
Geography
Ozaukee County is located in the southeastern corner of Wisconsin, and is part of the Milwaukee metropolitan area. It is bordered by Lake Michigan to the east, Sheboygan County to the north, Washington County to the west, and Milwaukee County to the south. The county seat is Port Washington. Ozaukee County has a total area of 233 square miles, of which 229 square miles is land and 4 square miles is water.
The terrain of Ozaukee County is generally flat, with some rolling hills in the western part of the county. The highest point in the county is located in the town of Saukville, at an elevation of 845 feet. The county is drained by the Milwaukee River, which flows through the county from north to south.
Economy
Ozaukee County has a diverse economy, with a mix of manufacturing, retail, and service industries. The largest employers in the county are Aurora Health Care, Kohler Company, and Quad/Graphics. Manufacturing is the largest sector of the economy, with companies such as Kohler, Quad/Graphics, and Johnsonville Sausage located in the county. Retail and service industries are also important to the economy, with many small businesses located in the county.
Demographics
As of the 2010 census, there were 86,395 people, 33,845 households, and 23,845 families residing in the county. The population density was 375 people per square mile. The racial makeup of the county was 95.2% White, 1.2% African American, 0.4% Native American, 1.3% Asian, 0.2% Pacific Islander, 0.7% from other races, and 1.2% from two or more races. Hispanic or Latino of any race were 2.7% of the population.
The median income for a household in the county was $62,845, and the median income for a family was $76,945. The per capita income for the county was $30,945. About 4.2% of families and 6.2% of the population were below the poverty line, including 8.2% of those under age 18 and 4.7% of those age 65 or over.
Conclusion
Ozaukee County is a diverse and vibrant county located in the southeastern corner of Wisconsin. It has a rich history, and a diverse economy that includes manufacturing, retail, and service industries. The population of the county is largely white, with a small percentage of African Americans, Native Americans, Asians, and Pacific Islanders. The median income for a household in the county is above the national average, and the poverty rate is below the national average.
Common Questions
What is the Total Population of Ozaukee County?
Total Population of Ozaukee County is 91,745.
What is the Total Male Population of Ozaukee County?
Total Male Population of Ozaukee County is 45,566.
What is the Total Female Population of Ozaukee County?
Total Female Population of Ozaukee County is 46,179.
What is the Ratio of Males per 100 Females in Ozaukee County?
There are 98.67 Males per 100 Females in Ozaukee County.
What is the Ratio of Females per 100 Males in Ozaukee County?
There are 101.35 Females per 100 Males in Ozaukee County.
What is the Median Population Age in Ozaukee County?
Median Population Age in Ozaukee County is 43.8 Years.
What is the Average Family Size in Ozaukee County
Average Family Size in Ozaukee County is 2.9 People.
What is the Average Household Size in Ozaukee County
Average Household Size in Ozaukee County is 2.4 People.
What is Per Capita Income in Ozaukee County?
Per Capita income in Ozaukee County is $55,948.
What is the Median Family Income in Ozaukee County?
Median Family Income in Ozaukee County is $117,113.
What is the Median Household income in Ozaukee County?
Median Household Income in Ozaukee County is $92,258.
What is Income or Wage Gap in Ozaukee County?
Income or Wage Gap in Ozaukee County is 42.8%.
Women in Ozaukee County earn 57.2 cents for every dollar earned by a man.
What is Family Income Deficit in Ozaukee County?
Family Income Deficit in Ozaukee County is $10,739.
Families that are below poverty line in Ozaukee County earn $10,739 less on average than the poverty threshold level.
What is Inequality or Gini Index in Ozaukee County?
Inequality or Gini Index in Ozaukee County is 0.48.
How Large is the Labor Force in Ozaukee County?
There are 50,077 People in the Labor Forcein in Ozaukee County.
What is the Percentage of People in the Labor Force in Ozaukee County?
66.9% of People are in the Labor Force in Ozaukee County.
What is the Unemployment Rate in Ozaukee County?
Unemployment Rate in Ozaukee County is 2.6%.