Outagamie County, WI
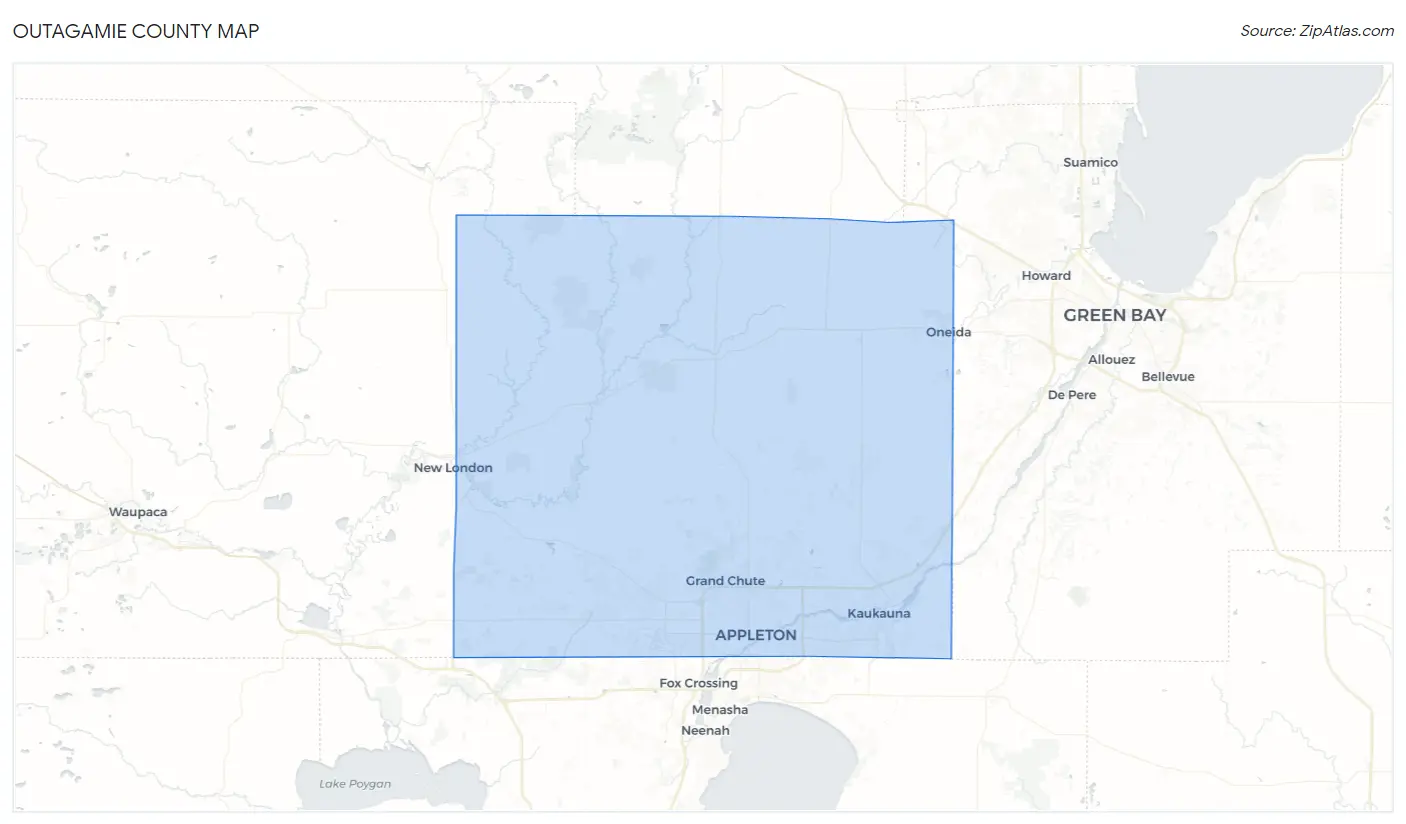
Outagamie County Map
Outagamie County Overview
190,611
TOTAL POPULATION
95,875
MALE POPULATION
94,736
FEMALE POPULATION
101.20
MALES / 100 FEMALES
98.81
FEMALES / 100 MALES
38.5
MEDIAN AGE
3.0
AVG FAMILY SIZE
2.4
AVG HOUSEHOLD SIZE
$42,923
PER CAPITA INCOME
$99,144
AVG FAMILY INCOME
$78,705
AVG HOUSEHOLD INCOME
34.6%
WAGE / INCOME GAP [ % ]
65.4¢/ $1
WAGE / INCOME GAP [ $ ]
$8,641
FAMILY INCOME DEFICIT
0.44
INEQUALITY / GINI INDEX
105,698
LABOR FORCE [ PEOPLE ]
69.7%
PERCENT IN LABOR FORCE
3.1%
UNEMPLOYMENT RATE
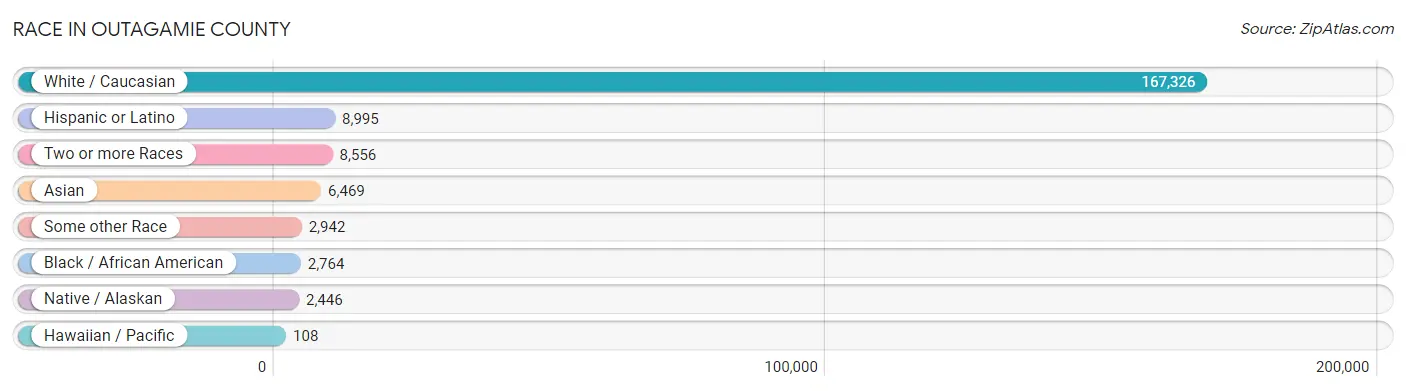
Race in Outagamie County
The most populous races in Outagamie County are White / Caucasian (167,326 | 87.8%), Hispanic or Latino (8,995 | 4.7%), and Two or more Races (8,556 | 4.5%).
| Race | # Population | % Population |
| Asian | 6,469 | 3.4% |
| Black / African American | 2,764 | 1.5% |
| Hawaiian / Pacific | 108 | 0.1% |
| Hispanic or Latino | 8,995 | 4.7% |
| Native / Alaskan | 2,446 | 1.3% |
| White / Caucasian | 167,326 | 87.8% |
| Two or more Races | 8,556 | 4.5% |
| Some other Race | 2,942 | 1.5% |
| Total | 190,611 | 100.0% |
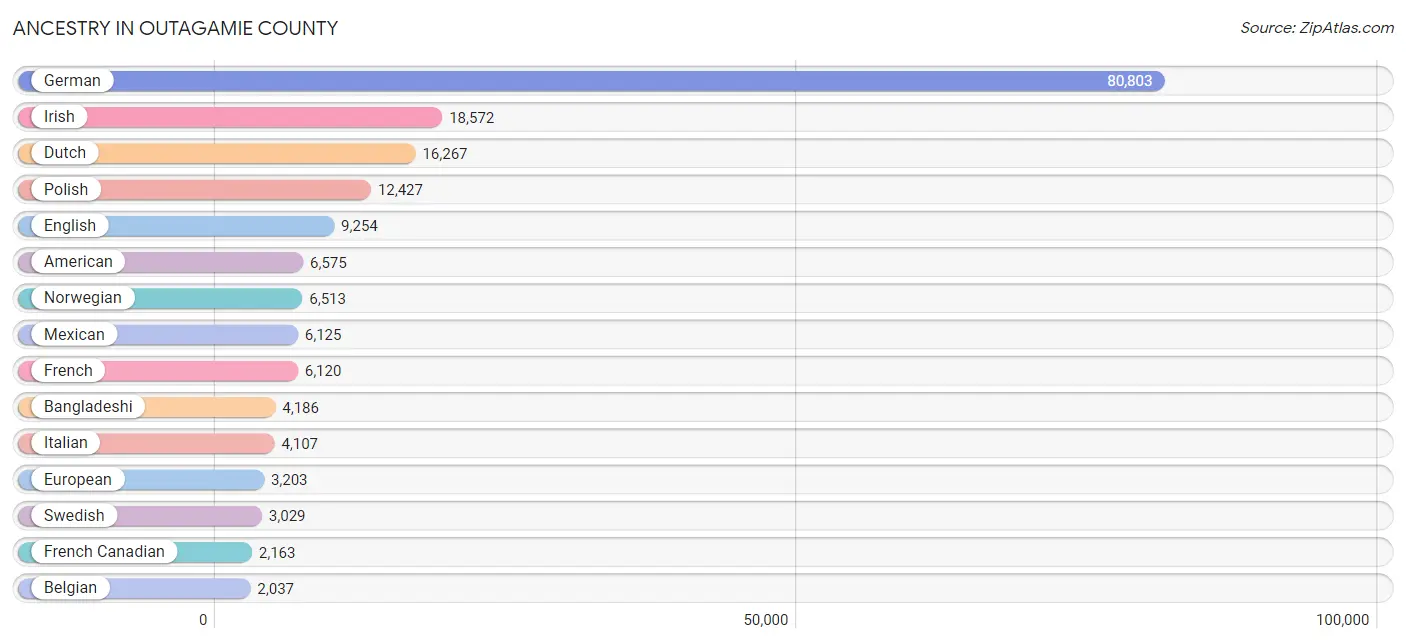
Ancestry in Outagamie County
The most populous ancestries reported in Outagamie County are German (80,803 | 42.4%), Irish (18,572 | 9.7%), Dutch (16,267 | 8.5%), Polish (12,427 | 6.5%), and English (9,254 | 4.9%), together accounting for 72.0% of all Outagamie County residents.
| Ancestry | # Population | % Population |
| Afghan | 62 | 0.0% |
| African | 105 | 0.1% |
| Alaskan Athabascan | 16 | 0.0% |
| American | 6,575 | 3.5% |
| Arab | 247 | 0.1% |
| Argentinean | 80 | 0.0% |
| Armenian | 31 | 0.0% |
| Australian | 8 | 0.0% |
| Austrian | 332 | 0.2% |
| Bangladeshi | 4,186 | 2.2% |
| Belgian | 2,037 | 1.1% |
| Bhutanese | 531 | 0.3% |
| Brazilian | 15 | 0.0% |
| British | 682 | 0.4% |
| Bulgarian | 187 | 0.1% |
| Burmese | 597 | 0.3% |
| Cajun | 21 | 0.0% |
| Cambodian | 14 | 0.0% |
| Canadian | 283 | 0.2% |
| Central American | 650 | 0.3% |
| Central American Indian | 16 | 0.0% |
| Cherokee | 236 | 0.1% |
| Chippewa | 621 | 0.3% |
| Choctaw | 71 | 0.0% |
| Colombian | 118 | 0.1% |
| Creek | 9 | 0.0% |
| Croatian | 242 | 0.1% |
| Cuban | 41 | 0.0% |
| Czech | 1,717 | 0.9% |
| Czechoslovakian | 164 | 0.1% |
| Danish | 1,051 | 0.5% |
| Delaware | 11 | 0.0% |
| Dominican | 125 | 0.1% |
| Dutch | 16,267 | 8.5% |
| Eastern European | 551 | 0.3% |
| Ecuadorian | 23 | 0.0% |
| English | 9,254 | 4.9% |
| Estonian | 6 | 0.0% |
| Ethiopian | 29 | 0.0% |
| European | 3,203 | 1.7% |
| Filipino | 9 | 0.0% |
| Finnish | 855 | 0.4% |
| French | 6,120 | 3.2% |
| French American Indian | 12 | 0.0% |
| French Canadian | 2,163 | 1.1% |
| German | 80,803 | 42.4% |
| Greek | 330 | 0.2% |
| Guamanian / Chamorro | 41 | 0.0% |
| Guatemalan | 379 | 0.2% |
| Haitian | 24 | 0.0% |
| Honduran | 116 | 0.1% |
| Hungarian | 528 | 0.3% |
| Icelander | 32 | 0.0% |
| Indian (Asian) | 690 | 0.4% |
| Indonesian | 36 | 0.0% |
| Inupiat | 30 | 0.0% |
| Iraqi | 43 | 0.0% |
| Irish | 18,572 | 9.7% |
| Iroquois | 1,297 | 0.7% |
| Italian | 4,107 | 2.1% |
| Jamaican | 21 | 0.0% |
| Japanese | 17 | 0.0% |
| Korean | 724 | 0.4% |
| Laotian | 9 | 0.0% |
| Latvian | 59 | 0.0% |
| Lebanese | 182 | 0.1% |
| Liberian | 7 | 0.0% |
| Lithuanian | 269 | 0.1% |
| Lumbee | 10 | 0.0% |
| Luxembourger | 65 | 0.0% |
| Macedonian | 20 | 0.0% |
| Malaysian | 152 | 0.1% |
| Maltese | 12 | 0.0% |
| Menominee | 232 | 0.1% |
| Mexican | 6,125 | 3.2% |
| Mexican American Indian | 44 | 0.0% |
| Native Hawaiian | 124 | 0.1% |
| Nicaraguan | 17 | 0.0% |
| Nigerian | 50 | 0.0% |
| Northern European | 167 | 0.1% |
| Norwegian | 6,513 | 3.4% |
| Ottawa | 20 | 0.0% |
| Pakistani | 41 | 0.0% |
| Palestinian | 8 | 0.0% |
| Panamanian | 3 | 0.0% |
| Paraguayan | 16 | 0.0% |
| Pennsylvania German | 68 | 0.0% |
| Peruvian | 65 | 0.0% |
| Polish | 12,427 | 6.5% |
| Portuguese | 54 | 0.0% |
| Potawatomi | 84 | 0.0% |
| Puerto Rican | 780 | 0.4% |
| Romanian | 115 | 0.1% |
| Russian | 795 | 0.4% |
| Salvadoran | 118 | 0.1% |
| Samoan | 16 | 0.0% |
| Scandinavian | 969 | 0.5% |
| Scotch-Irish | 326 | 0.2% |
| Scottish | 1,301 | 0.7% |
| Serbian | 92 | 0.1% |
| Sioux | 48 | 0.0% |
| Slavic | 84 | 0.0% |
| Slovak | 202 | 0.1% |
| Slovene | 69 | 0.0% |
| South American | 457 | 0.2% |
| South American Indian | 16 | 0.0% |
| Spaniard | 362 | 0.2% |
| Spanish | 76 | 0.0% |
| Sri Lankan | 337 | 0.2% |
| Subsaharan African | 434 | 0.2% |
| Sudanese | 31 | 0.0% |
| Swedish | 3,029 | 1.6% |
| Swiss | 582 | 0.3% |
| Syrian | 2 | 0.0% |
| Thai | 742 | 0.4% |
| Turkish | 35 | 0.0% |
| Ukrainian | 178 | 0.1% |
| Venezuelan | 155 | 0.1% |
| Vietnamese | 16 | 0.0% |
| Welsh | 514 | 0.3% |
| Yugoslavian | 100 | 0.1% | View All 121 Rows |
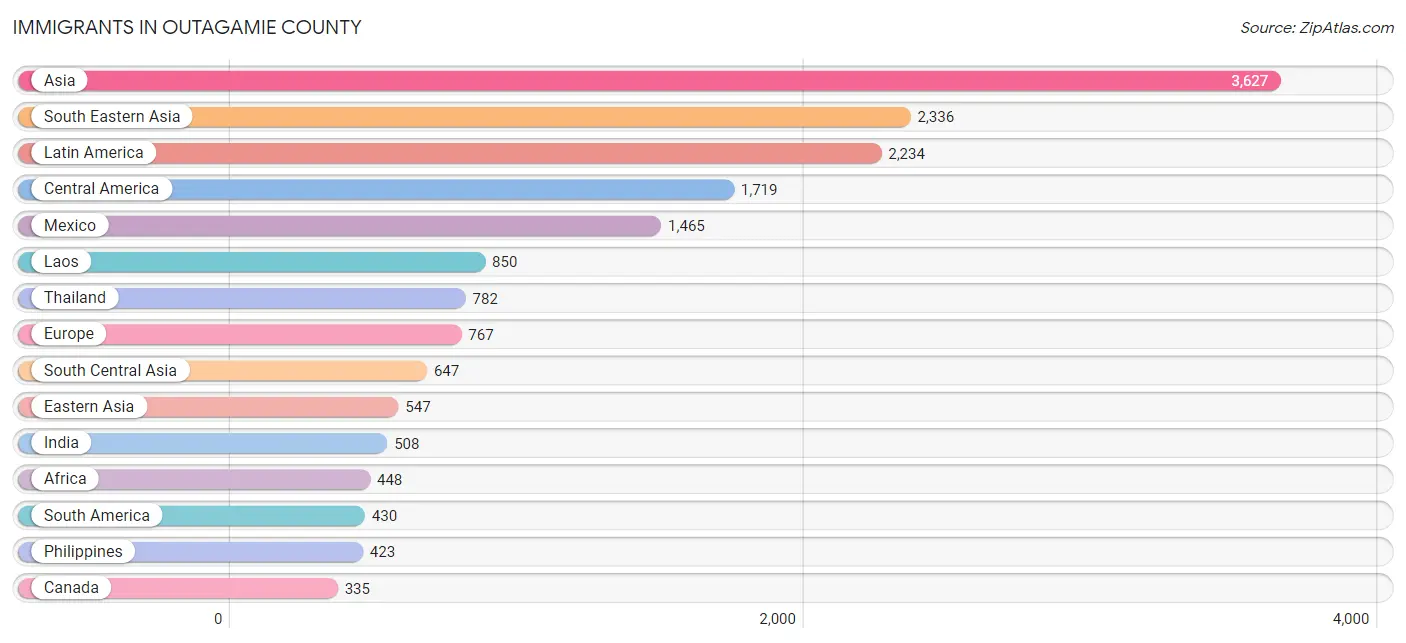
Immigrants in Outagamie County
The most numerous immigrant groups reported in Outagamie County came from Asia (3,627 | 1.9%), South Eastern Asia (2,336 | 1.2%), Latin America (2,234 | 1.2%), Central America (1,719 | 0.9%), and Mexico (1,465 | 0.8%), together accounting for 6.0% of all Outagamie County residents.
| Immigration Origin | # Population | % Population |
| Afghanistan | 62 | 0.0% |
| Africa | 448 | 0.2% |
| Argentina | 64 | 0.0% |
| Asia | 3,627 | 1.9% |
| Australia | 3 | 0.0% |
| Austria | 46 | 0.0% |
| Bangladesh | 16 | 0.0% |
| Belarus | 23 | 0.0% |
| Belize | 17 | 0.0% |
| Bosnia and Herzegovina | 12 | 0.0% |
| Brazil | 80 | 0.0% |
| Bulgaria | 50 | 0.0% |
| Cameroon | 17 | 0.0% |
| Canada | 335 | 0.2% |
| Caribbean | 85 | 0.0% |
| Central America | 1,719 | 0.9% |
| China | 335 | 0.2% |
| Colombia | 53 | 0.0% |
| Congo | 12 | 0.0% |
| Croatia | 21 | 0.0% |
| Cuba | 4 | 0.0% |
| Dominican Republic | 36 | 0.0% |
| Eastern Africa | 163 | 0.1% |
| Eastern Asia | 547 | 0.3% |
| Eastern Europe | 216 | 0.1% |
| El Salvador | 111 | 0.1% |
| England | 108 | 0.1% |
| Ethiopia | 42 | 0.0% |
| Europe | 767 | 0.4% |
| France | 18 | 0.0% |
| Germany | 183 | 0.1% |
| Greece | 27 | 0.0% |
| Guatemala | 113 | 0.1% |
| Haiti | 24 | 0.0% |
| Hong Kong | 65 | 0.0% |
| Hungary | 16 | 0.0% |
| India | 508 | 0.3% |
| Indonesia | 5 | 0.0% |
| Italy | 7 | 0.0% |
| Jamaica | 21 | 0.0% |
| Japan | 34 | 0.0% |
| Korea | 178 | 0.1% |
| Laos | 850 | 0.4% |
| Latin America | 2,234 | 1.2% |
| Lebanon | 9 | 0.0% |
| Liberia | 7 | 0.0% |
| Malaysia | 9 | 0.0% |
| Mexico | 1,465 | 0.8% |
| Middle Africa | 184 | 0.1% |
| Netherlands | 47 | 0.0% |
| Nicaragua | 13 | 0.0% |
| Nigeria | 40 | 0.0% |
| Northern Africa | 6 | 0.0% |
| Northern Europe | 188 | 0.1% |
| Oceania | 3 | 0.0% |
| Pakistan | 31 | 0.0% |
| Peru | 57 | 0.0% |
| Philippines | 423 | 0.2% |
| Poland | 3 | 0.0% |
| Russia | 65 | 0.0% |
| Saudi Arabia | 31 | 0.0% |
| Serbia | 4 | 0.0% |
| South Africa | 17 | 0.0% |
| South America | 430 | 0.2% |
| South Central Asia | 647 | 0.3% |
| South Eastern Asia | 2,336 | 1.2% |
| Southern Europe | 59 | 0.0% |
| Spain | 25 | 0.0% |
| Sri Lanka | 30 | 0.0% |
| Switzerland | 10 | 0.0% |
| Taiwan | 9 | 0.0% |
| Thailand | 782 | 0.4% |
| Turkey | 57 | 0.0% |
| Venezuela | 155 | 0.1% |
| Vietnam | 231 | 0.1% |
| Western Africa | 78 | 0.0% |
| Western Asia | 97 | 0.1% |
| Western Europe | 304 | 0.2% |
| Zaire | 155 | 0.1% | View All 79 Rows |
Sex and Age in Outagamie County
Sex and Age in Outagamie County
The most populous age groups in Outagamie County are 35 to 39 Years (7,684 | 8.0%) for men and 35 to 39 Years (7,049 | 7.4%) for women.
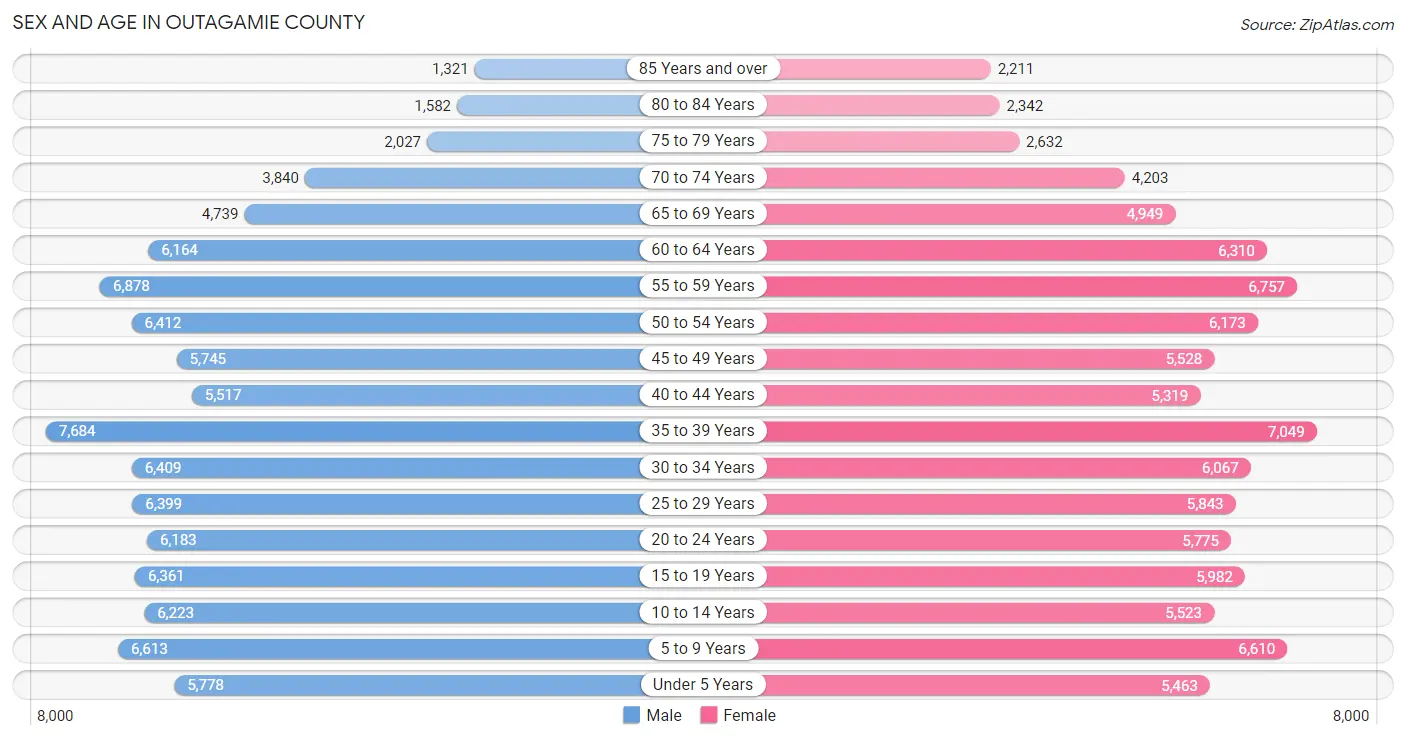
| Age Bracket | Male | Female |
| Under 5 Years | 5,778 (6.0%) | 5,463 (5.8%) |
| 5 to 9 Years | 6,613 (6.9%) | 6,610 (7.0%) |
| 10 to 14 Years | 6,223 (6.5%) | 5,523 (5.8%) |
| 15 to 19 Years | 6,361 (6.6%) | 5,982 (6.3%) |
| 20 to 24 Years | 6,183 (6.5%) | 5,775 (6.1%) |
| 25 to 29 Years | 6,399 (6.7%) | 5,843 (6.2%) |
| 30 to 34 Years | 6,409 (6.7%) | 6,067 (6.4%) |
| 35 to 39 Years | 7,684 (8.0%) | 7,049 (7.4%) |
| 40 to 44 Years | 5,517 (5.8%) | 5,319 (5.6%) |
| 45 to 49 Years | 5,745 (6.0%) | 5,528 (5.8%) |
| 50 to 54 Years | 6,412 (6.7%) | 6,173 (6.5%) |
| 55 to 59 Years | 6,878 (7.2%) | 6,757 (7.1%) |
| 60 to 64 Years | 6,164 (6.4%) | 6,310 (6.7%) |
| 65 to 69 Years | 4,739 (4.9%) | 4,949 (5.2%) |
| 70 to 74 Years | 3,840 (4.0%) | 4,203 (4.4%) |
| 75 to 79 Years | 2,027 (2.1%) | 2,632 (2.8%) |
| 80 to 84 Years | 1,582 (1.7%) | 2,342 (2.5%) |
| 85 Years and over | 1,321 (1.4%) | 2,211 (2.3%) |
| Total | 95,875 (100.0%) | 94,736 (100.0%) |
Families and Households in Outagamie County
Median Family Size in Outagamie County
The median family size in Outagamie County is 3.04 persons per family, with married-couple families (40,727 | 82.4%) accounting for the largest median family size of 3.09 persons per family. On the other hand, single male/father families (3,264 | 6.6%) represent the smallest median family size with 2.72 persons per family.
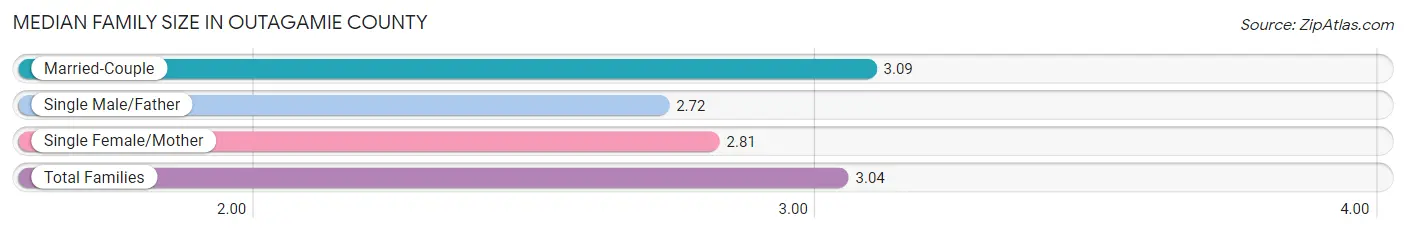
| Family Type | # Families | Family Size |
| Married-Couple | 40,727 (82.4%) | 3.09 |
| Single Male/Father | 3,264 (6.6%) | 2.72 |
| Single Female/Mother | 5,449 (11.0%) | 2.81 |
| Total Families | 49,440 (100.0%) | 3.04 |
Median Household Size in Outagamie County
The median household size in Outagamie County is 2.44 persons per household, with single male/father households (3,264 | 4.3%) accounting for the largest median household size of 3.21 persons per household. non-family households (27,206 | 35.5%) represent the smallest median household size with 1.23 persons per household.
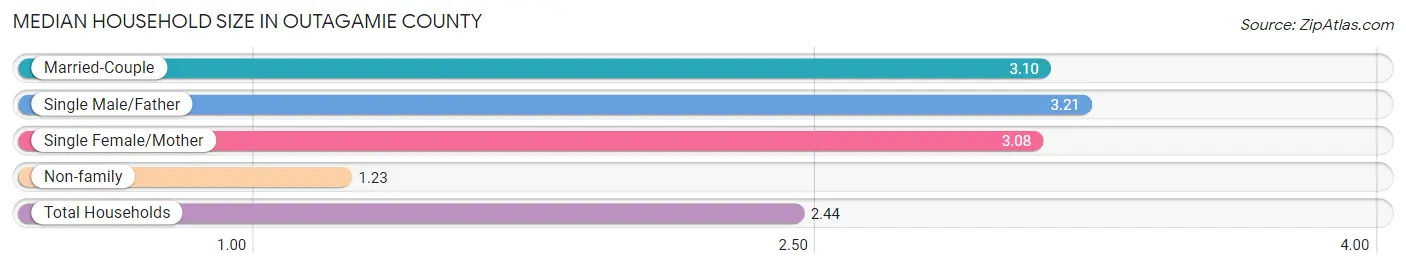
| Household Type | # Households | Household Size |
| Married-Couple | 40,727 (53.1%) | 3.10 |
| Single Male/Father | 3,264 (4.3%) | 3.21 |
| Single Female/Mother | 5,449 (7.1%) | 3.08 |
| Non-family | 27,206 (35.5%) | 1.23 |
| Total Households | 76,646 (100.0%) | 2.44 |
Household Size by Marriage Status in Outagamie County
Out of a total of 76,646 households in Outagamie County, 49,440 (64.5%) are family households, while 27,206 (35.5%) are nonfamily households. The most numerous type of family households are 2-person households, comprising 23,262, and the most common type of nonfamily households are 1-person households, comprising 21,979.
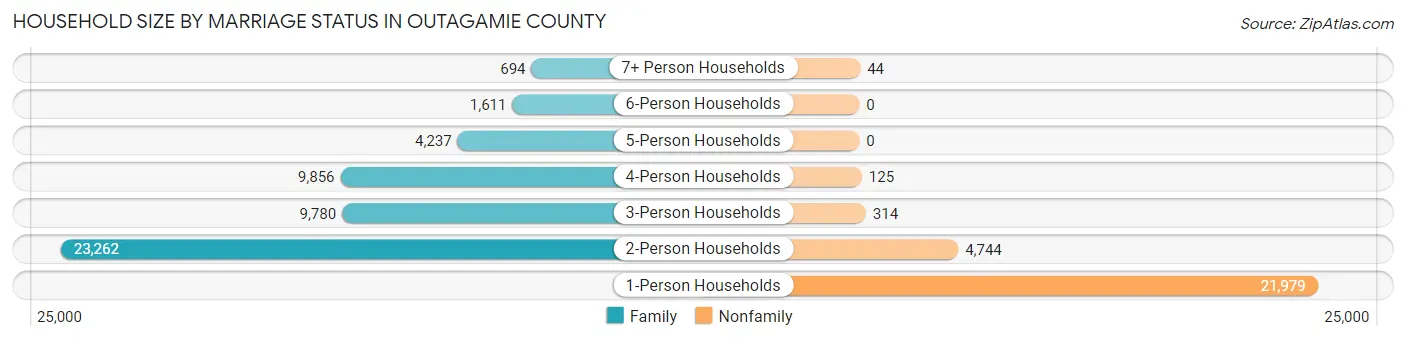
| Household Size | Family Households | Nonfamily Households |
| 1-Person Households | - | 21,979 (28.7%) |
| 2-Person Households | 23,262 (30.3%) | 4,744 (6.2%) |
| 3-Person Households | 9,780 (12.8%) | 314 (0.4%) |
| 4-Person Households | 9,856 (12.9%) | 125 (0.2%) |
| 5-Person Households | 4,237 (5.5%) | 0 (0.0%) |
| 6-Person Households | 1,611 (2.1%) | 0 (0.0%) |
| 7+ Person Households | 694 (0.9%) | 44 (0.1%) |
| Total | 49,440 (64.5%) | 27,206 (35.5%) |
Female Fertility in Outagamie County
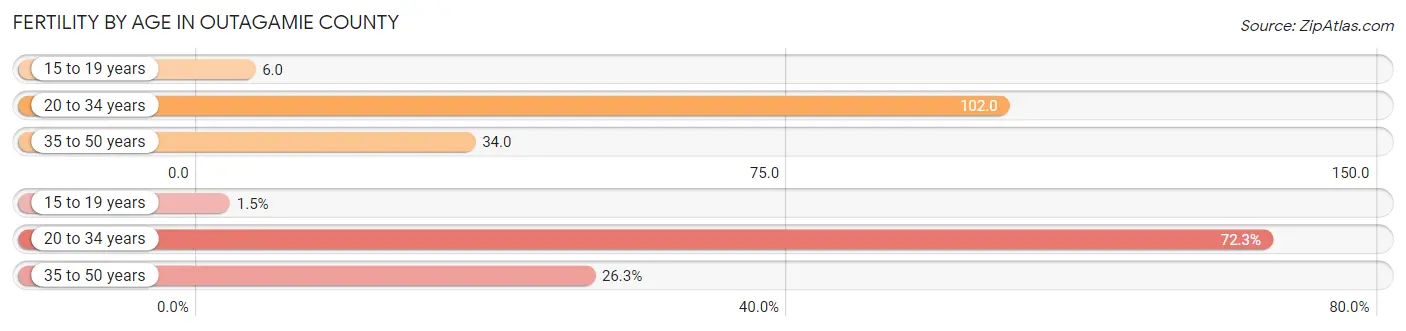
Fertility by Age in Outagamie County
Average fertility rate in Outagamie County is 58.0 births per 1,000 women. Women in the age bracket of 20 to 34 years have the highest fertility rate with 102.0 births per 1,000 women. Women in the age bracket of 20 to 34 years acount for 72.3% of all women with births.
| Age Bracket | Women with Births | Births / 1,000 Women |
| 15 to 19 years | 37 (1.5%) | 6.0 |
| 20 to 34 years | 1,805 (72.3%) | 102.0 |
| 35 to 50 years | 656 (26.3%) | 34.0 |
| Total | 2,498 (100.0%) | 58.0 |
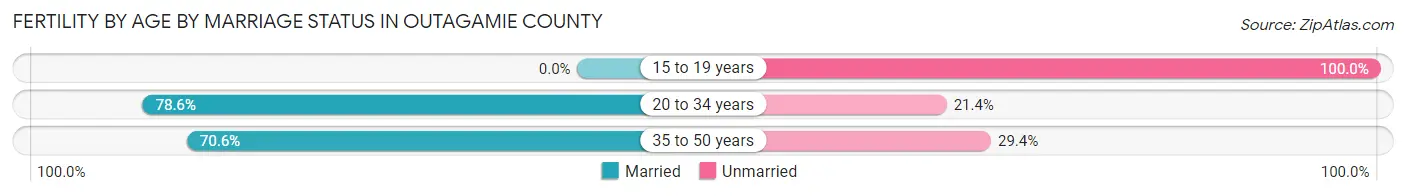
Fertility by Age by Marriage Status in Outagamie County
75.3% of women with births (2,498) in Outagamie County are married. The highest percentage of unmarried women with births falls into 15 to 19 years age bracket with 100.0% of them unmarried at the time of birth, while the lowest percentage of unmarried women with births belong to 20 to 34 years age bracket with 21.4% of them unmarried.
| Age Bracket | Married | Unmarried |
| 15 to 19 years | 0 (0.0%) | 37 (100.0%) |
| 20 to 34 years | 1,419 (78.6%) | 386 (21.4%) |
| 35 to 50 years | 463 (70.6%) | 193 (29.4%) |
| Total | 1,881 (75.3%) | 617 (24.7%) |
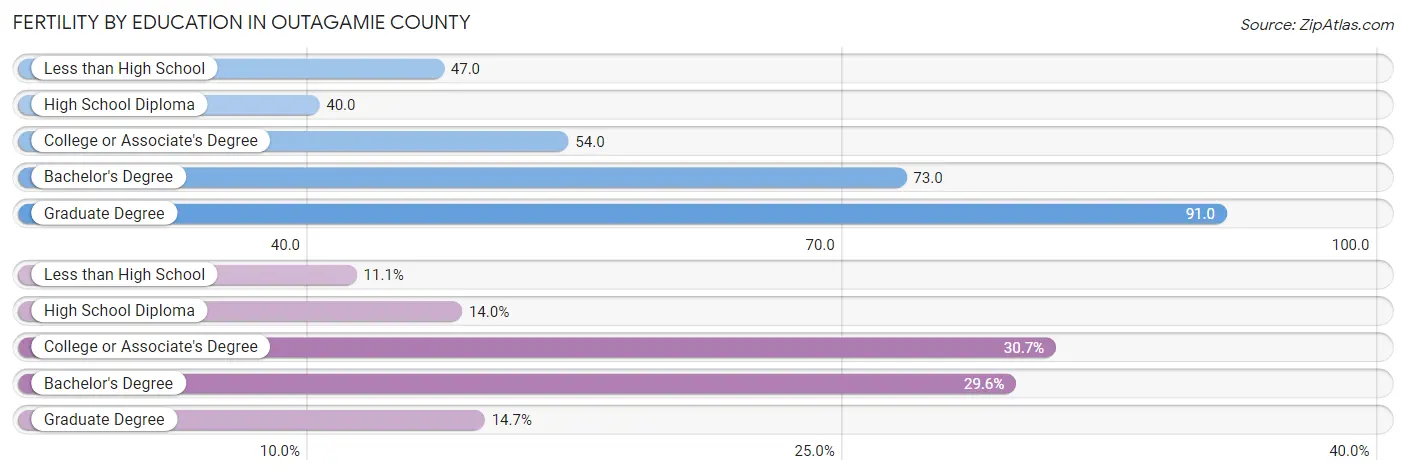
Fertility by Education in Outagamie County
Average fertility rate in Outagamie County is 58.0 births per 1,000 women. Women with the education attainment of graduate degree have the highest fertility rate of 91.0 births per 1,000 women, while women with the education attainment of high school diploma have the lowest fertility at 40.0 births per 1,000 women. Women with the education attainment of college or associate's degree represent 30.7% of all women with births.
| Educational Attainment | Women with Births | Births / 1,000 Women |
| Less than High School | 276 (11.1%) | 47.0 |
| High School Diploma | 350 (14.0%) | 40.0 |
| College or Associate's Degree | 767 (30.7%) | 54.0 |
| Bachelor's Degree | 739 (29.6%) | 73.0 |
| Graduate Degree | 366 (14.6%) | 91.0 |
| Total | 2,498 (100.0%) | 58.0 |
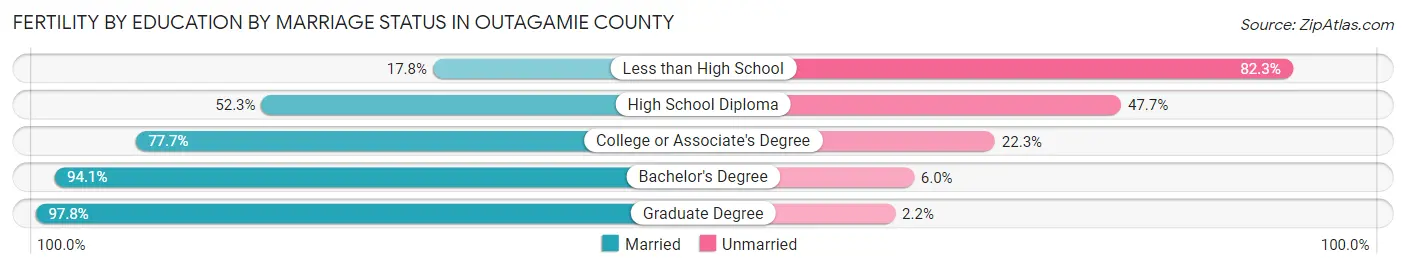
Fertility by Education by Marriage Status in Outagamie County
24.7% of women with births in Outagamie County are unmarried. Women with the educational attainment of graduate degree are most likely to be married with 97.8% of them married at childbirth, while women with the educational attainment of less than high school are least likely to be married with 82.3% of them unmarried at childbirth.
| Educational Attainment | Married | Unmarried |
| Less than High School | 49 (17.7%) | 227 (82.3%) |
| High School Diploma | 183 (52.3%) | 167 (47.7%) |
| College or Associate's Degree | 596 (77.7%) | 171 (22.3%) |
| Bachelor's Degree | 695 (94.1%) | 44 (5.9%) |
| Graduate Degree | 358 (97.8%) | 8 (2.2%) |
| Total | 1,881 (75.3%) | 617 (24.7%) |
Income in Outagamie County
Income Overview in Outagamie County
Per Capita Income in Outagamie County is $42,923, while median incomes of families and households are $99,144 and $78,705 respectively.
| Characteristic | Number | Measure |
| Per Capita Income | 190,611 | $42,923 |
| Median Family Income | 49,440 | $99,144 |
| Mean Family Income | 49,440 | $119,231 |
| Median Household Income | 76,646 | $78,705 |
| Mean Household Income | 76,646 | $104,983 |
| Income Deficit | 49,440 | $8,641 |
| Wage / Income Gap (%) | 190,611 | 34.61% |
| Wage / Income Gap ($) | 190,611 | 65.39¢ per $1 |
| Gini / Inequality Index | 190,611 | 0.44 |
Earnings by Sex in Outagamie County
Average Earnings in Outagamie County are $45,532, $55,387 for men and $36,218 for women, a difference of 34.6%.
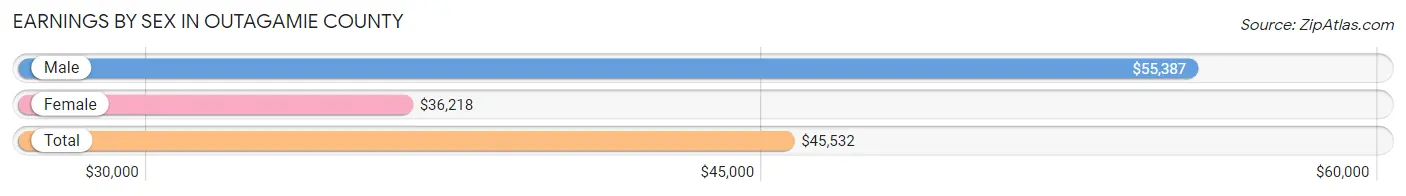
| Sex | Number | Average Earnings |
| Male | 58,239 (52.7%) | $55,387 |
| Female | 52,332 (47.3%) | $36,218 |
| Total | 110,571 (100.0%) | $45,532 |
Earnings by Sex by Income Bracket in Outagamie County
The most common earnings brackets in Outagamie County are $100,000+ for men (9,429 | 16.2%) and $35,000 to $39,999 for women (4,217 | 8.1%).
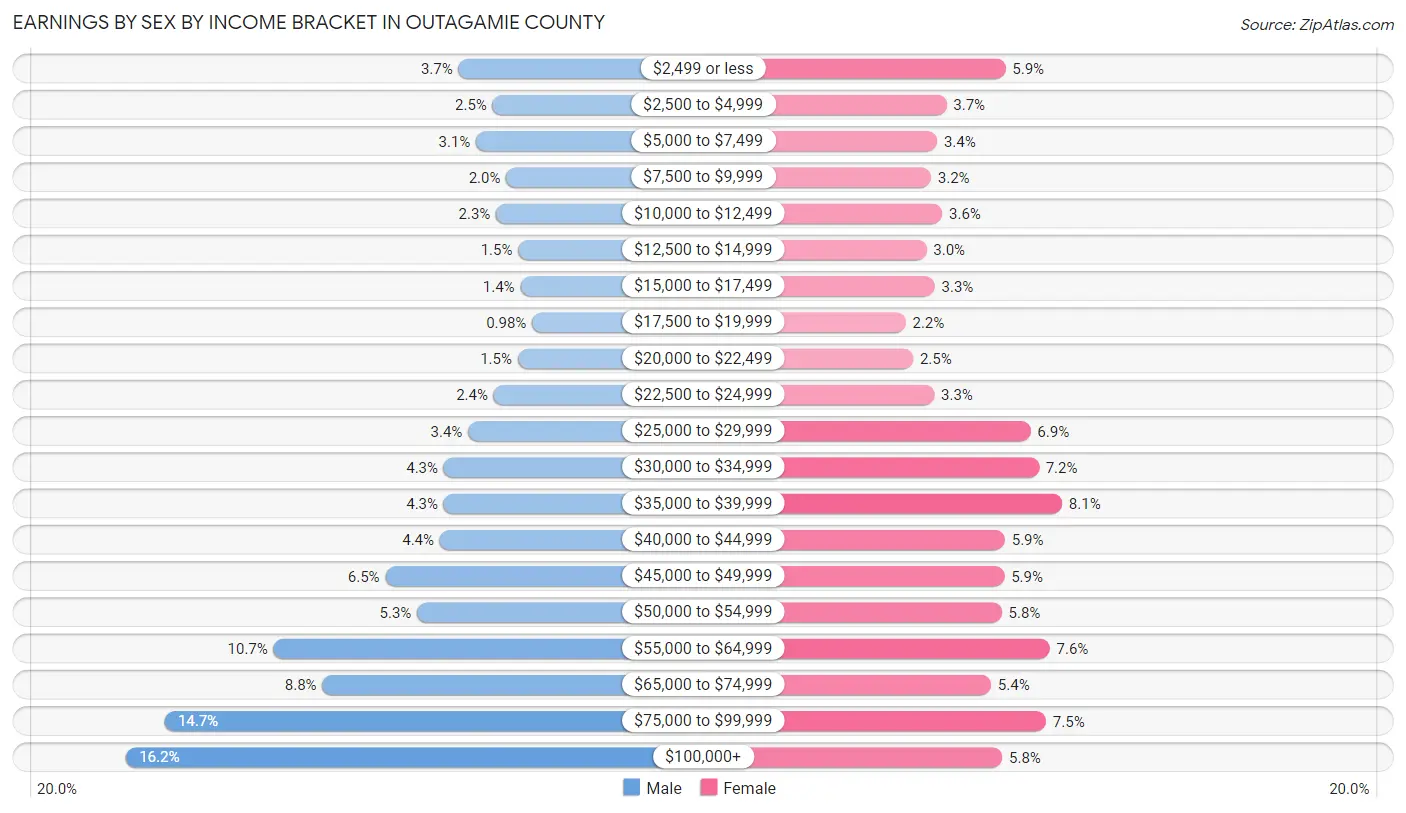
| Income | Male | Female |
| $2,499 or less | 2,179 (3.7%) | 3,107 (5.9%) |
| $2,500 to $4,999 | 1,434 (2.5%) | 1,954 (3.7%) |
| $5,000 to $7,499 | 1,794 (3.1%) | 1,767 (3.4%) |
| $7,500 to $9,999 | 1,135 (1.9%) | 1,650 (3.2%) |
| $10,000 to $12,499 | 1,357 (2.3%) | 1,867 (3.6%) |
| $12,500 to $14,999 | 876 (1.5%) | 1,560 (3.0%) |
| $15,000 to $17,499 | 826 (1.4%) | 1,721 (3.3%) |
| $17,500 to $19,999 | 571 (1.0%) | 1,150 (2.2%) |
| $20,000 to $22,499 | 883 (1.5%) | 1,296 (2.5%) |
| $22,500 to $24,999 | 1,409 (2.4%) | 1,710 (3.3%) |
| $25,000 to $29,999 | 1,968 (3.4%) | 3,600 (6.9%) |
| $30,000 to $34,999 | 2,496 (4.3%) | 3,761 (7.2%) |
| $35,000 to $39,999 | 2,496 (4.3%) | 4,217 (8.1%) |
| $40,000 to $44,999 | 2,586 (4.4%) | 3,096 (5.9%) |
| $45,000 to $49,999 | 3,776 (6.5%) | 3,088 (5.9%) |
| $50,000 to $54,999 | 3,079 (5.3%) | 3,034 (5.8%) |
| $55,000 to $64,999 | 6,212 (10.7%) | 3,975 (7.6%) |
| $65,000 to $74,999 | 5,150 (8.8%) | 2,827 (5.4%) |
| $75,000 to $99,999 | 8,583 (14.7%) | 3,905 (7.5%) |
| $100,000+ | 9,429 (16.2%) | 3,047 (5.8%) |
| Total | 58,239 (100.0%) | 52,332 (100.0%) |
Earnings by Sex by Educational Attainment in Outagamie County
Average earnings in Outagamie County are $60,813 for men and $40,095 for women, a difference of 34.1%. Men with an educational attainment of graduate degree enjoy the highest average annual earnings of $95,145, while those with less than high school education earn the least with $45,494. Women with an educational attainment of graduate degree earn the most with the average annual earnings of $70,401, while those with less than high school education have the smallest earnings of $27,965.
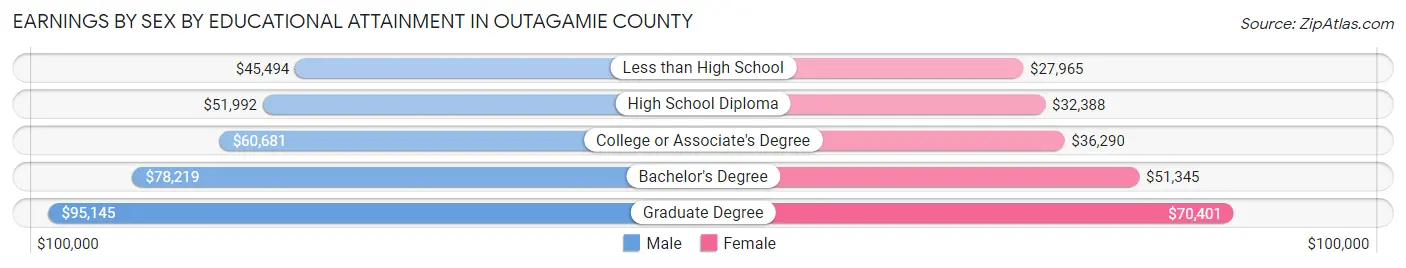
| Educational Attainment | Male Income | Female Income |
| Less than High School | $45,494 | $27,965 |
| High School Diploma | $51,992 | $32,388 |
| College or Associate's Degree | $60,681 | $36,290 |
| Bachelor's Degree | $78,219 | $51,345 |
| Graduate Degree | $95,145 | $70,401 |
| Total | $60,813 | $40,095 |
Family Income in Outagamie County
Family Income Brackets in Outagamie County
According to the Outagamie County family income data, there are 12,904 families falling into the $100,000 to $149,999 income range, which is the most common income bracket and makes up 26.1% of all families. Conversely, the less than $10,000 income bracket is the least frequent group with only 544 families (1.1%) belonging to this category.
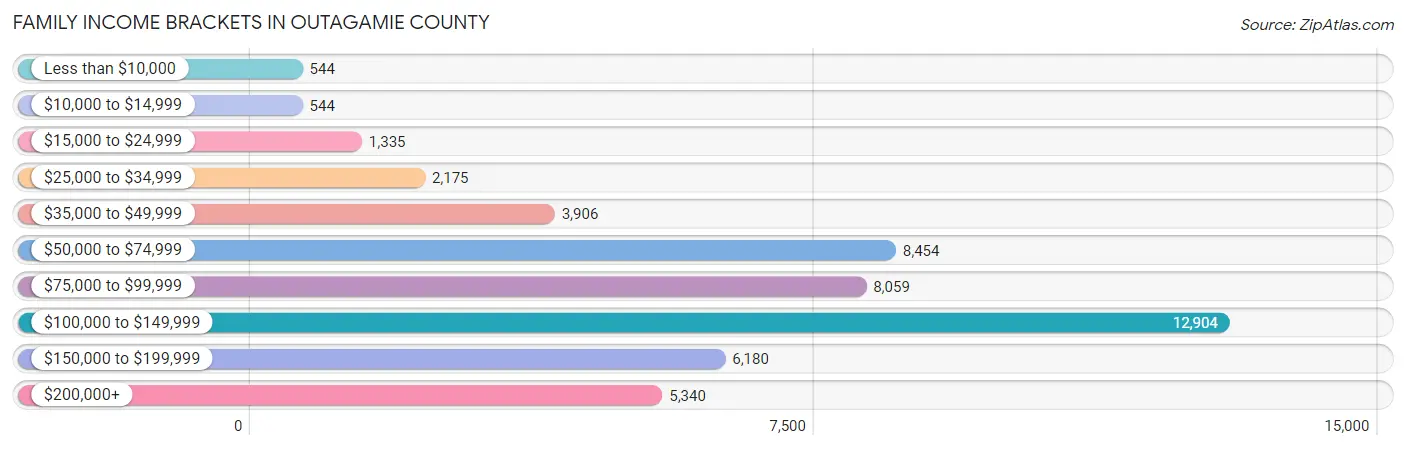
| Income Bracket | # Families | % Families |
| Less than $10,000 | 544 | 1.1% |
| $10,000 to $14,999 | 544 | 1.1% |
| $15,000 to $24,999 | 1,335 | 2.7% |
| $25,000 to $34,999 | 2,175 | 4.4% |
| $35,000 to $49,999 | 3,906 | 7.9% |
| $50,000 to $74,999 | 8,454 | 17.1% |
| $75,000 to $99,999 | 8,059 | 16.3% |
| $100,000 to $149,999 | 12,904 | 26.1% |
| $150,000 to $199,999 | 6,180 | 12.5% |
| $200,000+ | 5,340 | 10.8% |
Family Income by Famaliy Size in Outagamie County
5-person families (3,871 | 7.8%) account for the highest median family income in Outagamie County with $128,801 per family, while 2-person families (24,586 | 49.7%) have the highest median income of $40,908 per family member.
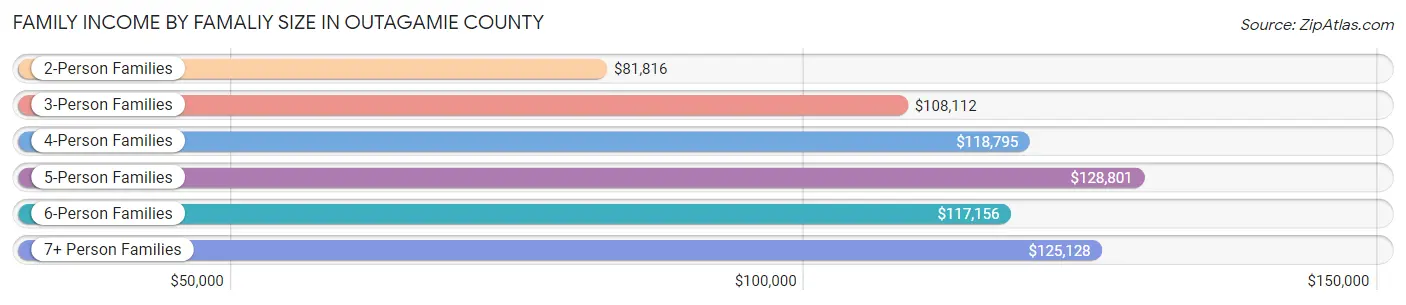
| Income Bracket | # Families | Median Income |
| 2-Person Families | 24,586 (49.7%) | $81,816 |
| 3-Person Families | 9,692 (19.6%) | $108,112 |
| 4-Person Families | 9,187 (18.6%) | $118,795 |
| 5-Person Families | 3,871 (7.8%) | $128,801 |
| 6-Person Families | 1,499 (3.0%) | $117,156 |
| 7+ Person Families | 605 (1.2%) | $125,128 |
| Total | 49,440 (100.0%) | $99,144 |
Family Income by Number of Earners in Outagamie County
The median family income in Outagamie County is $99,144, with families comprising 3+ earners (6,745) having the highest median family income of $145,523, while families with no earners (6,943) have the lowest median family income of $62,637, accounting for 13.6% and 14.0% of families, respectively.
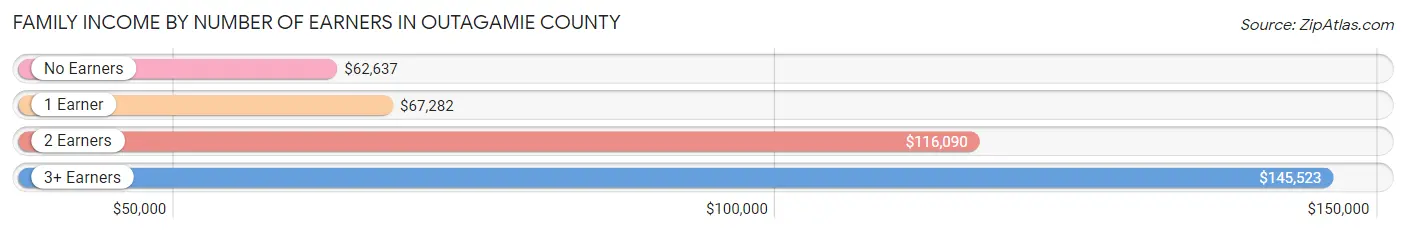
| Number of Earners | # Families | Median Income |
| No Earners | 6,943 (14.0%) | $62,637 |
| 1 Earner | 12,992 (26.3%) | $67,282 |
| 2 Earners | 22,760 (46.0%) | $116,090 |
| 3+ Earners | 6,745 (13.6%) | $145,523 |
| Total | 49,440 (100.0%) | $99,144 |
Household Income in Outagamie County
Household Income Brackets in Outagamie County
With 15,406 households falling in the category, the $100,000 to $149,999 income range is the most frequent in Outagamie County, accounting for 20.1% of all households. In contrast, only 1,686 households (2.2%) fall into the $10,000 to $14,999 income bracket, making it the least populous group.
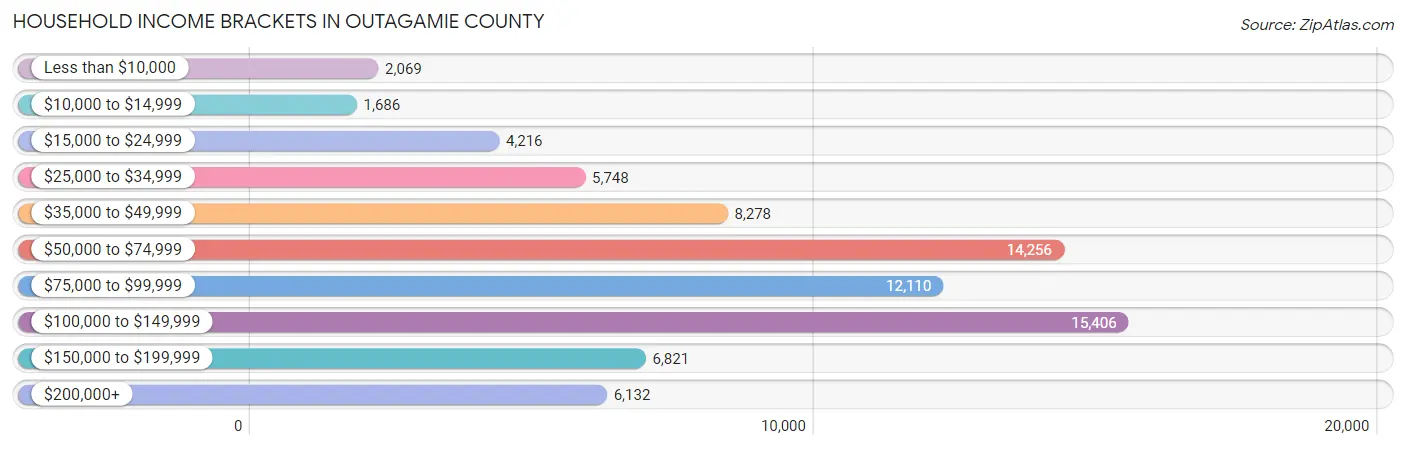
| Income Bracket | # Households | % Households |
| Less than $10,000 | 2,069 | 2.7% |
| $10,000 to $14,999 | 1,686 | 2.2% |
| $15,000 to $24,999 | 4,216 | 5.5% |
| $25,000 to $34,999 | 5,748 | 7.5% |
| $35,000 to $49,999 | 8,278 | 10.8% |
| $50,000 to $74,999 | 14,256 | 18.6% |
| $75,000 to $99,999 | 12,110 | 15.8% |
| $100,000 to $149,999 | 15,406 | 20.1% |
| $150,000 to $199,999 | 6,821 | 8.9% |
| $200,000+ | 6,132 | 8.0% |
Household Income by Householder Age in Outagamie County
The median household income in Outagamie County is $78,705, with the highest median household income of $97,359 found in the 45 to 64 years age bracket for the primary householder. A total of 28,458 households (37.1%) fall into this category. Meanwhile, the 65+ years age bracket for the primary householder has the lowest median household income of $49,760, with 19,203 households (25.1%) in this group.
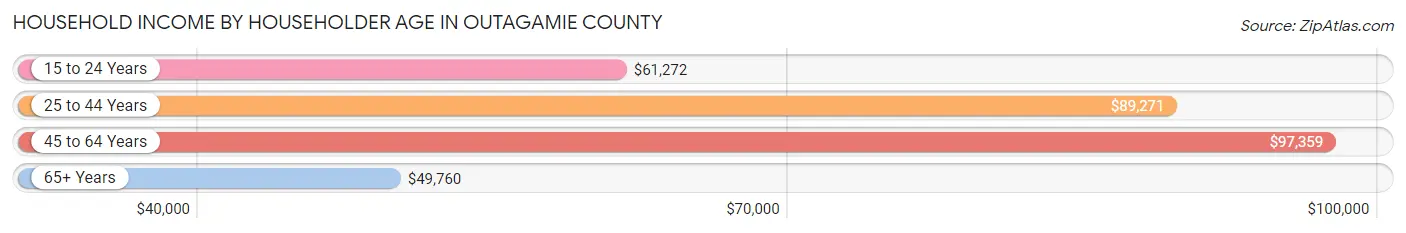
| Income Bracket | # Households | Median Income |
| 15 to 24 Years | 3,221 (4.2%) | $61,272 |
| 25 to 44 Years | 25,764 (33.6%) | $89,271 |
| 45 to 64 Years | 28,458 (37.1%) | $97,359 |
| 65+ Years | 19,203 (25.1%) | $49,760 |
| Total | 76,646 (100.0%) | $78,705 |
Poverty in Outagamie County
Income Below Poverty by Sex and Age in Outagamie County
With 6.2% poverty level for males and 7.6% for females among the residents of Outagamie County, 15 year old males and 18 to 24 year old females are the most vulnerable to poverty, with 168 males (11.4%) and 963 females (13.3%) in their respective age groups living below the poverty level.
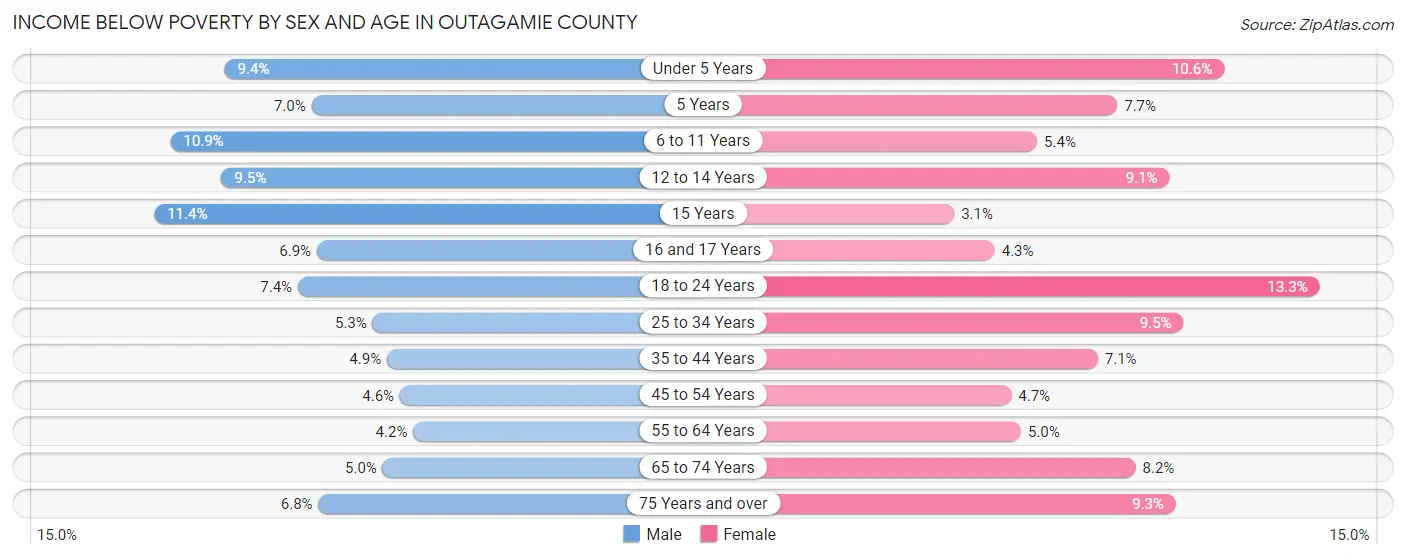
| Age Bracket | Male | Female |
| Under 5 Years | 535 (9.4%) | 579 (10.6%) |
| 5 Years | 95 (7.0%) | 89 (7.7%) |
| 6 to 11 Years | 843 (10.9%) | 407 (5.4%) |
| 12 to 14 Years | 335 (9.5%) | 293 (9.1%) |
| 15 Years | 168 (11.4%) | 40 (3.1%) |
| 16 and 17 Years | 172 (6.9%) | 110 (4.3%) |
| 18 to 24 Years | 580 (7.4%) | 963 (13.3%) |
| 25 to 34 Years | 673 (5.3%) | 1,132 (9.5%) |
| 35 to 44 Years | 642 (4.9%) | 882 (7.1%) |
| 45 to 54 Years | 549 (4.5%) | 552 (4.7%) |
| 55 to 64 Years | 542 (4.2%) | 651 (5.0%) |
| 65 to 74 Years | 427 (5.0%) | 732 (8.2%) |
| 75 Years and over | 329 (6.8%) | 629 (9.3%) |
| Total | 5,890 (6.2%) | 7,059 (7.6%) |
Income Above Poverty by Sex and Age in Outagamie County
According to the poverty statistics in Outagamie County, males aged 55 to 64 years and females aged 15 years are the age groups that are most secure financially, with 95.8% of males and 96.9% of females in these age groups living above the poverty line.
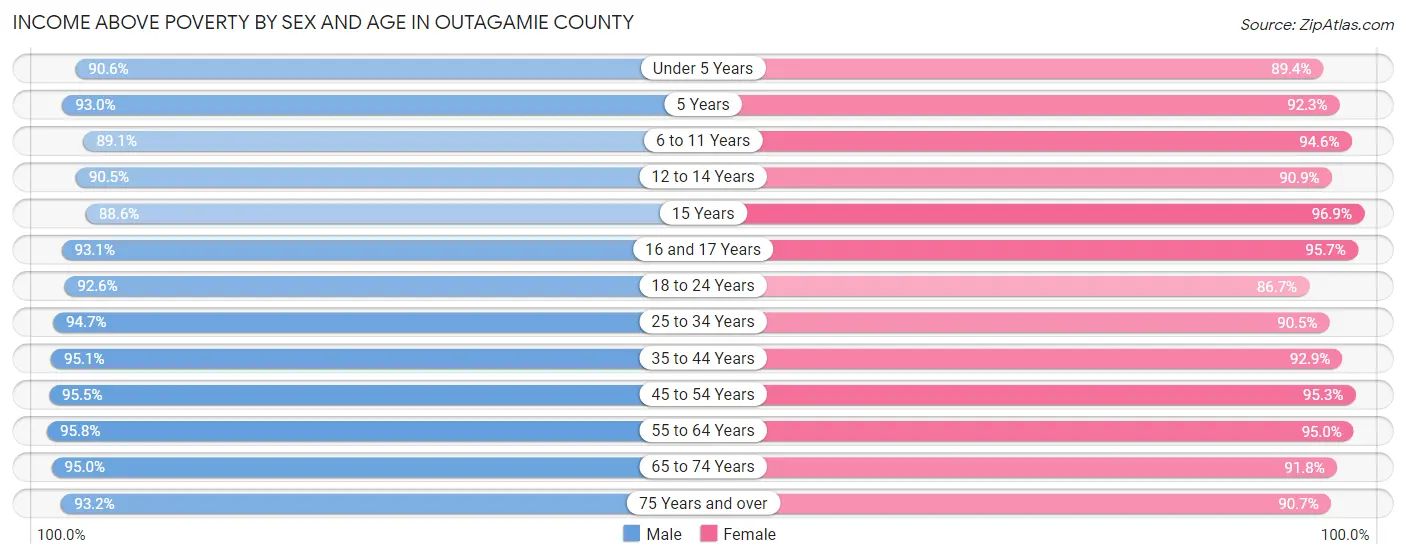
| Age Bracket | Male | Female |
| Under 5 Years | 5,141 (90.6%) | 4,863 (89.4%) |
| 5 Years | 1,261 (93.0%) | 1,071 (92.3%) |
| 6 to 11 Years | 6,860 (89.1%) | 7,079 (94.6%) |
| 12 to 14 Years | 3,184 (90.5%) | 2,921 (90.9%) |
| 15 Years | 1,307 (88.6%) | 1,239 (96.9%) |
| 16 and 17 Years | 2,335 (93.1%) | 2,473 (95.7%) |
| 18 to 24 Years | 7,266 (92.6%) | 6,276 (86.7%) |
| 25 to 34 Years | 12,011 (94.7%) | 10,769 (90.5%) |
| 35 to 44 Years | 12,423 (95.1%) | 11,480 (92.9%) |
| 45 to 54 Years | 11,522 (95.5%) | 11,148 (95.3%) |
| 55 to 64 Years | 12,436 (95.8%) | 12,390 (95.0%) |
| 65 to 74 Years | 8,065 (95.0%) | 8,217 (91.8%) |
| 75 Years and over | 4,494 (93.2%) | 6,135 (90.7%) |
| Total | 88,305 (93.8%) | 86,061 (92.4%) |
Income Below Poverty Among Married-Couple Families in Outagamie County
The poverty statistics for married-couple families in Outagamie County show that 2.1% or 837 of the total 40,727 families live below the poverty line. Families with 5 or more children have the highest poverty rate of 10.2%, comprising of 34 families. On the other hand, families with 1 or 2 children have the lowest poverty rate of 1.4%, which includes 171 families.
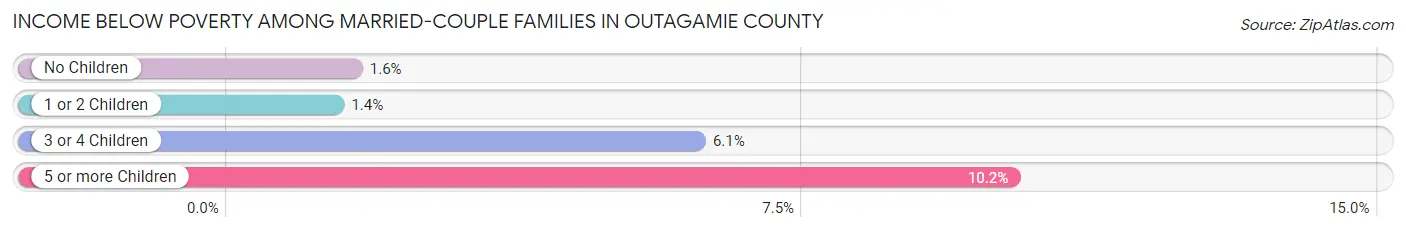
| Children | Above Poverty | Below Poverty |
| No Children | 23,820 (98.4%) | 394 (1.6%) |
| 1 or 2 Children | 12,111 (98.6%) | 171 (1.4%) |
| 3 or 4 Children | 3,660 (93.9%) | 238 (6.1%) |
| 5 or more Children | 299 (89.8%) | 34 (10.2%) |
| Total | 39,890 (97.9%) | 837 (2.1%) |
Income Below Poverty Among Single-Parent Households in Outagamie County
According to the poverty data in Outagamie County, 12.0% or 392 single-father households and 20.1% or 1,096 single-mother households are living below the poverty line. Among single-father households, those with 3 or 4 children have the highest poverty rate, with 103 households (34.4%) experiencing poverty. Likewise, among single-mother households, those with 3 or 4 children have the highest poverty rate, with 258 households (38.0%) falling below the poverty line.
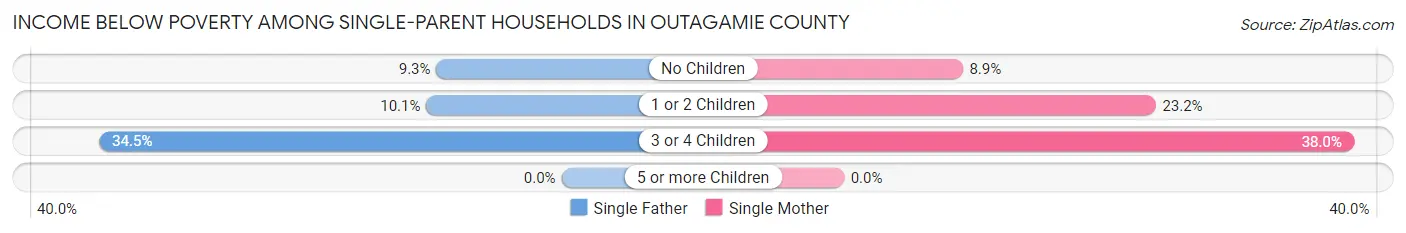
| Children | Single Father | Single Mother |
| No Children | 113 (9.3%) | 161 (8.8%) |
| 1 or 2 Children | 176 (10.1%) | 677 (23.2%) |
| 3 or 4 Children | 103 (34.4%) | 258 (38.0%) |
| 5 or more Children | 0 (0.0%) | 0 (0.0%) |
| Total | 392 (12.0%) | 1,096 (20.1%) |
Income Below Poverty Among Married-Couple vs Single-Parent Households in Outagamie County
The poverty data for Outagamie County shows that 837 of the married-couple family households (2.1%) and 1,488 of the single-parent households (17.1%) are living below the poverty level. Within the married-couple family households, those with 5 or more children have the highest poverty rate, with 34 households (10.2%) falling below the poverty line. Among the single-parent households, those with 3 or 4 children have the highest poverty rate, with 361 household (36.9%) living below poverty.
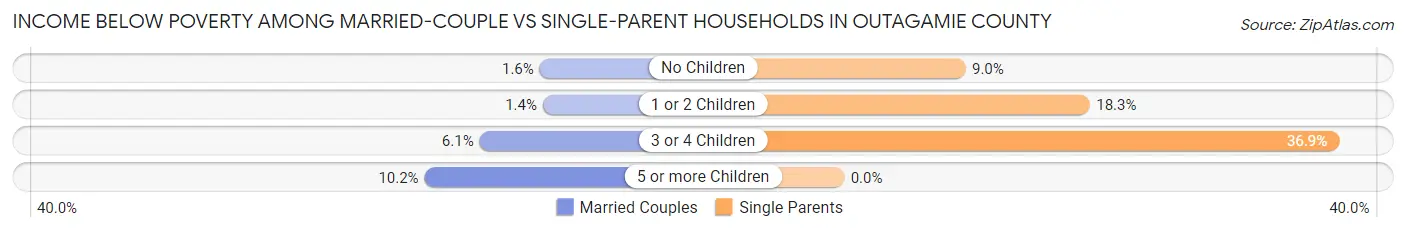
| Children | Married-Couple Families | Single-Parent Households |
| No Children | 394 (1.6%) | 274 (9.0%) |
| 1 or 2 Children | 171 (1.4%) | 853 (18.3%) |
| 3 or 4 Children | 238 (6.1%) | 361 (36.9%) |
| 5 or more Children | 34 (10.2%) | 0 (0.0%) |
| Total | 837 (2.1%) | 1,488 (17.1%) |
Employment Characteristics in Outagamie County
Employment by Class of Employer in Outagamie County
Among the 101,029 employed individuals in Outagamie County, private company employees (73,592 | 72.8%), not-for-profit organizations (10,001 | 9.9%), and local government employees (6,084 | 6.0%) make up the most common classes of employment.
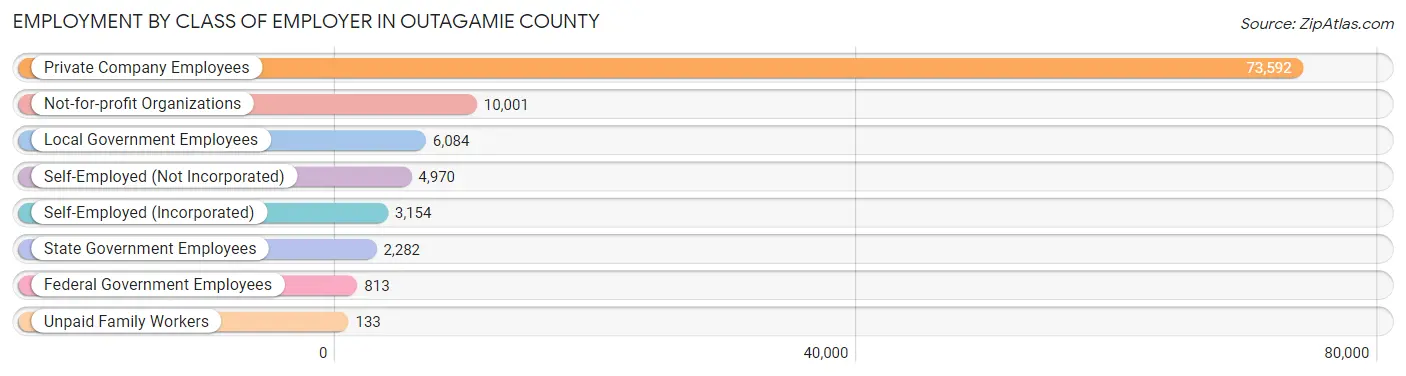
| Employer Class | # Employees | % Employees |
| Private Company Employees | 73,592 | 72.8% |
| Self-Employed (Incorporated) | 3,154 | 3.1% |
| Self-Employed (Not Incorporated) | 4,970 | 4.9% |
| Not-for-profit Organizations | 10,001 | 9.9% |
| Local Government Employees | 6,084 | 6.0% |
| State Government Employees | 2,282 | 2.3% |
| Federal Government Employees | 813 | 0.8% |
| Unpaid Family Workers | 133 | 0.1% |
| Total | 101,029 | 100.0% |
Employment Status by Age in Outagamie County
According to the labor force statistics for Outagamie County, out of the total population over 16 years of age (151,647), 69.7% or 105,698 individuals are in the labor force, with 3.1% or 3,277 of them unemployed. The age group with the highest labor force participation rate is 25 to 29 years, with 92.8% or 11,361 individuals in the labor force. Within the labor force, the 16 to 19 years age range has the highest percentage of unemployed individuals, with 8.8% or 469 of them being unemployed.
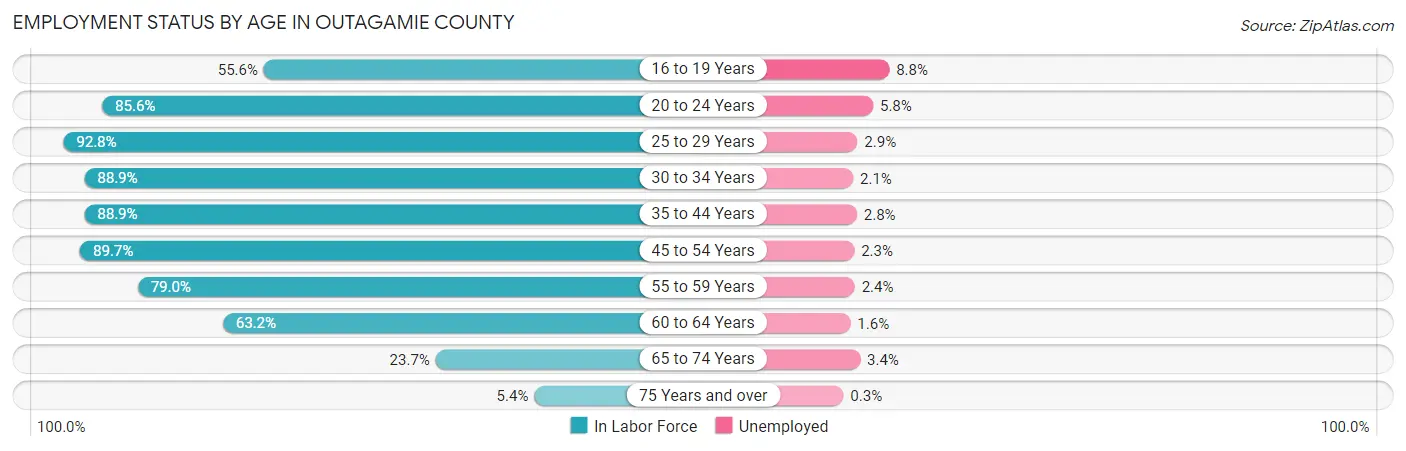
| Age Bracket | In Labor Force | Unemployed |
| 16 to 19 Years | 5,331 (55.6%) | 469 (8.8%) |
| 20 to 24 Years | 10,236 (85.6%) | 594 (5.8%) |
| 25 to 29 Years | 11,361 (92.8%) | 329 (2.9%) |
| 30 to 34 Years | 11,091 (88.9%) | 233 (2.1%) |
| 35 to 44 Years | 22,731 (88.9%) | 636 (2.8%) |
| 45 to 54 Years | 21,401 (89.7%) | 492 (2.3%) |
| 55 to 59 Years | 10,772 (79.0%) | 259 (2.4%) |
| 60 to 64 Years | 7,884 (63.2%) | 126 (1.6%) |
| 65 to 74 Years | 4,202 (23.7%) | 143 (3.4%) |
| 75 Years and over | 654 (5.4%) | 2 (0.3%) |
| Total | 105,698 (69.7%) | 3,277 (3.1%) |
Employment Status by Educational Attainment in Outagamie County
According to labor force statistics for Outagamie County, 85.0% of individuals (85,216) out of the total population between 25 and 64 years of age (100,254) are in the labor force, with 2.4% or 2,045 of them being unemployed. The group with the highest labor force participation rate are those with the educational attainment of bachelor's degree or higher, with 90.1% or 30,653 individuals in the labor force. Within the labor force, individuals with less than high school education have the highest percentage of unemployment, with 5.4% or 189 of them being unemployed.
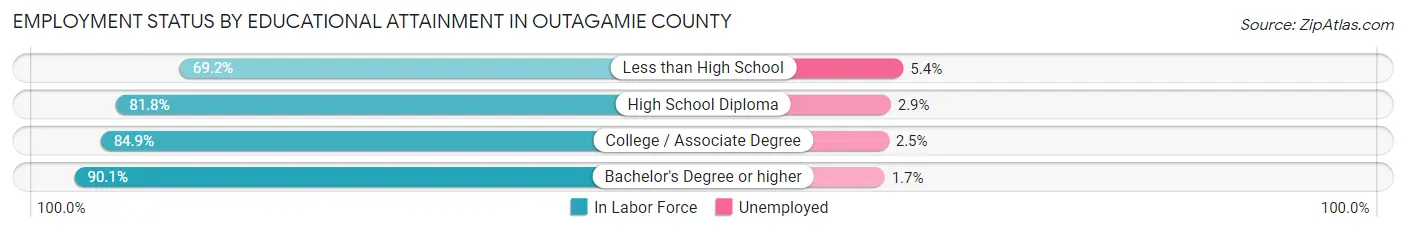
| Educational Attainment | In Labor Force | Unemployed |
| Less than High School | 3,500 (69.2%) | 273 (5.4%) |
| High School Diploma | 22,039 (81.8%) | 781 (2.9%) |
| College / Associate Degree | 29,063 (84.9%) | 856 (2.5%) |
| Bachelor's Degree or higher | 30,653 (90.1%) | 578 (1.7%) |
| Total | 85,216 (85.0%) | 2,406 (2.4%) |
Employment Occupations by Sex in Outagamie County
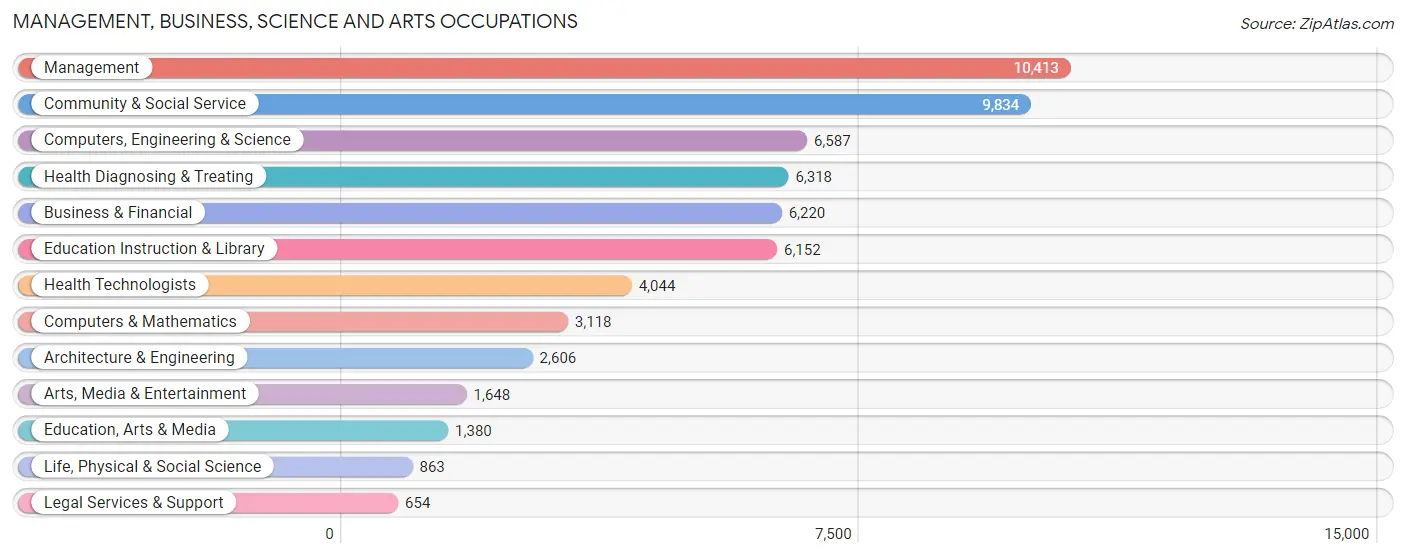
Management, Business, Science and Arts Occupations
The most common Management, Business, Science and Arts occupations in Outagamie County are Management (10,413 | 10.2%), Community & Social Service (9,834 | 9.6%), Computers, Engineering & Science (6,587 | 6.4%), Health Diagnosing & Treating (6,318 | 6.2%), and Business & Financial (6,220 | 6.1%).
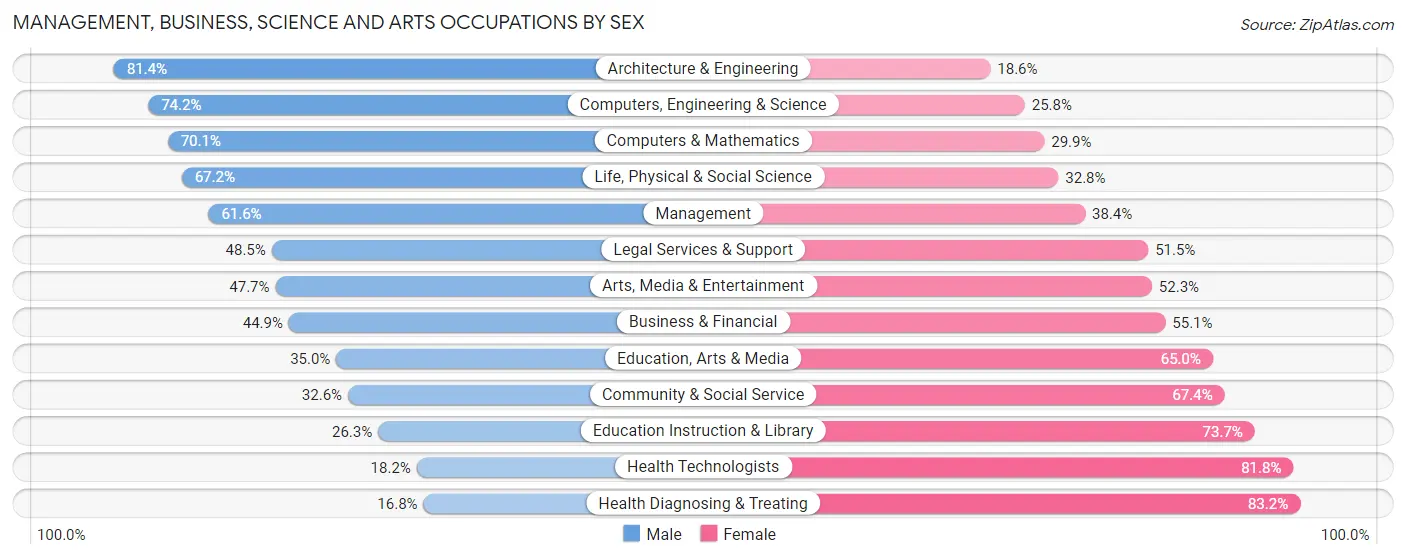
Management, Business, Science and Arts Occupations by Sex
Within the Management, Business, Science and Arts occupations in Outagamie County, the most male-oriented occupations are Architecture & Engineering (81.4%), Computers, Engineering & Science (74.2%), and Computers & Mathematics (70.1%), while the most female-oriented occupations are Health Diagnosing & Treating (83.2%), Health Technologists (81.8%), and Education Instruction & Library (73.7%).
| Occupation | Male | Female |
| Management | 6,419 (61.6%) | 3,994 (38.4%) |
| Business & Financial | 2,792 (44.9%) | 3,428 (55.1%) |
| Computers, Engineering & Science | 4,888 (74.2%) | 1,699 (25.8%) |
| Computers & Mathematics | 2,187 (70.1%) | 931 (29.9%) |
| Architecture & Engineering | 2,121 (81.4%) | 485 (18.6%) |
| Life, Physical & Social Science | 580 (67.2%) | 283 (32.8%) |
| Community & Social Service | 3,202 (32.6%) | 6,632 (67.4%) |
| Education, Arts & Media | 483 (35.0%) | 897 (65.0%) |
| Legal Services & Support | 317 (48.5%) | 337 (51.5%) |
| Education Instruction & Library | 1,616 (26.3%) | 4,536 (73.7%) |
| Arts, Media & Entertainment | 786 (47.7%) | 862 (52.3%) |
| Health Diagnosing & Treating | 1,062 (16.8%) | 5,256 (83.2%) |
| Health Technologists | 737 (18.2%) | 3,307 (81.8%) |
| Total (Category) | 18,363 (46.6%) | 21,009 (53.4%) |
| Total (Overall) | 54,291 (53.1%) | 48,006 (46.9%) |
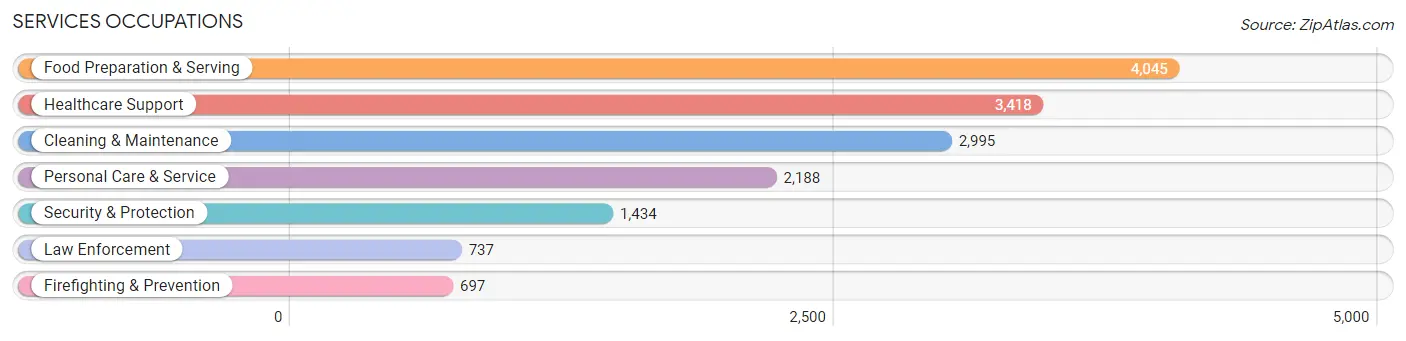
Services Occupations
The most common Services occupations in Outagamie County are Food Preparation & Serving (4,045 | 4.0%), Healthcare Support (3,418 | 3.3%), Cleaning & Maintenance (2,995 | 2.9%), Personal Care & Service (2,188 | 2.1%), and Security & Protection (1,434 | 1.4%).
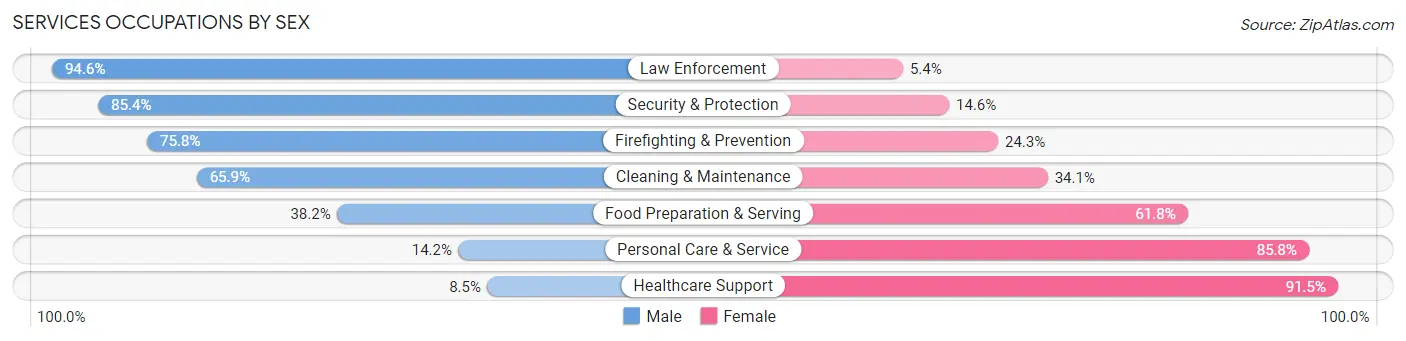
Services Occupations by Sex
Within the Services occupations in Outagamie County, the most male-oriented occupations are Law Enforcement (94.6%), Security & Protection (85.4%), and Firefighting & Prevention (75.7%), while the most female-oriented occupations are Healthcare Support (91.5%), Personal Care & Service (85.8%), and Food Preparation & Serving (61.8%).
| Occupation | Male | Female |
| Healthcare Support | 290 (8.5%) | 3,128 (91.5%) |
| Security & Protection | 1,225 (85.4%) | 209 (14.6%) |
| Firefighting & Prevention | 528 (75.7%) | 169 (24.2%) |
| Law Enforcement | 697 (94.6%) | 40 (5.4%) |
| Food Preparation & Serving | 1,547 (38.2%) | 2,498 (61.8%) |
| Cleaning & Maintenance | 1,974 (65.9%) | 1,021 (34.1%) |
| Personal Care & Service | 311 (14.2%) | 1,877 (85.8%) |
| Total (Category) | 5,347 (38.0%) | 8,733 (62.0%) |
| Total (Overall) | 54,291 (53.1%) | 48,006 (46.9%) |
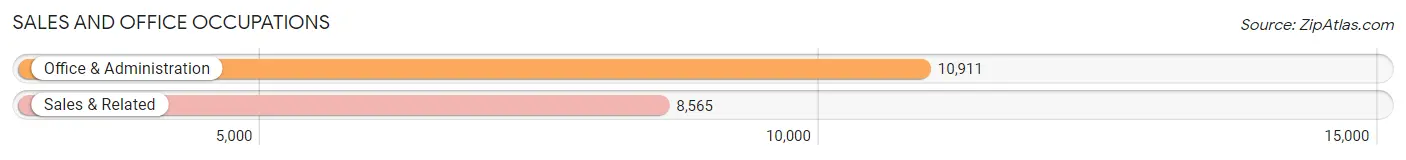
Sales and Office Occupations
The most common Sales and Office occupations in Outagamie County are Office & Administration (10,911 | 10.7%), and Sales & Related (8,565 | 8.4%).
Sales and Office Occupations by Sex
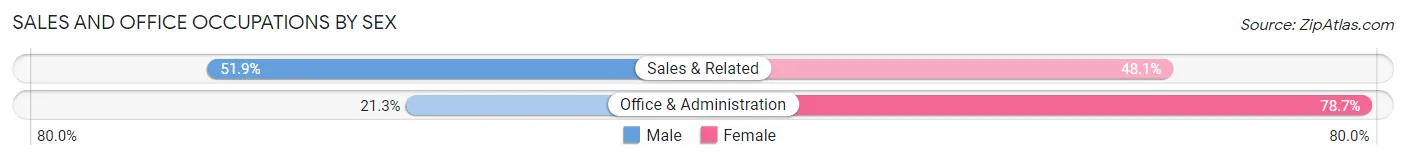
| Occupation | Male | Female |
| Sales & Related | 4,444 (51.9%) | 4,121 (48.1%) |
| Office & Administration | 2,320 (21.3%) | 8,591 (78.7%) |
| Total (Category) | 6,764 (34.7%) | 12,712 (65.3%) |
| Total (Overall) | 54,291 (53.1%) | 48,006 (46.9%) |
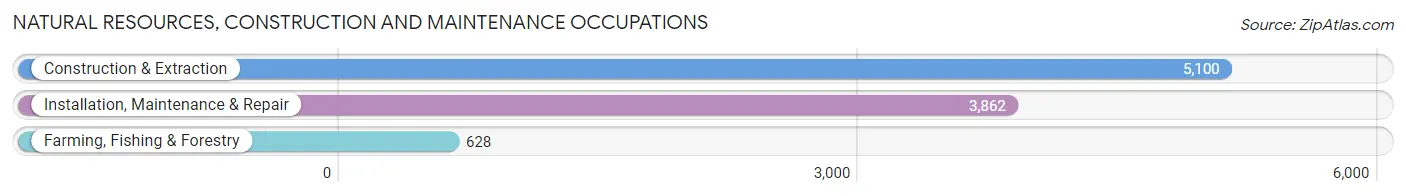
Natural Resources, Construction and Maintenance Occupations
The most common Natural Resources, Construction and Maintenance occupations in Outagamie County are Construction & Extraction (5,100 | 5.0%), Installation, Maintenance & Repair (3,862 | 3.8%), and Farming, Fishing & Forestry (628 | 0.6%).
Natural Resources, Construction and Maintenance Occupations by Sex
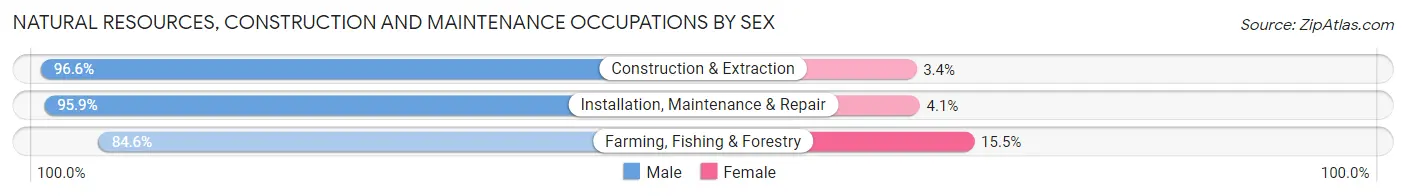
| Occupation | Male | Female |
| Farming, Fishing & Forestry | 531 (84.6%) | 97 (15.4%) |
| Construction & Extraction | 4,927 (96.6%) | 173 (3.4%) |
| Installation, Maintenance & Repair | 3,704 (95.9%) | 158 (4.1%) |
| Total (Category) | 9,162 (95.5%) | 428 (4.5%) |
| Total (Overall) | 54,291 (53.1%) | 48,006 (46.9%) |
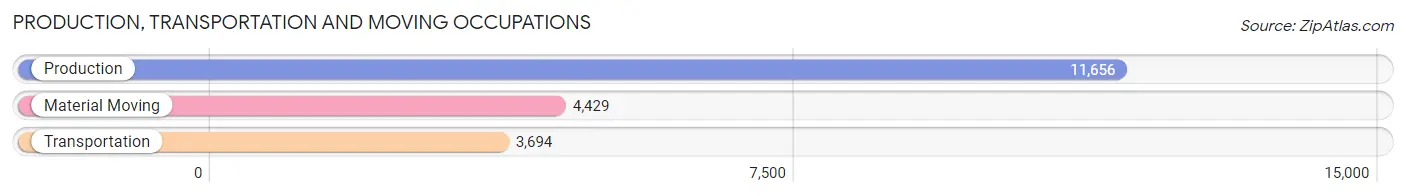
Production, Transportation and Moving Occupations
The most common Production, Transportation and Moving occupations in Outagamie County are Production (11,656 | 11.4%), Material Moving (4,429 | 4.3%), and Transportation (3,694 | 3.6%).
Production, Transportation and Moving Occupations by Sex

| Occupation | Male | Female |
| Production | 8,437 (72.4%) | 3,219 (27.6%) |
| Transportation | 3,154 (85.4%) | 540 (14.6%) |
| Material Moving | 3,064 (69.2%) | 1,365 (30.8%) |
| Total (Category) | 14,655 (74.1%) | 5,124 (25.9%) |
| Total (Overall) | 54,291 (53.1%) | 48,006 (46.9%) |
Employment Industries by Sex in Outagamie County
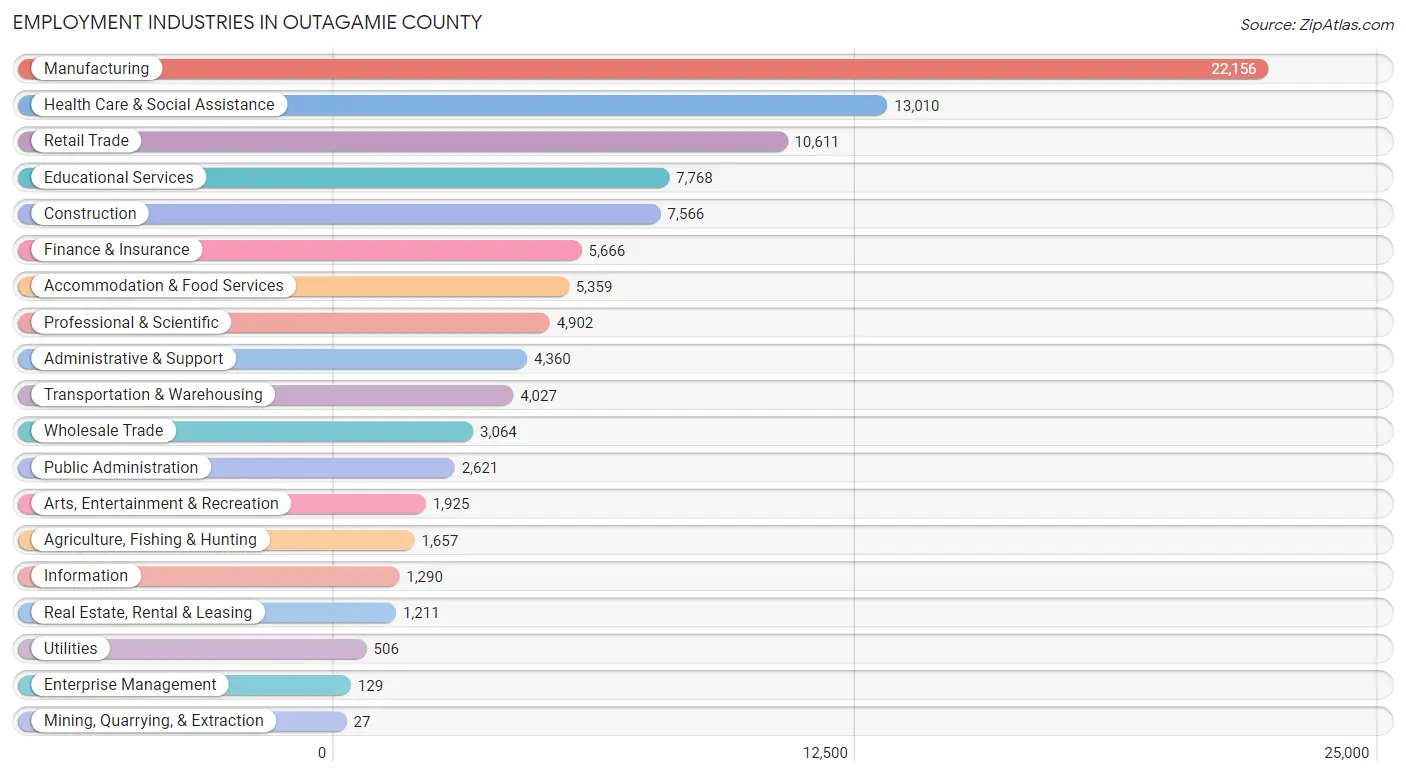
Employment Industries in Outagamie County
The major employment industries in Outagamie County include Manufacturing (22,156 | 21.7%), Health Care & Social Assistance (13,010 | 12.7%), Retail Trade (10,611 | 10.4%), Educational Services (7,768 | 7.6%), and Construction (7,566 | 7.4%).
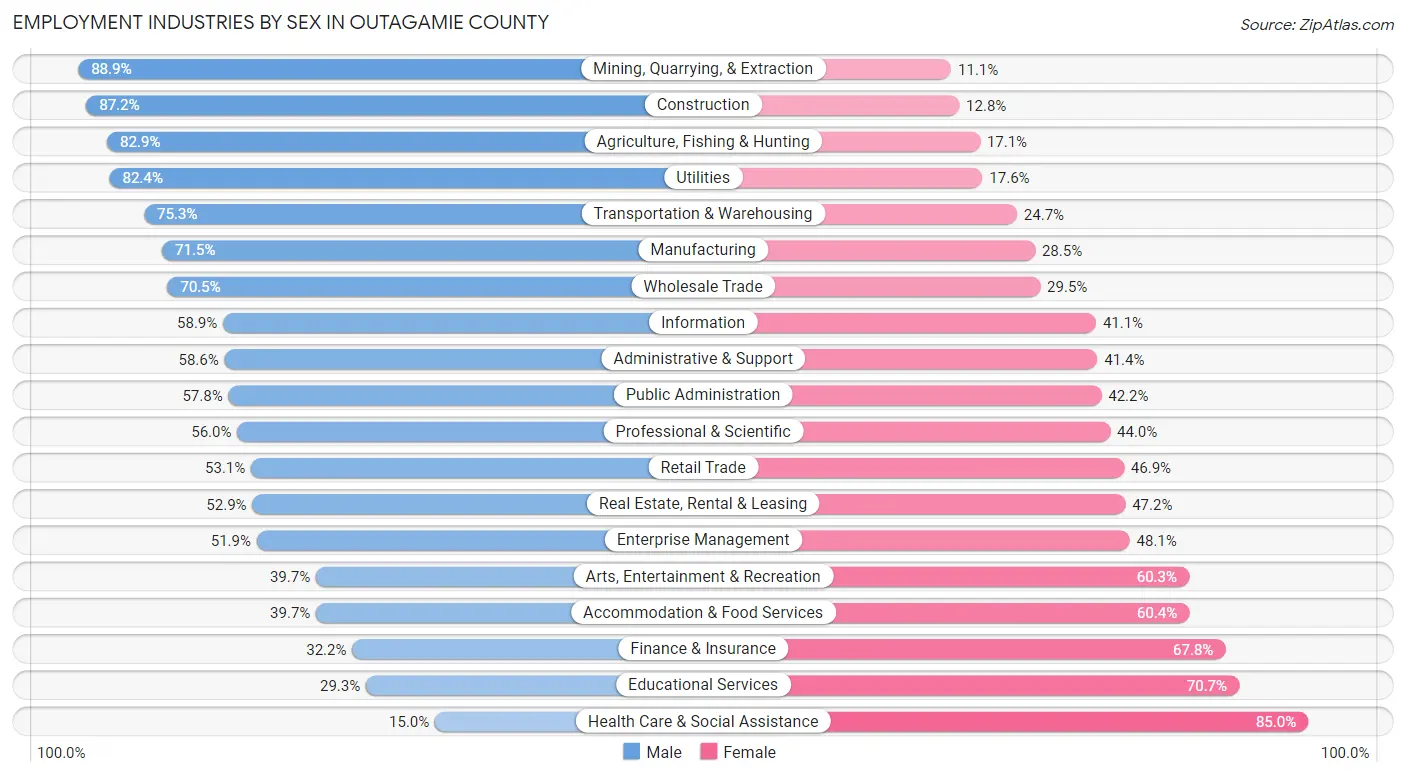
Employment Industries by Sex in Outagamie County
The Outagamie County industries that see more men than women are Mining, Quarrying, & Extraction (88.9%), Construction (87.2%), and Agriculture, Fishing & Hunting (82.9%), whereas the industries that tend to have a higher number of women are Health Care & Social Assistance (85.0%), Educational Services (70.7%), and Finance & Insurance (67.8%).
| Industry | Male | Female |
| Agriculture, Fishing & Hunting | 1,374 (82.9%) | 283 (17.1%) |
| Mining, Quarrying, & Extraction | 24 (88.9%) | 3 (11.1%) |
| Construction | 6,599 (87.2%) | 967 (12.8%) |
| Manufacturing | 15,848 (71.5%) | 6,308 (28.5%) |
| Wholesale Trade | 2,159 (70.5%) | 905 (29.5%) |
| Retail Trade | 5,637 (53.1%) | 4,974 (46.9%) |
| Transportation & Warehousing | 3,031 (75.3%) | 996 (24.7%) |
| Utilities | 417 (82.4%) | 89 (17.6%) |
| Information | 760 (58.9%) | 530 (41.1%) |
| Finance & Insurance | 1,823 (32.2%) | 3,843 (67.8%) |
| Real Estate, Rental & Leasing | 640 (52.8%) | 571 (47.1%) |
| Professional & Scientific | 2,744 (56.0%) | 2,158 (44.0%) |
| Enterprise Management | 67 (51.9%) | 62 (48.1%) |
| Administrative & Support | 2,556 (58.6%) | 1,804 (41.4%) |
| Educational Services | 2,278 (29.3%) | 5,490 (70.7%) |
| Health Care & Social Assistance | 1,955 (15.0%) | 11,055 (85.0%) |
| Arts, Entertainment & Recreation | 764 (39.7%) | 1,161 (60.3%) |
| Accommodation & Food Services | 2,125 (39.7%) | 3,234 (60.4%) |
| Public Administration | 1,515 (57.8%) | 1,106 (42.2%) |
| Total | 54,291 (53.1%) | 48,006 (46.9%) |
Education in Outagamie County
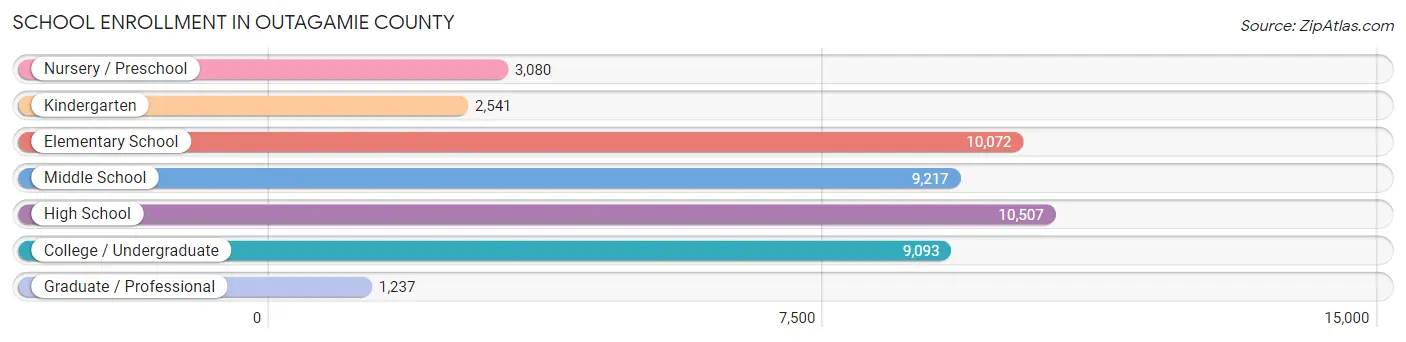
School Enrollment in Outagamie County
The most common levels of schooling among the 45,747 students in Outagamie County are high school (10,507 | 23.0%), elementary school (10,072 | 22.0%), and middle school (9,217 | 20.2%).
| School Level | # Students | % Students |
| Nursery / Preschool | 3,080 | 6.7% |
| Kindergarten | 2,541 | 5.6% |
| Elementary School | 10,072 | 22.0% |
| Middle School | 9,217 | 20.2% |
| High School | 10,507 | 23.0% |
| College / Undergraduate | 9,093 | 19.9% |
| Graduate / Professional | 1,237 | 2.7% |
| Total | 45,747 | 100.0% |
School Enrollment by Age by Funding Source in Outagamie County
Out of a total of 45,747 students who are enrolled in schools in Outagamie County, 8,189 (17.9%) attend a private institution, while the remaining 37,558 (82.1%) are enrolled in public schools. The age group of 3 to 4 year olds has the highest likelihood of being enrolled in private schools, with 691 (32.2% in the age bracket) enrolled. Conversely, the age group of 15 to 17 year olds has the lowest likelihood of being enrolled in a private school, with 6,972 (90.3% in the age bracket) attending a public institution.
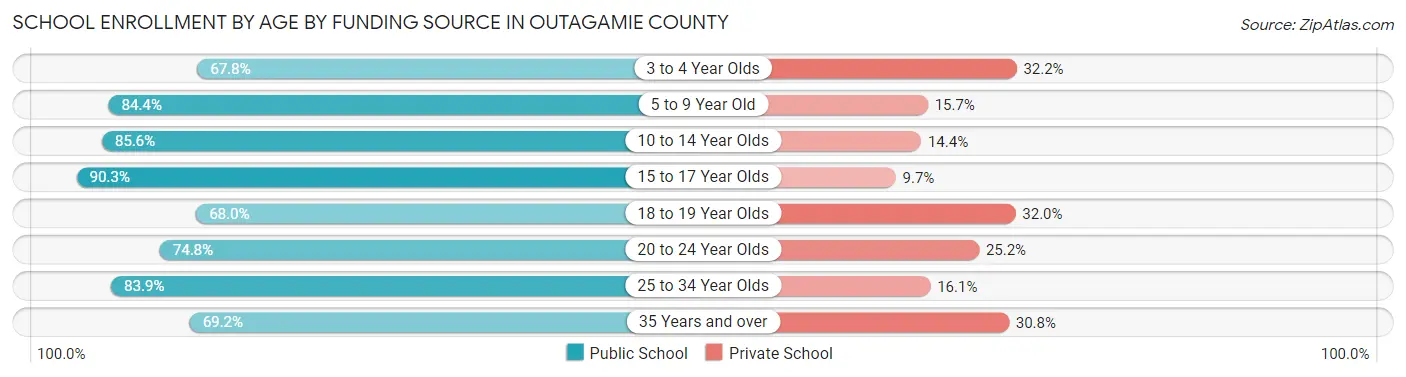
| Age Bracket | Public School | Private School |
| 3 to 4 Year Olds | 1,456 (67.8%) | 691 (32.2%) |
| 5 to 9 Year Old | 10,508 (84.4%) | 1,950 (15.7%) |
| 10 to 14 Year Olds | 9,796 (85.6%) | 1,648 (14.4%) |
| 15 to 17 Year Olds | 6,972 (90.3%) | 747 (9.7%) |
| 18 to 19 Year Olds | 2,348 (68.0%) | 1,104 (32.0%) |
| 20 to 24 Year Olds | 2,957 (74.8%) | 996 (25.2%) |
| 25 to 34 Year Olds | 2,056 (83.9%) | 395 (16.1%) |
| 35 Years and over | 1,470 (69.2%) | 653 (30.8%) |
| Total | 37,558 (82.1%) | 8,189 (17.9%) |
Educational Attainment by Field of Study in Outagamie County
Business (9,816 | 21.7%), education (6,622 | 14.6%), science & technology (4,434 | 9.8%), engineering (3,340 | 7.4%), and arts & humanities (3,157 | 7.0%) are the most common fields of study among 45,272 individuals in Outagamie County who have obtained a bachelor's degree or higher.
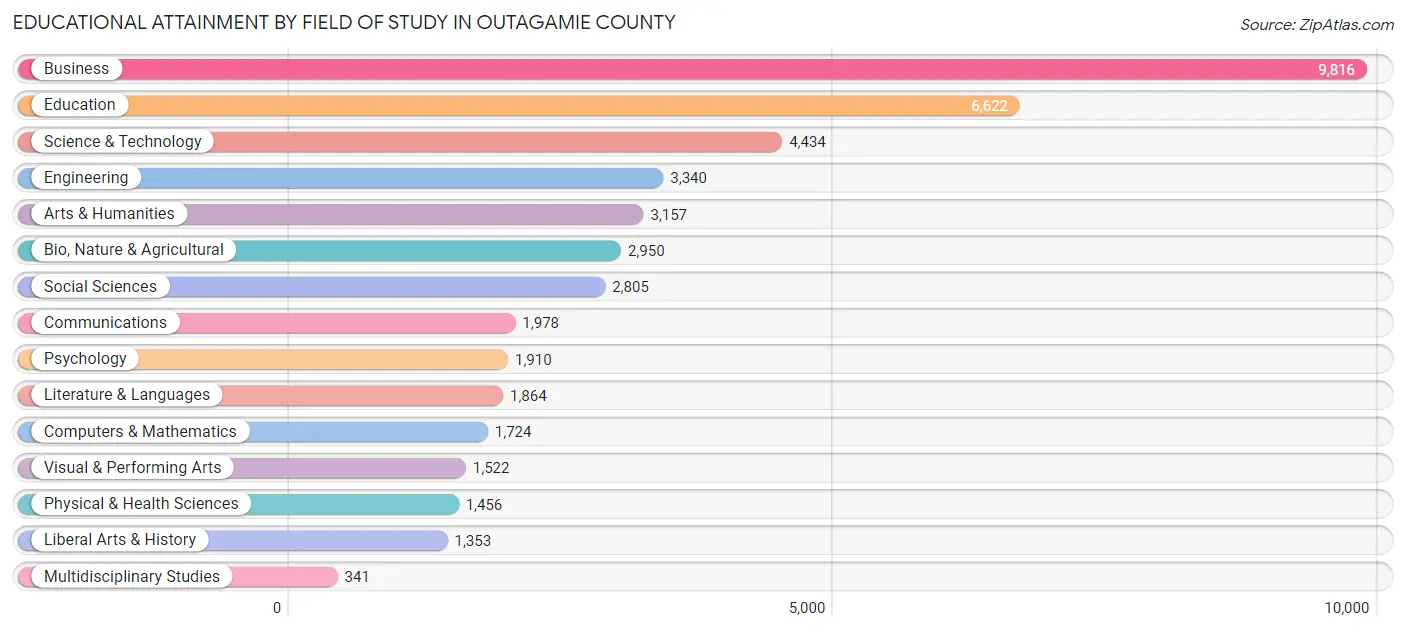
| Field of Study | # Graduates | % Graduates |
| Computers & Mathematics | 1,724 | 3.8% |
| Bio, Nature & Agricultural | 2,950 | 6.5% |
| Physical & Health Sciences | 1,456 | 3.2% |
| Psychology | 1,910 | 4.2% |
| Social Sciences | 2,805 | 6.2% |
| Engineering | 3,340 | 7.4% |
| Multidisciplinary Studies | 341 | 0.7% |
| Science & Technology | 4,434 | 9.8% |
| Business | 9,816 | 21.7% |
| Education | 6,622 | 14.6% |
| Literature & Languages | 1,864 | 4.1% |
| Liberal Arts & History | 1,353 | 3.0% |
| Visual & Performing Arts | 1,522 | 3.4% |
| Communications | 1,978 | 4.4% |
| Arts & Humanities | 3,157 | 7.0% |
| Total | 45,272 | 100.0% |
Transportation & Commute in Outagamie County
Vehicle Availability by Sex in Outagamie County
The most prevalent vehicle ownership categories in Outagamie County are males with 2 vehicles (25,176, accounting for 47.2%) and females with 2 vehicles (22,007, making up 53.7%).
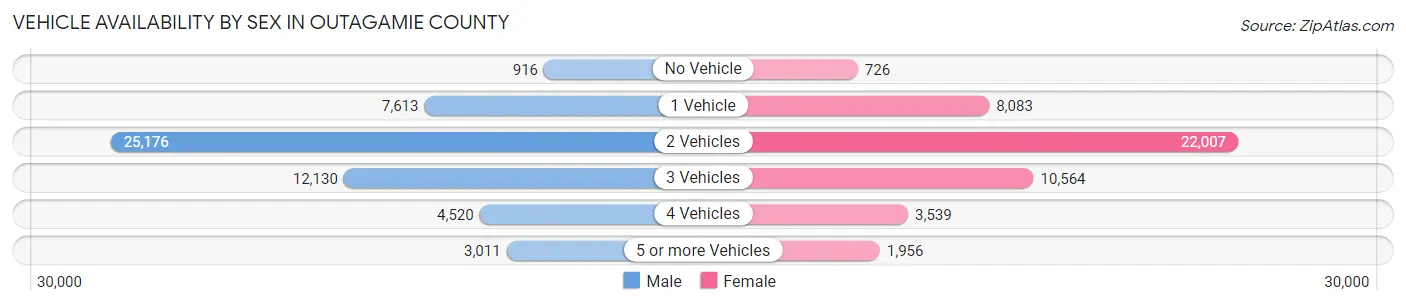
| Vehicles Available | Male | Female |
| No Vehicle | 916 (1.7%) | 726 (1.5%) |
| 1 Vehicle | 7,613 (14.3%) | 8,083 (17.2%) |
| 2 Vehicles | 25,176 (47.2%) | 22,007 (46.9%) |
| 3 Vehicles | 12,130 (22.7%) | 10,564 (22.5%) |
| 4 Vehicles | 4,520 (8.5%) | 3,539 (7.5%) |
| 5 or more Vehicles | 3,011 (5.6%) | 1,956 (4.2%) |
| Total | 53,366 (100.0%) | 46,875 (100.0%) |
Commute Time in Outagamie County
The most frequently occuring commute durations in Outagamie County are 15 to 19 minutes (17,676 commuters, 19.2%), 10 to 14 minutes (16,584 commuters, 18.0%), and 20 to 24 minutes (15,980 commuters, 17.4%).
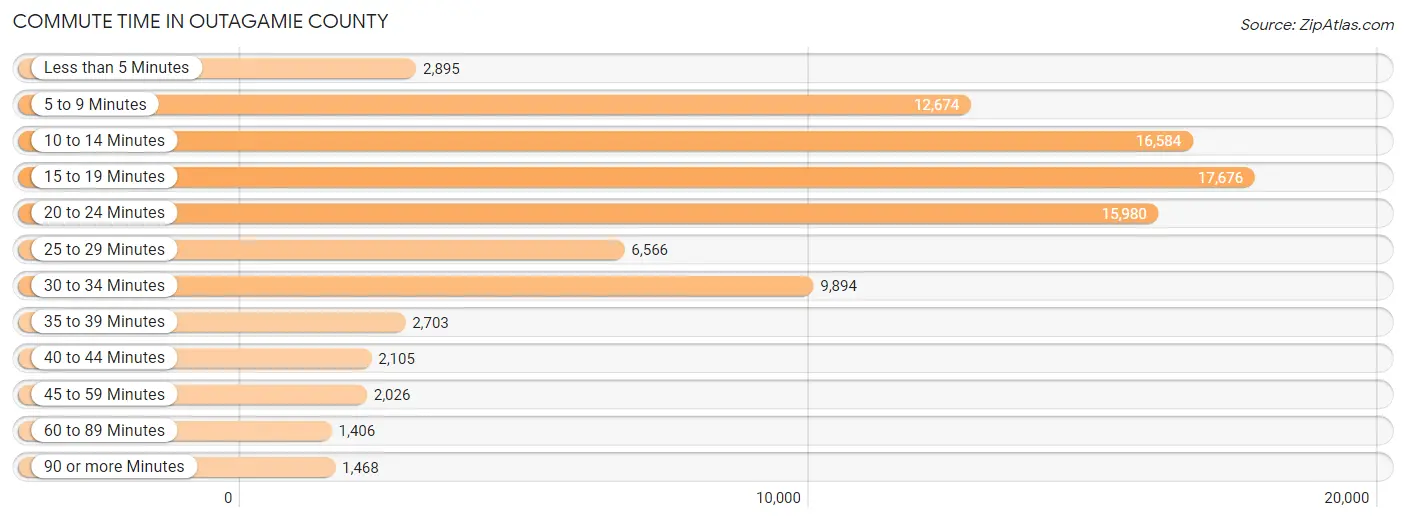
| Commute Time | # Commuters | % Commuters |
| Less than 5 Minutes | 2,895 | 3.2% |
| 5 to 9 Minutes | 12,674 | 13.8% |
| 10 to 14 Minutes | 16,584 | 18.0% |
| 15 to 19 Minutes | 17,676 | 19.2% |
| 20 to 24 Minutes | 15,980 | 17.4% |
| 25 to 29 Minutes | 6,566 | 7.1% |
| 30 to 34 Minutes | 9,894 | 10.8% |
| 35 to 39 Minutes | 2,703 | 2.9% |
| 40 to 44 Minutes | 2,105 | 2.3% |
| 45 to 59 Minutes | 2,026 | 2.2% |
| 60 to 89 Minutes | 1,406 | 1.5% |
| 90 or more Minutes | 1,468 | 1.6% |
Commute Time by Sex in Outagamie County
The most common commute times in Outagamie County are 15 to 19 minutes (9,171 commuters, 18.6%) for males and 10 to 14 minutes (8,563 commuters, 20.1%) for females.
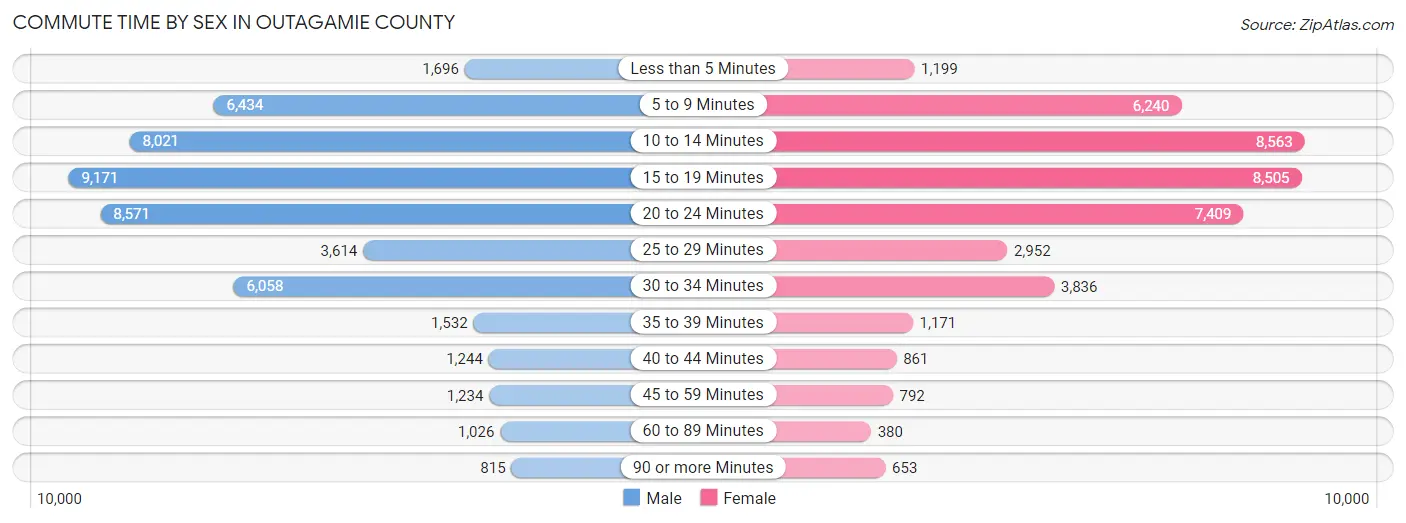
| Commute Time | Male | Female |
| Less than 5 Minutes | 1,696 (3.4%) | 1,199 (2.8%) |
| 5 to 9 Minutes | 6,434 (13.0%) | 6,240 (14.7%) |
| 10 to 14 Minutes | 8,021 (16.2%) | 8,563 (20.1%) |
| 15 to 19 Minutes | 9,171 (18.6%) | 8,505 (20.0%) |
| 20 to 24 Minutes | 8,571 (17.3%) | 7,409 (17.4%) |
| 25 to 29 Minutes | 3,614 (7.3%) | 2,952 (6.9%) |
| 30 to 34 Minutes | 6,058 (12.3%) | 3,836 (9.0%) |
| 35 to 39 Minutes | 1,532 (3.1%) | 1,171 (2.8%) |
| 40 to 44 Minutes | 1,244 (2.5%) | 861 (2.0%) |
| 45 to 59 Minutes | 1,234 (2.5%) | 792 (1.9%) |
| 60 to 89 Minutes | 1,026 (2.1%) | 380 (0.9%) |
| 90 or more Minutes | 815 (1.7%) | 653 (1.5%) |
Time of Departure to Work by Sex in Outagamie County
The most frequent times of departure to work in Outagamie County are 7:00 AM to 7:29 AM (6,358, 12.9%) for males and 7:00 AM to 7:29 AM (7,982, 18.8%) for females.
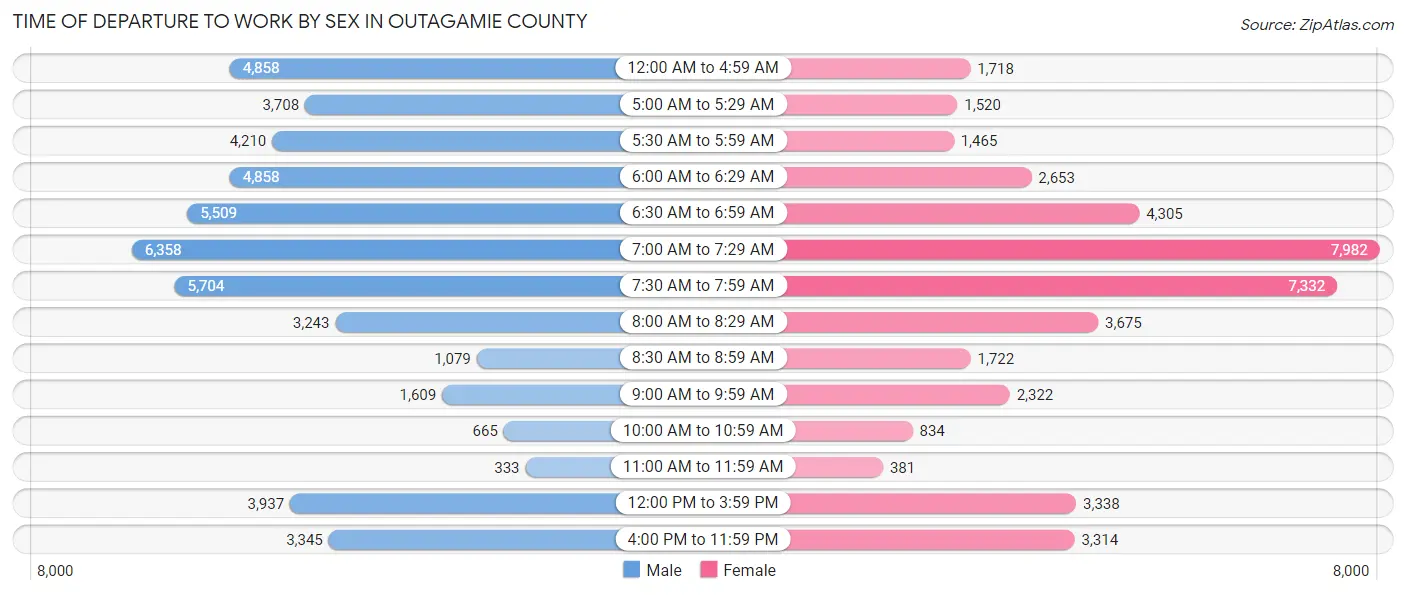
| Time of Departure | Male | Female |
| 12:00 AM to 4:59 AM | 4,858 (9.8%) | 1,718 (4.0%) |
| 5:00 AM to 5:29 AM | 3,708 (7.5%) | 1,520 (3.6%) |
| 5:30 AM to 5:59 AM | 4,210 (8.5%) | 1,465 (3.4%) |
| 6:00 AM to 6:29 AM | 4,858 (9.8%) | 2,653 (6.2%) |
| 6:30 AM to 6:59 AM | 5,509 (11.2%) | 4,305 (10.1%) |
| 7:00 AM to 7:29 AM | 6,358 (12.9%) | 7,982 (18.8%) |
| 7:30 AM to 7:59 AM | 5,704 (11.5%) | 7,332 (17.2%) |
| 8:00 AM to 8:29 AM | 3,243 (6.6%) | 3,675 (8.6%) |
| 8:30 AM to 8:59 AM | 1,079 (2.2%) | 1,722 (4.1%) |
| 9:00 AM to 9:59 AM | 1,609 (3.3%) | 2,322 (5.5%) |
| 10:00 AM to 10:59 AM | 665 (1.3%) | 834 (2.0%) |
| 11:00 AM to 11:59 AM | 333 (0.7%) | 381 (0.9%) |
| 12:00 PM to 3:59 PM | 3,937 (8.0%) | 3,338 (7.8%) |
| 4:00 PM to 11:59 PM | 3,345 (6.8%) | 3,314 (7.8%) |
| Total | 49,416 (100.0%) | 42,561 (100.0%) |
Housing Occupancy in Outagamie County
Occupancy by Ownership in Outagamie County
Of the total 76,646 dwellings in Outagamie County, owner-occupied units account for 54,775 (71.5%), while renter-occupied units make up 21,871 (28.5%).
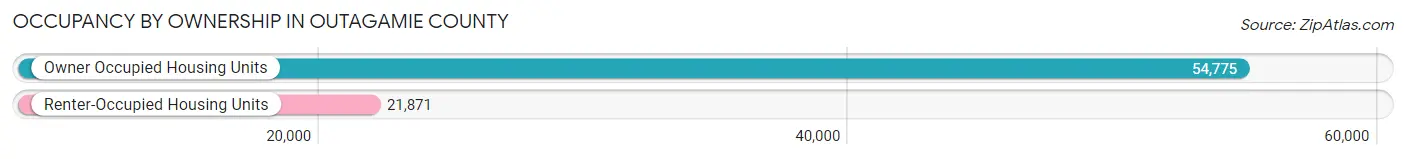
| Occupancy | # Housing Units | % Housing Units |
| Owner Occupied Housing Units | 54,775 | 71.5% |
| Renter-Occupied Housing Units | 21,871 | 28.5% |
| Total Occupied Housing Units | 76,646 | 100.0% |
Occupancy by Household Size in Outagamie County
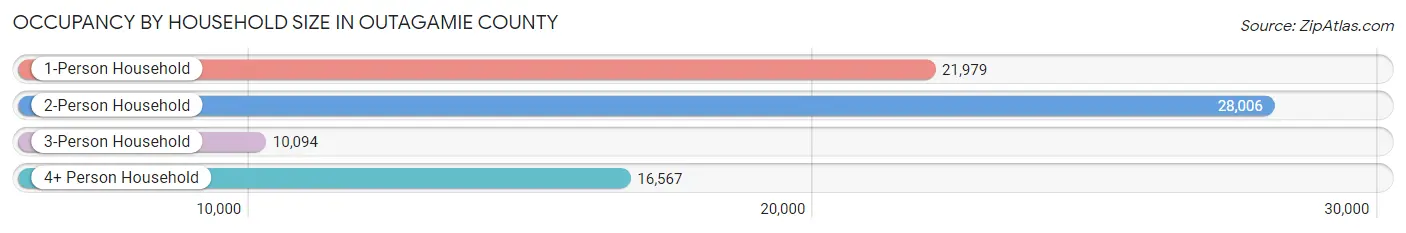
| Household Size | # Housing Units | % Housing Units |
| 1-Person Household | 21,979 | 28.7% |
| 2-Person Household | 28,006 | 36.5% |
| 3-Person Household | 10,094 | 13.2% |
| 4+ Person Household | 16,567 | 21.6% |
| Total Housing Units | 76,646 | 100.0% |
Occupancy by Ownership by Household Size in Outagamie County
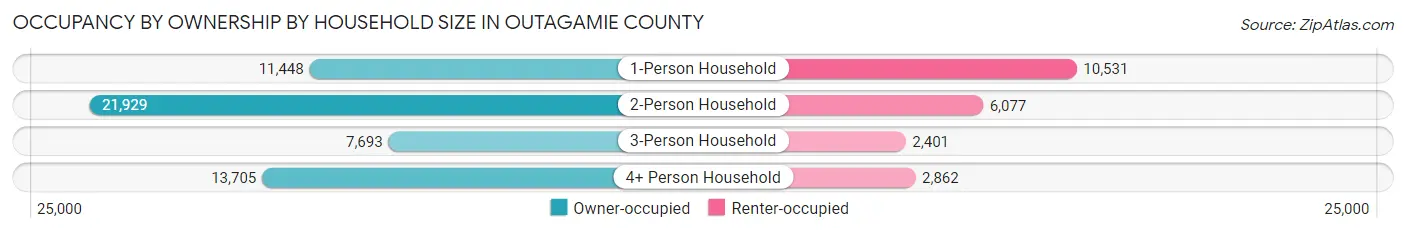
| Household Size | Owner-occupied | Renter-occupied |
| 1-Person Household | 11,448 (52.1%) | 10,531 (47.9%) |
| 2-Person Household | 21,929 (78.3%) | 6,077 (21.7%) |
| 3-Person Household | 7,693 (76.2%) | 2,401 (23.8%) |
| 4+ Person Household | 13,705 (82.7%) | 2,862 (17.3%) |
| Total Housing Units | 54,775 (71.5%) | 21,871 (28.5%) |
Occupancy by Educational Attainment in Outagamie County
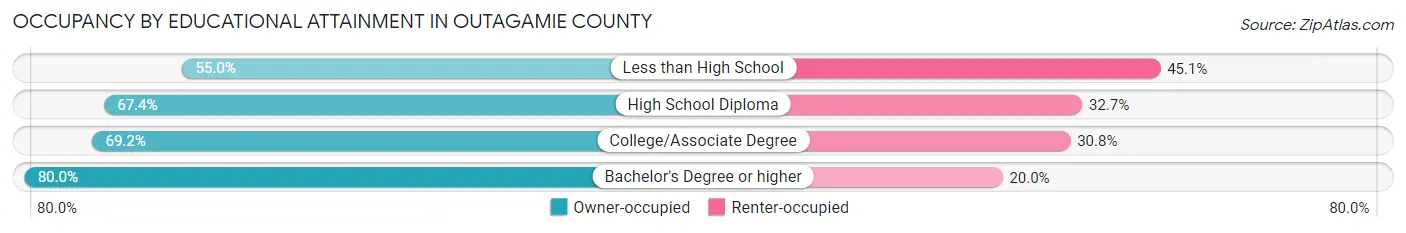
| Household Size | Owner-occupied | Renter-occupied |
| Less than High School | 2,124 (54.9%) | 1,741 (45.1%) |
| High School Diploma | 14,992 (67.3%) | 7,268 (32.7%) |
| College/Associate Degree | 17,658 (69.2%) | 7,852 (30.8%) |
| Bachelor's Degree or higher | 20,001 (80.0%) | 5,010 (20.0%) |
Occupancy by Age of Householder in Outagamie County
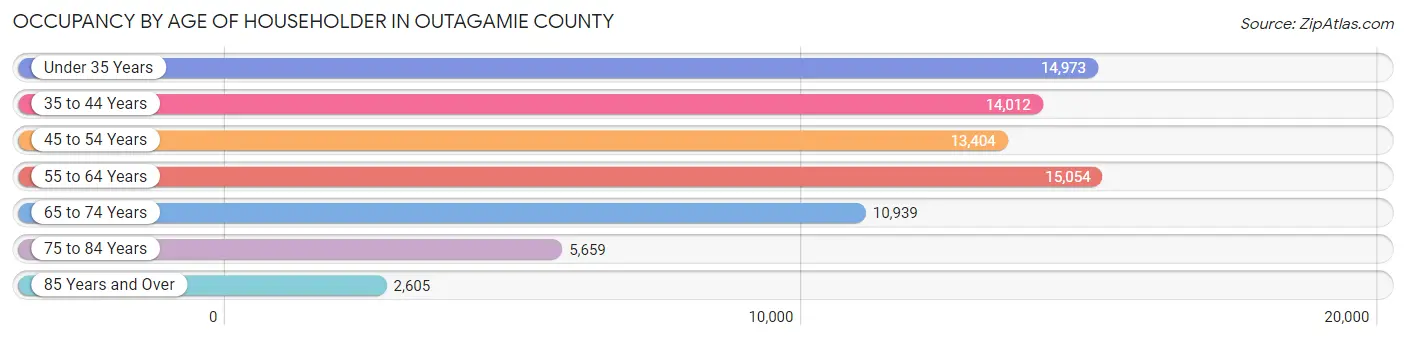
| Age Bracket | # Households | % Households |
| Under 35 Years | 14,973 | 19.5% |
| 35 to 44 Years | 14,012 | 18.3% |
| 45 to 54 Years | 13,404 | 17.5% |
| 55 to 64 Years | 15,054 | 19.6% |
| 65 to 74 Years | 10,939 | 14.3% |
| 75 to 84 Years | 5,659 | 7.4% |
| 85 Years and Over | 2,605 | 3.4% |
| Total | 76,646 | 100.0% |
Housing Finances in Outagamie County
Median Income by Occupancy in Outagamie County
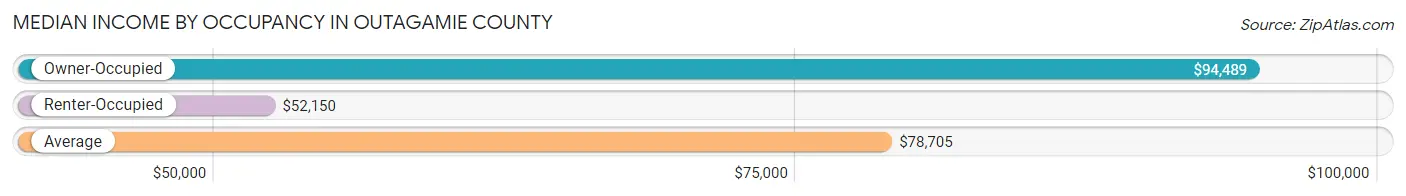
| Occupancy Type | # Households | Median Income |
| Owner-Occupied | 54,775 (71.5%) | $94,489 |
| Renter-Occupied | 21,871 (28.5%) | $52,150 |
| Average | 76,646 (100.0%) | $78,705 |
Occupancy by Householder Income Bracket in Outagamie County
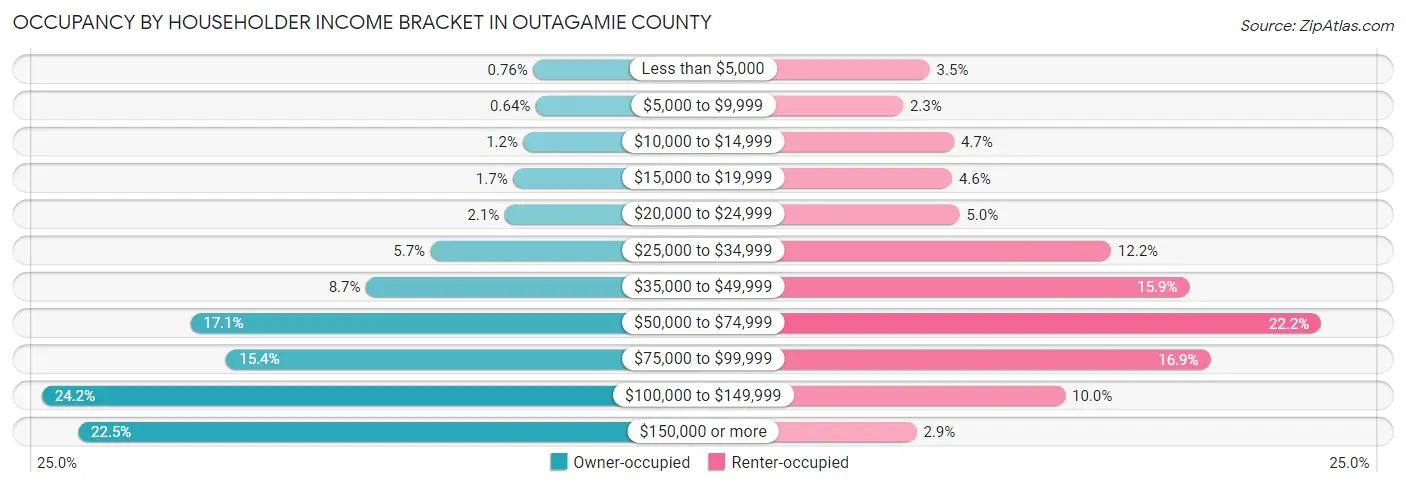
| Income Bracket | Owner-occupied | Renter-occupied |
| Less than $5,000 | 416 (0.8%) | 771 (3.5%) |
| $5,000 to $9,999 | 351 (0.6%) | 494 (2.3%) |
| $10,000 to $14,999 | 674 (1.2%) | 1,025 (4.7%) |
| $15,000 to $19,999 | 942 (1.7%) | 1,003 (4.6%) |
| $20,000 to $24,999 | 1,162 (2.1%) | 1,082 (5.0%) |
| $25,000 to $34,999 | 3,094 (5.7%) | 2,659 (12.2%) |
| $35,000 to $49,999 | 4,783 (8.7%) | 3,475 (15.9%) |
| $50,000 to $74,999 | 9,371 (17.1%) | 4,849 (22.2%) |
| $75,000 to $99,999 | 8,430 (15.4%) | 3,695 (16.9%) |
| $100,000 to $149,999 | 13,247 (24.2%) | 2,183 (10.0%) |
| $150,000 or more | 12,305 (22.5%) | 635 (2.9%) |
| Total | 54,775 (100.0%) | 21,871 (100.0%) |
Monthly Housing Cost Tiers in Outagamie County
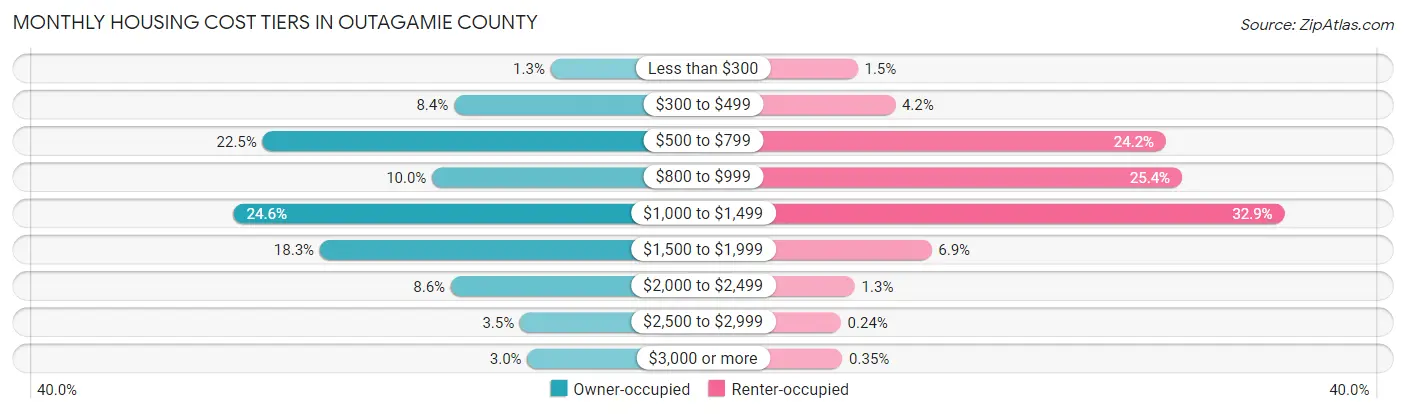
| Monthly Cost | Owner-occupied | Renter-occupied |
| Less than $300 | 684 (1.3%) | 323 (1.5%) |
| $300 to $499 | 4,583 (8.4%) | 928 (4.2%) |
| $500 to $799 | 12,309 (22.5%) | 5,291 (24.2%) |
| $800 to $999 | 5,468 (10.0%) | 5,549 (25.4%) |
| $1,000 to $1,499 | 13,475 (24.6%) | 7,201 (32.9%) |
| $1,500 to $1,999 | 9,999 (18.2%) | 1,513 (6.9%) |
| $2,000 to $2,499 | 4,709 (8.6%) | 277 (1.3%) |
| $2,500 to $2,999 | 1,921 (3.5%) | 52 (0.2%) |
| $3,000 or more | 1,627 (3.0%) | 77 (0.4%) |
| Total | 54,775 (100.0%) | 21,871 (100.0%) |
Physical Housing Characteristics in Outagamie County
Housing Structures in Outagamie County
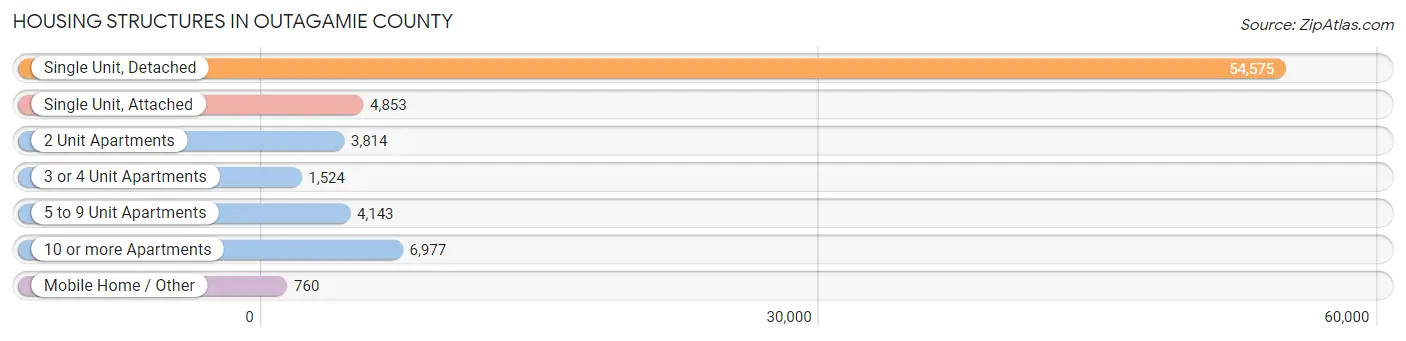
| Structure Type | # Housing Units | % Housing Units |
| Single Unit, Detached | 54,575 | 71.2% |
| Single Unit, Attached | 4,853 | 6.3% |
| 2 Unit Apartments | 3,814 | 5.0% |
| 3 or 4 Unit Apartments | 1,524 | 2.0% |
| 5 to 9 Unit Apartments | 4,143 | 5.4% |
| 10 or more Apartments | 6,977 | 9.1% |
| Mobile Home / Other | 760 | 1.0% |
| Total | 76,646 | 100.0% |
Housing Structures by Occupancy in Outagamie County
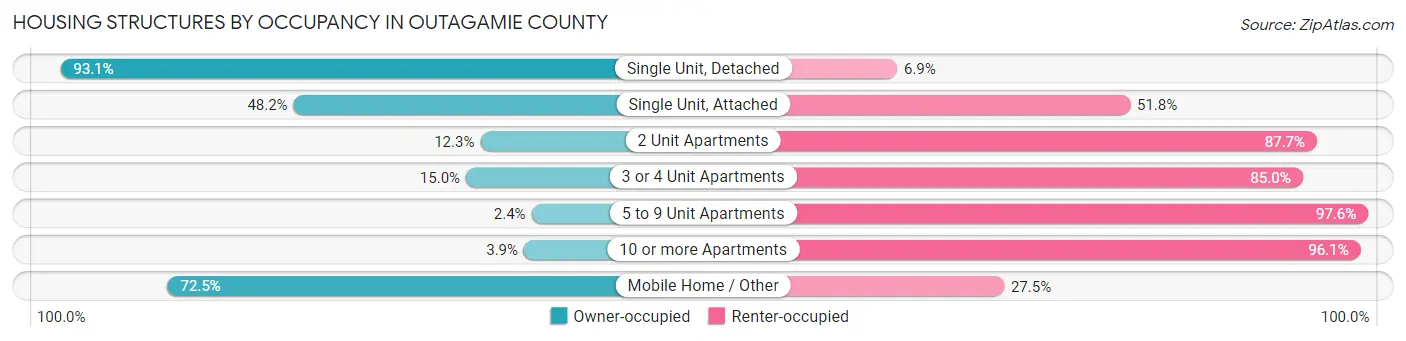
| Structure Type | Owner-occupied | Renter-occupied |
| Single Unit, Detached | 50,816 (93.1%) | 3,759 (6.9%) |
| Single Unit, Attached | 2,341 (48.2%) | 2,512 (51.8%) |
| 2 Unit Apartments | 468 (12.3%) | 3,346 (87.7%) |
| 3 or 4 Unit Apartments | 229 (15.0%) | 1,295 (85.0%) |
| 5 to 9 Unit Apartments | 100 (2.4%) | 4,043 (97.6%) |
| 10 or more Apartments | 270 (3.9%) | 6,707 (96.1%) |
| Mobile Home / Other | 551 (72.5%) | 209 (27.5%) |
| Total | 54,775 (71.5%) | 21,871 (28.5%) |
Housing Structures by Number of Rooms in Outagamie County
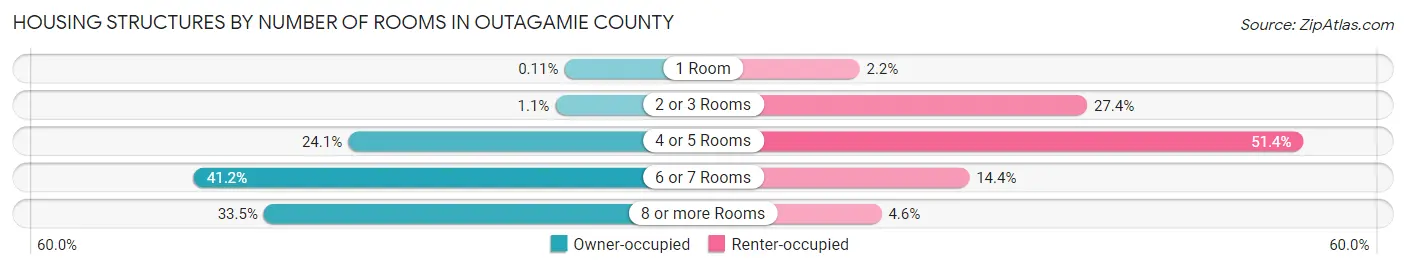
| Number of Rooms | Owner-occupied | Renter-occupied |
| 1 Room | 60 (0.1%) | 476 (2.2%) |
| 2 or 3 Rooms | 609 (1.1%) | 6,000 (27.4%) |
| 4 or 5 Rooms | 13,205 (24.1%) | 11,249 (51.4%) |
| 6 or 7 Rooms | 22,572 (41.2%) | 3,138 (14.3%) |
| 8 or more Rooms | 18,329 (33.5%) | 1,008 (4.6%) |
| Total | 54,775 (100.0%) | 21,871 (100.0%) |
Housing Structure by Heating Type in Outagamie County
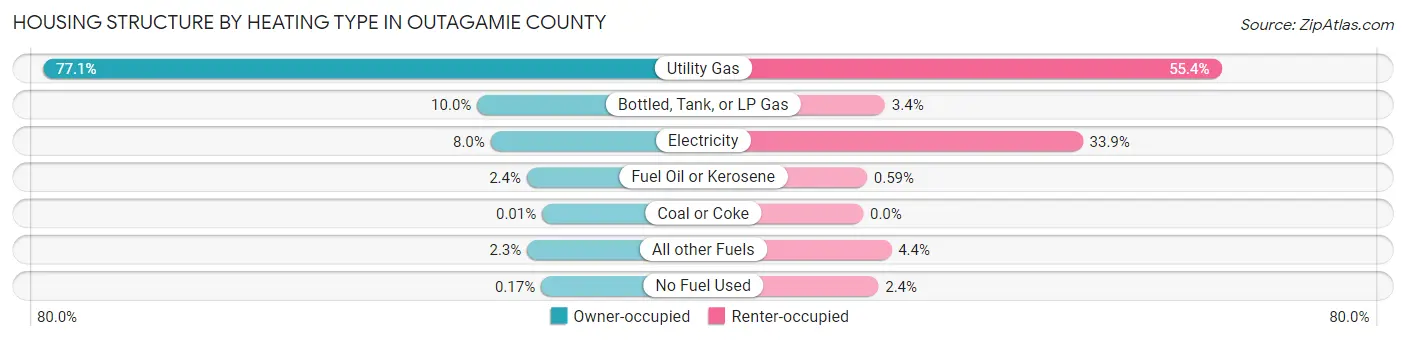
| Heating Type | Owner-occupied | Renter-occupied |
| Utility Gas | 42,246 (77.1%) | 12,111 (55.4%) |
| Bottled, Tank, or LP Gas | 5,502 (10.0%) | 739 (3.4%) |
| Electricity | 4,362 (8.0%) | 7,424 (33.9%) |
| Fuel Oil or Kerosene | 1,293 (2.4%) | 129 (0.6%) |
| Coal or Coke | 8 (0.0%) | 0 (0.0%) |
| All other Fuels | 1,271 (2.3%) | 951 (4.3%) |
| No Fuel Used | 93 (0.2%) | 517 (2.4%) |
| Total | 54,775 (100.0%) | 21,871 (100.0%) |
Household Vehicle Usage in Outagamie County
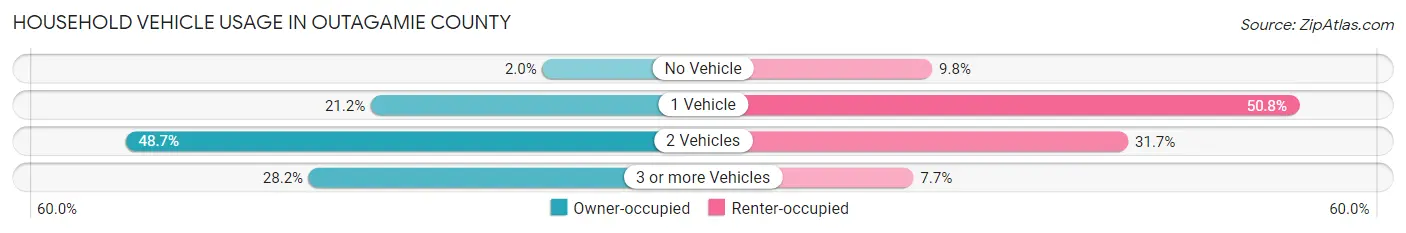
| Vehicles per Household | Owner-occupied | Renter-occupied |
| No Vehicle | 1,083 (2.0%) | 2,136 (9.8%) |
| 1 Vehicle | 11,612 (21.2%) | 11,119 (50.8%) |
| 2 Vehicles | 26,662 (48.7%) | 6,938 (31.7%) |
| 3 or more Vehicles | 15,418 (28.1%) | 1,678 (7.7%) |
| Total | 54,775 (100.0%) | 21,871 (100.0%) |
Real Estate & Mortgages in Outagamie County
Real Estate and Mortgage Overview in Outagamie County
| Characteristic | Without Mortgage | With Mortgage |
| Housing Units | 20,449 | 34,326 |
| Median Property Value | $214,400 | $230,500 |
| Median Household Income | $71,011 | $8,977 |
| Monthly Housing Costs | $611 | $1,543 |
| Real Estate Taxes | $3,439 | $394 |
Property Value by Mortgage Status in Outagamie County
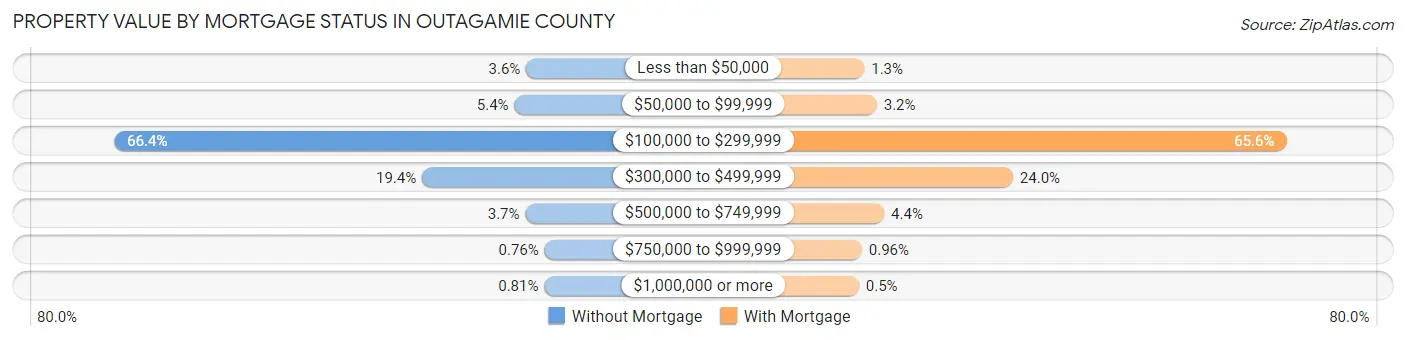
| Property Value | Without Mortgage | With Mortgage |
| Less than $50,000 | 731 (3.6%) | 457 (1.3%) |
| $50,000 to $99,999 | 1,097 (5.4%) | 1,113 (3.2%) |
| $100,000 to $299,999 | 13,570 (66.4%) | 22,527 (65.6%) |
| $300,000 to $499,999 | 3,975 (19.4%) | 8,230 (24.0%) |
| $500,000 to $749,999 | 755 (3.7%) | 1,498 (4.4%) |
| $750,000 to $999,999 | 156 (0.8%) | 328 (1.0%) |
| $1,000,000 or more | 165 (0.8%) | 173 (0.5%) |
| Total | 20,449 (100.0%) | 34,326 (100.0%) |
Household Income by Mortgage Status in Outagamie County
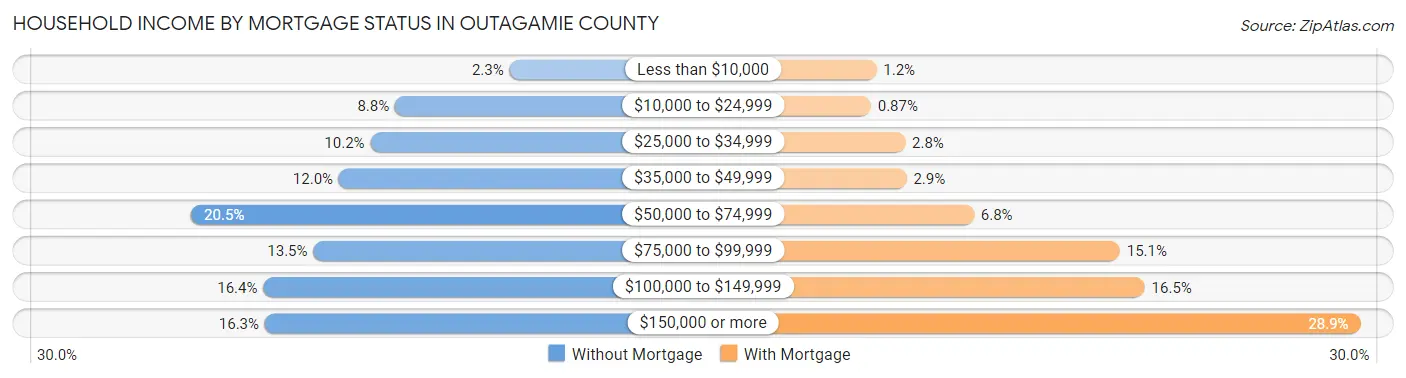
| Household Income | Without Mortgage | With Mortgage |
| Less than $10,000 | 468 (2.3%) | 409 (1.2%) |
| $10,000 to $24,999 | 1,805 (8.8%) | 299 (0.9%) |
| $25,000 to $34,999 | 2,094 (10.2%) | 973 (2.8%) |
| $35,000 to $49,999 | 2,462 (12.0%) | 1,000 (2.9%) |
| $50,000 to $74,999 | 4,187 (20.5%) | 2,321 (6.8%) |
| $75,000 to $99,999 | 2,760 (13.5%) | 5,184 (15.1%) |
| $100,000 to $149,999 | 3,345 (16.4%) | 5,670 (16.5%) |
| $150,000 or more | 3,328 (16.3%) | 9,902 (28.8%) |
| Total | 20,449 (100.0%) | 34,326 (100.0%) |
Property Value to Household Income Ratio in Outagamie County
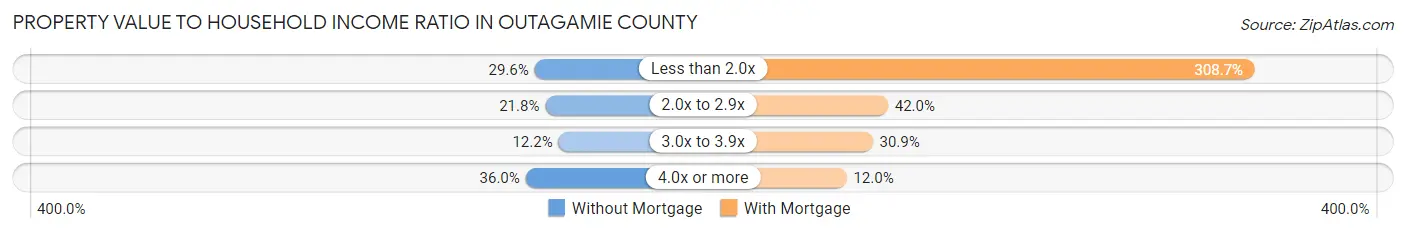
| Value-to-Income Ratio | Without Mortgage | With Mortgage |
| Less than 2.0x | 6,048 (29.6%) | 105,978 (308.7%) |
| 2.0x to 2.9x | 4,454 (21.8%) | 14,425 (42.0%) |
| 3.0x to 3.9x | 2,488 (12.2%) | 10,622 (30.9%) |
| 4.0x or more | 7,370 (36.0%) | 4,130 (12.0%) |
| Total | 20,449 (100.0%) | 34,326 (100.0%) |
Real Estate Taxes by Mortgage Status in Outagamie County
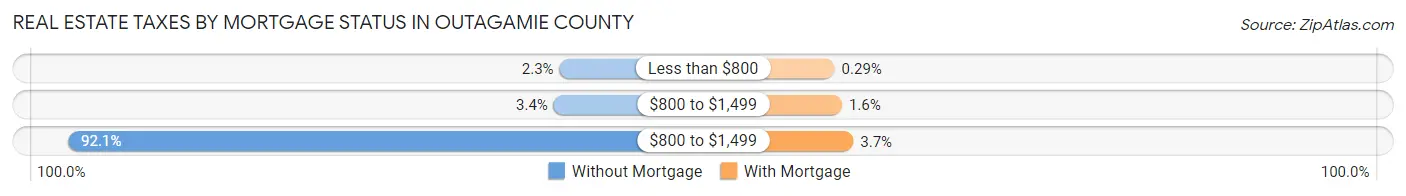
| Property Taxes | Without Mortgage | With Mortgage |
| Less than $800 | 473 (2.3%) | 101 (0.3%) |
| $800 to $1,499 | 688 (3.4%) | 561 (1.6%) |
| $800 to $1,499 | 18,824 (92.0%) | 1,272 (3.7%) |
| Total | 20,449 (100.0%) | 34,326 (100.0%) |
Health & Disability in Outagamie County
Health Insurance Coverage by Age in Outagamie County
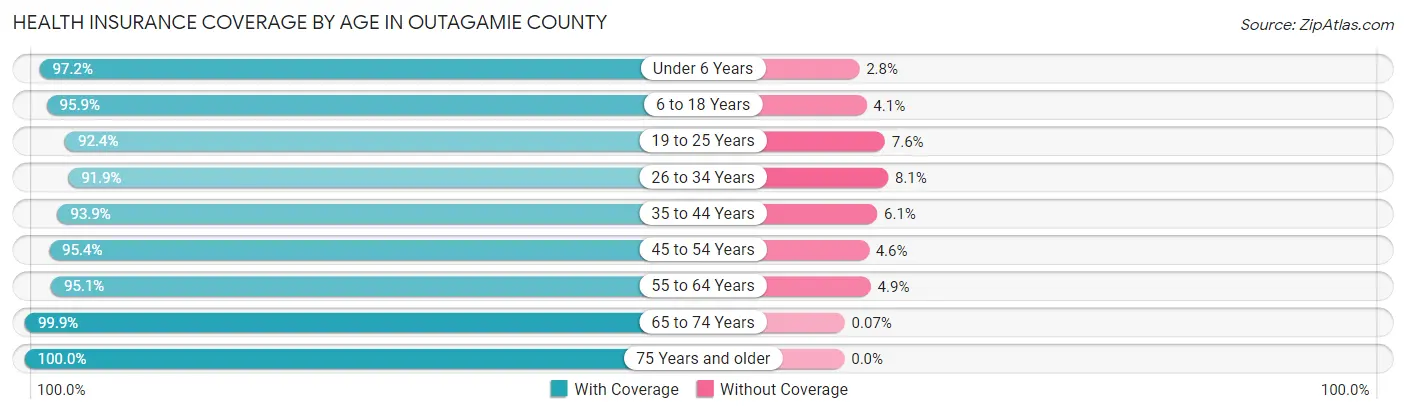
| Age Bracket | With Coverage | Without Coverage |
| Under 6 Years | 13,412 (97.2%) | 384 (2.8%) |
| 6 to 18 Years | 31,328 (95.9%) | 1,347 (4.1%) |
| 19 to 25 Years | 15,011 (92.4%) | 1,227 (7.6%) |
| 26 to 34 Years | 20,427 (91.9%) | 1,809 (8.1%) |
| 35 to 44 Years | 23,834 (93.9%) | 1,555 (6.1%) |
| 45 to 54 Years | 22,686 (95.4%) | 1,085 (4.6%) |
| 55 to 64 Years | 24,739 (95.1%) | 1,280 (4.9%) |
| 65 to 74 Years | 17,428 (99.9%) | 13 (0.1%) |
| 75 Years and older | 11,587 (100.0%) | 0 (0.0%) |
| Total | 180,452 (95.4%) | 8,700 (4.6%) |
Health Insurance Coverage by Citizenship Status in Outagamie County
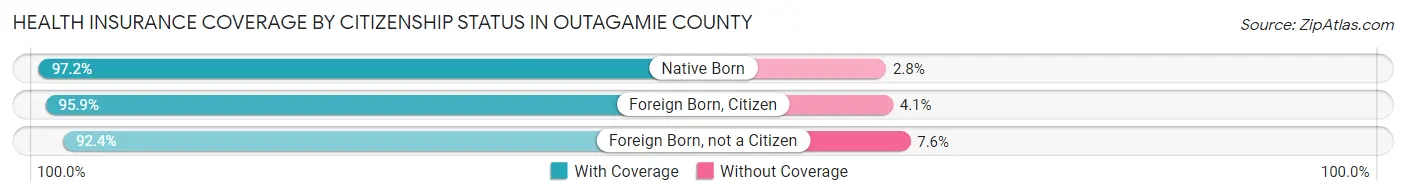
| Citizenship Status | With Coverage | Without Coverage |
| Native Born | 13,412 (97.2%) | 384 (2.8%) |
| Foreign Born, Citizen | 31,328 (95.9%) | 1,347 (4.1%) |
| Foreign Born, not a Citizen | 15,011 (92.4%) | 1,227 (7.6%) |
Health Insurance Coverage by Household Income in Outagamie County
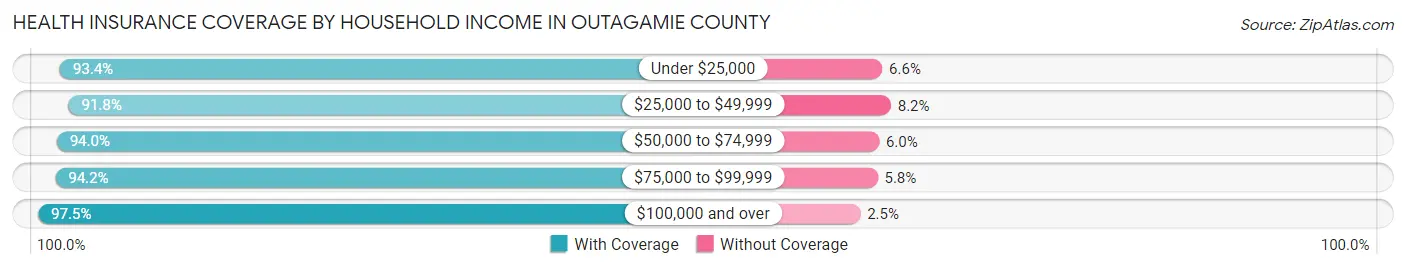
| Household Income | With Coverage | Without Coverage |
| Under $25,000 | 10,693 (93.4%) | 758 (6.6%) |
| $25,000 to $49,999 | 22,580 (91.8%) | 2,029 (8.2%) |
| $50,000 to $74,999 | 28,673 (94.0%) | 1,838 (6.0%) |
| $75,000 to $99,999 | 29,111 (94.2%) | 1,780 (5.8%) |
| $100,000 and over | 87,459 (97.5%) | 2,265 (2.5%) |
Public vs Private Health Insurance Coverage by Age in Outagamie County
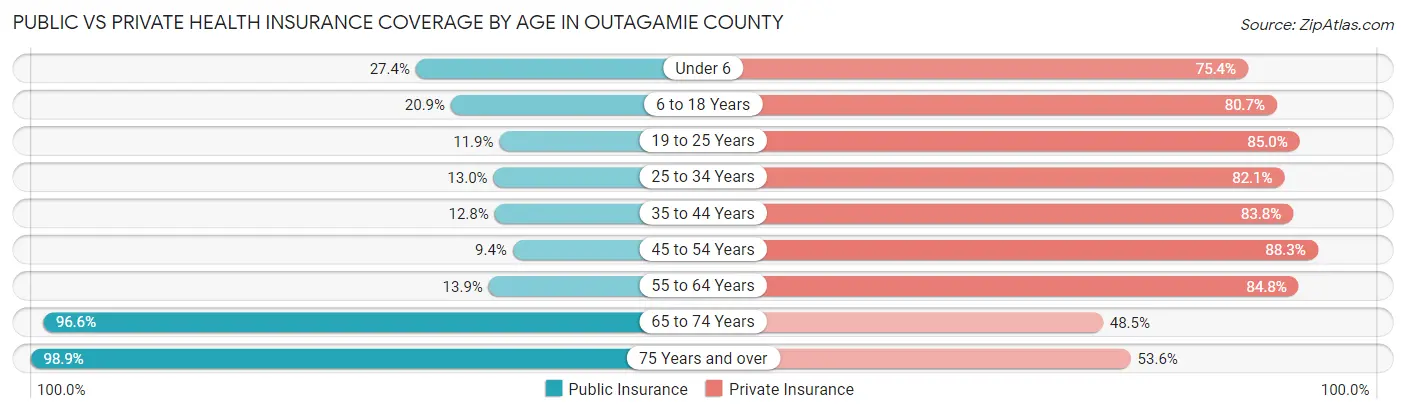
| Age Bracket | Public Insurance | Private Insurance |
| Under 6 | 3,780 (27.4%) | 10,397 (75.4%) |
| 6 to 18 Years | 6,822 (20.9%) | 26,378 (80.7%) |
| 19 to 25 Years | 1,930 (11.9%) | 13,798 (85.0%) |
| 25 to 34 Years | 2,886 (13.0%) | 18,263 (82.1%) |
| 35 to 44 Years | 3,242 (12.8%) | 21,264 (83.8%) |
| 45 to 54 Years | 2,234 (9.4%) | 20,990 (88.3%) |
| 55 to 64 Years | 3,606 (13.9%) | 22,062 (84.8%) |
| 65 to 74 Years | 16,851 (96.6%) | 8,450 (48.4%) |
| 75 Years and over | 11,461 (98.9%) | 6,213 (53.6%) |
| Total | 52,812 (27.9%) | 147,815 (78.1%) |
Disability Status by Sex by Age in Outagamie County
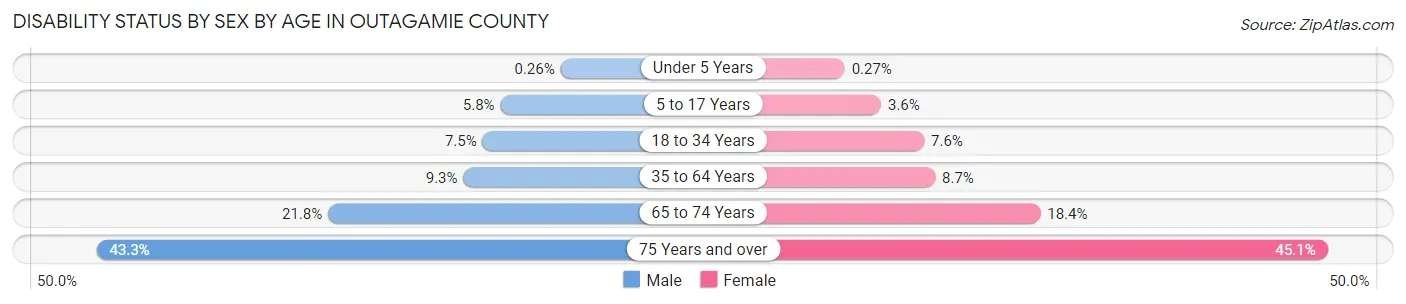
| Age Bracket | Male | Female |
| Under 5 Years | 15 (0.3%) | 15 (0.3%) |
| 5 to 17 Years | 982 (5.8%) | 582 (3.6%) |
| 18 to 34 Years | 1,585 (7.5%) | 1,509 (7.6%) |
| 35 to 64 Years | 3,535 (9.3%) | 3,214 (8.7%) |
| 65 to 74 Years | 1,854 (21.8%) | 1,648 (18.4%) |
| 75 Years and over | 2,090 (43.3%) | 3,049 (45.1%) |
Disability Class by Sex by Age in Outagamie County
Disability Class: Hearing Difficulty
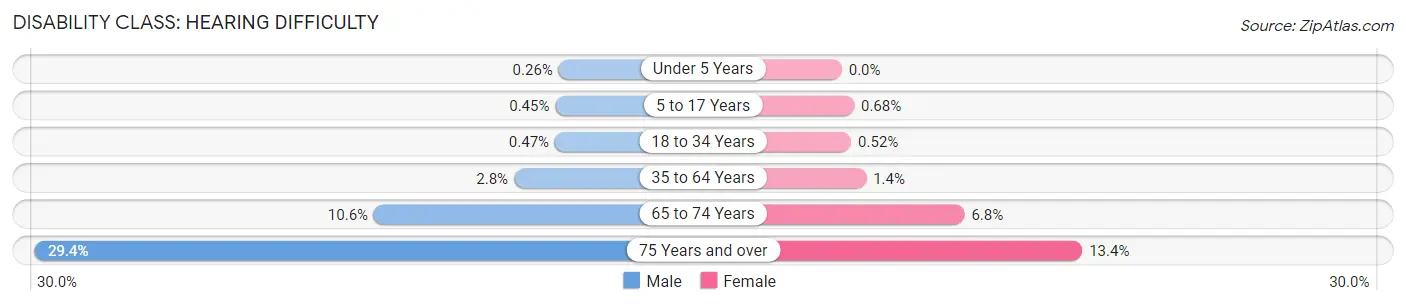
| Age Bracket | Male | Female |
| Under 5 Years | 15 (0.3%) | 0 (0.0%) |
| 5 to 17 Years | 76 (0.4%) | 108 (0.7%) |
| 18 to 34 Years | 100 (0.5%) | 102 (0.5%) |
| 35 to 64 Years | 1,048 (2.8%) | 506 (1.4%) |
| 65 to 74 Years | 896 (10.5%) | 611 (6.8%) |
| 75 Years and over | 1,419 (29.4%) | 906 (13.4%) |
Disability Class: Vision Difficulty
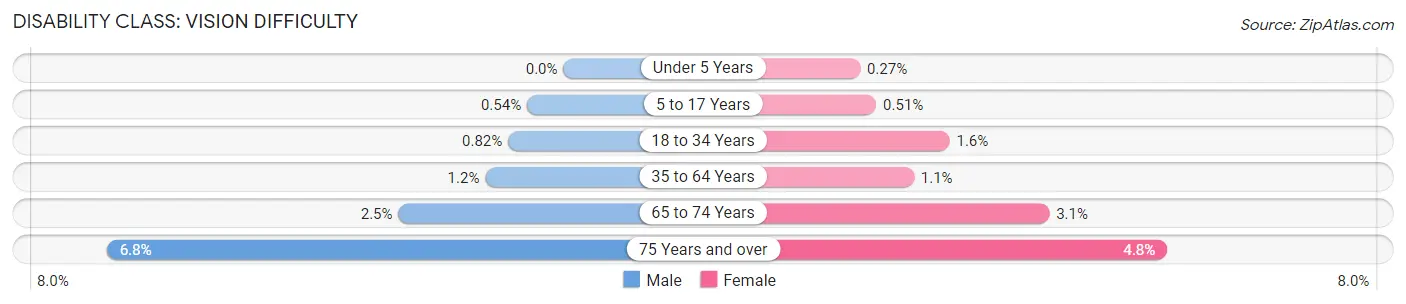
| Age Bracket | Male | Female |
| Under 5 Years | 0 (0.0%) | 15 (0.3%) |
| 5 to 17 Years | 90 (0.5%) | 81 (0.5%) |
| 18 to 34 Years | 174 (0.8%) | 317 (1.6%) |
| 35 to 64 Years | 442 (1.2%) | 398 (1.1%) |
| 65 to 74 Years | 208 (2.5%) | 276 (3.1%) |
| 75 Years and over | 327 (6.8%) | 327 (4.8%) |
Disability Class: Cognitive Difficulty
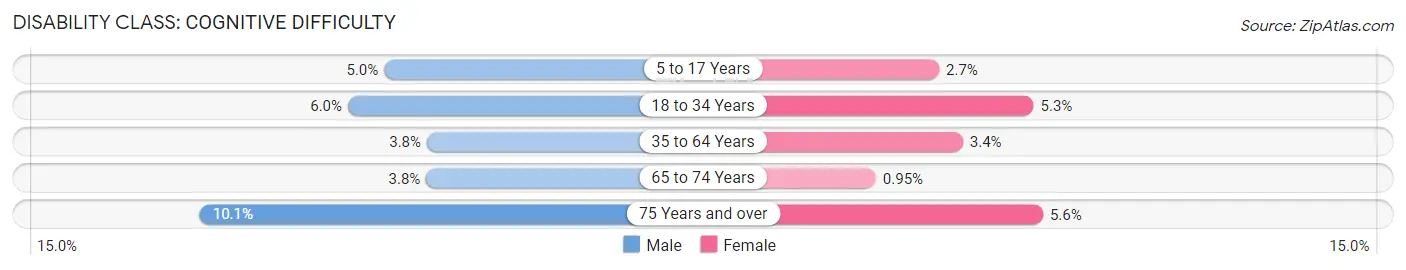
| Age Bracket | Male | Female |
| 5 to 17 Years | 840 (5.0%) | 434 (2.7%) |
| 18 to 34 Years | 1,268 (6.0%) | 1,054 (5.3%) |
| 35 to 64 Years | 1,448 (3.8%) | 1,249 (3.4%) |
| 65 to 74 Years | 324 (3.8%) | 85 (0.9%) |
| 75 Years and over | 488 (10.1%) | 379 (5.6%) |
Disability Class: Ambulatory Difficulty
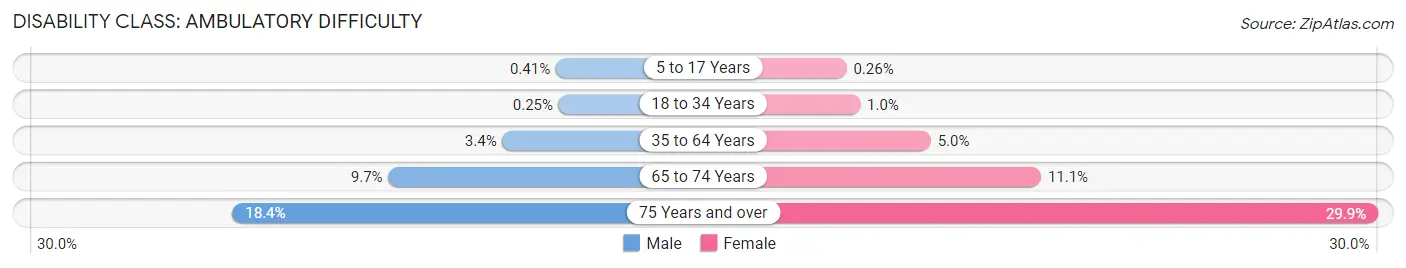
| Age Bracket | Male | Female |
| 5 to 17 Years | 69 (0.4%) | 41 (0.3%) |
| 18 to 34 Years | 52 (0.3%) | 202 (1.0%) |
| 35 to 64 Years | 1,292 (3.4%) | 1,837 (5.0%) |
| 65 to 74 Years | 827 (9.7%) | 992 (11.1%) |
| 75 Years and over | 889 (18.4%) | 2,020 (29.9%) |
Disability Class: Self-Care Difficulty
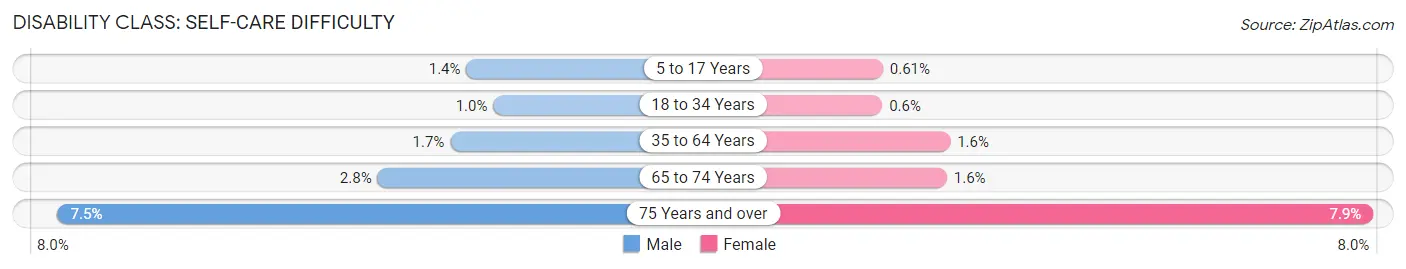
| Age Bracket | Male | Female |
| 5 to 17 Years | 242 (1.4%) | 97 (0.6%) |
| 18 to 34 Years | 219 (1.0%) | 118 (0.6%) |
| 35 to 64 Years | 638 (1.7%) | 598 (1.6%) |
| 65 to 74 Years | 234 (2.8%) | 140 (1.6%) |
| 75 Years and over | 362 (7.5%) | 534 (7.9%) |
Technology Access in Outagamie County
Computing Device Access in Outagamie County
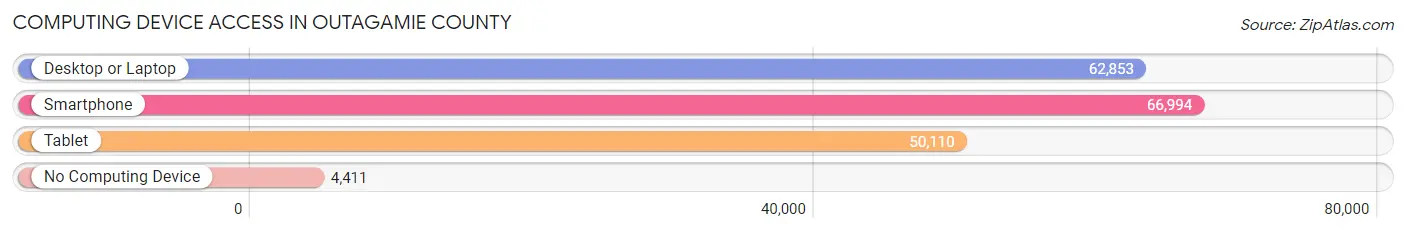
| Device Type | # Households | % Households |
| Desktop or Laptop | 62,853 | 82.0% |
| Smartphone | 66,994 | 87.4% |
| Tablet | 50,110 | 65.4% |
| No Computing Device | 4,411 | 5.8% |
| Total | 76,646 | 100.0% |
Internet Access in Outagamie County
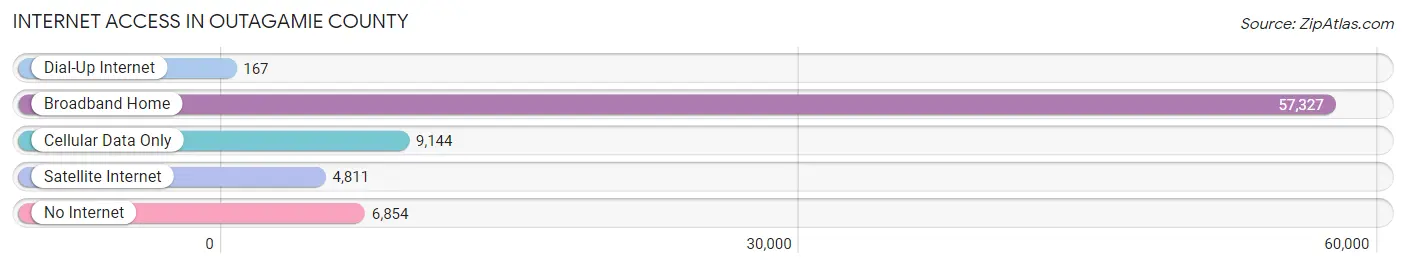
| Internet Type | # Households | % Households |
| Dial-Up Internet | 167 | 0.2% |
| Broadband Home | 57,327 | 74.8% |
| Cellular Data Only | 9,144 | 11.9% |
| Satellite Internet | 4,811 | 6.3% |
| No Internet | 6,854 | 8.9% |
| Total | 76,646 | 100.0% |
Outagamie County Summary
Outagamie County, Wisconsin is located in the northeastern part of the state and is part of the Fox Valley region. It is bordered by Winnebago County to the north, Calumet County to the east, Waupaca County to the south, and Shawano County to the west. The county seat is Appleton, which is also the largest city in the county. Outagamie County has a population of 178,737, making it the 11th most populous county in Wisconsin.
History
Outagamie County was established in 1851 and was named after the Outagamie Indians, who were a branch of the Fox tribe. The county was originally part of Brown County, but was split off due to its large population. The first settlers in the area were French fur traders, who were followed by German and Dutch immigrants. The county was largely agricultural until the late 19th century, when the paper industry began to take off. Appleton was the first city in the county to incorporate, in 1857.
Geography
Outagamie County covers an area of 845 square miles and is located in the Fox Valley region of Wisconsin. The Fox River runs through the county, and there are several lakes, including Lake Winnebago, Little Lake Butte des Morts, and Lake Poygan. The terrain is mostly flat, with some rolling hills in the western part of the county. The highest point in the county is located in the town of Freedom, at an elevation of 1,039 feet.
Economy
Outagamie County has a diverse economy, with a mix of manufacturing, retail, and service industries. The largest employers in the county are the Appleton Area School District, the City of Appleton, and the Outagamie County government. The paper industry is a major employer in the county, with several paper mills located in the area. Other major industries include healthcare, education, and tourism.
Demographics
As of the 2010 census, Outagamie County had a population of 178,737. The racial makeup of the county was 90.2% White, 4.2% Hispanic or Latino, 2.3% Black or African American, 1.7% Asian, and 1.6% Native American. The median household income was $54,845, and the median family income was $67,845. The per capita income was $27,845.
Outagamie County is home to several colleges and universities, including the University of Wisconsin-Fox Valley, Fox Valley Technical College, and Lawrence University. The county is also home to several museums, including the History Museum at the Castle, the Hearthstone Historic House Museum, and the Trout Museum of Art.
Outagamie County is a vibrant and diverse community, with a strong economy and a rich history. It is home to a variety of industries, educational institutions, and cultural attractions, making it an ideal place to live and work.
Common Questions
What is the Total Population of Outagamie County?
Total Population of Outagamie County is 190,611.
What is the Total Male Population of Outagamie County?
Total Male Population of Outagamie County is 95,875.
What is the Total Female Population of Outagamie County?
Total Female Population of Outagamie County is 94,736.
What is the Ratio of Males per 100 Females in Outagamie County?
There are 101.20 Males per 100 Females in Outagamie County.
What is the Ratio of Females per 100 Males in Outagamie County?
There are 98.81 Females per 100 Males in Outagamie County.
What is the Median Population Age in Outagamie County?
Median Population Age in Outagamie County is 38.5 Years.
What is the Average Family Size in Outagamie County
Average Family Size in Outagamie County is 3.0 People.
What is the Average Household Size in Outagamie County
Average Household Size in Outagamie County is 2.4 People.
What is Per Capita Income in Outagamie County?
Per Capita income in Outagamie County is $42,923.
What is the Median Family Income in Outagamie County?
Median Family Income in Outagamie County is $99,144.
What is the Median Household income in Outagamie County?
Median Household Income in Outagamie County is $78,705.
What is Income or Wage Gap in Outagamie County?
Income or Wage Gap in Outagamie County is 34.6%.
Women in Outagamie County earn 65.4 cents for every dollar earned by a man.
What is Family Income Deficit in Outagamie County?
Family Income Deficit in Outagamie County is $8,641.
Families that are below poverty line in Outagamie County earn $8,641 less on average than the poverty threshold level.
What is Inequality or Gini Index in Outagamie County?
Inequality or Gini Index in Outagamie County is 0.44.
How Large is the Labor Force in Outagamie County?
There are 105,698 People in the Labor Forcein in Outagamie County.
What is the Percentage of People in the Labor Force in Outagamie County?
69.7% of People are in the Labor Force in Outagamie County.
What is the Unemployment Rate in Outagamie County?
Unemployment Rate in Outagamie County is 3.1%.