Oconto County, WI
Oconto County Map
Oconto County Overview
39,048
TOTAL POPULATION
20,030
MALE POPULATION
19,018
FEMALE POPULATION
105.32
MALES / 100 FEMALES
94.95
FEMALES / 100 MALES
47.5
MEDIAN AGE
2.8
AVG FAMILY SIZE
2.4
AVG HOUSEHOLD SIZE
$37,124
PER CAPITA INCOME
$88,202
AVG FAMILY INCOME
$73,611
AVG HOUSEHOLD INCOME
34.7%
WAGE / INCOME GAP [ % ]
65.3¢/ $1
WAGE / INCOME GAP [ $ ]
$8,820
FAMILY INCOME DEFICIT
0.39
INEQUALITY / GINI INDEX
19,570
LABOR FORCE [ PEOPLE ]
60.6%
PERCENT IN LABOR FORCE
2.0%
UNEMPLOYMENT RATE
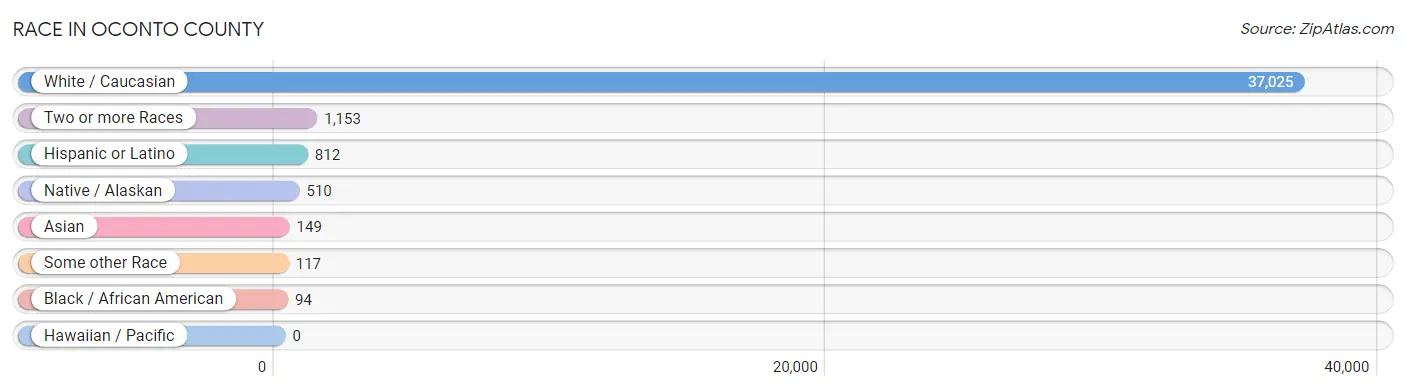
Race in Oconto County
The most populous races in Oconto County are White / Caucasian (37,025 | 94.8%), Two or more Races (1,153 | 2.9%), and Hispanic or Latino (812 | 2.1%).
| Race | # Population | % Population |
| Asian | 149 | 0.4% |
| Black / African American | 94 | 0.2% |
| Hawaiian / Pacific | 0 | 0.0% |
| Hispanic or Latino | 812 | 2.1% |
| Native / Alaskan | 510 | 1.3% |
| White / Caucasian | 37,025 | 94.8% |
| Two or more Races | 1,153 | 2.9% |
| Some other Race | 117 | 0.3% |
| Total | 39,048 | 100.0% |
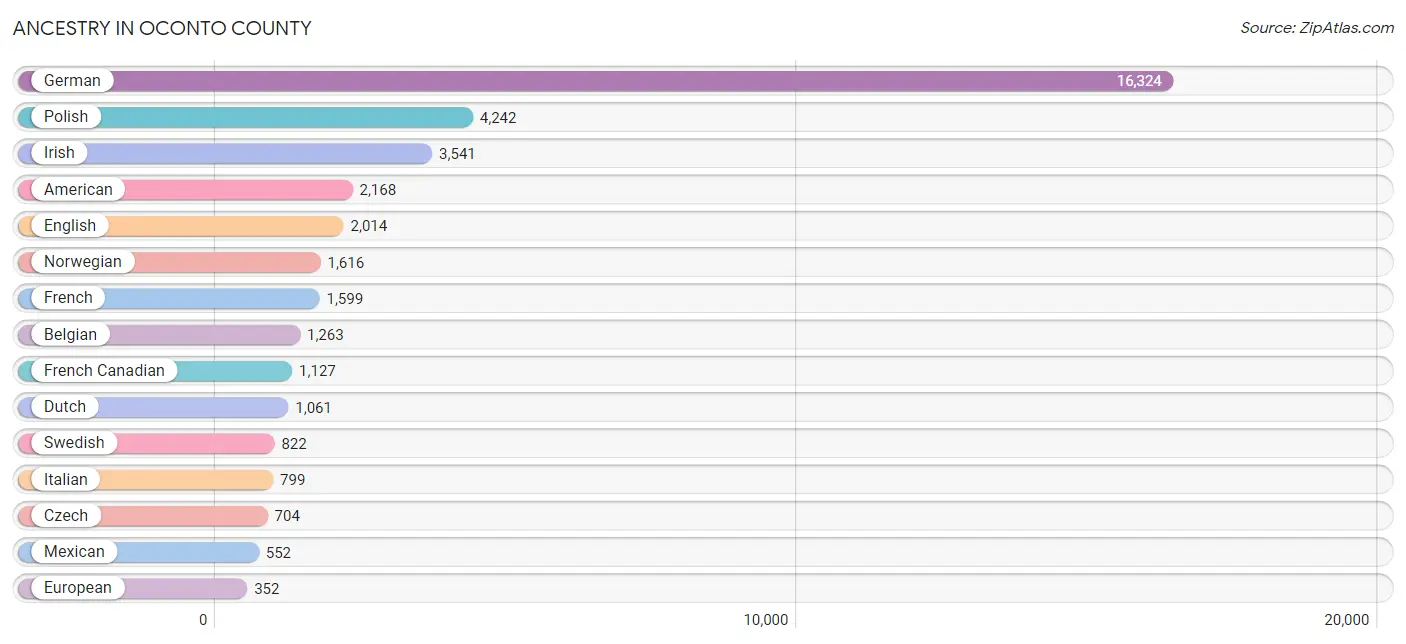
Ancestry in Oconto County
The most populous ancestries reported in Oconto County are German (16,324 | 41.8%), Polish (4,242 | 10.9%), Irish (3,541 | 9.1%), American (2,168 | 5.6%), and English (2,014 | 5.2%), together accounting for 72.4% of all Oconto County residents.
| Ancestry | # Population | % Population |
| African | 30 | 0.1% |
| American | 2,168 | 5.6% |
| Arab | 15 | 0.0% |
| Armenian | 17 | 0.0% |
| Australian | 5 | 0.0% |
| Austrian | 57 | 0.2% |
| Bangladeshi | 76 | 0.2% |
| Belgian | 1,263 | 3.2% |
| Belizean | 26 | 0.1% |
| Bhutanese | 20 | 0.1% |
| Blackfeet | 2 | 0.0% |
| British | 73 | 0.2% |
| Bulgarian | 4 | 0.0% |
| Burmese | 1 | 0.0% |
| Canadian | 67 | 0.2% |
| Central American | 111 | 0.3% |
| Central American Indian | 3 | 0.0% |
| Cherokee | 8 | 0.0% |
| Cheyenne | 1 | 0.0% |
| Chippewa | 230 | 0.6% |
| Croatian | 29 | 0.1% |
| Cuban | 12 | 0.0% |
| Czech | 704 | 1.8% |
| Czechoslovakian | 36 | 0.1% |
| Danish | 287 | 0.7% |
| Dominican | 4 | 0.0% |
| Dutch | 1,061 | 2.7% |
| Dutch West Indian | 4 | 0.0% |
| Eastern European | 104 | 0.3% |
| Egyptian | 7 | 0.0% |
| English | 2,014 | 5.2% |
| Ethiopian | 28 | 0.1% |
| European | 352 | 0.9% |
| Filipino | 13 | 0.0% |
| Finnish | 199 | 0.5% |
| French | 1,599 | 4.1% |
| French Canadian | 1,127 | 2.9% |
| German | 16,324 | 41.8% |
| Greek | 69 | 0.2% |
| Guatemalan | 28 | 0.1% |
| Honduran | 9 | 0.0% |
| Hungarian | 71 | 0.2% |
| Icelander | 1 | 0.0% |
| Indian (Asian) | 93 | 0.2% |
| Indonesian | 2 | 0.0% |
| Inupiat | 9 | 0.0% |
| Irish | 3,541 | 9.1% |
| Iroquois | 107 | 0.3% |
| Israeli | 24 | 0.1% |
| Italian | 799 | 2.1% |
| Korean | 71 | 0.2% |
| Laotian | 6 | 0.0% |
| Latvian | 7 | 0.0% |
| Lebanese | 8 | 0.0% |
| Lithuanian | 67 | 0.2% |
| Luxembourger | 25 | 0.1% |
| Maltese | 2 | 0.0% |
| Menominee | 144 | 0.4% |
| Mexican | 552 | 1.4% |
| Mexican American Indian | 2 | 0.0% |
| Native Hawaiian | 17 | 0.0% |
| Navajo | 3 | 0.0% |
| Northern European | 113 | 0.3% |
| Norwegian | 1,616 | 4.1% |
| Ottawa | 15 | 0.0% |
| Pennsylvania German | 3 | 0.0% |
| Peruvian | 1 | 0.0% |
| Polish | 4,242 | 10.9% |
| Potawatomi | 120 | 0.3% |
| Puerto Rican | 58 | 0.2% |
| Romanian | 7 | 0.0% |
| Russian | 233 | 0.6% |
| Salvadoran | 74 | 0.2% |
| Scandinavian | 80 | 0.2% |
| Scotch-Irish | 114 | 0.3% |
| Scottish | 285 | 0.7% |
| Serbian | 4 | 0.0% |
| Sioux | 39 | 0.1% |
| Slavic | 6 | 0.0% |
| Slovak | 71 | 0.2% |
| Slovene | 43 | 0.1% |
| South American | 1 | 0.0% |
| Spaniard | 22 | 0.1% |
| Spanish | 45 | 0.1% |
| Subsaharan African | 58 | 0.2% |
| Swedish | 822 | 2.1% |
| Swiss | 135 | 0.4% |
| Thai | 12 | 0.0% |
| Tlingit-Haida | 8 | 0.0% |
| Ukrainian | 43 | 0.1% |
| Welsh | 116 | 0.3% |
| Yaqui | 6 | 0.0% |
| Yugoslavian | 10 | 0.0% | View All 93 Rows |
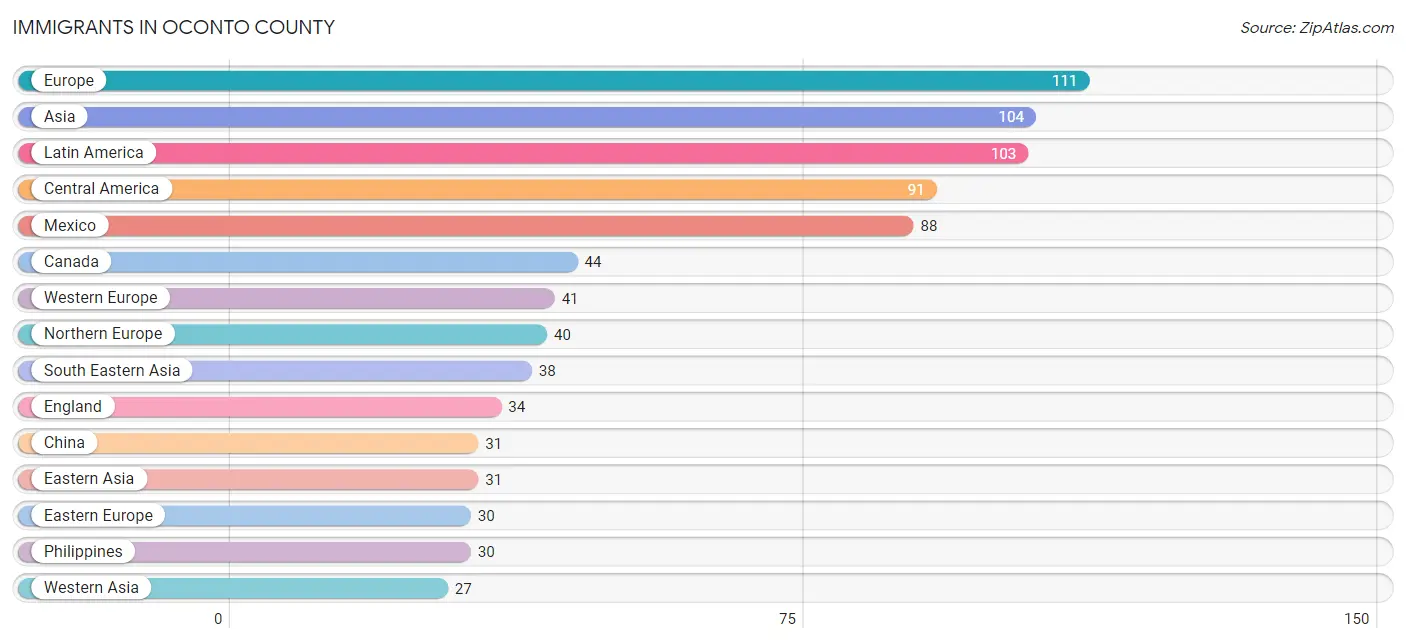
Immigrants in Oconto County
The most numerous immigrant groups reported in Oconto County came from Europe (111 | 0.3%), Asia (104 | 0.3%), Latin America (103 | 0.3%), Central America (91 | 0.2%), and Mexico (88 | 0.2%), together accounting for 1.3% of all Oconto County residents.
| Immigration Origin | # Population | % Population |
| Asia | 104 | 0.3% |
| Australia | 5 | 0.0% |
| Austria | 7 | 0.0% |
| Bulgaria | 2 | 0.0% |
| Canada | 44 | 0.1% |
| Caribbean | 11 | 0.0% |
| Central America | 91 | 0.2% |
| China | 31 | 0.1% |
| Colombia | 1 | 0.0% |
| Cuba | 7 | 0.0% |
| Dominican Republic | 4 | 0.0% |
| Eastern Asia | 31 | 0.1% |
| Eastern Europe | 30 | 0.1% |
| England | 34 | 0.1% |
| Europe | 111 | 0.3% |
| France | 21 | 0.1% |
| Germany | 13 | 0.0% |
| Honduras | 3 | 0.0% |
| India | 8 | 0.0% |
| Indonesia | 6 | 0.0% |
| Israel | 24 | 0.1% |
| Latin America | 103 | 0.3% |
| Latvia | 10 | 0.0% |
| Lebanon | 3 | 0.0% |
| Mexico | 88 | 0.2% |
| Northern Europe | 40 | 0.1% |
| Oceania | 5 | 0.0% |
| Philippines | 30 | 0.1% |
| Poland | 15 | 0.0% |
| Russia | 3 | 0.0% |
| Scotland | 6 | 0.0% |
| South America | 1 | 0.0% |
| South Central Asia | 8 | 0.0% |
| South Eastern Asia | 38 | 0.1% |
| Taiwan | 4 | 0.0% |
| Western Asia | 27 | 0.1% |
| Western Europe | 41 | 0.1% | View All 37 Rows |
Sex and Age in Oconto County
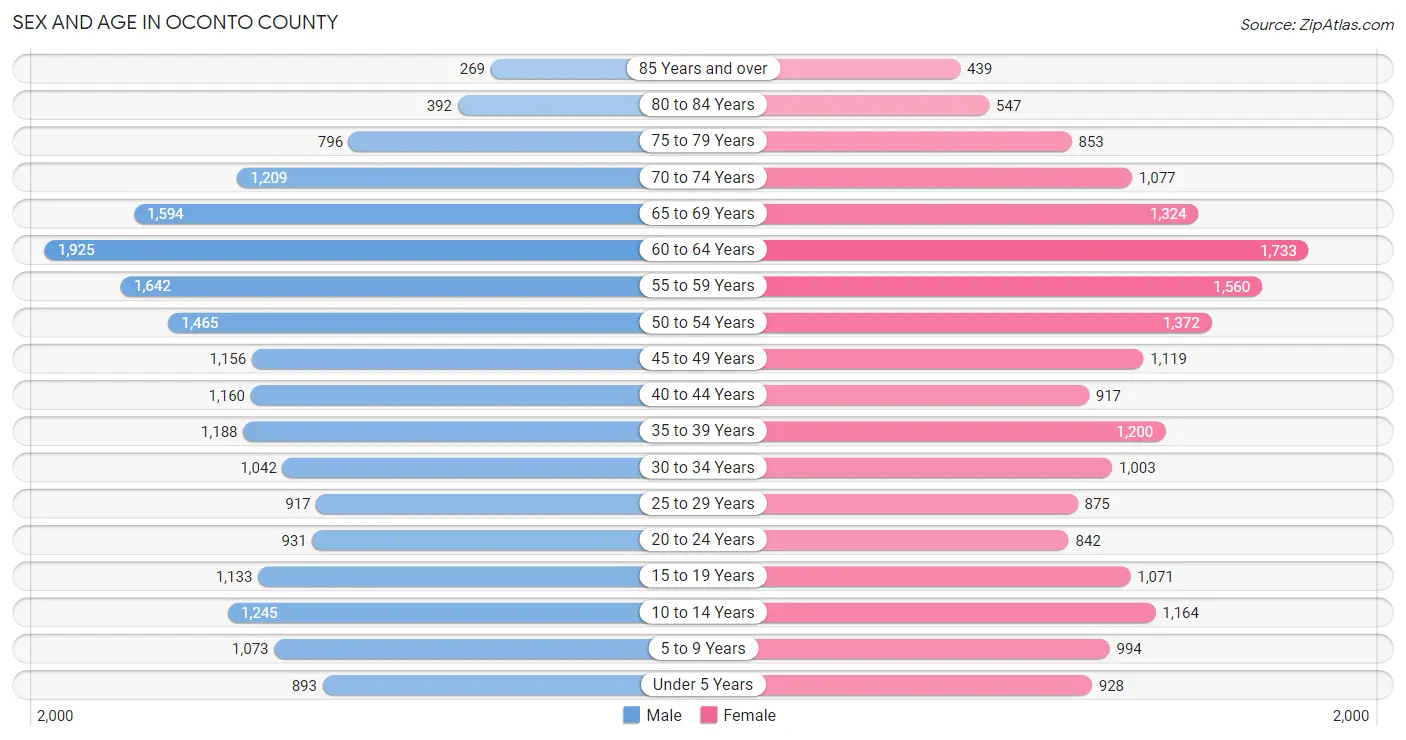
Sex and Age in Oconto County
The most populous age groups in Oconto County are 60 to 64 Years (1,925 | 9.6%) for men and 60 to 64 Years (1,733 | 9.1%) for women.
| Age Bracket | Male | Female |
| Under 5 Years | 893 (4.5%) | 928 (4.9%) |
| 5 to 9 Years | 1,073 (5.4%) | 994 (5.2%) |
| 10 to 14 Years | 1,245 (6.2%) | 1,164 (6.1%) |
| 15 to 19 Years | 1,133 (5.7%) | 1,071 (5.6%) |
| 20 to 24 Years | 931 (4.6%) | 842 (4.4%) |
| 25 to 29 Years | 917 (4.6%) | 875 (4.6%) |
| 30 to 34 Years | 1,042 (5.2%) | 1,003 (5.3%) |
| 35 to 39 Years | 1,188 (5.9%) | 1,200 (6.3%) |
| 40 to 44 Years | 1,160 (5.8%) | 917 (4.8%) |
| 45 to 49 Years | 1,156 (5.8%) | 1,119 (5.9%) |
| 50 to 54 Years | 1,465 (7.3%) | 1,372 (7.2%) |
| 55 to 59 Years | 1,642 (8.2%) | 1,560 (8.2%) |
| 60 to 64 Years | 1,925 (9.6%) | 1,733 (9.1%) |
| 65 to 69 Years | 1,594 (8.0%) | 1,324 (7.0%) |
| 70 to 74 Years | 1,209 (6.0%) | 1,077 (5.7%) |
| 75 to 79 Years | 796 (4.0%) | 853 (4.5%) |
| 80 to 84 Years | 392 (2.0%) | 547 (2.9%) |
| 85 Years and over | 269 (1.3%) | 439 (2.3%) |
| Total | 20,030 (100.0%) | 19,018 (100.0%) |
Families and Households in Oconto County
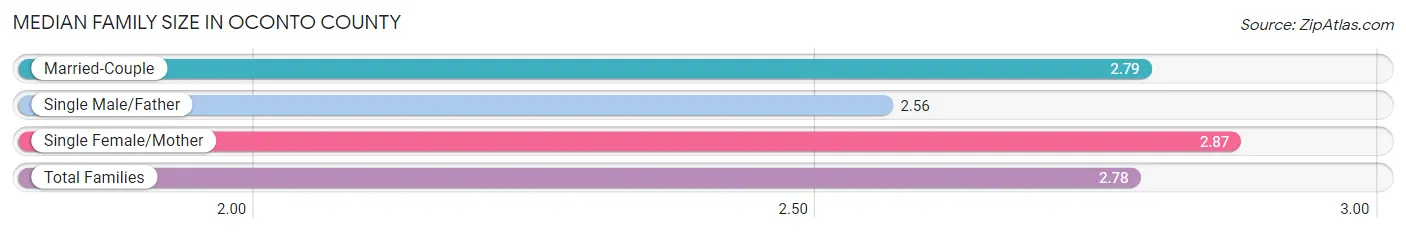
Median Family Size in Oconto County
The median family size in Oconto County is 2.78 persons per family, with single female/mother families (1,142 | 10.2%) accounting for the largest median family size of 2.87 persons per family. On the other hand, single male/father families (783 | 7.0%) represent the smallest median family size with 2.56 persons per family.
| Family Type | # Families | Family Size |
| Married-Couple | 9,263 (82.8%) | 2.79 |
| Single Male/Father | 783 (7.0%) | 2.56 |
| Single Female/Mother | 1,142 (10.2%) | 2.87 |
| Total Families | 11,188 (100.0%) | 2.78 |
Median Household Size in Oconto County
The median household size in Oconto County is 2.37 persons per household, with single female/mother households (1,142 | 7.0%) accounting for the largest median household size of 3.19 persons per household. non-family households (5,150 | 31.5%) represent the smallest median household size with 1.30 persons per household.

| Household Type | # Households | Household Size |
| Married-Couple | 9,263 (56.7%) | 2.81 |
| Single Male/Father | 783 (4.8%) | 3.05 |
| Single Female/Mother | 1,142 (7.0%) | 3.19 |
| Non-family | 5,150 (31.5%) | 1.30 |
| Total Households | 16,338 (100.0%) | 2.37 |
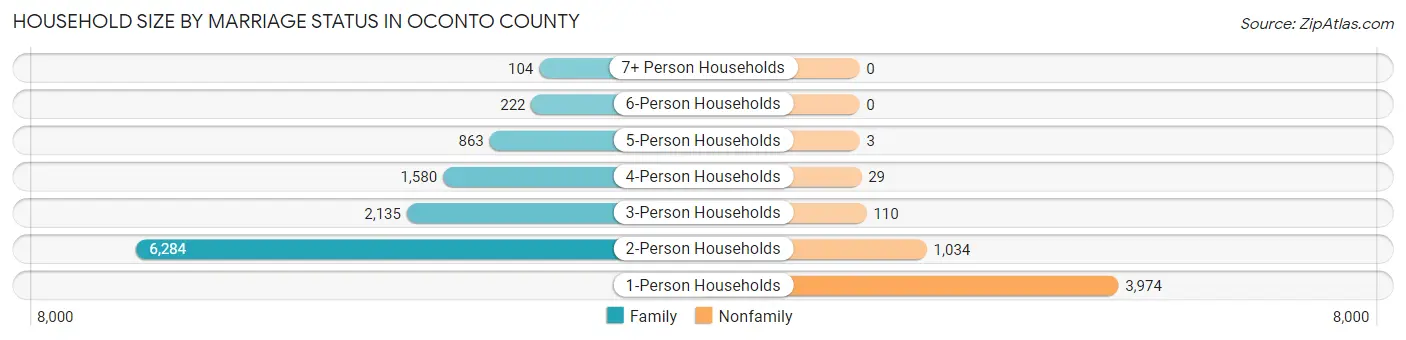
Household Size by Marriage Status in Oconto County
Out of a total of 16,338 households in Oconto County, 11,188 (68.5%) are family households, while 5,150 (31.5%) are nonfamily households. The most numerous type of family households are 2-person households, comprising 6,284, and the most common type of nonfamily households are 1-person households, comprising 3,974.
| Household Size | Family Households | Nonfamily Households |
| 1-Person Households | - | 3,974 (24.3%) |
| 2-Person Households | 6,284 (38.5%) | 1,034 (6.3%) |
| 3-Person Households | 2,135 (13.1%) | 110 (0.7%) |
| 4-Person Households | 1,580 (9.7%) | 29 (0.2%) |
| 5-Person Households | 863 (5.3%) | 3 (0.0%) |
| 6-Person Households | 222 (1.4%) | 0 (0.0%) |
| 7+ Person Households | 104 (0.6%) | 0 (0.0%) |
| Total | 11,188 (68.5%) | 5,150 (31.5%) |
Female Fertility in Oconto County
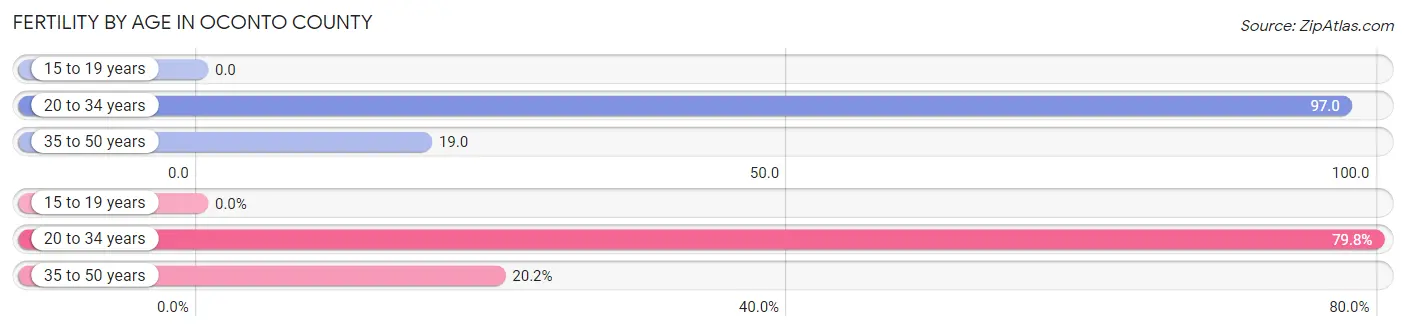
Fertility by Age in Oconto County
Average fertility rate in Oconto County is 46.0 births per 1,000 women. Women in the age bracket of 20 to 34 years have the highest fertility rate with 97.0 births per 1,000 women. Women in the age bracket of 20 to 34 years acount for 79.8% of all women with births.
| Age Bracket | Women with Births | Births / 1,000 Women |
| 15 to 19 years | 0 (0.0%) | 0.0 |
| 20 to 34 years | 265 (79.8%) | 97.0 |
| 35 to 50 years | 67 (20.2%) | 19.0 |
| Total | 332 (100.0%) | 46.0 |
Fertility by Age by Marriage Status in Oconto County
79.5% of women with births (332) in Oconto County are married. The highest percentage of unmarried women with births falls into 20 to 34 years age bracket with 24.1% of them unmarried at the time of birth, while the lowest percentage of unmarried women with births belong to 35 to 50 years age bracket with 6.0% of them unmarried.
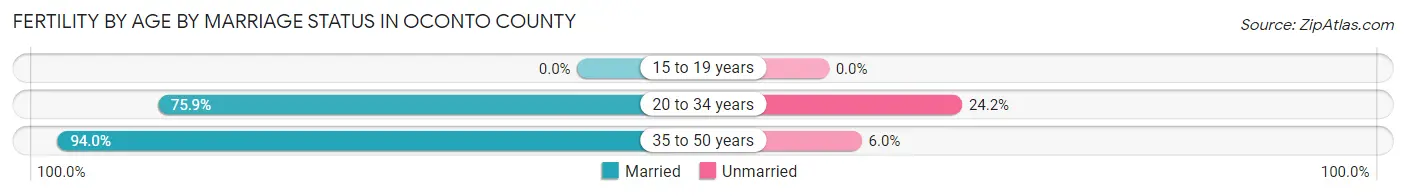
| Age Bracket | Married | Unmarried |
| 15 to 19 years | 0 (0.0%) | 0 (0.0%) |
| 20 to 34 years | 201 (75.8%) | 64 (24.1%) |
| 35 to 50 years | 63 (94.0%) | 4 (6.0%) |
| Total | 264 (79.5%) | 68 (20.5%) |
Fertility by Education in Oconto County
Average fertility rate in Oconto County is 46.0 births per 1,000 women. Women with the education attainment of bachelor's degree have the highest fertility rate of 122.0 births per 1,000 women, while women with the education attainment of graduate degree have the lowest fertility at 11.0 births per 1,000 women. Women with the education attainment of bachelor's degree represent 45.2% of all women with births.
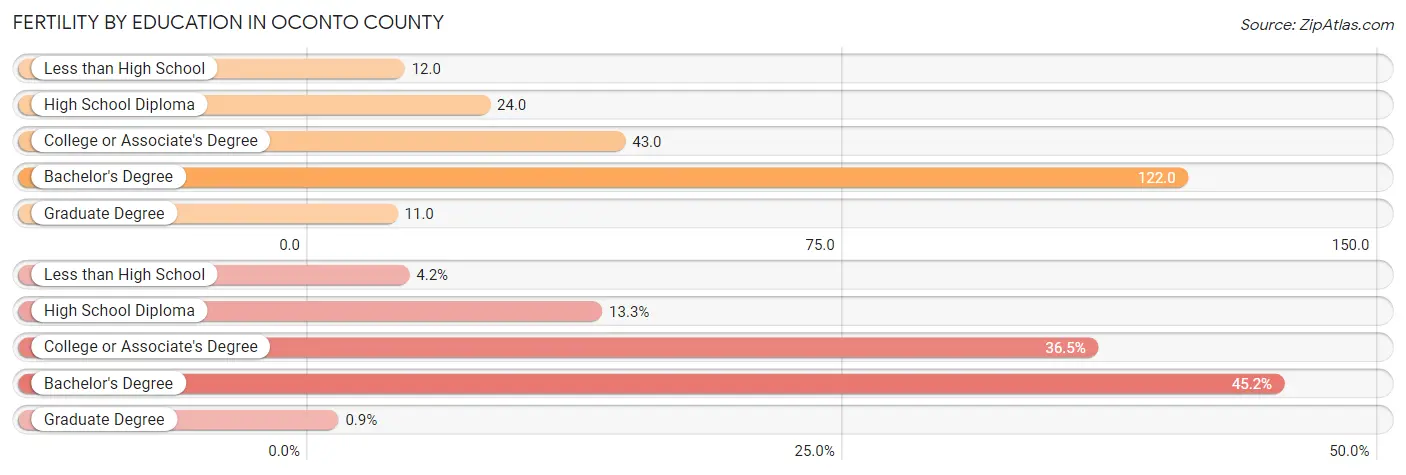
| Educational Attainment | Women with Births | Births / 1,000 Women |
| Less than High School | 14 (4.2%) | 12.0 |
| High School Diploma | 44 (13.3%) | 24.0 |
| College or Associate's Degree | 121 (36.4%) | 43.0 |
| Bachelor's Degree | 150 (45.2%) | 122.0 |
| Graduate Degree | 3 (0.9%) | 11.0 |
| Total | 332 (100.0%) | 46.0 |
Fertility by Education by Marriage Status in Oconto County
20.5% of women with births in Oconto County are unmarried. Women with the educational attainment of bachelor's degree are most likely to be married with 100.0% of them married at childbirth, while women with the educational attainment of high school diploma are least likely to be married with 47.7% of them unmarried at childbirth.

| Educational Attainment | Married | Unmarried |
| Less than High School | 11 (78.6%) | 3 (21.4%) |
| High School Diploma | 23 (52.3%) | 21 (47.7%) |
| College or Associate's Degree | 77 (63.6%) | 44 (36.4%) |
| Bachelor's Degree | 150 (100.0%) | 0 (0.0%) |
| Graduate Degree | 3 (100.0%) | 0 (0.0%) |
| Total | 264 (79.5%) | 68 (20.5%) |
Income in Oconto County
Income Overview in Oconto County
Per Capita Income in Oconto County is $37,124, while median incomes of families and households are $88,202 and $73,611 respectively.
| Characteristic | Number | Measure |
| Per Capita Income | 39,048 | $37,124 |
| Median Family Income | 11,188 | $88,202 |
| Mean Family Income | 11,188 | $99,379 |
| Median Household Income | 16,338 | $73,611 |
| Mean Household Income | 16,338 | $86,394 |
| Income Deficit | 11,188 | $8,820 |
| Wage / Income Gap (%) | 39,048 | 34.71% |
| Wage / Income Gap ($) | 39,048 | 65.29¢ per $1 |
| Gini / Inequality Index | 39,048 | 0.39 |
Earnings by Sex in Oconto County
Average Earnings in Oconto County are $43,288, $52,133 for men and $34,037 for women, a difference of 34.7%.
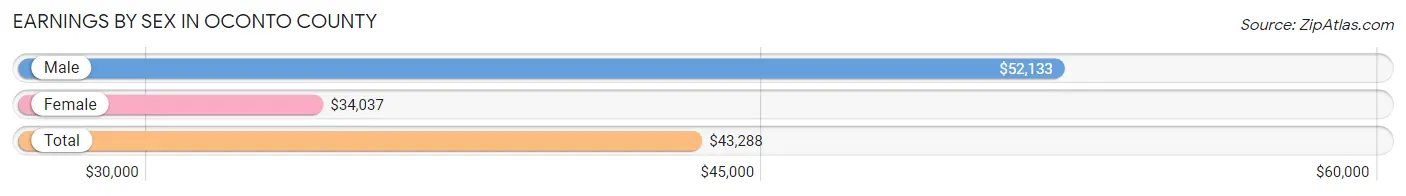
| Sex | Number | Average Earnings |
| Male | 11,101 (53.0%) | $52,133 |
| Female | 9,841 (47.0%) | $34,037 |
| Total | 20,942 (100.0%) | $43,288 |
Earnings by Sex by Income Bracket in Oconto County
The most common earnings brackets in Oconto County are $75,000 to $99,999 for men (1,669 | 15.0%) and $30,000 to $34,999 for women (919 | 9.3%).

| Income | Male | Female |
| $2,499 or less | 517 (4.7%) | 597 (6.1%) |
| $2,500 to $4,999 | 342 (3.1%) | 418 (4.3%) |
| $5,000 to $7,499 | 319 (2.9%) | 334 (3.4%) |
| $7,500 to $9,999 | 149 (1.3%) | 311 (3.2%) |
| $10,000 to $12,499 | 217 (1.9%) | 287 (2.9%) |
| $12,500 to $14,999 | 214 (1.9%) | 367 (3.7%) |
| $15,000 to $17,499 | 125 (1.1%) | 376 (3.8%) |
| $17,500 to $19,999 | 184 (1.7%) | 229 (2.3%) |
| $20,000 to $22,499 | 215 (1.9%) | 290 (2.9%) |
| $22,500 to $24,999 | 139 (1.3%) | 291 (3.0%) |
| $25,000 to $29,999 | 440 (4.0%) | 703 (7.1%) |
| $30,000 to $34,999 | 394 (3.5%) | 919 (9.3%) |
| $35,000 to $39,999 | 483 (4.3%) | 685 (7.0%) |
| $40,000 to $44,999 | 686 (6.2%) | 694 (7.0%) |
| $45,000 to $49,999 | 757 (6.8%) | 560 (5.7%) |
| $50,000 to $54,999 | 760 (6.9%) | 509 (5.2%) |
| $55,000 to $64,999 | 1,353 (12.2%) | 832 (8.5%) |
| $65,000 to $74,999 | 961 (8.7%) | 455 (4.6%) |
| $75,000 to $99,999 | 1,669 (15.0%) | 645 (6.6%) |
| $100,000+ | 1,177 (10.6%) | 339 (3.4%) |
| Total | 11,101 (100.0%) | 9,841 (100.0%) |
Earnings by Sex by Educational Attainment in Oconto County
Average earnings in Oconto County are $56,535 for men and $37,256 for women, a difference of 34.1%. Men with an educational attainment of bachelor's degree enjoy the highest average annual earnings of $76,642, while those with less than high school education earn the least with $43,966. Women with an educational attainment of graduate degree earn the most with the average annual earnings of $70,119, while those with less than high school education have the smallest earnings of $19,737.
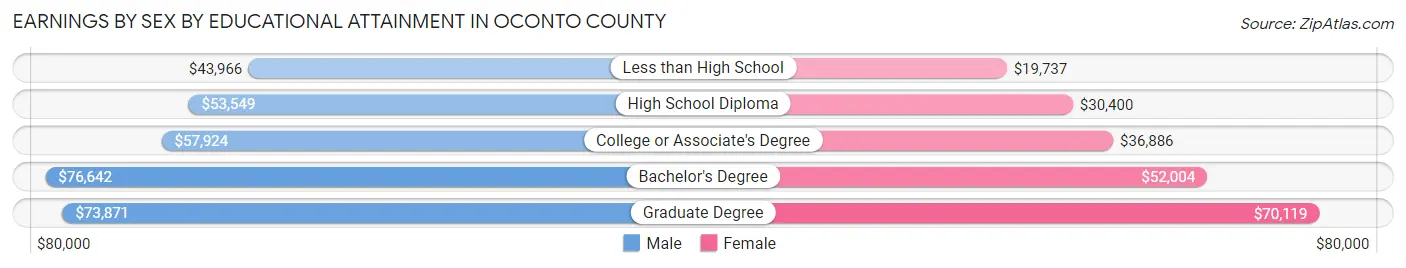
| Educational Attainment | Male Income | Female Income |
| Less than High School | $43,966 | $19,737 |
| High School Diploma | $53,549 | $30,400 |
| College or Associate's Degree | $57,924 | $36,886 |
| Bachelor's Degree | $76,642 | $52,004 |
| Graduate Degree | $73,871 | $70,119 |
| Total | $56,535 | $37,256 |
Family Income in Oconto County
Family Income Brackets in Oconto County
According to the Oconto County family income data, there are 2,842 families falling into the $100,000 to $149,999 income range, which is the most common income bracket and makes up 25.4% of all families. Conversely, the $10,000 to $14,999 income bracket is the least frequent group with only 112 families (1.0%) belonging to this category.

| Income Bracket | # Families | % Families |
| Less than $10,000 | 224 | 2.0% |
| $10,000 to $14,999 | 112 | 1.0% |
| $15,000 to $24,999 | 448 | 4.0% |
| $25,000 to $34,999 | 582 | 5.2% |
| $35,000 to $49,999 | 1,085 | 9.7% |
| $50,000 to $74,999 | 2,215 | 19.8% |
| $75,000 to $99,999 | 1,902 | 17.0% |
| $100,000 to $149,999 | 2,842 | 25.4% |
| $150,000 to $199,999 | 1,074 | 9.6% |
| $200,000+ | 705 | 6.3% |
Family Income by Famaliy Size in Oconto County
4-person families (1,523 | 13.6%) account for the highest median family income in Oconto County with $113,984 per family, while 2-person families (6,569 | 58.7%) have the highest median income of $37,512 per family member.
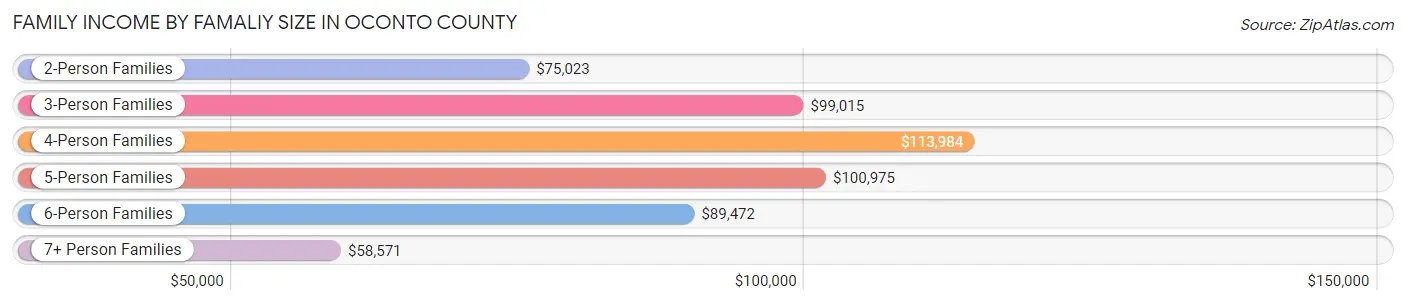
| Income Bracket | # Families | Median Income |
| 2-Person Families | 6,569 (58.7%) | $75,023 |
| 3-Person Families | 2,090 (18.7%) | $99,015 |
| 4-Person Families | 1,523 (13.6%) | $113,984 |
| 5-Person Families | 709 (6.3%) | $100,975 |
| 6-Person Families | 215 (1.9%) | $89,472 |
| 7+ Person Families | 82 (0.7%) | $58,571 |
| Total | 11,188 (100.0%) | $88,202 |
Family Income by Number of Earners in Oconto County
The median family income in Oconto County is $88,202, with families comprising 3+ earners (1,070) having the highest median family income of $126,875, while families with no earners (2,317) have the lowest median family income of $56,063, accounting for 9.6% and 20.7% of families, respectively.
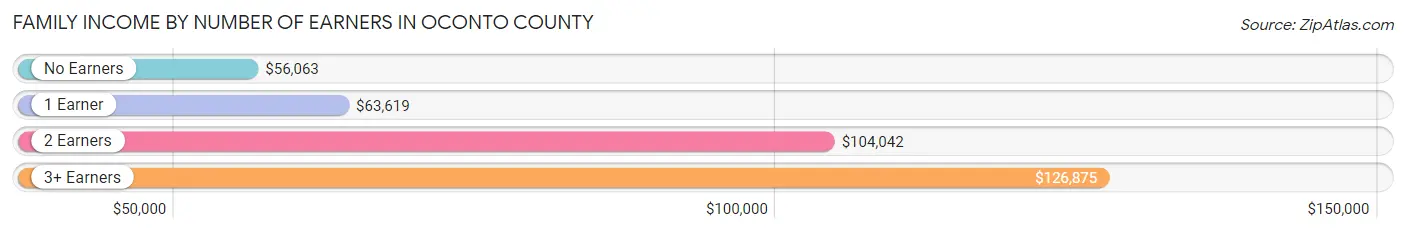
| Number of Earners | # Families | Median Income |
| No Earners | 2,317 (20.7%) | $56,063 |
| 1 Earner | 2,936 (26.2%) | $63,619 |
| 2 Earners | 4,865 (43.5%) | $104,042 |
| 3+ Earners | 1,070 (9.6%) | $126,875 |
| Total | 11,188 (100.0%) | $88,202 |
Household Income in Oconto County
Household Income Brackets in Oconto County
With 3,366 households falling in the category, the $100,000 to $149,999 income range is the most frequent in Oconto County, accounting for 20.6% of all households. In contrast, only 490 households (3.0%) fall into the $10,000 to $14,999 income bracket, making it the least populous group.

| Income Bracket | # Households | % Households |
| Less than $10,000 | 572 | 3.5% |
| $10,000 to $14,999 | 490 | 3.0% |
| $15,000 to $24,999 | 1,046 | 6.4% |
| $25,000 to $34,999 | 1,258 | 7.7% |
| $35,000 to $49,999 | 1,944 | 11.9% |
| $50,000 to $74,999 | 3,072 | 18.8% |
| $75,000 to $99,999 | 2,614 | 16.0% |
| $100,000 to $149,999 | 3,366 | 20.6% |
| $150,000 to $199,999 | 1,176 | 7.2% |
| $200,000+ | 817 | 5.0% |
Household Income by Householder Age in Oconto County
The median household income in Oconto County is $73,611, with the highest median household income of $89,196 found in the 25 to 44 years age bracket for the primary householder. A total of 3,977 households (24.3%) fall into this category. Meanwhile, the 15 to 24 years age bracket for the primary householder has the lowest median household income of $47,150, with 417 households (2.5%) in this group.

| Income Bracket | # Households | Median Income |
| 15 to 24 Years | 417 (2.5%) | $47,150 |
| 25 to 44 Years | 3,977 (24.3%) | $89,196 |
| 45 to 64 Years | 6,740 (41.2%) | $86,541 |
| 65+ Years | 5,204 (31.9%) | $53,467 |
| Total | 16,338 (100.0%) | $73,611 |
Poverty in Oconto County
Income Below Poverty by Sex and Age in Oconto County
With 7.6% poverty level for males and 8.9% for females among the residents of Oconto County, 12 to 14 year old males and 18 to 24 year old females are the most vulnerable to poverty, with 84 males (12.7%) and 183 females (15.2%) in their respective age groups living below the poverty level.
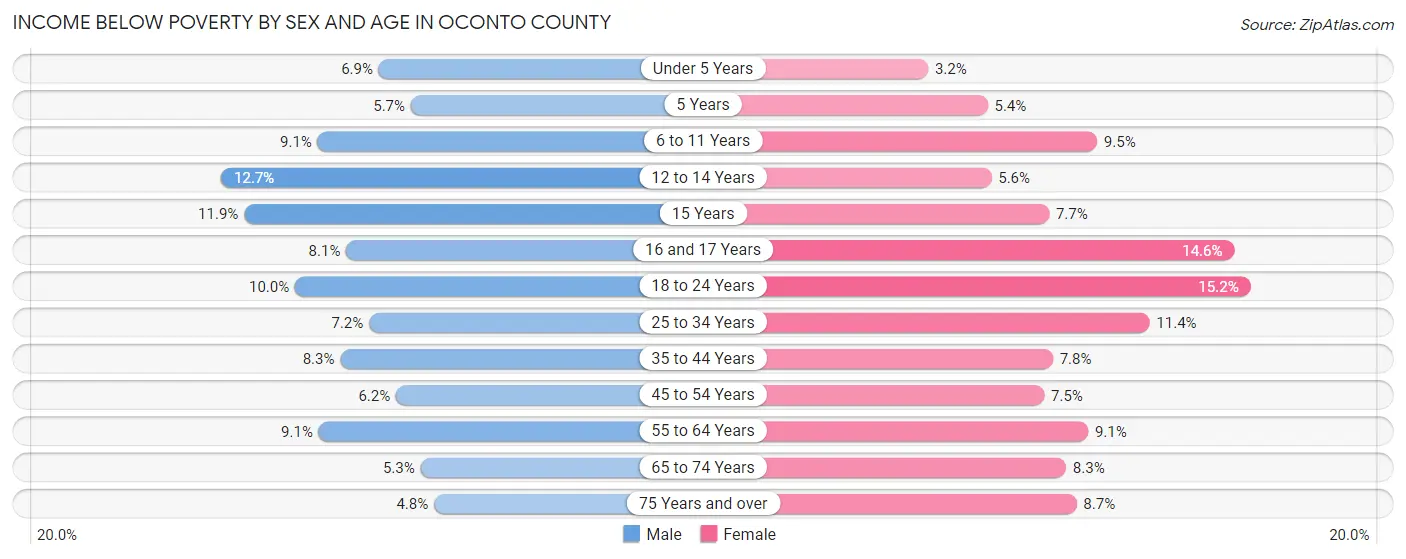
| Age Bracket | Male | Female |
| Under 5 Years | 58 (6.9%) | 28 (3.2%) |
| 5 Years | 12 (5.7%) | 10 (5.4%) |
| 6 to 11 Years | 121 (9.1%) | 117 (9.5%) |
| 12 to 14 Years | 84 (12.7%) | 37 (5.6%) |
| 15 Years | 25 (11.8%) | 19 (7.7%) |
| 16 and 17 Years | 42 (8.1%) | 67 (14.6%) |
| 18 to 24 Years | 132 (10.0%) | 183 (15.2%) |
| 25 to 34 Years | 139 (7.2%) | 213 (11.4%) |
| 35 to 44 Years | 193 (8.3%) | 165 (7.8%) |
| 45 to 54 Years | 162 (6.2%) | 187 (7.5%) |
| 55 to 64 Years | 323 (9.1%) | 301 (9.1%) |
| 65 to 74 Years | 148 (5.3%) | 199 (8.3%) |
| 75 Years and over | 68 (4.8%) | 148 (8.7%) |
| Total | 1,507 (7.6%) | 1,674 (8.9%) |
Income Above Poverty by Sex and Age in Oconto County
According to the poverty statistics in Oconto County, males aged 75 years and over and females aged under 5 years are the age groups that are most secure financially, with 95.2% of males and 96.8% of females in these age groups living above the poverty line.
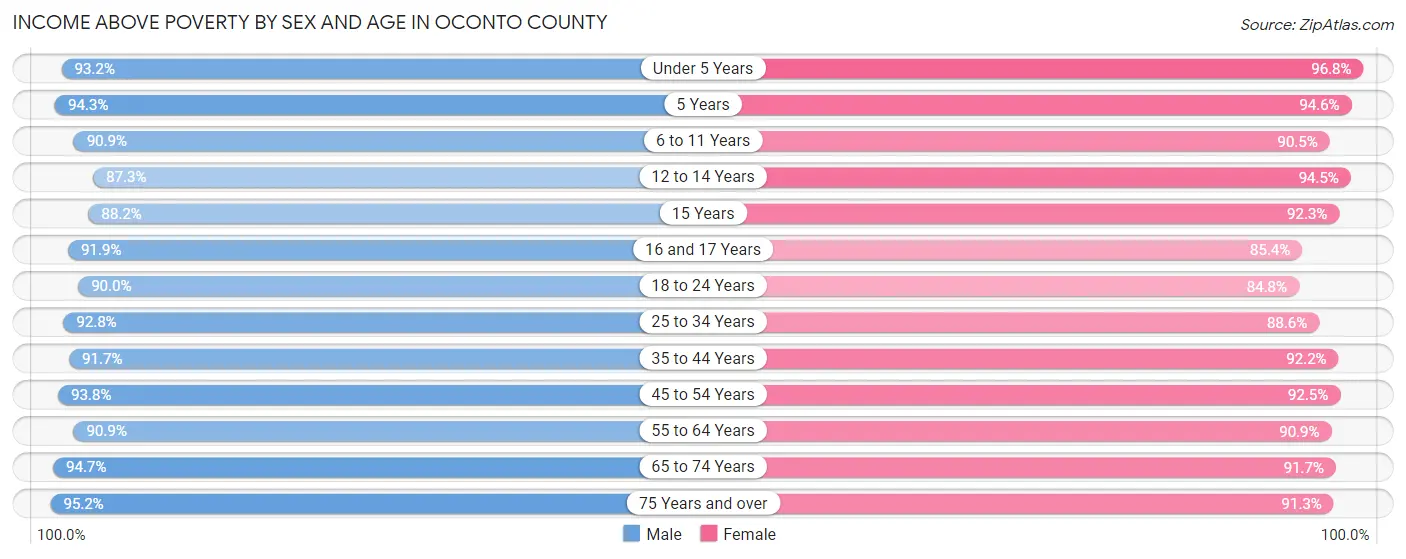
| Age Bracket | Male | Female |
| Under 5 Years | 789 (93.1%) | 848 (96.8%) |
| 5 Years | 200 (94.3%) | 175 (94.6%) |
| 6 to 11 Years | 1,206 (90.9%) | 1,118 (90.5%) |
| 12 to 14 Years | 577 (87.3%) | 630 (94.5%) |
| 15 Years | 186 (88.1%) | 228 (92.3%) |
| 16 and 17 Years | 479 (91.9%) | 393 (85.4%) |
| 18 to 24 Years | 1,193 (90.0%) | 1,023 (84.8%) |
| 25 to 34 Years | 1,790 (92.8%) | 1,652 (88.6%) |
| 35 to 44 Years | 2,139 (91.7%) | 1,941 (92.2%) |
| 45 to 54 Years | 2,447 (93.8%) | 2,304 (92.5%) |
| 55 to 64 Years | 3,235 (90.9%) | 2,992 (90.9%) |
| 65 to 74 Years | 2,643 (94.7%) | 2,194 (91.7%) |
| 75 Years and over | 1,349 (95.2%) | 1,551 (91.3%) |
| Total | 18,233 (92.4%) | 17,049 (91.1%) |
Income Below Poverty Among Married-Couple Families in Oconto County
The poverty statistics for married-couple families in Oconto County show that 3.7% or 342 of the total 9,263 families live below the poverty line. Families with 5 or more children have the highest poverty rate of 25.0%, comprising of 3 families. On the other hand, families with 1 or 2 children have the lowest poverty rate of 3.2%, which includes 70 families.
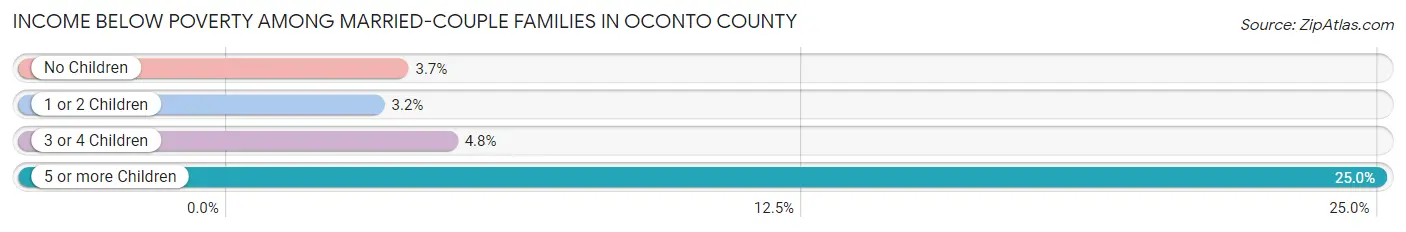
| Children | Above Poverty | Below Poverty |
| No Children | 6,148 (96.3%) | 237 (3.7%) |
| 1 or 2 Children | 2,126 (96.8%) | 70 (3.2%) |
| 3 or 4 Children | 638 (95.2%) | 32 (4.8%) |
| 5 or more Children | 9 (75.0%) | 3 (25.0%) |
| Total | 8,921 (96.3%) | 342 (3.7%) |
Income Below Poverty Among Single-Parent Households in Oconto County
According to the poverty data in Oconto County, 8.6% or 67 single-father households and 18.6% or 213 single-mother households are living below the poverty line. Among single-father households, those with 1 or 2 children have the highest poverty rate, with 55 households (13.0%) experiencing poverty. Likewise, among single-mother households, those with 1 or 2 children have the highest poverty rate, with 144 households (27.7%) falling below the poverty line.
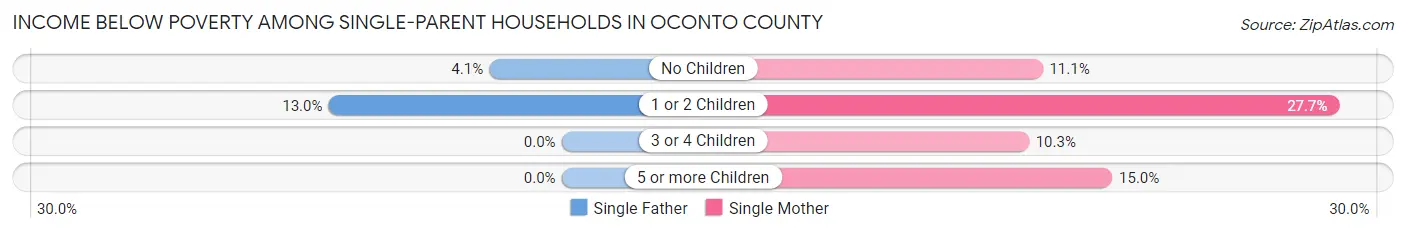
| Children | Single Father | Single Mother |
| No Children | 12 (4.1%) | 54 (11.1%) |
| 1 or 2 Children | 55 (13.0%) | 144 (27.7%) |
| 3 or 4 Children | 0 (0.0%) | 12 (10.3%) |
| 5 or more Children | 0 (0.0%) | 3 (15.0%) |
| Total | 67 (8.6%) | 213 (18.6%) |
Income Below Poverty Among Married-Couple vs Single-Parent Households in Oconto County
The poverty data for Oconto County shows that 342 of the married-couple family households (3.7%) and 280 of the single-parent households (14.5%) are living below the poverty level. Within the married-couple family households, those with 5 or more children have the highest poverty rate, with 3 households (25.0%) falling below the poverty line. Among the single-parent households, those with 1 or 2 children have the highest poverty rate, with 199 household (21.1%) living below poverty.
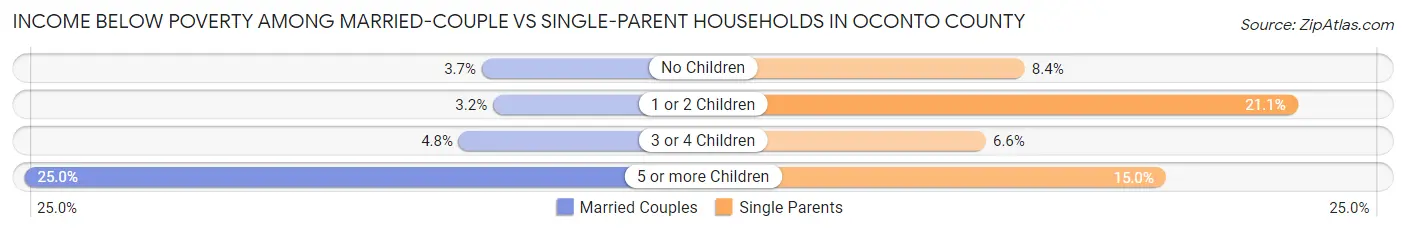
| Children | Married-Couple Families | Single-Parent Households |
| No Children | 237 (3.7%) | 66 (8.4%) |
| 1 or 2 Children | 70 (3.2%) | 199 (21.1%) |
| 3 or 4 Children | 32 (4.8%) | 12 (6.6%) |
| 5 or more Children | 3 (25.0%) | 3 (15.0%) |
| Total | 342 (3.7%) | 280 (14.5%) |
Employment Characteristics in Oconto County
Employment by Class of Employer in Oconto County
Among the 18,925 employed individuals in Oconto County, private company employees (13,369 | 70.6%), local government employees (1,534 | 8.1%), and self-employed (not incorporated) (1,526 | 8.1%) make up the most common classes of employment.
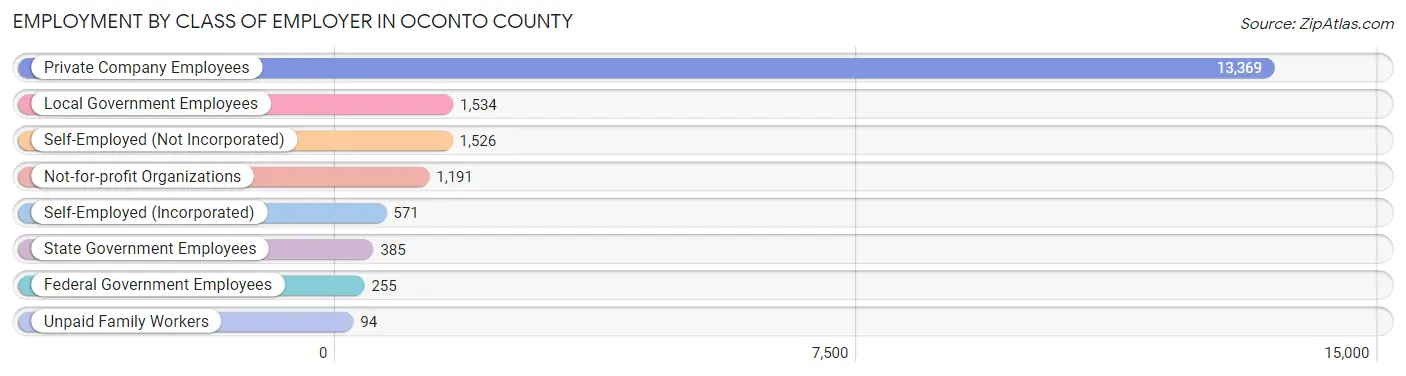
| Employer Class | # Employees | % Employees |
| Private Company Employees | 13,369 | 70.6% |
| Self-Employed (Incorporated) | 571 | 3.0% |
| Self-Employed (Not Incorporated) | 1,526 | 8.1% |
| Not-for-profit Organizations | 1,191 | 6.3% |
| Local Government Employees | 1,534 | 8.1% |
| State Government Employees | 385 | 2.0% |
| Federal Government Employees | 255 | 1.3% |
| Unpaid Family Workers | 94 | 0.5% |
| Total | 18,925 | 100.0% |
Employment Status by Age in Oconto County
According to the labor force statistics for Oconto County, out of the total population over 16 years of age (32,293), 60.6% or 19,570 individuals are in the labor force, with 2.0% or 391 of them unemployed. The age group with the highest labor force participation rate is 30 to 34 years, with 90.2% or 1,845 individuals in the labor force. Within the labor force, the 20 to 24 years age range has the highest percentage of unemployed individuals, with 3.5% or 51 of them being unemployed.
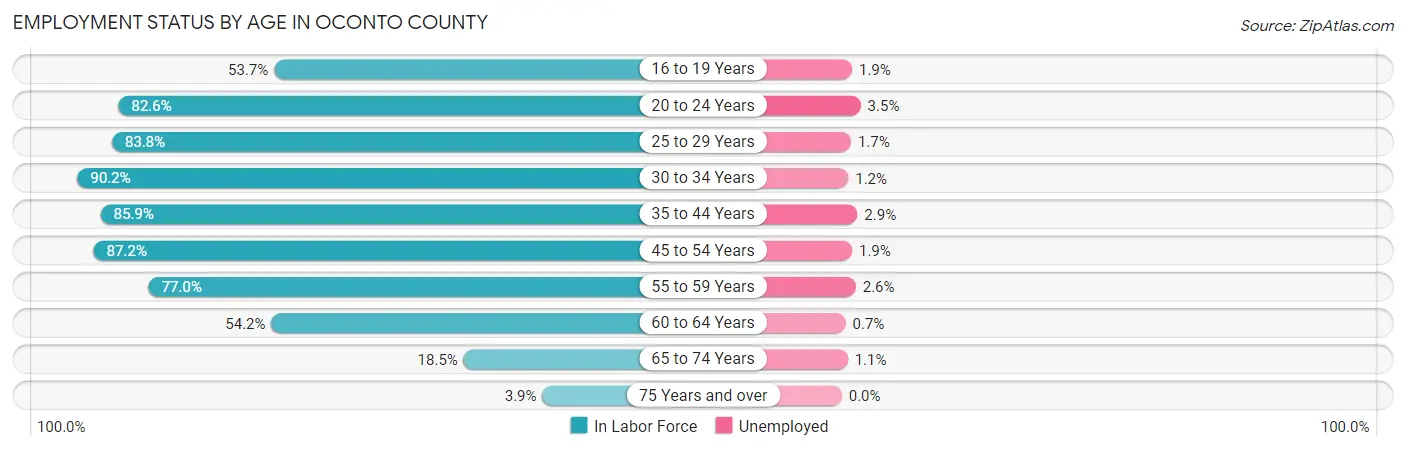
| Age Bracket | In Labor Force | Unemployed |
| 16 to 19 Years | 938 (53.7%) | 18 (1.9%) |
| 20 to 24 Years | 1,464 (82.6%) | 51 (3.5%) |
| 25 to 29 Years | 1,502 (83.8%) | 26 (1.7%) |
| 30 to 34 Years | 1,845 (90.2%) | 22 (1.2%) |
| 35 to 44 Years | 3,835 (85.9%) | 111 (2.9%) |
| 45 to 54 Years | 4,458 (87.2%) | 85 (1.9%) |
| 55 to 59 Years | 2,466 (77.0%) | 64 (2.6%) |
| 60 to 64 Years | 1,983 (54.2%) | 14 (0.7%) |
| 65 to 74 Years | 963 (18.5%) | 11 (1.1%) |
| 75 Years and over | 129 (3.9%) | 0 (0.0%) |
| Total | 19,570 (60.6%) | 391 (2.0%) |
Employment Status by Educational Attainment in Oconto County
According to labor force statistics for Oconto County, 79.4% of individuals (16,098) out of the total population between 25 and 64 years of age (20,274) are in the labor force, with 2.0% or 322 of them being unemployed. The group with the highest labor force participation rate are those with the educational attainment of bachelor's degree or higher, with 88.8% or 3,284 individuals in the labor force. Within the labor force, individuals with high school diploma education have the highest percentage of unemployment, with 2.4% or 136 of them being unemployed.
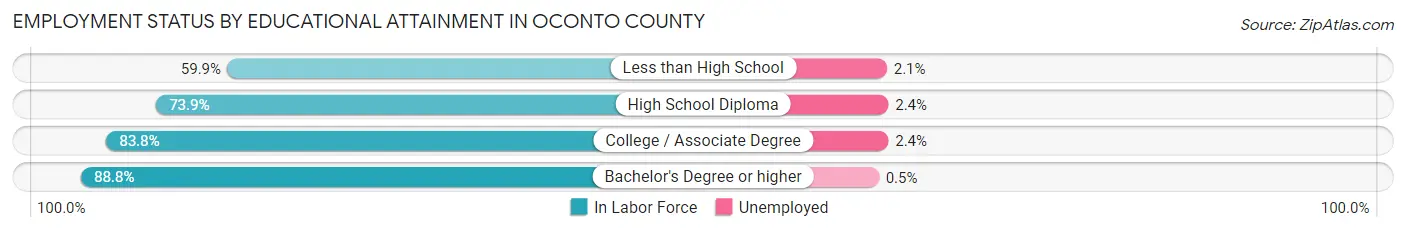
| Educational Attainment | In Labor Force | Unemployed |
| Less than High School | 826 (59.9%) | 29 (2.1%) |
| High School Diploma | 5,673 (73.9%) | 184 (2.4%) |
| College / Associate Degree | 6,302 (83.8%) | 180 (2.4%) |
| Bachelor's Degree or higher | 3,284 (88.8%) | 18 (0.5%) |
| Total | 16,098 (79.4%) | 405 (2.0%) |
Employment Occupations by Sex in Oconto County
Management, Business, Science and Arts Occupations
The most common Management, Business, Science and Arts occupations in Oconto County are Management (1,941 | 10.1%), Community & Social Service (1,268 | 6.6%), Health Diagnosing & Treating (1,020 | 5.3%), Computers, Engineering & Science (964 | 5.0%), and Education Instruction & Library (892 | 4.6%).
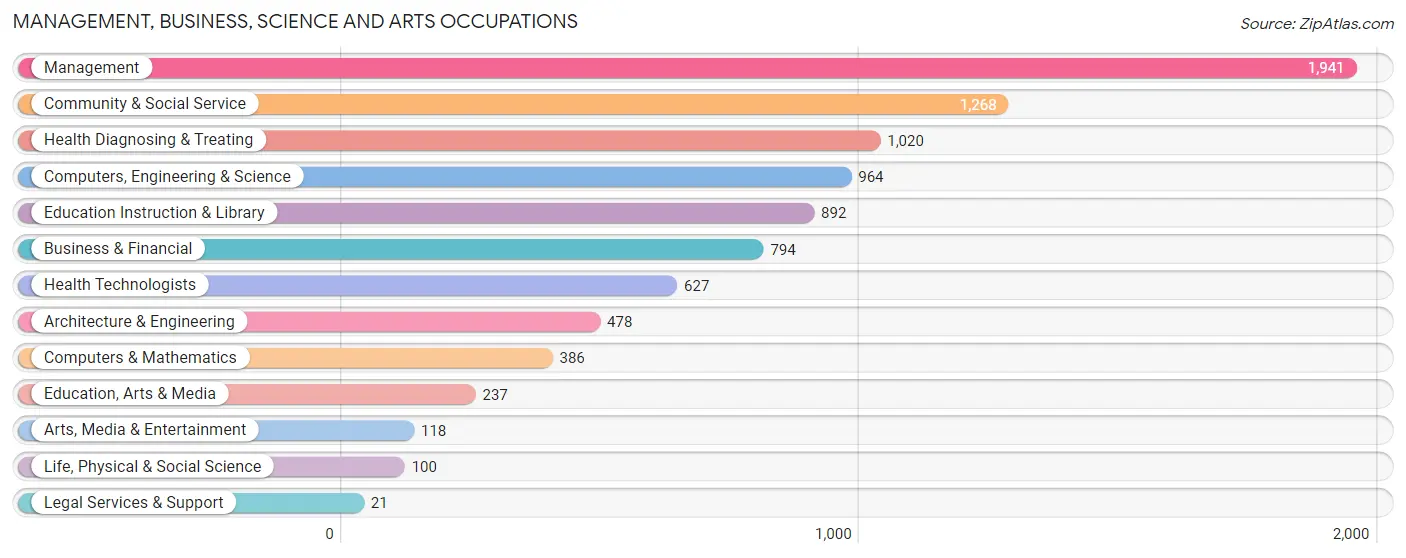
Management, Business, Science and Arts Occupations by Sex
Within the Management, Business, Science and Arts occupations in Oconto County, the most male-oriented occupations are Architecture & Engineering (75.1%), Computers, Engineering & Science (65.7%), and Management (64.1%), while the most female-oriented occupations are Health Diagnosing & Treating (90.5%), Health Technologists (89.3%), and Legal Services & Support (80.9%).

| Occupation | Male | Female |
| Management | 1,245 (64.1%) | 696 (35.9%) |
| Business & Financial | 272 (34.3%) | 522 (65.7%) |
| Computers, Engineering & Science | 633 (65.7%) | 331 (34.3%) |
| Computers & Mathematics | 225 (58.3%) | 161 (41.7%) |
| Architecture & Engineering | 359 (75.1%) | 119 (24.9%) |
| Life, Physical & Social Science | 49 (49.0%) | 51 (51.0%) |
| Community & Social Service | 376 (29.6%) | 892 (70.4%) |
| Education, Arts & Media | 95 (40.1%) | 142 (59.9%) |
| Legal Services & Support | 4 (19.1%) | 17 (80.9%) |
| Education Instruction & Library | 215 (24.1%) | 677 (75.9%) |
| Arts, Media & Entertainment | 62 (52.5%) | 56 (47.5%) |
| Health Diagnosing & Treating | 97 (9.5%) | 923 (90.5%) |
| Health Technologists | 67 (10.7%) | 560 (89.3%) |
| Total (Category) | 2,623 (43.8%) | 3,364 (56.2%) |
| Total (Overall) | 10,285 (53.6%) | 8,893 (46.4%) |
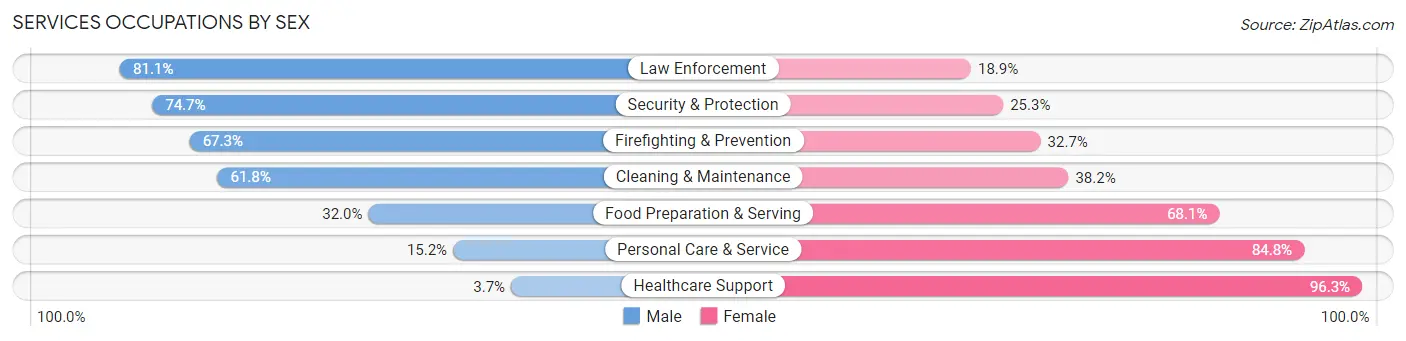
Services Occupations
The most common Services occupations in Oconto County are Healthcare Support (758 | 4.0%), Food Preparation & Serving (745 | 3.9%), Cleaning & Maintenance (636 | 3.3%), Personal Care & Service (382 | 2.0%), and Security & Protection (344 | 1.8%).

Services Occupations by Sex
Within the Services occupations in Oconto County, the most male-oriented occupations are Law Enforcement (81.1%), Security & Protection (74.7%), and Firefighting & Prevention (67.3%), while the most female-oriented occupations are Healthcare Support (96.3%), Personal Care & Service (84.8%), and Food Preparation & Serving (68.0%).
| Occupation | Male | Female |
| Healthcare Support | 28 (3.7%) | 730 (96.3%) |
| Security & Protection | 257 (74.7%) | 87 (25.3%) |
| Firefighting & Prevention | 107 (67.3%) | 52 (32.7%) |
| Law Enforcement | 150 (81.1%) | 35 (18.9%) |
| Food Preparation & Serving | 238 (32.0%) | 507 (68.0%) |
| Cleaning & Maintenance | 393 (61.8%) | 243 (38.2%) |
| Personal Care & Service | 58 (15.2%) | 324 (84.8%) |
| Total (Category) | 974 (34.0%) | 1,891 (66.0%) |
| Total (Overall) | 10,285 (53.6%) | 8,893 (46.4%) |
Sales and Office Occupations
The most common Sales and Office occupations in Oconto County are Office & Administration (1,923 | 10.0%), and Sales & Related (1,255 | 6.5%).
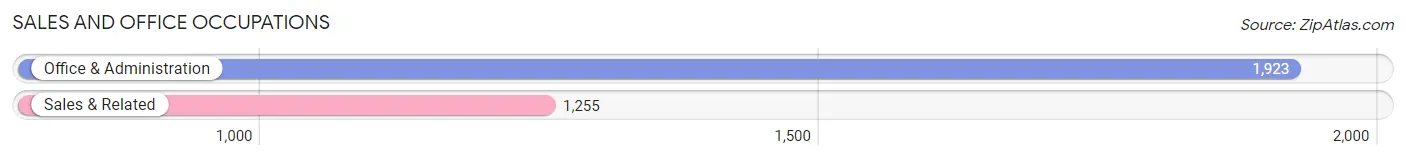
Sales and Office Occupations by Sex

| Occupation | Male | Female |
| Sales & Related | 490 (39.0%) | 765 (61.0%) |
| Office & Administration | 346 (18.0%) | 1,577 (82.0%) |
| Total (Category) | 836 (26.3%) | 2,342 (73.7%) |
| Total (Overall) | 10,285 (53.6%) | 8,893 (46.4%) |
Natural Resources, Construction and Maintenance Occupations
The most common Natural Resources, Construction and Maintenance occupations in Oconto County are Construction & Extraction (1,418 | 7.4%), Installation, Maintenance & Repair (988 | 5.1%), and Farming, Fishing & Forestry (263 | 1.4%).

Natural Resources, Construction and Maintenance Occupations by Sex
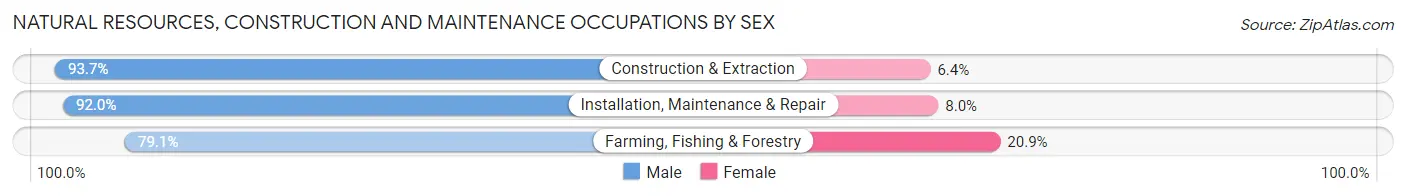
| Occupation | Male | Female |
| Farming, Fishing & Forestry | 208 (79.1%) | 55 (20.9%) |
| Construction & Extraction | 1,328 (93.6%) | 90 (6.4%) |
| Installation, Maintenance & Repair | 909 (92.0%) | 79 (8.0%) |
| Total (Category) | 2,445 (91.6%) | 224 (8.4%) |
| Total (Overall) | 10,285 (53.6%) | 8,893 (46.4%) |
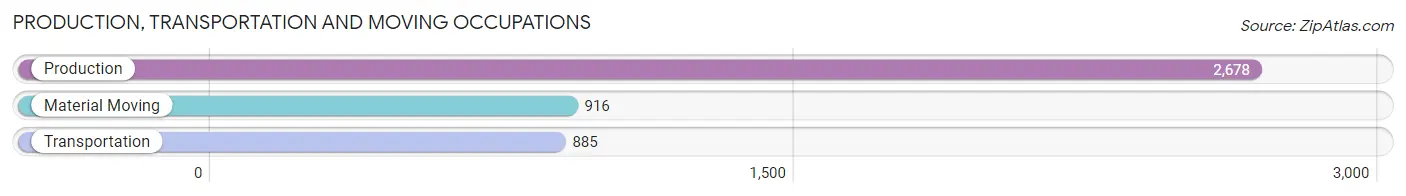
Production, Transportation and Moving Occupations
The most common Production, Transportation and Moving occupations in Oconto County are Production (2,678 | 14.0%), Material Moving (916 | 4.8%), and Transportation (885 | 4.6%).
Production, Transportation and Moving Occupations by Sex
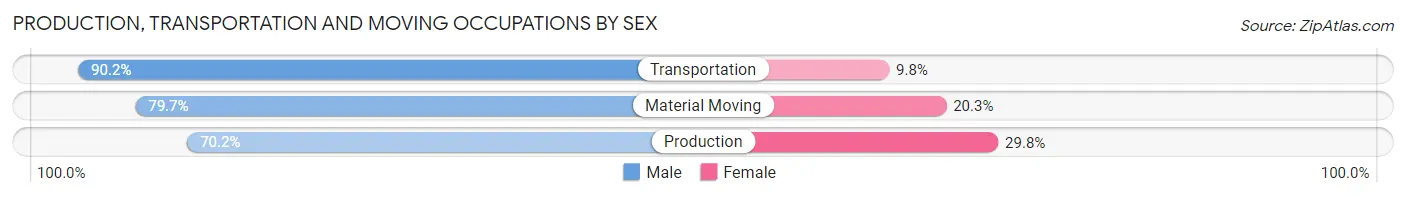
| Occupation | Male | Female |
| Production | 1,879 (70.2%) | 799 (29.8%) |
| Transportation | 798 (90.2%) | 87 (9.8%) |
| Material Moving | 730 (79.7%) | 186 (20.3%) |
| Total (Category) | 3,407 (76.1%) | 1,072 (23.9%) |
| Total (Overall) | 10,285 (53.6%) | 8,893 (46.4%) |
Employment Industries by Sex in Oconto County
Employment Industries in Oconto County
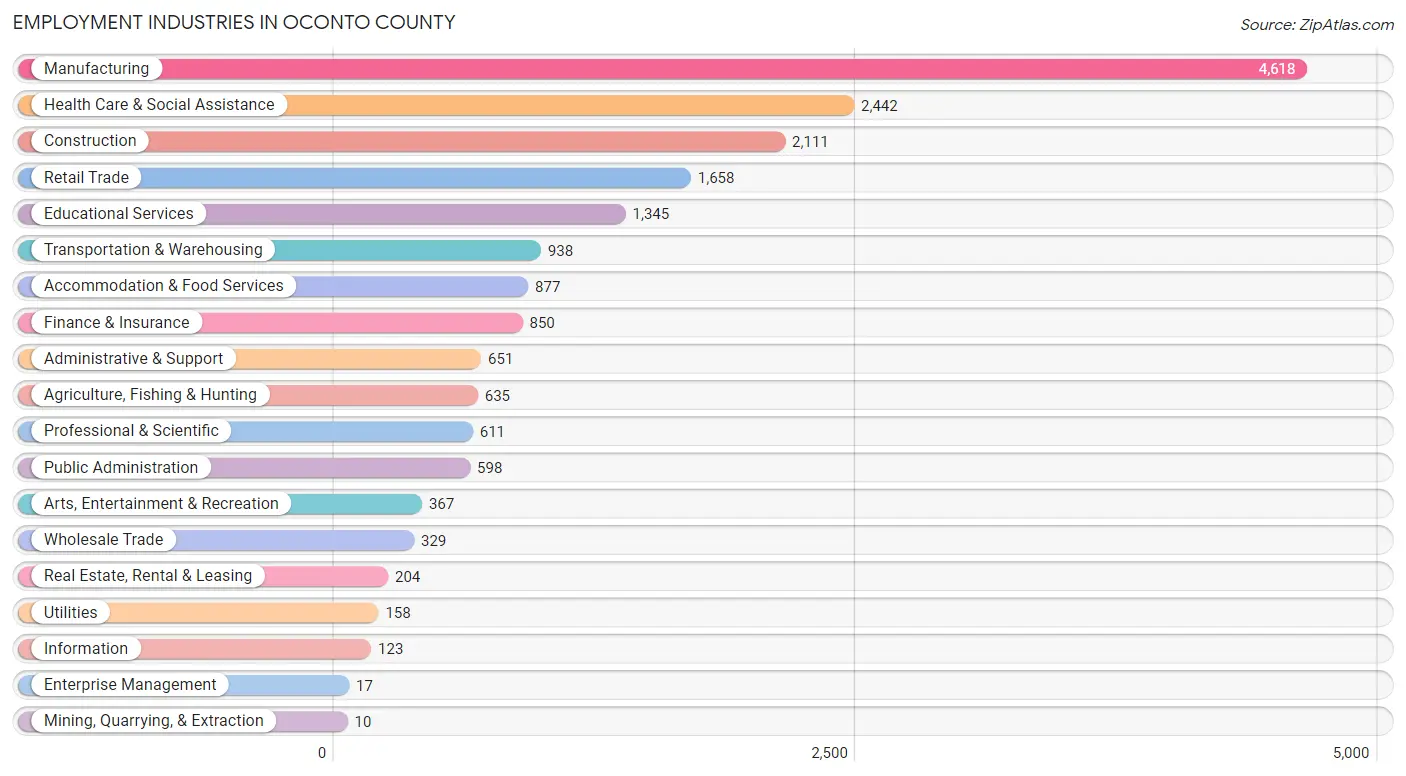
The major employment industries in Oconto County include Manufacturing (4,618 | 24.1%), Health Care & Social Assistance (2,442 | 12.7%), Construction (2,111 | 11.0%), Retail Trade (1,658 | 8.6%), and Educational Services (1,345 | 7.0%).
Employment Industries by Sex in Oconto County
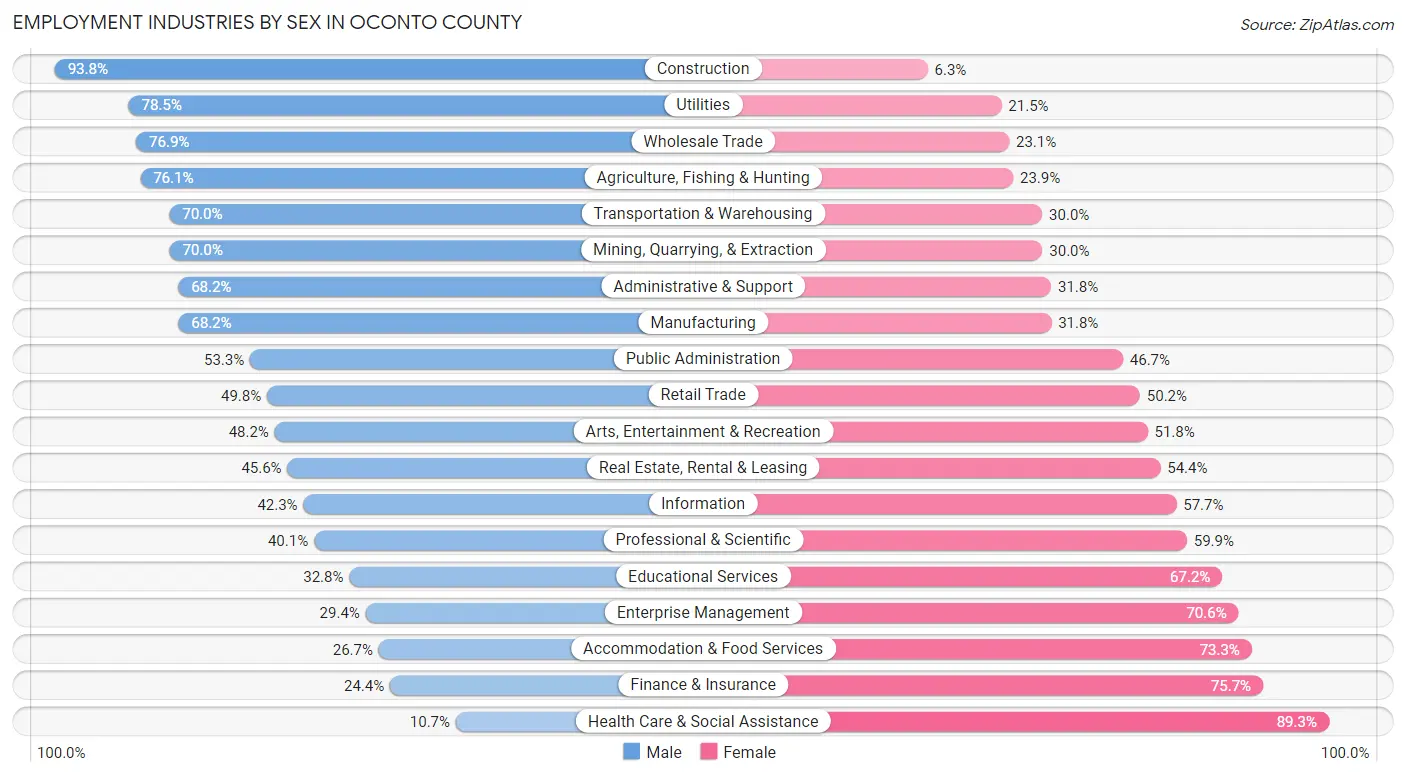
The Oconto County industries that see more men than women are Construction (93.8%), Utilities (78.5%), and Wholesale Trade (76.9%), whereas the industries that tend to have a higher number of women are Health Care & Social Assistance (89.3%), Finance & Insurance (75.6%), and Accommodation & Food Services (73.3%).
| Industry | Male | Female |
| Agriculture, Fishing & Hunting | 483 (76.1%) | 152 (23.9%) |
| Mining, Quarrying, & Extraction | 7 (70.0%) | 3 (30.0%) |
| Construction | 1,979 (93.8%) | 132 (6.2%) |
| Manufacturing | 3,148 (68.2%) | 1,470 (31.8%) |
| Wholesale Trade | 253 (76.9%) | 76 (23.1%) |
| Retail Trade | 826 (49.8%) | 832 (50.2%) |
| Transportation & Warehousing | 657 (70.0%) | 281 (30.0%) |
| Utilities | 124 (78.5%) | 34 (21.5%) |
| Information | 52 (42.3%) | 71 (57.7%) |
| Finance & Insurance | 207 (24.3%) | 643 (75.6%) |
| Real Estate, Rental & Leasing | 93 (45.6%) | 111 (54.4%) |
| Professional & Scientific | 245 (40.1%) | 366 (59.9%) |
| Enterprise Management | 5 (29.4%) | 12 (70.6%) |
| Administrative & Support | 444 (68.2%) | 207 (31.8%) |
| Educational Services | 441 (32.8%) | 904 (67.2%) |
| Health Care & Social Assistance | 262 (10.7%) | 2,180 (89.3%) |
| Arts, Entertainment & Recreation | 177 (48.2%) | 190 (51.8%) |
| Accommodation & Food Services | 234 (26.7%) | 643 (73.3%) |
| Public Administration | 319 (53.3%) | 279 (46.7%) |
| Total | 10,285 (53.6%) | 8,893 (46.4%) |
Education in Oconto County
School Enrollment in Oconto County
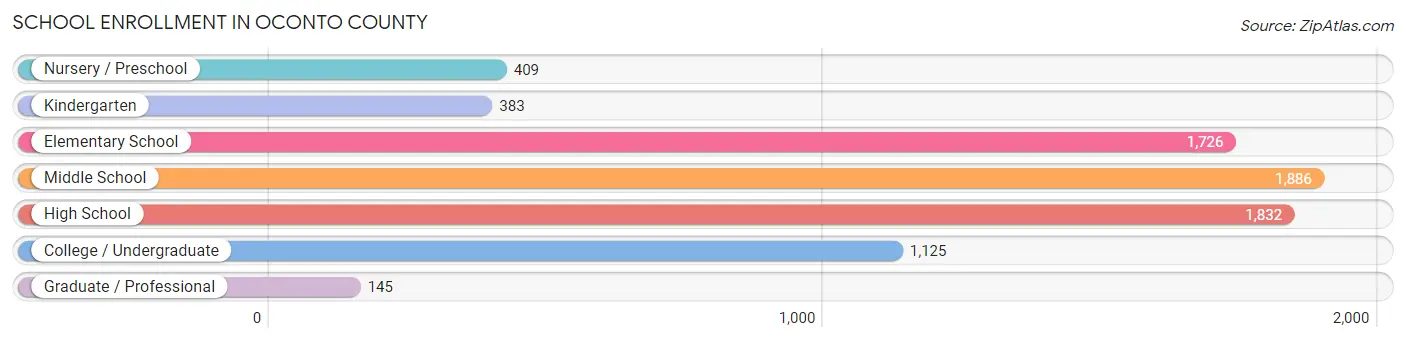
The most common levels of schooling among the 7,506 students in Oconto County are middle school (1,886 | 25.1%), high school (1,832 | 24.4%), and elementary school (1,726 | 23.0%).
| School Level | # Students | % Students |
| Nursery / Preschool | 409 | 5.4% |
| Kindergarten | 383 | 5.1% |
| Elementary School | 1,726 | 23.0% |
| Middle School | 1,886 | 25.1% |
| High School | 1,832 | 24.4% |
| College / Undergraduate | 1,125 | 15.0% |
| Graduate / Professional | 145 | 1.9% |
| Total | 7,506 | 100.0% |
School Enrollment by Age by Funding Source in Oconto County
Out of a total of 7,506 students who are enrolled in schools in Oconto County, 893 (11.9%) attend a private institution, while the remaining 6,613 (88.1%) are enrolled in public schools. The age group of 3 to 4 year olds has the highest likelihood of being enrolled in private schools, with 60 (23.9% in the age bracket) enrolled. Conversely, the age group of 15 to 17 year olds has the lowest likelihood of being enrolled in a private school, with 1,293 (93.7% in the age bracket) attending a public institution.

| Age Bracket | Public School | Private School |
| 3 to 4 Year Olds | 191 (76.1%) | 60 (23.9%) |
| 5 to 9 Year Old | 1,702 (85.4%) | 291 (14.6%) |
| 10 to 14 Year Olds | 2,097 (90.5%) | 219 (9.5%) |
| 15 to 17 Year Olds | 1,293 (93.7%) | 87 (6.3%) |
| 18 to 19 Year Olds | 447 (87.3%) | 65 (12.7%) |
| 20 to 24 Year Olds | 333 (87.9%) | 46 (12.1%) |
| 25 to 34 Year Olds | 214 (83.0%) | 44 (17.1%) |
| 35 Years and over | 338 (81.1%) | 79 (18.9%) |
| Total | 6,613 (88.1%) | 893 (11.9%) |
Educational Attainment by Field of Study in Oconto County
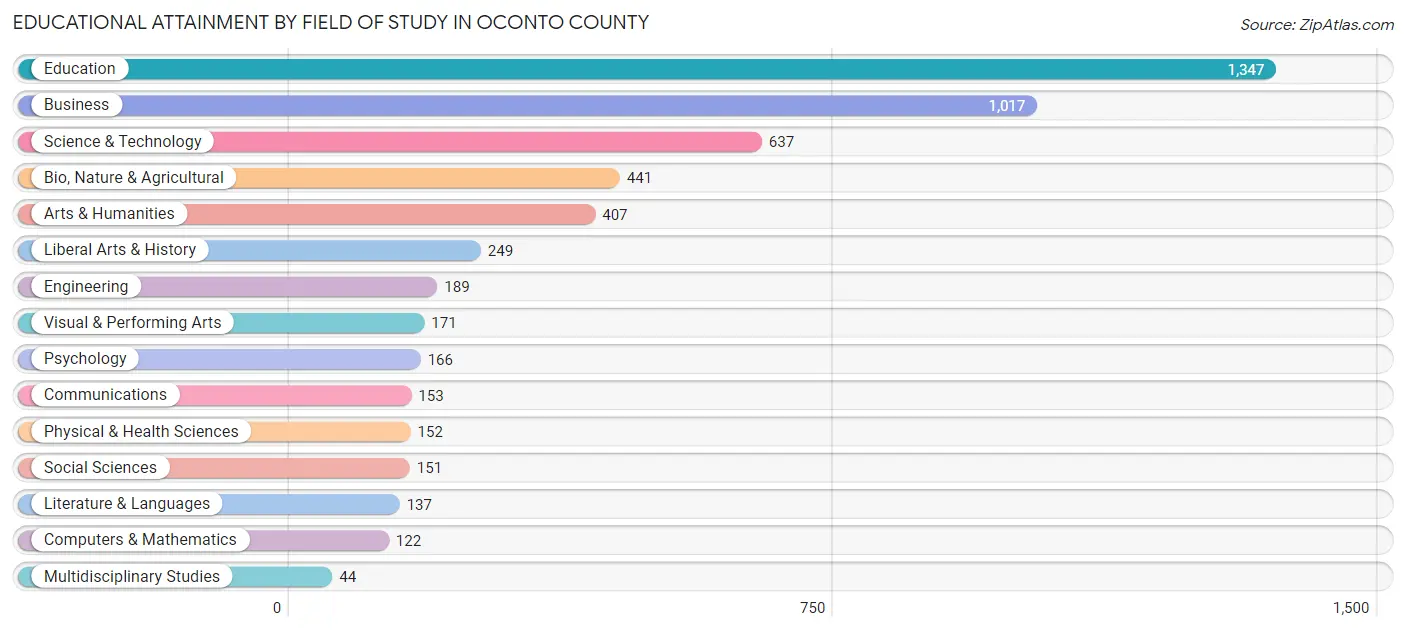
Education (1,347 | 25.0%), business (1,017 | 18.9%), science & technology (637 | 11.8%), bio, nature & agricultural (441 | 8.2%), and arts & humanities (407 | 7.6%) are the most common fields of study among 5,383 individuals in Oconto County who have obtained a bachelor's degree or higher.
| Field of Study | # Graduates | % Graduates |
| Computers & Mathematics | 122 | 2.3% |
| Bio, Nature & Agricultural | 441 | 8.2% |
| Physical & Health Sciences | 152 | 2.8% |
| Psychology | 166 | 3.1% |
| Social Sciences | 151 | 2.8% |
| Engineering | 189 | 3.5% |
| Multidisciplinary Studies | 44 | 0.8% |
| Science & Technology | 637 | 11.8% |
| Business | 1,017 | 18.9% |
| Education | 1,347 | 25.0% |
| Literature & Languages | 137 | 2.5% |
| Liberal Arts & History | 249 | 4.6% |
| Visual & Performing Arts | 171 | 3.2% |
| Communications | 153 | 2.8% |
| Arts & Humanities | 407 | 7.6% |
| Total | 5,383 | 100.0% |
Transportation & Commute in Oconto County
Vehicle Availability by Sex in Oconto County
The most prevalent vehicle ownership categories in Oconto County are males with 2 vehicles (3,977, accounting for 39.1%) and females with 2 vehicles (3,363, making up 45.5%).
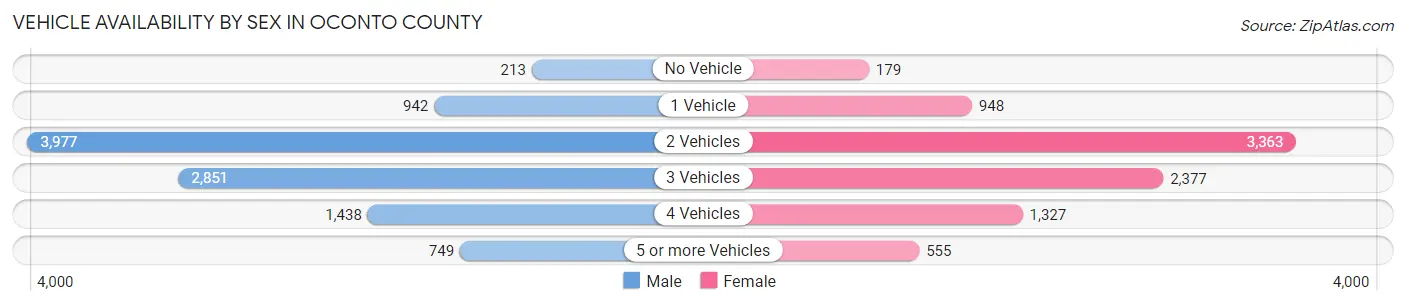
| Vehicles Available | Male | Female |
| No Vehicle | 213 (2.1%) | 179 (2.1%) |
| 1 Vehicle | 942 (9.3%) | 948 (10.8%) |
| 2 Vehicles | 3,977 (39.1%) | 3,363 (38.4%) |
| 3 Vehicles | 2,851 (28.0%) | 2,377 (27.2%) |
| 4 Vehicles | 1,438 (14.1%) | 1,327 (15.2%) |
| 5 or more Vehicles | 749 (7.4%) | 555 (6.3%) |
| Total | 10,170 (100.0%) | 8,749 (100.0%) |
Commute Time in Oconto County
The most frequently occuring commute durations in Oconto County are 30 to 34 minutes (2,823 commuters, 16.5%), 20 to 24 minutes (2,195 commuters, 12.8%), and 5 to 9 minutes (1,838 commuters, 10.7%).
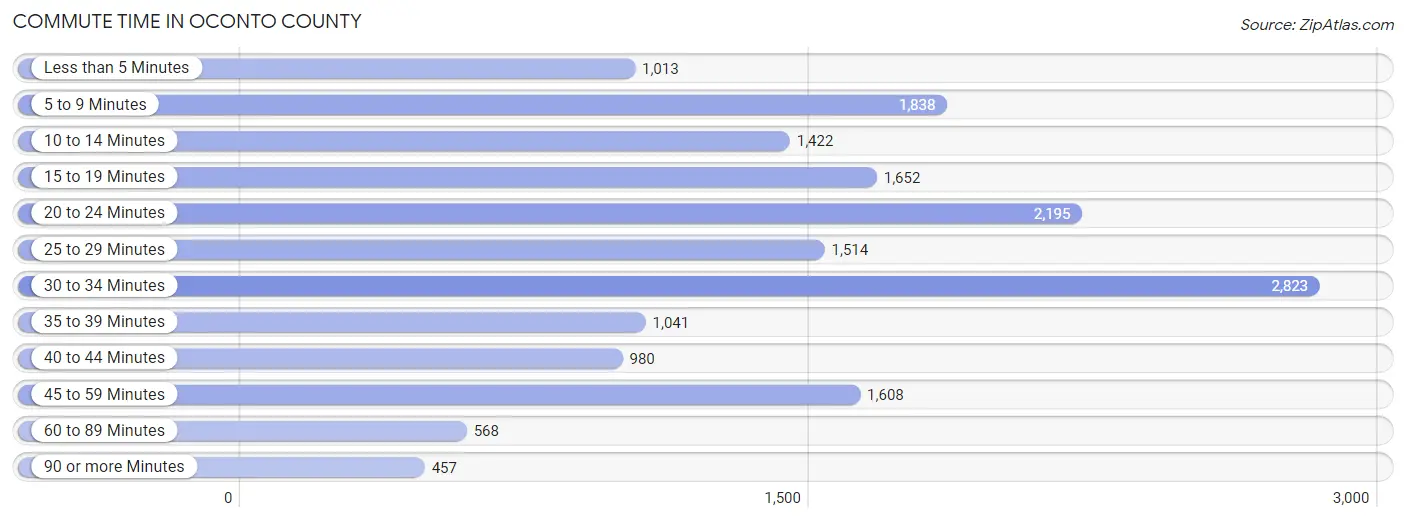
| Commute Time | # Commuters | % Commuters |
| Less than 5 Minutes | 1,013 | 5.9% |
| 5 to 9 Minutes | 1,838 | 10.7% |
| 10 to 14 Minutes | 1,422 | 8.3% |
| 15 to 19 Minutes | 1,652 | 9.7% |
| 20 to 24 Minutes | 2,195 | 12.8% |
| 25 to 29 Minutes | 1,514 | 8.8% |
| 30 to 34 Minutes | 2,823 | 16.5% |
| 35 to 39 Minutes | 1,041 | 6.1% |
| 40 to 44 Minutes | 980 | 5.7% |
| 45 to 59 Minutes | 1,608 | 9.4% |
| 60 to 89 Minutes | 568 | 3.3% |
| 90 or more Minutes | 457 | 2.7% |
Commute Time by Sex in Oconto County
The most common commute times in Oconto County are 30 to 34 minutes (1,679 commuters, 17.8%) for males and 30 to 34 minutes (1,144 commuters, 14.9%) for females.
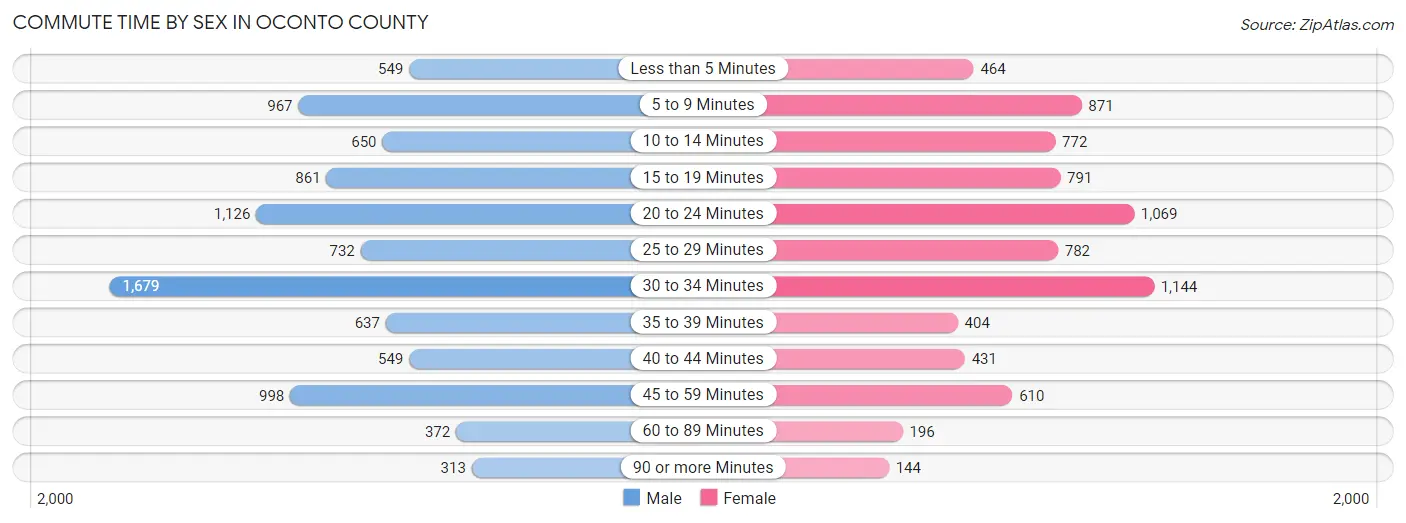
| Commute Time | Male | Female |
| Less than 5 Minutes | 549 (5.8%) | 464 (6.0%) |
| 5 to 9 Minutes | 967 (10.2%) | 871 (11.3%) |
| 10 to 14 Minutes | 650 (6.9%) | 772 (10.1%) |
| 15 to 19 Minutes | 861 (9.1%) | 791 (10.3%) |
| 20 to 24 Minutes | 1,126 (11.9%) | 1,069 (13.9%) |
| 25 to 29 Minutes | 732 (7.8%) | 782 (10.2%) |
| 30 to 34 Minutes | 1,679 (17.8%) | 1,144 (14.9%) |
| 35 to 39 Minutes | 637 (6.8%) | 404 (5.3%) |
| 40 to 44 Minutes | 549 (5.8%) | 431 (5.6%) |
| 45 to 59 Minutes | 998 (10.6%) | 610 (7.9%) |
| 60 to 89 Minutes | 372 (3.9%) | 196 (2.5%) |
| 90 or more Minutes | 313 (3.3%) | 144 (1.9%) |
Time of Departure to Work by Sex in Oconto County
The most frequent times of departure to work in Oconto County are 12:00 AM to 4:59 AM (1,303, 13.8%) for males and 7:00 AM to 7:29 AM (1,309, 17.1%) for females.

| Time of Departure | Male | Female |
| 12:00 AM to 4:59 AM | 1,303 (13.8%) | 782 (10.2%) |
| 5:00 AM to 5:29 AM | 1,095 (11.6%) | 432 (5.6%) |
| 5:30 AM to 5:59 AM | 1,122 (11.9%) | 460 (6.0%) |
| 6:00 AM to 6:29 AM | 1,103 (11.7%) | 664 (8.6%) |
| 6:30 AM to 6:59 AM | 1,105 (11.7%) | 902 (11.7%) |
| 7:00 AM to 7:29 AM | 1,156 (12.2%) | 1,309 (17.1%) |
| 7:30 AM to 7:59 AM | 629 (6.7%) | 832 (10.8%) |
| 8:00 AM to 8:29 AM | 346 (3.7%) | 492 (6.4%) |
| 8:30 AM to 8:59 AM | 226 (2.4%) | 231 (3.0%) |
| 9:00 AM to 9:59 AM | 200 (2.1%) | 281 (3.7%) |
| 10:00 AM to 10:59 AM | 99 (1.1%) | 140 (1.8%) |
| 11:00 AM to 11:59 AM | 51 (0.5%) | 86 (1.1%) |
| 12:00 PM to 3:59 PM | 587 (6.2%) | 607 (7.9%) |
| 4:00 PM to 11:59 PM | 411 (4.4%) | 460 (6.0%) |
| Total | 9,433 (100.0%) | 7,678 (100.0%) |
Housing Occupancy in Oconto County
Occupancy by Ownership in Oconto County
Of the total 16,338 dwellings in Oconto County, owner-occupied units account for 13,783 (84.4%), while renter-occupied units make up 2,555 (15.6%).

| Occupancy | # Housing Units | % Housing Units |
| Owner Occupied Housing Units | 13,783 | 84.4% |
| Renter-Occupied Housing Units | 2,555 | 15.6% |
| Total Occupied Housing Units | 16,338 | 100.0% |
Occupancy by Household Size in Oconto County

| Household Size | # Housing Units | % Housing Units |
| 1-Person Household | 3,974 | 24.3% |
| 2-Person Household | 7,318 | 44.8% |
| 3-Person Household | 2,245 | 13.7% |
| 4+ Person Household | 2,801 | 17.1% |
| Total Housing Units | 16,338 | 100.0% |
Occupancy by Ownership by Household Size in Oconto County
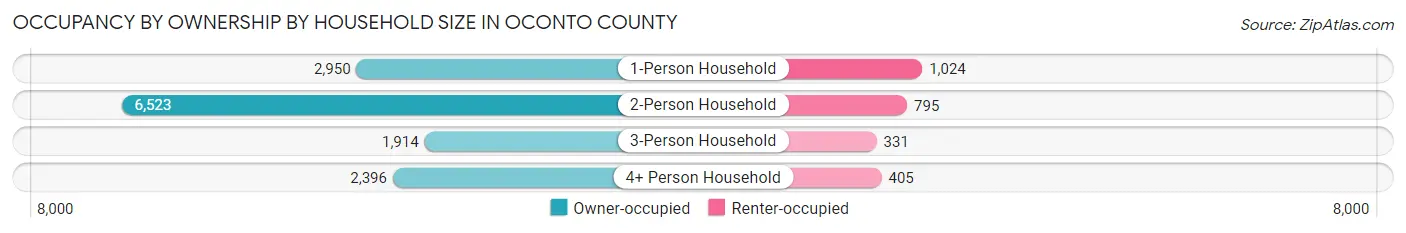
| Household Size | Owner-occupied | Renter-occupied |
| 1-Person Household | 2,950 (74.2%) | 1,024 (25.8%) |
| 2-Person Household | 6,523 (89.1%) | 795 (10.9%) |
| 3-Person Household | 1,914 (85.3%) | 331 (14.7%) |
| 4+ Person Household | 2,396 (85.5%) | 405 (14.5%) |
| Total Housing Units | 13,783 (84.4%) | 2,555 (15.6%) |
Occupancy by Educational Attainment in Oconto County
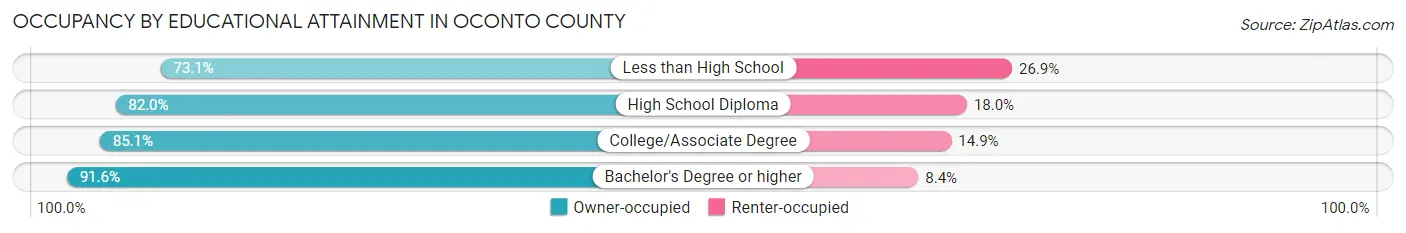
| Household Size | Owner-occupied | Renter-occupied |
| Less than High School | 773 (73.1%) | 285 (26.9%) |
| High School Diploma | 5,019 (82.0%) | 1,102 (18.0%) |
| College/Associate Degree | 5,217 (85.1%) | 915 (14.9%) |
| Bachelor's Degree or higher | 2,774 (91.6%) | 253 (8.4%) |
Occupancy by Age of Householder in Oconto County
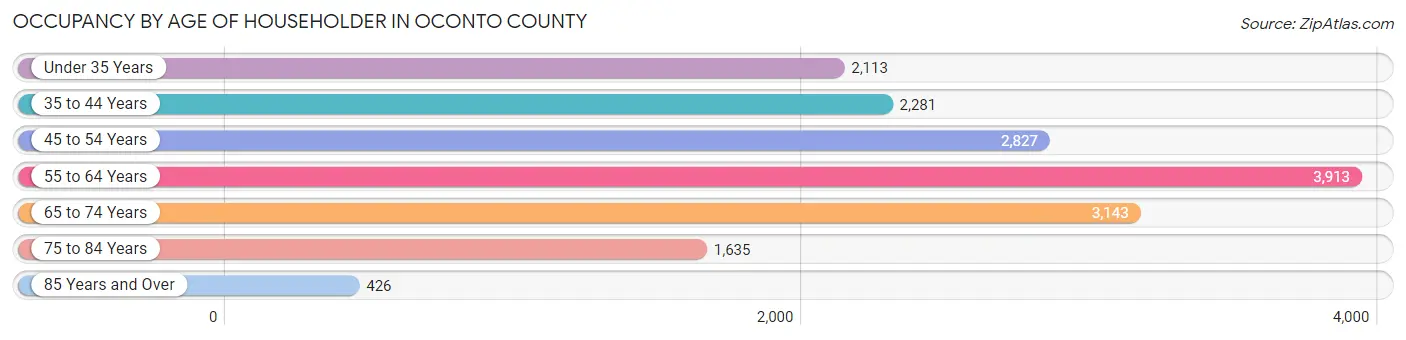
| Age Bracket | # Households | % Households |
| Under 35 Years | 2,113 | 12.9% |
| 35 to 44 Years | 2,281 | 14.0% |
| 45 to 54 Years | 2,827 | 17.3% |
| 55 to 64 Years | 3,913 | 23.9% |
| 65 to 74 Years | 3,143 | 19.2% |
| 75 to 84 Years | 1,635 | 10.0% |
| 85 Years and Over | 426 | 2.6% |
| Total | 16,338 | 100.0% |
Housing Finances in Oconto County
Median Income by Occupancy in Oconto County
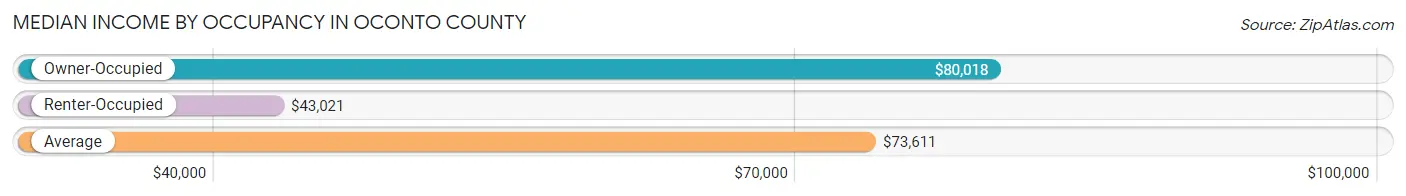
| Occupancy Type | # Households | Median Income |
| Owner-Occupied | 13,783 (84.4%) | $80,018 |
| Renter-Occupied | 2,555 (15.6%) | $43,021 |
| Average | 16,338 (100.0%) | $73,611 |
Occupancy by Householder Income Bracket in Oconto County
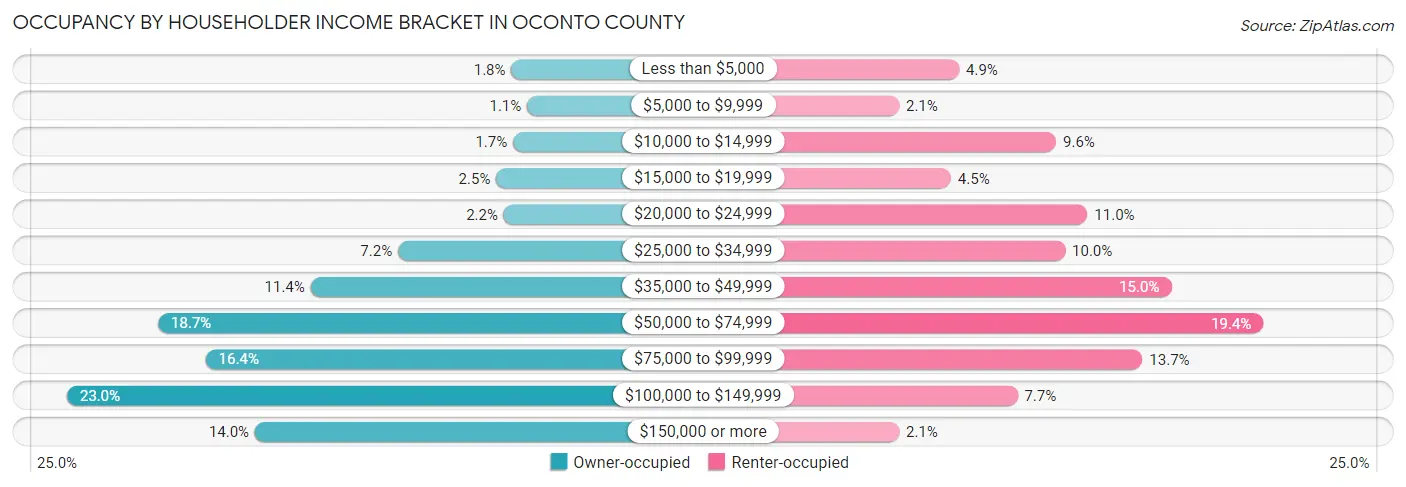
| Income Bracket | Owner-occupied | Renter-occupied |
| Less than $5,000 | 251 (1.8%) | 126 (4.9%) |
| $5,000 to $9,999 | 147 (1.1%) | 53 (2.1%) |
| $10,000 to $14,999 | 240 (1.7%) | 244 (9.6%) |
| $15,000 to $19,999 | 350 (2.5%) | 116 (4.5%) |
| $20,000 to $24,999 | 301 (2.2%) | 282 (11.0%) |
| $25,000 to $34,999 | 995 (7.2%) | 255 (10.0%) |
| $35,000 to $49,999 | 1,568 (11.4%) | 384 (15.0%) |
| $50,000 to $74,999 | 2,571 (18.6%) | 496 (19.4%) |
| $75,000 to $99,999 | 2,257 (16.4%) | 349 (13.7%) |
| $100,000 to $149,999 | 3,169 (23.0%) | 197 (7.7%) |
| $150,000 or more | 1,934 (14.0%) | 53 (2.1%) |
| Total | 13,783 (100.0%) | 2,555 (100.0%) |
Monthly Housing Cost Tiers in Oconto County
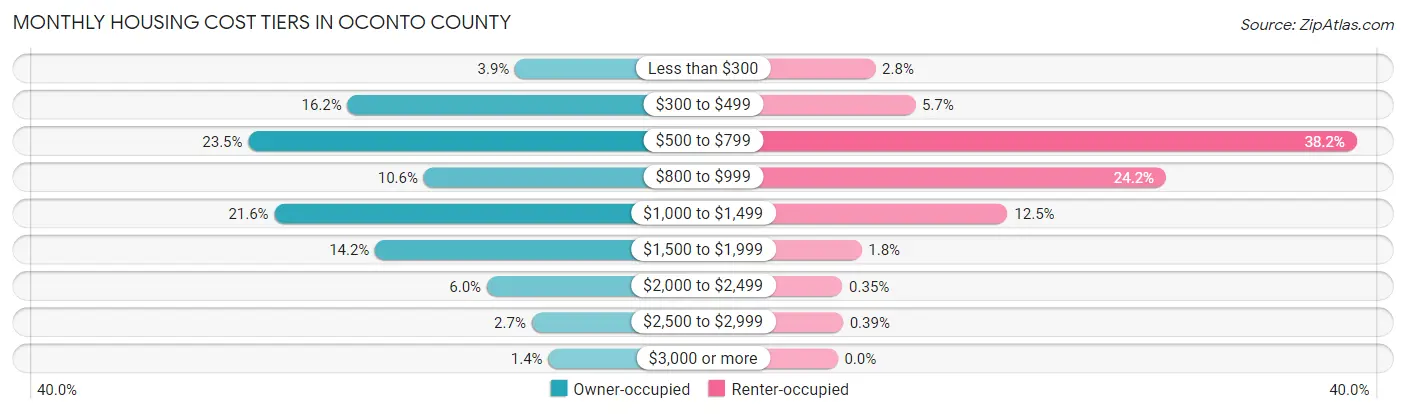
| Monthly Cost | Owner-occupied | Renter-occupied |
| Less than $300 | 533 (3.9%) | 71 (2.8%) |
| $300 to $499 | 2,234 (16.2%) | 146 (5.7%) |
| $500 to $799 | 3,242 (23.5%) | 977 (38.2%) |
| $800 to $999 | 1,461 (10.6%) | 618 (24.2%) |
| $1,000 to $1,499 | 2,977 (21.6%) | 320 (12.5%) |
| $1,500 to $1,999 | 1,955 (14.2%) | 45 (1.8%) |
| $2,000 to $2,499 | 820 (5.9%) | 9 (0.4%) |
| $2,500 to $2,999 | 365 (2.6%) | 10 (0.4%) |
| $3,000 or more | 196 (1.4%) | 0 (0.0%) |
| Total | 13,783 (100.0%) | 2,555 (100.0%) |
Physical Housing Characteristics in Oconto County
Housing Structures in Oconto County
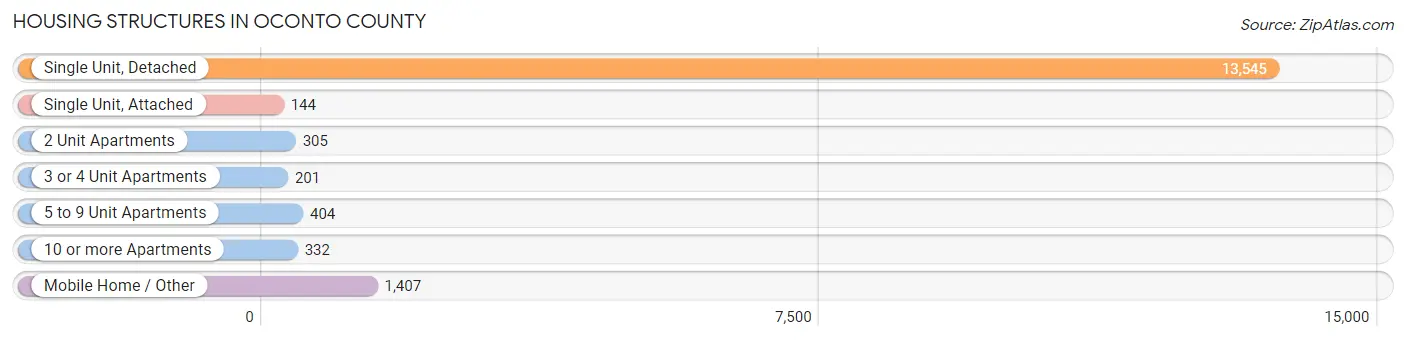
| Structure Type | # Housing Units | % Housing Units |
| Single Unit, Detached | 13,545 | 82.9% |
| Single Unit, Attached | 144 | 0.9% |
| 2 Unit Apartments | 305 | 1.9% |
| 3 or 4 Unit Apartments | 201 | 1.2% |
| 5 to 9 Unit Apartments | 404 | 2.5% |
| 10 or more Apartments | 332 | 2.0% |
| Mobile Home / Other | 1,407 | 8.6% |
| Total | 16,338 | 100.0% |
Housing Structures by Occupancy in Oconto County
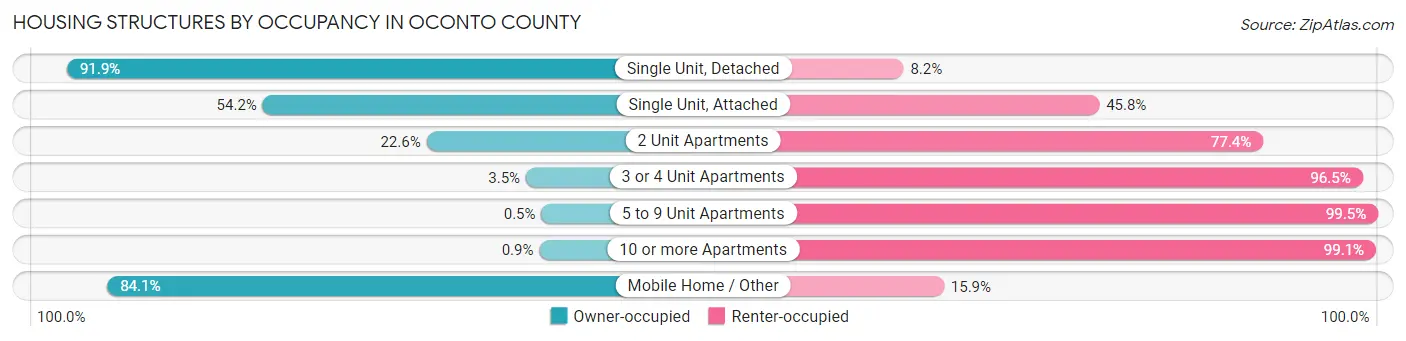
| Structure Type | Owner-occupied | Renter-occupied |
| Single Unit, Detached | 12,441 (91.8%) | 1,104 (8.2%) |
| Single Unit, Attached | 78 (54.2%) | 66 (45.8%) |
| 2 Unit Apartments | 69 (22.6%) | 236 (77.4%) |
| 3 or 4 Unit Apartments | 7 (3.5%) | 194 (96.5%) |
| 5 to 9 Unit Apartments | 2 (0.5%) | 402 (99.5%) |
| 10 or more Apartments | 3 (0.9%) | 329 (99.1%) |
| Mobile Home / Other | 1,183 (84.1%) | 224 (15.9%) |
| Total | 13,783 (84.4%) | 2,555 (15.6%) |
Housing Structures by Number of Rooms in Oconto County

| Number of Rooms | Owner-occupied | Renter-occupied |
| 1 Room | 29 (0.2%) | 26 (1.0%) |
| 2 or 3 Rooms | 454 (3.3%) | 658 (25.8%) |
| 4 or 5 Rooms | 4,671 (33.9%) | 1,157 (45.3%) |
| 6 or 7 Rooms | 5,233 (38.0%) | 471 (18.4%) |
| 8 or more Rooms | 3,396 (24.6%) | 243 (9.5%) |
| Total | 13,783 (100.0%) | 2,555 (100.0%) |
Housing Structure by Heating Type in Oconto County

| Heating Type | Owner-occupied | Renter-occupied |
| Utility Gas | 6,414 (46.5%) | 1,205 (47.2%) |
| Bottled, Tank, or LP Gas | 4,687 (34.0%) | 519 (20.3%) |
| Electricity | 827 (6.0%) | 631 (24.7%) |
| Fuel Oil or Kerosene | 339 (2.5%) | 28 (1.1%) |
| Coal or Coke | 0 (0.0%) | 0 (0.0%) |
| All other Fuels | 1,466 (10.6%) | 166 (6.5%) |
| No Fuel Used | 50 (0.4%) | 6 (0.2%) |
| Total | 13,783 (100.0%) | 2,555 (100.0%) |
Household Vehicle Usage in Oconto County
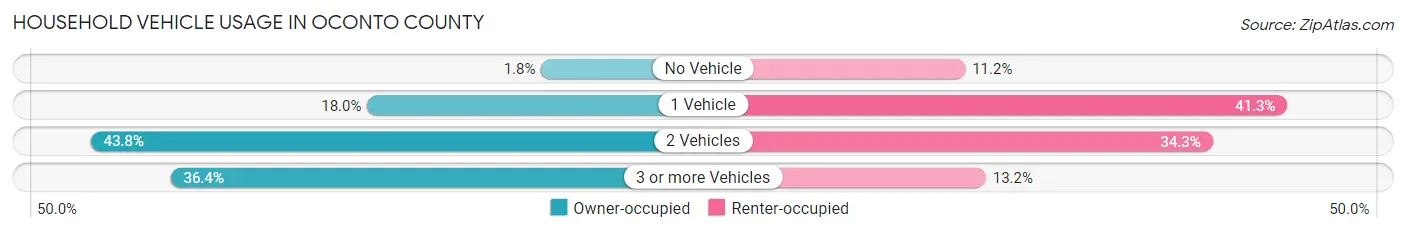
| Vehicles per Household | Owner-occupied | Renter-occupied |
| No Vehicle | 244 (1.8%) | 287 (11.2%) |
| 1 Vehicle | 2,483 (18.0%) | 1,055 (41.3%) |
| 2 Vehicles | 6,043 (43.8%) | 877 (34.3%) |
| 3 or more Vehicles | 5,013 (36.4%) | 336 (13.2%) |
| Total | 13,783 (100.0%) | 2,555 (100.0%) |
Real Estate & Mortgages in Oconto County
Real Estate and Mortgage Overview in Oconto County
| Characteristic | Without Mortgage | With Mortgage |
| Housing Units | 6,088 | 7,695 |
| Median Property Value | $165,000 | $216,900 |
| Median Household Income | $59,531 | $1,359 |
| Monthly Housing Costs | $526 | $182 |
| Real Estate Taxes | $2,349 | $70 |
Property Value by Mortgage Status in Oconto County
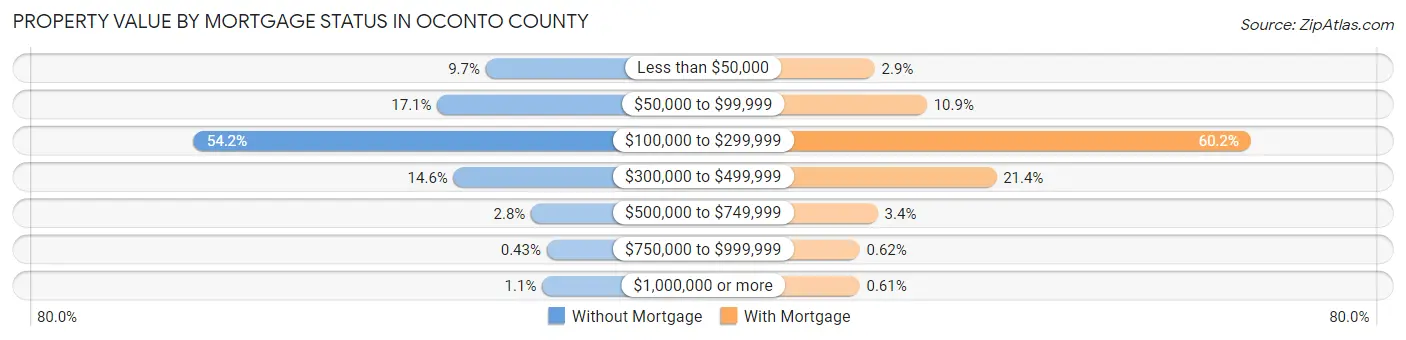
| Property Value | Without Mortgage | With Mortgage |
| Less than $50,000 | 592 (9.7%) | 223 (2.9%) |
| $50,000 to $99,999 | 1,041 (17.1%) | 835 (10.8%) |
| $100,000 to $299,999 | 3,300 (54.2%) | 4,634 (60.2%) |
| $300,000 to $499,999 | 890 (14.6%) | 1,649 (21.4%) |
| $500,000 to $749,999 | 171 (2.8%) | 259 (3.4%) |
| $750,000 to $999,999 | 26 (0.4%) | 48 (0.6%) |
| $1,000,000 or more | 68 (1.1%) | 47 (0.6%) |
| Total | 6,088 (100.0%) | 7,695 (100.0%) |
Household Income by Mortgage Status in Oconto County
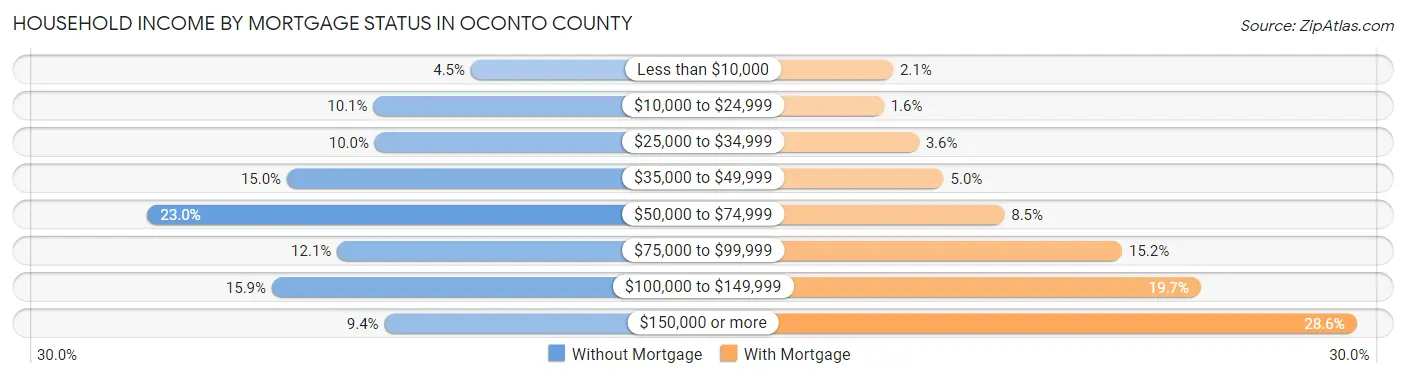
| Household Income | Without Mortgage | With Mortgage |
| Less than $10,000 | 274 (4.5%) | 165 (2.1%) |
| $10,000 to $24,999 | 613 (10.1%) | 124 (1.6%) |
| $25,000 to $34,999 | 608 (10.0%) | 278 (3.6%) |
| $35,000 to $49,999 | 914 (15.0%) | 387 (5.0%) |
| $50,000 to $74,999 | 1,399 (23.0%) | 654 (8.5%) |
| $75,000 to $99,999 | 739 (12.1%) | 1,172 (15.2%) |
| $100,000 to $149,999 | 966 (15.9%) | 1,518 (19.7%) |
| $150,000 or more | 575 (9.4%) | 2,203 (28.6%) |
| Total | 6,088 (100.0%) | 7,695 (100.0%) |
Property Value to Household Income Ratio in Oconto County

| Value-to-Income Ratio | Without Mortgage | With Mortgage |
| Less than 2.0x | 2,359 (38.8%) | 95,667 (1,243.2%) |
| 2.0x to 2.9x | 888 (14.6%) | 3,324 (43.2%) |
| 3.0x to 3.9x | 794 (13.0%) | 2,038 (26.5%) |
| 4.0x or more | 1,942 (31.9%) | 797 (10.4%) |
| Total | 6,088 (100.0%) | 7,695 (100.0%) |
Real Estate Taxes by Mortgage Status in Oconto County

| Property Taxes | Without Mortgage | With Mortgage |
| Less than $800 | 551 (9.0%) | 25 (0.3%) |
| $800 to $1,499 | 1,083 (17.8%) | 243 (3.2%) |
| $800 to $1,499 | 4,306 (70.7%) | 1,066 (13.9%) |
| Total | 6,088 (100.0%) | 7,695 (100.0%) |
Health & Disability in Oconto County
Health Insurance Coverage by Age in Oconto County
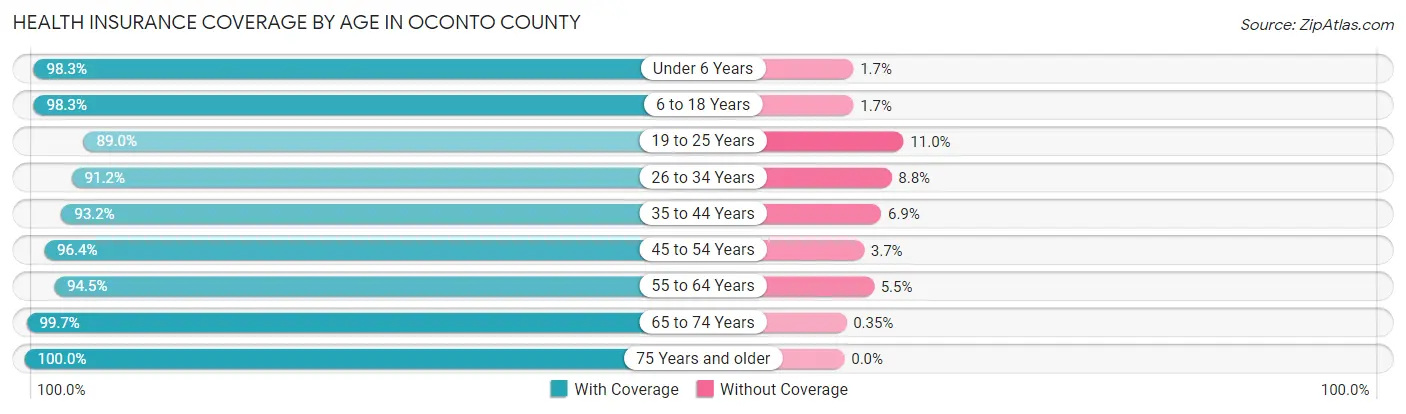
| Age Bracket | With Coverage | Without Coverage |
| Under 6 Years | 2,181 (98.3%) | 37 (1.7%) |
| 6 to 18 Years | 5,847 (98.3%) | 100 (1.7%) |
| 19 to 25 Years | 2,060 (89.0%) | 255 (11.0%) |
| 26 to 34 Years | 3,267 (91.2%) | 314 (8.8%) |
| 35 to 44 Years | 4,134 (93.1%) | 304 (6.9%) |
| 45 to 54 Years | 4,914 (96.4%) | 186 (3.6%) |
| 55 to 64 Years | 6,475 (94.5%) | 376 (5.5%) |
| 65 to 74 Years | 5,166 (99.7%) | 18 (0.4%) |
| 75 Years and older | 3,116 (100.0%) | 0 (0.0%) |
| Total | 37,160 (95.9%) | 1,590 (4.1%) |
Health Insurance Coverage by Citizenship Status in Oconto County
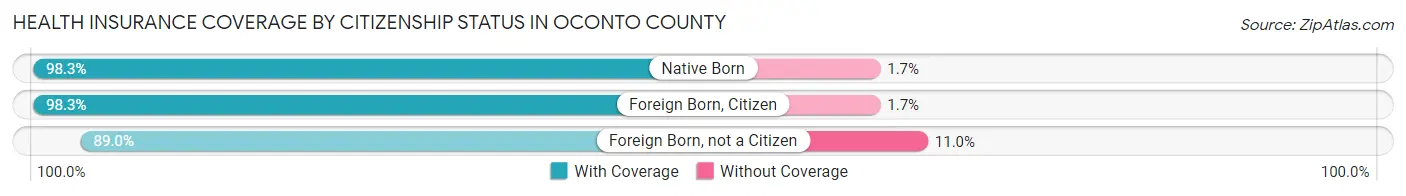
| Citizenship Status | With Coverage | Without Coverage |
| Native Born | 2,181 (98.3%) | 37 (1.7%) |
| Foreign Born, Citizen | 5,847 (98.3%) | 100 (1.7%) |
| Foreign Born, not a Citizen | 2,060 (89.0%) | 255 (11.0%) |
Health Insurance Coverage by Household Income in Oconto County
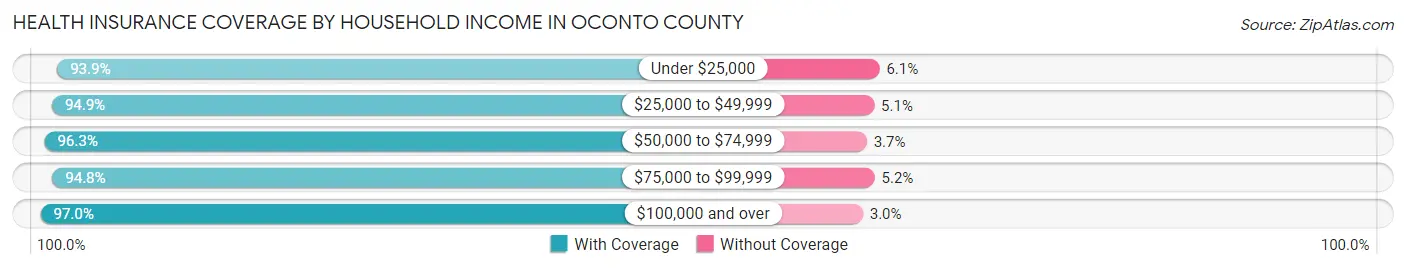
| Household Income | With Coverage | Without Coverage |
| Under $25,000 | 3,066 (93.9%) | 200 (6.1%) |
| $25,000 to $49,999 | 5,773 (94.9%) | 312 (5.1%) |
| $50,000 to $74,999 | 6,460 (96.3%) | 250 (3.7%) |
| $75,000 to $99,999 | 6,385 (94.8%) | 351 (5.2%) |
| $100,000 and over | 15,419 (97.0%) | 477 (3.0%) |
Public vs Private Health Insurance Coverage by Age in Oconto County
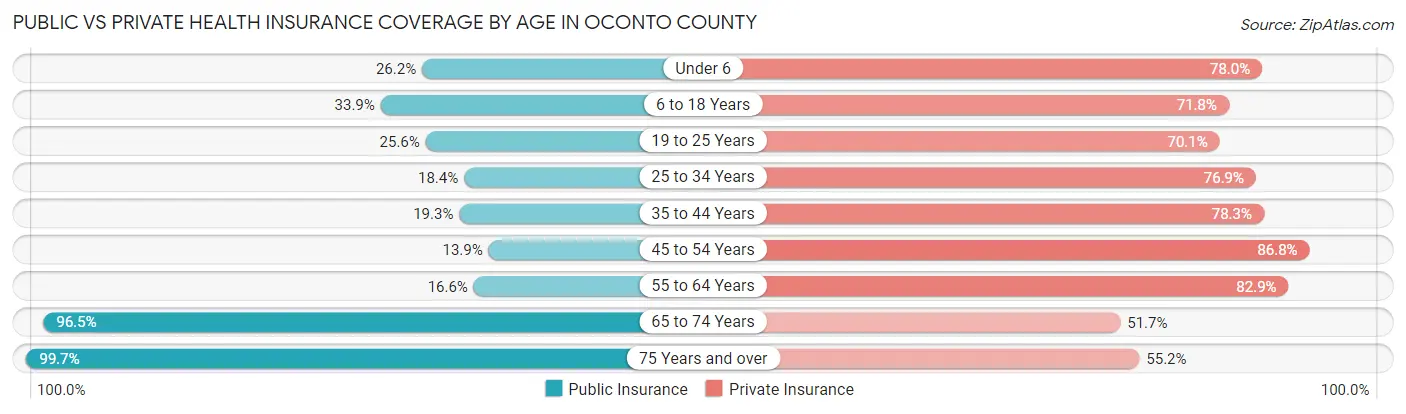
| Age Bracket | Public Insurance | Private Insurance |
| Under 6 | 582 (26.2%) | 1,730 (78.0%) |
| 6 to 18 Years | 2,017 (33.9%) | 4,272 (71.8%) |
| 19 to 25 Years | 592 (25.6%) | 1,623 (70.1%) |
| 25 to 34 Years | 660 (18.4%) | 2,752 (76.8%) |
| 35 to 44 Years | 858 (19.3%) | 3,476 (78.3%) |
| 45 to 54 Years | 708 (13.9%) | 4,427 (86.8%) |
| 55 to 64 Years | 1,140 (16.6%) | 5,679 (82.9%) |
| 65 to 74 Years | 5,004 (96.5%) | 2,680 (51.7%) |
| 75 Years and over | 3,106 (99.7%) | 1,721 (55.2%) |
| Total | 14,667 (37.9%) | 28,360 (73.2%) |
Disability Status by Sex by Age in Oconto County
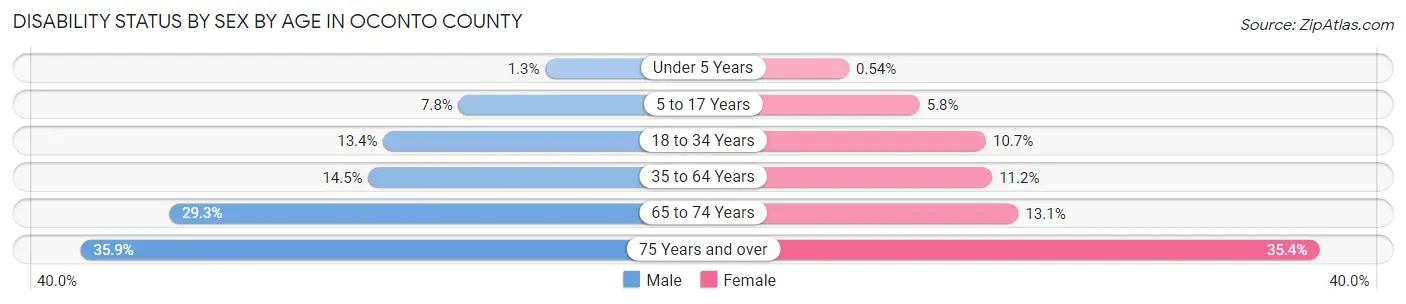
| Age Bracket | Male | Female |
| Under 5 Years | 12 (1.3%) | 5 (0.5%) |
| 5 to 17 Years | 237 (7.8%) | 166 (5.8%) |
| 18 to 34 Years | 435 (13.4%) | 329 (10.7%) |
| 35 to 64 Years | 1,230 (14.5%) | 881 (11.2%) |
| 65 to 74 Years | 817 (29.3%) | 314 (13.1%) |
| 75 Years and over | 508 (35.8%) | 602 (35.4%) |
Disability Class by Sex by Age in Oconto County
Disability Class: Hearing Difficulty
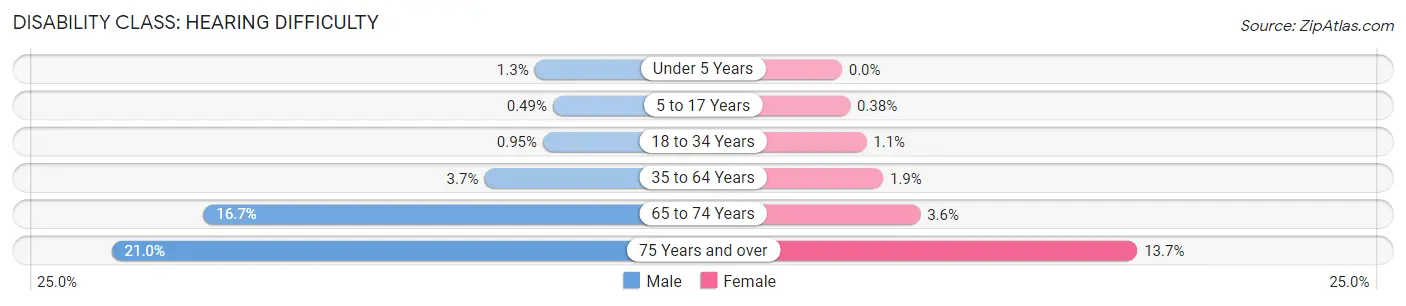
| Age Bracket | Male | Female |
| Under 5 Years | 12 (1.3%) | 0 (0.0%) |
| 5 to 17 Years | 15 (0.5%) | 11 (0.4%) |
| 18 to 34 Years | 31 (0.9%) | 35 (1.1%) |
| 35 to 64 Years | 312 (3.7%) | 151 (1.9%) |
| 65 to 74 Years | 466 (16.7%) | 87 (3.6%) |
| 75 Years and over | 297 (21.0%) | 233 (13.7%) |
Disability Class: Vision Difficulty

| Age Bracket | Male | Female |
| Under 5 Years | 6 (0.7%) | 5 (0.5%) |
| 5 to 17 Years | 31 (1.0%) | 62 (2.2%) |
| 18 to 34 Years | 4 (0.1%) | 3 (0.1%) |
| 35 to 64 Years | 219 (2.6%) | 155 (2.0%) |
| 65 to 74 Years | 62 (2.2%) | 74 (3.1%) |
| 75 Years and over | 104 (7.3%) | 124 (7.3%) |
Disability Class: Cognitive Difficulty
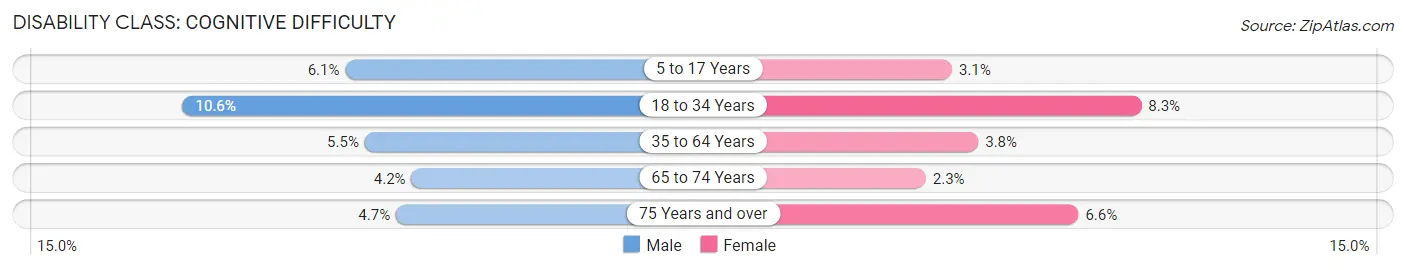
| Age Bracket | Male | Female |
| 5 to 17 Years | 185 (6.1%) | 88 (3.1%) |
| 18 to 34 Years | 345 (10.6%) | 256 (8.3%) |
| 35 to 64 Years | 470 (5.5%) | 300 (3.8%) |
| 65 to 74 Years | 118 (4.2%) | 56 (2.3%) |
| 75 Years and over | 66 (4.7%) | 112 (6.6%) |
Disability Class: Ambulatory Difficulty
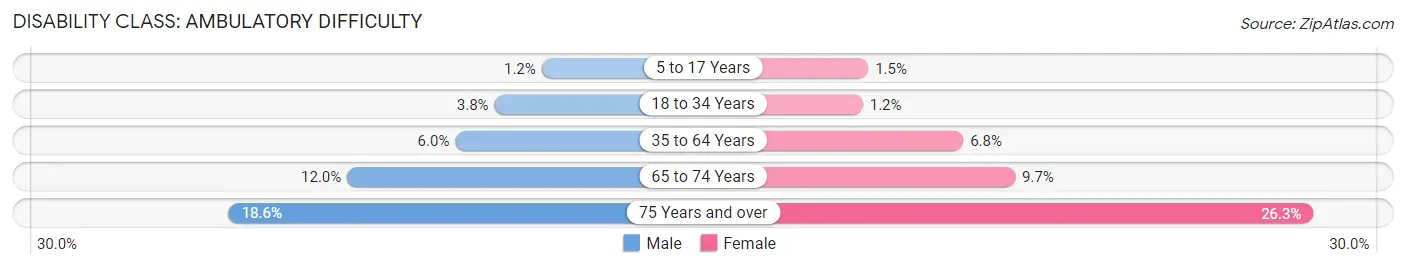
| Age Bracket | Male | Female |
| 5 to 17 Years | 37 (1.2%) | 42 (1.5%) |
| 18 to 34 Years | 125 (3.8%) | 36 (1.2%) |
| 35 to 64 Years | 512 (6.0%) | 533 (6.8%) |
| 65 to 74 Years | 336 (12.0%) | 231 (9.7%) |
| 75 Years and over | 264 (18.6%) | 446 (26.3%) |
Disability Class: Self-Care Difficulty
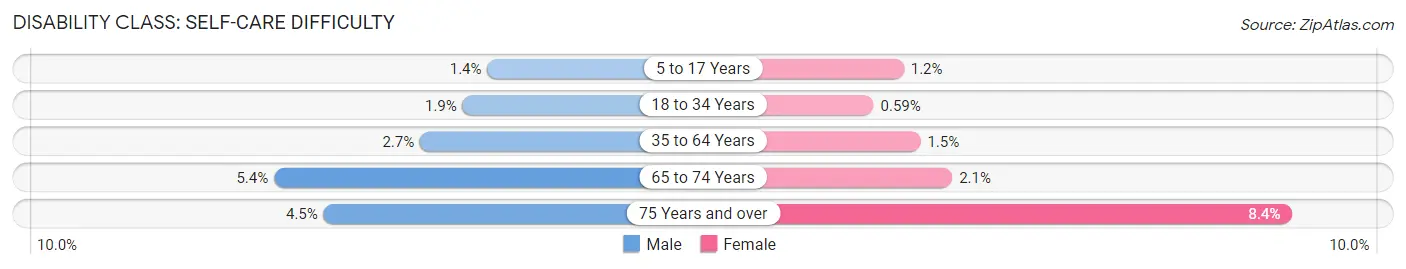
| Age Bracket | Male | Female |
| 5 to 17 Years | 43 (1.4%) | 33 (1.1%) |
| 18 to 34 Years | 61 (1.9%) | 18 (0.6%) |
| 35 to 64 Years | 226 (2.7%) | 115 (1.5%) |
| 65 to 74 Years | 150 (5.4%) | 49 (2.1%) |
| 75 Years and over | 63 (4.4%) | 142 (8.4%) |
Technology Access in Oconto County
Computing Device Access in Oconto County
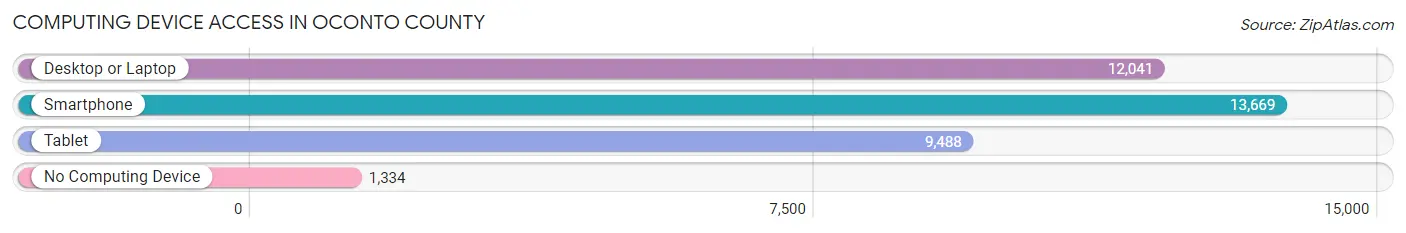
| Device Type | # Households | % Households |
| Desktop or Laptop | 12,041 | 73.7% |
| Smartphone | 13,669 | 83.7% |
| Tablet | 9,488 | 58.1% |
| No Computing Device | 1,334 | 8.2% |
| Total | 16,338 | 100.0% |
Internet Access in Oconto County
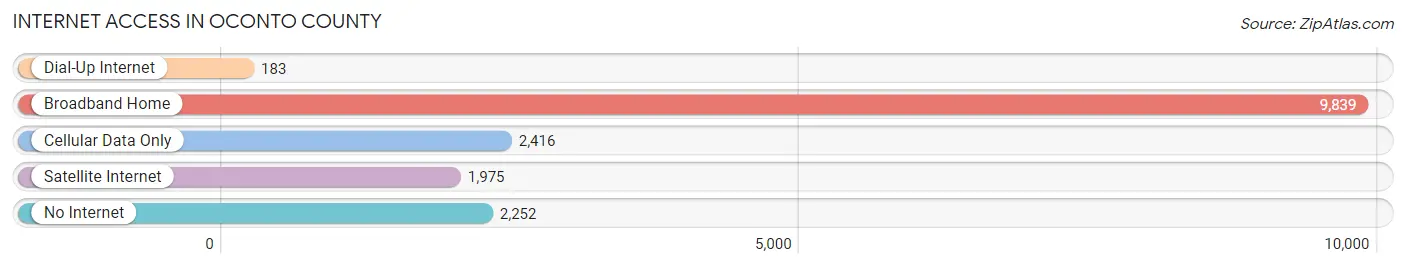
| Internet Type | # Households | % Households |
| Dial-Up Internet | 183 | 1.1% |
| Broadband Home | 9,839 | 60.2% |
| Cellular Data Only | 2,416 | 14.8% |
| Satellite Internet | 1,975 | 12.1% |
| No Internet | 2,252 | 13.8% |
| Total | 16,338 | 100.0% |
Oconto County Summary
Oconto County is located in the northeastern part of Wisconsin, and is part of the Green Bay Metropolitan Statistical Area. It is bordered by Marinette County to the north, Shawano County to the east, Brown County to the south, and Door County to the west. The county seat is Oconto, and the largest city is Oconto Falls. The county has a total area of 1,541 square miles, of which 1,521 square miles is land and 20 square miles is water.
The geography of Oconto County is mostly rural, with rolling hills, forests, and numerous lakes and rivers. The county is home to the Peshtigo River State Forest, which is the largest state forest in Wisconsin. The county also contains the Nicolet National Forest, which is the only national forest in the state. The county is also home to the Oconto River, which is a popular destination for fishing and canoeing.
The economy of Oconto County is largely based on agriculture and tourism. The county is home to numerous dairy farms, as well as beef and poultry farms. The county is also home to several wineries and breweries, as well as a number of small businesses. Tourism is also an important part of the economy, with visitors coming to the county to enjoy its natural beauty and outdoor activities.
As of the 2010 census, the population of Oconto County was 37,660. The population is largely white (96.2%), with small percentages of African American (1.2%), Native American (0.7%), Asian (0.4%), and other races (1.5%). The median household income in the county is $45,945, and the median age is 44.7 years.
Oconto County has a rich history, dating back to the early 1800s when it was part of the Wisconsin Territory. The county was officially established in 1851, and was named after the Oconto River. The county has a long history of logging and lumbering, and was once home to the world’s largest sawmill. The county also has a long history of agriculture, with dairy farming being the main industry.
Oconto County is a beautiful and diverse area of Wisconsin, with a rich history and a strong economy. The county is home to numerous farms, wineries, breweries, and small businesses, as well as a variety of outdoor activities. The county is also home to a diverse population, with a median age of 44.7 years and a median household income of $45,945. Oconto County is a great place to live, work, and play.
Common Questions
What is the Total Population of Oconto County?
Total Population of Oconto County is 39,048.
What is the Total Male Population of Oconto County?
Total Male Population of Oconto County is 20,030.
What is the Total Female Population of Oconto County?
Total Female Population of Oconto County is 19,018.
What is the Ratio of Males per 100 Females in Oconto County?
There are 105.32 Males per 100 Females in Oconto County.
What is the Ratio of Females per 100 Males in Oconto County?
There are 94.95 Females per 100 Males in Oconto County.
What is the Median Population Age in Oconto County?
Median Population Age in Oconto County is 47.5 Years.
What is the Average Family Size in Oconto County
Average Family Size in Oconto County is 2.8 People.
What is the Average Household Size in Oconto County
Average Household Size in Oconto County is 2.4 People.
What is Per Capita Income in Oconto County?
Per Capita income in Oconto County is $37,124.
What is the Median Family Income in Oconto County?
Median Family Income in Oconto County is $88,202.
What is the Median Household income in Oconto County?
Median Household Income in Oconto County is $73,611.
What is Income or Wage Gap in Oconto County?
Income or Wage Gap in Oconto County is 34.7%.
Women in Oconto County earn 65.3 cents for every dollar earned by a man.
What is Family Income Deficit in Oconto County?
Family Income Deficit in Oconto County is $8,820.
Families that are below poverty line in Oconto County earn $8,820 less on average than the poverty threshold level.
What is Inequality or Gini Index in Oconto County?
Inequality or Gini Index in Oconto County is 0.39.
How Large is the Labor Force in Oconto County?
There are 19,570 People in the Labor Forcein in Oconto County.
What is the Percentage of People in the Labor Force in Oconto County?
60.6% of People are in the Labor Force in Oconto County.
What is the Unemployment Rate in Oconto County?
Unemployment Rate in Oconto County is 2.0%.