Milwaukee County, WI
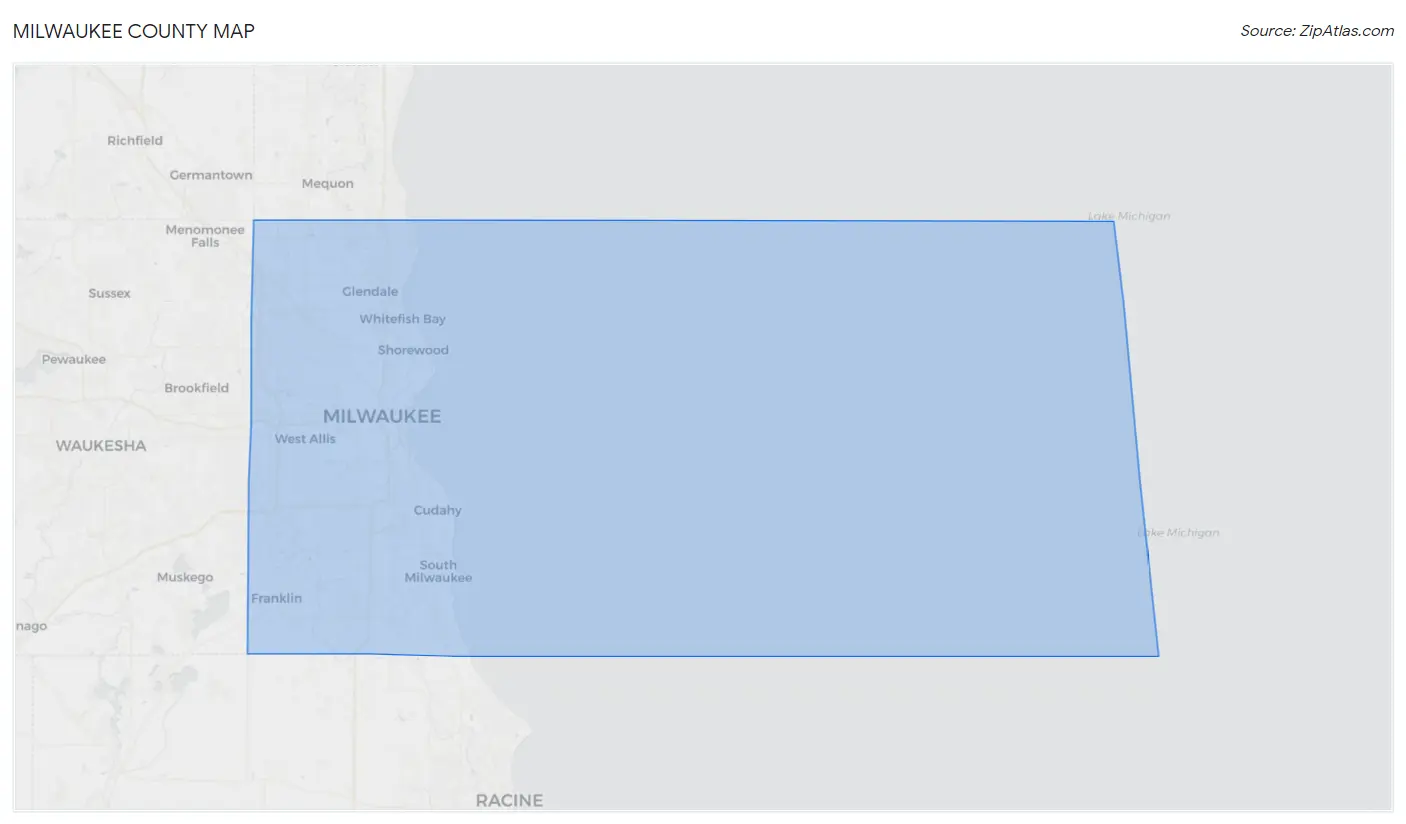
Milwaukee County Map
Milwaukee County Overview
933,063
TOTAL POPULATION
454,480
MALE POPULATION
478,583
FEMALE POPULATION
94.96
MALES / 100 FEMALES
105.30
FEMALES / 100 MALES
35.3
MEDIAN AGE
3.2
AVG FAMILY SIZE
2.3
AVG HOUSEHOLD SIZE
$35,039
PER CAPITA INCOME
$77,644
AVG FAMILY INCOME
$59,319
AVG HOUSEHOLD INCOME
22.3%
WAGE / INCOME GAP [ % ]
77.7¢/ $1
WAGE / INCOME GAP [ $ ]
$10,982
FAMILY INCOME DEFICIT
0.47
INEQUALITY / GINI INDEX
475,412
LABOR FORCE [ PEOPLE ]
64.7%
PERCENT IN LABOR FORCE
4.7%
UNEMPLOYMENT RATE
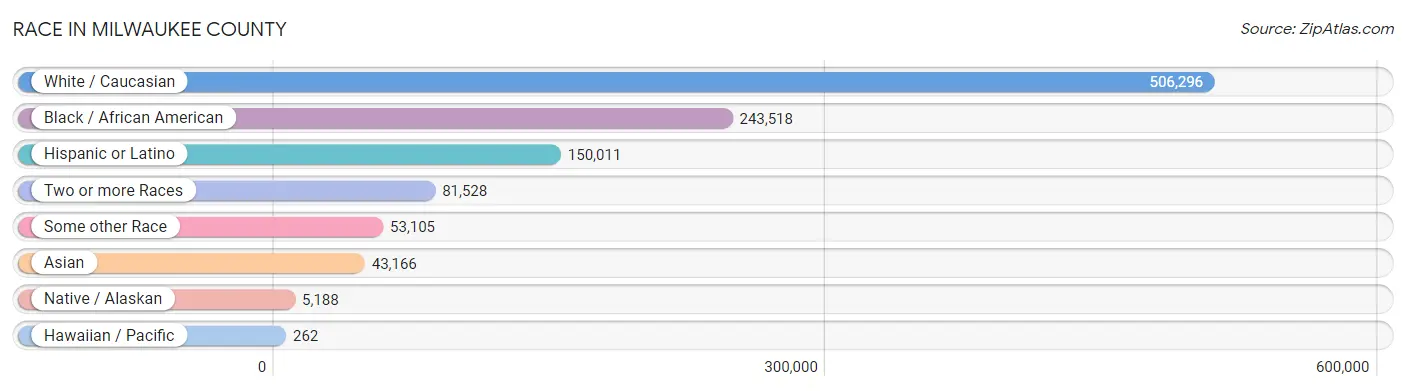
Race in Milwaukee County
The most populous races in Milwaukee County are White / Caucasian (506,296 | 54.3%), Black / African American (243,518 | 26.1%), and Hispanic or Latino (150,011 | 16.1%).
| Race | # Population | % Population |
| Asian | 43,166 | 4.6% |
| Black / African American | 243,518 | 26.1% |
| Hawaiian / Pacific | 262 | 0.0% |
| Hispanic or Latino | 150,011 | 16.1% |
| Native / Alaskan | 5,188 | 0.6% |
| White / Caucasian | 506,296 | 54.3% |
| Two or more Races | 81,528 | 8.7% |
| Some other Race | 53,105 | 5.7% |
| Total | 933,063 | 100.0% |
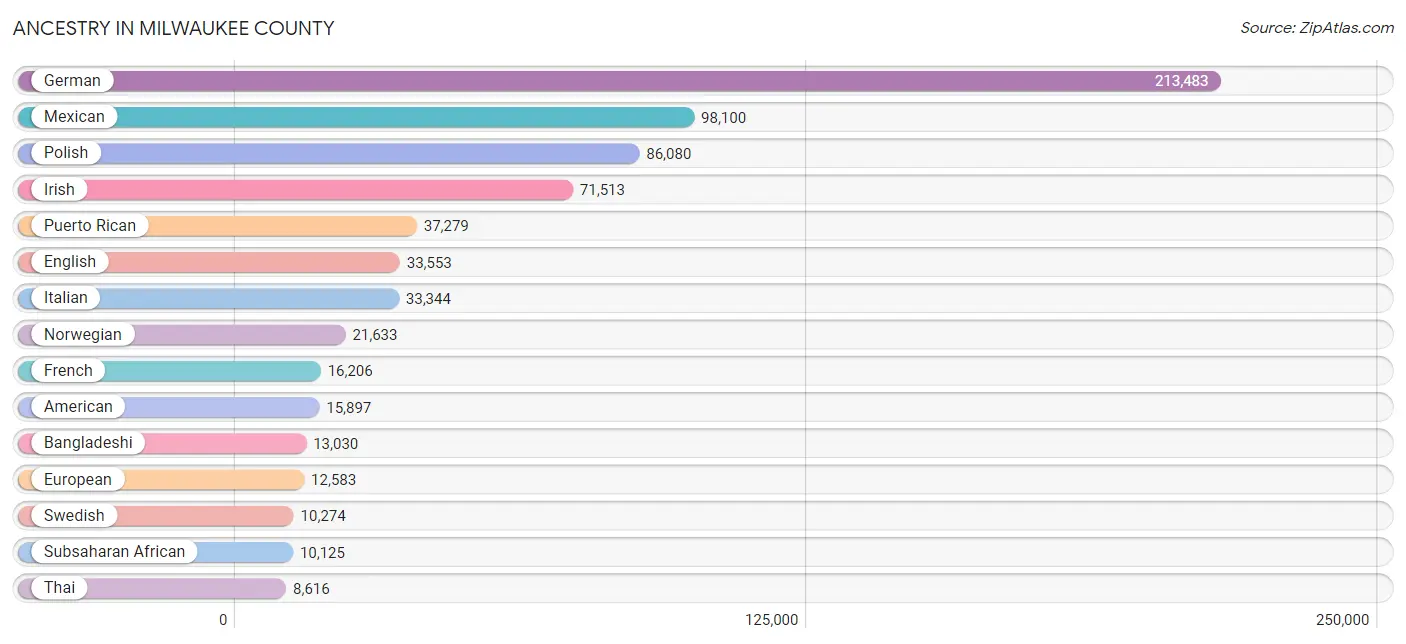
Ancestry in Milwaukee County
The most populous ancestries reported in Milwaukee County are German (213,483 | 22.9%), Mexican (98,100 | 10.5%), Polish (86,080 | 9.2%), Irish (71,513 | 7.7%), and Puerto Rican (37,279 | 4.0%), together accounting for 54.3% of all Milwaukee County residents.
| Ancestry | # Population | % Population |
| Afghan | 9 | 0.0% |
| African | 5,503 | 0.6% |
| Alaska Native | 14 | 0.0% |
| Alaskan Athabascan | 26 | 0.0% |
| Albanian | 1,557 | 0.2% |
| Aleut | 126 | 0.0% |
| Alsatian | 60 | 0.0% |
| American | 15,897 | 1.7% |
| Apache | 171 | 0.0% |
| Arab | 7,582 | 0.8% |
| Argentinean | 317 | 0.0% |
| Armenian | 1,033 | 0.1% |
| Assyrian / Chaldean / Syriac | 136 | 0.0% |
| Australian | 147 | 0.0% |
| Austrian | 3,361 | 0.4% |
| Bahamian | 25 | 0.0% |
| Bangladeshi | 13,030 | 1.4% |
| Barbadian | 13 | 0.0% |
| Basque | 25 | 0.0% |
| Belgian | 1,621 | 0.2% |
| Belizean | 38 | 0.0% |
| Bhutanese | 2,265 | 0.2% |
| Blackfeet | 520 | 0.1% |
| Bolivian | 343 | 0.0% |
| Brazilian | 98 | 0.0% |
| British | 2,631 | 0.3% |
| British West Indian | 41 | 0.0% |
| Bulgarian | 246 | 0.0% |
| Burmese | 2,151 | 0.2% |
| Cajun | 14 | 0.0% |
| Cambodian | 19 | 0.0% |
| Canadian | 884 | 0.1% |
| Cape Verdean | 34 | 0.0% |
| Carpatho Rusyn | 26 | 0.0% |
| Celtic | 29 | 0.0% |
| Central American | 5,127 | 0.5% |
| Central American Indian | 1,128 | 0.1% |
| Cherokee | 1,681 | 0.2% |
| Cheyenne | 14 | 0.0% |
| Chickasaw | 73 | 0.0% |
| Chilean | 281 | 0.0% |
| Chippewa | 2,162 | 0.2% |
| Choctaw | 339 | 0.0% |
| Colombian | 1,073 | 0.1% |
| Comanche | 54 | 0.0% |
| Costa Rican | 255 | 0.0% |
| Cree | 111 | 0.0% |
| Creek | 122 | 0.0% |
| Croatian | 3,318 | 0.4% |
| Crow | 14 | 0.0% |
| Cuban | 1,376 | 0.2% |
| Czech | 6,243 | 0.7% |
| Czechoslovakian | 892 | 0.1% |
| Danish | 3,957 | 0.4% |
| Dominican | 1,633 | 0.2% |
| Dutch | 8,049 | 0.9% |
| Eastern European | 2,270 | 0.2% |
| Ecuadorian | 286 | 0.0% |
| Egyptian | 625 | 0.1% |
| English | 33,553 | 3.6% |
| Estonian | 73 | 0.0% |
| Ethiopian | 155 | 0.0% |
| European | 12,583 | 1.3% |
| Fijian | 13 | 0.0% |
| Filipino | 200 | 0.0% |
| Finnish | 2,774 | 0.3% |
| French | 16,206 | 1.7% |
| French American Indian | 54 | 0.0% |
| French Canadian | 4,250 | 0.5% |
| German | 213,483 | 22.9% |
| German Russian | 1,269 | 0.1% |
| Ghanaian | 348 | 0.0% |
| Greek | 3,550 | 0.4% |
| Guamanian / Chamorro | 52 | 0.0% |
| Guatemalan | 1,226 | 0.1% |
| Guyanese | 19 | 0.0% |
| Haitian | 267 | 0.0% |
| Honduran | 637 | 0.1% |
| Hungarian | 3,392 | 0.4% |
| Icelander | 69 | 0.0% |
| Indian (Asian) | 6,124 | 0.7% |
| Indonesian | 5,639 | 0.6% |
| Iranian | 411 | 0.0% |
| Iraqi | 400 | 0.0% |
| Irish | 71,513 | 7.7% |
| Iroquois | 1,354 | 0.2% |
| Israeli | 211 | 0.0% |
| Italian | 33,344 | 3.6% |
| Jamaican | 1,776 | 0.2% |
| Japanese | 192 | 0.0% |
| Jordanian | 400 | 0.0% |
| Kenyan | 182 | 0.0% |
| Kiowa | 17 | 0.0% |
| Korean | 4,204 | 0.4% |
| Laotian | 370 | 0.0% |
| Latvian | 633 | 0.1% |
| Lebanese | 388 | 0.0% |
| Liberian | 57 | 0.0% |
| Lithuanian | 1,821 | 0.2% |
| Luxembourger | 751 | 0.1% |
| Macedonian | 94 | 0.0% |
| Malaysian | 2,478 | 0.3% |
| Maltese | 14 | 0.0% |
| Menominee | 931 | 0.1% |
| Mexican | 98,100 | 10.5% |
| Mexican American Indian | 850 | 0.1% |
| Mongolian | 759 | 0.1% |
| Moroccan | 684 | 0.1% |
| Native Hawaiian | 330 | 0.0% |
| Navajo | 126 | 0.0% |
| New Zealander | 9 | 0.0% |
| Nicaraguan | 945 | 0.1% |
| Nigerian | 1,791 | 0.2% |
| Northern European | 757 | 0.1% |
| Norwegian | 21,633 | 2.3% |
| Okinawan | 9 | 0.0% |
| Osage | 12 | 0.0% |
| Ottawa | 47 | 0.0% |
| Pakistani | 1,141 | 0.1% |
| Palestinian | 2,001 | 0.2% |
| Panamanian | 423 | 0.1% |
| Paraguayan | 48 | 0.0% |
| Pennsylvania German | 56 | 0.0% |
| Peruvian | 712 | 0.1% |
| Pima | 19 | 0.0% |
| Polish | 86,080 | 9.2% |
| Portuguese | 406 | 0.0% |
| Potawatomi | 312 | 0.0% |
| Puerto Rican | 37,279 | 4.0% |
| Romanian | 874 | 0.1% |
| Russian | 6,041 | 0.6% |
| Salvadoran | 1,621 | 0.2% |
| Samoan | 102 | 0.0% |
| Scandinavian | 2,162 | 0.2% |
| Scotch-Irish | 2,387 | 0.3% |
| Scottish | 5,632 | 0.6% |
| Seminole | 46 | 0.0% |
| Senegalese | 94 | 0.0% |
| Serbian | 2,965 | 0.3% |
| Sierra Leonean | 37 | 0.0% |
| Sioux | 283 | 0.0% |
| Slavic | 371 | 0.0% |
| Slovak | 2,723 | 0.3% |
| Slovene | 2,122 | 0.2% |
| Somali | 1,119 | 0.1% |
| South African | 147 | 0.0% |
| South American | 3,555 | 0.4% |
| South American Indian | 32 | 0.0% |
| Spaniard | 780 | 0.1% |
| Spanish | 633 | 0.1% |
| Spanish American | 15 | 0.0% |
| Sri Lankan | 1,974 | 0.2% |
| Subsaharan African | 10,125 | 1.1% |
| Swedish | 10,274 | 1.1% |
| Swiss | 2,264 | 0.2% |
| Syrian | 333 | 0.0% |
| Taiwanese | 11 | 0.0% |
| Thai | 8,616 | 0.9% |
| Tongan | 57 | 0.0% |
| Trinidadian and Tobagonian | 23 | 0.0% |
| Turkish | 331 | 0.0% |
| U.S. Virgin Islander | 46 | 0.0% |
| Ugandan | 33 | 0.0% |
| Ukrainian | 1,738 | 0.2% |
| Uruguayan | 13 | 0.0% |
| Venezuelan | 445 | 0.1% |
| Vietnamese | 139 | 0.0% |
| Welsh | 2,446 | 0.3% |
| West Indian | 289 | 0.0% |
| Yaqui | 10 | 0.0% |
| Yugoslavian | 569 | 0.1% | View All 171 Rows |
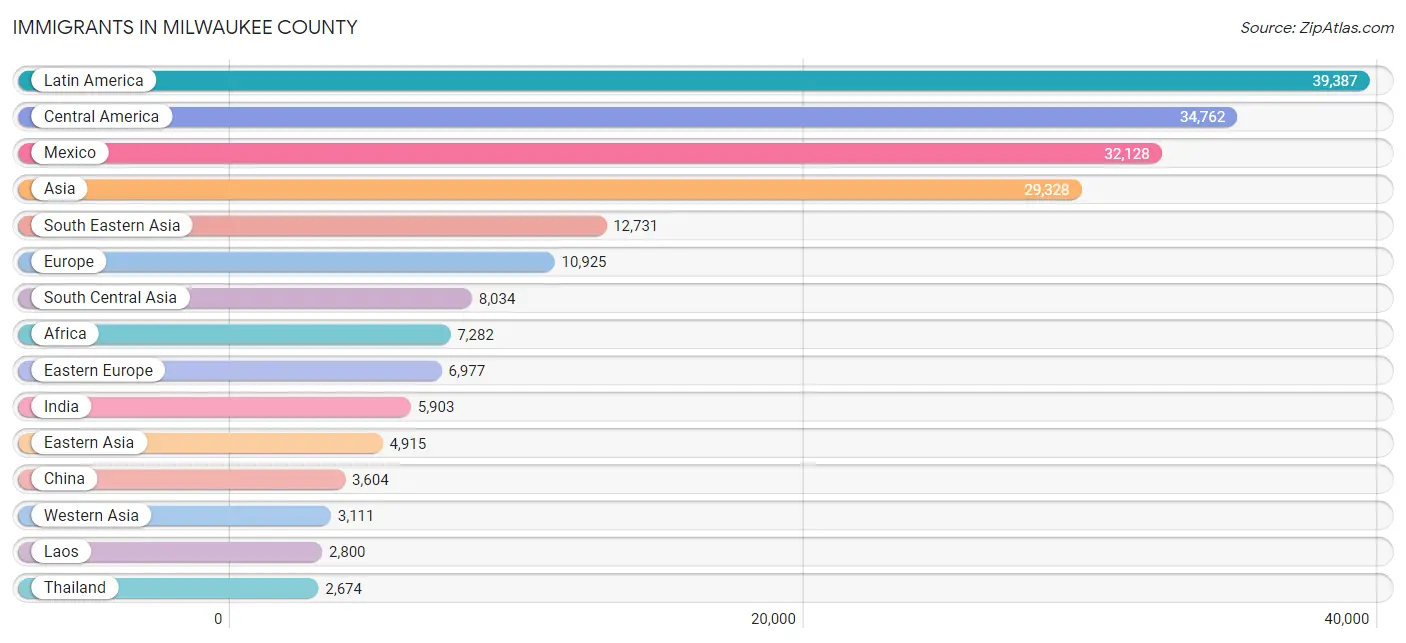
Immigrants in Milwaukee County
The most numerous immigrant groups reported in Milwaukee County came from Latin America (39,387 | 4.2%), Central America (34,762 | 3.7%), Mexico (32,128 | 3.4%), Asia (29,328 | 3.1%), and South Eastern Asia (12,731 | 1.4%), together accounting for 15.9% of all Milwaukee County residents.
| Immigration Origin | # Population | % Population |
| Afghanistan | 9 | 0.0% |
| Africa | 7,282 | 0.8% |
| Albania | 793 | 0.1% |
| Argentina | 132 | 0.0% |
| Asia | 29,328 | 3.1% |
| Australia | 58 | 0.0% |
| Austria | 178 | 0.0% |
| Bahamas | 4 | 0.0% |
| Bangladesh | 258 | 0.0% |
| Barbados | 9 | 0.0% |
| Belarus | 176 | 0.0% |
| Belgium | 88 | 0.0% |
| Belize | 33 | 0.0% |
| Bolivia | 235 | 0.0% |
| Bosnia and Herzegovina | 384 | 0.0% |
| Brazil | 151 | 0.0% |
| Bulgaria | 102 | 0.0% |
| Cambodia | 102 | 0.0% |
| Cameroon | 273 | 0.0% |
| Canada | 937 | 0.1% |
| Caribbean | 2,336 | 0.3% |
| Central America | 34,762 | 3.7% |
| Chile | 178 | 0.0% |
| China | 3,604 | 0.4% |
| Colombia | 587 | 0.1% |
| Congo | 418 | 0.0% |
| Costa Rica | 91 | 0.0% |
| Croatia | 378 | 0.0% |
| Cuba | 417 | 0.0% |
| Czechoslovakia | 296 | 0.0% |
| Denmark | 21 | 0.0% |
| Dominica | 36 | 0.0% |
| Dominican Republic | 837 | 0.1% |
| Eastern Africa | 1,822 | 0.2% |
| Eastern Asia | 4,915 | 0.5% |
| Eastern Europe | 6,977 | 0.7% |
| Ecuador | 92 | 0.0% |
| Egypt | 505 | 0.1% |
| El Salvador | 757 | 0.1% |
| England | 367 | 0.0% |
| Eritrea | 182 | 0.0% |
| Ethiopia | 177 | 0.0% |
| Europe | 10,925 | 1.2% |
| France | 177 | 0.0% |
| Germany | 1,483 | 0.2% |
| Ghana | 443 | 0.1% |
| Greece | 169 | 0.0% |
| Guatemala | 658 | 0.1% |
| Guyana | 8 | 0.0% |
| Haiti | 88 | 0.0% |
| Honduras | 370 | 0.0% |
| Hong Kong | 150 | 0.0% |
| Hungary | 222 | 0.0% |
| India | 5,903 | 0.6% |
| Indonesia | 194 | 0.0% |
| Iran | 295 | 0.0% |
| Iraq | 587 | 0.1% |
| Ireland | 128 | 0.0% |
| Israel | 163 | 0.0% |
| Italy | 495 | 0.1% |
| Jamaica | 896 | 0.1% |
| Japan | 269 | 0.0% |
| Jordan | 927 | 0.1% |
| Kazakhstan | 57 | 0.0% |
| Kenya | 580 | 0.1% |
| Korea | 1,023 | 0.1% |
| Kuwait | 296 | 0.0% |
| Laos | 2,800 | 0.3% |
| Latin America | 39,387 | 4.2% |
| Latvia | 57 | 0.0% |
| Lebanon | 72 | 0.0% |
| Liberia | 39 | 0.0% |
| Lithuania | 93 | 0.0% |
| Malaysia | 864 | 0.1% |
| Mexico | 32,128 | 3.4% |
| Middle Africa | 1,147 | 0.1% |
| Moldova | 16 | 0.0% |
| Morocco | 553 | 0.1% |
| Nepal | 392 | 0.0% |
| Netherlands | 135 | 0.0% |
| Nicaragua | 633 | 0.1% |
| Nigeria | 1,148 | 0.1% |
| North Macedonia | 213 | 0.0% |
| Northern Africa | 1,209 | 0.1% |
| Northern Europe | 971 | 0.1% |
| Oceania | 104 | 0.0% |
| Pakistan | 1,013 | 0.1% |
| Panama | 92 | 0.0% |
| Peru | 535 | 0.1% |
| Philippines | 1,701 | 0.2% |
| Poland | 1,167 | 0.1% |
| Portugal | 16 | 0.0% |
| Romania | 371 | 0.0% |
| Russia | 995 | 0.1% |
| Saudi Arabia | 544 | 0.1% |
| Scotland | 89 | 0.0% |
| Senegal | 84 | 0.0% |
| Serbia | 278 | 0.0% |
| Sierra Leone | 79 | 0.0% |
| Singapore | 12 | 0.0% |
| Somalia | 686 | 0.1% |
| South Africa | 417 | 0.0% |
| South America | 2,289 | 0.3% |
| South Central Asia | 8,034 | 0.9% |
| South Eastern Asia | 12,731 | 1.4% |
| Southern Europe | 879 | 0.1% |
| Spain | 199 | 0.0% |
| Sri Lanka | 37 | 0.0% |
| Sudan | 27 | 0.0% |
| Sweden | 54 | 0.0% |
| Switzerland | 9 | 0.0% |
| Syria | 161 | 0.0% |
| Taiwan | 249 | 0.0% |
| Thailand | 2,674 | 0.3% |
| Trinidad and Tobago | 49 | 0.0% |
| Turkey | 281 | 0.0% |
| Uganda | 23 | 0.0% |
| Ukraine | 830 | 0.1% |
| Uzbekistan | 39 | 0.0% |
| Venezuela | 336 | 0.0% |
| Vietnam | 845 | 0.1% |
| Western Africa | 2,145 | 0.2% |
| Western Asia | 3,111 | 0.3% |
| Western Europe | 2,070 | 0.2% |
| Yemen | 4 | 0.0% |
| Zaire | 456 | 0.1% | View All 126 Rows |
Sex and Age in Milwaukee County
Sex and Age in Milwaukee County
The most populous age groups in Milwaukee County are 25 to 29 Years (37,787 | 8.3%) for men and 25 to 29 Years (39,161 | 8.2%) for women.
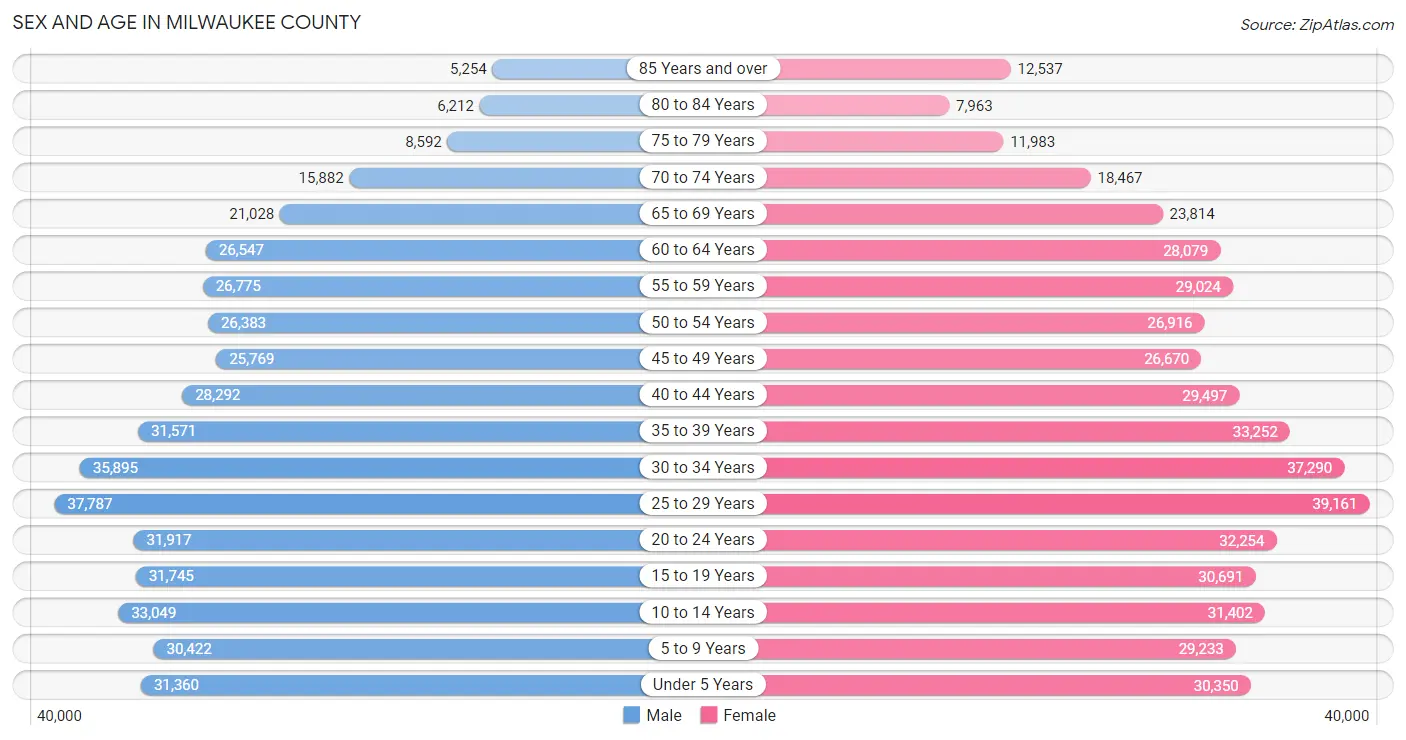
| Age Bracket | Male | Female |
| Under 5 Years | 31,360 (6.9%) | 30,350 (6.3%) |
| 5 to 9 Years | 30,422 (6.7%) | 29,233 (6.1%) |
| 10 to 14 Years | 33,049 (7.3%) | 31,402 (6.6%) |
| 15 to 19 Years | 31,745 (7.0%) | 30,691 (6.4%) |
| 20 to 24 Years | 31,917 (7.0%) | 32,254 (6.7%) |
| 25 to 29 Years | 37,787 (8.3%) | 39,161 (8.2%) |
| 30 to 34 Years | 35,895 (7.9%) | 37,290 (7.8%) |
| 35 to 39 Years | 31,571 (7.0%) | 33,252 (7.0%) |
| 40 to 44 Years | 28,292 (6.2%) | 29,497 (6.2%) |
| 45 to 49 Years | 25,769 (5.7%) | 26,670 (5.6%) |
| 50 to 54 Years | 26,383 (5.8%) | 26,916 (5.6%) |
| 55 to 59 Years | 26,775 (5.9%) | 29,024 (6.1%) |
| 60 to 64 Years | 26,547 (5.8%) | 28,079 (5.9%) |
| 65 to 69 Years | 21,028 (4.6%) | 23,814 (5.0%) |
| 70 to 74 Years | 15,882 (3.5%) | 18,467 (3.9%) |
| 75 to 79 Years | 8,592 (1.9%) | 11,983 (2.5%) |
| 80 to 84 Years | 6,212 (1.4%) | 7,963 (1.7%) |
| 85 Years and over | 5,254 (1.2%) | 12,537 (2.6%) |
| Total | 454,480 (100.0%) | 478,583 (100.0%) |
Families and Households in Milwaukee County
Median Family Size in Milwaukee County
The median family size in Milwaukee County is 3.17 persons per family, with single female/mother families (60,400 | 28.7%) accounting for the largest median family size of 3.29 persons per family. On the other hand, single male/father families (21,074 | 10.0%) represent the smallest median family size with 2.87 persons per family.
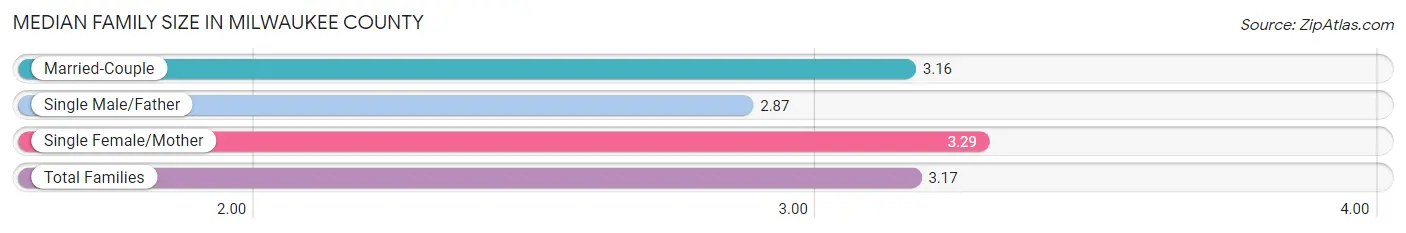
| Family Type | # Families | Family Size |
| Married-Couple | 128,617 (61.2%) | 3.16 |
| Single Male/Father | 21,074 (10.0%) | 2.87 |
| Single Female/Mother | 60,400 (28.7%) | 3.29 |
| Total Families | 210,091 (100.0%) | 3.17 |
Median Household Size in Milwaukee County
The median household size in Milwaukee County is 2.34 persons per household, with single female/mother households (60,400 | 15.5%) accounting for the largest median household size of 3.48 persons per household. non-family households (179,156 | 46.0%) represent the smallest median household size with 1.25 persons per household.
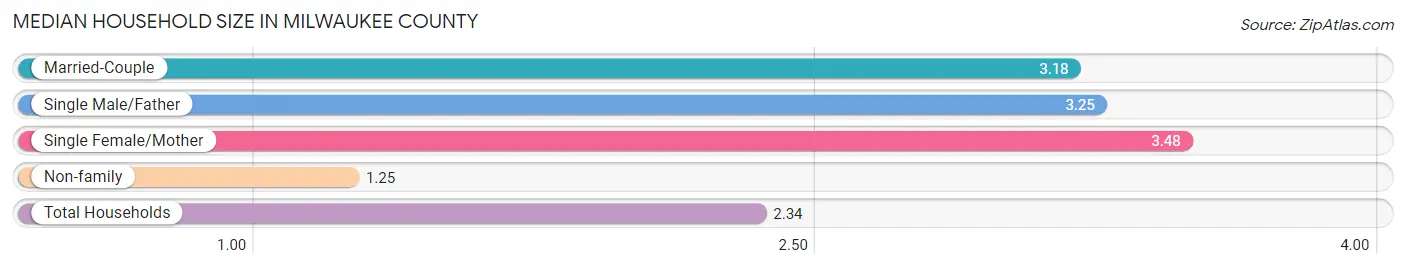
| Household Type | # Households | Household Size |
| Married-Couple | 128,617 (33.0%) | 3.18 |
| Single Male/Father | 21,074 (5.4%) | 3.25 |
| Single Female/Mother | 60,400 (15.5%) | 3.48 |
| Non-family | 179,156 (46.0%) | 1.25 |
| Total Households | 389,247 (100.0%) | 2.34 |
Household Size by Marriage Status in Milwaukee County
Out of a total of 389,247 households in Milwaukee County, 210,091 (54.0%) are family households, while 179,156 (46.0%) are nonfamily households. The most numerous type of family households are 2-person households, comprising 91,194, and the most common type of nonfamily households are 1-person households, comprising 144,763.
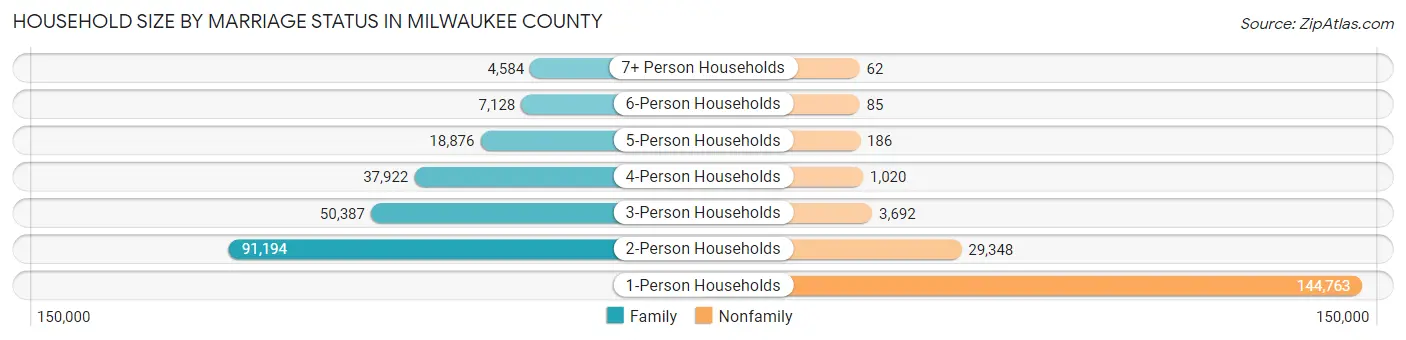
| Household Size | Family Households | Nonfamily Households |
| 1-Person Households | - | 144,763 (37.2%) |
| 2-Person Households | 91,194 (23.4%) | 29,348 (7.5%) |
| 3-Person Households | 50,387 (12.9%) | 3,692 (0.9%) |
| 4-Person Households | 37,922 (9.7%) | 1,020 (0.3%) |
| 5-Person Households | 18,876 (4.9%) | 186 (0.1%) |
| 6-Person Households | 7,128 (1.8%) | 85 (0.0%) |
| 7+ Person Households | 4,584 (1.2%) | 62 (0.0%) |
| Total | 210,091 (54.0%) | 179,156 (46.0%) |
Female Fertility in Milwaukee County
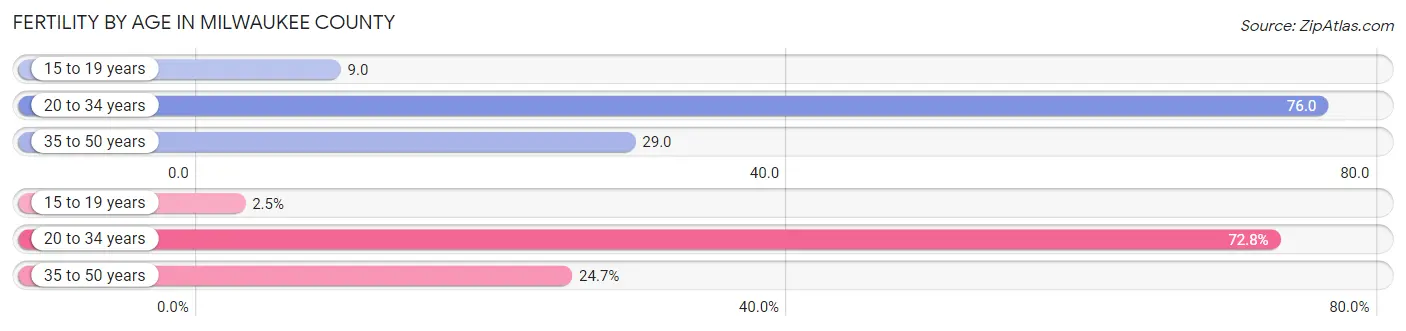
Fertility by Age in Milwaukee County
Average fertility rate in Milwaukee County is 48.0 births per 1,000 women. Women in the age bracket of 20 to 34 years have the highest fertility rate with 76.0 births per 1,000 women. Women in the age bracket of 20 to 34 years acount for 72.8% of all women with births.
| Age Bracket | Women with Births | Births / 1,000 Women |
| 15 to 19 years | 284 (2.5%) | 9.0 |
| 20 to 34 years | 8,216 (72.8%) | 76.0 |
| 35 to 50 years | 2,789 (24.7%) | 29.0 |
| Total | 11,289 (100.0%) | 48.0 |
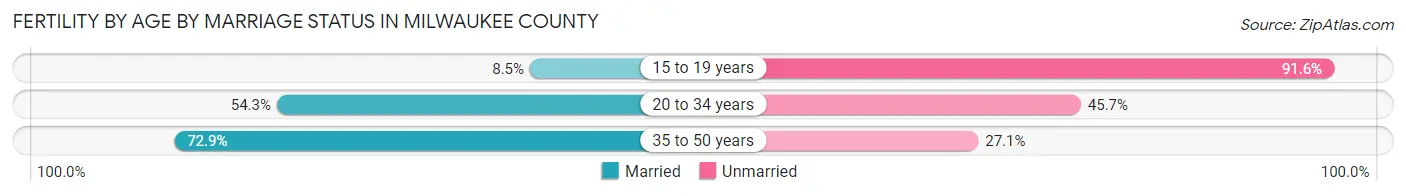
Fertility by Age by Marriage Status in Milwaukee County
57.8% of women with births (11,289) in Milwaukee County are married. The highest percentage of unmarried women with births falls into 15 to 19 years age bracket with 91.5% of them unmarried at the time of birth, while the lowest percentage of unmarried women with births belong to 35 to 50 years age bracket with 27.1% of them unmarried.
| Age Bracket | Married | Unmarried |
| 15 to 19 years | 24 (8.5%) | 260 (91.5%) |
| 20 to 34 years | 4,461 (54.3%) | 3,755 (45.7%) |
| 35 to 50 years | 2,033 (72.9%) | 756 (27.1%) |
| Total | 6,525 (57.8%) | 4,764 (42.2%) |
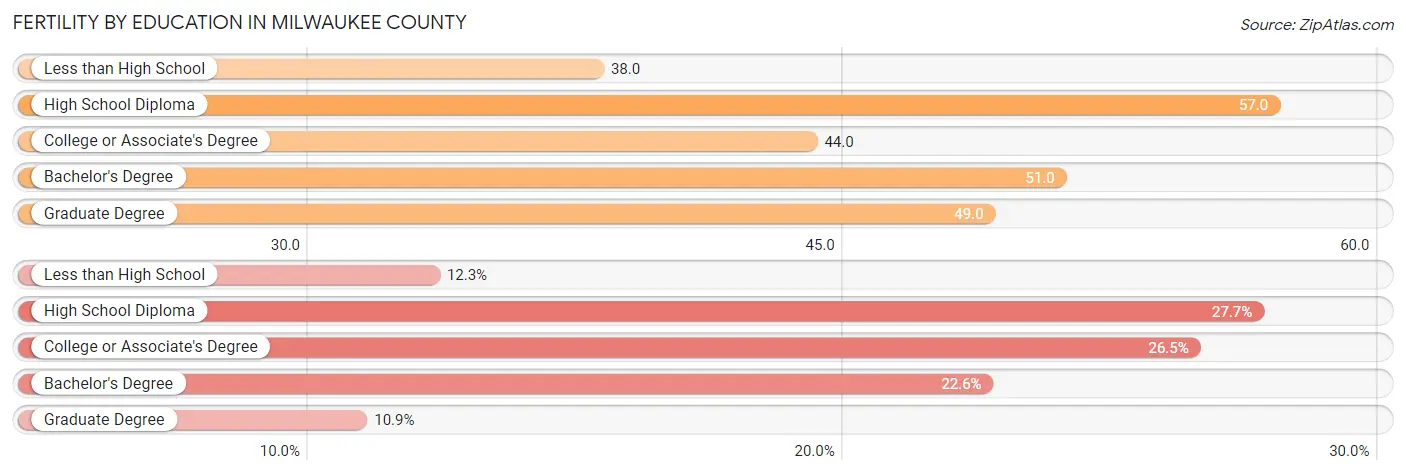
Fertility by Education in Milwaukee County
Average fertility rate in Milwaukee County is 48.0 births per 1,000 women. Women with the education attainment of high school diploma have the highest fertility rate of 57.0 births per 1,000 women, while women with the education attainment of less than high school have the lowest fertility at 38.0 births per 1,000 women. Women with the education attainment of high school diploma represent 27.7% of all women with births.
| Educational Attainment | Women with Births | Births / 1,000 Women |
| Less than High School | 1,384 (12.3%) | 38.0 |
| High School Diploma | 3,127 (27.7%) | 57.0 |
| College or Associate's Degree | 2,993 (26.5%) | 44.0 |
| Bachelor's Degree | 2,555 (22.6%) | 51.0 |
| Graduate Degree | 1,230 (10.9%) | 49.0 |
| Total | 11,289 (100.0%) | 48.0 |
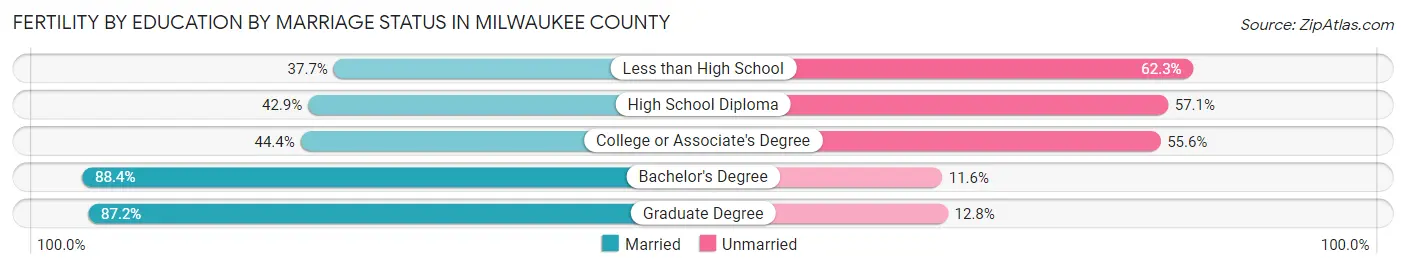
Fertility by Education by Marriage Status in Milwaukee County
42.2% of women with births in Milwaukee County are unmarried. Women with the educational attainment of bachelor's degree are most likely to be married with 88.4% of them married at childbirth, while women with the educational attainment of less than high school are least likely to be married with 62.3% of them unmarried at childbirth.
| Educational Attainment | Married | Unmarried |
| Less than High School | 522 (37.7%) | 862 (62.3%) |
| High School Diploma | 1,341 (42.9%) | 1,786 (57.1%) |
| College or Associate's Degree | 1,329 (44.4%) | 1,664 (55.6%) |
| Bachelor's Degree | 2,259 (88.4%) | 296 (11.6%) |
| Graduate Degree | 1,073 (87.2%) | 157 (12.8%) |
| Total | 6,525 (57.8%) | 4,764 (42.2%) |
Income in Milwaukee County
Income Overview in Milwaukee County
Per Capita Income in Milwaukee County is $35,039, while median incomes of families and households are $77,644 and $59,319 respectively.
| Characteristic | Number | Measure |
| Per Capita Income | 933,063 | $35,039 |
| Median Family Income | 210,091 | $77,644 |
| Mean Family Income | 210,091 | $100,988 |
| Median Household Income | 389,247 | $59,319 |
| Mean Household Income | 389,247 | $81,770 |
| Income Deficit | 210,091 | $10,982 |
| Wage / Income Gap (%) | 933,063 | 22.29% |
| Wage / Income Gap ($) | 933,063 | 77.71¢ per $1 |
| Gini / Inequality Index | 933,063 | 0.47 |
Earnings by Sex in Milwaukee County
Average Earnings in Milwaukee County are $40,346, $45,563 for men and $35,405 for women, a difference of 22.3%.
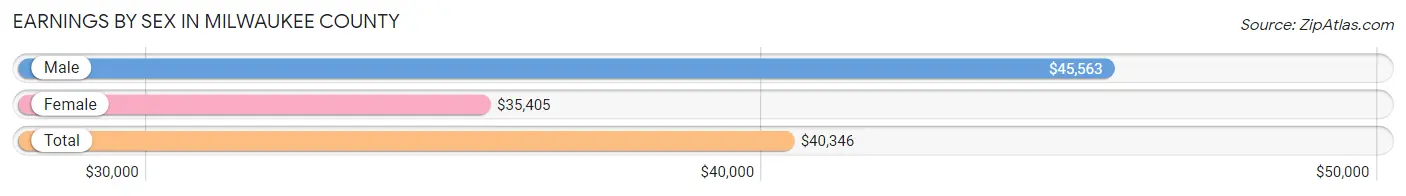
| Sex | Number | Average Earnings |
| Male | 251,228 (50.2%) | $45,563 |
| Female | 249,421 (49.8%) | $35,405 |
| Total | 500,649 (100.0%) | $40,346 |
Earnings by Sex by Income Bracket in Milwaukee County
The most common earnings brackets in Milwaukee County are $100,000+ for men (31,720 | 12.6%) and $75,000 to $99,999 for women (21,117 | 8.5%).
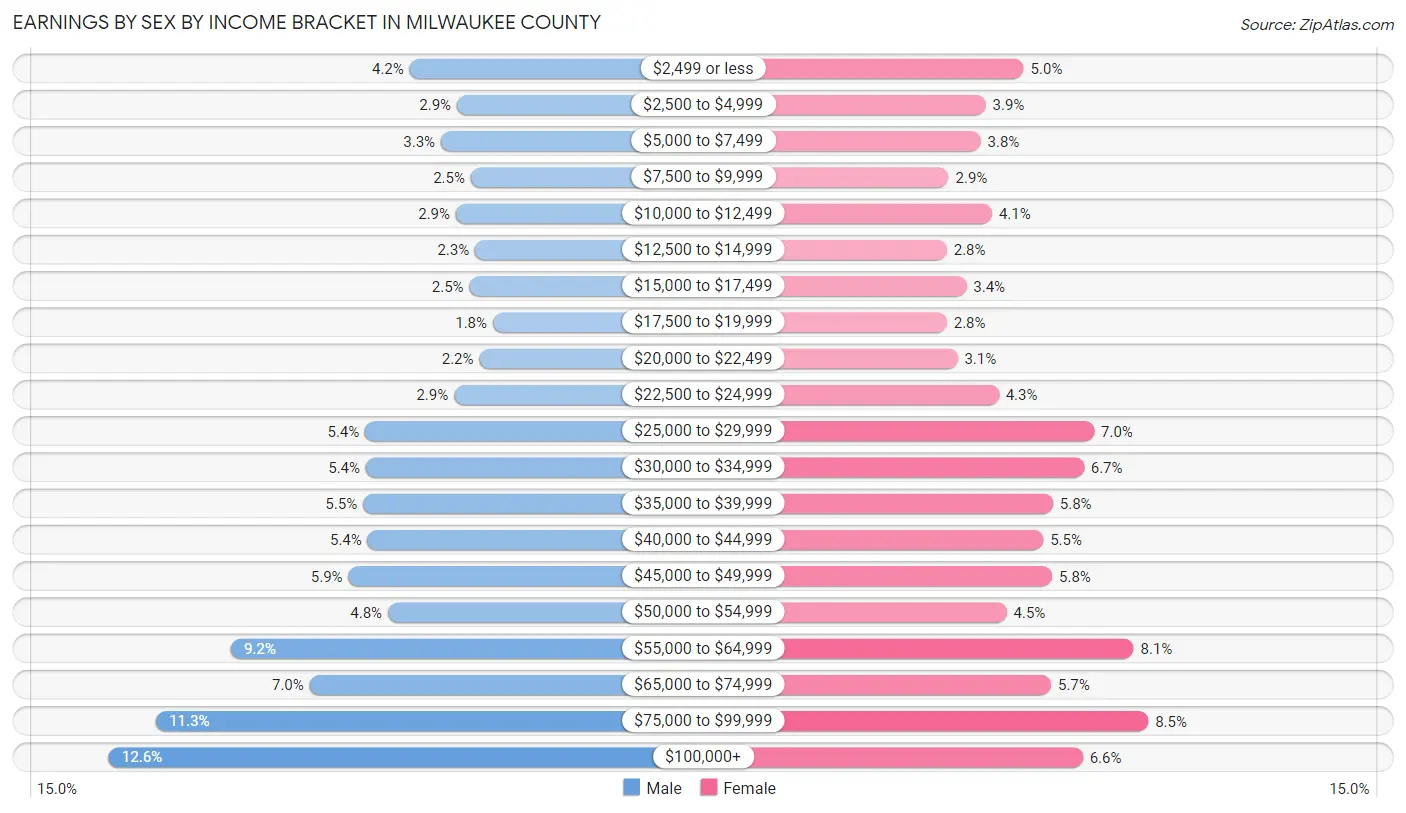
| Income | Male | Female |
| $2,499 or less | 10,506 (4.2%) | 12,403 (5.0%) |
| $2,500 to $4,999 | 7,161 (2.9%) | 9,725 (3.9%) |
| $5,000 to $7,499 | 8,279 (3.3%) | 9,370 (3.8%) |
| $7,500 to $9,999 | 6,174 (2.5%) | 7,132 (2.9%) |
| $10,000 to $12,499 | 7,235 (2.9%) | 10,173 (4.1%) |
| $12,500 to $14,999 | 5,886 (2.3%) | 7,012 (2.8%) |
| $15,000 to $17,499 | 6,274 (2.5%) | 8,391 (3.4%) |
| $17,500 to $19,999 | 4,611 (1.8%) | 7,009 (2.8%) |
| $20,000 to $22,499 | 5,585 (2.2%) | 7,749 (3.1%) |
| $22,500 to $24,999 | 7,360 (2.9%) | 10,642 (4.3%) |
| $25,000 to $29,999 | 13,641 (5.4%) | 17,328 (7.0%) |
| $30,000 to $34,999 | 13,596 (5.4%) | 16,619 (6.7%) |
| $35,000 to $39,999 | 13,804 (5.5%) | 14,439 (5.8%) |
| $40,000 to $44,999 | 13,461 (5.4%) | 13,780 (5.5%) |
| $45,000 to $49,999 | 14,811 (5.9%) | 14,396 (5.8%) |
| $50,000 to $54,999 | 12,041 (4.8%) | 11,198 (4.5%) |
| $55,000 to $64,999 | 23,115 (9.2%) | 20,099 (8.1%) |
| $65,000 to $74,999 | 17,571 (7.0%) | 14,313 (5.7%) |
| $75,000 to $99,999 | 28,397 (11.3%) | 21,117 (8.5%) |
| $100,000+ | 31,720 (12.6%) | 16,526 (6.6%) |
| Total | 251,228 (100.0%) | 249,421 (100.0%) |
Earnings by Sex by Educational Attainment in Milwaukee County
Average earnings in Milwaukee County are $51,524 for men and $41,126 for women, a difference of 20.2%. Men with an educational attainment of graduate degree enjoy the highest average annual earnings of $87,060, while those with less than high school education earn the least with $34,731. Women with an educational attainment of graduate degree earn the most with the average annual earnings of $67,941, while those with less than high school education have the smallest earnings of $23,633.
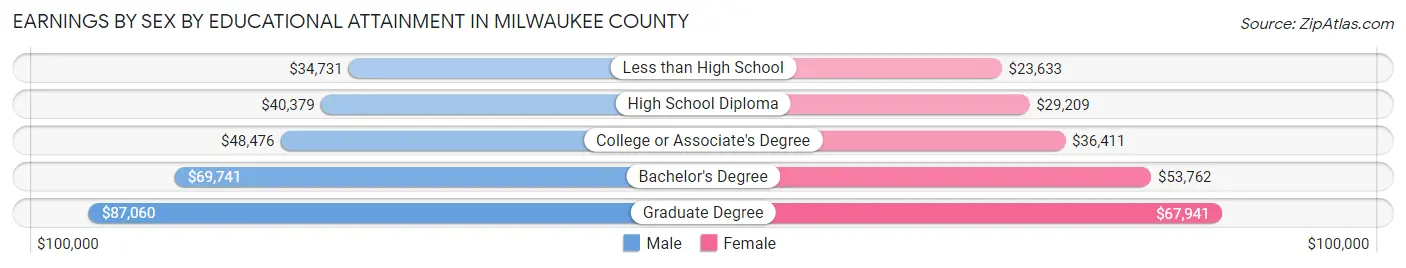
| Educational Attainment | Male Income | Female Income |
| Less than High School | $34,731 | $23,633 |
| High School Diploma | $40,379 | $29,209 |
| College or Associate's Degree | $48,476 | $36,411 |
| Bachelor's Degree | $69,741 | $53,762 |
| Graduate Degree | $87,060 | $67,941 |
| Total | $51,524 | $41,126 |
Family Income in Milwaukee County
Family Income Brackets in Milwaukee County
According to the Milwaukee County family income data, there are 41,388 families falling into the $100,000 to $149,999 income range, which is the most common income bracket and makes up 19.7% of all families. Conversely, the $10,000 to $14,999 income bracket is the least frequent group with only 6,303 families (3.0%) belonging to this category.
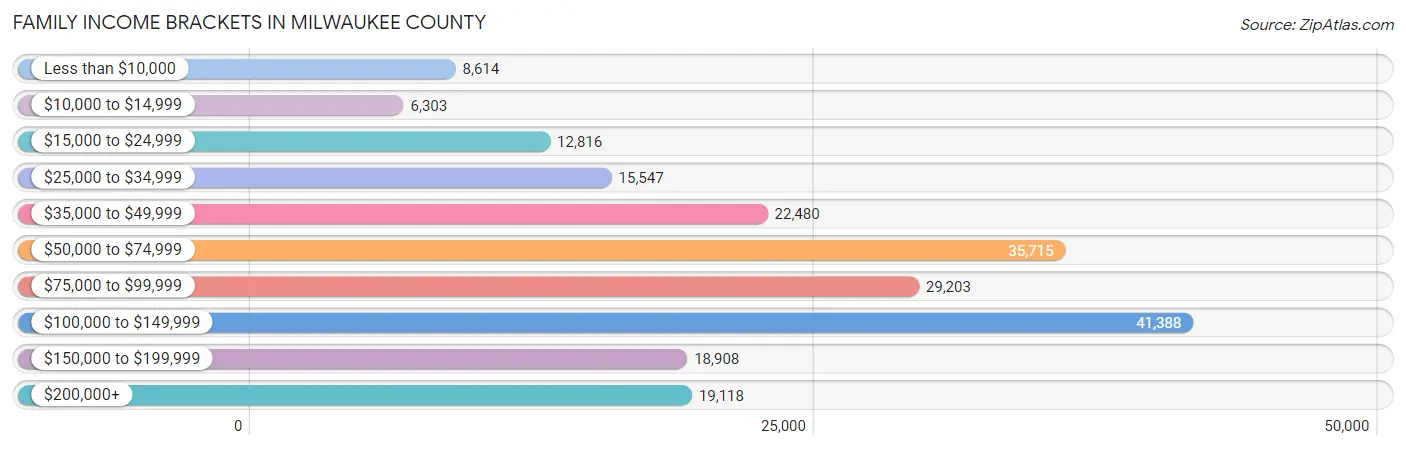
| Income Bracket | # Families | % Families |
| Less than $10,000 | 8,614 | 4.1% |
| $10,000 to $14,999 | 6,303 | 3.0% |
| $15,000 to $24,999 | 12,816 | 6.1% |
| $25,000 to $34,999 | 15,547 | 7.4% |
| $35,000 to $49,999 | 22,480 | 10.7% |
| $50,000 to $74,999 | 35,715 | 17.0% |
| $75,000 to $99,999 | 29,203 | 13.9% |
| $100,000 to $149,999 | 41,388 | 19.7% |
| $150,000 to $199,999 | 18,908 | 9.0% |
| $200,000+ | 19,118 | 9.1% |
Family Income by Famaliy Size in Milwaukee County
4-person families (36,097 | 17.2%) account for the highest median family income in Milwaukee County with $89,246 per family, while 2-person families (99,525 | 47.4%) have the highest median income of $37,030 per family member.
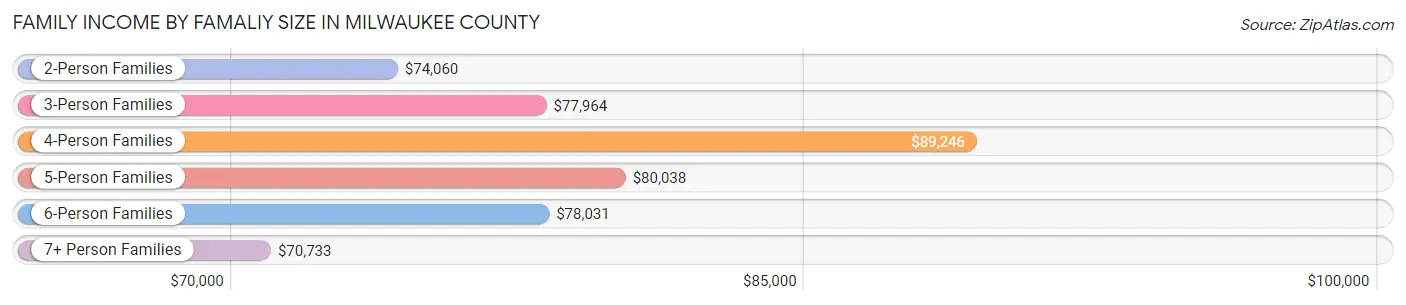
| Income Bracket | # Families | Median Income |
| 2-Person Families | 99,525 (47.4%) | $74,060 |
| 3-Person Families | 47,979 (22.8%) | $77,964 |
| 4-Person Families | 36,097 (17.2%) | $89,246 |
| 5-Person Families | 16,186 (7.7%) | $80,038 |
| 6-Person Families | 6,546 (3.1%) | $78,031 |
| 7+ Person Families | 3,758 (1.8%) | $70,733 |
| Total | 210,091 (100.0%) | $77,644 |
Family Income by Number of Earners in Milwaukee County
The median family income in Milwaukee County is $77,644, with families comprising 3+ earners (21,420) having the highest median family income of $130,763, while families with no earners (28,811) have the lowest median family income of $41,633, accounting for 10.2% and 13.7% of families, respectively.
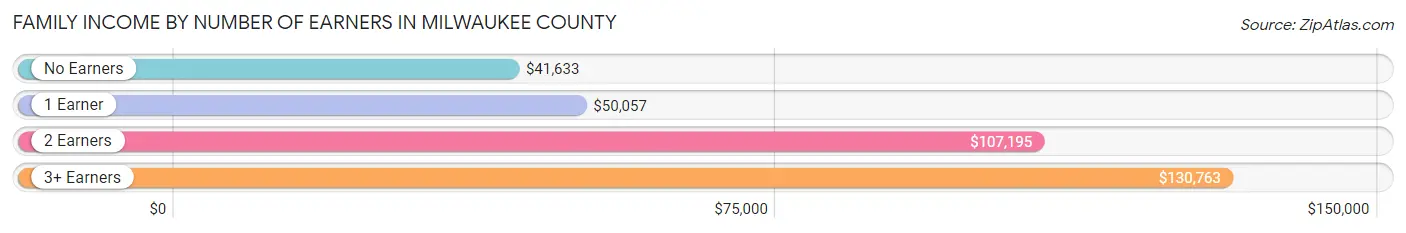
| Number of Earners | # Families | Median Income |
| No Earners | 28,811 (13.7%) | $41,633 |
| 1 Earner | 76,033 (36.2%) | $50,057 |
| 2 Earners | 83,827 (39.9%) | $107,195 |
| 3+ Earners | 21,420 (10.2%) | $130,763 |
| Total | 210,091 (100.0%) | $77,644 |
Household Income in Milwaukee County
Household Income Brackets in Milwaukee County
With 70,454 households falling in the category, the $50,000 to $74,999 income range is the most frequent in Milwaukee County, accounting for 18.1% of all households. In contrast, only 22,187 households (5.7%) fall into the $10,000 to $14,999 income bracket, making it the least populous group.
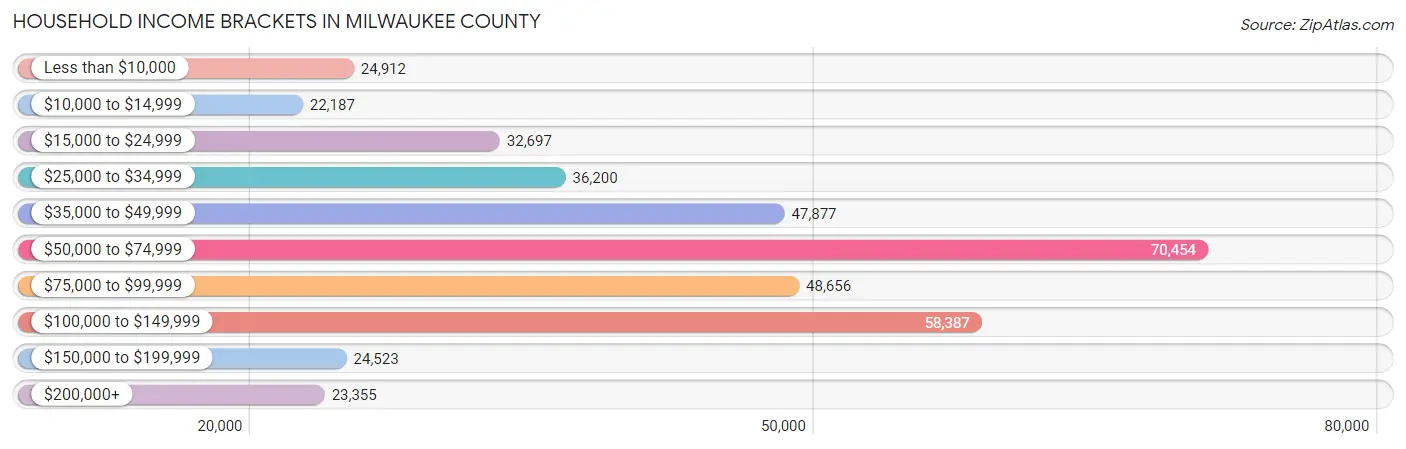
| Income Bracket | # Households | % Households |
| Less than $10,000 | 24,912 | 6.4% |
| $10,000 to $14,999 | 22,187 | 5.7% |
| $15,000 to $24,999 | 32,697 | 8.4% |
| $25,000 to $34,999 | 36,200 | 9.3% |
| $35,000 to $49,999 | 47,877 | 12.3% |
| $50,000 to $74,999 | 70,454 | 18.1% |
| $75,000 to $99,999 | 48,656 | 12.5% |
| $100,000 to $149,999 | 58,387 | 15.0% |
| $150,000 to $199,999 | 24,523 | 6.3% |
| $200,000+ | 23,355 | 6.0% |
Household Income by Householder Age in Milwaukee County
The median household income in Milwaukee County is $59,319, with the highest median household income of $69,078 found in the 45 to 64 years age bracket for the primary householder. A total of 131,708 households (33.8%) fall into this category. Meanwhile, the 15 to 24 years age bracket for the primary householder has the lowest median household income of $33,151, with 20,064 households (5.1%) in this group.
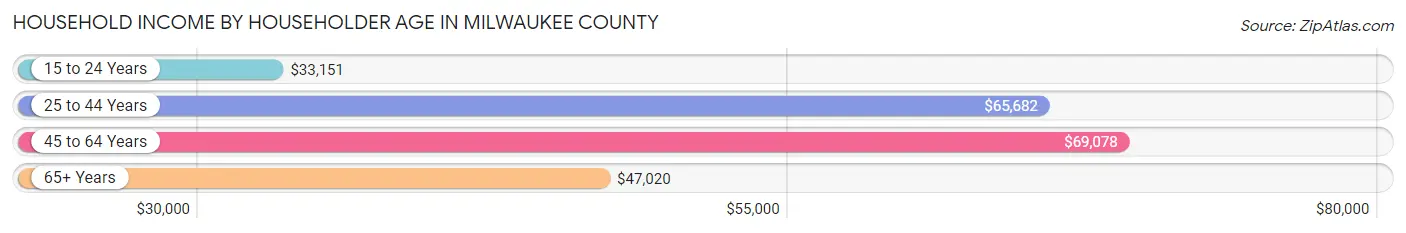
| Income Bracket | # Households | Median Income |
| 15 to 24 Years | 20,064 (5.1%) | $33,151 |
| 25 to 44 Years | 149,010 (38.3%) | $65,682 |
| 45 to 64 Years | 131,708 (33.8%) | $69,078 |
| 65+ Years | 88,465 (22.7%) | $47,020 |
| Total | 389,247 (100.0%) | $59,319 |
Poverty in Milwaukee County
Income Below Poverty by Sex and Age in Milwaukee County
With 16.8% poverty level for males and 18.8% for females among the residents of Milwaukee County, 6 to 11 year old males and 18 to 24 year old females are the most vulnerable to poverty, with 10,855 males (28.8%) and 11,411 females (28.5%) in their respective age groups living below the poverty level.
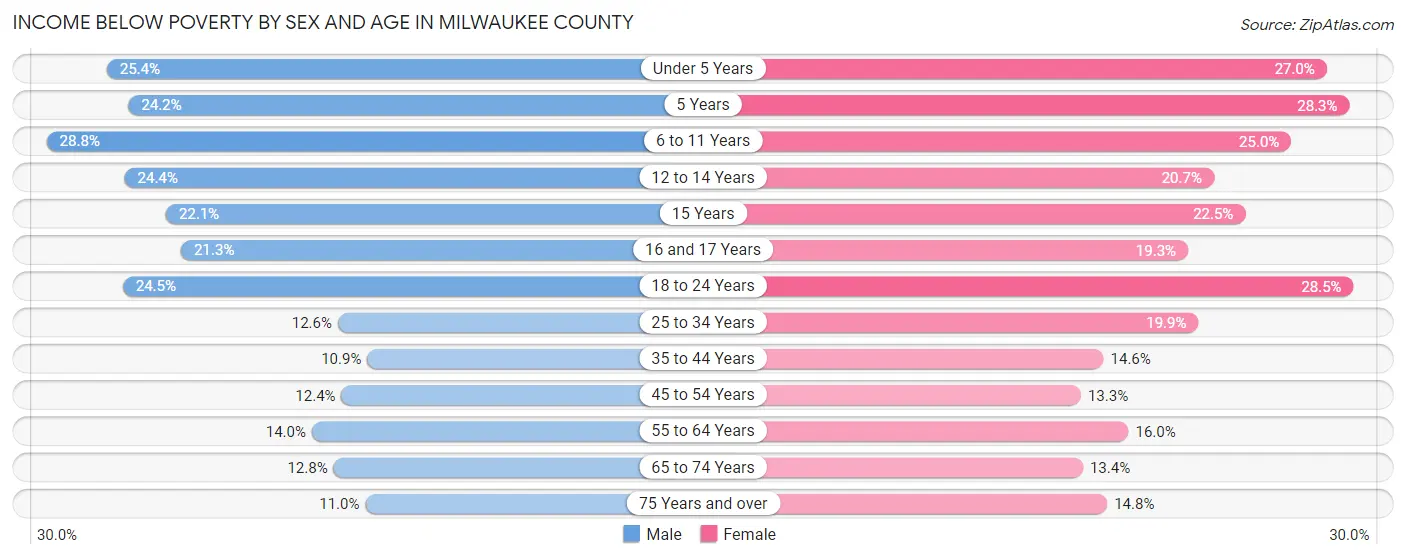
| Age Bracket | Male | Female |
| Under 5 Years | 7,828 (25.4%) | 8,080 (27.0%) |
| 5 Years | 1,376 (24.2%) | 1,545 (28.3%) |
| 6 to 11 Years | 10,855 (28.8%) | 8,852 (25.0%) |
| 12 to 14 Years | 4,577 (24.4%) | 3,849 (20.7%) |
| 15 Years | 1,412 (22.1%) | 1,357 (22.5%) |
| 16 and 17 Years | 2,528 (21.3%) | 2,255 (19.3%) |
| 18 to 24 Years | 10,080 (24.5%) | 11,411 (28.5%) |
| 25 to 34 Years | 9,125 (12.6%) | 15,115 (19.9%) |
| 35 to 44 Years | 6,473 (10.9%) | 9,120 (14.6%) |
| 45 to 54 Years | 6,409 (12.4%) | 7,132 (13.3%) |
| 55 to 64 Years | 7,398 (14.0%) | 9,087 (16.0%) |
| 65 to 74 Years | 4,661 (12.8%) | 5,573 (13.4%) |
| 75 Years and over | 2,154 (11.0%) | 4,535 (14.8%) |
| Total | 74,876 (16.8%) | 87,911 (18.8%) |
Income Above Poverty by Sex and Age in Milwaukee County
According to the poverty statistics in Milwaukee County, males aged 35 to 44 years and females aged 45 to 54 years are the age groups that are most secure financially, with 89.1% of males and 86.7% of females in these age groups living above the poverty line.
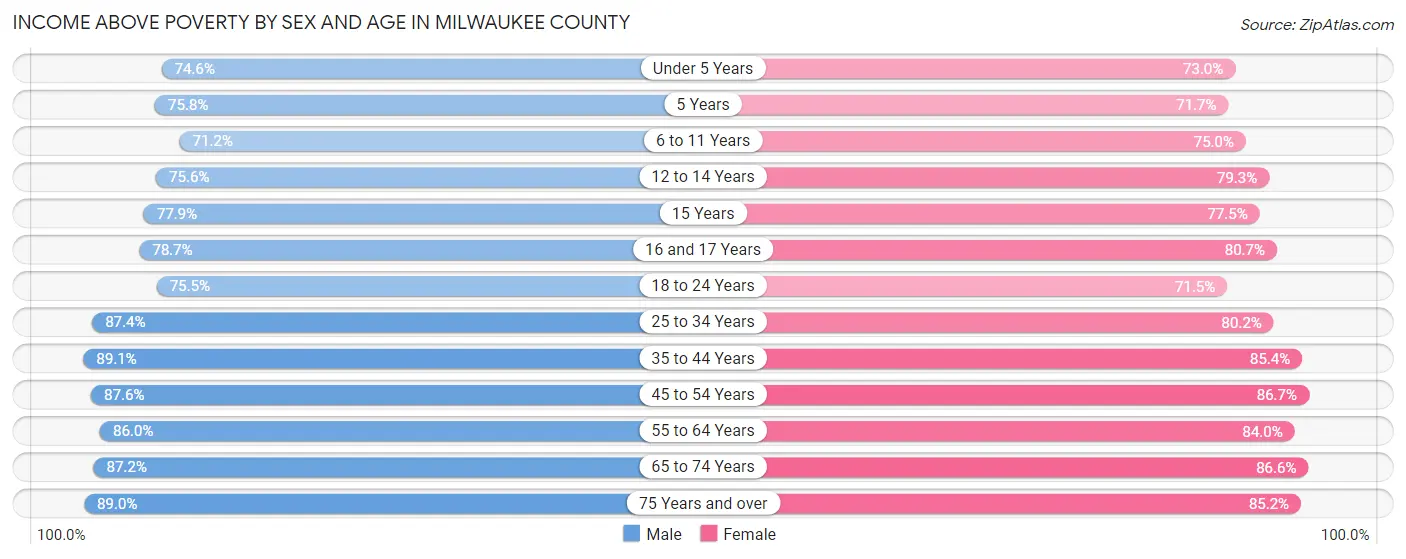
| Age Bracket | Male | Female |
| Under 5 Years | 22,971 (74.6%) | 21,850 (73.0%) |
| 5 Years | 4,306 (75.8%) | 3,922 (71.7%) |
| 6 to 11 Years | 26,881 (71.2%) | 26,533 (75.0%) |
| 12 to 14 Years | 14,161 (75.6%) | 14,735 (79.3%) |
| 15 Years | 4,969 (77.9%) | 4,685 (77.5%) |
| 16 and 17 Years | 9,347 (78.7%) | 9,449 (80.7%) |
| 18 to 24 Years | 31,017 (75.5%) | 28,635 (71.5%) |
| 25 to 34 Years | 63,544 (87.4%) | 61,044 (80.1%) |
| 35 to 44 Years | 52,810 (89.1%) | 53,438 (85.4%) |
| 45 to 54 Years | 45,448 (87.6%) | 46,420 (86.7%) |
| 55 to 64 Years | 45,407 (86.0%) | 47,817 (84.0%) |
| 65 to 74 Years | 31,756 (87.2%) | 35,932 (86.6%) |
| 75 Years and over | 17,378 (89.0%) | 26,151 (85.2%) |
| Total | 369,995 (83.2%) | 380,611 (81.2%) |
Income Below Poverty Among Married-Couple Families in Milwaukee County
The poverty statistics for married-couple families in Milwaukee County show that 5.4% or 6,994 of the total 128,617 families live below the poverty line. Families with 5 or more children have the highest poverty rate of 45.5%, comprising of 701 families. On the other hand, families with no children have the lowest poverty rate of 4.0%, which includes 2,974 families.
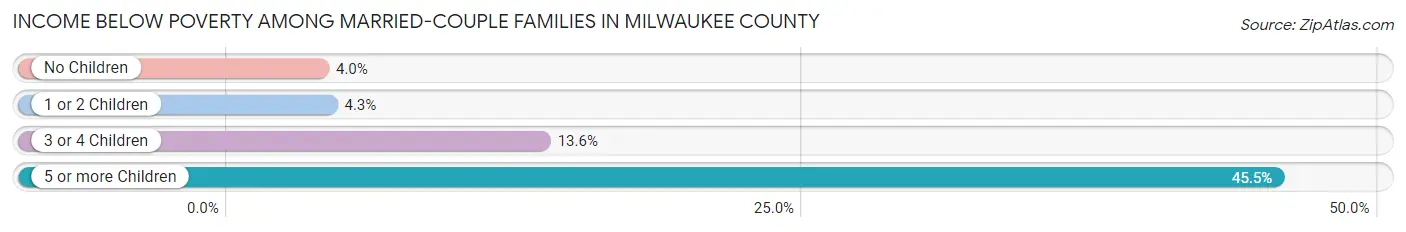
| Children | Above Poverty | Below Poverty |
| No Children | 72,202 (96.0%) | 2,974 (4.0%) |
| 1 or 2 Children | 38,611 (95.7%) | 1,748 (4.3%) |
| 3 or 4 Children | 9,971 (86.4%) | 1,571 (13.6%) |
| 5 or more Children | 839 (54.5%) | 701 (45.5%) |
| Total | 121,623 (94.6%) | 6,994 (5.4%) |
Income Below Poverty Among Single-Parent Households in Milwaukee County
According to the poverty data in Milwaukee County, 17.3% or 3,639 single-father households and 27.9% or 16,856 single-mother households are living below the poverty line. Among single-father households, those with 5 or more children have the highest poverty rate, with 79 households (40.1%) experiencing poverty. Likewise, among single-mother households, those with 5 or more children have the highest poverty rate, with 721 households (68.1%) falling below the poverty line.
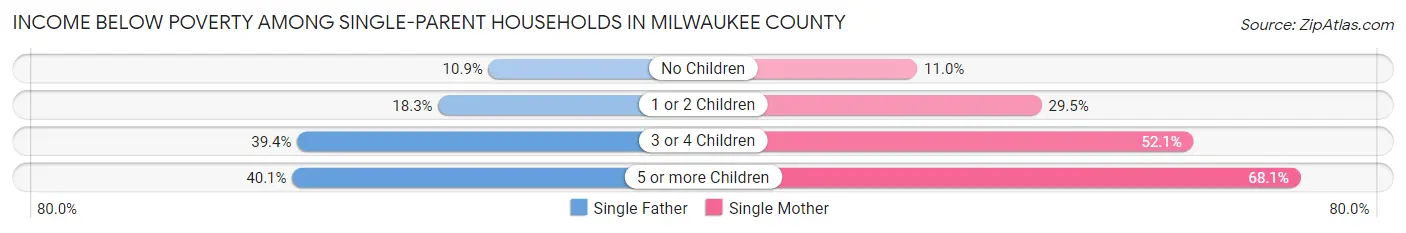
| Children | Single Father | Single Mother |
| No Children | 1,005 (10.8%) | 2,043 (11.0%) |
| 1 or 2 Children | 1,759 (18.3%) | 9,278 (29.5%) |
| 3 or 4 Children | 796 (39.4%) | 4,814 (52.1%) |
| 5 or more Children | 79 (40.1%) | 721 (68.1%) |
| Total | 3,639 (17.3%) | 16,856 (27.9%) |
Income Below Poverty Among Married-Couple vs Single-Parent Households in Milwaukee County
The poverty data for Milwaukee County shows that 6,994 of the married-couple family households (5.4%) and 20,495 of the single-parent households (25.2%) are living below the poverty level. Within the married-couple family households, those with 5 or more children have the highest poverty rate, with 701 households (45.5%) falling below the poverty line. Among the single-parent households, those with 5 or more children have the highest poverty rate, with 800 household (63.7%) living below poverty.
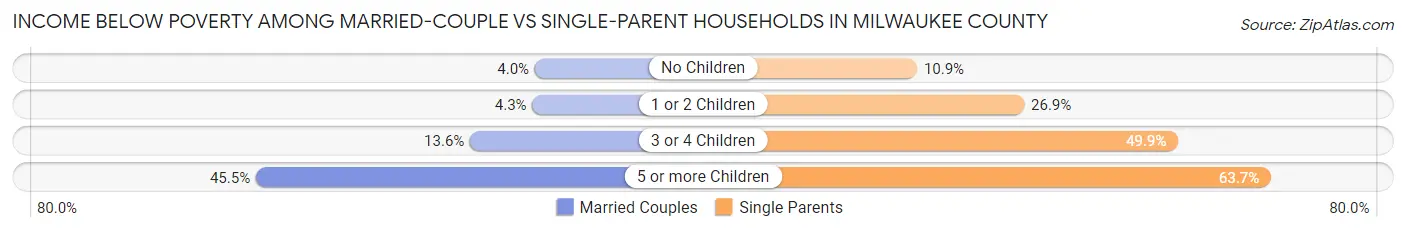
| Children | Married-Couple Families | Single-Parent Households |
| No Children | 2,974 (4.0%) | 3,048 (10.9%) |
| 1 or 2 Children | 1,748 (4.3%) | 11,037 (26.9%) |
| 3 or 4 Children | 1,571 (13.6%) | 5,610 (49.8%) |
| 5 or more Children | 701 (45.5%) | 800 (63.7%) |
| Total | 6,994 (5.4%) | 20,495 (25.2%) |
Employment Characteristics in Milwaukee County
Employment by Class of Employer in Milwaukee County
Among the 445,979 employed individuals in Milwaukee County, private company employees (313,611 | 70.3%), not-for-profit organizations (54,221 | 12.2%), and local government employees (29,143 | 6.5%) make up the most common classes of employment.
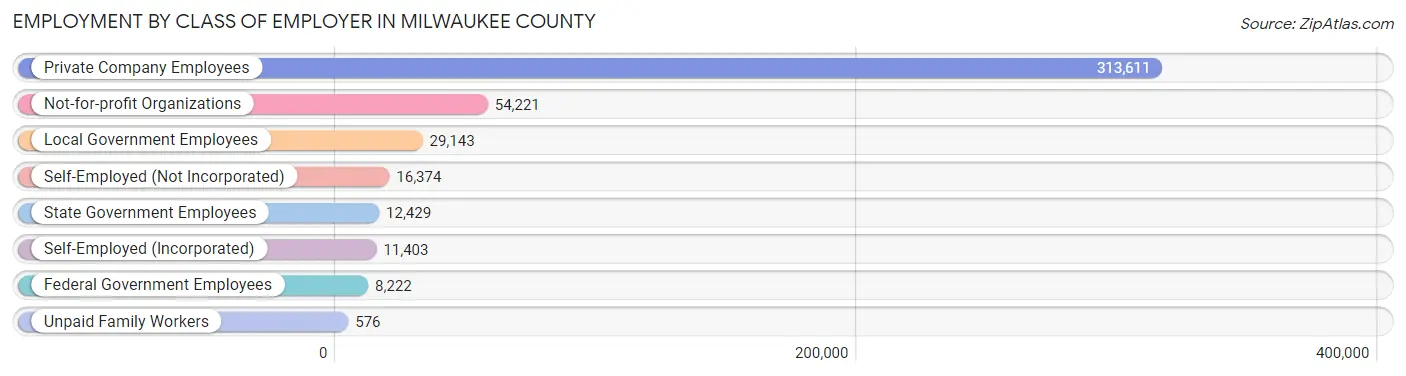
| Employer Class | # Employees | % Employees |
| Private Company Employees | 313,611 | 70.3% |
| Self-Employed (Incorporated) | 11,403 | 2.6% |
| Self-Employed (Not Incorporated) | 16,374 | 3.7% |
| Not-for-profit Organizations | 54,221 | 12.2% |
| Local Government Employees | 29,143 | 6.5% |
| State Government Employees | 12,429 | 2.8% |
| Federal Government Employees | 8,222 | 1.8% |
| Unpaid Family Workers | 576 | 0.1% |
| Total | 445,979 | 100.0% |
Employment Status by Age in Milwaukee County
According to the labor force statistics for Milwaukee County, out of the total population over 16 years of age (734,795), 64.7% or 475,412 individuals are in the labor force, with 4.7% or 22,344 of them unemployed. The age group with the highest labor force participation rate is 30 to 34 years, with 84.6% or 61,915 individuals in the labor force. Within the labor force, the 16 to 19 years age range has the highest percentage of unemployed individuals, with 9.4% or 1,912 of them being unemployed.
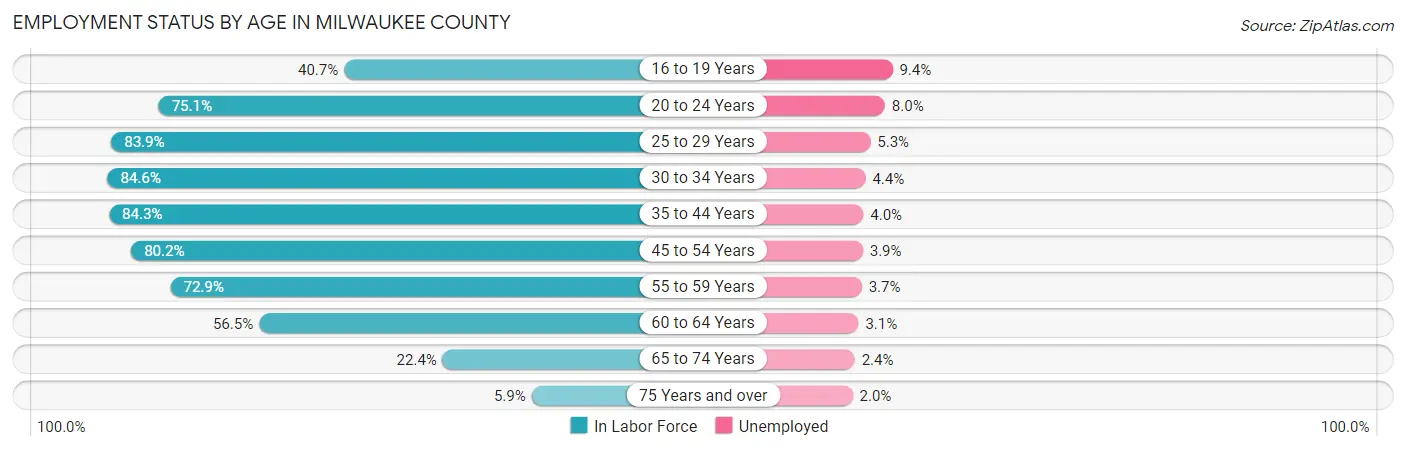
| Age Bracket | In Labor Force | Unemployed |
| 16 to 19 Years | 20,343 (40.7%) | 1,912 (9.4%) |
| 20 to 24 Years | 48,192 (75.1%) | 3,855 (8.0%) |
| 25 to 29 Years | 64,559 (83.9%) | 3,422 (5.3%) |
| 30 to 34 Years | 61,915 (84.6%) | 2,724 (4.4%) |
| 35 to 44 Years | 103,362 (84.3%) | 4,134 (4.0%) |
| 45 to 54 Years | 84,802 (80.2%) | 3,307 (3.9%) |
| 55 to 59 Years | 40,677 (72.9%) | 1,505 (3.7%) |
| 60 to 64 Years | 30,864 (56.5%) | 957 (3.1%) |
| 65 to 74 Years | 17,739 (22.4%) | 426 (2.4%) |
| 75 Years and over | 3,100 (5.9%) | 62 (2.0%) |
| Total | 475,412 (64.7%) | 22,344 (4.7%) |
Employment Status by Educational Attainment in Milwaukee County
According to labor force statistics for Milwaukee County, 79.0% of individuals (386,237) out of the total population between 25 and 64 years of age (488,908) are in the labor force, with 4.1% or 15,836 of them being unemployed. The group with the highest labor force participation rate are those with the educational attainment of bachelor's degree or higher, with 88.8% or 148,990 individuals in the labor force. Within the labor force, individuals with less than high school education have the highest percentage of unemployment, with 7.1% or 2,073 of them being unemployed.
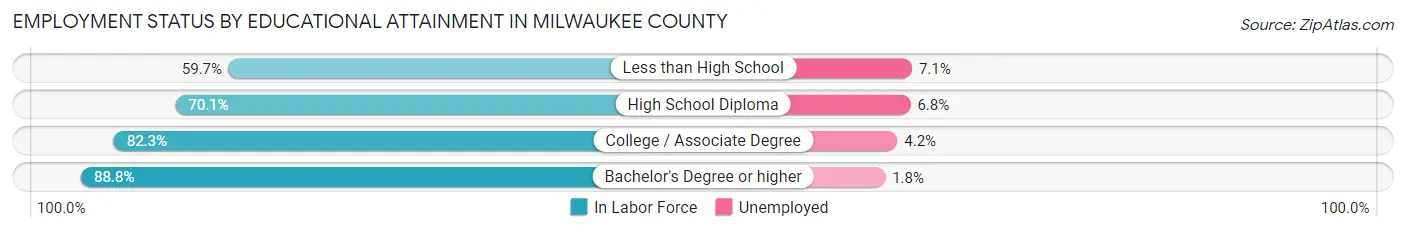
| Educational Attainment | In Labor Force | Unemployed |
| Less than High School | 29,196 (59.7%) | 3,472 (7.1%) |
| High School Diploma | 92,574 (70.1%) | 8,980 (6.8%) |
| College / Associate Degree | 115,353 (82.3%) | 5,887 (4.2%) |
| Bachelor's Degree or higher | 148,990 (88.8%) | 3,020 (1.8%) |
| Total | 386,237 (79.0%) | 20,045 (4.1%) |
Employment Occupations by Sex in Milwaukee County
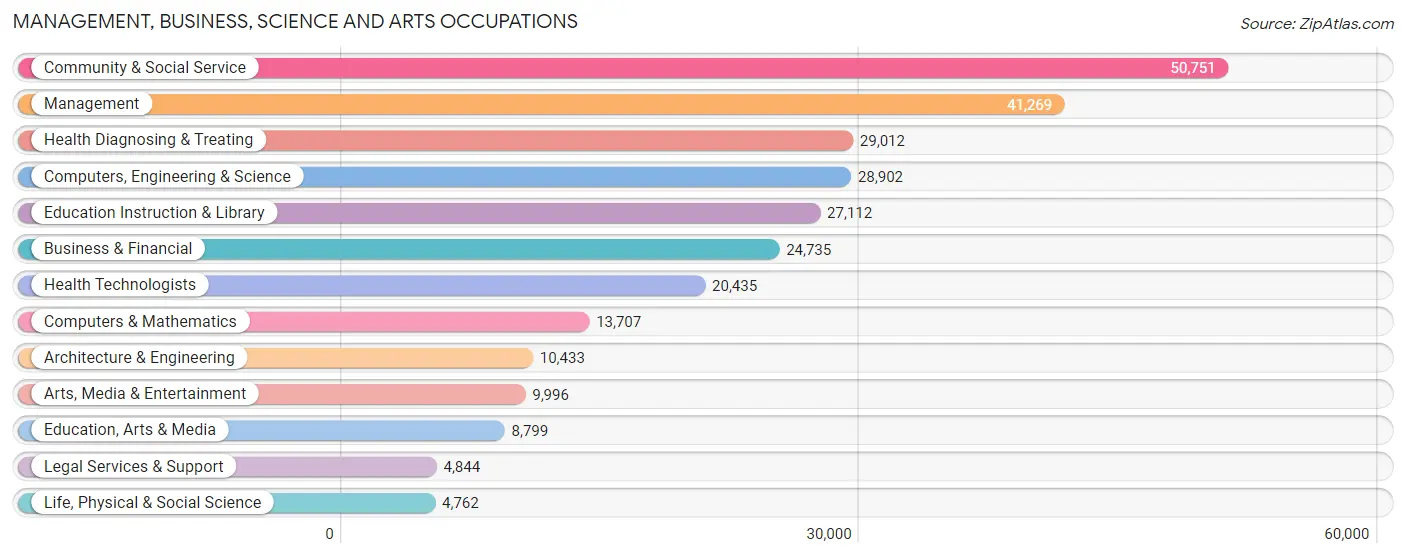
Management, Business, Science and Arts Occupations
The most common Management, Business, Science and Arts occupations in Milwaukee County are Community & Social Service (50,751 | 11.2%), Management (41,269 | 9.1%), Health Diagnosing & Treating (29,012 | 6.4%), Computers, Engineering & Science (28,902 | 6.4%), and Education Instruction & Library (27,112 | 6.0%).
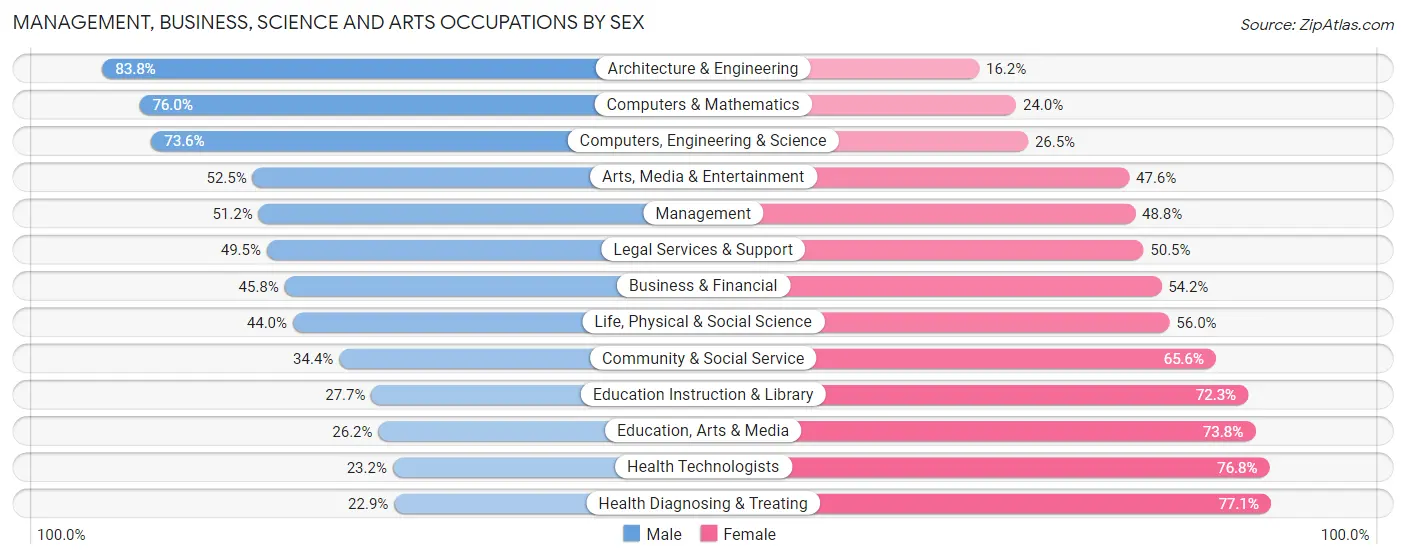
Management, Business, Science and Arts Occupations by Sex
Within the Management, Business, Science and Arts occupations in Milwaukee County, the most male-oriented occupations are Architecture & Engineering (83.8%), Computers & Mathematics (76.0%), and Computers, Engineering & Science (73.6%), while the most female-oriented occupations are Health Diagnosing & Treating (77.1%), Health Technologists (76.8%), and Education, Arts & Media (73.8%).
| Occupation | Male | Female |
| Management | 21,132 (51.2%) | 20,137 (48.8%) |
| Business & Financial | 11,319 (45.8%) | 13,416 (54.2%) |
| Computers, Engineering & Science | 21,258 (73.6%) | 7,644 (26.5%) |
| Computers & Mathematics | 10,422 (76.0%) | 3,285 (24.0%) |
| Architecture & Engineering | 8,739 (83.8%) | 1,694 (16.2%) |
| Life, Physical & Social Science | 2,097 (44.0%) | 2,665 (56.0%) |
| Community & Social Service | 17,448 (34.4%) | 33,303 (65.6%) |
| Education, Arts & Media | 2,305 (26.2%) | 6,494 (73.8%) |
| Legal Services & Support | 2,397 (49.5%) | 2,447 (50.5%) |
| Education Instruction & Library | 7,503 (27.7%) | 19,609 (72.3%) |
| Arts, Media & Entertainment | 5,243 (52.4%) | 4,753 (47.5%) |
| Health Diagnosing & Treating | 6,646 (22.9%) | 22,366 (77.1%) |
| Health Technologists | 4,742 (23.2%) | 15,693 (76.8%) |
| Total (Category) | 77,803 (44.5%) | 96,866 (55.5%) |
| Total (Overall) | 227,447 (50.2%) | 225,391 (49.8%) |
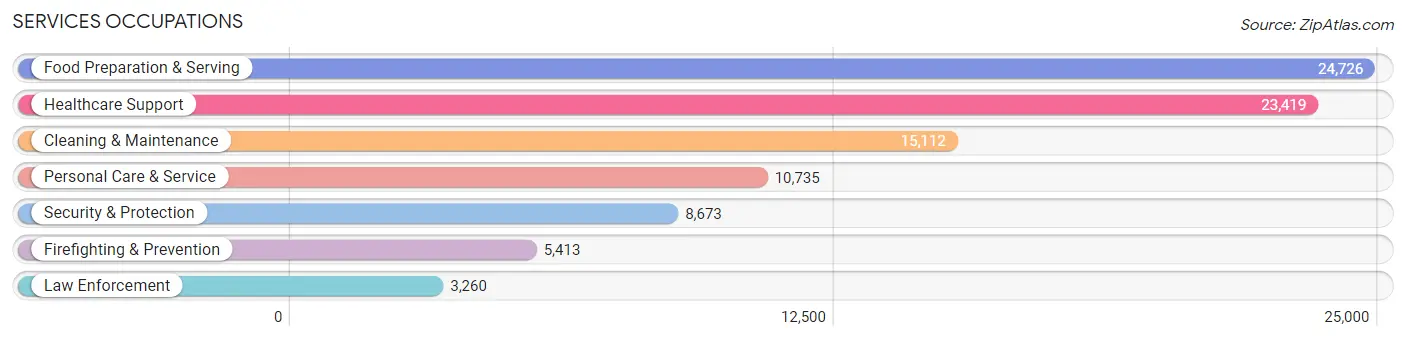
Services Occupations
The most common Services occupations in Milwaukee County are Food Preparation & Serving (24,726 | 5.5%), Healthcare Support (23,419 | 5.2%), Cleaning & Maintenance (15,112 | 3.3%), Personal Care & Service (10,735 | 2.4%), and Security & Protection (8,673 | 1.9%).
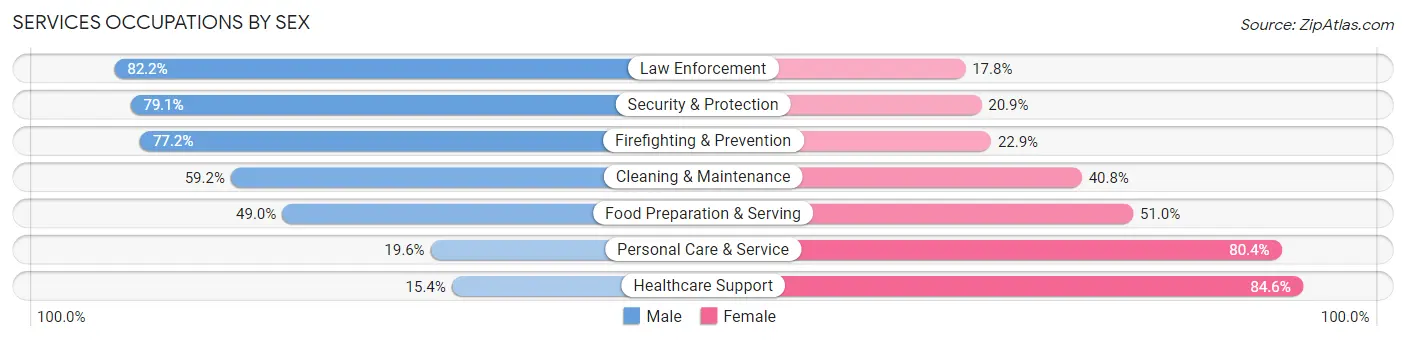
Services Occupations by Sex
Within the Services occupations in Milwaukee County, the most male-oriented occupations are Law Enforcement (82.2%), Security & Protection (79.1%), and Firefighting & Prevention (77.1%), while the most female-oriented occupations are Healthcare Support (84.6%), Personal Care & Service (80.4%), and Food Preparation & Serving (51.0%).
| Occupation | Male | Female |
| Healthcare Support | 3,615 (15.4%) | 19,804 (84.6%) |
| Security & Protection | 6,857 (79.1%) | 1,816 (20.9%) |
| Firefighting & Prevention | 4,176 (77.1%) | 1,237 (22.9%) |
| Law Enforcement | 2,681 (82.2%) | 579 (17.8%) |
| Food Preparation & Serving | 12,119 (49.0%) | 12,607 (51.0%) |
| Cleaning & Maintenance | 8,944 (59.2%) | 6,168 (40.8%) |
| Personal Care & Service | 2,108 (19.6%) | 8,627 (80.4%) |
| Total (Category) | 33,643 (40.7%) | 49,022 (59.3%) |
| Total (Overall) | 227,447 (50.2%) | 225,391 (49.8%) |
Sales and Office Occupations
The most common Sales and Office occupations in Milwaukee County are Office & Administration (50,736 | 11.2%), and Sales & Related (38,045 | 8.4%).

Sales and Office Occupations by Sex
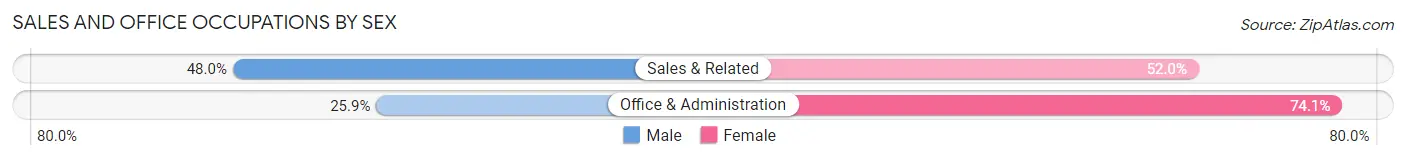
| Occupation | Male | Female |
| Sales & Related | 18,254 (48.0%) | 19,791 (52.0%) |
| Office & Administration | 13,139 (25.9%) | 37,597 (74.1%) |
| Total (Category) | 31,393 (35.4%) | 57,388 (64.6%) |
| Total (Overall) | 227,447 (50.2%) | 225,391 (49.8%) |
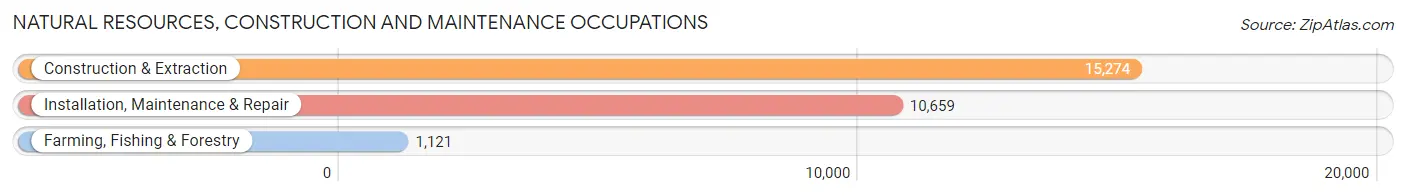
Natural Resources, Construction and Maintenance Occupations
The most common Natural Resources, Construction and Maintenance occupations in Milwaukee County are Construction & Extraction (15,274 | 3.4%), Installation, Maintenance & Repair (10,659 | 2.4%), and Farming, Fishing & Forestry (1,121 | 0.3%).
Natural Resources, Construction and Maintenance Occupations by Sex
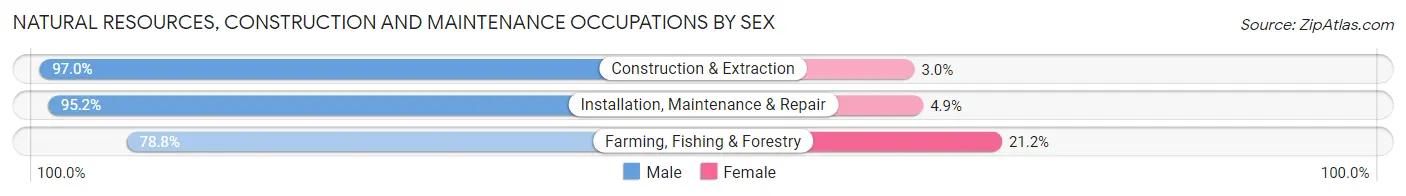
| Occupation | Male | Female |
| Farming, Fishing & Forestry | 883 (78.8%) | 238 (21.2%) |
| Construction & Extraction | 14,809 (97.0%) | 465 (3.0%) |
| Installation, Maintenance & Repair | 10,142 (95.2%) | 517 (4.9%) |
| Total (Category) | 25,834 (95.5%) | 1,220 (4.5%) |
| Total (Overall) | 227,447 (50.2%) | 225,391 (49.8%) |
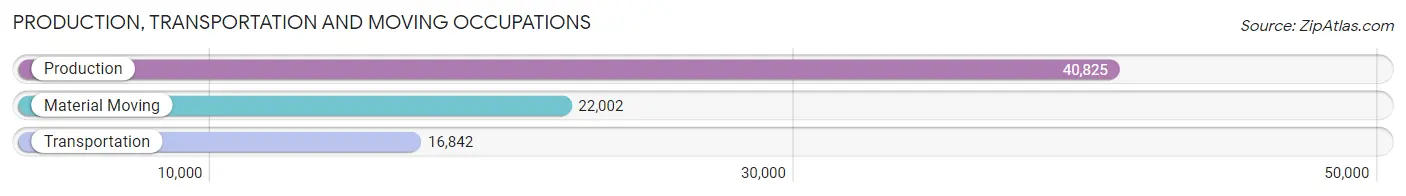
Production, Transportation and Moving Occupations
The most common Production, Transportation and Moving occupations in Milwaukee County are Production (40,825 | 9.0%), Material Moving (22,002 | 4.9%), and Transportation (16,842 | 3.7%).
Production, Transportation and Moving Occupations by Sex
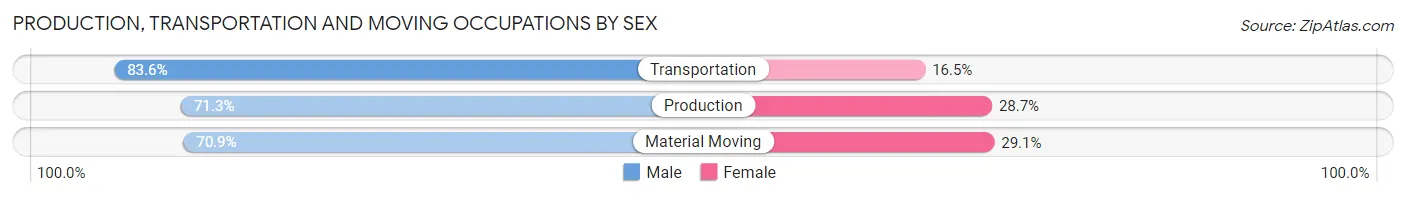
| Occupation | Male | Female |
| Production | 29,109 (71.3%) | 11,716 (28.7%) |
| Transportation | 14,072 (83.6%) | 2,770 (16.5%) |
| Material Moving | 15,593 (70.9%) | 6,409 (29.1%) |
| Total (Category) | 58,774 (73.8%) | 20,895 (26.2%) |
| Total (Overall) | 227,447 (50.2%) | 225,391 (49.8%) |
Employment Industries by Sex in Milwaukee County
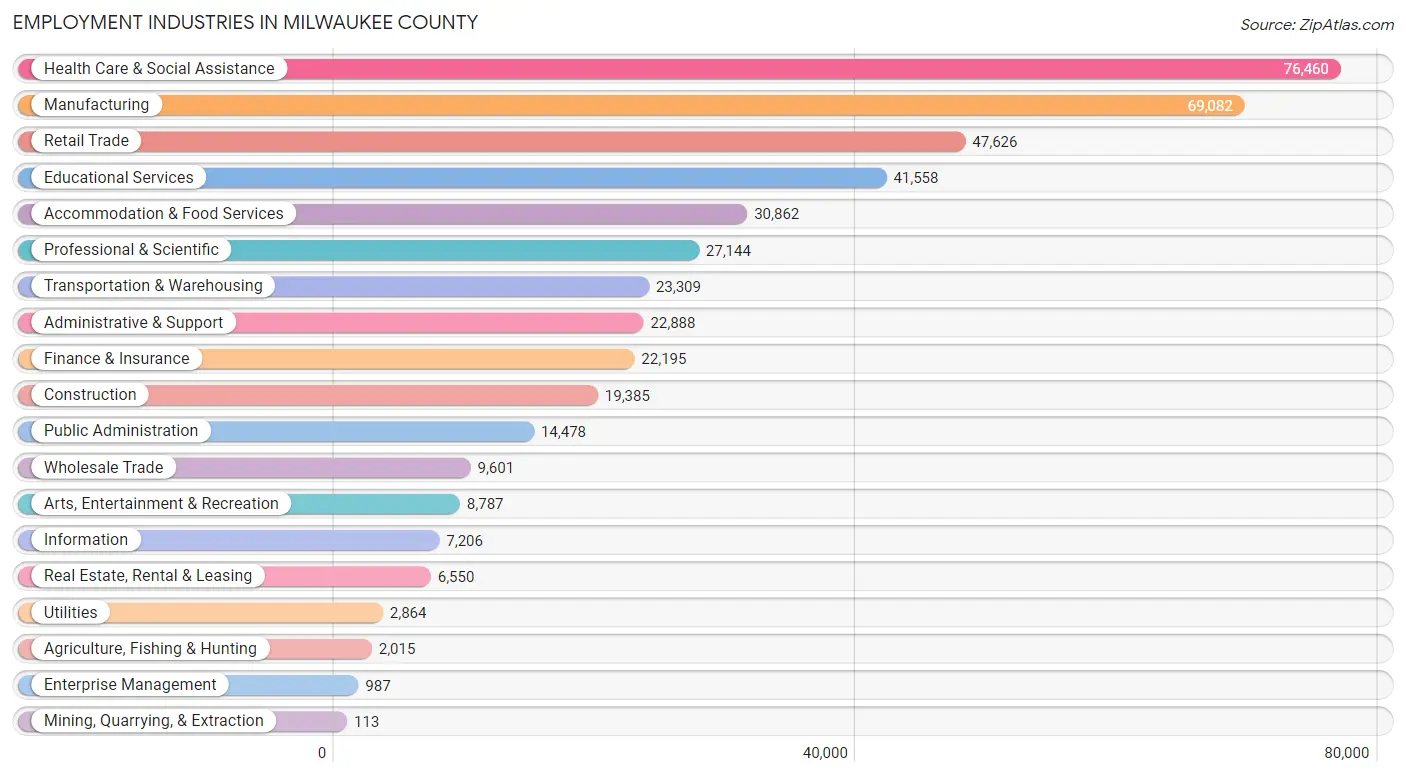
Employment Industries in Milwaukee County
The major employment industries in Milwaukee County include Health Care & Social Assistance (76,460 | 16.9%), Manufacturing (69,082 | 15.3%), Retail Trade (47,626 | 10.5%), Educational Services (41,558 | 9.2%), and Accommodation & Food Services (30,862 | 6.8%).
Employment Industries by Sex in Milwaukee County
The Milwaukee County industries that see more men than women are Construction (90.7%), Mining, Quarrying, & Extraction (76.1%), and Utilities (73.1%), whereas the industries that tend to have a higher number of women are Health Care & Social Assistance (80.0%), Educational Services (67.4%), and Enterprise Management (60.0%).
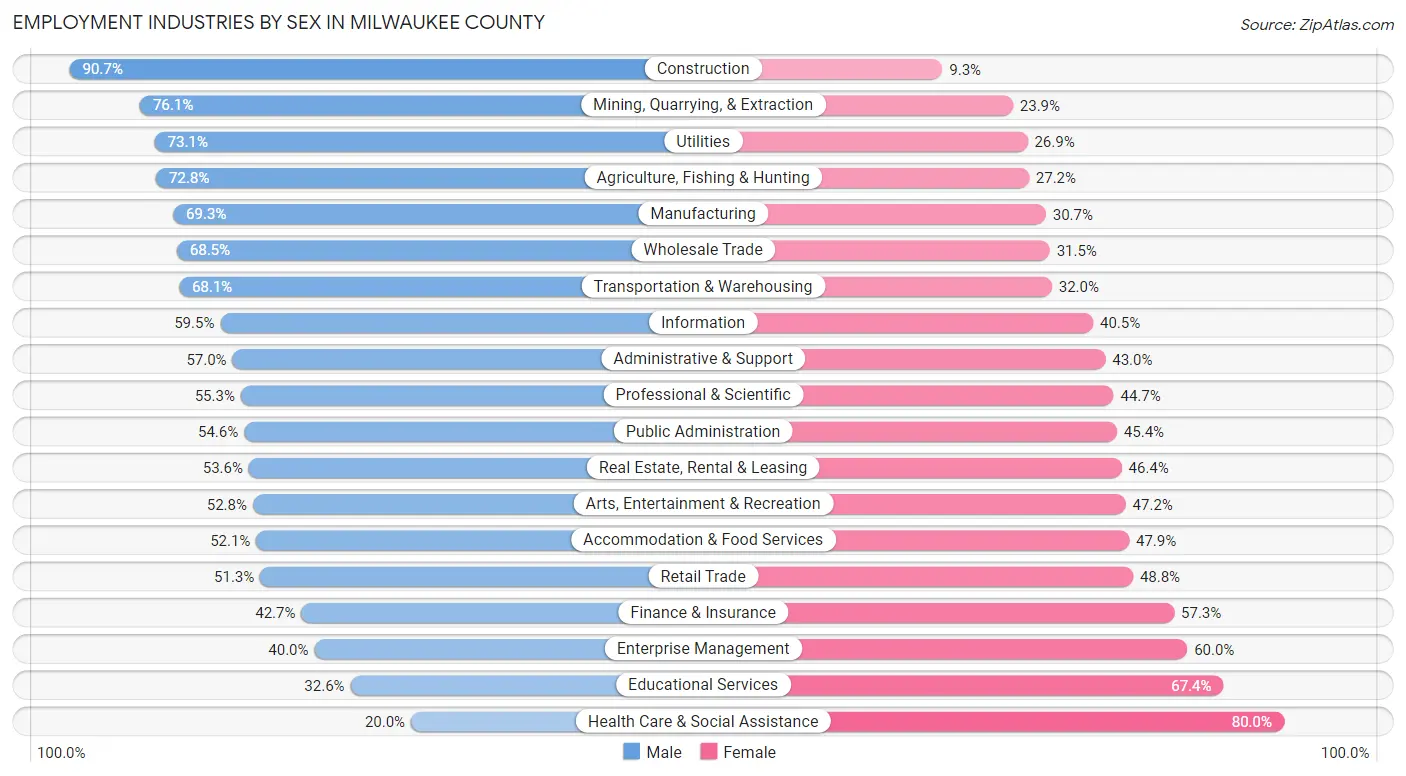
| Industry | Male | Female |
| Agriculture, Fishing & Hunting | 1,467 (72.8%) | 548 (27.2%) |
| Mining, Quarrying, & Extraction | 86 (76.1%) | 27 (23.9%) |
| Construction | 17,583 (90.7%) | 1,802 (9.3%) |
| Manufacturing | 47,863 (69.3%) | 21,219 (30.7%) |
| Wholesale Trade | 6,575 (68.5%) | 3,026 (31.5%) |
| Retail Trade | 24,407 (51.2%) | 23,219 (48.7%) |
| Transportation & Warehousing | 15,862 (68.0%) | 7,447 (32.0%) |
| Utilities | 2,093 (73.1%) | 771 (26.9%) |
| Information | 4,288 (59.5%) | 2,918 (40.5%) |
| Finance & Insurance | 9,485 (42.7%) | 12,710 (57.3%) |
| Real Estate, Rental & Leasing | 3,510 (53.6%) | 3,040 (46.4%) |
| Professional & Scientific | 14,999 (55.3%) | 12,145 (44.7%) |
| Enterprise Management | 395 (40.0%) | 592 (60.0%) |
| Administrative & Support | 13,041 (57.0%) | 9,847 (43.0%) |
| Educational Services | 13,533 (32.6%) | 28,025 (67.4%) |
| Health Care & Social Assistance | 15,316 (20.0%) | 61,144 (80.0%) |
| Arts, Entertainment & Recreation | 4,636 (52.8%) | 4,151 (47.2%) |
| Accommodation & Food Services | 16,066 (52.1%) | 14,796 (47.9%) |
| Public Administration | 7,901 (54.6%) | 6,577 (45.4%) |
| Total | 227,447 (50.2%) | 225,391 (49.8%) |
Education in Milwaukee County
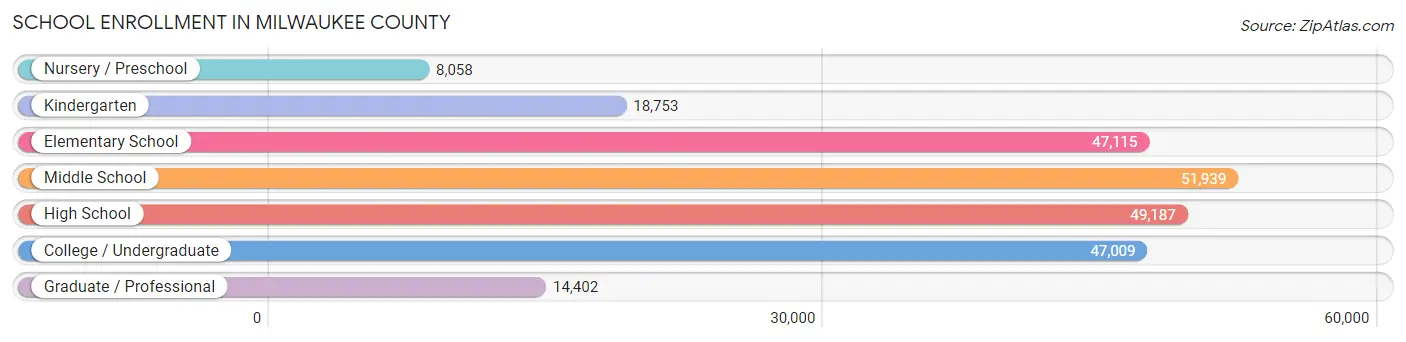
School Enrollment in Milwaukee County
The most common levels of schooling among the 236,463 students in Milwaukee County are middle school (51,939 | 22.0%), high school (49,187 | 20.8%), and elementary school (47,115 | 19.9%).
| School Level | # Students | % Students |
| Nursery / Preschool | 8,058 | 3.4% |
| Kindergarten | 18,753 | 7.9% |
| Elementary School | 47,115 | 19.9% |
| Middle School | 51,939 | 22.0% |
| High School | 49,187 | 20.8% |
| College / Undergraduate | 47,009 | 19.9% |
| Graduate / Professional | 14,402 | 6.1% |
| Total | 236,463 | 100.0% |
School Enrollment by Age by Funding Source in Milwaukee County
Out of a total of 236,463 students who are enrolled in schools in Milwaukee County, 61,007 (25.8%) attend a private institution, while the remaining 175,456 (74.2%) are enrolled in public schools. The age group of 20 to 24 year olds has the highest likelihood of being enrolled in private schools, with 9,021 (37.8% in the age bracket) enrolled. Conversely, the age group of 15 to 17 year olds has the lowest likelihood of being enrolled in a private school, with 28,572 (81.4% in the age bracket) attending a public institution.
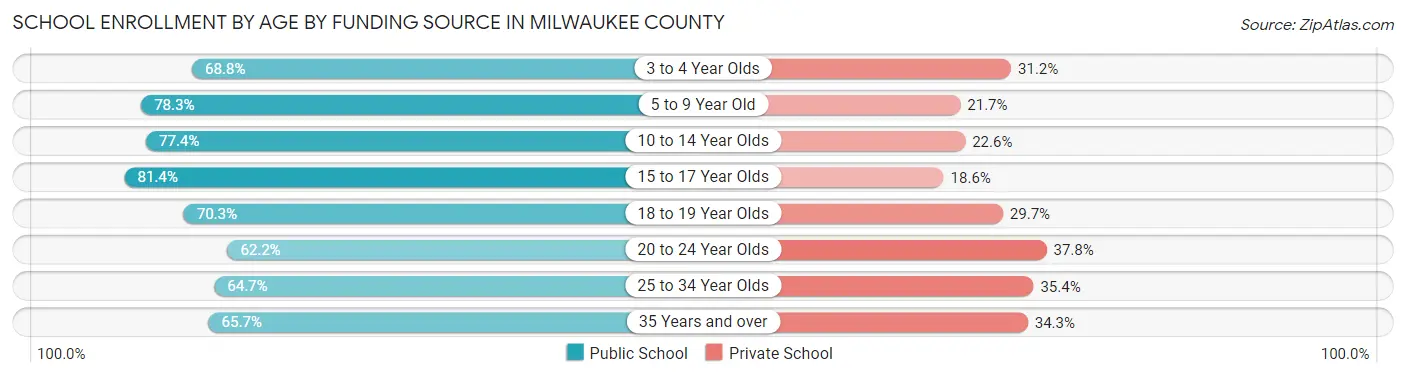
| Age Bracket | Public School | Private School |
| 3 to 4 Year Olds | 7,909 (68.8%) | 3,585 (31.2%) |
| 5 to 9 Year Old | 44,889 (78.3%) | 12,463 (21.7%) |
| 10 to 14 Year Olds | 48,388 (77.4%) | 14,162 (22.6%) |
| 15 to 17 Year Olds | 28,572 (81.4%) | 6,536 (18.6%) |
| 18 to 19 Year Olds | 13,080 (70.3%) | 5,516 (29.7%) |
| 20 to 24 Year Olds | 14,850 (62.2%) | 9,021 (37.8%) |
| 25 to 34 Year Olds | 11,212 (64.6%) | 6,130 (35.3%) |
| 35 Years and over | 6,670 (65.7%) | 3,480 (34.3%) |
| Total | 175,456 (74.2%) | 61,007 (25.8%) |
Educational Attainment by Field of Study in Milwaukee County
Business (41,518 | 18.4%), science & technology (24,502 | 10.9%), education (24,276 | 10.8%), social sciences (18,074 | 8.0%), and arts & humanities (15,193 | 6.7%) are the most common fields of study among 225,656 individuals in Milwaukee County who have obtained a bachelor's degree or higher.
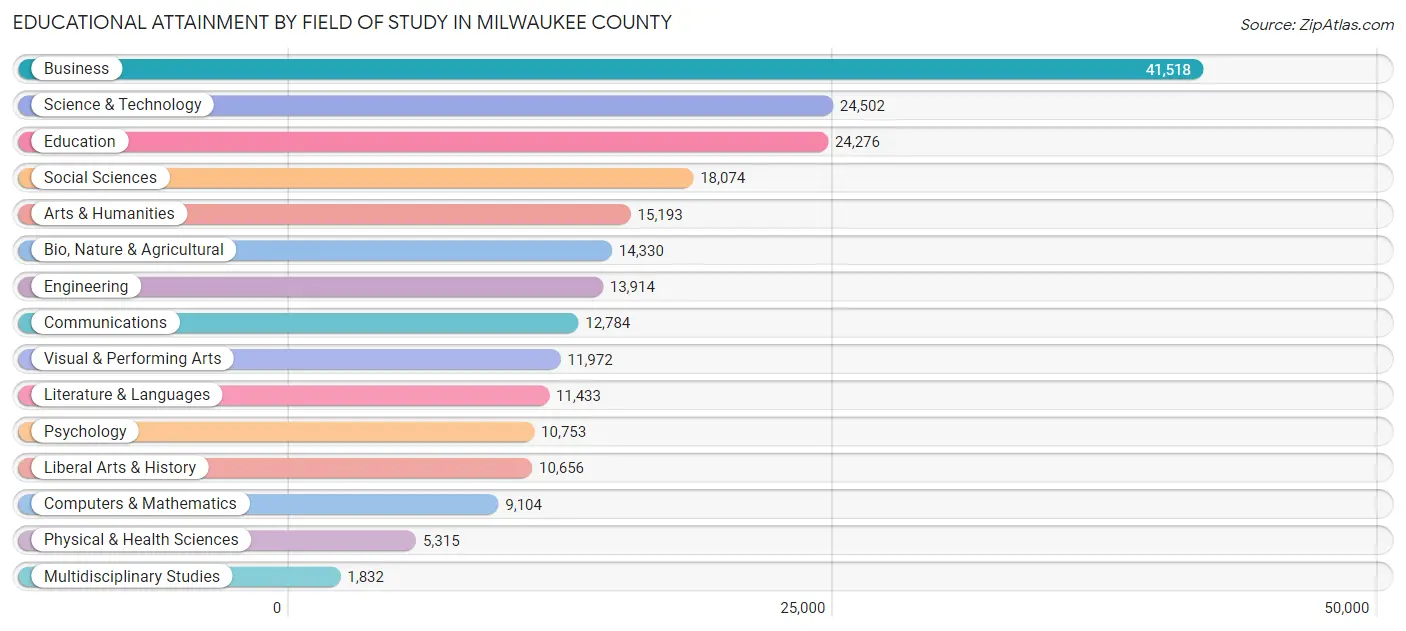
| Field of Study | # Graduates | % Graduates |
| Computers & Mathematics | 9,104 | 4.0% |
| Bio, Nature & Agricultural | 14,330 | 6.4% |
| Physical & Health Sciences | 5,315 | 2.4% |
| Psychology | 10,753 | 4.8% |
| Social Sciences | 18,074 | 8.0% |
| Engineering | 13,914 | 6.2% |
| Multidisciplinary Studies | 1,832 | 0.8% |
| Science & Technology | 24,502 | 10.9% |
| Business | 41,518 | 18.4% |
| Education | 24,276 | 10.8% |
| Literature & Languages | 11,433 | 5.1% |
| Liberal Arts & History | 10,656 | 4.7% |
| Visual & Performing Arts | 11,972 | 5.3% |
| Communications | 12,784 | 5.7% |
| Arts & Humanities | 15,193 | 6.7% |
| Total | 225,656 | 100.0% |
Transportation & Commute in Milwaukee County
Vehicle Availability by Sex in Milwaukee County
The most prevalent vehicle ownership categories in Milwaukee County are males with 2 vehicles (101,322, accounting for 45.5%) and females with 2 vehicles (90,145, making up 46.2%).
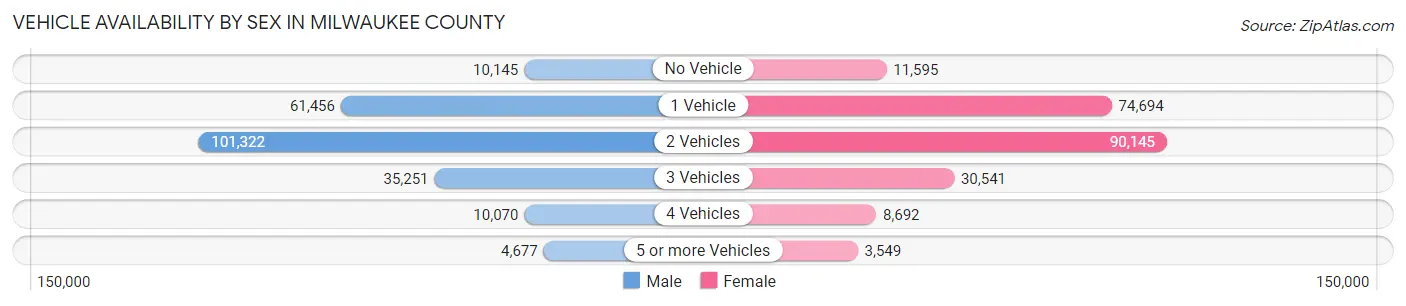
| Vehicles Available | Male | Female |
| No Vehicle | 10,145 (4.5%) | 11,595 (5.3%) |
| 1 Vehicle | 61,456 (27.6%) | 74,694 (34.1%) |
| 2 Vehicles | 101,322 (45.5%) | 90,145 (41.1%) |
| 3 Vehicles | 35,251 (15.8%) | 30,541 (13.9%) |
| 4 Vehicles | 10,070 (4.5%) | 8,692 (4.0%) |
| 5 or more Vehicles | 4,677 (2.1%) | 3,549 (1.6%) |
| Total | 222,921 (100.0%) | 219,216 (100.0%) |
Commute Time in Milwaukee County
The most frequently occuring commute durations in Milwaukee County are 15 to 19 minutes (79,010 commuters, 19.9%), 20 to 24 minutes (75,951 commuters, 19.1%), and 10 to 14 minutes (60,215 commuters, 15.1%).
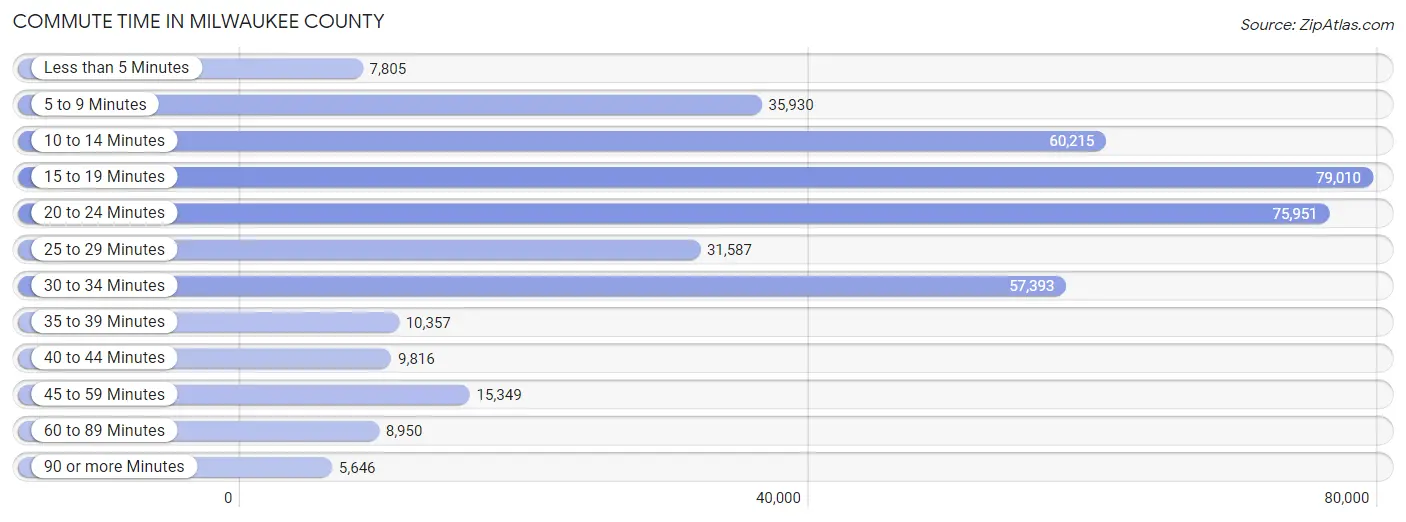
| Commute Time | # Commuters | % Commuters |
| Less than 5 Minutes | 7,805 | 2.0% |
| 5 to 9 Minutes | 35,930 | 9.0% |
| 10 to 14 Minutes | 60,215 | 15.1% |
| 15 to 19 Minutes | 79,010 | 19.9% |
| 20 to 24 Minutes | 75,951 | 19.1% |
| 25 to 29 Minutes | 31,587 | 7.9% |
| 30 to 34 Minutes | 57,393 | 14.4% |
| 35 to 39 Minutes | 10,357 | 2.6% |
| 40 to 44 Minutes | 9,816 | 2.5% |
| 45 to 59 Minutes | 15,349 | 3.9% |
| 60 to 89 Minutes | 8,950 | 2.2% |
| 90 or more Minutes | 5,646 | 1.4% |
Commute Time by Sex in Milwaukee County
The most common commute times in Milwaukee County are 20 to 24 minutes (38,887 commuters, 19.3%) for males and 15 to 19 minutes (40,308 commuters, 20.5%) for females.
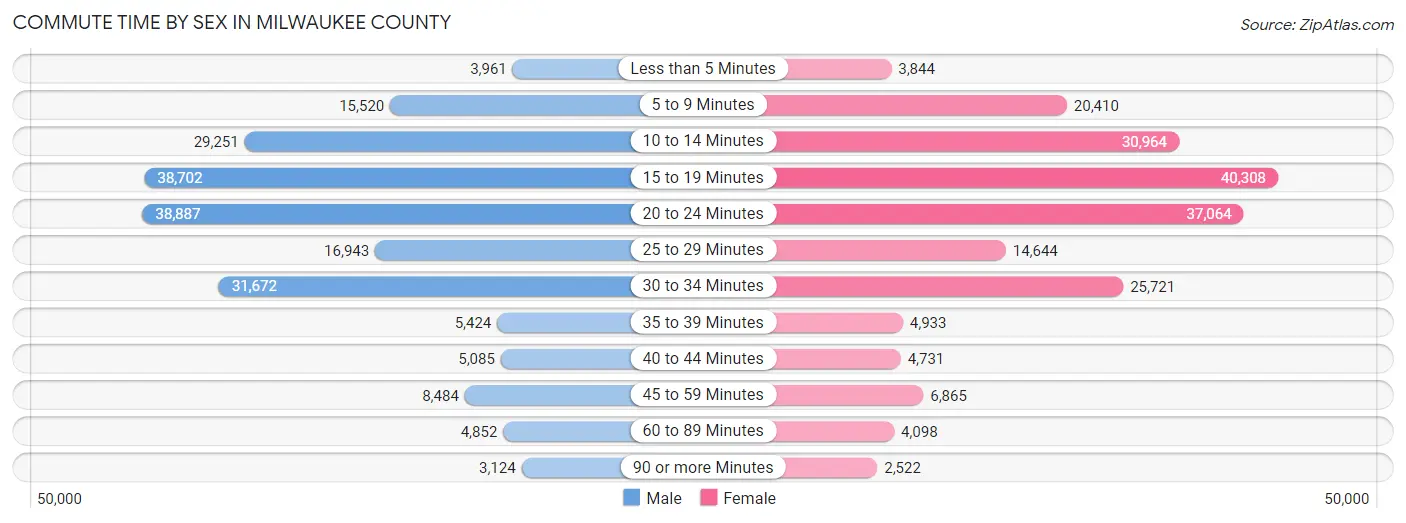
| Commute Time | Male | Female |
| Less than 5 Minutes | 3,961 (2.0%) | 3,844 (2.0%) |
| 5 to 9 Minutes | 15,520 (7.7%) | 20,410 (10.4%) |
| 10 to 14 Minutes | 29,251 (14.5%) | 30,964 (15.8%) |
| 15 to 19 Minutes | 38,702 (19.2%) | 40,308 (20.5%) |
| 20 to 24 Minutes | 38,887 (19.3%) | 37,064 (18.9%) |
| 25 to 29 Minutes | 16,943 (8.4%) | 14,644 (7.5%) |
| 30 to 34 Minutes | 31,672 (15.7%) | 25,721 (13.1%) |
| 35 to 39 Minutes | 5,424 (2.7%) | 4,933 (2.5%) |
| 40 to 44 Minutes | 5,085 (2.5%) | 4,731 (2.4%) |
| 45 to 59 Minutes | 8,484 (4.2%) | 6,865 (3.5%) |
| 60 to 89 Minutes | 4,852 (2.4%) | 4,098 (2.1%) |
| 90 or more Minutes | 3,124 (1.5%) | 2,522 (1.3%) |
Time of Departure to Work by Sex in Milwaukee County
The most frequent times of departure to work in Milwaukee County are 7:00 AM to 7:29 AM (29,715, 14.7%) for males and 7:00 AM to 7:29 AM (32,886, 16.8%) for females.
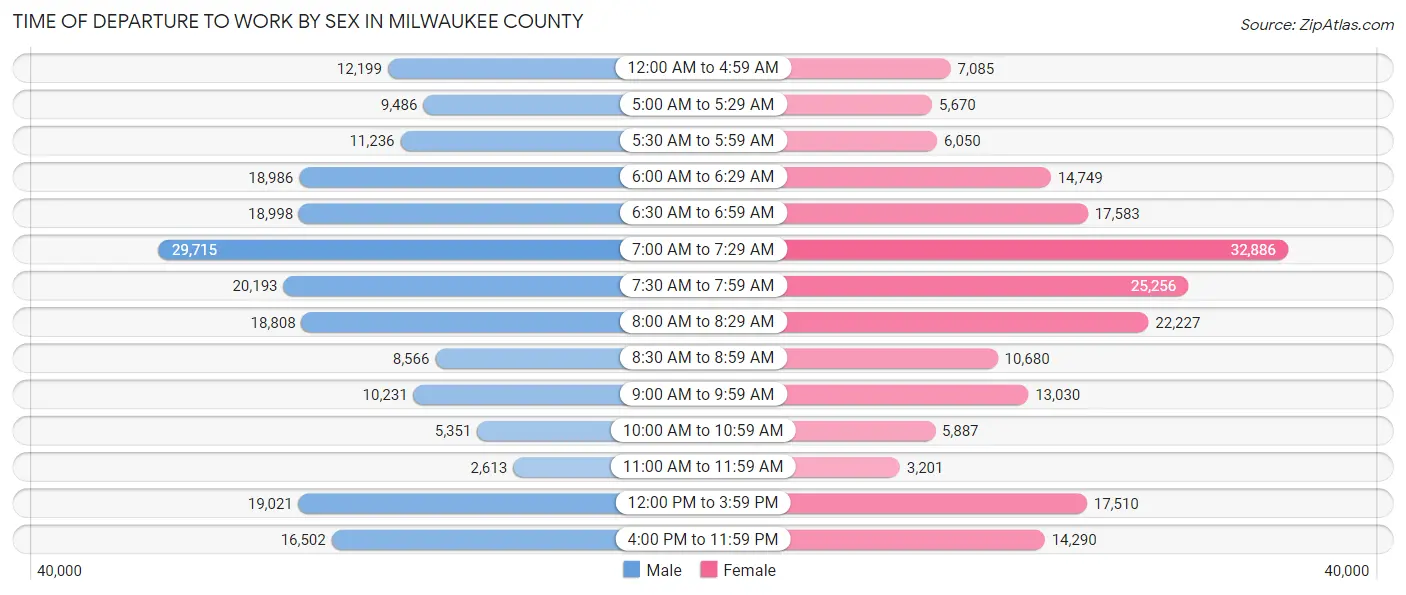
| Time of Departure | Male | Female |
| 12:00 AM to 4:59 AM | 12,199 (6.0%) | 7,085 (3.6%) |
| 5:00 AM to 5:29 AM | 9,486 (4.7%) | 5,670 (2.9%) |
| 5:30 AM to 5:59 AM | 11,236 (5.6%) | 6,050 (3.1%) |
| 6:00 AM to 6:29 AM | 18,986 (9.4%) | 14,749 (7.5%) |
| 6:30 AM to 6:59 AM | 18,998 (9.4%) | 17,583 (9.0%) |
| 7:00 AM to 7:29 AM | 29,715 (14.7%) | 32,886 (16.8%) |
| 7:30 AM to 7:59 AM | 20,193 (10.0%) | 25,256 (12.9%) |
| 8:00 AM to 8:29 AM | 18,808 (9.3%) | 22,227 (11.3%) |
| 8:30 AM to 8:59 AM | 8,566 (4.2%) | 10,680 (5.4%) |
| 9:00 AM to 9:59 AM | 10,231 (5.1%) | 13,030 (6.6%) |
| 10:00 AM to 10:59 AM | 5,351 (2.6%) | 5,887 (3.0%) |
| 11:00 AM to 11:59 AM | 2,613 (1.3%) | 3,201 (1.6%) |
| 12:00 PM to 3:59 PM | 19,021 (9.4%) | 17,510 (8.9%) |
| 4:00 PM to 11:59 PM | 16,502 (8.2%) | 14,290 (7.3%) |
| Total | 201,905 (100.0%) | 196,104 (100.0%) |
Housing Occupancy in Milwaukee County
Occupancy by Ownership in Milwaukee County
Of the total 389,247 dwellings in Milwaukee County, owner-occupied units account for 192,212 (49.4%), while renter-occupied units make up 197,035 (50.6%).
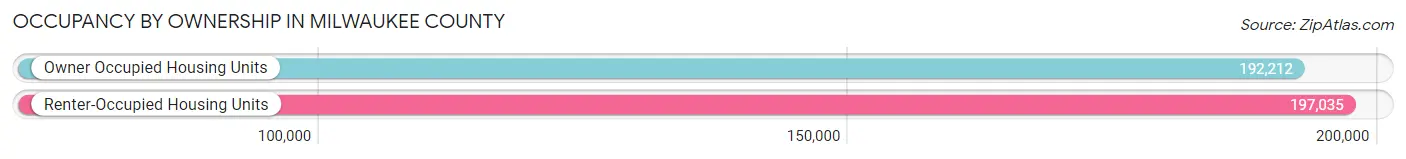
| Occupancy | # Housing Units | % Housing Units |
| Owner Occupied Housing Units | 192,212 | 49.4% |
| Renter-Occupied Housing Units | 197,035 | 50.6% |
| Total Occupied Housing Units | 389,247 | 100.0% |
Occupancy by Household Size in Milwaukee County
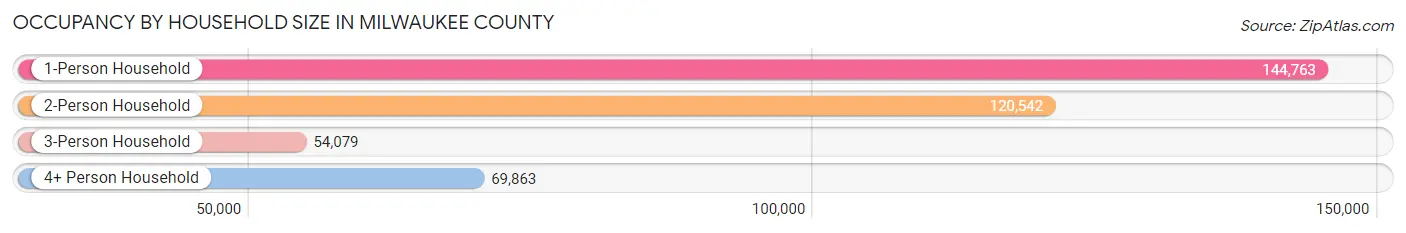
| Household Size | # Housing Units | % Housing Units |
| 1-Person Household | 144,763 | 37.2% |
| 2-Person Household | 120,542 | 31.0% |
| 3-Person Household | 54,079 | 13.9% |
| 4+ Person Household | 69,863 | 17.9% |
| Total Housing Units | 389,247 | 100.0% |
Occupancy by Ownership by Household Size in Milwaukee County
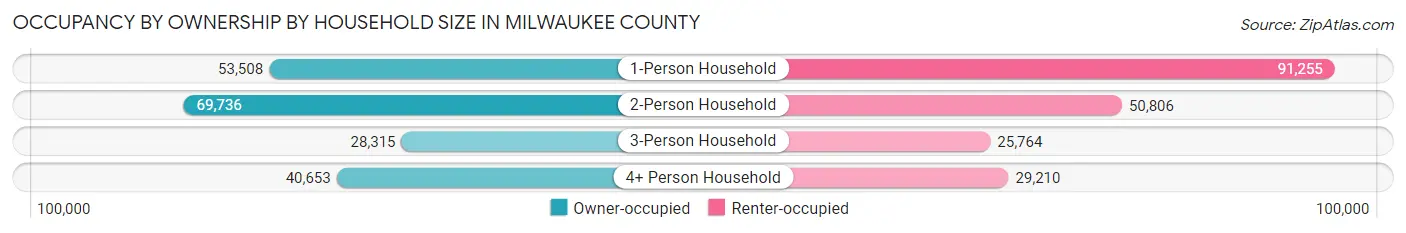
| Household Size | Owner-occupied | Renter-occupied |
| 1-Person Household | 53,508 (37.0%) | 91,255 (63.0%) |
| 2-Person Household | 69,736 (57.9%) | 50,806 (42.1%) |
| 3-Person Household | 28,315 (52.4%) | 25,764 (47.6%) |
| 4+ Person Household | 40,653 (58.2%) | 29,210 (41.8%) |
| Total Housing Units | 192,212 (49.4%) | 197,035 (50.6%) |
Occupancy by Educational Attainment in Milwaukee County
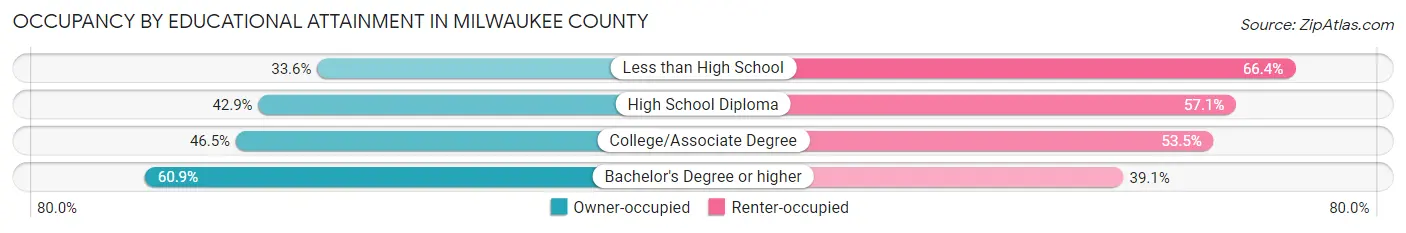
| Household Size | Owner-occupied | Renter-occupied |
| Less than High School | 12,041 (33.6%) | 23,815 (66.4%) |
| High School Diploma | 42,567 (42.9%) | 56,627 (57.1%) |
| College/Associate Degree | 55,519 (46.5%) | 63,939 (53.5%) |
| Bachelor's Degree or higher | 82,085 (60.9%) | 52,654 (39.1%) |
Occupancy by Age of Householder in Milwaukee County
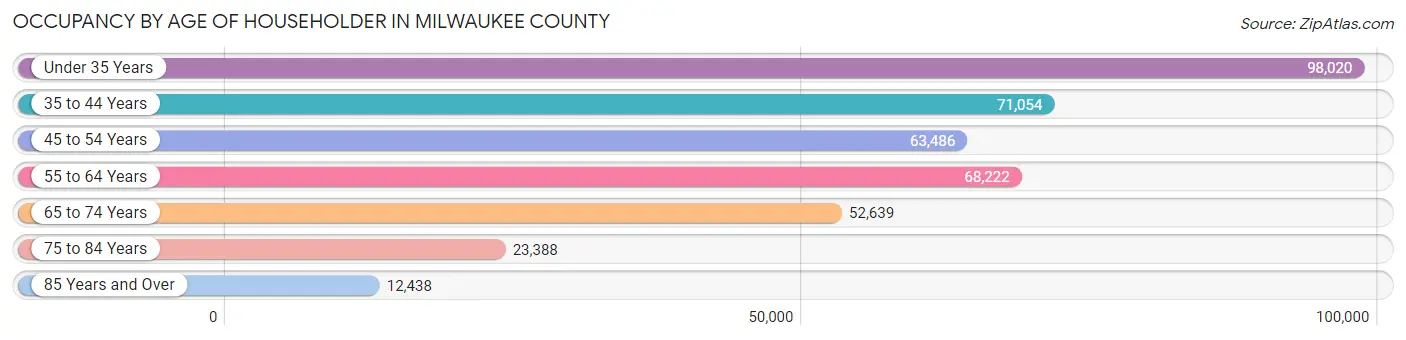
| Age Bracket | # Households | % Households |
| Under 35 Years | 98,020 | 25.2% |
| 35 to 44 Years | 71,054 | 18.2% |
| 45 to 54 Years | 63,486 | 16.3% |
| 55 to 64 Years | 68,222 | 17.5% |
| 65 to 74 Years | 52,639 | 13.5% |
| 75 to 84 Years | 23,388 | 6.0% |
| 85 Years and Over | 12,438 | 3.2% |
| Total | 389,247 | 100.0% |
Housing Finances in Milwaukee County
Median Income by Occupancy in Milwaukee County
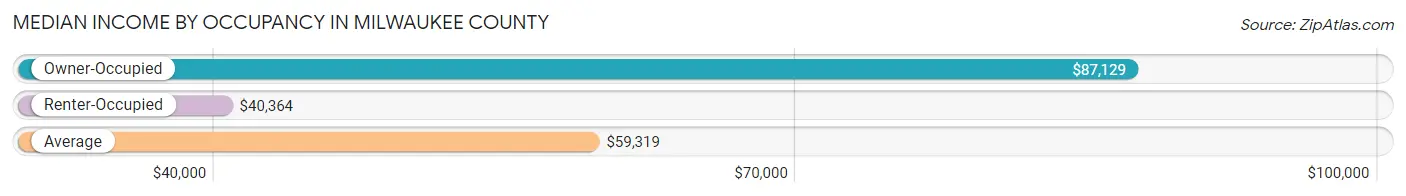
| Occupancy Type | # Households | Median Income |
| Owner-Occupied | 192,212 (49.4%) | $87,129 |
| Renter-Occupied | 197,035 (50.6%) | $40,364 |
| Average | 389,247 (100.0%) | $59,319 |
Occupancy by Householder Income Bracket in Milwaukee County
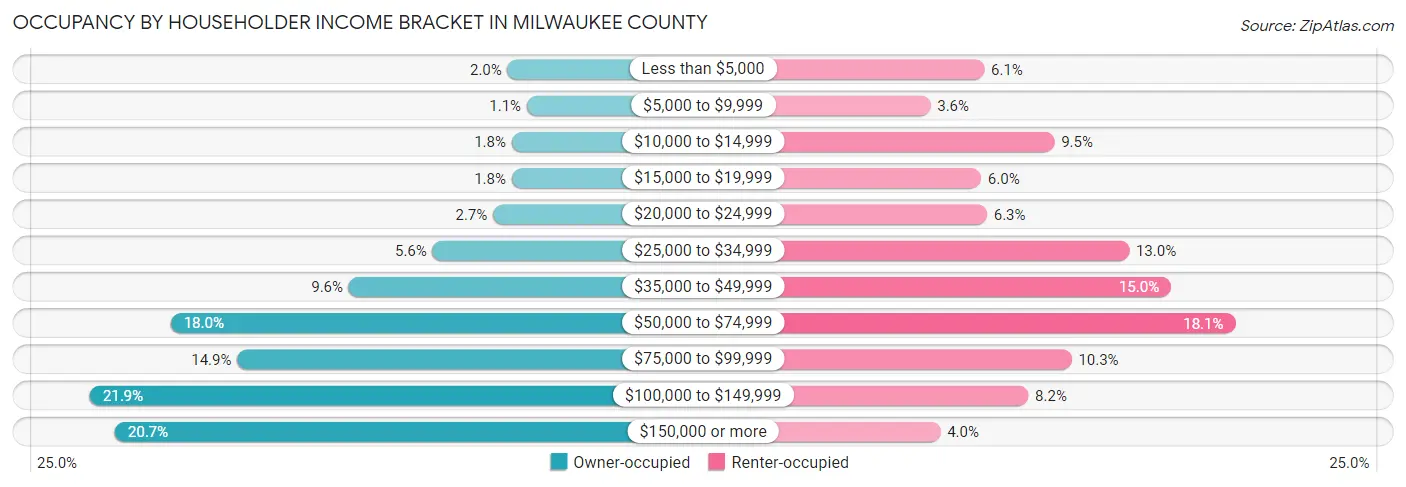
| Income Bracket | Owner-occupied | Renter-occupied |
| Less than $5,000 | 3,845 (2.0%) | 12,056 (6.1%) |
| $5,000 to $9,999 | 2,073 (1.1%) | 7,005 (3.6%) |
| $10,000 to $14,999 | 3,461 (1.8%) | 18,641 (9.5%) |
| $15,000 to $19,999 | 3,451 (1.8%) | 11,764 (6.0%) |
| $20,000 to $24,999 | 5,174 (2.7%) | 12,306 (6.2%) |
| $25,000 to $34,999 | 10,704 (5.6%) | 25,661 (13.0%) |
| $35,000 to $49,999 | 18,377 (9.6%) | 29,592 (15.0%) |
| $50,000 to $74,999 | 34,679 (18.0%) | 35,621 (18.1%) |
| $75,000 to $99,999 | 28,584 (14.9%) | 20,254 (10.3%) |
| $100,000 to $149,999 | 42,083 (21.9%) | 16,193 (8.2%) |
| $150,000 or more | 39,781 (20.7%) | 7,942 (4.0%) |
| Total | 192,212 (100.0%) | 197,035 (100.0%) |
Monthly Housing Cost Tiers in Milwaukee County
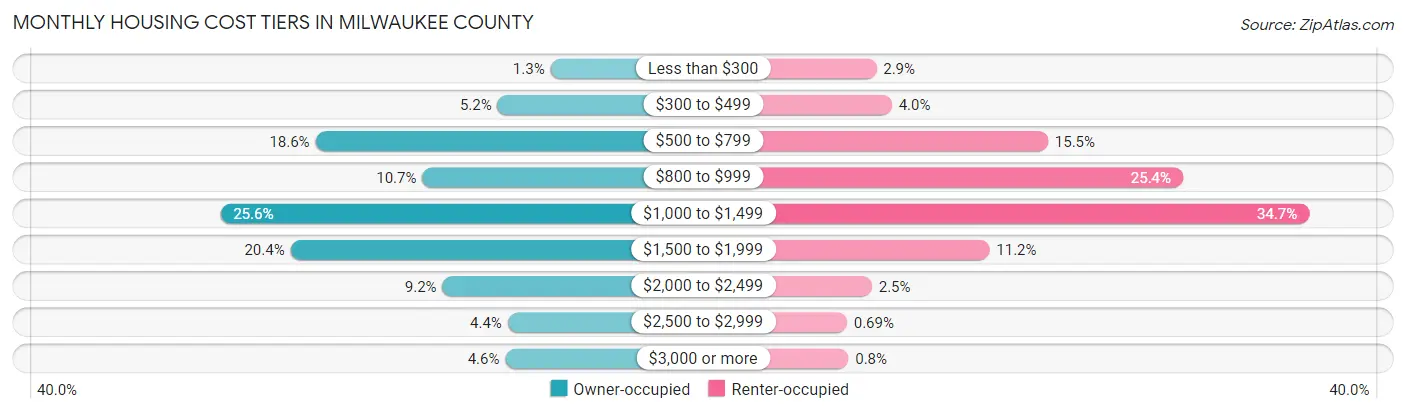
| Monthly Cost | Owner-occupied | Renter-occupied |
| Less than $300 | 2,446 (1.3%) | 5,629 (2.9%) |
| $300 to $499 | 9,933 (5.2%) | 7,877 (4.0%) |
| $500 to $799 | 35,722 (18.6%) | 30,548 (15.5%) |
| $800 to $999 | 20,591 (10.7%) | 50,121 (25.4%) |
| $1,000 to $1,499 | 49,179 (25.6%) | 68,435 (34.7%) |
| $1,500 to $1,999 | 39,247 (20.4%) | 22,042 (11.2%) |
| $2,000 to $2,499 | 17,744 (9.2%) | 4,994 (2.5%) |
| $2,500 to $2,999 | 8,500 (4.4%) | 1,368 (0.7%) |
| $3,000 or more | 8,850 (4.6%) | 1,585 (0.8%) |
| Total | 192,212 (100.0%) | 197,035 (100.0%) |
Physical Housing Characteristics in Milwaukee County
Housing Structures in Milwaukee County
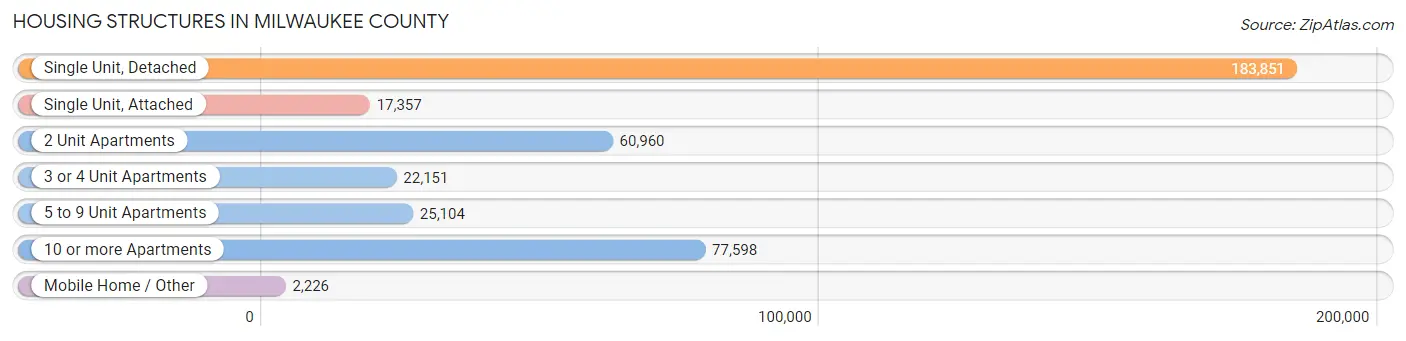
| Structure Type | # Housing Units | % Housing Units |
| Single Unit, Detached | 183,851 | 47.2% |
| Single Unit, Attached | 17,357 | 4.5% |
| 2 Unit Apartments | 60,960 | 15.7% |
| 3 or 4 Unit Apartments | 22,151 | 5.7% |
| 5 to 9 Unit Apartments | 25,104 | 6.5% |
| 10 or more Apartments | 77,598 | 19.9% |
| Mobile Home / Other | 2,226 | 0.6% |
| Total | 389,247 | 100.0% |
Housing Structures by Occupancy in Milwaukee County
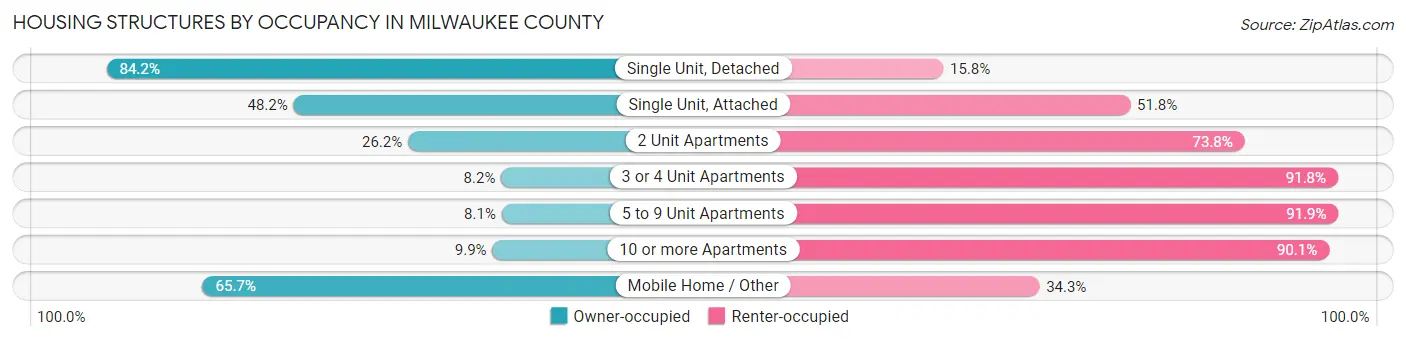
| Structure Type | Owner-occupied | Renter-occupied |
| Single Unit, Detached | 154,847 (84.2%) | 29,004 (15.8%) |
| Single Unit, Attached | 8,369 (48.2%) | 8,988 (51.8%) |
| 2 Unit Apartments | 15,961 (26.2%) | 44,999 (73.8%) |
| 3 or 4 Unit Apartments | 1,823 (8.2%) | 20,328 (91.8%) |
| 5 to 9 Unit Apartments | 2,041 (8.1%) | 23,063 (91.9%) |
| 10 or more Apartments | 7,708 (9.9%) | 69,890 (90.1%) |
| Mobile Home / Other | 1,463 (65.7%) | 763 (34.3%) |
| Total | 192,212 (49.4%) | 197,035 (50.6%) |
Housing Structures by Number of Rooms in Milwaukee County
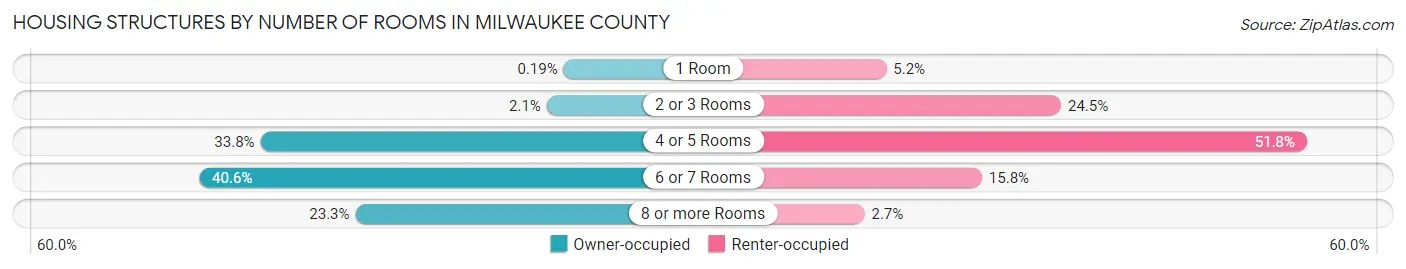
| Number of Rooms | Owner-occupied | Renter-occupied |
| 1 Room | 365 (0.2%) | 10,152 (5.1%) |
| 2 or 3 Rooms | 3,951 (2.1%) | 48,349 (24.5%) |
| 4 or 5 Rooms | 65,019 (33.8%) | 102,100 (51.8%) |
| 6 or 7 Rooms | 78,118 (40.6%) | 31,048 (15.8%) |
| 8 or more Rooms | 44,759 (23.3%) | 5,386 (2.7%) |
| Total | 192,212 (100.0%) | 197,035 (100.0%) |
Housing Structure by Heating Type in Milwaukee County
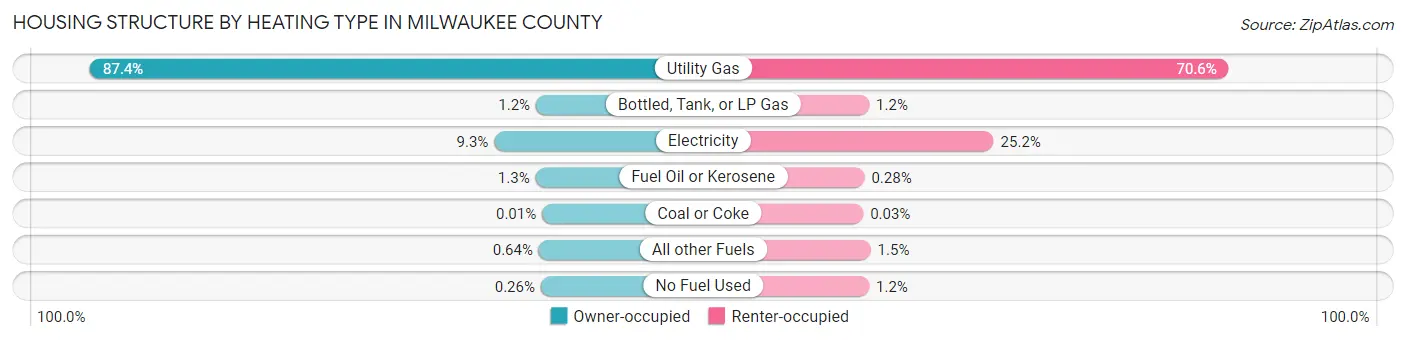
| Heating Type | Owner-occupied | Renter-occupied |
| Utility Gas | 167,936 (87.4%) | 139,161 (70.6%) |
| Bottled, Tank, or LP Gas | 2,281 (1.2%) | 2,322 (1.2%) |
| Electricity | 17,798 (9.3%) | 49,741 (25.2%) |
| Fuel Oil or Kerosene | 2,452 (1.3%) | 551 (0.3%) |
| Coal or Coke | 14 (0.0%) | 52 (0.0%) |
| All other Fuels | 1,229 (0.6%) | 2,898 (1.5%) |
| No Fuel Used | 502 (0.3%) | 2,310 (1.2%) |
| Total | 192,212 (100.0%) | 197,035 (100.0%) |
Household Vehicle Usage in Milwaukee County
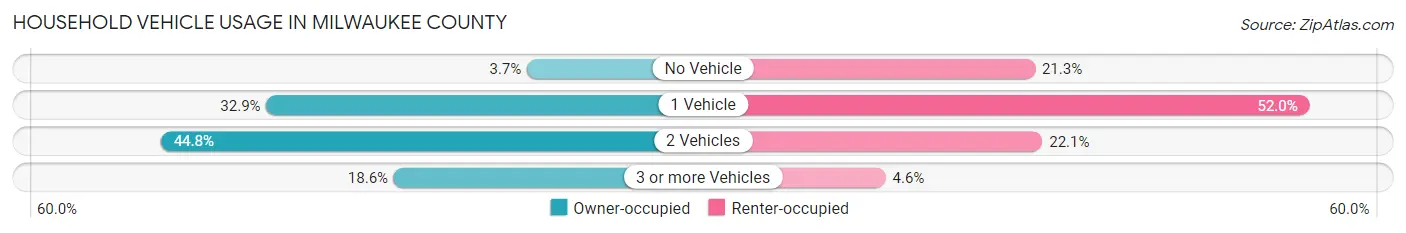
| Vehicles per Household | Owner-occupied | Renter-occupied |
| No Vehicle | 7,139 (3.7%) | 41,945 (21.3%) |
| 1 Vehicle | 63,255 (32.9%) | 102,544 (52.0%) |
| 2 Vehicles | 86,007 (44.8%) | 43,570 (22.1%) |
| 3 or more Vehicles | 35,811 (18.6%) | 8,976 (4.6%) |
| Total | 192,212 (100.0%) | 197,035 (100.0%) |
Real Estate & Mortgages in Milwaukee County
Real Estate and Mortgage Overview in Milwaukee County
| Characteristic | Without Mortgage | With Mortgage |
| Housing Units | 67,119 | 125,093 |
| Median Property Value | $189,000 | $206,500 |
| Median Household Income | $66,791 | $29,753 |
| Monthly Housing Costs | $696 | $8,447 |
| Real Estate Taxes | $4,114 | $1,112 |
Property Value by Mortgage Status in Milwaukee County
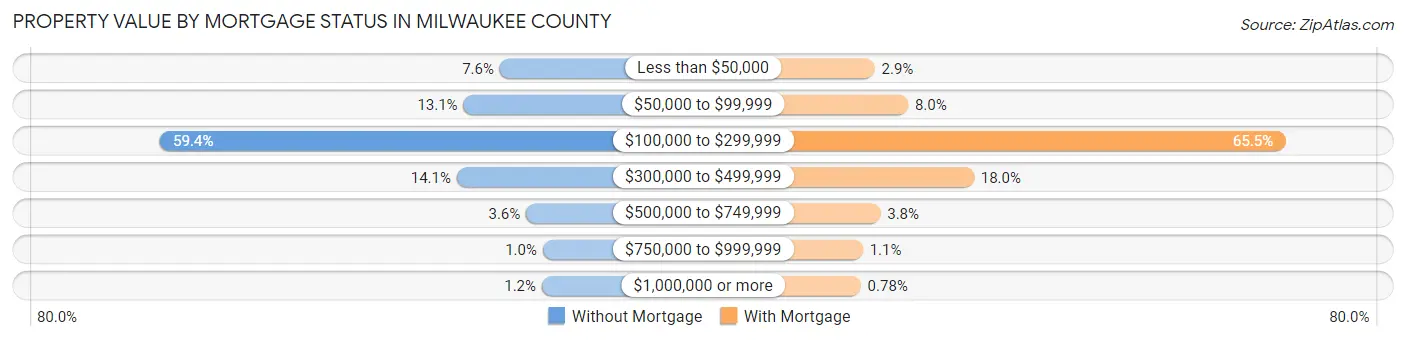
| Property Value | Without Mortgage | With Mortgage |
| Less than $50,000 | 5,094 (7.6%) | 3,631 (2.9%) |
| $50,000 to $99,999 | 8,810 (13.1%) | 9,998 (8.0%) |
| $100,000 to $299,999 | 39,837 (59.4%) | 81,868 (65.4%) |
| $300,000 to $499,999 | 9,490 (14.1%) | 22,539 (18.0%) |
| $500,000 to $749,999 | 2,401 (3.6%) | 4,720 (3.8%) |
| $750,000 to $999,999 | 695 (1.0%) | 1,360 (1.1%) |
| $1,000,000 or more | 792 (1.2%) | 977 (0.8%) |
| Total | 67,119 (100.0%) | 125,093 (100.0%) |
Household Income by Mortgage Status in Milwaukee County
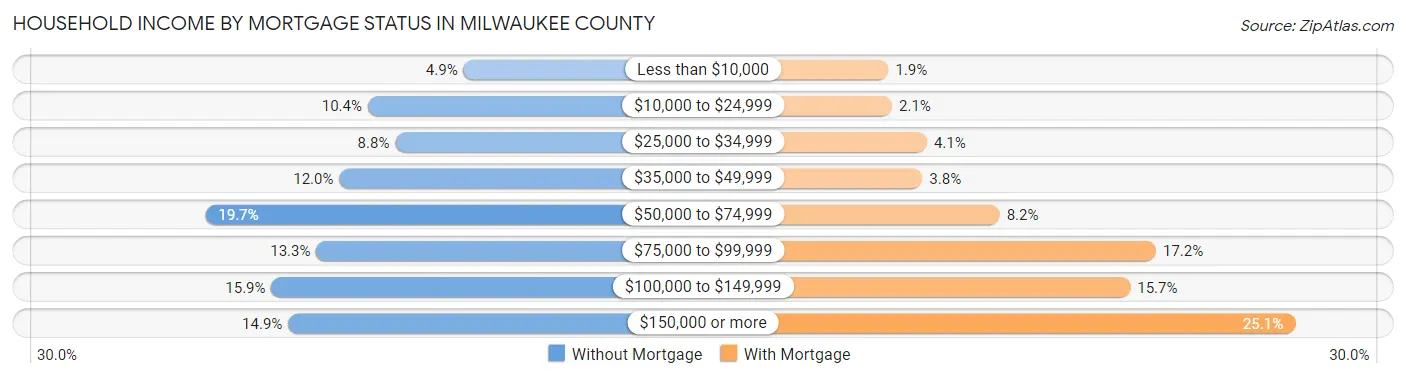
| Household Income | Without Mortgage | With Mortgage |
| Less than $10,000 | 3,299 (4.9%) | 2,352 (1.9%) |
| $10,000 to $24,999 | 6,976 (10.4%) | 2,619 (2.1%) |
| $25,000 to $34,999 | 5,922 (8.8%) | 5,110 (4.1%) |
| $35,000 to $49,999 | 8,066 (12.0%) | 4,782 (3.8%) |
| $50,000 to $74,999 | 13,204 (19.7%) | 10,311 (8.2%) |
| $75,000 to $99,999 | 8,950 (13.3%) | 21,475 (17.2%) |
| $100,000 to $149,999 | 10,674 (15.9%) | 19,634 (15.7%) |
| $150,000 or more | 10,028 (14.9%) | 31,409 (25.1%) |
| Total | 67,119 (100.0%) | 125,093 (100.0%) |
Property Value to Household Income Ratio in Milwaukee County
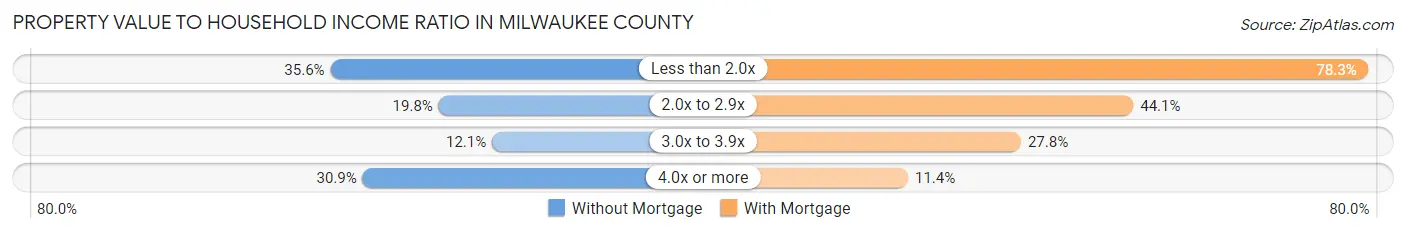
| Value-to-Income Ratio | Without Mortgage | With Mortgage |
| Less than 2.0x | 23,874 (35.6%) | 97,911 (78.3%) |
| 2.0x to 2.9x | 13,317 (19.8%) | 55,140 (44.1%) |
| 3.0x to 3.9x | 8,116 (12.1%) | 34,722 (27.8%) |
| 4.0x or more | 20,740 (30.9%) | 14,201 (11.4%) |
| Total | 67,119 (100.0%) | 125,093 (100.0%) |
Real Estate Taxes by Mortgage Status in Milwaukee County

| Property Taxes | Without Mortgage | With Mortgage |
| Less than $800 | 2,767 (4.1%) | 768 (0.6%) |
| $800 to $1,499 | 4,842 (7.2%) | 2,012 (1.6%) |
| $800 to $1,499 | 58,122 (86.6%) | 4,542 (3.6%) |
| Total | 67,119 (100.0%) | 125,093 (100.0%) |
Health & Disability in Milwaukee County
Health Insurance Coverage by Age in Milwaukee County
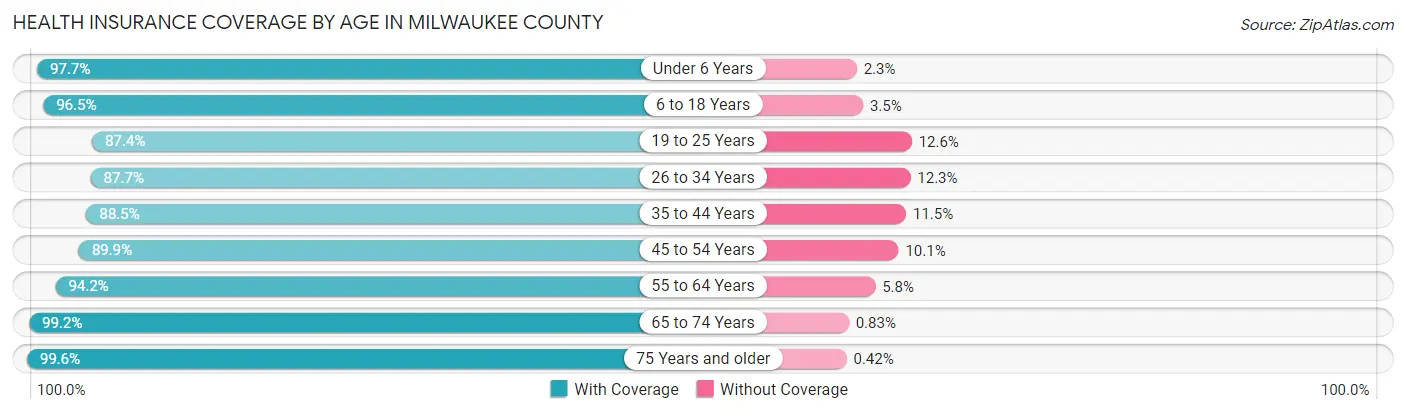
| Age Bracket | With Coverage | Without Coverage |
| Under 6 Years | 71,517 (97.7%) | 1,696 (2.3%) |
| 6 to 18 Years | 156,335 (96.5%) | 5,635 (3.5%) |
| 19 to 25 Years | 79,467 (87.4%) | 11,430 (12.6%) |
| 26 to 34 Years | 117,718 (87.7%) | 16,540 (12.3%) |
| 35 to 44 Years | 107,777 (88.5%) | 14,018 (11.5%) |
| 45 to 54 Years | 94,693 (89.9%) | 10,635 (10.1%) |
| 55 to 64 Years | 103,387 (94.2%) | 6,322 (5.8%) |
| 65 to 74 Years | 77,277 (99.2%) | 645 (0.8%) |
| 75 Years and older | 50,007 (99.6%) | 211 (0.4%) |
| Total | 858,178 (92.7%) | 67,132 (7.3%) |
Health Insurance Coverage by Citizenship Status in Milwaukee County
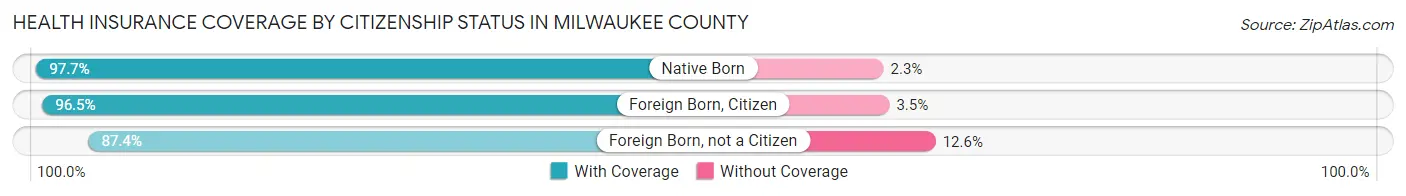
| Citizenship Status | With Coverage | Without Coverage |
| Native Born | 71,517 (97.7%) | 1,696 (2.3%) |
| Foreign Born, Citizen | 156,335 (96.5%) | 5,635 (3.5%) |
| Foreign Born, not a Citizen | 79,467 (87.4%) | 11,430 (12.6%) |
Health Insurance Coverage by Household Income in Milwaukee County
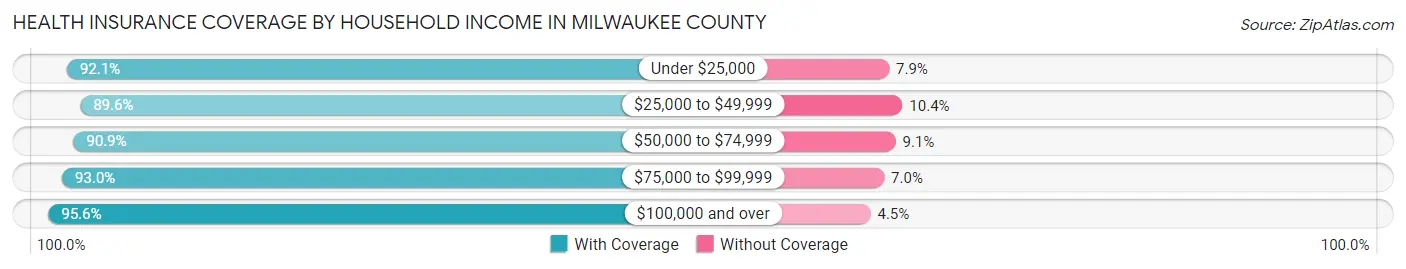
| Household Income | With Coverage | Without Coverage |
| Under $25,000 | 128,453 (92.1%) | 11,066 (7.9%) |
| $25,000 to $49,999 | 159,998 (89.6%) | 18,603 (10.4%) |
| $50,000 to $74,999 | 141,136 (90.9%) | 14,200 (9.1%) |
| $75,000 to $99,999 | 117,694 (93.0%) | 8,858 (7.0%) |
| $100,000 and over | 297,743 (95.6%) | 13,882 (4.4%) |
Public vs Private Health Insurance Coverage by Age in Milwaukee County
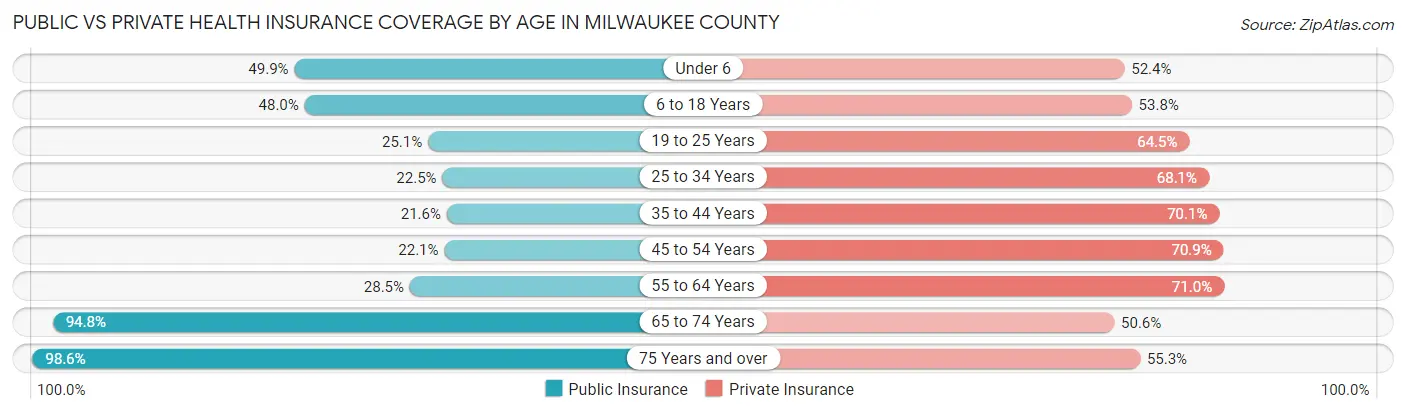
| Age Bracket | Public Insurance | Private Insurance |
| Under 6 | 36,545 (49.9%) | 38,382 (52.4%) |
| 6 to 18 Years | 77,791 (48.0%) | 87,140 (53.8%) |
| 19 to 25 Years | 22,826 (25.1%) | 58,629 (64.5%) |
| 25 to 34 Years | 30,146 (22.5%) | 91,471 (68.1%) |
| 35 to 44 Years | 26,355 (21.6%) | 85,314 (70.1%) |
| 45 to 54 Years | 23,262 (22.1%) | 74,630 (70.9%) |
| 55 to 64 Years | 31,261 (28.5%) | 77,835 (71.0%) |
| 65 to 74 Years | 73,858 (94.8%) | 39,392 (50.5%) |
| 75 Years and over | 49,488 (98.6%) | 27,792 (55.3%) |
| Total | 371,532 (40.2%) | 580,585 (62.7%) |
Disability Status by Sex by Age in Milwaukee County
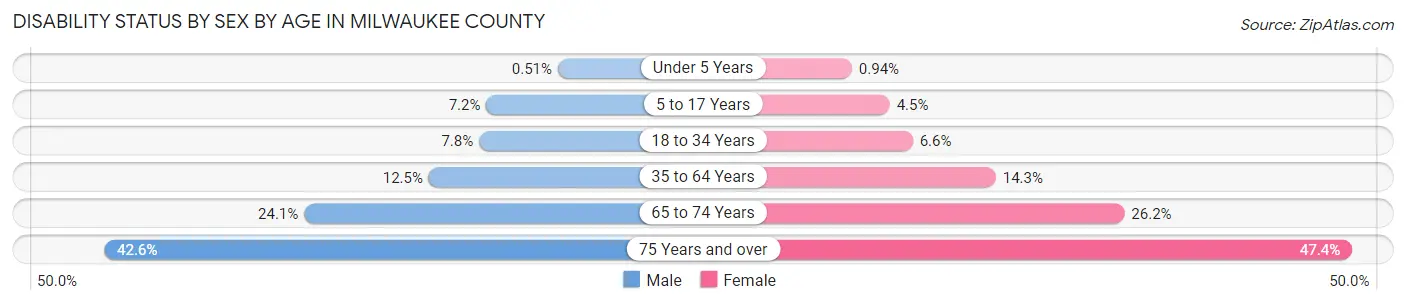
| Age Bracket | Male | Female |
| Under 5 Years | 160 (0.5%) | 284 (0.9%) |
| 5 to 17 Years | 5,839 (7.1%) | 3,486 (4.4%) |
| 18 to 34 Years | 9,163 (7.8%) | 7,988 (6.6%) |
| 35 to 64 Years | 20,464 (12.5%) | 24,731 (14.3%) |
| 65 to 74 Years | 8,761 (24.1%) | 10,888 (26.2%) |
| 75 Years and over | 8,324 (42.6%) | 14,531 (47.3%) |
Disability Class by Sex by Age in Milwaukee County
Disability Class: Hearing Difficulty
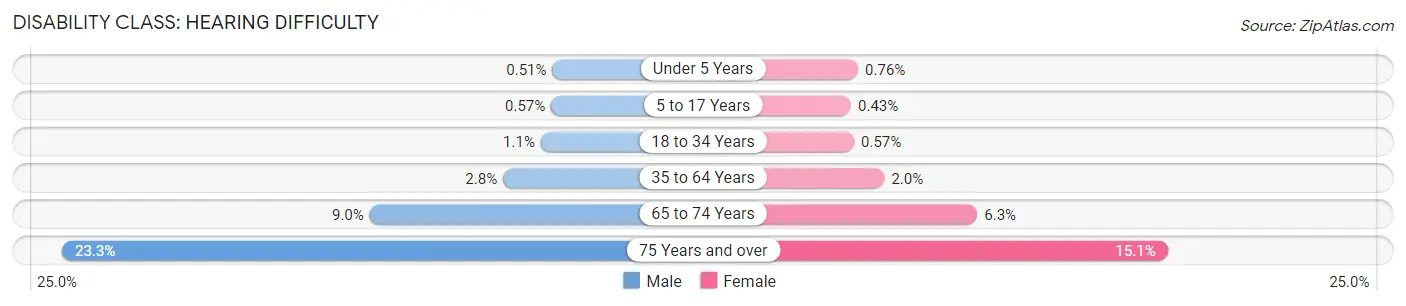
| Age Bracket | Male | Female |
| Under 5 Years | 160 (0.5%) | 231 (0.8%) |
| 5 to 17 Years | 466 (0.6%) | 336 (0.4%) |
| 18 to 34 Years | 1,233 (1.1%) | 696 (0.6%) |
| 35 to 64 Years | 4,588 (2.8%) | 3,420 (2.0%) |
| 65 to 74 Years | 3,273 (9.0%) | 2,609 (6.3%) |
| 75 Years and over | 4,543 (23.3%) | 4,640 (15.1%) |
Disability Class: Vision Difficulty
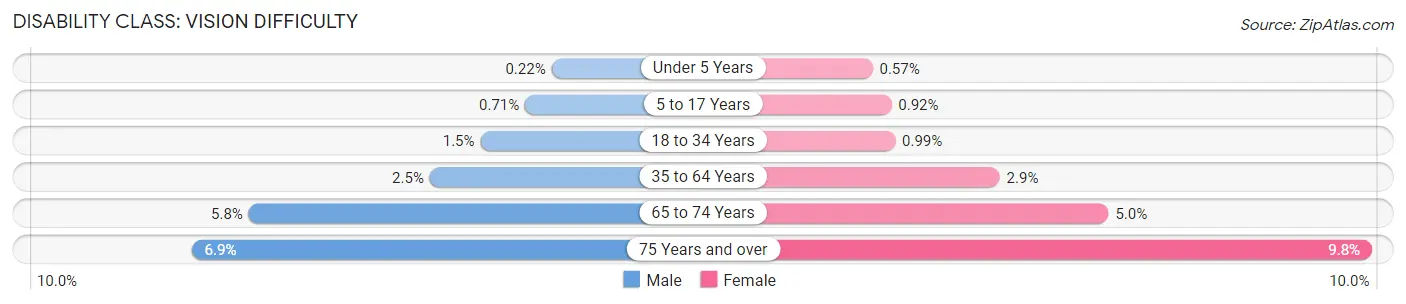
| Age Bracket | Male | Female |
| Under 5 Years | 69 (0.2%) | 172 (0.6%) |
| 5 to 17 Years | 577 (0.7%) | 724 (0.9%) |
| 18 to 34 Years | 1,800 (1.5%) | 1,201 (1.0%) |
| 35 to 64 Years | 4,057 (2.5%) | 5,073 (2.9%) |
| 65 to 74 Years | 2,128 (5.8%) | 2,055 (5.0%) |
| 75 Years and over | 1,347 (6.9%) | 3,021 (9.8%) |
Disability Class: Cognitive Difficulty
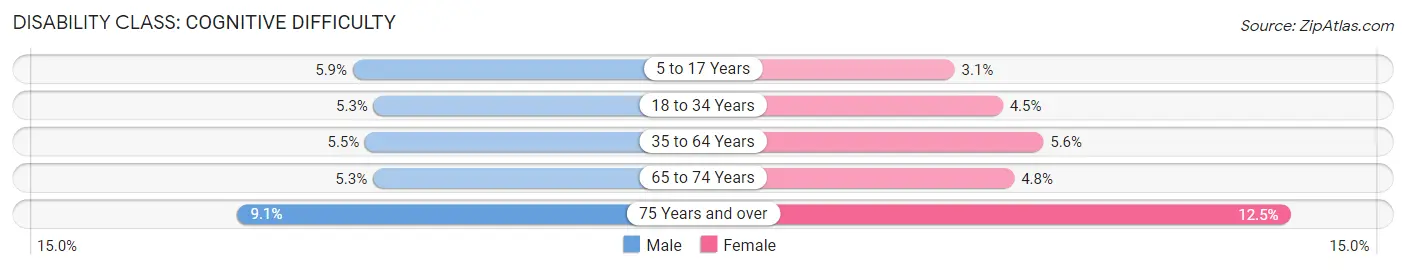
| Age Bracket | Male | Female |
| 5 to 17 Years | 4,789 (5.9%) | 2,462 (3.1%) |
| 18 to 34 Years | 6,192 (5.3%) | 5,433 (4.5%) |
| 35 to 64 Years | 9,049 (5.5%) | 9,706 (5.6%) |
| 65 to 74 Years | 1,929 (5.3%) | 1,993 (4.8%) |
| 75 Years and over | 1,771 (9.1%) | 3,834 (12.5%) |
Disability Class: Ambulatory Difficulty
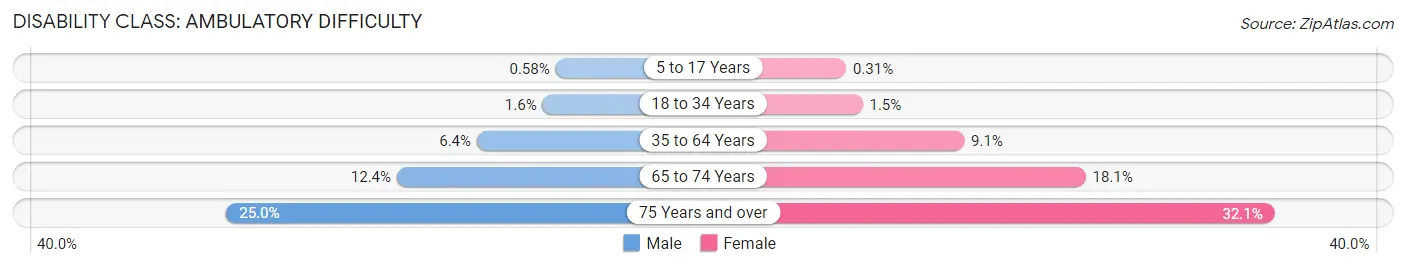
| Age Bracket | Male | Female |
| 5 to 17 Years | 475 (0.6%) | 241 (0.3%) |
| 18 to 34 Years | 1,817 (1.5%) | 1,870 (1.5%) |
| 35 to 64 Years | 10,512 (6.4%) | 15,707 (9.1%) |
| 65 to 74 Years | 4,502 (12.4%) | 7,513 (18.1%) |
| 75 Years and over | 4,887 (25.0%) | 9,858 (32.1%) |
Disability Class: Self-Care Difficulty
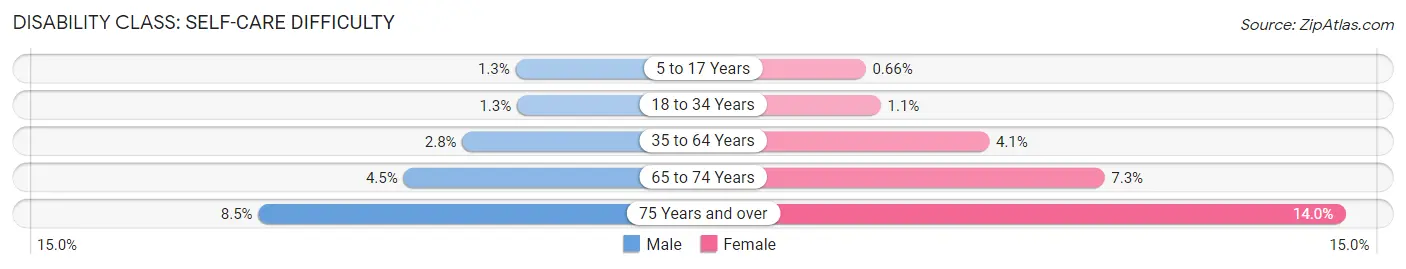
| Age Bracket | Male | Female |
| 5 to 17 Years | 1,086 (1.3%) | 516 (0.7%) |
| 18 to 34 Years | 1,514 (1.3%) | 1,313 (1.1%) |
| 35 to 64 Years | 4,600 (2.8%) | 7,087 (4.1%) |
| 65 to 74 Years | 1,621 (4.4%) | 3,036 (7.3%) |
| 75 Years and over | 1,658 (8.5%) | 4,298 (14.0%) |
Technology Access in Milwaukee County
Computing Device Access in Milwaukee County
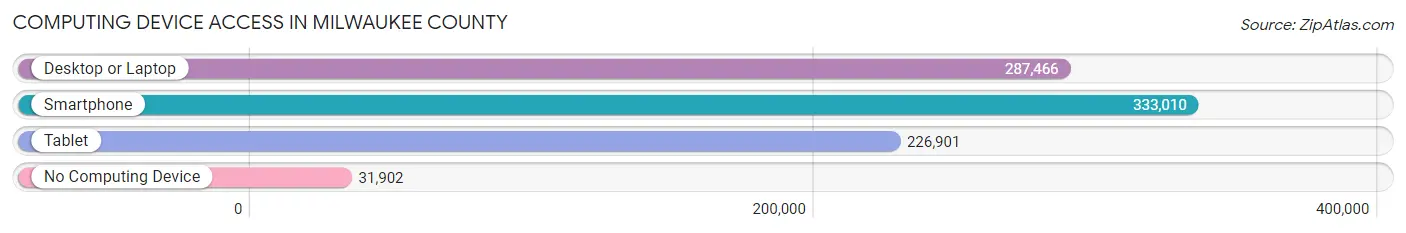
| Device Type | # Households | % Households |
| Desktop or Laptop | 287,466 | 73.9% |
| Smartphone | 333,010 | 85.6% |
| Tablet | 226,901 | 58.3% |
| No Computing Device | 31,902 | 8.2% |
| Total | 389,247 | 100.0% |
Internet Access in Milwaukee County
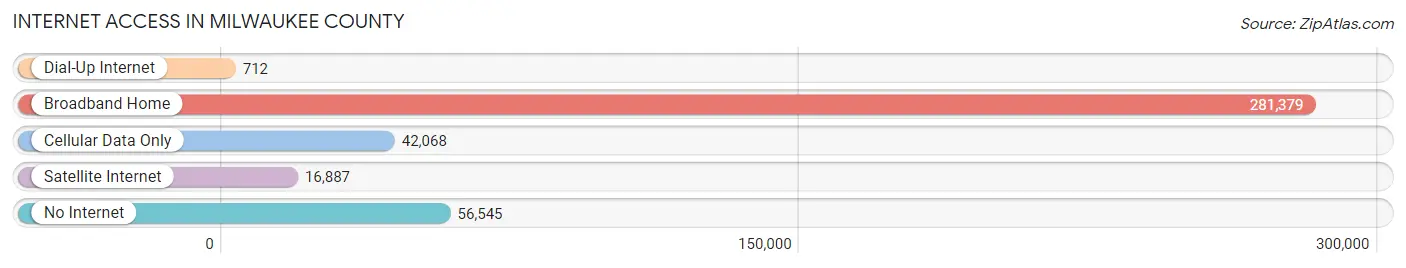
| Internet Type | # Households | % Households |
| Dial-Up Internet | 712 | 0.2% |
| Broadband Home | 281,379 | 72.3% |
| Cellular Data Only | 42,068 | 10.8% |
| Satellite Internet | 16,887 | 4.3% |
| No Internet | 56,545 | 14.5% |
| Total | 389,247 | 100.0% |
Milwaukee County Summary
Milwaukee County is located in the southeastern corner of Wisconsin, and is the most populous county in the state. It is bordered by Waukesha County to the west, Washington County to the north, Ozaukee County to the northeast, and Racine and Kenosha Counties to the south. The county seat is Milwaukee, the largest city in the state.
History
Milwaukee County was established in 1834, when Wisconsin was still a part of Michigan Territory. The county was named after the Milwaukee River, which was named by the Potawatomi people who lived in the area. The first settlers in the area were French fur traders, who established trading posts along the river. The first permanent settlers were German immigrants, who arrived in the 1840s.
The city of Milwaukee was founded in 1846, and quickly became an important port city and industrial center. The city was the site of the first railroad in Wisconsin, and the first public library in the state. Milwaukee was also the site of the first brewery in the state, and the first public school.
In the late 19th century, Milwaukee was a major center of German immigration, and the city became known as the “German Athens.” The city was also a major center of the labor movement, and was the site of the first Labor Day parade in the United States.
Geography
Milwaukee County covers an area of 1,190 square miles, making it the largest county in Wisconsin. The county is located in the southeastern corner of the state, and is bordered by Waukesha County to the west, Washington County to the north, Ozaukee County to the northeast, and Racine and Kenosha Counties to the south.
The county is divided into two distinct regions. The northern part of the county is part of the Central Plain, while the southern part is part of the Eastern Ridges and Lowlands. The Central Plain is characterized by rolling hills and flat plains, while the Eastern Ridges and Lowlands are characterized by steep hills and deep valleys.
The Milwaukee River runs through the county, and is the main source of water for the county. The river is fed by several smaller rivers, including the Menomonee, Kinnickinnic, and Fox Rivers. The county also contains several lakes, including Lake Michigan, which forms the eastern border of the county.
Economy
Milwaukee County is home to a diverse economy, with a mix of manufacturing, service, and technology industries. The county is home to several major corporations, including Harley-Davidson, MillerCoors, and Johnson Controls. The county is also home to several major universities, including the University of Wisconsin-Milwaukee, Marquette University, and Milwaukee School of Engineering.
The county is also home to several major tourist attractions, including the Milwaukee Art Museum, the Milwaukee County Zoo, and the Milwaukee Public Museum. The county is also home to several professional sports teams, including the Milwaukee Brewers, the Milwaukee Bucks, and the Milwaukee Admirals.
Demographics
As of the 2010 census, Milwaukee County had a population of 947,735. The population is racially and ethnically diverse, with the largest racial group being White (63.2%), followed by African American (25.2%), Hispanic or Latino (7.7%), and Asian (2.7%). The county is also home to a large immigrant population, with over 20% of the population being foreign-born.
The median household income in the county is $45,945, and the median home value is $153,400. The unemployment rate in the county is 5.2%, which is slightly lower than the national average. The poverty rate in the county is 17.2%, which is higher than the national average.
Common Questions
What is the Total Population of Milwaukee County?
Total Population of Milwaukee County is 933,063.
What is the Total Male Population of Milwaukee County?
Total Male Population of Milwaukee County is 454,480.
What is the Total Female Population of Milwaukee County?
Total Female Population of Milwaukee County is 478,583.
What is the Ratio of Males per 100 Females in Milwaukee County?
There are 94.96 Males per 100 Females in Milwaukee County.
What is the Ratio of Females per 100 Males in Milwaukee County?
There are 105.30 Females per 100 Males in Milwaukee County.
What is the Median Population Age in Milwaukee County?
Median Population Age in Milwaukee County is 35.3 Years.
What is the Average Family Size in Milwaukee County
Average Family Size in Milwaukee County is 3.2 People.
What is the Average Household Size in Milwaukee County
Average Household Size in Milwaukee County is 2.3 People.
What is Per Capita Income in Milwaukee County?
Per Capita income in Milwaukee County is $35,039.
What is the Median Family Income in Milwaukee County?
Median Family Income in Milwaukee County is $77,644.
What is the Median Household income in Milwaukee County?
Median Household Income in Milwaukee County is $59,319.
What is Income or Wage Gap in Milwaukee County?
Income or Wage Gap in Milwaukee County is 22.3%.
Women in Milwaukee County earn 77.7 cents for every dollar earned by a man.
What is Family Income Deficit in Milwaukee County?
Family Income Deficit in Milwaukee County is $10,982.
Families that are below poverty line in Milwaukee County earn $10,982 less on average than the poverty threshold level.
What is Inequality or Gini Index in Milwaukee County?
Inequality or Gini Index in Milwaukee County is 0.47.
How Large is the Labor Force in Milwaukee County?
There are 475,412 People in the Labor Forcein in Milwaukee County.
What is the Percentage of People in the Labor Force in Milwaukee County?
64.7% of People are in the Labor Force in Milwaukee County.
What is the Unemployment Rate in Milwaukee County?
Unemployment Rate in Milwaukee County is 4.7%.