Menominee County, WI
Menominee County Overview
4,279
TOTAL POPULATION
2,185
MALE POPULATION
2,094
FEMALE POPULATION
104.35
MALES / 100 FEMALES
95.84
FEMALES / 100 MALES
32.1
MEDIAN AGE
3.6
AVG FAMILY SIZE
3.2
AVG HOUSEHOLD SIZE
$24,004
PER CAPITA INCOME
$65,938
AVG FAMILY INCOME
$62,194
AVG HOUSEHOLD INCOME
1.9%
WAGE / INCOME GAP [ % ]
98.1¢/ $1
WAGE / INCOME GAP [ $ ]
$17,312
FAMILY INCOME DEFICIT
0.43
INEQUALITY / GINI INDEX
1,570
LABOR FORCE [ PEOPLE ]
51.2%
PERCENT IN LABOR FORCE
10.7%
UNEMPLOYMENT RATE
Menominee County Area Codes
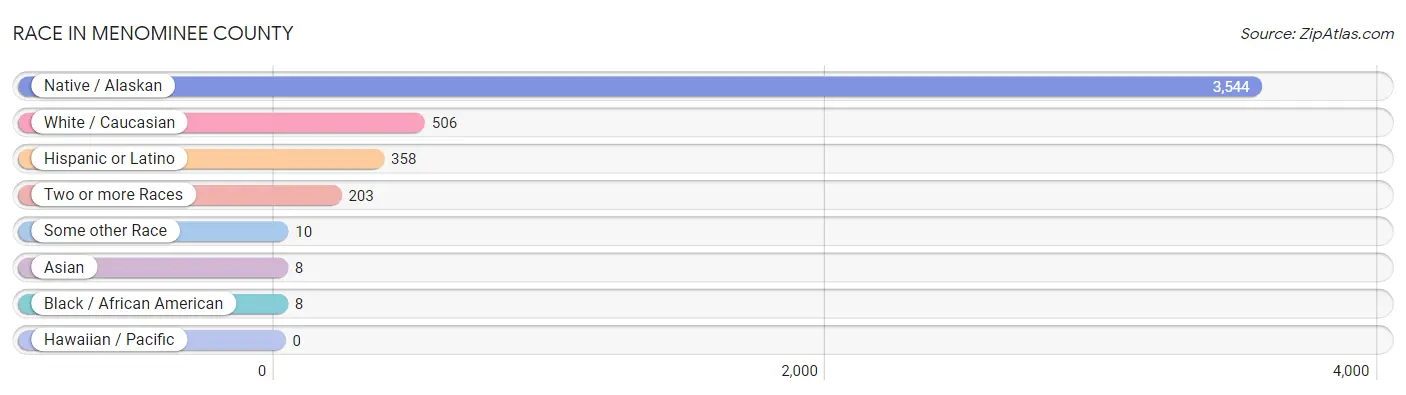
Race in Menominee County
The most populous races in Menominee County are Native / Alaskan (3,544 | 82.8%), White / Caucasian (506 | 11.8%), and Hispanic or Latino (358 | 8.4%).
| Race | # Population | % Population |
| Asian | 8 | 0.2% |
| Black / African American | 8 | 0.2% |
| Hawaiian / Pacific | 0 | 0.0% |
| Hispanic or Latino | 358 | 8.4% |
| Native / Alaskan | 3,544 | 82.8% |
| White / Caucasian | 506 | 11.8% |
| Two or more Races | 203 | 4.7% |
| Some other Race | 10 | 0.2% |
| Total | 4,279 | 100.0% |
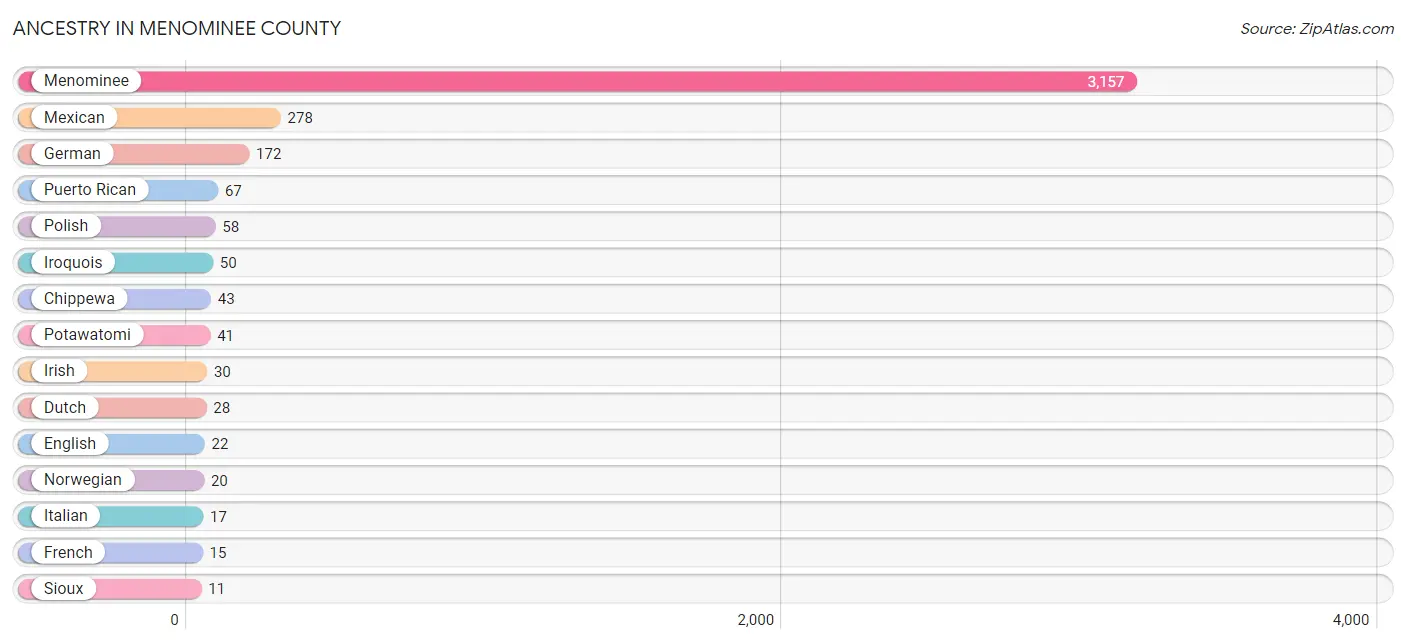
Ancestry in Menominee County
The most populous ancestries reported in Menominee County are Menominee (3,157 | 73.8%), Mexican (278 | 6.5%), German (172 | 4.0%), Puerto Rican (67 | 1.6%), and Polish (58 | 1.4%), together accounting for 87.2% of all Menominee County residents.
| Ancestry | # Population | % Population |
| American | 7 | 0.2% |
| Arab | 4 | 0.1% |
| Arapaho | 9 | 0.2% |
| Austrian | 8 | 0.2% |
| Belgian | 7 | 0.2% |
| Cherokee | 5 | 0.1% |
| Chippewa | 43 | 1.0% |
| Cuban | 2 | 0.1% |
| Czech | 8 | 0.2% |
| Czechoslovakian | 3 | 0.1% |
| Dutch | 28 | 0.6% |
| English | 22 | 0.5% |
| European | 3 | 0.1% |
| French | 15 | 0.4% |
| French Canadian | 2 | 0.1% |
| German | 172 | 4.0% |
| Irish | 30 | 0.7% |
| Iroquois | 50 | 1.2% |
| Italian | 17 | 0.4% |
| Korean | 8 | 0.2% |
| Lebanese | 4 | 0.1% |
| Menominee | 3,157 | 73.8% |
| Mexican | 278 | 6.5% |
| Norwegian | 20 | 0.5% |
| Polish | 58 | 1.4% |
| Potawatomi | 41 | 1.0% |
| Puerto Rican | 67 | 1.6% |
| Scandinavian | 8 | 0.2% |
| Scottish | 4 | 0.1% |
| Shoshone | 4 | 0.1% |
| Sioux | 11 | 0.3% |
| Swedish | 7 | 0.2% | View All 32 Rows |
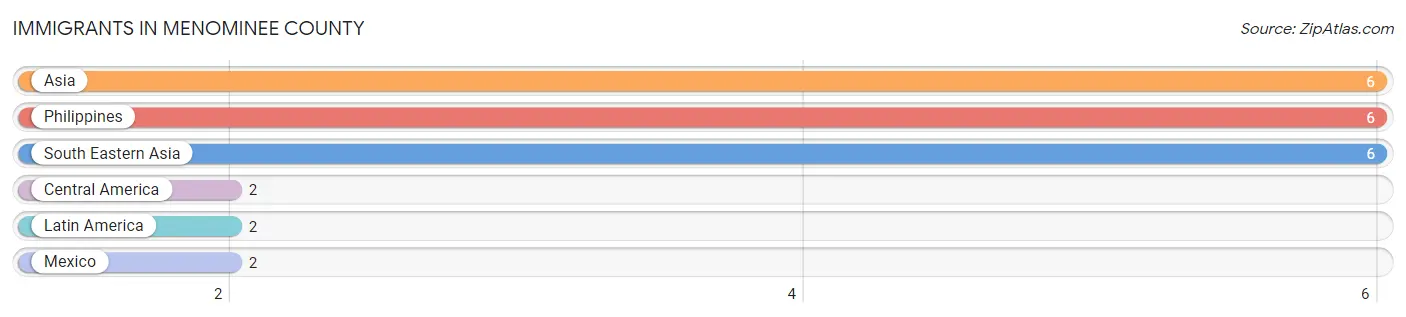
Immigrants in Menominee County
The most numerous immigrant groups reported in Menominee County came from Asia (6 | 0.1%), Philippines (6 | 0.1%), South Eastern Asia (6 | 0.1%), Central America (2 | 0.1%), and Latin America (2 | 0.1%), together accounting for 0.5% of all Menominee County residents.
| Immigration Origin | # Population | % Population |
| Asia | 6 | 0.1% |
| Central America | 2 | 0.1% |
| Latin America | 2 | 0.1% |
| Mexico | 2 | 0.1% |
| Philippines | 6 | 0.1% |
| South Eastern Asia | 6 | 0.1% | View All 6 Rows |
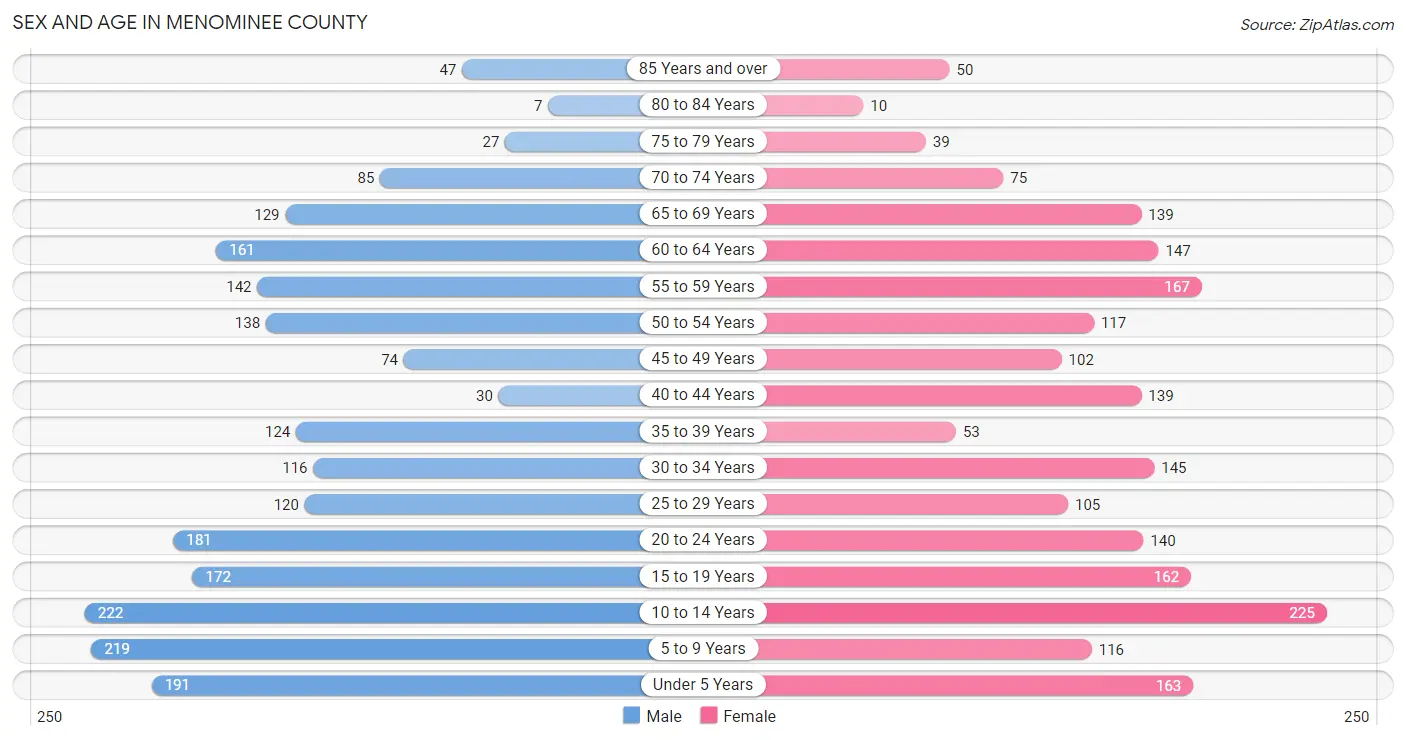
Sex and Age in Menominee County
Sex and Age in Menominee County
The most populous age groups in Menominee County are 10 to 14 Years (222 | 10.2%) for men and 10 to 14 Years (225 | 10.7%) for women.
| Age Bracket | Male | Female |
| Under 5 Years | 191 (8.7%) | 163 (7.8%) |
| 5 to 9 Years | 219 (10.0%) | 116 (5.5%) |
| 10 to 14 Years | 222 (10.2%) | 225 (10.7%) |
| 15 to 19 Years | 172 (7.9%) | 162 (7.7%) |
| 20 to 24 Years | 181 (8.3%) | 140 (6.7%) |
| 25 to 29 Years | 120 (5.5%) | 105 (5.0%) |
| 30 to 34 Years | 116 (5.3%) | 145 (6.9%) |
| 35 to 39 Years | 124 (5.7%) | 53 (2.5%) |
| 40 to 44 Years | 30 (1.4%) | 139 (6.6%) |
| 45 to 49 Years | 74 (3.4%) | 102 (4.9%) |
| 50 to 54 Years | 138 (6.3%) | 117 (5.6%) |
| 55 to 59 Years | 142 (6.5%) | 167 (8.0%) |
| 60 to 64 Years | 161 (7.4%) | 147 (7.0%) |
| 65 to 69 Years | 129 (5.9%) | 139 (6.6%) |
| 70 to 74 Years | 85 (3.9%) | 75 (3.6%) |
| 75 to 79 Years | 27 (1.2%) | 39 (1.9%) |
| 80 to 84 Years | 7 (0.3%) | 10 (0.5%) |
| 85 Years and over | 47 (2.1%) | 50 (2.4%) |
| Total | 2,185 (100.0%) | 2,094 (100.0%) |
Families and Households in Menominee County
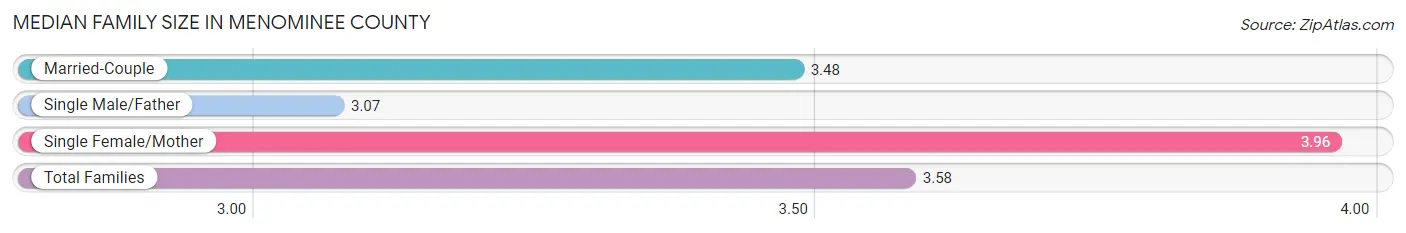
Median Family Size in Menominee County
The median family size in Menominee County is 3.58 persons per family, with single female/mother families (365 | 34.1%) accounting for the largest median family size of 3.96 persons per family. On the other hand, single male/father families (150 | 14.0%) represent the smallest median family size with 3.07 persons per family.
| Family Type | # Families | Family Size |
| Married-Couple | 555 (51.9%) | 3.48 |
| Single Male/Father | 150 (14.0%) | 3.07 |
| Single Female/Mother | 365 (34.1%) | 3.96 |
| Total Families | 1,070 (100.0%) | 3.58 |
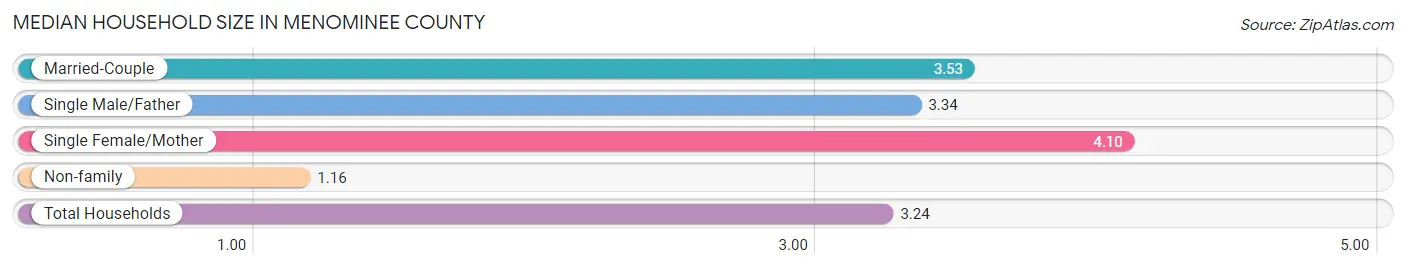
Median Household Size in Menominee County
The median household size in Menominee County is 3.24 persons per household, with single female/mother households (365 | 27.9%) accounting for the largest median household size of 4.1 persons per household. non-family households (237 | 18.1%) represent the smallest median household size with 1.16 persons per household.
| Household Type | # Households | Household Size |
| Married-Couple | 555 (42.5%) | 3.53 |
| Single Male/Father | 150 (11.5%) | 3.34 |
| Single Female/Mother | 365 (27.9%) | 4.10 |
| Non-family | 237 (18.1%) | 1.16 |
| Total Households | 1,307 (100.0%) | 3.24 |
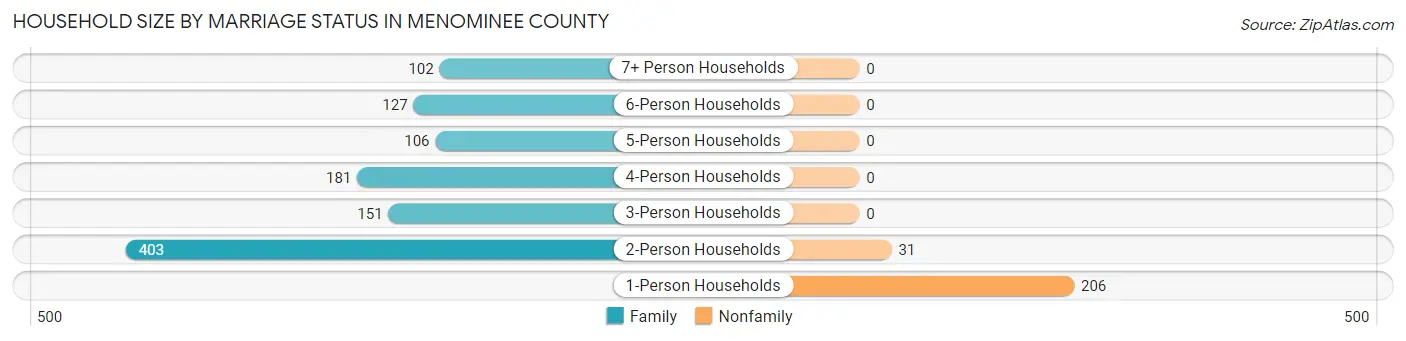
Household Size by Marriage Status in Menominee County
Out of a total of 1,307 households in Menominee County, 1,070 (81.9%) are family households, while 237 (18.1%) are nonfamily households. The most numerous type of family households are 2-person households, comprising 403, and the most common type of nonfamily households are 1-person households, comprising 206.
| Household Size | Family Households | Nonfamily Households |
| 1-Person Households | - | 206 (15.8%) |
| 2-Person Households | 403 (30.8%) | 31 (2.4%) |
| 3-Person Households | 151 (11.6%) | 0 (0.0%) |
| 4-Person Households | 181 (13.9%) | 0 (0.0%) |
| 5-Person Households | 106 (8.1%) | 0 (0.0%) |
| 6-Person Households | 127 (9.7%) | 0 (0.0%) |
| 7+ Person Households | 102 (7.8%) | 0 (0.0%) |
| Total | 1,070 (81.9%) | 237 (18.1%) |
Female Fertility in Menominee County
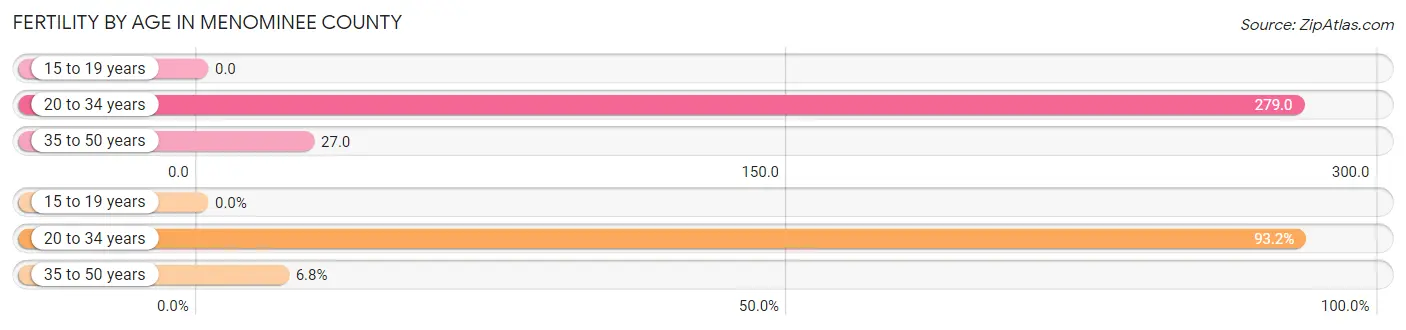
Fertility by Age in Menominee County
Average fertility rate in Menominee County is 137.0 births per 1,000 women. Women in the age bracket of 20 to 34 years have the highest fertility rate with 279.0 births per 1,000 women. Women in the age bracket of 20 to 34 years acount for 93.2% of all women with births.
| Age Bracket | Women with Births | Births / 1,000 Women |
| 15 to 19 years | 0 (0.0%) | 0.0 |
| 20 to 34 years | 109 (93.2%) | 279.0 |
| 35 to 50 years | 8 (6.8%) | 27.0 |
| Total | 117 (100.0%) | 137.0 |
Fertility by Age by Marriage Status in Menominee County
9.4% of women with births (117) in Menominee County are married. The highest percentage of unmarried women with births falls into 35 to 50 years age bracket with 100.0% of them unmarried at the time of birth, while the lowest percentage of unmarried women with births belong to 20 to 34 years age bracket with 89.9% of them unmarried.

| Age Bracket | Married | Unmarried |
| 15 to 19 years | 0 (0.0%) | 0 (0.0%) |
| 20 to 34 years | 11 (10.1%) | 98 (89.9%) |
| 35 to 50 years | 0 (0.0%) | 8 (100.0%) |
| Total | 11 (9.4%) | 106 (90.6%) |
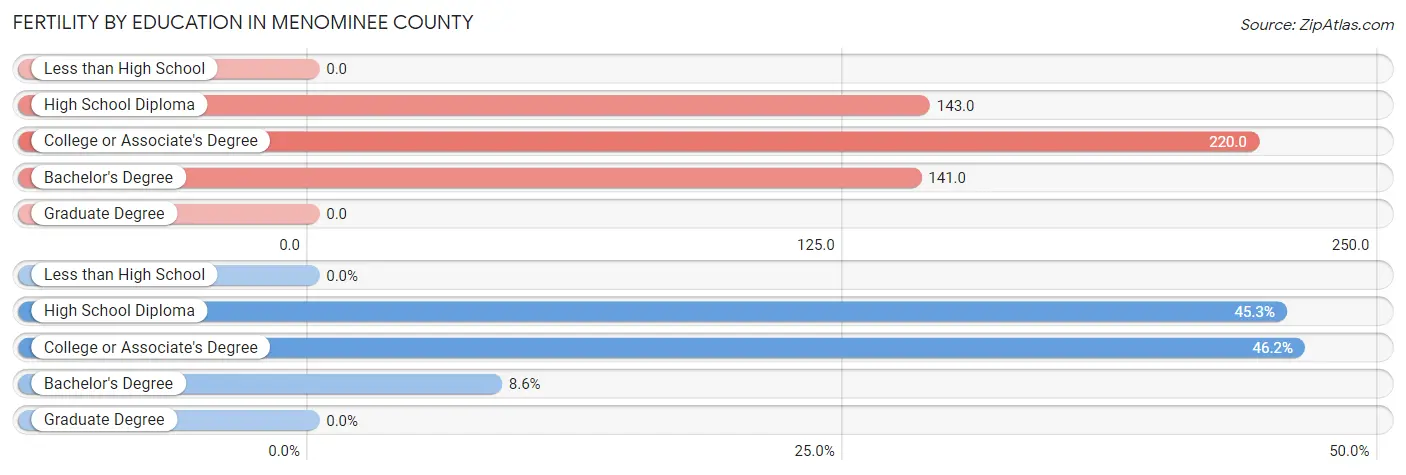
Fertility by Education in Menominee County
| Educational Attainment | Women with Births | Births / 1,000 Women |
| Less than High School | 0 (0.0%) | 0.0 |
| High School Diploma | 53 (45.3%) | 143.0 |
| College or Associate's Degree | 54 (46.2%) | 220.0 |
| Bachelor's Degree | 10 (8.6%) | 141.0 |
| Graduate Degree | 0 (0.0%) | 0.0 |
| Total | 117 (100.0%) | 137.0 |
Fertility by Education by Marriage Status in Menominee County
90.6% of women with births in Menominee County are unmarried. Women with the educational attainment of high school diploma are most likely to be married with 20.7% of them married at childbirth, while women with the educational attainment of college or associate's degree are least likely to be married with 100.0% of them unmarried at childbirth.
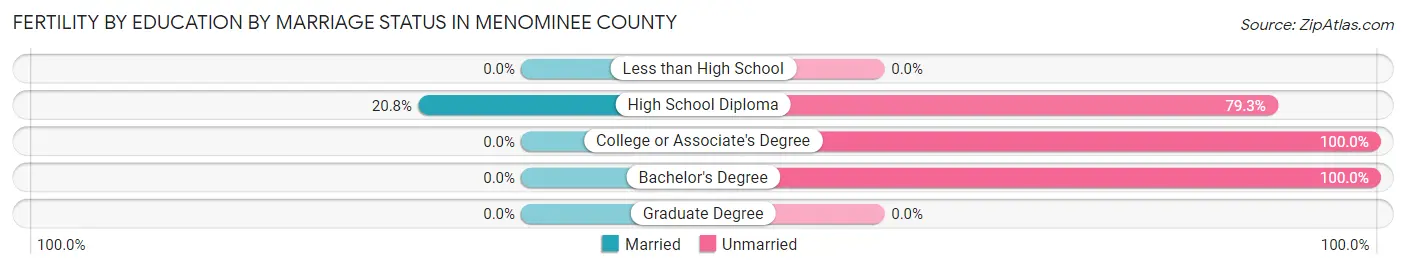
| Educational Attainment | Married | Unmarried |
| Less than High School | 0 (0.0%) | 0 (0.0%) |
| High School Diploma | 11 (20.7%) | 42 (79.2%) |
| College or Associate's Degree | 0 (0.0%) | 54 (100.0%) |
| Bachelor's Degree | 0 (0.0%) | 10 (100.0%) |
| Graduate Degree | 0 (0.0%) | 0 (0.0%) |
| Total | 11 (9.4%) | 106 (90.6%) |
Income in Menominee County
Income Overview in Menominee County
Per Capita Income in Menominee County is $24,004, while median incomes of families and households are $65,938 and $62,194 respectively.
| Characteristic | Number | Measure |
| Per Capita Income | 4,279 | $24,004 |
| Median Family Income | 1,070 | $65,938 |
| Mean Family Income | 1,070 | $86,383 |
| Median Household Income | 1,307 | $62,194 |
| Mean Household Income | 1,307 | $81,490 |
| Income Deficit | 1,070 | $17,312 |
| Wage / Income Gap (%) | 4,279 | 1.85% |
| Wage / Income Gap ($) | 4,279 | 98.15¢ per $1 |
| Gini / Inequality Index | 4,279 | 0.43 |
Earnings by Sex in Menominee County
Average Earnings in Menominee County are $30,048, $29,717 for men and $30,278 for women, a difference of 1.8%.
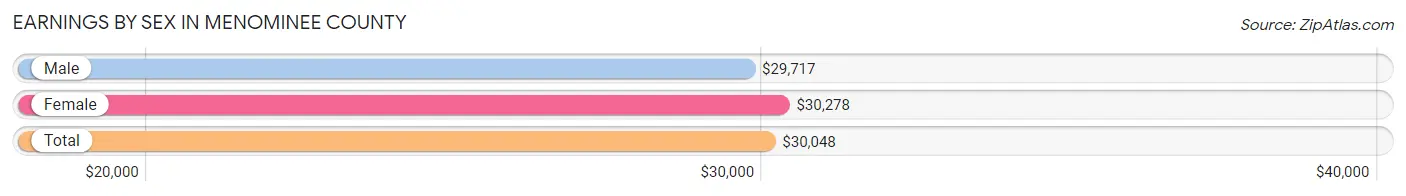
| Sex | Number | Average Earnings |
| Male | 837 (48.3%) | $29,717 |
| Female | 894 (51.6%) | $30,278 |
| Total | 1,731 (100.0%) | $30,048 |
Earnings by Sex by Income Bracket in Menominee County
The most common earnings brackets in Menominee County are $25,000 to $29,999 for men (117 | 14.0%) and $30,000 to $34,999 for women (140 | 15.7%).
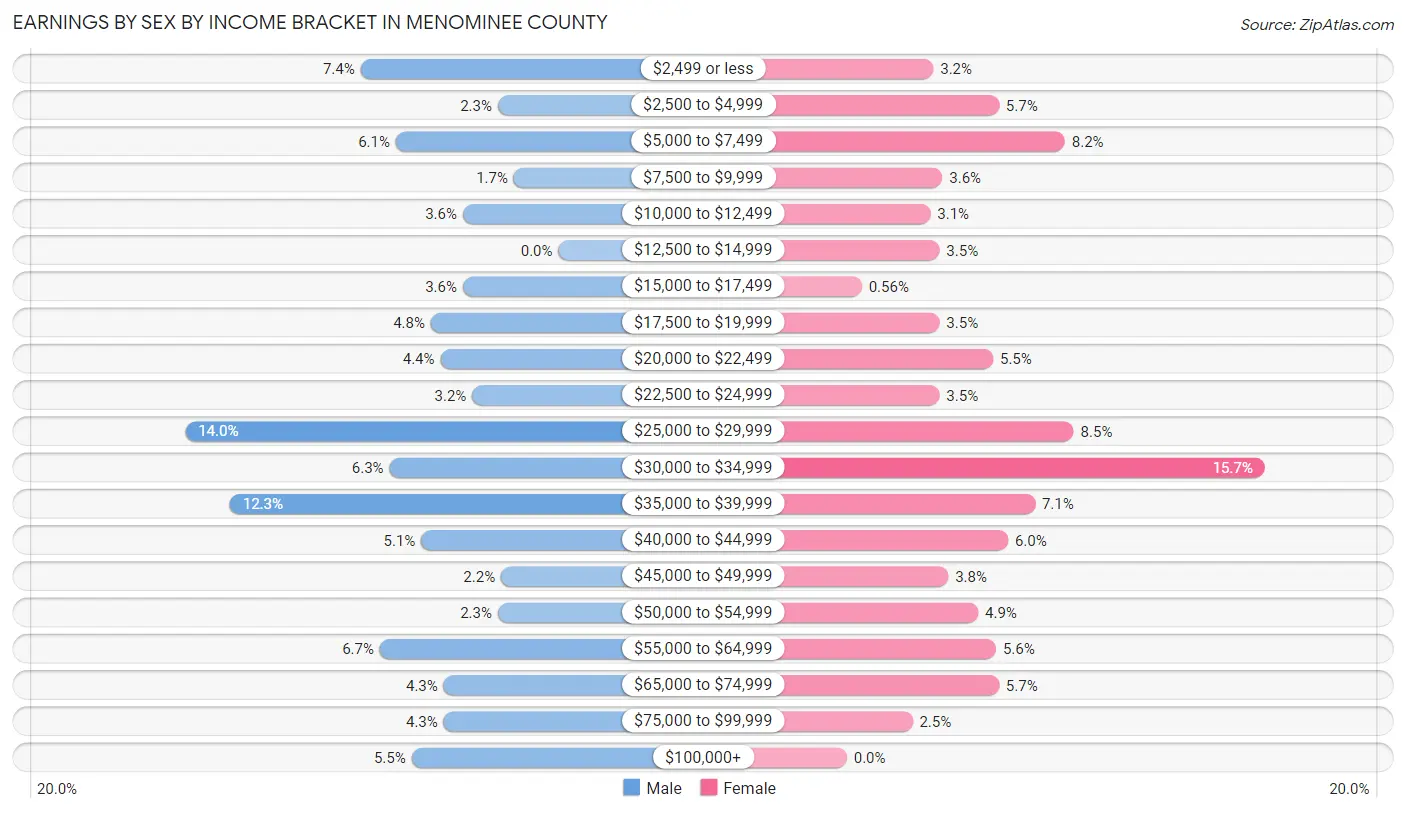
| Income | Male | Female |
| $2,499 or less | 62 (7.4%) | 29 (3.2%) |
| $2,500 to $4,999 | 19 (2.3%) | 51 (5.7%) |
| $5,000 to $7,499 | 51 (6.1%) | 73 (8.2%) |
| $7,500 to $9,999 | 14 (1.7%) | 32 (3.6%) |
| $10,000 to $12,499 | 30 (3.6%) | 28 (3.1%) |
| $12,500 to $14,999 | 0 (0.0%) | 31 (3.5%) |
| $15,000 to $17,499 | 30 (3.6%) | 5 (0.6%) |
| $17,500 to $19,999 | 40 (4.8%) | 31 (3.5%) |
| $20,000 to $22,499 | 37 (4.4%) | 49 (5.5%) |
| $22,500 to $24,999 | 27 (3.2%) | 31 (3.5%) |
| $25,000 to $29,999 | 117 (14.0%) | 76 (8.5%) |
| $30,000 to $34,999 | 53 (6.3%) | 140 (15.7%) |
| $35,000 to $39,999 | 103 (12.3%) | 63 (7.0%) |
| $40,000 to $44,999 | 43 (5.1%) | 54 (6.0%) |
| $45,000 to $49,999 | 18 (2.1%) | 34 (3.8%) |
| $50,000 to $54,999 | 19 (2.3%) | 44 (4.9%) |
| $55,000 to $64,999 | 56 (6.7%) | 50 (5.6%) |
| $65,000 to $74,999 | 36 (4.3%) | 51 (5.7%) |
| $75,000 to $99,999 | 36 (4.3%) | 22 (2.5%) |
| $100,000+ | 46 (5.5%) | 0 (0.0%) |
| Total | 837 (100.0%) | 894 (100.0%) |
Earnings by Sex by Educational Attainment in Menominee County
Average earnings in Menominee County are $33,636 for men and $31,869 for women, a difference of 5.2%. Men with an educational attainment of graduate degree enjoy the highest average annual earnings of $77,000, while those with college or associate's degree education earn the least with $28,363. Women with an educational attainment of graduate degree earn the most with the average annual earnings of $70,781, while those with high school diploma education have the smallest earnings of $26,765.
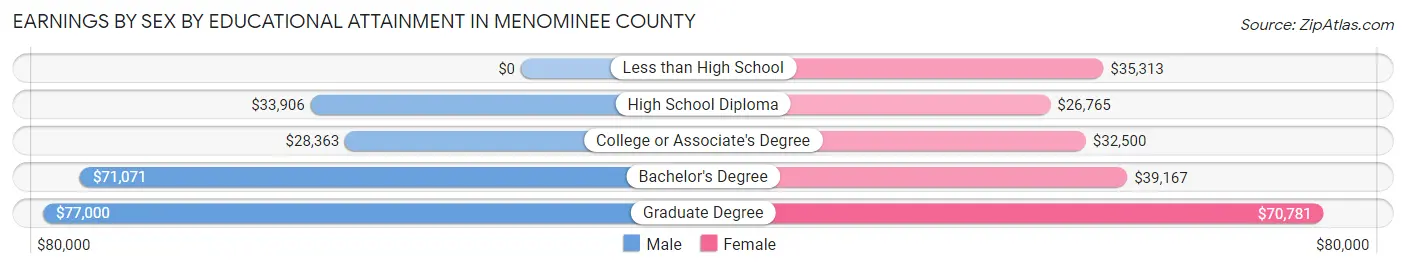
| Educational Attainment | Male Income | Female Income |
| Less than High School | - | - |
| High School Diploma | $33,906 | $26,765 |
| College or Associate's Degree | $28,363 | $32,500 |
| Bachelor's Degree | $71,071 | $39,167 |
| Graduate Degree | $77,000 | $70,781 |
| Total | $33,636 | $31,869 |
Family Income in Menominee County
Family Income Brackets in Menominee County
According to the Menominee County family income data, there are 234 families falling into the $50,000 to $74,999 income range, which is the most common income bracket and makes up 21.9% of all families. Conversely, the $10,000 to $14,999 income bracket is the least frequent group with only 39 families (3.6%) belonging to this category.
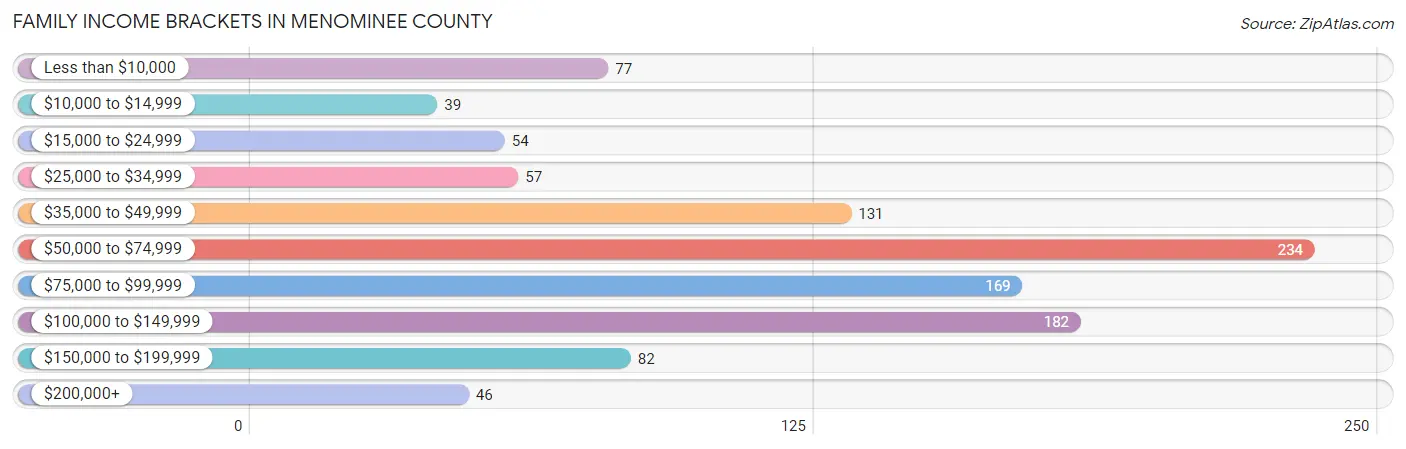
| Income Bracket | # Families | % Families |
| Less than $10,000 | 77 | 7.2% |
| $10,000 to $14,999 | 39 | 3.6% |
| $15,000 to $24,999 | 54 | 5.0% |
| $25,000 to $34,999 | 57 | 5.3% |
| $35,000 to $49,999 | 131 | 12.2% |
| $50,000 to $74,999 | 234 | 21.9% |
| $75,000 to $99,999 | 169 | 15.8% |
| $100,000 to $149,999 | 182 | 17.0% |
| $150,000 to $199,999 | 82 | 7.7% |
| $200,000+ | 46 | 4.3% |
Family Income by Famaliy Size in Menominee County
6-person families (106 | 9.9%) account for the highest median family income in Menominee County with $88,661 per family, while 2-person families (421 | 39.4%) have the highest median income of $34,062 per family member.
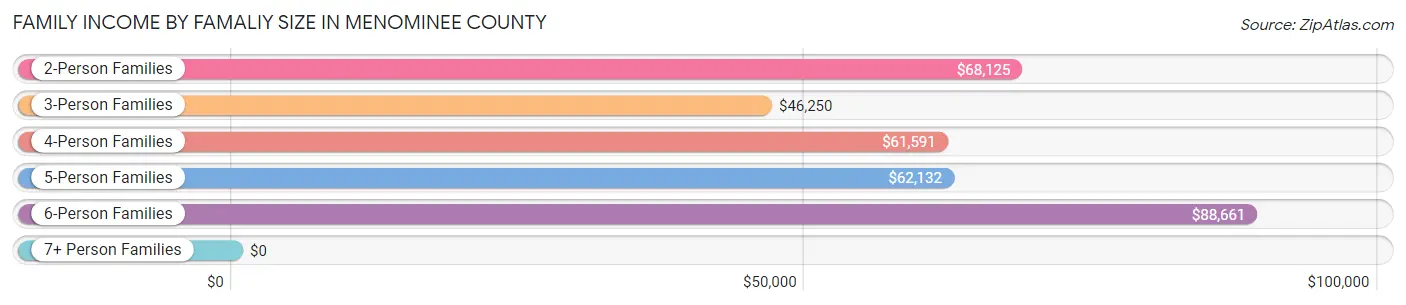
| Income Bracket | # Families | Median Income |
| 2-Person Families | 421 (39.4%) | $68,125 |
| 3-Person Families | 178 (16.6%) | $46,250 |
| 4-Person Families | 174 (16.3%) | $61,591 |
| 5-Person Families | 89 (8.3%) | $62,132 |
| 6-Person Families | 106 (9.9%) | $88,661 |
| 7+ Person Families | 102 (9.5%) | $0 |
| Total | 1,070 (100.0%) | $65,938 |
Family Income by Number of Earners in Menominee County
The median family income in Menominee County is $65,938, with families comprising 2 earners (366) having the highest median family income of $92,813, while families with no earners (174) have the lowest median family income of $33,125, accounting for 34.2% and 16.3% of families, respectively.
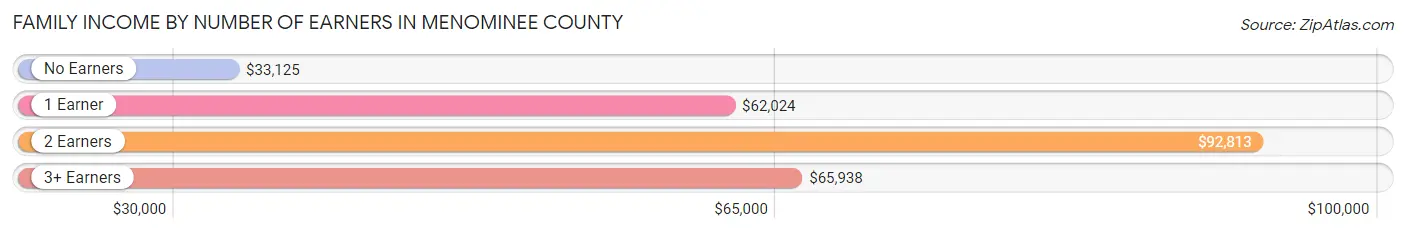
| Number of Earners | # Families | Median Income |
| No Earners | 174 (16.3%) | $33,125 |
| 1 Earner | 478 (44.7%) | $62,024 |
| 2 Earners | 366 (34.2%) | $92,813 |
| 3+ Earners | 52 (4.9%) | $65,938 |
| Total | 1,070 (100.0%) | $65,938 |
Household Income in Menominee County
Household Income Brackets in Menominee County
With 252 households falling in the category, the $50,000 to $74,999 income range is the most frequent in Menominee County, accounting for 19.3% of all households. In contrast, only 35 households (2.7%) fall into the $10,000 to $14,999 income bracket, making it the least populous group.
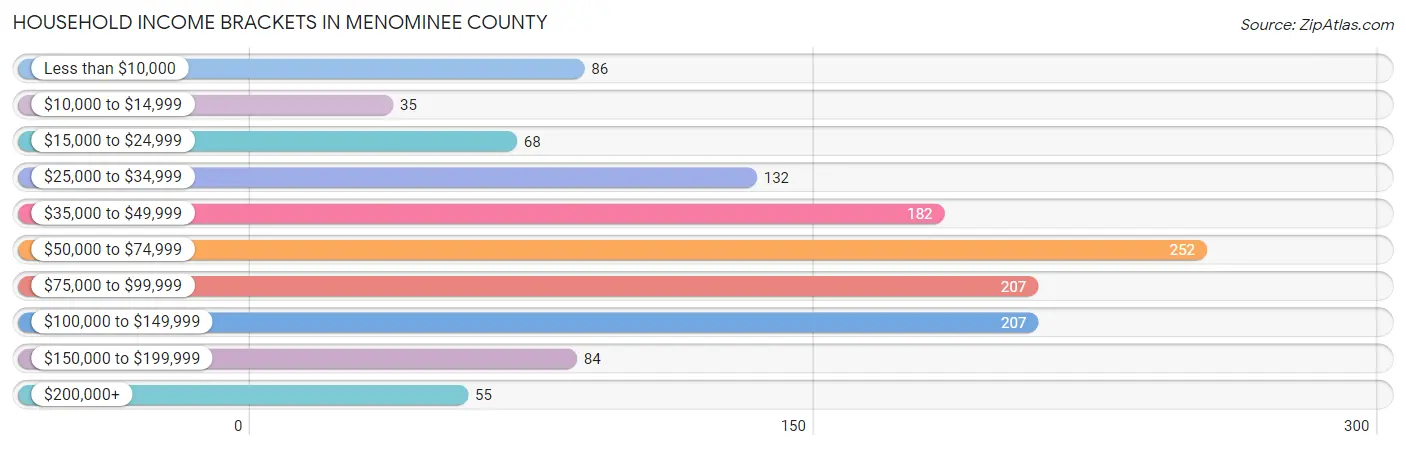
| Income Bracket | # Households | % Households |
| Less than $10,000 | 86 | 6.6% |
| $10,000 to $14,999 | 35 | 2.7% |
| $15,000 to $24,999 | 68 | 5.2% |
| $25,000 to $34,999 | 132 | 10.1% |
| $35,000 to $49,999 | 182 | 13.9% |
| $50,000 to $74,999 | 252 | 19.3% |
| $75,000 to $99,999 | 207 | 15.8% |
| $100,000 to $149,999 | 207 | 15.8% |
| $150,000 to $199,999 | 84 | 6.4% |
| $200,000+ | 55 | 4.2% |
Household Income by Householder Age in Menominee County
The median household income in Menominee County is $62,194, with the highest median household income of $73,304 found in the 45 to 64 years age bracket for the primary householder. A total of 599 households (45.8%) fall into this category. Meanwhile, the 15 to 24 years age bracket for the primary householder has the lowest median household income of $37,639, with 27 households (2.1%) in this group.
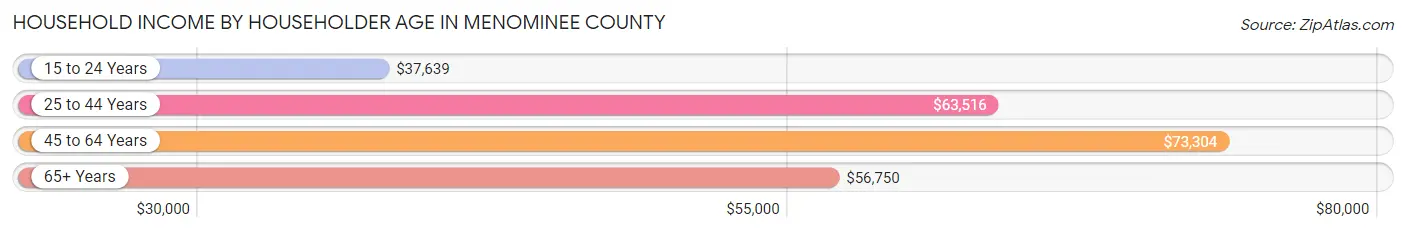
| Income Bracket | # Households | Median Income |
| 15 to 24 Years | 27 (2.1%) | $37,639 |
| 25 to 44 Years | 325 (24.9%) | $63,516 |
| 45 to 64 Years | 599 (45.8%) | $73,304 |
| 65+ Years | 356 (27.2%) | $56,750 |
| Total | 1,307 (100.0%) | $62,194 |
Poverty in Menominee County
Income Below Poverty by Sex and Age in Menominee County
With 19.7% poverty level for males and 20.3% for females among the residents of Menominee County, 5 year old males and 5 year old females are the most vulnerable to poverty, with 43 males (75.4%) and 14 females (58.3%) in their respective age groups living below the poverty level.
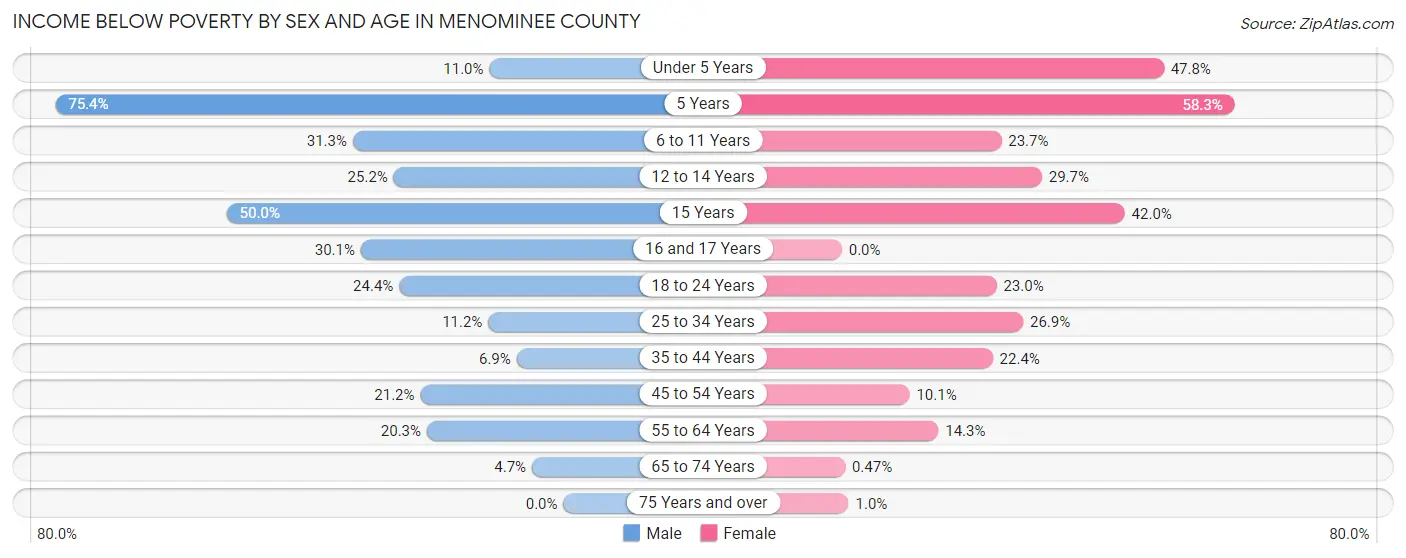
| Age Bracket | Male | Female |
| Under 5 Years | 21 (11.0%) | 76 (47.8%) |
| 5 Years | 43 (75.4%) | 14 (58.3%) |
| 6 to 11 Years | 81 (31.3%) | 36 (23.7%) |
| 12 to 14 Years | 31 (25.2%) | 49 (29.7%) |
| 15 Years | 13 (50.0%) | 21 (42.0%) |
| 16 and 17 Years | 37 (30.1%) | 0 (0.0%) |
| 18 to 24 Years | 49 (24.4%) | 48 (23.0%) |
| 25 to 34 Years | 26 (11.2%) | 67 (26.9%) |
| 35 to 44 Years | 10 (6.9%) | 43 (22.4%) |
| 45 to 54 Years | 45 (21.2%) | 22 (10.1%) |
| 55 to 64 Years | 61 (20.3%) | 45 (14.3%) |
| 65 to 74 Years | 10 (4.7%) | 1 (0.5%) |
| 75 Years and over | 0 (0.0%) | 1 (1.0%) |
| Total | 427 (19.7%) | 423 (20.3%) |
Income Above Poverty by Sex and Age in Menominee County
According to the poverty statistics in Menominee County, males aged 75 years and over and females aged 16 and 17 years are the age groups that are most secure financially, with 100.0% of males and 100.0% of females in these age groups living above the poverty line.
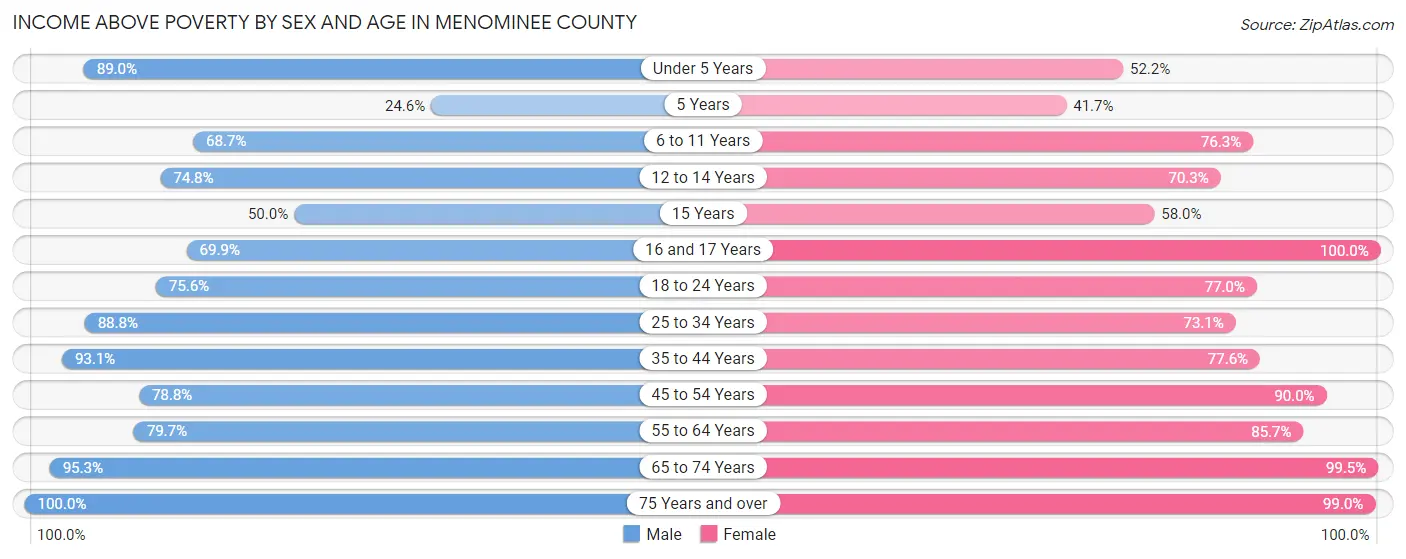
| Age Bracket | Male | Female |
| Under 5 Years | 170 (89.0%) | 83 (52.2%) |
| 5 Years | 14 (24.6%) | 10 (41.7%) |
| 6 to 11 Years | 178 (68.7%) | 116 (76.3%) |
| 12 to 14 Years | 92 (74.8%) | 116 (70.3%) |
| 15 Years | 13 (50.0%) | 29 (58.0%) |
| 16 and 17 Years | 86 (69.9%) | 43 (100.0%) |
| 18 to 24 Years | 152 (75.6%) | 161 (77.0%) |
| 25 to 34 Years | 207 (88.8%) | 182 (73.1%) |
| 35 to 44 Years | 134 (93.1%) | 149 (77.6%) |
| 45 to 54 Years | 167 (78.8%) | 197 (89.9%) |
| 55 to 64 Years | 240 (79.7%) | 269 (85.7%) |
| 65 to 74 Years | 204 (95.3%) | 213 (99.5%) |
| 75 Years and over | 81 (100.0%) | 98 (99.0%) |
| Total | 1,738 (80.3%) | 1,666 (79.7%) |
Income Below Poverty Among Married-Couple Families in Menominee County
The poverty statistics for married-couple families in Menominee County show that 3.4% or 19 of the total 555 families live below the poverty line. Families with 5 or more children have the highest poverty rate of 25.0%, comprising of 10 families. On the other hand, families with 1 or 2 children have the lowest poverty rate of 0.0%, which includes 0 families.
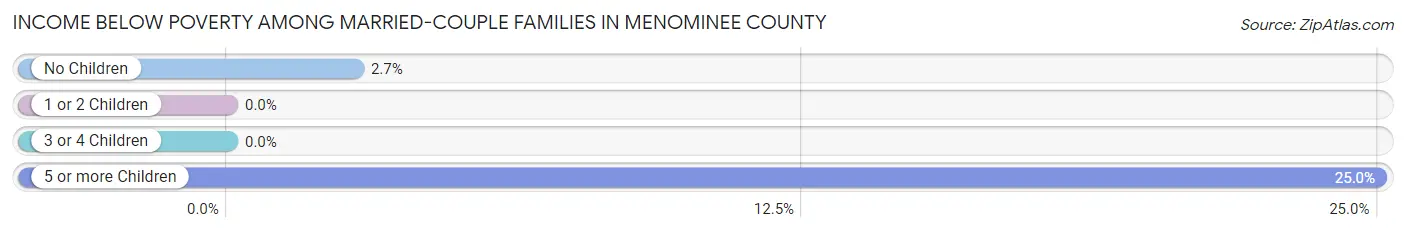
| Children | Above Poverty | Below Poverty |
| No Children | 319 (97.3%) | 9 (2.7%) |
| 1 or 2 Children | 122 (100.0%) | 0 (0.0%) |
| 3 or 4 Children | 65 (100.0%) | 0 (0.0%) |
| 5 or more Children | 30 (75.0%) | 10 (25.0%) |
| Total | 536 (96.6%) | 19 (3.4%) |
Income Below Poverty Among Single-Parent Households in Menominee County
According to the poverty data in Menominee County, 32.0% or 48 single-father households and 29.3% or 107 single-mother households are living below the poverty line. Among single-father households, those with 3 or 4 children have the highest poverty rate, with 35 households (83.3%) experiencing poverty. Likewise, among single-mother households, those with 5 or more children have the highest poverty rate, with 9 households (100.0%) falling below the poverty line.
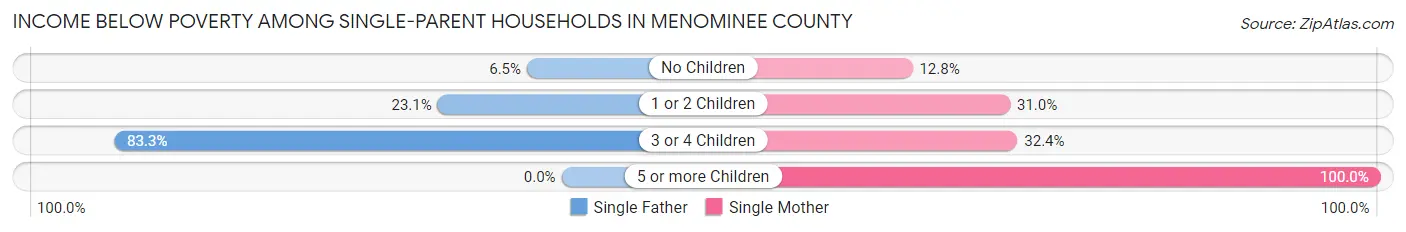
| Children | Single Father | Single Mother |
| No Children | 4 (6.5%) | 10 (12.8%) |
| 1 or 2 Children | 9 (23.1%) | 44 (31.0%) |
| 3 or 4 Children | 35 (83.3%) | 44 (32.4%) |
| 5 or more Children | 0 (0.0%) | 9 (100.0%) |
| Total | 48 (32.0%) | 107 (29.3%) |
Income Below Poverty Among Married-Couple vs Single-Parent Households in Menominee County
The poverty data for Menominee County shows that 19 of the married-couple family households (3.4%) and 155 of the single-parent households (30.1%) are living below the poverty level. Within the married-couple family households, those with 5 or more children have the highest poverty rate, with 10 households (25.0%) falling below the poverty line. Among the single-parent households, those with 5 or more children have the highest poverty rate, with 9 household (56.2%) living below poverty.
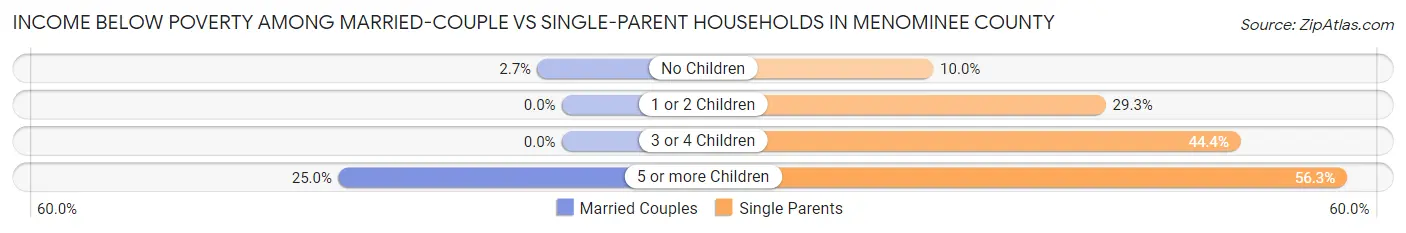
| Children | Married-Couple Families | Single-Parent Households |
| No Children | 9 (2.7%) | 14 (10.0%) |
| 1 or 2 Children | 0 (0.0%) | 53 (29.3%) |
| 3 or 4 Children | 0 (0.0%) | 79 (44.4%) |
| 5 or more Children | 10 (25.0%) | 9 (56.2%) |
| Total | 19 (3.4%) | 155 (30.1%) |
Employment Characteristics in Menominee County
Employment by Class of Employer in Menominee County
Among the 1,364 employed individuals in Menominee County, local government employees (608 | 44.6%), private company employees (438 | 32.1%), and not-for-profit organizations (96 | 7.0%) make up the most common classes of employment.
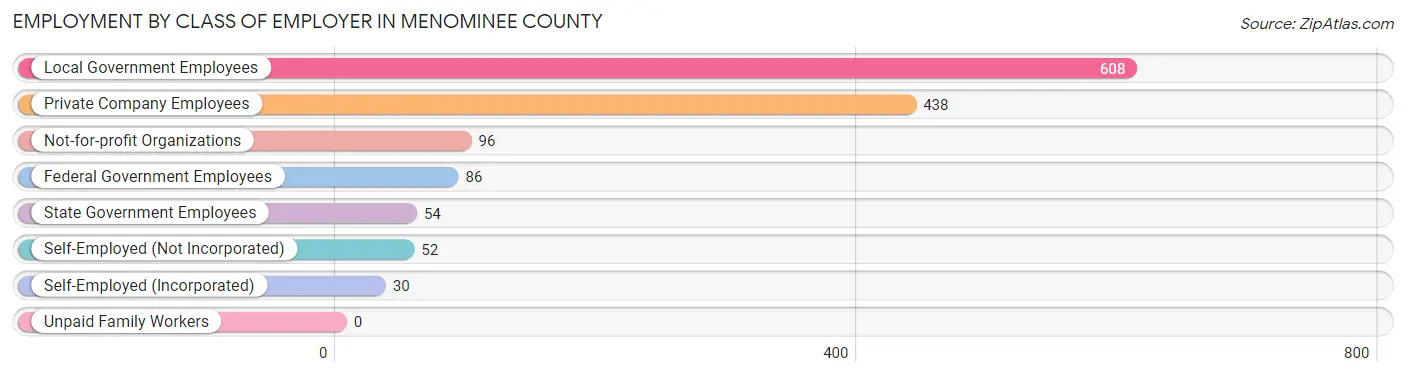
| Employer Class | # Employees | % Employees |
| Private Company Employees | 438 | 32.1% |
| Self-Employed (Incorporated) | 30 | 2.2% |
| Self-Employed (Not Incorporated) | 52 | 3.8% |
| Not-for-profit Organizations | 96 | 7.0% |
| Local Government Employees | 608 | 44.6% |
| State Government Employees | 54 | 4.0% |
| Federal Government Employees | 86 | 6.3% |
| Unpaid Family Workers | 0 | 0.0% |
| Total | 1,364 | 100.0% |
Employment Status by Age in Menominee County
According to the labor force statistics for Menominee County, out of the total population over 16 years of age (3,067), 51.2% or 1,570 individuals are in the labor force, with 10.7% or 168 of them unemployed. The age group with the highest labor force participation rate is 30 to 34 years, with 79.3% or 207 individuals in the labor force. Within the labor force, the 55 to 59 years age range has the highest percentage of unemployed individuals, with 30.3% or 56 of them being unemployed.
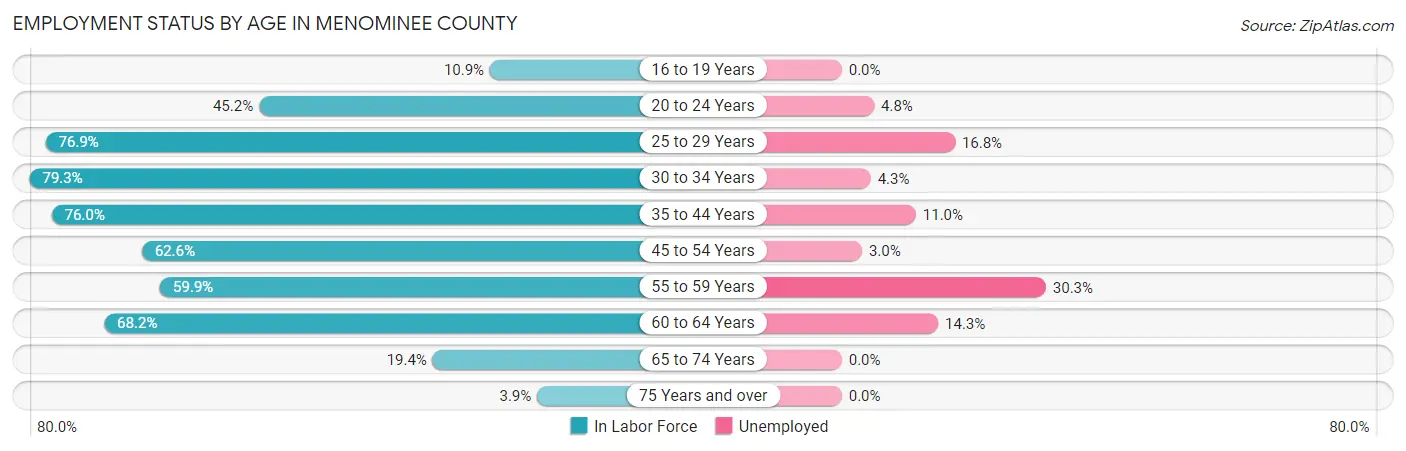
| Age Bracket | In Labor Force | Unemployed |
| 16 to 19 Years | 28 (10.9%) | 0 (0.0%) |
| 20 to 24 Years | 145 (45.2%) | 7 (4.8%) |
| 25 to 29 Years | 173 (76.9%) | 29 (16.8%) |
| 30 to 34 Years | 207 (79.3%) | 9 (4.3%) |
| 35 to 44 Years | 263 (76.0%) | 29 (11.0%) |
| 45 to 54 Years | 270 (62.6%) | 8 (3.0%) |
| 55 to 59 Years | 185 (59.9%) | 56 (30.3%) |
| 60 to 64 Years | 210 (68.2%) | 30 (14.3%) |
| 65 to 74 Years | 83 (19.4%) | 0 (0.0%) |
| 75 Years and over | 7 (3.9%) | 0 (0.0%) |
| Total | 1,570 (51.2%) | 168 (10.7%) |
Employment Status by Educational Attainment in Menominee County
According to labor force statistics for Menominee County, 69.6% of individuals (1,308) out of the total population between 25 and 64 years of age (1,880) are in the labor force, with 12.3% or 161 of them being unemployed. The group with the highest labor force participation rate are those with the educational attainment of college / associate degree, with 77.1% or 529 individuals in the labor force. Within the labor force, individuals with college / associate degree education have the highest percentage of unemployment, with 19.7% or 104 of them being unemployed.
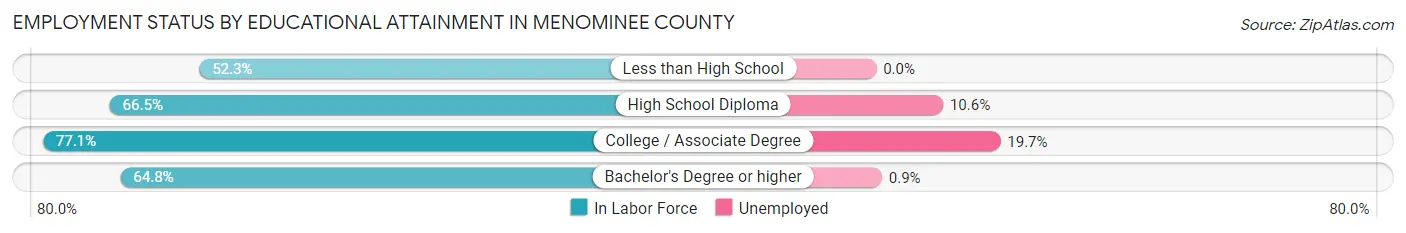
| Educational Attainment | In Labor Force | Unemployed |
| Less than High School | 34 (52.3%) | 0 (0.0%) |
| High School Diploma | 517 (66.5%) | 82 (10.6%) |
| College / Associate Degree | 529 (77.1%) | 135 (19.7%) |
| Bachelor's Degree or higher | 228 (64.8%) | 3 (0.9%) |
| Total | 1,308 (69.6%) | 231 (12.3%) |
Employment Occupations by Sex in Menominee County
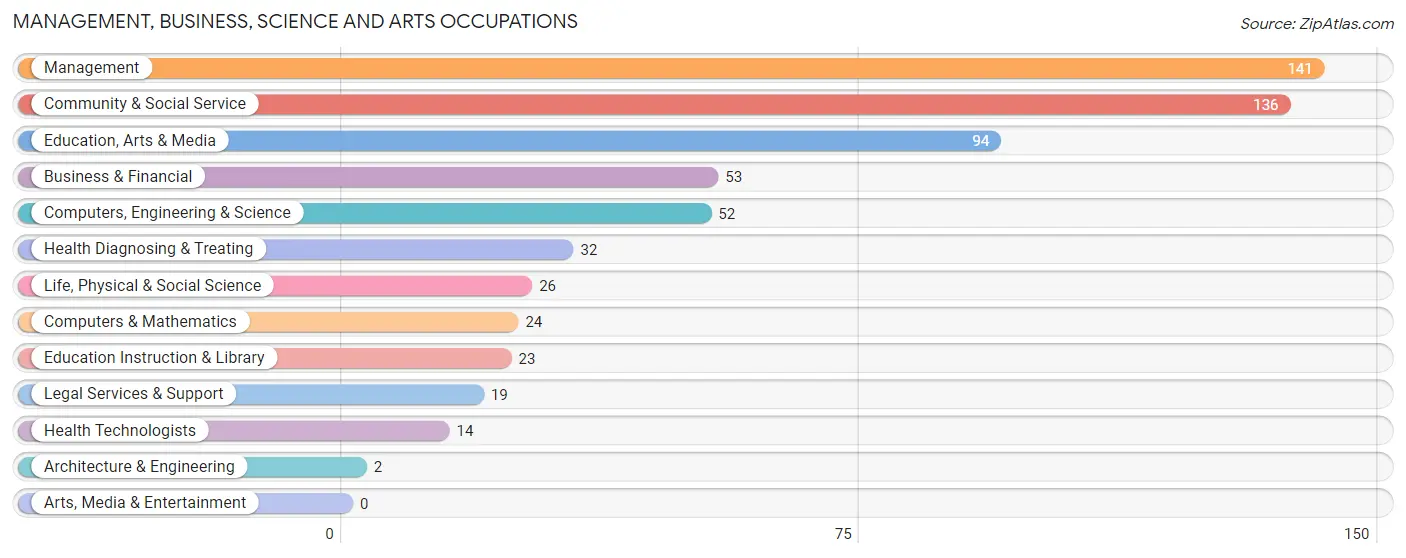
Management, Business, Science and Arts Occupations
The most common Management, Business, Science and Arts occupations in Menominee County are Management (141 | 10.1%), Community & Social Service (136 | 9.7%), Education, Arts & Media (94 | 6.7%), Business & Financial (53 | 3.8%), and Computers, Engineering & Science (52 | 3.7%).
Management, Business, Science and Arts Occupations by Sex
Within the Management, Business, Science and Arts occupations in Menominee County, the most male-oriented occupations are Architecture & Engineering (100.0%), Life, Physical & Social Science (100.0%), and Computers, Engineering & Science (65.4%), while the most female-oriented occupations are Health Diagnosing & Treating (100.0%), Health Technologists (100.0%), and Business & Financial (86.8%).
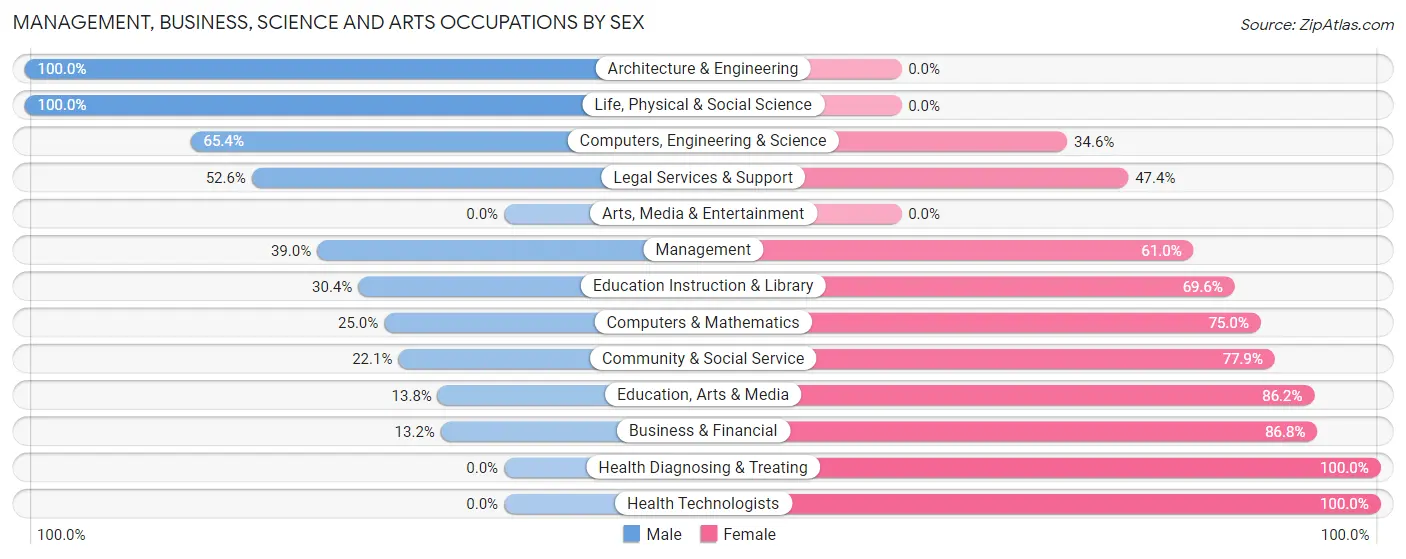
| Occupation | Male | Female |
| Management | 55 (39.0%) | 86 (61.0%) |
| Business & Financial | 7 (13.2%) | 46 (86.8%) |
| Computers, Engineering & Science | 34 (65.4%) | 18 (34.6%) |
| Computers & Mathematics | 6 (25.0%) | 18 (75.0%) |
| Architecture & Engineering | 2 (100.0%) | 0 (0.0%) |
| Life, Physical & Social Science | 26 (100.0%) | 0 (0.0%) |
| Community & Social Service | 30 (22.1%) | 106 (77.9%) |
| Education, Arts & Media | 13 (13.8%) | 81 (86.2%) |
| Legal Services & Support | 10 (52.6%) | 9 (47.4%) |
| Education Instruction & Library | 7 (30.4%) | 16 (69.6%) |
| Arts, Media & Entertainment | 0 (0.0%) | 0 (0.0%) |
| Health Diagnosing & Treating | 0 (0.0%) | 32 (100.0%) |
| Health Technologists | 0 (0.0%) | 14 (100.0%) |
| Total (Category) | 126 (30.4%) | 288 (69.6%) |
| Total (Overall) | 663 (47.3%) | 740 (52.7%) |
Services Occupations
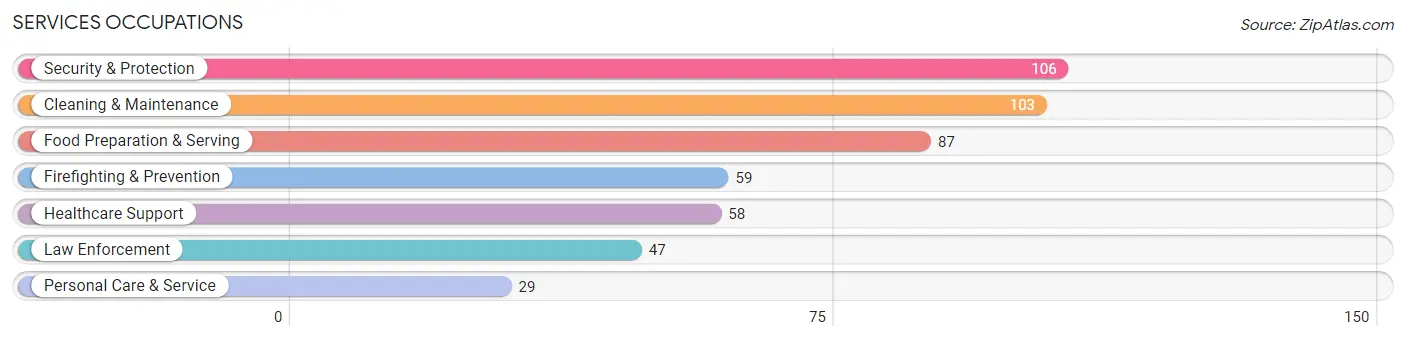
The most common Services occupations in Menominee County are Security & Protection (106 | 7.6%), Cleaning & Maintenance (103 | 7.3%), Food Preparation & Serving (87 | 6.2%), Firefighting & Prevention (59 | 4.2%), and Healthcare Support (58 | 4.1%).
Services Occupations by Sex
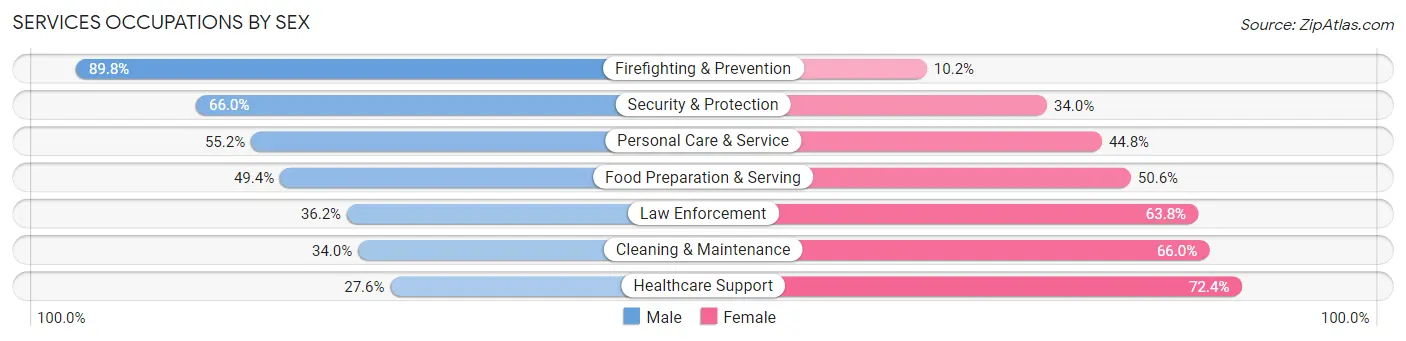
Within the Services occupations in Menominee County, the most male-oriented occupations are Firefighting & Prevention (89.8%), Security & Protection (66.0%), and Personal Care & Service (55.2%), while the most female-oriented occupations are Healthcare Support (72.4%), Cleaning & Maintenance (66.0%), and Law Enforcement (63.8%).
| Occupation | Male | Female |
| Healthcare Support | 16 (27.6%) | 42 (72.4%) |
| Security & Protection | 70 (66.0%) | 36 (34.0%) |
| Firefighting & Prevention | 53 (89.8%) | 6 (10.2%) |
| Law Enforcement | 17 (36.2%) | 30 (63.8%) |
| Food Preparation & Serving | 43 (49.4%) | 44 (50.6%) |
| Cleaning & Maintenance | 35 (34.0%) | 68 (66.0%) |
| Personal Care & Service | 16 (55.2%) | 13 (44.8%) |
| Total (Category) | 180 (47.0%) | 203 (53.0%) |
| Total (Overall) | 663 (47.3%) | 740 (52.7%) |
Sales and Office Occupations
The most common Sales and Office occupations in Menominee County are Office & Administration (199 | 14.2%), and Sales & Related (48 | 3.4%).

Sales and Office Occupations by Sex

| Occupation | Male | Female |
| Sales & Related | 13 (27.1%) | 35 (72.9%) |
| Office & Administration | 69 (34.7%) | 130 (65.3%) |
| Total (Category) | 82 (33.2%) | 165 (66.8%) |
| Total (Overall) | 663 (47.3%) | 740 (52.7%) |
Natural Resources, Construction and Maintenance Occupations
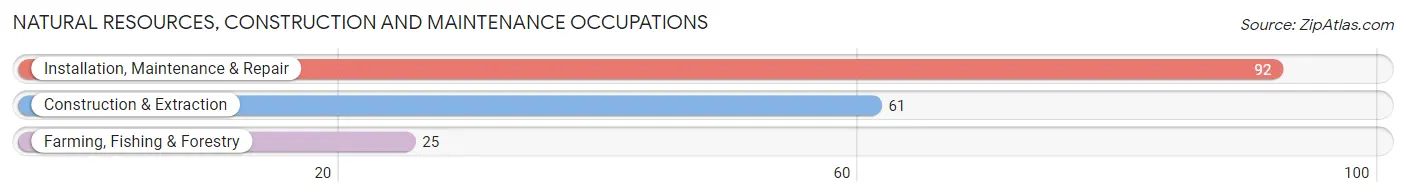
The most common Natural Resources, Construction and Maintenance occupations in Menominee County are Installation, Maintenance & Repair (92 | 6.6%), Construction & Extraction (61 | 4.3%), and Farming, Fishing & Forestry (25 | 1.8%).
Natural Resources, Construction and Maintenance Occupations by Sex

| Occupation | Male | Female |
| Farming, Fishing & Forestry | 25 (100.0%) | 0 (0.0%) |
| Construction & Extraction | 54 (88.5%) | 7 (11.5%) |
| Installation, Maintenance & Repair | 72 (78.3%) | 20 (21.7%) |
| Total (Category) | 151 (84.8%) | 27 (15.2%) |
| Total (Overall) | 663 (47.3%) | 740 (52.7%) |
Production, Transportation and Moving Occupations
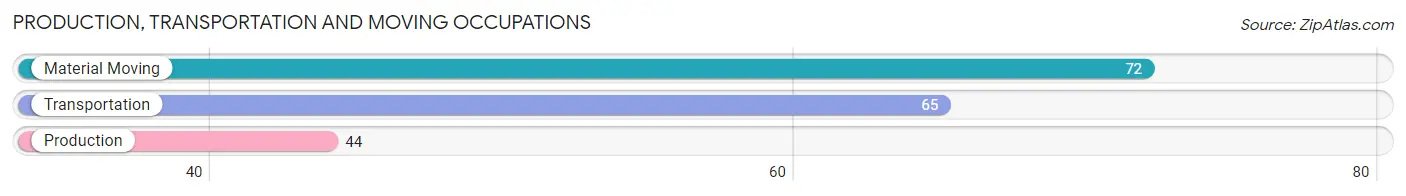
The most common Production, Transportation and Moving occupations in Menominee County are Material Moving (72 | 5.1%), Transportation (65 | 4.6%), and Production (44 | 3.1%).
Production, Transportation and Moving Occupations by Sex
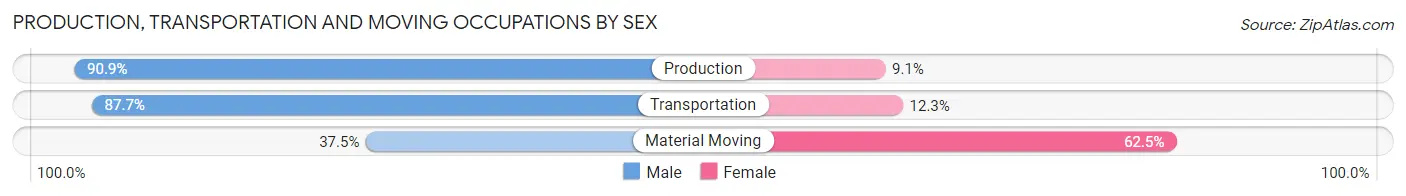
| Occupation | Male | Female |
| Production | 40 (90.9%) | 4 (9.1%) |
| Transportation | 57 (87.7%) | 8 (12.3%) |
| Material Moving | 27 (37.5%) | 45 (62.5%) |
| Total (Category) | 124 (68.5%) | 57 (31.5%) |
| Total (Overall) | 663 (47.3%) | 740 (52.7%) |
Employment Industries by Sex in Menominee County
Employment Industries in Menominee County
The major employment industries in Menominee County include Arts, Entertainment & Recreation (257 | 18.3%), Health Care & Social Assistance (234 | 16.7%), Public Administration (212 | 15.1%), Educational Services (144 | 10.3%), and Manufacturing (134 | 9.6%).

Employment Industries by Sex in Menominee County
The Menominee County industries that see more men than women are Mining, Quarrying, & Extraction (100.0%), Utilities (100.0%), and Real Estate, Rental & Leasing (100.0%), whereas the industries that tend to have a higher number of women are Finance & Insurance (100.0%), Professional & Scientific (100.0%), and Retail Trade (82.8%).
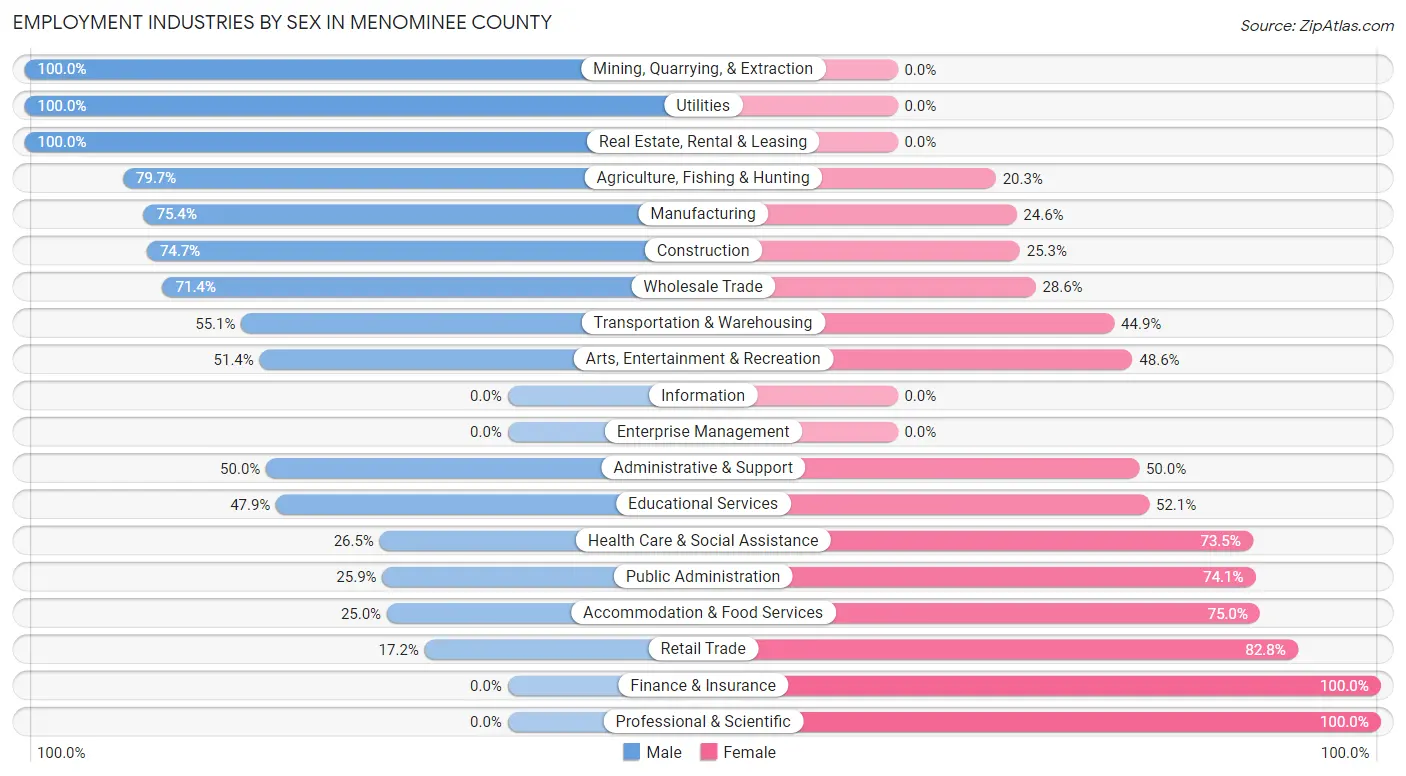
| Industry | Male | Female |
| Agriculture, Fishing & Hunting | 47 (79.7%) | 12 (20.3%) |
| Mining, Quarrying, & Extraction | 7 (100.0%) | 0 (0.0%) |
| Construction | 56 (74.7%) | 19 (25.3%) |
| Manufacturing | 101 (75.4%) | 33 (24.6%) |
| Wholesale Trade | 5 (71.4%) | 2 (28.6%) |
| Retail Trade | 11 (17.2%) | 53 (82.8%) |
| Transportation & Warehousing | 59 (55.1%) | 48 (44.9%) |
| Utilities | 13 (100.0%) | 0 (0.0%) |
| Information | 0 (0.0%) | 0 (0.0%) |
| Finance & Insurance | 0 (0.0%) | 12 (100.0%) |
| Real Estate, Rental & Leasing | 15 (100.0%) | 0 (0.0%) |
| Professional & Scientific | 0 (0.0%) | 13 (100.0%) |
| Enterprise Management | 0 (0.0%) | 0 (0.0%) |
| Administrative & Support | 10 (50.0%) | 10 (50.0%) |
| Educational Services | 69 (47.9%) | 75 (52.1%) |
| Health Care & Social Assistance | 62 (26.5%) | 172 (73.5%) |
| Arts, Entertainment & Recreation | 132 (51.4%) | 125 (48.6%) |
| Accommodation & Food Services | 3 (25.0%) | 9 (75.0%) |
| Public Administration | 55 (25.9%) | 157 (74.1%) |
| Total | 663 (47.3%) | 740 (52.7%) |
Education in Menominee County
School Enrollment in Menominee County
The most common levels of schooling among the 1,125 students in Menominee County are middle school (300 | 26.7%), elementary school (275 | 24.4%), and high school (273 | 24.3%).
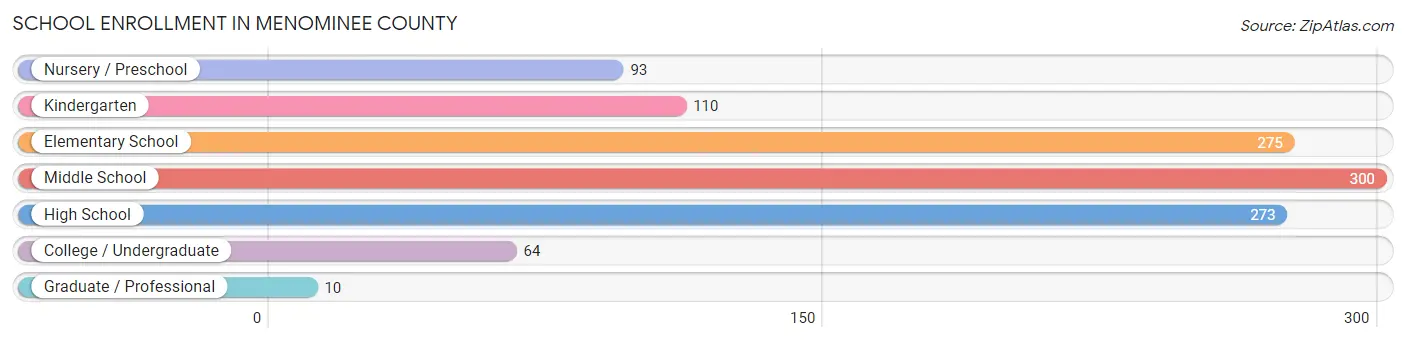
| School Level | # Students | % Students |
| Nursery / Preschool | 93 | 8.3% |
| Kindergarten | 110 | 9.8% |
| Elementary School | 275 | 24.4% |
| Middle School | 300 | 26.7% |
| High School | 273 | 24.3% |
| College / Undergraduate | 64 | 5.7% |
| Graduate / Professional | 10 | 0.9% |
| Total | 1,125 | 100.0% |
School Enrollment by Age by Funding Source in Menominee County
Out of a total of 1,125 students who are enrolled in schools in Menominee County, 101 (9.0%) attend a private institution, while the remaining 1,024 (91.0%) are enrolled in public schools. The age group of 5 to 9 year old has the highest likelihood of being enrolled in private schools, with 76 (24.1% in the age bracket) enrolled. Conversely, the age group of 3 to 4 year olds has the lowest likelihood of being enrolled in a private school, with 101 (100.0% in the age bracket) attending a public institution.
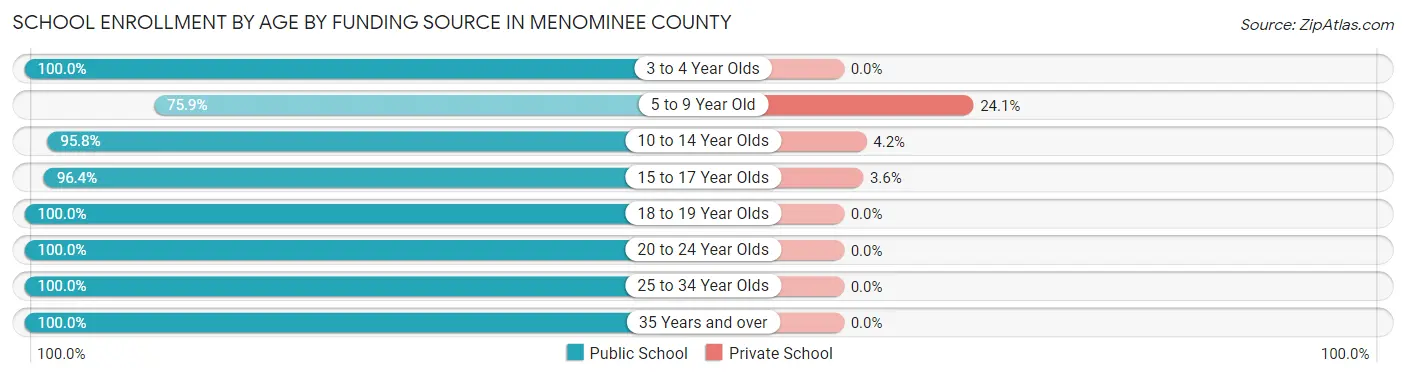
| Age Bracket | Public School | Private School |
| 3 to 4 Year Olds | 101 (100.0%) | 0 (0.0%) |
| 5 to 9 Year Old | 239 (75.9%) | 76 (24.1%) |
| 10 to 14 Year Olds | 385 (95.8%) | 17 (4.2%) |
| 15 to 17 Year Olds | 215 (96.4%) | 8 (3.6%) |
| 18 to 19 Year Olds | 10 (100.0%) | 0 (0.0%) |
| 20 to 24 Year Olds | 21 (100.0%) | 0 (0.0%) |
| 25 to 34 Year Olds | 26 (100.0%) | 0 (0.0%) |
| 35 Years and over | 27 (100.0%) | 0 (0.0%) |
| Total | 1,024 (91.0%) | 101 (9.0%) |
Educational Attainment by Field of Study in Menominee County
Education (156 | 31.3%), arts & humanities (78 | 15.7%), business (73 | 14.7%), social sciences (61 | 12.2%), and science & technology (47 | 9.4%) are the most common fields of study among 498 individuals in Menominee County who have obtained a bachelor's degree or higher.
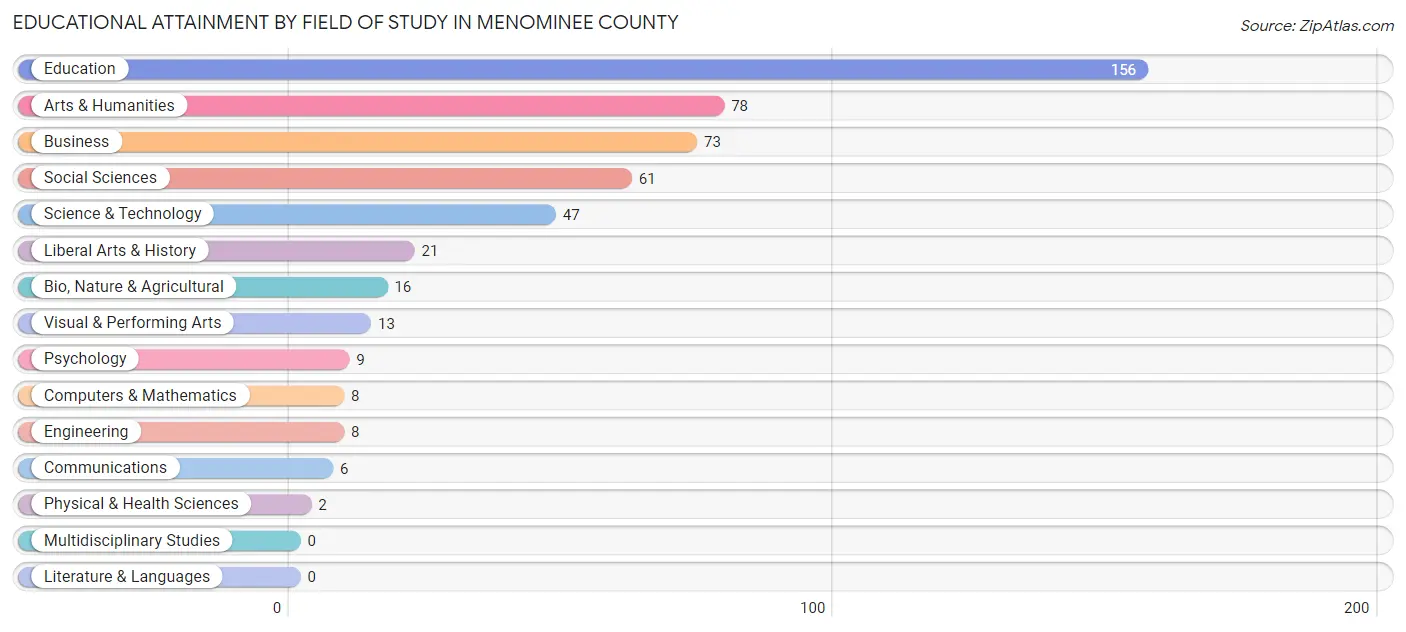
| Field of Study | # Graduates | % Graduates |
| Computers & Mathematics | 8 | 1.6% |
| Bio, Nature & Agricultural | 16 | 3.2% |
| Physical & Health Sciences | 2 | 0.4% |
| Psychology | 9 | 1.8% |
| Social Sciences | 61 | 12.2% |
| Engineering | 8 | 1.6% |
| Multidisciplinary Studies | 0 | 0.0% |
| Science & Technology | 47 | 9.4% |
| Business | 73 | 14.7% |
| Education | 156 | 31.3% |
| Literature & Languages | 0 | 0.0% |
| Liberal Arts & History | 21 | 4.2% |
| Visual & Performing Arts | 13 | 2.6% |
| Communications | 6 | 1.2% |
| Arts & Humanities | 78 | 15.7% |
| Total | 498 | 100.0% |
Transportation & Commute in Menominee County
Vehicle Availability by Sex in Menominee County
The most prevalent vehicle ownership categories in Menominee County are males with 2 vehicles (297, accounting for 46.4%) and females with 2 vehicles (342, making up 41.5%).
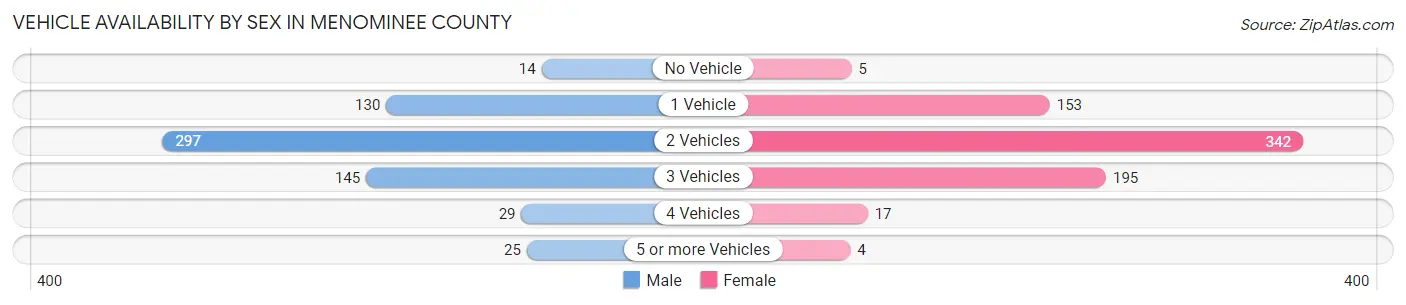
| Vehicles Available | Male | Female |
| No Vehicle | 14 (2.2%) | 5 (0.7%) |
| 1 Vehicle | 130 (20.3%) | 153 (21.4%) |
| 2 Vehicles | 297 (46.4%) | 342 (47.8%) |
| 3 Vehicles | 145 (22.7%) | 195 (27.2%) |
| 4 Vehicles | 29 (4.5%) | 17 (2.4%) |
| 5 or more Vehicles | 25 (3.9%) | 4 (0.6%) |
| Total | 640 (100.0%) | 716 (100.0%) |
Commute Time in Menominee County
The most frequently occuring commute durations in Menominee County are 20 to 24 minutes (257 commuters, 20.6%), less than 5 minutes (251 commuters, 20.1%), and 5 to 9 minutes (209 commuters, 16.7%).
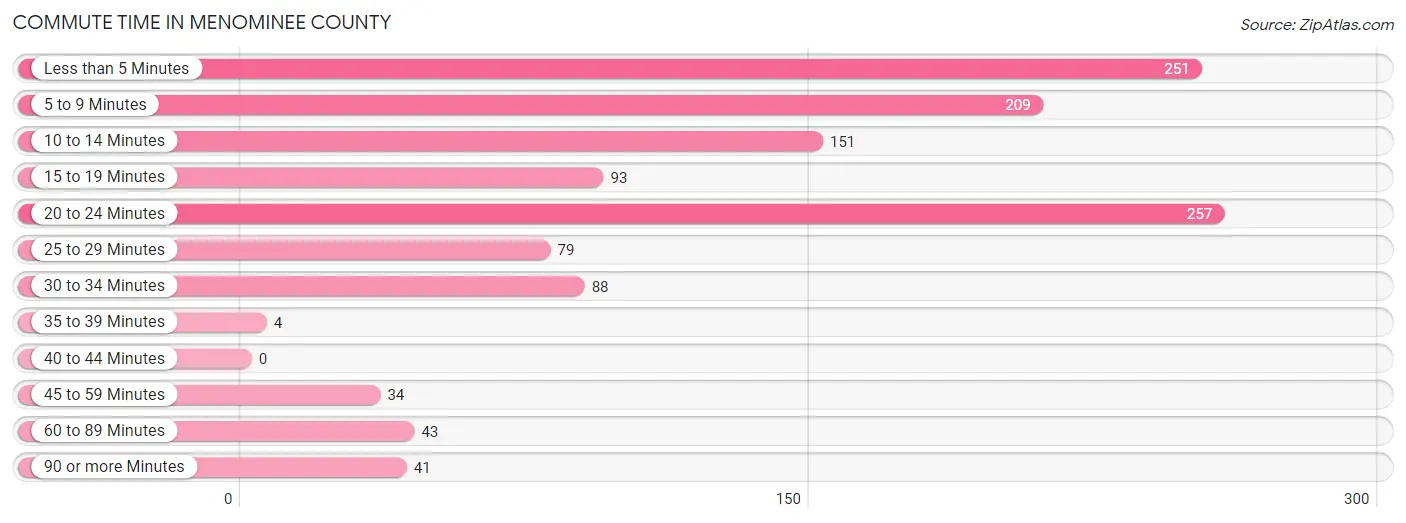
| Commute Time | # Commuters | % Commuters |
| Less than 5 Minutes | 251 | 20.1% |
| 5 to 9 Minutes | 209 | 16.7% |
| 10 to 14 Minutes | 151 | 12.1% |
| 15 to 19 Minutes | 93 | 7.4% |
| 20 to 24 Minutes | 257 | 20.6% |
| 25 to 29 Minutes | 79 | 6.3% |
| 30 to 34 Minutes | 88 | 7.0% |
| 35 to 39 Minutes | 4 | 0.3% |
| 40 to 44 Minutes | 0 | 0.0% |
| 45 to 59 Minutes | 34 | 2.7% |
| 60 to 89 Minutes | 43 | 3.4% |
| 90 or more Minutes | 41 | 3.3% |
Commute Time by Sex in Menominee County
The most common commute times in Menominee County are 20 to 24 minutes (132 commuters, 22.4%) for males and less than 5 minutes (136 commuters, 20.6%) for females.
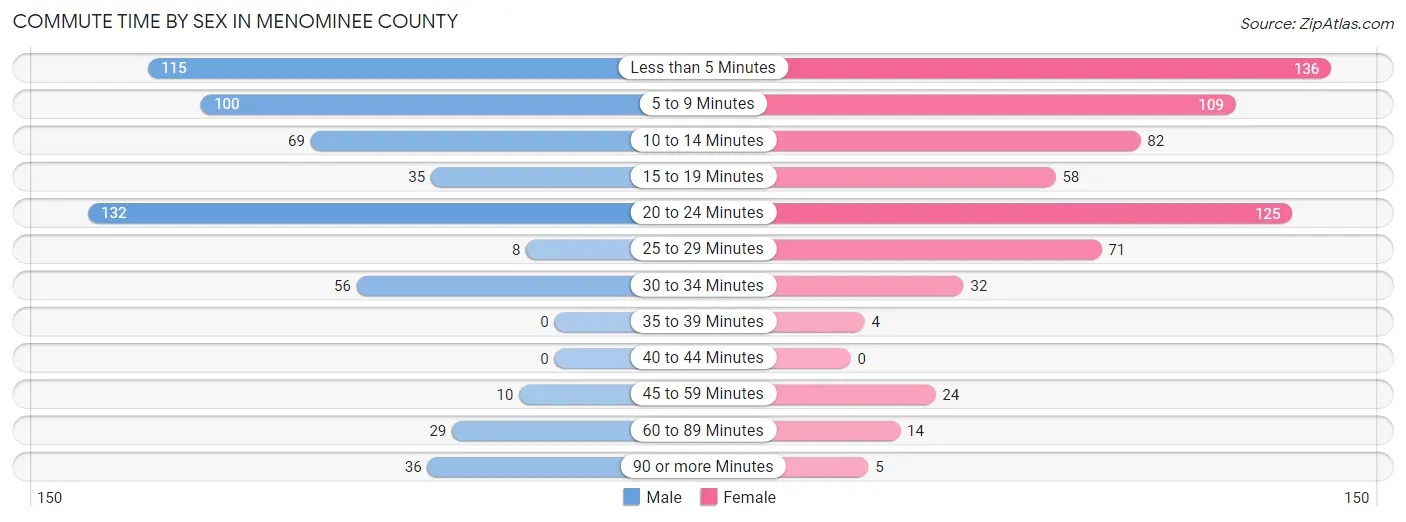
| Commute Time | Male | Female |
| Less than 5 Minutes | 115 (19.5%) | 136 (20.6%) |
| 5 to 9 Minutes | 100 (17.0%) | 109 (16.5%) |
| 10 to 14 Minutes | 69 (11.7%) | 82 (12.4%) |
| 15 to 19 Minutes | 35 (5.9%) | 58 (8.8%) |
| 20 to 24 Minutes | 132 (22.4%) | 125 (18.9%) |
| 25 to 29 Minutes | 8 (1.4%) | 71 (10.8%) |
| 30 to 34 Minutes | 56 (9.5%) | 32 (4.9%) |
| 35 to 39 Minutes | 0 (0.0%) | 4 (0.6%) |
| 40 to 44 Minutes | 0 (0.0%) | 0 (0.0%) |
| 45 to 59 Minutes | 10 (1.7%) | 24 (3.6%) |
| 60 to 89 Minutes | 29 (4.9%) | 14 (2.1%) |
| 90 or more Minutes | 36 (6.1%) | 5 (0.8%) |
Time of Departure to Work by Sex in Menominee County
The most frequent times of departure to work in Menominee County are 7:00 AM to 7:29 AM (115, 19.5%) for males and 7:30 AM to 7:59 AM (174, 26.4%) for females.
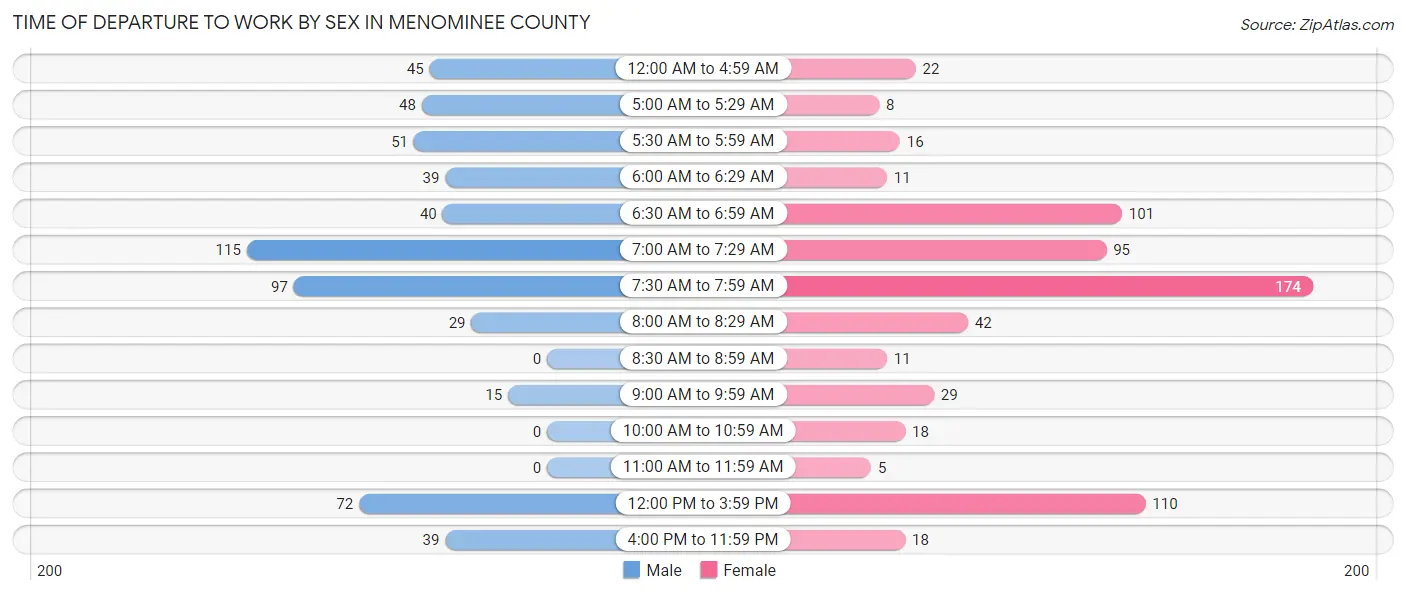
| Time of Departure | Male | Female |
| 12:00 AM to 4:59 AM | 45 (7.6%) | 22 (3.3%) |
| 5:00 AM to 5:29 AM | 48 (8.1%) | 8 (1.2%) |
| 5:30 AM to 5:59 AM | 51 (8.6%) | 16 (2.4%) |
| 6:00 AM to 6:29 AM | 39 (6.6%) | 11 (1.7%) |
| 6:30 AM to 6:59 AM | 40 (6.8%) | 101 (15.3%) |
| 7:00 AM to 7:29 AM | 115 (19.5%) | 95 (14.4%) |
| 7:30 AM to 7:59 AM | 97 (16.4%) | 174 (26.4%) |
| 8:00 AM to 8:29 AM | 29 (4.9%) | 42 (6.4%) |
| 8:30 AM to 8:59 AM | 0 (0.0%) | 11 (1.7%) |
| 9:00 AM to 9:59 AM | 15 (2.5%) | 29 (4.4%) |
| 10:00 AM to 10:59 AM | 0 (0.0%) | 18 (2.7%) |
| 11:00 AM to 11:59 AM | 0 (0.0%) | 5 (0.8%) |
| 12:00 PM to 3:59 PM | 72 (12.2%) | 110 (16.7%) |
| 4:00 PM to 11:59 PM | 39 (6.6%) | 18 (2.7%) |
| Total | 590 (100.0%) | 660 (100.0%) |
Housing Occupancy in Menominee County
Occupancy by Ownership in Menominee County
Of the total 1,307 dwellings in Menominee County, owner-occupied units account for 917 (70.2%), while renter-occupied units make up 390 (29.8%).
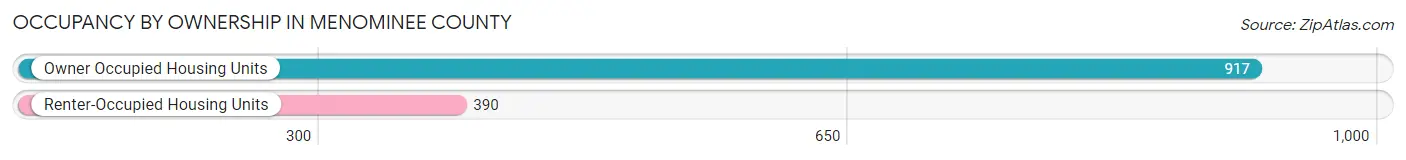
| Occupancy | # Housing Units | % Housing Units |
| Owner Occupied Housing Units | 917 | 70.2% |
| Renter-Occupied Housing Units | 390 | 29.8% |
| Total Occupied Housing Units | 1,307 | 100.0% |
Occupancy by Household Size in Menominee County
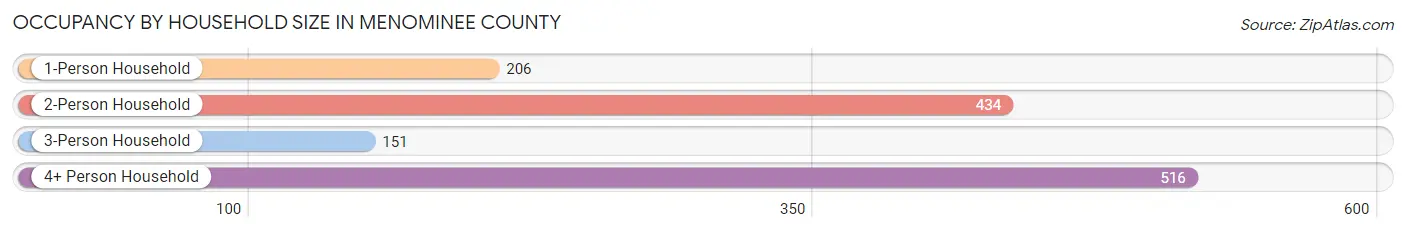
| Household Size | # Housing Units | % Housing Units |
| 1-Person Household | 206 | 15.8% |
| 2-Person Household | 434 | 33.2% |
| 3-Person Household | 151 | 11.6% |
| 4+ Person Household | 516 | 39.5% |
| Total Housing Units | 1,307 | 100.0% |
Occupancy by Ownership by Household Size in Menominee County
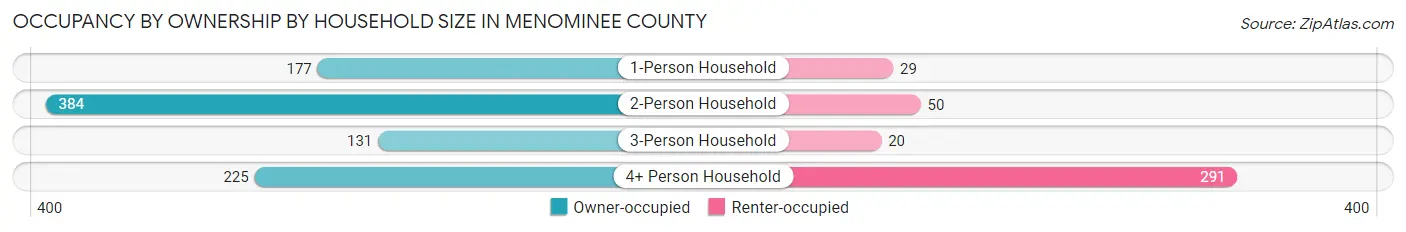
| Household Size | Owner-occupied | Renter-occupied |
| 1-Person Household | 177 (85.9%) | 29 (14.1%) |
| 2-Person Household | 384 (88.5%) | 50 (11.5%) |
| 3-Person Household | 131 (86.8%) | 20 (13.3%) |
| 4+ Person Household | 225 (43.6%) | 291 (56.4%) |
| Total Housing Units | 917 (70.2%) | 390 (29.8%) |
Occupancy by Educational Attainment in Menominee County
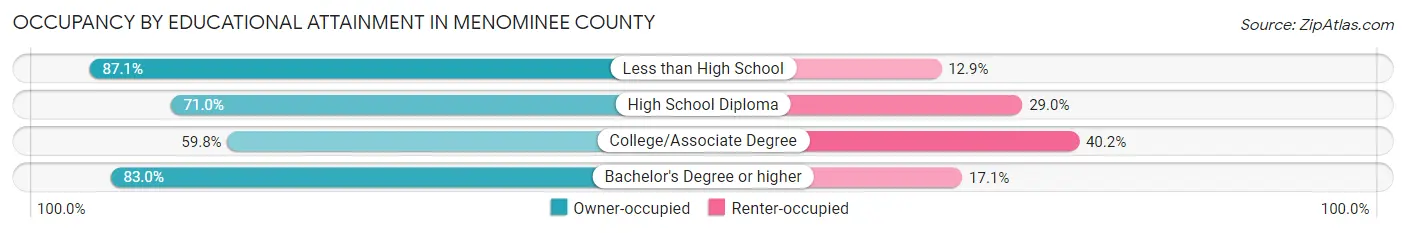
| Household Size | Owner-occupied | Renter-occupied |
| Less than High School | 54 (87.1%) | 8 (12.9%) |
| High School Diploma | 363 (71.0%) | 148 (29.0%) |
| College/Associate Degree | 281 (59.8%) | 189 (40.2%) |
| Bachelor's Degree or higher | 219 (83.0%) | 45 (17.1%) |
Occupancy by Age of Householder in Menominee County
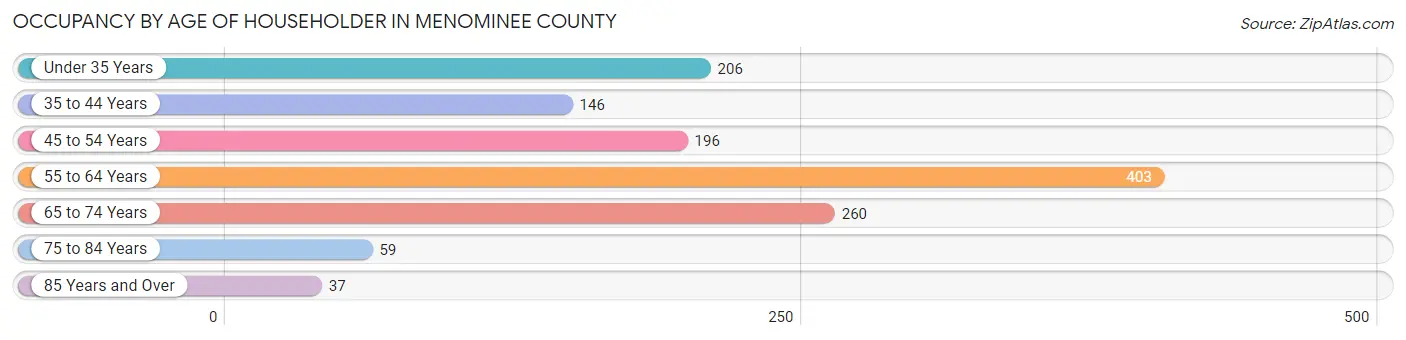
| Age Bracket | # Households | % Households |
| Under 35 Years | 206 | 15.8% |
| 35 to 44 Years | 146 | 11.2% |
| 45 to 54 Years | 196 | 15.0% |
| 55 to 64 Years | 403 | 30.8% |
| 65 to 74 Years | 260 | 19.9% |
| 75 to 84 Years | 59 | 4.5% |
| 85 Years and Over | 37 | 2.8% |
| Total | 1,307 | 100.0% |
Housing Finances in Menominee County
Median Income by Occupancy in Menominee County
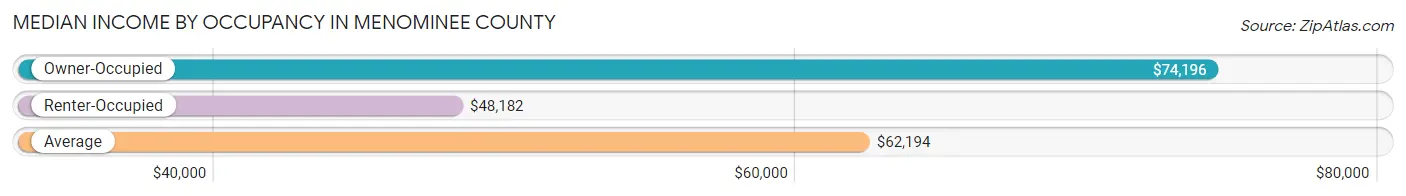
| Occupancy Type | # Households | Median Income |
| Owner-Occupied | 917 (70.2%) | $74,196 |
| Renter-Occupied | 390 (29.8%) | $48,182 |
| Average | 1,307 (100.0%) | $62,194 |
Occupancy by Householder Income Bracket in Menominee County
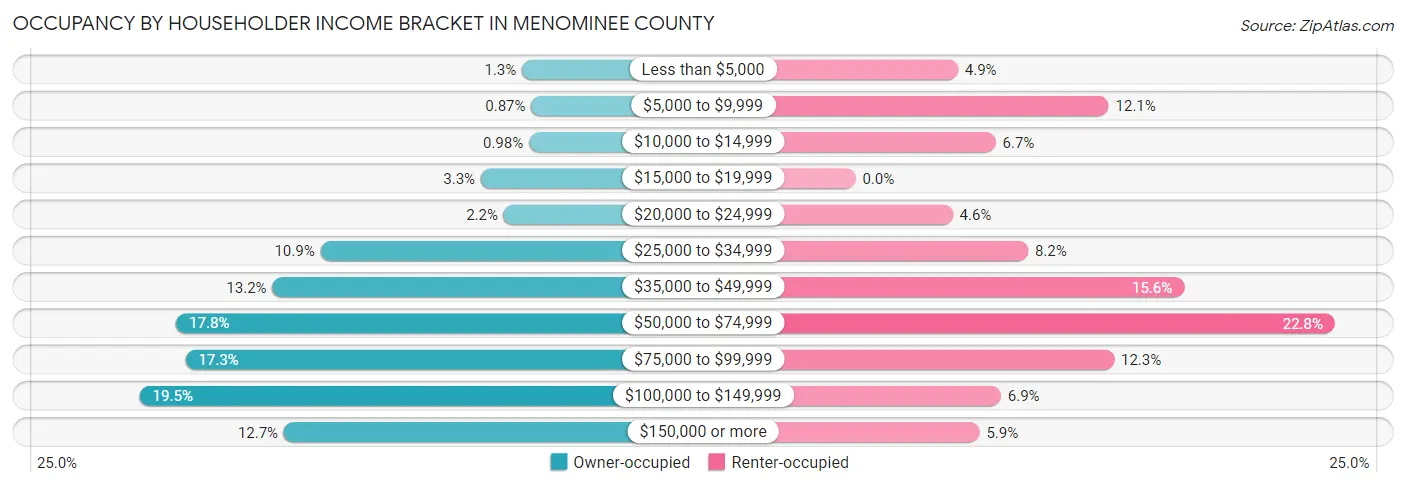
| Income Bracket | Owner-occupied | Renter-occupied |
| Less than $5,000 | 12 (1.3%) | 19 (4.9%) |
| $5,000 to $9,999 | 8 (0.9%) | 47 (12.0%) |
| $10,000 to $14,999 | 9 (1.0%) | 26 (6.7%) |
| $15,000 to $19,999 | 30 (3.3%) | 0 (0.0%) |
| $20,000 to $24,999 | 20 (2.2%) | 18 (4.6%) |
| $25,000 to $34,999 | 100 (10.9%) | 32 (8.2%) |
| $35,000 to $49,999 | 121 (13.2%) | 61 (15.6%) |
| $50,000 to $74,999 | 163 (17.8%) | 89 (22.8%) |
| $75,000 to $99,999 | 159 (17.3%) | 48 (12.3%) |
| $100,000 to $149,999 | 179 (19.5%) | 27 (6.9%) |
| $150,000 or more | 116 (12.7%) | 23 (5.9%) |
| Total | 917 (100.0%) | 390 (100.0%) |
Monthly Housing Cost Tiers in Menominee County
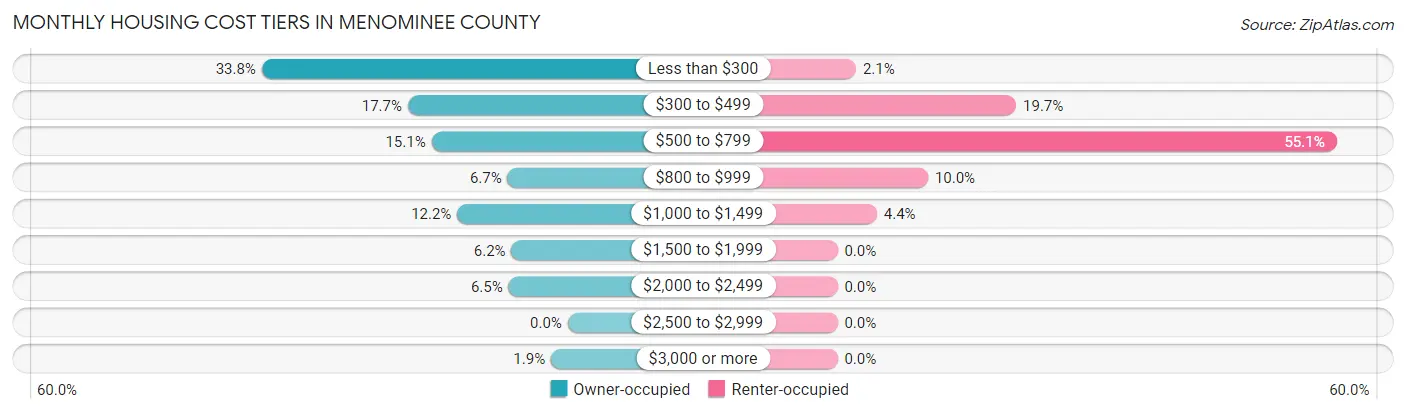
| Monthly Cost | Owner-occupied | Renter-occupied |
| Less than $300 | 310 (33.8%) | 8 (2.1%) |
| $300 to $499 | 162 (17.7%) | 77 (19.7%) |
| $500 to $799 | 138 (15.0%) | 215 (55.1%) |
| $800 to $999 | 61 (6.7%) | 39 (10.0%) |
| $1,000 to $1,499 | 112 (12.2%) | 17 (4.4%) |
| $1,500 to $1,999 | 57 (6.2%) | 0 (0.0%) |
| $2,000 to $2,499 | 60 (6.5%) | 0 (0.0%) |
| $2,500 to $2,999 | 0 (0.0%) | 0 (0.0%) |
| $3,000 or more | 17 (1.8%) | 0 (0.0%) |
| Total | 917 (100.0%) | 390 (100.0%) |
Physical Housing Characteristics in Menominee County
Housing Structures in Menominee County
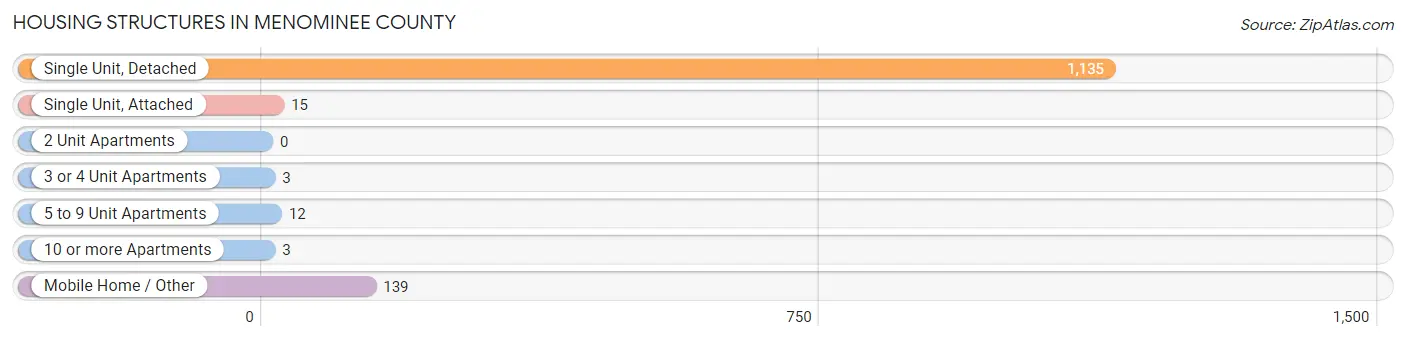
| Structure Type | # Housing Units | % Housing Units |
| Single Unit, Detached | 1,135 | 86.8% |
| Single Unit, Attached | 15 | 1.1% |
| 2 Unit Apartments | 0 | 0.0% |
| 3 or 4 Unit Apartments | 3 | 0.2% |
| 5 to 9 Unit Apartments | 12 | 0.9% |
| 10 or more Apartments | 3 | 0.2% |
| Mobile Home / Other | 139 | 10.6% |
| Total | 1,307 | 100.0% |
Housing Structures by Occupancy in Menominee County

| Structure Type | Owner-occupied | Renter-occupied |
| Single Unit, Detached | 798 (70.3%) | 337 (29.7%) |
| Single Unit, Attached | 8 (53.3%) | 7 (46.7%) |
| 2 Unit Apartments | 0 (0.0%) | 0 (0.0%) |
| 3 or 4 Unit Apartments | 0 (0.0%) | 3 (100.0%) |
| 5 to 9 Unit Apartments | 0 (0.0%) | 12 (100.0%) |
| 10 or more Apartments | 0 (0.0%) | 3 (100.0%) |
| Mobile Home / Other | 111 (79.9%) | 28 (20.1%) |
| Total | 917 (70.2%) | 390 (29.8%) |
Housing Structures by Number of Rooms in Menominee County
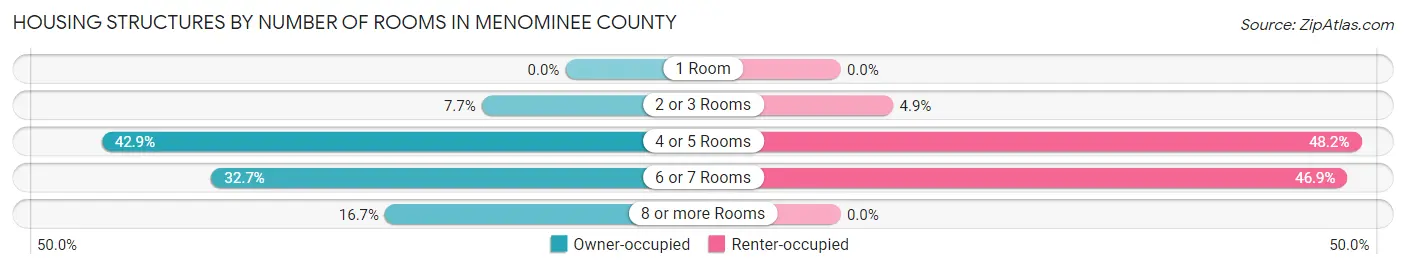
| Number of Rooms | Owner-occupied | Renter-occupied |
| 1 Room | 0 (0.0%) | 0 (0.0%) |
| 2 or 3 Rooms | 71 (7.7%) | 19 (4.9%) |
| 4 or 5 Rooms | 393 (42.9%) | 188 (48.2%) |
| 6 or 7 Rooms | 300 (32.7%) | 183 (46.9%) |
| 8 or more Rooms | 153 (16.7%) | 0 (0.0%) |
| Total | 917 (100.0%) | 390 (100.0%) |
Housing Structure by Heating Type in Menominee County
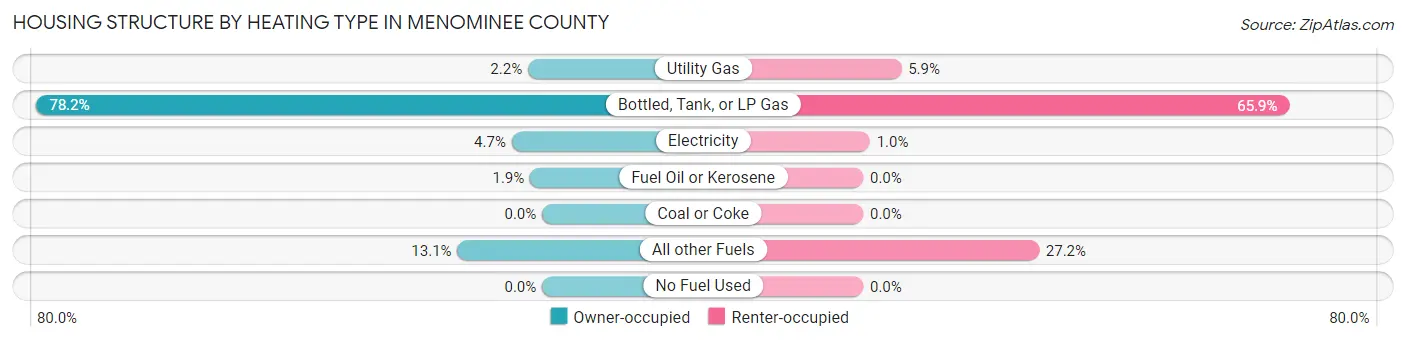
| Heating Type | Owner-occupied | Renter-occupied |
| Utility Gas | 20 (2.2%) | 23 (5.9%) |
| Bottled, Tank, or LP Gas | 717 (78.2%) | 257 (65.9%) |
| Electricity | 43 (4.7%) | 4 (1.0%) |
| Fuel Oil or Kerosene | 17 (1.8%) | 0 (0.0%) |
| Coal or Coke | 0 (0.0%) | 0 (0.0%) |
| All other Fuels | 120 (13.1%) | 106 (27.2%) |
| No Fuel Used | 0 (0.0%) | 0 (0.0%) |
| Total | 917 (100.0%) | 390 (100.0%) |
Household Vehicle Usage in Menominee County
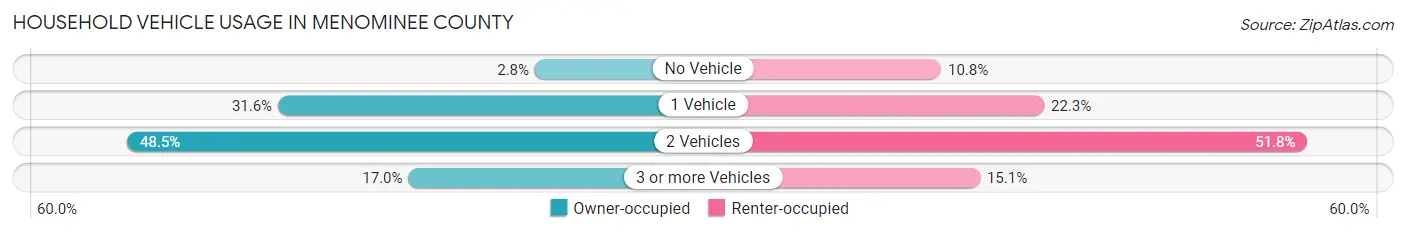
| Vehicles per Household | Owner-occupied | Renter-occupied |
| No Vehicle | 26 (2.8%) | 42 (10.8%) |
| 1 Vehicle | 290 (31.6%) | 87 (22.3%) |
| 2 Vehicles | 445 (48.5%) | 202 (51.8%) |
| 3 or more Vehicles | 156 (17.0%) | 59 (15.1%) |
| Total | 917 (100.0%) | 390 (100.0%) |
Real Estate & Mortgages in Menominee County
Real Estate and Mortgage Overview in Menominee County
| Characteristic | Without Mortgage | With Mortgage |
| Housing Units | 624 | 293 |
| Median Property Value | $86,400 | $206,300 |
| Median Household Income | $58,393 | $55 |
| Monthly Housing Costs | $301 | $17 |
| Real Estate Taxes | $2,429 | $98 |
Property Value by Mortgage Status in Menominee County
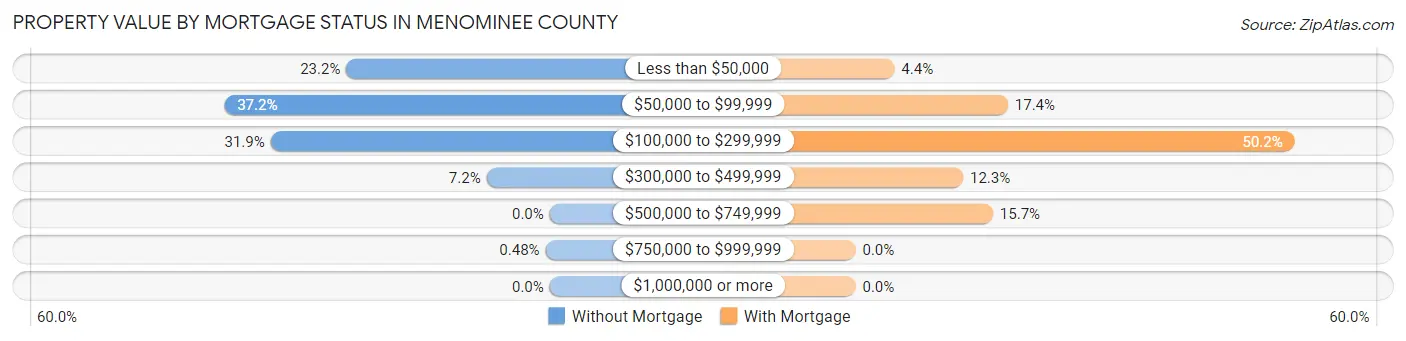
| Property Value | Without Mortgage | With Mortgage |
| Less than $50,000 | 145 (23.2%) | 13 (4.4%) |
| $50,000 to $99,999 | 232 (37.2%) | 51 (17.4%) |
| $100,000 to $299,999 | 199 (31.9%) | 147 (50.2%) |
| $300,000 to $499,999 | 45 (7.2%) | 36 (12.3%) |
| $500,000 to $749,999 | 0 (0.0%) | 46 (15.7%) |
| $750,000 to $999,999 | 3 (0.5%) | 0 (0.0%) |
| $1,000,000 or more | 0 (0.0%) | 0 (0.0%) |
| Total | 624 (100.0%) | 293 (100.0%) |
Household Income by Mortgage Status in Menominee County
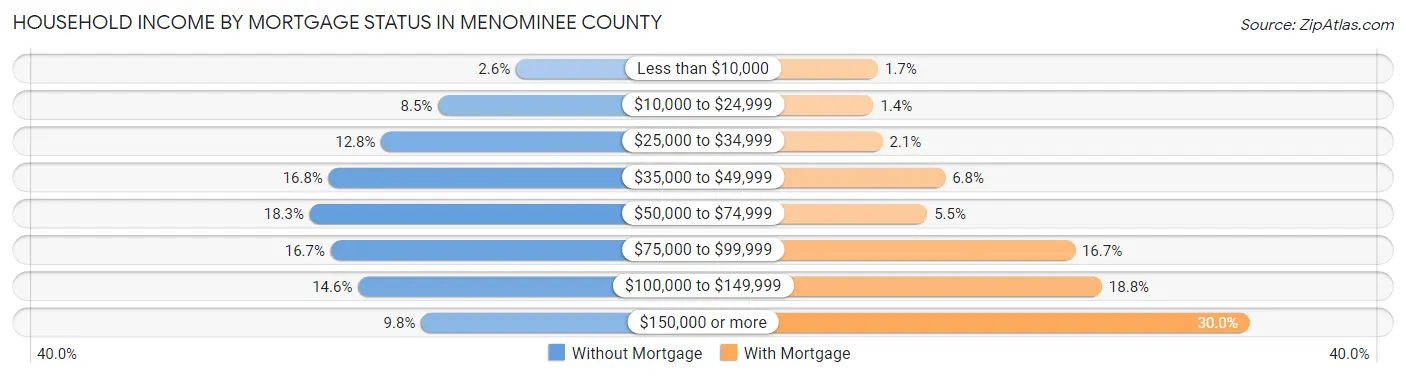
| Household Income | Without Mortgage | With Mortgage |
| Less than $10,000 | 16 (2.6%) | 5 (1.7%) |
| $10,000 to $24,999 | 53 (8.5%) | 4 (1.4%) |
| $25,000 to $34,999 | 80 (12.8%) | 6 (2.1%) |
| $35,000 to $49,999 | 105 (16.8%) | 20 (6.8%) |
| $50,000 to $74,999 | 114 (18.3%) | 16 (5.5%) |
| $75,000 to $99,999 | 104 (16.7%) | 49 (16.7%) |
| $100,000 to $149,999 | 91 (14.6%) | 55 (18.8%) |
| $150,000 or more | 61 (9.8%) | 88 (30.0%) |
| Total | 624 (100.0%) | 293 (100.0%) |
Property Value to Household Income Ratio in Menominee County
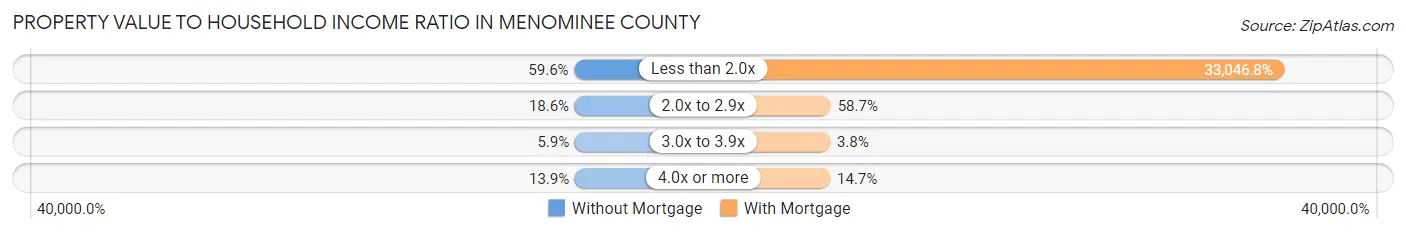
| Value-to-Income Ratio | Without Mortgage | With Mortgage |
| Less than 2.0x | 372 (59.6%) | 96,827 (33,046.8%) |
| 2.0x to 2.9x | 116 (18.6%) | 172 (58.7%) |
| 3.0x to 3.9x | 37 (5.9%) | 11 (3.7%) |
| 4.0x or more | 87 (13.9%) | 43 (14.7%) |
| Total | 624 (100.0%) | 293 (100.0%) |
Real Estate Taxes by Mortgage Status in Menominee County

| Property Taxes | Without Mortgage | With Mortgage |
| Less than $800 | 34 (5.4%) | 0 (0.0%) |
| $800 to $1,499 | 32 (5.1%) | 0 (0.0%) |
| $800 to $1,499 | 90 (14.4%) | 11 (3.7%) |
| Total | 624 (100.0%) | 293 (100.0%) |
Health & Disability in Menominee County
Health Insurance Coverage by Age in Menominee County
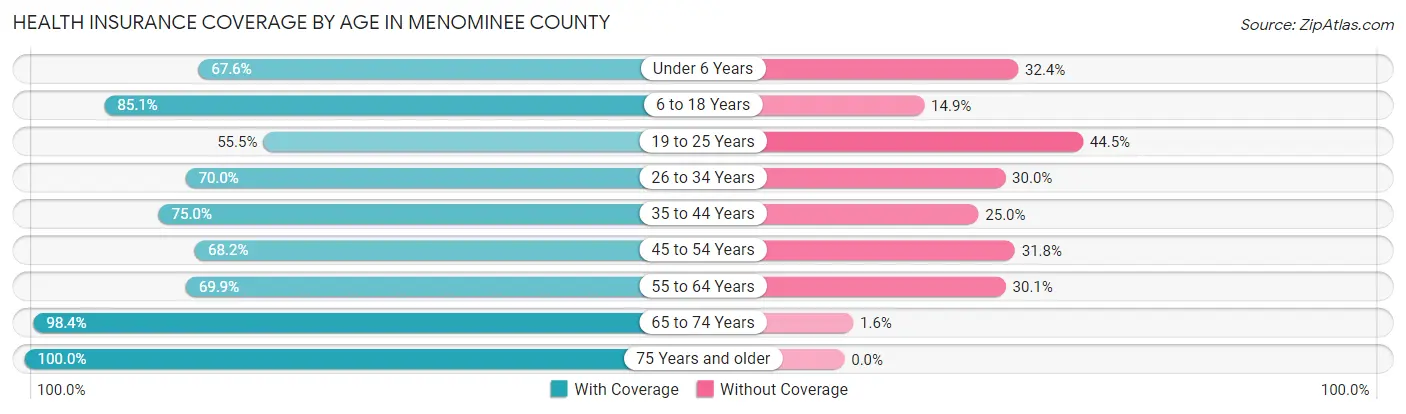
| Age Bracket | With Coverage | Without Coverage |
| Under 6 Years | 294 (67.6%) | 141 (32.4%) |
| 6 to 18 Years | 840 (85.1%) | 147 (14.9%) |
| 19 to 25 Years | 232 (55.5%) | 186 (44.5%) |
| 26 to 34 Years | 301 (70.0%) | 129 (30.0%) |
| 35 to 44 Years | 252 (75.0%) | 84 (25.0%) |
| 45 to 54 Years | 294 (68.2%) | 137 (31.8%) |
| 55 to 64 Years | 430 (69.9%) | 185 (30.1%) |
| 65 to 74 Years | 421 (98.4%) | 7 (1.6%) |
| 75 Years and older | 180 (100.0%) | 0 (0.0%) |
| Total | 3,244 (76.1%) | 1,016 (23.8%) |
Health Insurance Coverage by Citizenship Status in Menominee County

| Citizenship Status | With Coverage | Without Coverage |
| Native Born | 294 (67.6%) | 141 (32.4%) |
| Foreign Born, Citizen | 840 (85.1%) | 147 (14.9%) |
| Foreign Born, not a Citizen | 232 (55.5%) | 186 (44.5%) |
Health Insurance Coverage by Household Income in Menominee County
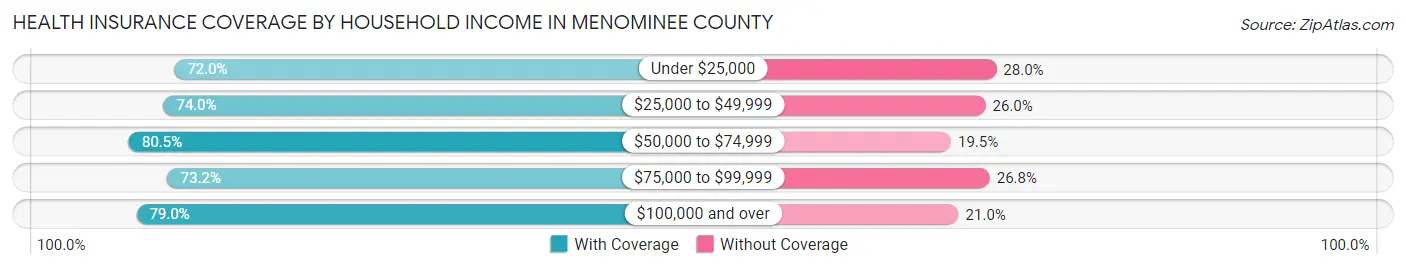
| Household Income | With Coverage | Without Coverage |
| Under $25,000 | 434 (72.0%) | 169 (28.0%) |
| $25,000 to $49,999 | 655 (74.0%) | 230 (26.0%) |
| $50,000 to $74,999 | 614 (80.5%) | 149 (19.5%) |
| $75,000 to $99,999 | 530 (73.2%) | 194 (26.8%) |
| $100,000 and over | 992 (79.0%) | 263 (21.0%) |
Public vs Private Health Insurance Coverage by Age in Menominee County
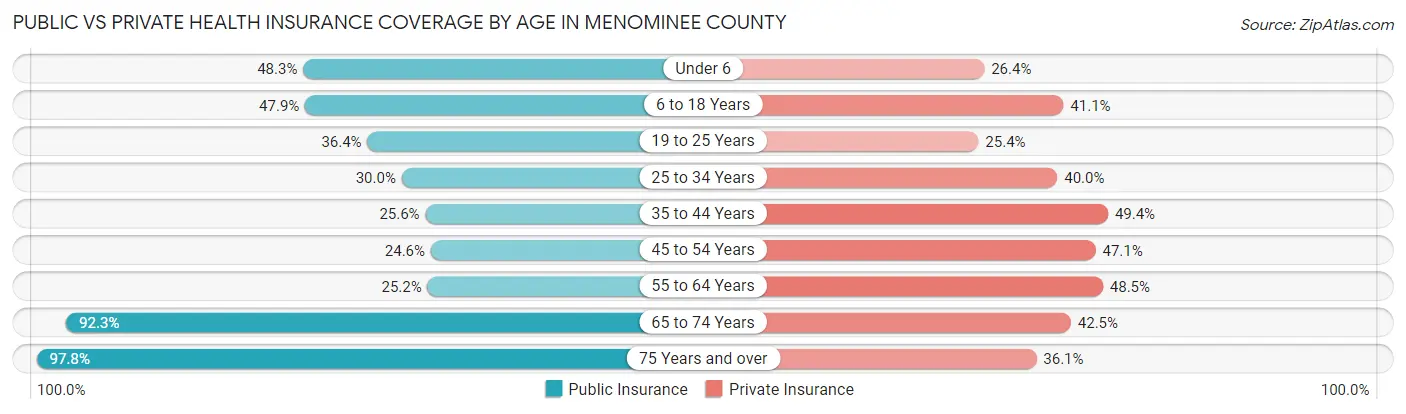
| Age Bracket | Public Insurance | Private Insurance |
| Under 6 | 210 (48.3%) | 115 (26.4%) |
| 6 to 18 Years | 473 (47.9%) | 406 (41.1%) |
| 19 to 25 Years | 152 (36.4%) | 106 (25.4%) |
| 25 to 34 Years | 129 (30.0%) | 172 (40.0%) |
| 35 to 44 Years | 86 (25.6%) | 166 (49.4%) |
| 45 to 54 Years | 106 (24.6%) | 203 (47.1%) |
| 55 to 64 Years | 155 (25.2%) | 298 (48.5%) |
| 65 to 74 Years | 395 (92.3%) | 182 (42.5%) |
| 75 Years and over | 176 (97.8%) | 65 (36.1%) |
| Total | 1,882 (44.2%) | 1,713 (40.2%) |
Disability Status by Sex by Age in Menominee County
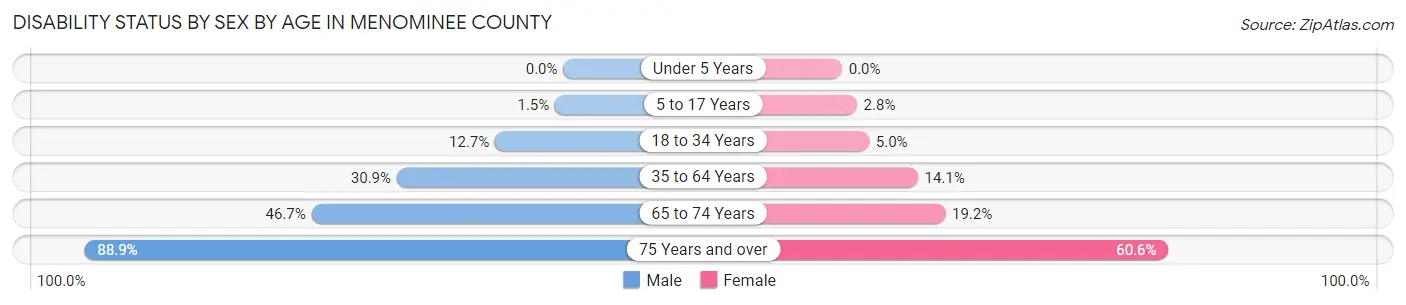
| Age Bracket | Male | Female |
| Under 5 Years | 0 (0.0%) | 0 (0.0%) |
| 5 to 17 Years | 9 (1.5%) | 12 (2.8%) |
| 18 to 34 Years | 55 (12.7%) | 23 (5.0%) |
| 35 to 64 Years | 203 (30.9%) | 102 (14.1%) |
| 65 to 74 Years | 100 (46.7%) | 41 (19.2%) |
| 75 Years and over | 72 (88.9%) | 60 (60.6%) |
Disability Class by Sex by Age in Menominee County
Disability Class: Hearing Difficulty
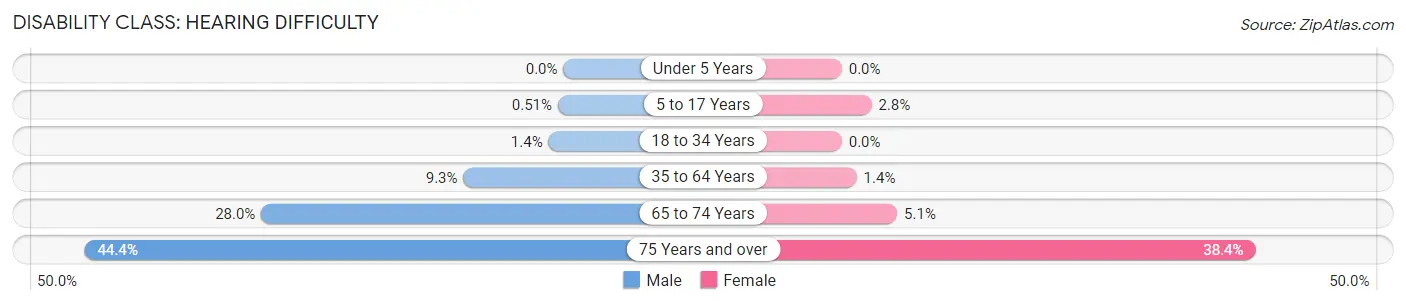
| Age Bracket | Male | Female |
| Under 5 Years | 0 (0.0%) | 0 (0.0%) |
| 5 to 17 Years | 3 (0.5%) | 12 (2.8%) |
| 18 to 34 Years | 6 (1.4%) | 0 (0.0%) |
| 35 to 64 Years | 61 (9.3%) | 10 (1.4%) |
| 65 to 74 Years | 60 (28.0%) | 11 (5.1%) |
| 75 Years and over | 36 (44.4%) | 38 (38.4%) |
Disability Class: Vision Difficulty
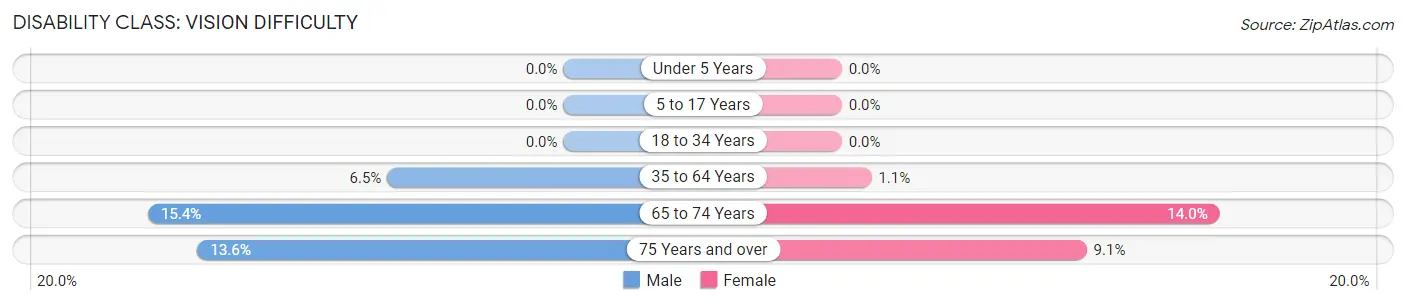
| Age Bracket | Male | Female |
| Under 5 Years | 0 (0.0%) | 0 (0.0%) |
| 5 to 17 Years | 0 (0.0%) | 0 (0.0%) |
| 18 to 34 Years | 0 (0.0%) | 0 (0.0%) |
| 35 to 64 Years | 43 (6.5%) | 8 (1.1%) |
| 65 to 74 Years | 33 (15.4%) | 30 (14.0%) |
| 75 Years and over | 11 (13.6%) | 9 (9.1%) |
Disability Class: Cognitive Difficulty
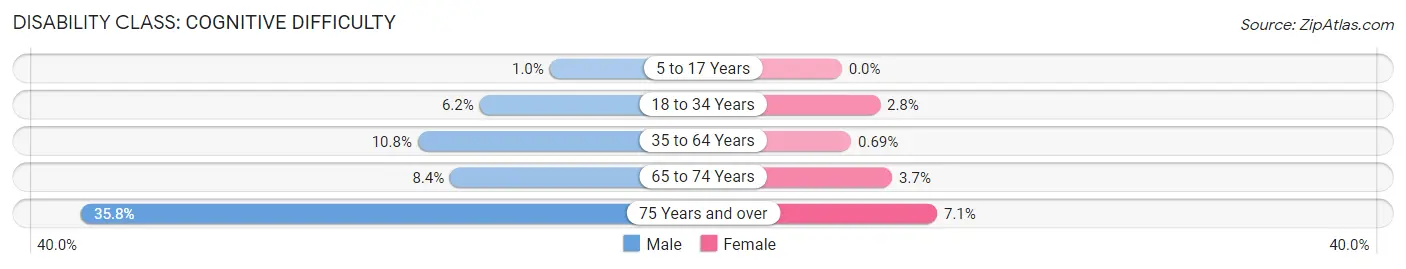
| Age Bracket | Male | Female |
| 5 to 17 Years | 6 (1.0%) | 0 (0.0%) |
| 18 to 34 Years | 27 (6.2%) | 13 (2.8%) |
| 35 to 64 Years | 71 (10.8%) | 5 (0.7%) |
| 65 to 74 Years | 18 (8.4%) | 8 (3.7%) |
| 75 Years and over | 29 (35.8%) | 7 (7.1%) |
Disability Class: Ambulatory Difficulty
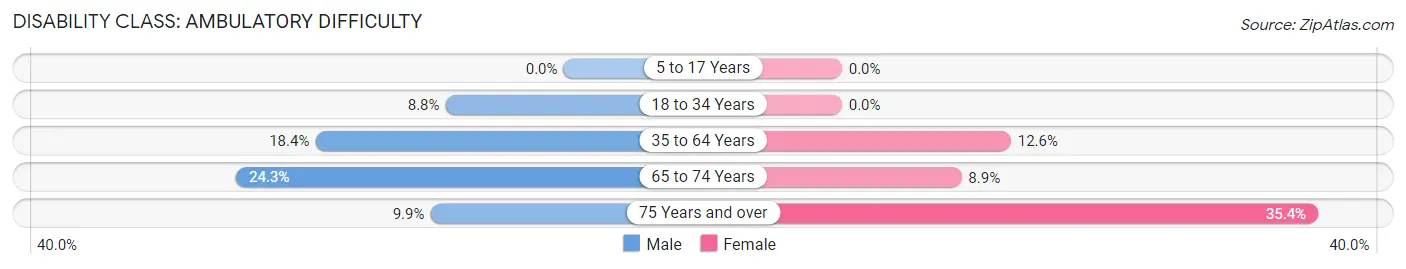
| Age Bracket | Male | Female |
| 5 to 17 Years | 0 (0.0%) | 0 (0.0%) |
| 18 to 34 Years | 38 (8.8%) | 0 (0.0%) |
| 35 to 64 Years | 121 (18.4%) | 91 (12.6%) |
| 65 to 74 Years | 52 (24.3%) | 19 (8.9%) |
| 75 Years and over | 8 (9.9%) | 35 (35.3%) |
Disability Class: Self-Care Difficulty
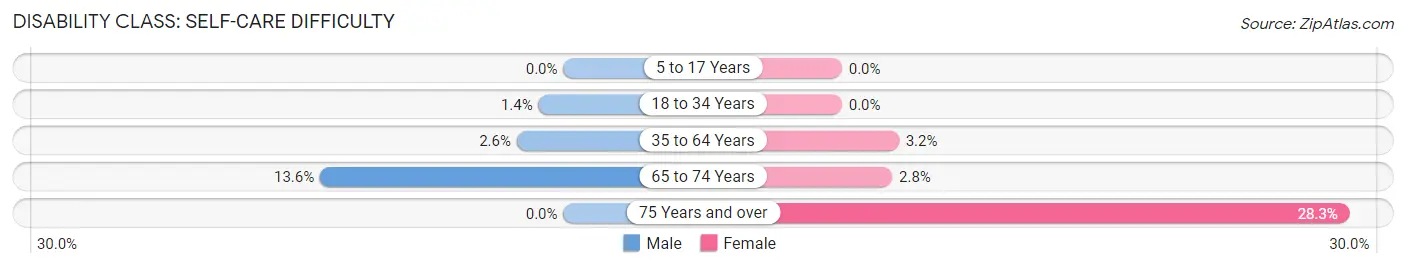
| Age Bracket | Male | Female |
| 5 to 17 Years | 0 (0.0%) | 0 (0.0%) |
| 18 to 34 Years | 6 (1.4%) | 0 (0.0%) |
| 35 to 64 Years | 17 (2.6%) | 23 (3.2%) |
| 65 to 74 Years | 29 (13.6%) | 6 (2.8%) |
| 75 Years and over | 0 (0.0%) | 28 (28.3%) |
Technology Access in Menominee County
Computing Device Access in Menominee County
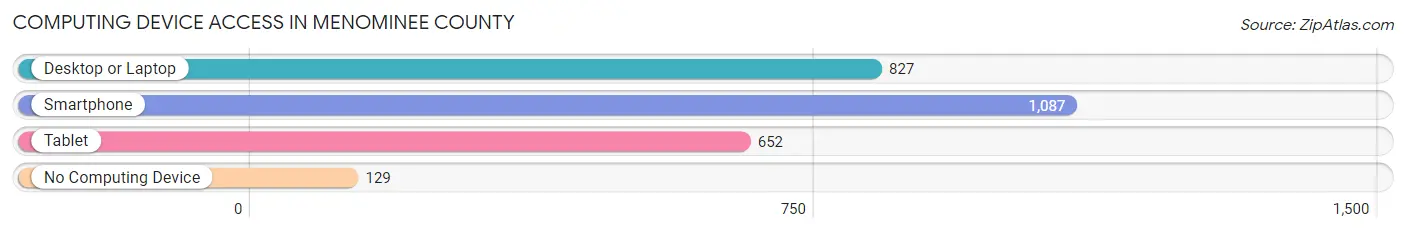
| Device Type | # Households | % Households |
| Desktop or Laptop | 827 | 63.3% |
| Smartphone | 1,087 | 83.2% |
| Tablet | 652 | 49.9% |
| No Computing Device | 129 | 9.9% |
| Total | 1,307 | 100.0% |
Internet Access in Menominee County
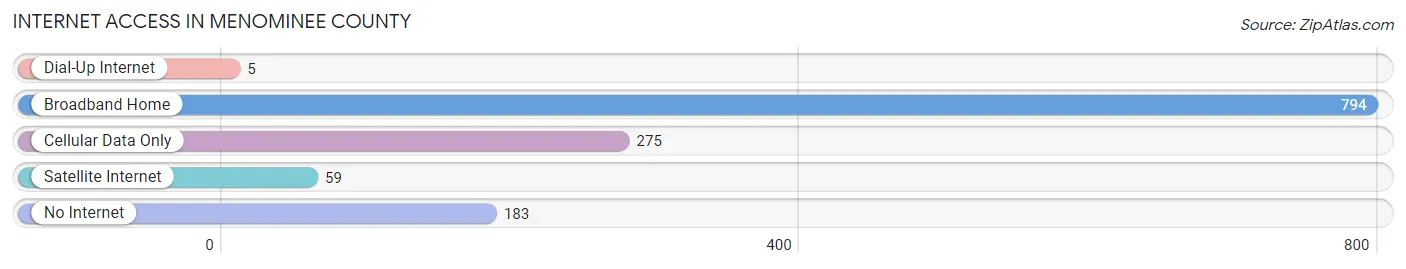
| Internet Type | # Households | % Households |
| Dial-Up Internet | 5 | 0.4% |
| Broadband Home | 794 | 60.8% |
| Cellular Data Only | 275 | 21.0% |
| Satellite Internet | 59 | 4.5% |
| No Internet | 183 | 14.0% |
| Total | 1,307 | 100.0% |
Menominee County Summary
Menominee County is located in the northeastern corner of Wisconsin, and is bordered by the states of Michigan and Illinois. It is part of the Central Wisconsin region and is the only county in the state that is entirely within the Menominee Indian Reservation. The county seat is Keshena, and the population was 4,232 at the 2010 census.
History
Menominee County was established in 1854, and was named after the Menominee tribe, which had inhabited the area for centuries. The tribe had been forced to cede much of their land to the United States government in the 1836 Treaty of the Cedars. The county was originally part of Shawano County, but was split off in 1854.
The county was home to a number of lumber mills in the late 19th and early 20th centuries, and the area was heavily logged. The county was also home to a number of small farming communities, and the population grew steadily throughout the 19th century.
In 1961, the Menominee Indian Tribe of Wisconsin was officially recognized by the federal government, and the Menominee Indian Reservation was established. This reservation covers the entire county, and is the only county in the state that is entirely within an Indian reservation.
Geography
Menominee County is located in the northeastern corner of Wisconsin, and is bordered by the states of Michigan and Illinois. It is part of the Central Wisconsin region and is the only county in the state that is entirely within the Menominee Indian Reservation. The county has a total area of 545 square miles, of which 544 square miles is land and 1.2 square miles is water.
The county is mostly flat, with some rolling hills in the western part of the county. The Wolf River runs through the county, and there are several small lakes and ponds scattered throughout the area. The county is heavily forested, with a mix of hardwood and coniferous trees.
Economy
The economy of Menominee County is largely based on agriculture and forestry. The county is home to a number of small farms, and the area is heavily logged. The county is also home to a number of small businesses, including restaurants, retail stores, and service providers.
The Menominee Indian Tribe is the largest employer in the county, and the tribe operates a number of businesses, including a casino, a hotel, and a golf course. The tribe also operates a number of government programs, including health care, education, and social services.
Demographics
As of the 2010 census, there were 4,232 people, 1,541 households, and 1,093 families living in Menominee County. The population density was 8 people per square mile. The racial makeup of the county was 85.3% Native American, 8.2% White, 0.2% African American, 0.2% Asian, 0.1% Pacific Islander, 0.2% from other races, and 5.9% from two or more races. Hispanic or Latino of any race were 1.3% of the population.
The median income for a household in the county was $30,938, and the median income for a family was $35,938. The per capita income for the county was $14,945. About 22.2% of families and 28.2% of the population were below the poverty line, including 37.2% of those under age 18 and 16.2% of those age 65 or over.
Common Questions
What is the Total Population of Menominee County?
Total Population of Menominee County is 4,279.
What is the Total Male Population of Menominee County?
Total Male Population of Menominee County is 2,185.
What is the Total Female Population of Menominee County?
Total Female Population of Menominee County is 2,094.
What is the Ratio of Males per 100 Females in Menominee County?
There are 104.35 Males per 100 Females in Menominee County.
What is the Ratio of Females per 100 Males in Menominee County?
There are 95.84 Females per 100 Males in Menominee County.
What is the Median Population Age in Menominee County?
Median Population Age in Menominee County is 32.1 Years.
What is the Average Family Size in Menominee County
Average Family Size in Menominee County is 3.6 People.
What is the Average Household Size in Menominee County
Average Household Size in Menominee County is 3.2 People.
What is Per Capita Income in Menominee County?
Per Capita income in Menominee County is $24,004.
What is the Median Family Income in Menominee County?
Median Family Income in Menominee County is $65,938.
What is the Median Household income in Menominee County?
Median Household Income in Menominee County is $62,194.
What is Income or Wage Gap in Menominee County?
Income or Wage Gap in Menominee County is 1.9%.
Women in Menominee County earn 98.1 cents for every dollar earned by a man.
What is Family Income Deficit in Menominee County?
Family Income Deficit in Menominee County is $17,312.
Families that are below poverty line in Menominee County earn $17,312 less on average than the poverty threshold level.
What is Inequality or Gini Index in Menominee County?
Inequality or Gini Index in Menominee County is 0.43.
How Large is the Labor Force in Menominee County?
There are 1,570 People in the Labor Forcein in Menominee County.
What is the Percentage of People in the Labor Force in Menominee County?
51.2% of People are in the Labor Force in Menominee County.
What is the Unemployment Rate in Menominee County?
Unemployment Rate in Menominee County is 10.7%.