Marinette County, WI
Marinette County Map
Marinette County Overview
41,827
TOTAL POPULATION
21,241
MALE POPULATION
20,586
FEMALE POPULATION
103.18
MALES / 100 FEMALES
96.92
FEMALES / 100 MALES
48.8
MEDIAN AGE
2.8
AVG FAMILY SIZE
2.2
AVG HOUSEHOLD SIZE
$33,952
PER CAPITA INCOME
$71,343
AVG FAMILY INCOME
$60,347
AVG HOUSEHOLD INCOME
40.6%
WAGE / INCOME GAP [ % ]
59.4¢/ $1
WAGE / INCOME GAP [ $ ]
$8,479
FAMILY INCOME DEFICIT
0.41
INEQUALITY / GINI INDEX
19,882
LABOR FORCE [ PEOPLE ]
57.0%
PERCENT IN LABOR FORCE
3.8%
UNEMPLOYMENT RATE
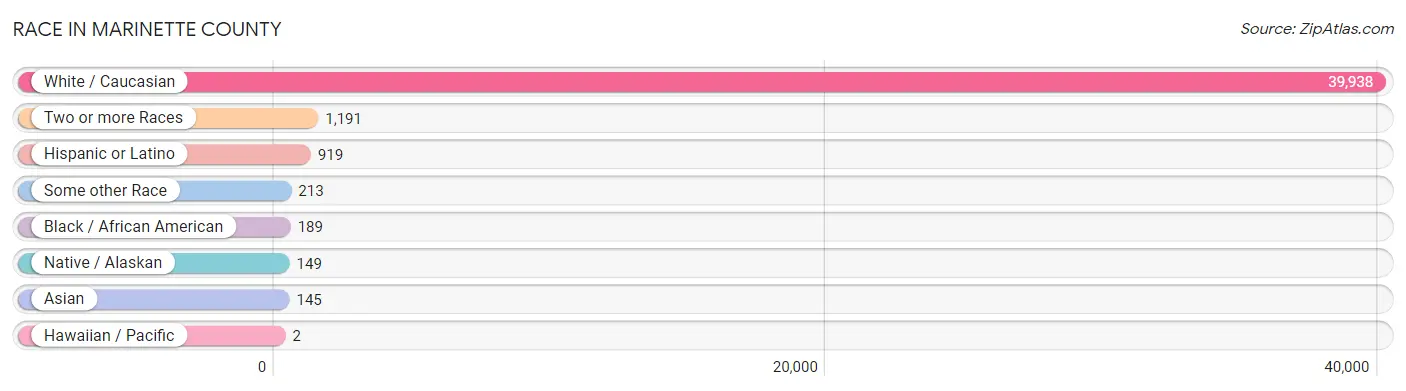
Race in Marinette County
The most populous races in Marinette County are White / Caucasian (39,938 | 95.5%), Two or more Races (1,191 | 2.9%), and Hispanic or Latino (919 | 2.2%).
| Race | # Population | % Population |
| Asian | 145 | 0.4% |
| Black / African American | 189 | 0.4% |
| Hawaiian / Pacific | 2 | 0.0% |
| Hispanic or Latino | 919 | 2.2% |
| Native / Alaskan | 149 | 0.4% |
| White / Caucasian | 39,938 | 95.5% |
| Two or more Races | 1,191 | 2.9% |
| Some other Race | 213 | 0.5% |
| Total | 41,827 | 100.0% |
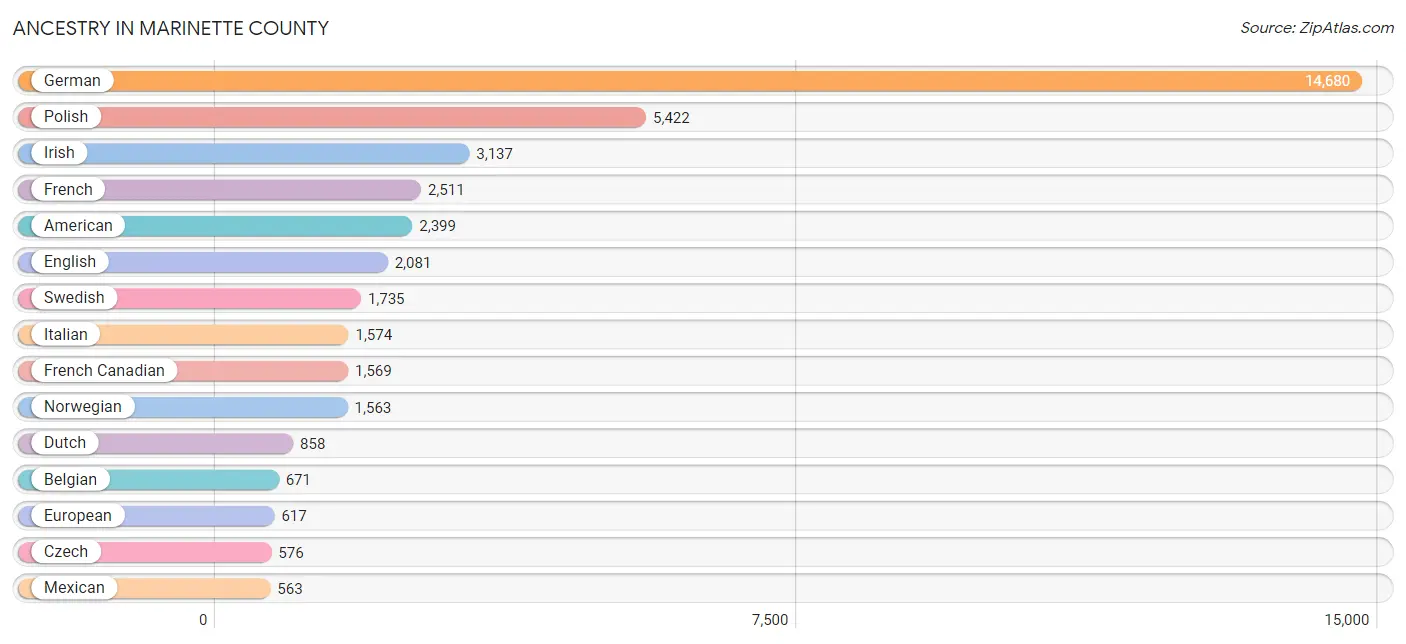
Ancestry in Marinette County
The most populous ancestries reported in Marinette County are German (14,680 | 35.1%), Polish (5,422 | 13.0%), Irish (3,137 | 7.5%), French (2,511 | 6.0%), and American (2,399 | 5.7%), together accounting for 67.3% of all Marinette County residents.
| Ancestry | # Population | % Population |
| African | 4 | 0.0% |
| American | 2,399 | 5.7% |
| Apache | 3 | 0.0% |
| Arab | 125 | 0.3% |
| Austrian | 161 | 0.4% |
| Bangladeshi | 3 | 0.0% |
| Belgian | 671 | 1.6% |
| Bhutanese | 122 | 0.3% |
| Blackfeet | 9 | 0.0% |
| Brazilian | 3 | 0.0% |
| British | 98 | 0.2% |
| Burmese | 15 | 0.0% |
| Canadian | 28 | 0.1% |
| Celtic | 7 | 0.0% |
| Central American | 20 | 0.1% |
| Central American Indian | 24 | 0.1% |
| Cherokee | 13 | 0.0% |
| Cheyenne | 1 | 0.0% |
| Chippewa | 226 | 0.5% |
| Choctaw | 15 | 0.0% |
| Croatian | 108 | 0.3% |
| Cuban | 3 | 0.0% |
| Czech | 576 | 1.4% |
| Czechoslovakian | 65 | 0.2% |
| Danish | 376 | 0.9% |
| Dutch | 858 | 2.1% |
| Eastern European | 86 | 0.2% |
| Ecuadorian | 13 | 0.0% |
| Egyptian | 74 | 0.2% |
| English | 2,081 | 5.0% |
| European | 617 | 1.5% |
| Finnish | 493 | 1.2% |
| French | 2,511 | 6.0% |
| French American Indian | 15 | 0.0% |
| French Canadian | 1,569 | 3.7% |
| German | 14,680 | 35.1% |
| Greek | 46 | 0.1% |
| Honduran | 5 | 0.0% |
| Hungarian | 105 | 0.3% |
| Icelander | 1 | 0.0% |
| Indian (Asian) | 35 | 0.1% |
| Iranian | 12 | 0.0% |
| Irish | 3,137 | 7.5% |
| Iroquois | 42 | 0.1% |
| Italian | 1,574 | 3.8% |
| Korean | 85 | 0.2% |
| Latvian | 24 | 0.1% |
| Lebanese | 29 | 0.1% |
| Lithuanian | 60 | 0.1% |
| Luxembourger | 20 | 0.1% |
| Menominee | 18 | 0.0% |
| Mexican | 563 | 1.3% |
| Moroccan | 10 | 0.0% |
| Native Hawaiian | 9 | 0.0% |
| Navajo | 42 | 0.1% |
| Nigerian | 38 | 0.1% |
| Northern European | 12 | 0.0% |
| Norwegian | 1,563 | 3.7% |
| Ottawa | 2 | 0.0% |
| Pakistani | 9 | 0.0% |
| Palestinian | 11 | 0.0% |
| Polish | 5,422 | 13.0% |
| Portuguese | 20 | 0.1% |
| Potawatomi | 28 | 0.1% |
| Puerto Rican | 248 | 0.6% |
| Romanian | 4 | 0.0% |
| Russian | 309 | 0.7% |
| Salvadoran | 15 | 0.0% |
| Scandinavian | 526 | 1.3% |
| Scotch-Irish | 41 | 0.1% |
| Scottish | 339 | 0.8% |
| Serbian | 28 | 0.1% |
| Sioux | 8 | 0.0% |
| Slavic | 47 | 0.1% |
| Slovak | 32 | 0.1% |
| Slovene | 80 | 0.2% |
| South American | 13 | 0.0% |
| Spaniard | 59 | 0.1% |
| Spanish | 2 | 0.0% |
| Sri Lankan | 5 | 0.0% |
| Subsaharan African | 88 | 0.2% |
| Sudanese | 46 | 0.1% |
| Swedish | 1,735 | 4.2% |
| Swiss | 102 | 0.2% |
| Syrian | 1 | 0.0% |
| Thai | 13 | 0.0% |
| Ukrainian | 44 | 0.1% |
| Welsh | 107 | 0.3% |
| Yugoslavian | 11 | 0.0% | View All 89 Rows |
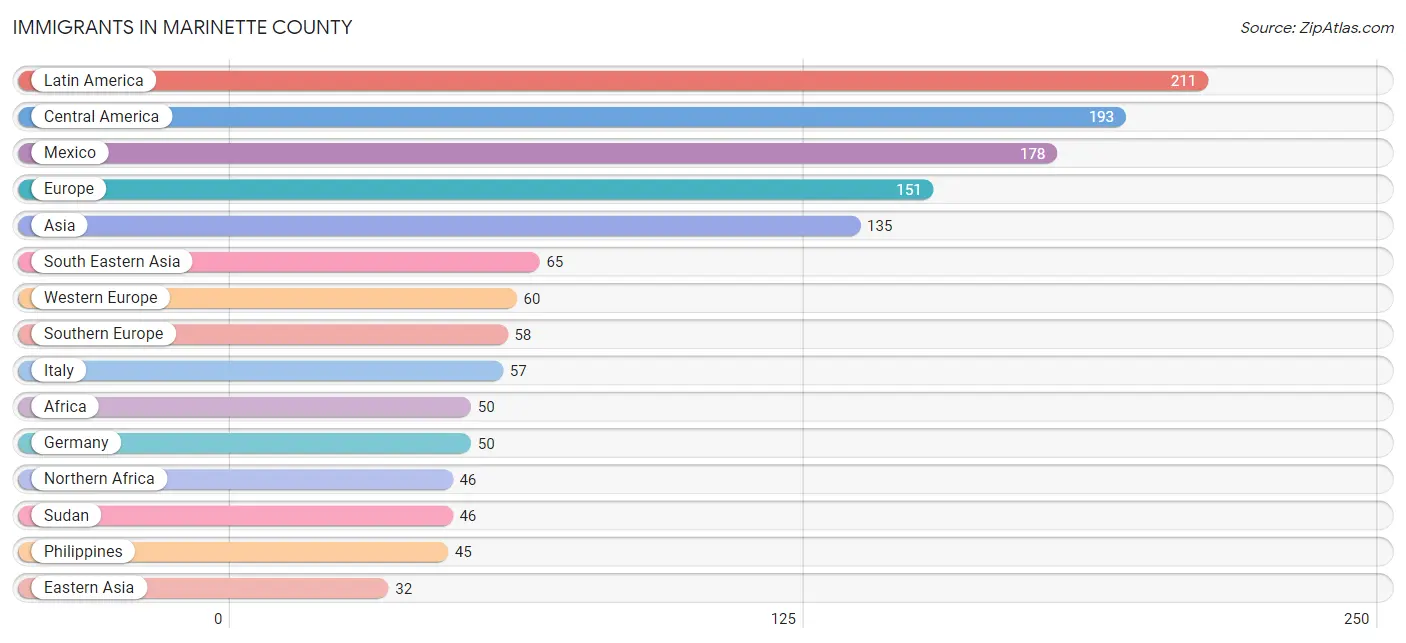
Immigrants in Marinette County
The most numerous immigrant groups reported in Marinette County came from Latin America (211 | 0.5%), Central America (193 | 0.5%), Mexico (178 | 0.4%), Europe (151 | 0.4%), and Asia (135 | 0.3%), together accounting for 2.1% of all Marinette County residents.
| Immigration Origin | # Population | % Population |
| Africa | 50 | 0.1% |
| Asia | 135 | 0.3% |
| Austria | 10 | 0.0% |
| Brazil | 6 | 0.0% |
| Canada | 10 | 0.0% |
| Central America | 193 | 0.5% |
| China | 21 | 0.1% |
| Croatia | 2 | 0.0% |
| Eastern Africa | 4 | 0.0% |
| Eastern Asia | 32 | 0.1% |
| Eastern Europe | 25 | 0.1% |
| Ecuador | 12 | 0.0% |
| El Salvador | 4 | 0.0% |
| England | 3 | 0.0% |
| Ethiopia | 4 | 0.0% |
| Europe | 151 | 0.4% |
| Germany | 50 | 0.1% |
| Honduras | 5 | 0.0% |
| Hong Kong | 9 | 0.0% |
| Italy | 57 | 0.1% |
| Jordan | 25 | 0.1% |
| Kazakhstan | 13 | 0.0% |
| Korea | 11 | 0.0% |
| Latin America | 211 | 0.5% |
| Latvia | 3 | 0.0% |
| Malaysia | 8 | 0.0% |
| Mexico | 178 | 0.4% |
| Nicaragua | 6 | 0.0% |
| Northern Africa | 46 | 0.1% |
| Northern Europe | 8 | 0.0% |
| Philippines | 45 | 0.1% |
| Poland | 16 | 0.0% |
| Scotland | 1 | 0.0% |
| South America | 18 | 0.0% |
| South Central Asia | 13 | 0.0% |
| South Eastern Asia | 65 | 0.2% |
| Southern Europe | 58 | 0.1% |
| Spain | 1 | 0.0% |
| Sudan | 46 | 0.1% |
| Thailand | 9 | 0.0% |
| Vietnam | 3 | 0.0% |
| Western Asia | 25 | 0.1% |
| Western Europe | 60 | 0.1% | View All 43 Rows |
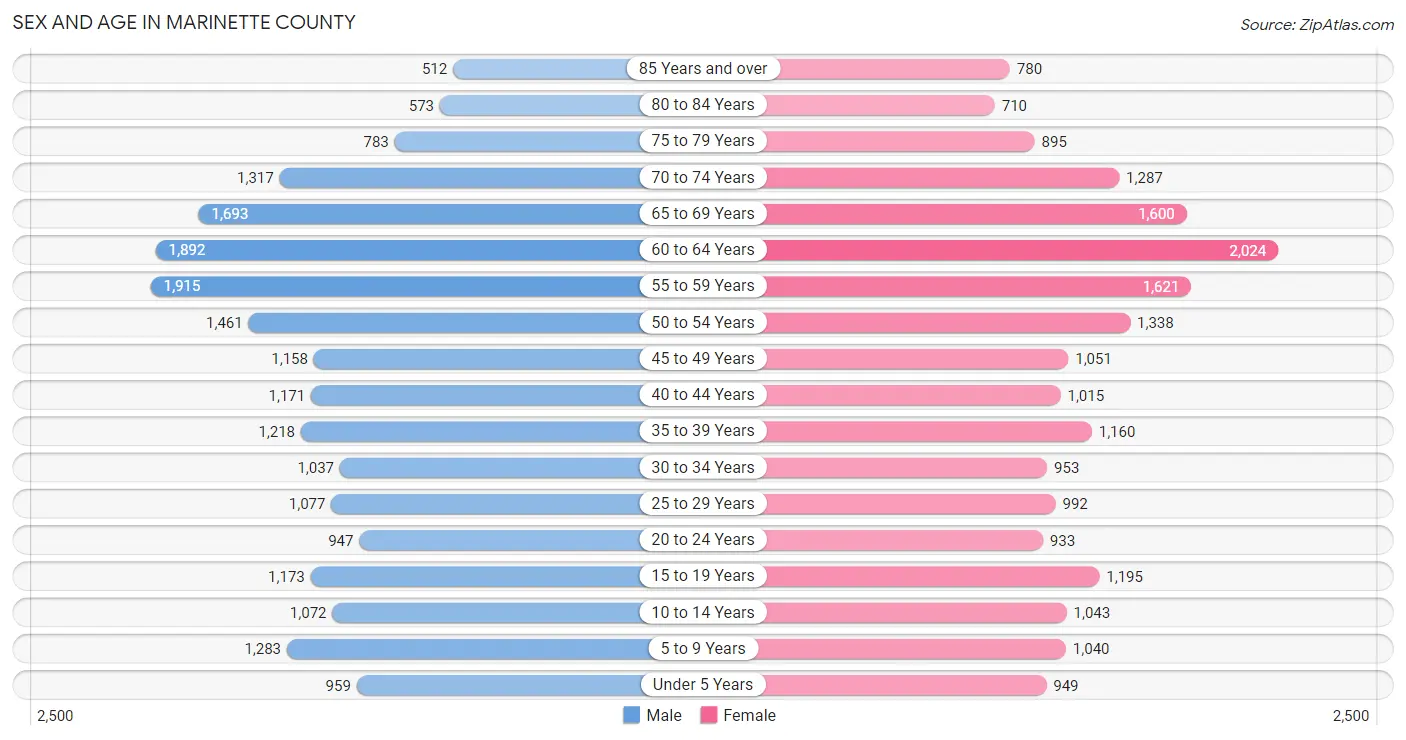
Sex and Age in Marinette County
Sex and Age in Marinette County
The most populous age groups in Marinette County are 55 to 59 Years (1,915 | 9.0%) for men and 60 to 64 Years (2,024 | 9.8%) for women.
| Age Bracket | Male | Female |
| Under 5 Years | 959 (4.5%) | 949 (4.6%) |
| 5 to 9 Years | 1,283 (6.0%) | 1,040 (5.1%) |
| 10 to 14 Years | 1,072 (5.1%) | 1,043 (5.1%) |
| 15 to 19 Years | 1,173 (5.5%) | 1,195 (5.8%) |
| 20 to 24 Years | 947 (4.5%) | 933 (4.5%) |
| 25 to 29 Years | 1,077 (5.1%) | 992 (4.8%) |
| 30 to 34 Years | 1,037 (4.9%) | 953 (4.6%) |
| 35 to 39 Years | 1,218 (5.7%) | 1,160 (5.6%) |
| 40 to 44 Years | 1,171 (5.5%) | 1,015 (4.9%) |
| 45 to 49 Years | 1,158 (5.4%) | 1,051 (5.1%) |
| 50 to 54 Years | 1,461 (6.9%) | 1,338 (6.5%) |
| 55 to 59 Years | 1,915 (9.0%) | 1,621 (7.9%) |
| 60 to 64 Years | 1,892 (8.9%) | 2,024 (9.8%) |
| 65 to 69 Years | 1,693 (8.0%) | 1,600 (7.8%) |
| 70 to 74 Years | 1,317 (6.2%) | 1,287 (6.2%) |
| 75 to 79 Years | 783 (3.7%) | 895 (4.3%) |
| 80 to 84 Years | 573 (2.7%) | 710 (3.5%) |
| 85 Years and over | 512 (2.4%) | 780 (3.8%) |
| Total | 21,241 (100.0%) | 20,586 (100.0%) |
Families and Households in Marinette County
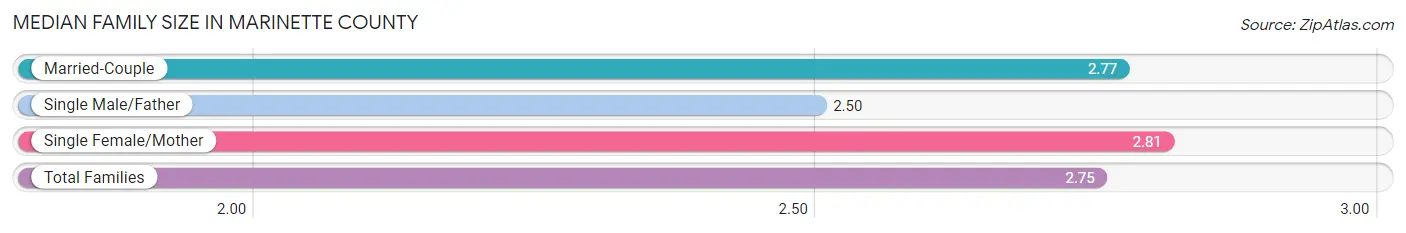
Median Family Size in Marinette County
The median family size in Marinette County is 2.75 persons per family, with single female/mother families (1,357 | 12.0%) accounting for the largest median family size of 2.81 persons per family. On the other hand, single male/father families (915 | 8.1%) represent the smallest median family size with 2.50 persons per family.
| Family Type | # Families | Family Size |
| Married-Couple | 9,076 (80.0%) | 2.77 |
| Single Male/Father | 915 (8.1%) | 2.50 |
| Single Female/Mother | 1,357 (12.0%) | 2.81 |
| Total Families | 11,348 (100.0%) | 2.75 |
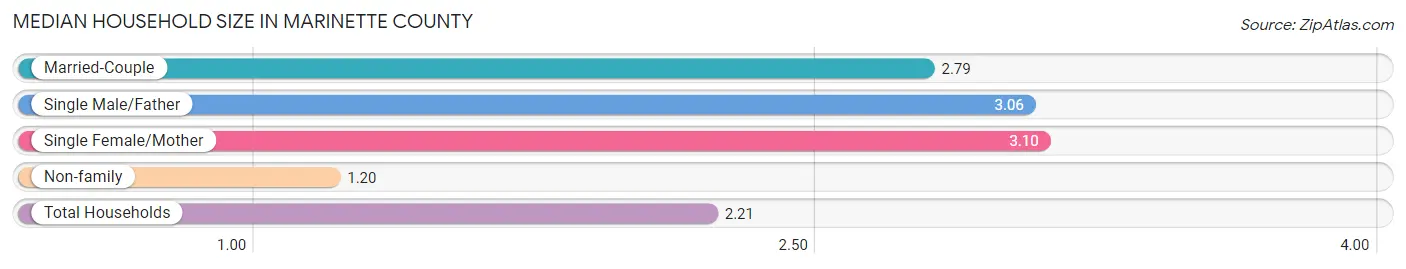
Median Household Size in Marinette County
The median household size in Marinette County is 2.21 persons per household, with single female/mother households (1,357 | 7.3%) accounting for the largest median household size of 3.1 persons per household. non-family households (7,221 | 38.9%) represent the smallest median household size with 1.20 persons per household.
| Household Type | # Households | Household Size |
| Married-Couple | 9,076 (48.9%) | 2.79 |
| Single Male/Father | 915 (4.9%) | 3.06 |
| Single Female/Mother | 1,357 (7.3%) | 3.10 |
| Non-family | 7,221 (38.9%) | 1.20 |
| Total Households | 18,569 (100.0%) | 2.21 |
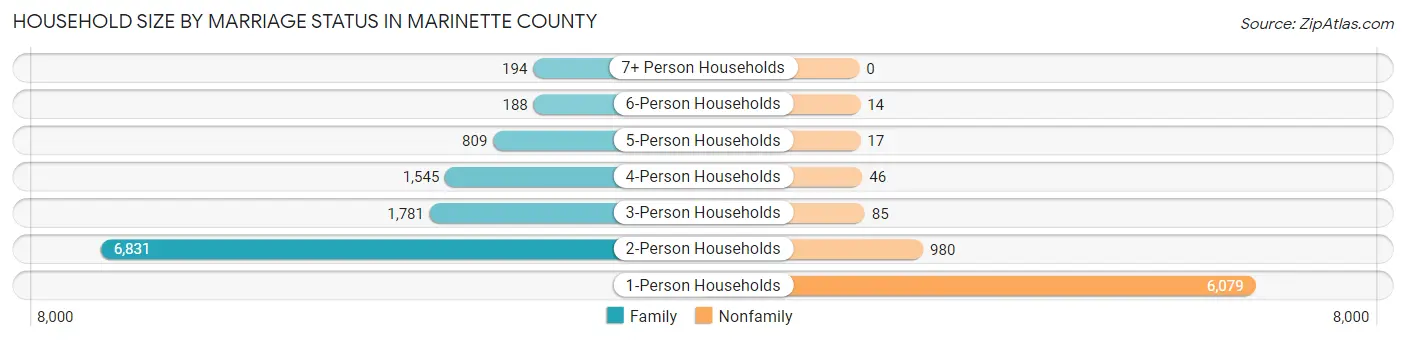
Household Size by Marriage Status in Marinette County
Out of a total of 18,569 households in Marinette County, 11,348 (61.1%) are family households, while 7,221 (38.9%) are nonfamily households. The most numerous type of family households are 2-person households, comprising 6,831, and the most common type of nonfamily households are 1-person households, comprising 6,079.
| Household Size | Family Households | Nonfamily Households |
| 1-Person Households | - | 6,079 (32.7%) |
| 2-Person Households | 6,831 (36.8%) | 980 (5.3%) |
| 3-Person Households | 1,781 (9.6%) | 85 (0.5%) |
| 4-Person Households | 1,545 (8.3%) | 46 (0.3%) |
| 5-Person Households | 809 (4.4%) | 17 (0.1%) |
| 6-Person Households | 188 (1.0%) | 14 (0.1%) |
| 7+ Person Households | 194 (1.0%) | 0 (0.0%) |
| Total | 11,348 (61.1%) | 7,221 (38.9%) |
Female Fertility in Marinette County
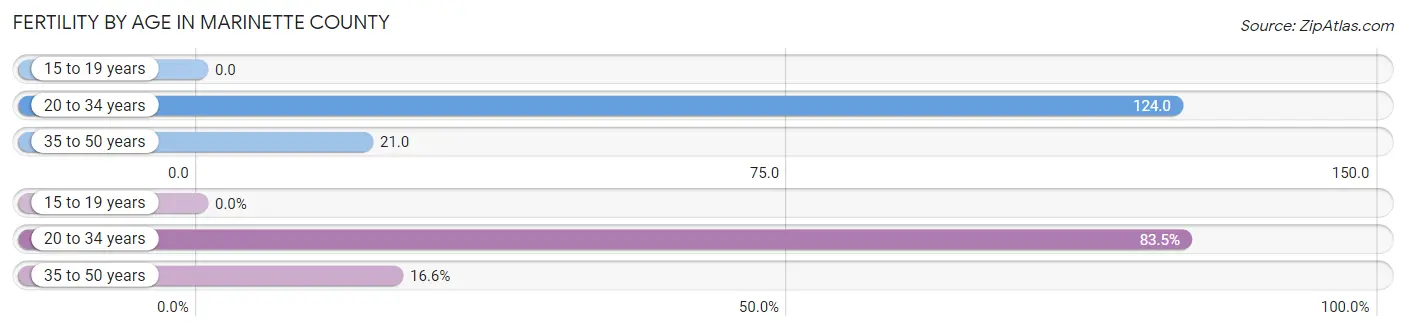
Fertility by Age in Marinette County
Average fertility rate in Marinette County is 57.0 births per 1,000 women. Women in the age bracket of 20 to 34 years have the highest fertility rate with 124.0 births per 1,000 women. Women in the age bracket of 20 to 34 years acount for 83.5% of all women with births.
| Age Bracket | Women with Births | Births / 1,000 Women |
| 15 to 19 years | 0 (0.0%) | 0.0 |
| 20 to 34 years | 358 (83.5%) | 124.0 |
| 35 to 50 years | 71 (16.6%) | 21.0 |
| Total | 429 (100.0%) | 57.0 |
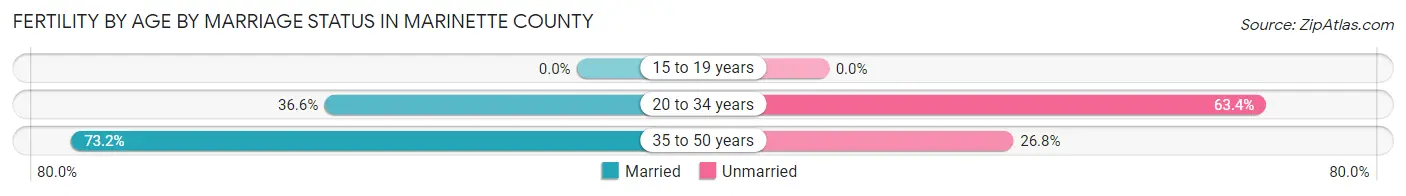
Fertility by Age by Marriage Status in Marinette County
42.7% of women with births (429) in Marinette County are married. The highest percentage of unmarried women with births falls into 20 to 34 years age bracket with 63.4% of them unmarried at the time of birth, while the lowest percentage of unmarried women with births belong to 35 to 50 years age bracket with 26.8% of them unmarried.
| Age Bracket | Married | Unmarried |
| 15 to 19 years | 0 (0.0%) | 0 (0.0%) |
| 20 to 34 years | 131 (36.6%) | 227 (63.4%) |
| 35 to 50 years | 52 (73.2%) | 19 (26.8%) |
| Total | 183 (42.7%) | 246 (57.3%) |
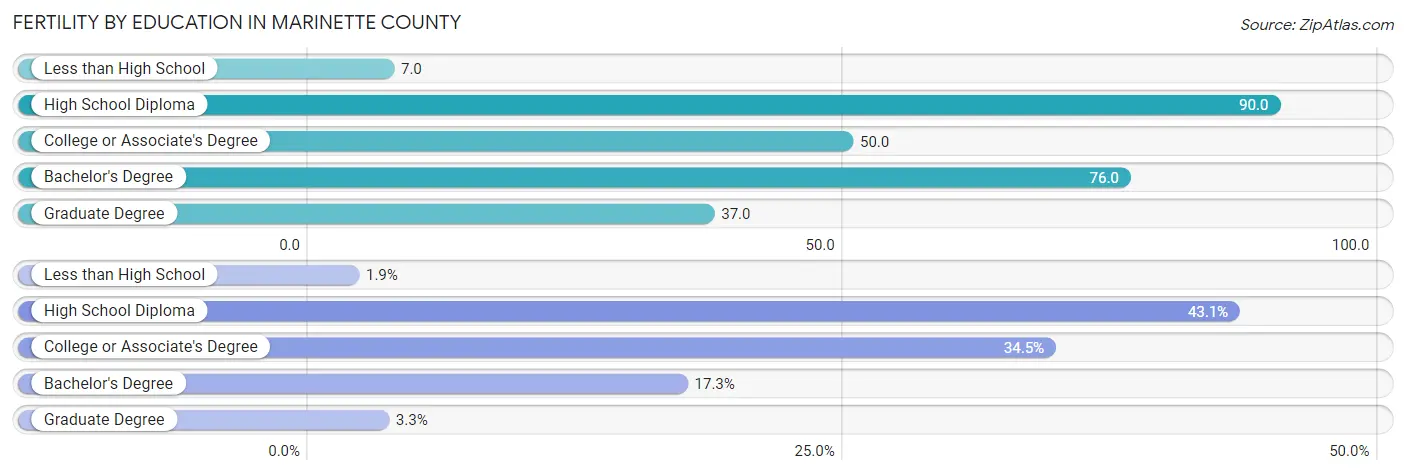
Fertility by Education in Marinette County
Average fertility rate in Marinette County is 57.0 births per 1,000 women. Women with the education attainment of high school diploma have the highest fertility rate of 90.0 births per 1,000 women, while women with the education attainment of less than high school have the lowest fertility at 7.0 births per 1,000 women. Women with the education attainment of high school diploma represent 43.1% of all women with births.
| Educational Attainment | Women with Births | Births / 1,000 Women |
| Less than High School | 8 (1.9%) | 7.0 |
| High School Diploma | 185 (43.1%) | 90.0 |
| College or Associate's Degree | 148 (34.5%) | 50.0 |
| Bachelor's Degree | 74 (17.2%) | 76.0 |
| Graduate Degree | 14 (3.3%) | 37.0 |
| Total | 429 (100.0%) | 57.0 |
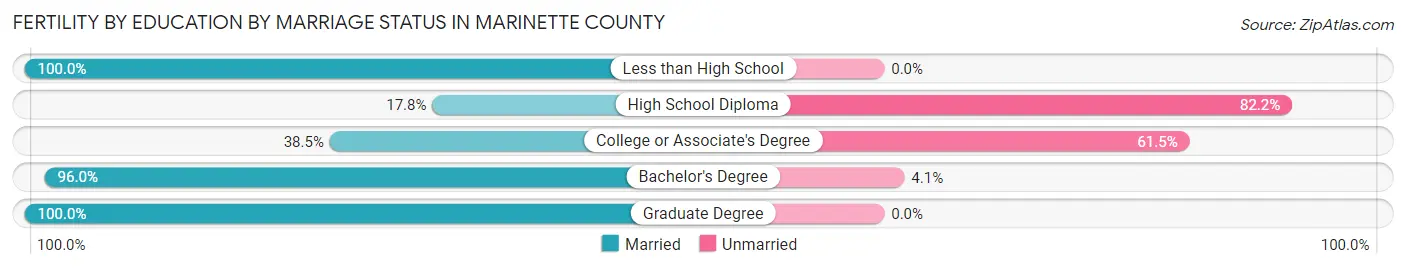
Fertility by Education by Marriage Status in Marinette County
57.3% of women with births in Marinette County are unmarried. Women with the educational attainment of less than high school are most likely to be married with 100.0% of them married at childbirth, while women with the educational attainment of high school diploma are least likely to be married with 82.2% of them unmarried at childbirth.
| Educational Attainment | Married | Unmarried |
| Less than High School | 8 (100.0%) | 0 (0.0%) |
| High School Diploma | 33 (17.8%) | 152 (82.2%) |
| College or Associate's Degree | 57 (38.5%) | 91 (61.5%) |
| Bachelor's Degree | 71 (96.0%) | 3 (4.1%) |
| Graduate Degree | 14 (100.0%) | 0 (0.0%) |
| Total | 183 (42.7%) | 246 (57.3%) |
Income in Marinette County
Income Overview in Marinette County
Per Capita Income in Marinette County is $33,952, while median incomes of families and households are $71,343 and $60,347 respectively.
| Characteristic | Number | Measure |
| Per Capita Income | 41,827 | $33,952 |
| Median Family Income | 11,348 | $71,343 |
| Mean Family Income | 11,348 | $88,823 |
| Median Household Income | 18,569 | $60,347 |
| Mean Household Income | 18,569 | $74,619 |
| Income Deficit | 11,348 | $8,479 |
| Wage / Income Gap (%) | 41,827 | 40.57% |
| Wage / Income Gap ($) | 41,827 | 59.43¢ per $1 |
| Gini / Inequality Index | 41,827 | 0.41 |
Earnings by Sex in Marinette County
Average Earnings in Marinette County are $39,355, $49,154 for men and $29,211 for women, a difference of 40.6%.
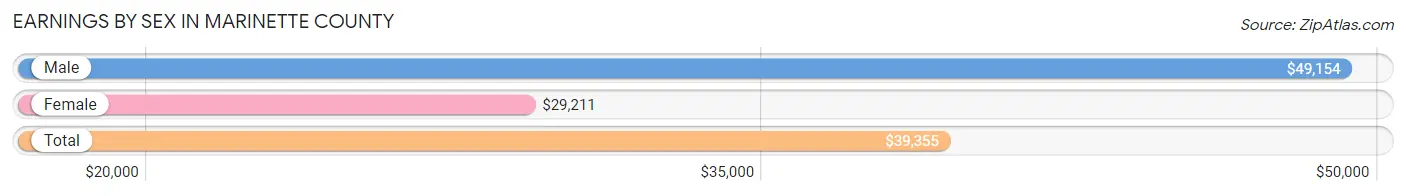
| Sex | Number | Average Earnings |
| Male | 11,315 (53.8%) | $49,154 |
| Female | 9,721 (46.2%) | $29,211 |
| Total | 21,036 (100.0%) | $39,355 |
Earnings by Sex by Income Bracket in Marinette County
The most common earnings brackets in Marinette County are $75,000 to $99,999 for men (1,364 | 12.0%) and $2,499 or less for women (794 | 8.2%).

| Income | Male | Female |
| $2,499 or less | 435 (3.8%) | 794 (8.2%) |
| $2,500 to $4,999 | 274 (2.4%) | 494 (5.1%) |
| $5,000 to $7,499 | 355 (3.1%) | 401 (4.1%) |
| $7,500 to $9,999 | 205 (1.8%) | 429 (4.4%) |
| $10,000 to $12,499 | 402 (3.5%) | 436 (4.5%) |
| $12,500 to $14,999 | 152 (1.3%) | 395 (4.1%) |
| $15,000 to $17,499 | 225 (2.0%) | 318 (3.3%) |
| $17,500 to $19,999 | 163 (1.4%) | 260 (2.7%) |
| $20,000 to $22,499 | 200 (1.8%) | 334 (3.4%) |
| $22,500 to $24,999 | 284 (2.5%) | 489 (5.0%) |
| $25,000 to $29,999 | 565 (5.0%) | 625 (6.4%) |
| $30,000 to $34,999 | 548 (4.8%) | 477 (4.9%) |
| $35,000 to $39,999 | 701 (6.2%) | 721 (7.4%) |
| $40,000 to $44,999 | 461 (4.1%) | 499 (5.1%) |
| $45,000 to $49,999 | 786 (7.0%) | 489 (5.0%) |
| $50,000 to $54,999 | 915 (8.1%) | 375 (3.9%) |
| $55,000 to $64,999 | 1,255 (11.1%) | 697 (7.2%) |
| $65,000 to $74,999 | 1,133 (10.0%) | 509 (5.2%) |
| $75,000 to $99,999 | 1,364 (12.0%) | 503 (5.2%) |
| $100,000+ | 892 (7.9%) | 476 (4.9%) |
| Total | 11,315 (100.0%) | 9,721 (100.0%) |
Earnings by Sex by Educational Attainment in Marinette County
Average earnings in Marinette County are $53,246 for men and $33,832 for women, a difference of 36.5%. Men with an educational attainment of graduate degree enjoy the highest average annual earnings of $83,413, while those with less than high school education earn the least with $33,720. Women with an educational attainment of graduate degree earn the most with the average annual earnings of $69,259, while those with less than high school education have the smallest earnings of $18,365.
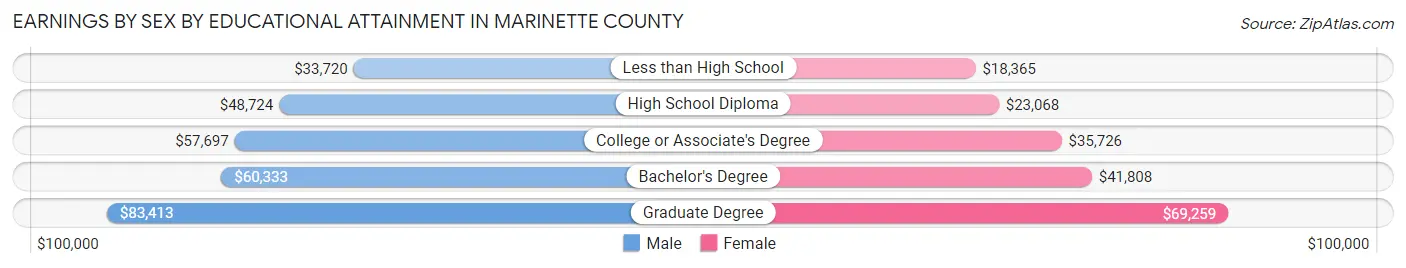
| Educational Attainment | Male Income | Female Income |
| Less than High School | $33,720 | $18,365 |
| High School Diploma | $48,724 | $23,068 |
| College or Associate's Degree | $57,697 | $35,726 |
| Bachelor's Degree | $60,333 | $41,808 |
| Graduate Degree | $83,413 | $69,259 |
| Total | $53,246 | $33,832 |
Family Income in Marinette County
Family Income Brackets in Marinette County
According to the Marinette County family income data, there are 2,701 families falling into the $50,000 to $74,999 income range, which is the most common income bracket and makes up 23.8% of all families. Conversely, the less than $10,000 income bracket is the least frequent group with only 182 families (1.6%) belonging to this category.
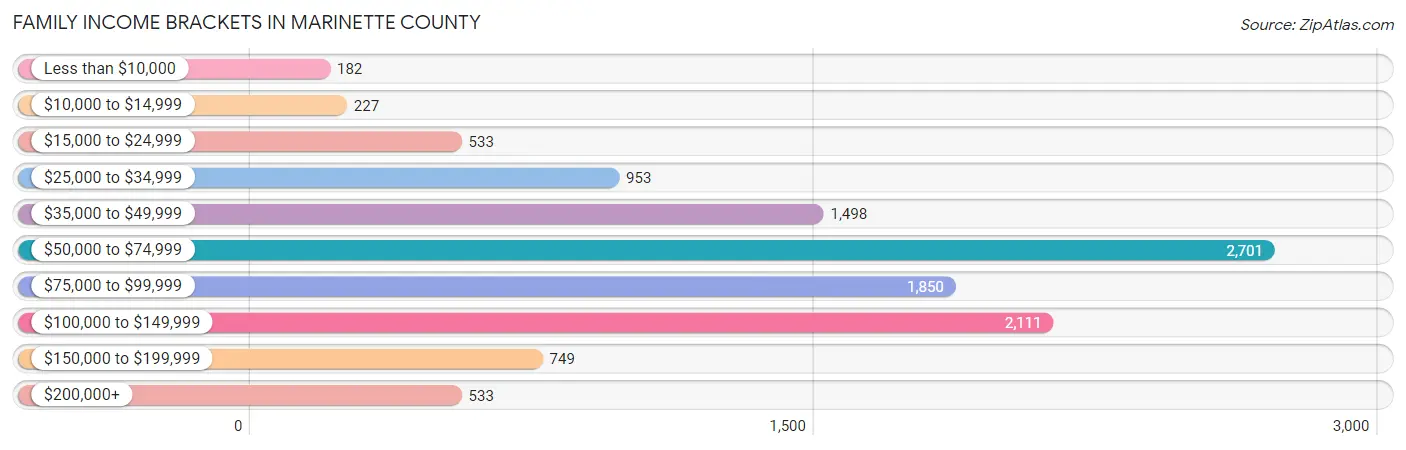
| Income Bracket | # Families | % Families |
| Less than $10,000 | 182 | 1.6% |
| $10,000 to $14,999 | 227 | 2.0% |
| $15,000 to $24,999 | 533 | 4.7% |
| $25,000 to $34,999 | 953 | 8.4% |
| $35,000 to $49,999 | 1,498 | 13.2% |
| $50,000 to $74,999 | 2,701 | 23.8% |
| $75,000 to $99,999 | 1,850 | 16.3% |
| $100,000 to $149,999 | 2,111 | 18.6% |
| $150,000 to $199,999 | 749 | 6.6% |
| $200,000+ | 533 | 4.7% |
Family Income by Famaliy Size in Marinette County
5-person families (604 | 5.3%) account for the highest median family income in Marinette County with $95,882 per family, while 2-person families (7,236 | 63.8%) have the highest median income of $32,766 per family member.
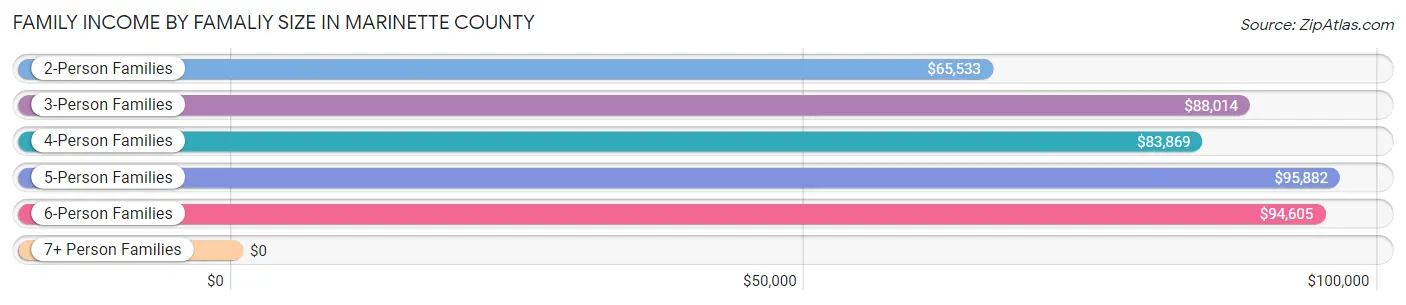
| Income Bracket | # Families | Median Income |
| 2-Person Families | 7,236 (63.8%) | $65,533 |
| 3-Person Families | 1,657 (14.6%) | $88,014 |
| 4-Person Families | 1,494 (13.2%) | $83,869 |
| 5-Person Families | 604 (5.3%) | $95,882 |
| 6-Person Families | 176 (1.5%) | $94,605 |
| 7+ Person Families | 181 (1.6%) | $0 |
| Total | 11,348 (100.0%) | $71,343 |
Family Income by Number of Earners in Marinette County
The median family income in Marinette County is $71,343, with families comprising 3+ earners (1,069) having the highest median family income of $128,259, while families with no earners (2,956) have the lowest median family income of $46,495, accounting for 9.4% and 26.1% of families, respectively.
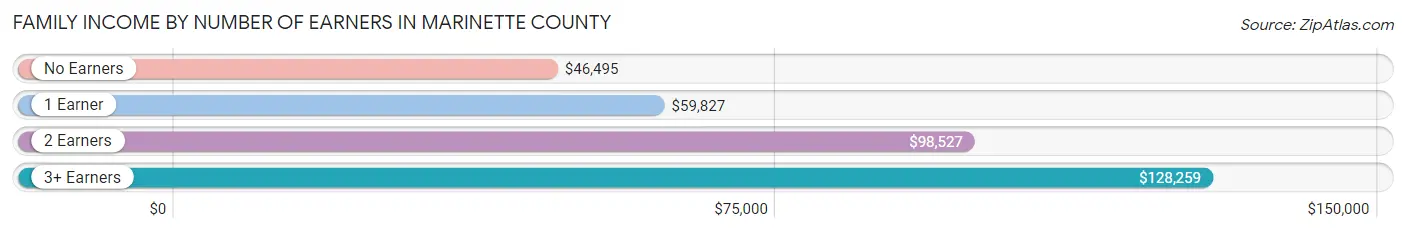
| Number of Earners | # Families | Median Income |
| No Earners | 2,956 (26.1%) | $46,495 |
| 1 Earner | 3,467 (30.5%) | $59,827 |
| 2 Earners | 3,856 (34.0%) | $98,527 |
| 3+ Earners | 1,069 (9.4%) | $128,259 |
| Total | 11,348 (100.0%) | $71,343 |
Household Income in Marinette County
Household Income Brackets in Marinette County
With 4,197 households falling in the category, the $50,000 to $74,999 income range is the most frequent in Marinette County, accounting for 22.6% of all households. In contrast, only 631 households (3.4%) fall into the $200,000+ income bracket, making it the least populous group.
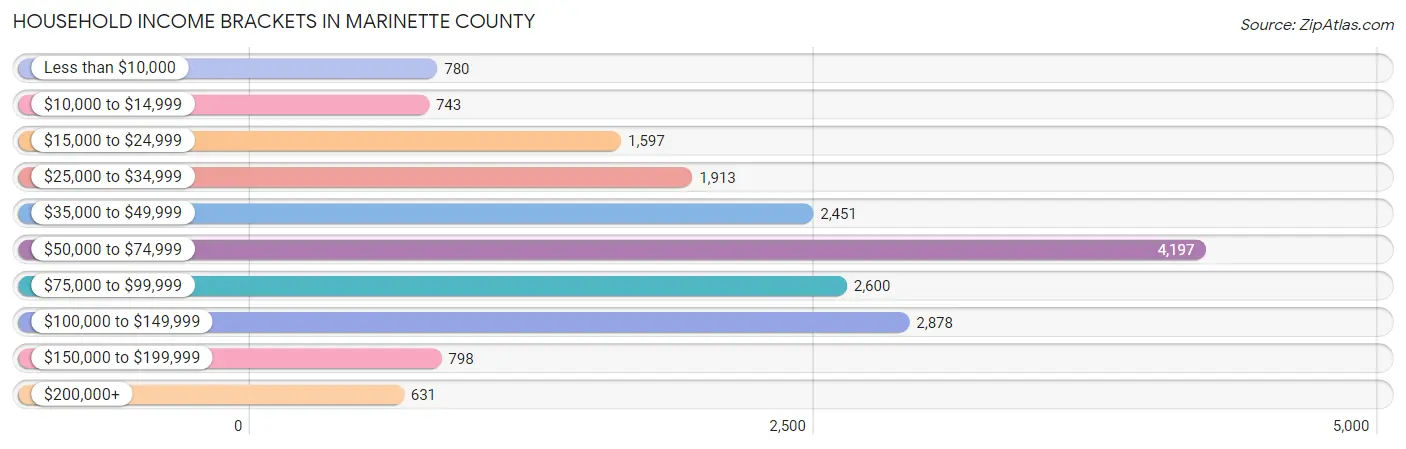
| Income Bracket | # Households | % Households |
| Less than $10,000 | 780 | 4.2% |
| $10,000 to $14,999 | 743 | 4.0% |
| $15,000 to $24,999 | 1,597 | 8.6% |
| $25,000 to $34,999 | 1,913 | 10.3% |
| $35,000 to $49,999 | 2,451 | 13.2% |
| $50,000 to $74,999 | 4,197 | 22.6% |
| $75,000 to $99,999 | 2,600 | 14.0% |
| $100,000 to $149,999 | 2,878 | 15.5% |
| $150,000 to $199,999 | 798 | 4.3% |
| $200,000+ | 631 | 3.4% |
Household Income by Householder Age in Marinette County
The median household income in Marinette County is $60,347, with the highest median household income of $74,905 found in the 25 to 44 years age bracket for the primary householder. A total of 4,453 households (24.0%) fall into this category. Meanwhile, the 15 to 24 years age bracket for the primary householder has the lowest median household income of $42,784, with 489 households (2.6%) in this group.
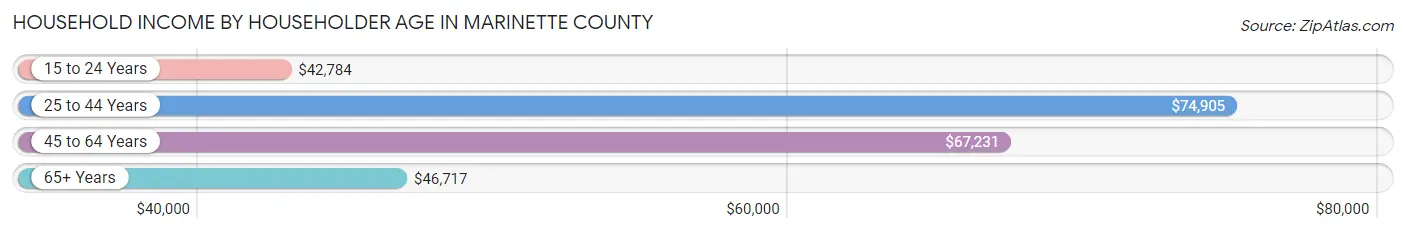
| Income Bracket | # Households | Median Income |
| 15 to 24 Years | 489 (2.6%) | $42,784 |
| 25 to 44 Years | 4,453 (24.0%) | $74,905 |
| 45 to 64 Years | 7,132 (38.4%) | $67,231 |
| 65+ Years | 6,495 (35.0%) | $46,717 |
| Total | 18,569 (100.0%) | $60,347 |
Poverty in Marinette County
Income Below Poverty by Sex and Age in Marinette County
With 8.1% poverty level for males and 11.2% for females among the residents of Marinette County, 6 to 11 year old males and 5 year old females are the most vulnerable to poverty, with 212 males (17.1%) and 52 females (36.9%) in their respective age groups living below the poverty level.
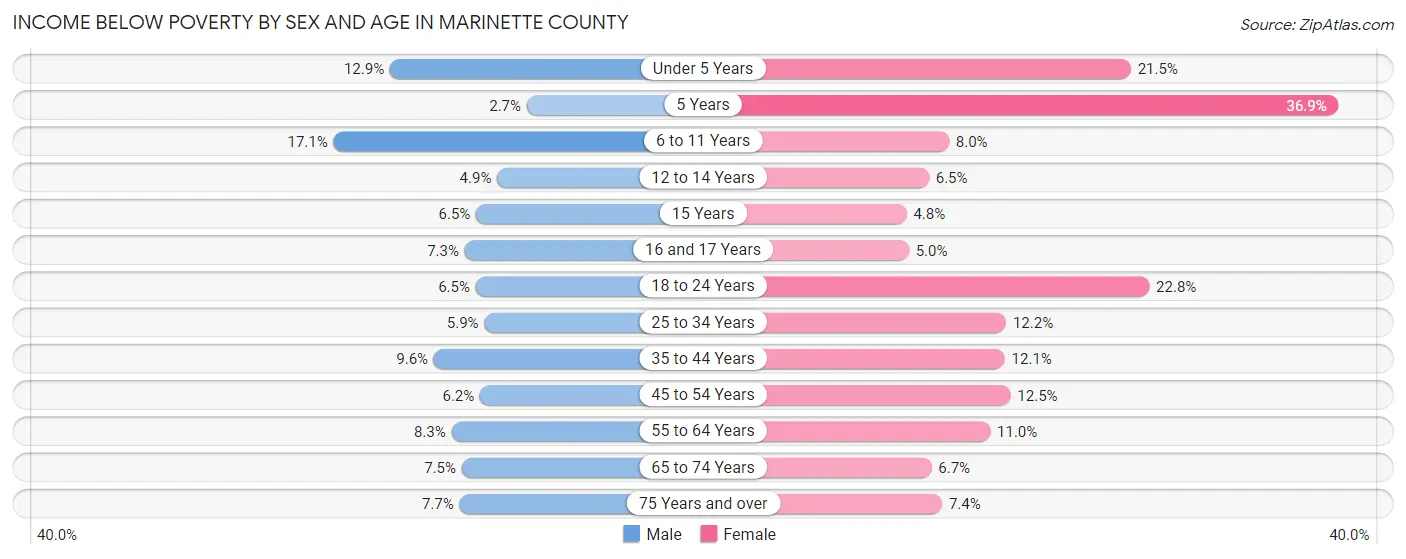
| Age Bracket | Male | Female |
| Under 5 Years | 116 (12.9%) | 192 (21.4%) |
| 5 Years | 10 (2.7%) | 52 (36.9%) |
| 6 to 11 Years | 212 (17.1%) | 96 (8.0%) |
| 12 to 14 Years | 32 (4.9%) | 37 (6.5%) |
| 15 Years | 24 (6.5%) | 11 (4.8%) |
| 16 and 17 Years | 29 (7.3%) | 29 (5.0%) |
| 18 to 24 Years | 84 (6.5%) | 282 (22.8%) |
| 25 to 34 Years | 121 (5.9%) | 237 (12.2%) |
| 35 to 44 Years | 227 (9.6%) | 263 (12.1%) |
| 45 to 54 Years | 161 (6.2%) | 299 (12.5%) |
| 55 to 64 Years | 313 (8.3%) | 400 (11.0%) |
| 65 to 74 Years | 224 (7.5%) | 191 (6.7%) |
| 75 Years and over | 135 (7.7%) | 162 (7.4%) |
| Total | 1,688 (8.1%) | 2,251 (11.2%) |
Income Above Poverty by Sex and Age in Marinette County
According to the poverty statistics in Marinette County, males aged 5 years and females aged 15 years are the age groups that are most secure financially, with 97.3% of males and 95.2% of females in these age groups living above the poverty line.
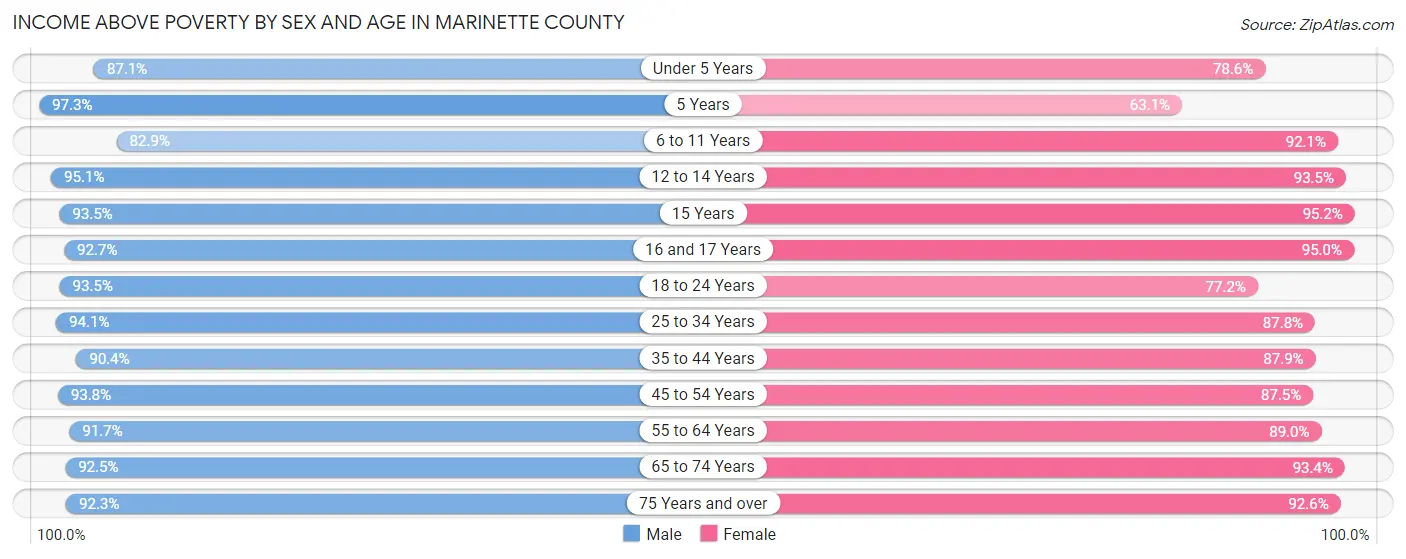
| Age Bracket | Male | Female |
| Under 5 Years | 785 (87.1%) | 703 (78.5%) |
| 5 Years | 359 (97.3%) | 89 (63.1%) |
| 6 to 11 Years | 1,031 (82.9%) | 1,111 (92.0%) |
| 12 to 14 Years | 620 (95.1%) | 536 (93.5%) |
| 15 Years | 347 (93.5%) | 218 (95.2%) |
| 16 and 17 Years | 367 (92.7%) | 555 (95.0%) |
| 18 to 24 Years | 1,208 (93.5%) | 954 (77.2%) |
| 25 to 34 Years | 1,944 (94.1%) | 1,708 (87.8%) |
| 35 to 44 Years | 2,136 (90.4%) | 1,912 (87.9%) |
| 45 to 54 Years | 2,446 (93.8%) | 2,090 (87.5%) |
| 55 to 64 Years | 3,460 (91.7%) | 3,233 (89.0%) |
| 65 to 74 Years | 2,745 (92.5%) | 2,683 (93.3%) |
| 75 Years and over | 1,615 (92.3%) | 2,016 (92.6%) |
| Total | 19,063 (91.9%) | 17,808 (88.8%) |
Income Below Poverty Among Married-Couple Families in Marinette County
The poverty statistics for married-couple families in Marinette County show that 3.6% or 331 of the total 9,076 families live below the poverty line. Families with 3 or 4 children have the highest poverty rate of 9.2%, comprising of 62 families. On the other hand, families with 5 or more children have the lowest poverty rate of 0.0%, which includes 0 families.
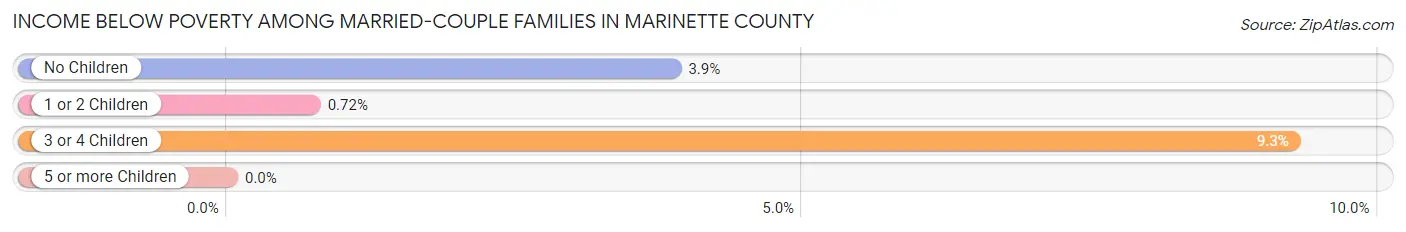
| Children | Above Poverty | Below Poverty |
| No Children | 6,400 (96.1%) | 257 (3.9%) |
| 1 or 2 Children | 1,644 (99.3%) | 12 (0.7%) |
| 3 or 4 Children | 608 (90.7%) | 62 (9.2%) |
| 5 or more Children | 93 (100.0%) | 0 (0.0%) |
| Total | 8,745 (96.4%) | 331 (3.6%) |
Income Below Poverty Among Single-Parent Households in Marinette County
According to the poverty data in Marinette County, 8.6% or 79 single-father households and 23.9% or 324 single-mother households are living below the poverty line. Among single-father households, those with 1 or 2 children have the highest poverty rate, with 57 households (15.0%) experiencing poverty. Likewise, among single-mother households, those with 5 or more children have the highest poverty rate, with 2 households (100.0%) falling below the poverty line.
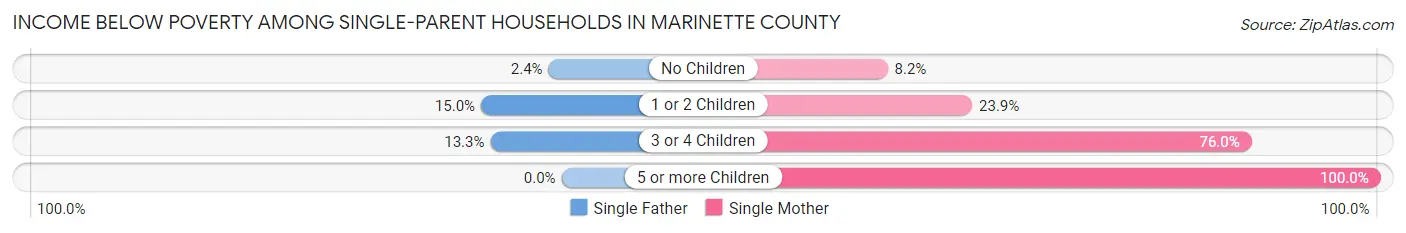
| Children | Single Father | Single Mother |
| No Children | 11 (2.4%) | 36 (8.2%) |
| 1 or 2 Children | 57 (15.0%) | 188 (23.9%) |
| 3 or 4 Children | 11 (13.3%) | 98 (76.0%) |
| 5 or more Children | 0 (0.0%) | 2 (100.0%) |
| Total | 79 (8.6%) | 324 (23.9%) |
Income Below Poverty Among Married-Couple vs Single-Parent Households in Marinette County
The poverty data for Marinette County shows that 331 of the married-couple family households (3.6%) and 403 of the single-parent households (17.7%) are living below the poverty level. Within the married-couple family households, those with 3 or 4 children have the highest poverty rate, with 62 households (9.2%) falling below the poverty line. Among the single-parent households, those with 5 or more children have the highest poverty rate, with 2 household (100.0%) living below poverty.
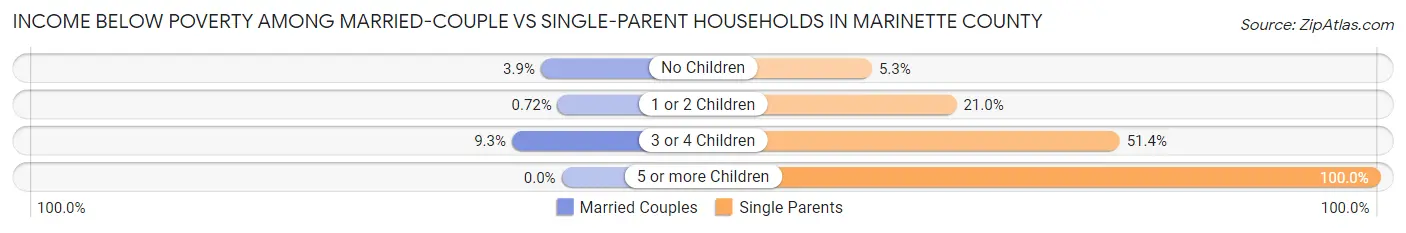
| Children | Married-Couple Families | Single-Parent Households |
| No Children | 257 (3.9%) | 47 (5.3%) |
| 1 or 2 Children | 12 (0.7%) | 245 (21.0%) |
| 3 or 4 Children | 62 (9.2%) | 109 (51.4%) |
| 5 or more Children | 0 (0.0%) | 2 (100.0%) |
| Total | 331 (3.6%) | 403 (17.7%) |
Employment Characteristics in Marinette County
Employment by Class of Employer in Marinette County
Among the 18,739 employed individuals in Marinette County, private company employees (13,521 | 72.2%), self-employed (not incorporated) (1,344 | 7.2%), and local government employees (1,285 | 6.9%) make up the most common classes of employment.
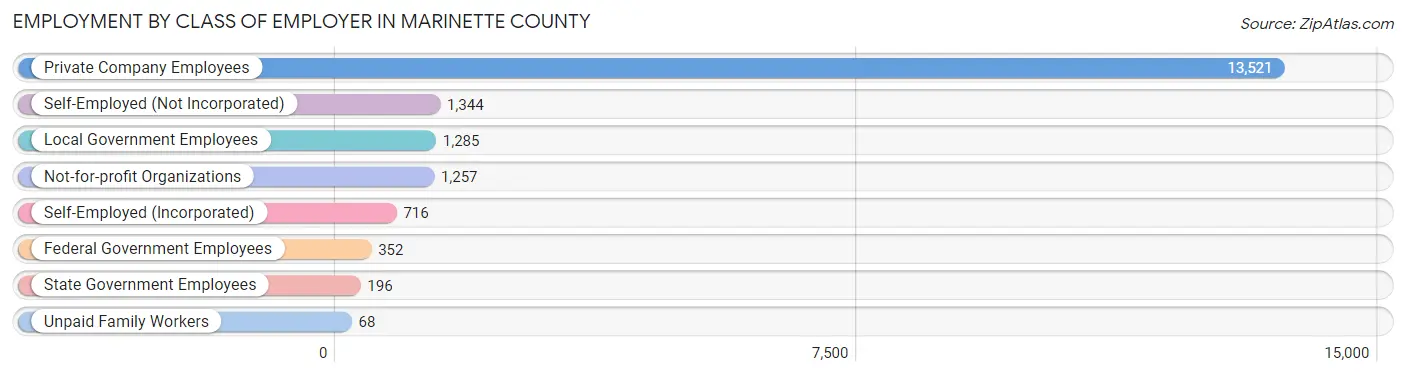
| Employer Class | # Employees | % Employees |
| Private Company Employees | 13,521 | 72.2% |
| Self-Employed (Incorporated) | 716 | 3.8% |
| Self-Employed (Not Incorporated) | 1,344 | 7.2% |
| Not-for-profit Organizations | 1,257 | 6.7% |
| Local Government Employees | 1,285 | 6.9% |
| State Government Employees | 196 | 1.1% |
| Federal Government Employees | 352 | 1.9% |
| Unpaid Family Workers | 68 | 0.4% |
| Total | 18,739 | 100.0% |
Employment Status by Age in Marinette County
According to the labor force statistics for Marinette County, out of the total population over 16 years of age (34,881), 57.0% or 19,882 individuals are in the labor force, with 3.8% or 756 of them unemployed. The age group with the highest labor force participation rate is 25 to 29 years, with 89.5% or 1,852 individuals in the labor force. Within the labor force, the 16 to 19 years age range has the highest percentage of unemployed individuals, with 18.9% or 208 of them being unemployed.
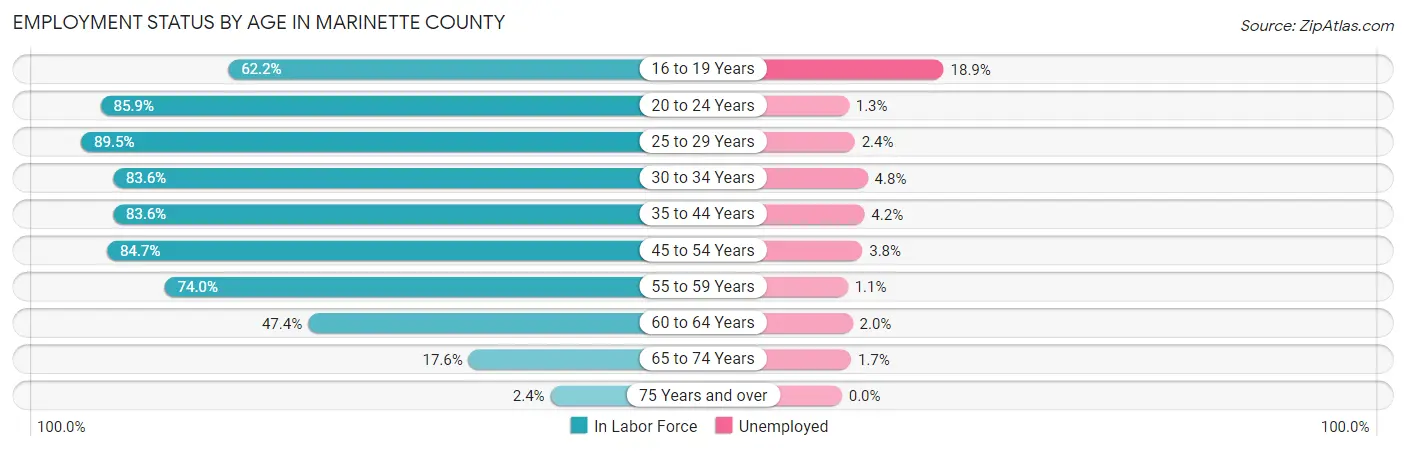
| Age Bracket | In Labor Force | Unemployed |
| 16 to 19 Years | 1,100 (62.2%) | 208 (18.9%) |
| 20 to 24 Years | 1,615 (85.9%) | 21 (1.3%) |
| 25 to 29 Years | 1,852 (89.5%) | 44 (2.4%) |
| 30 to 34 Years | 1,664 (83.6%) | 80 (4.8%) |
| 35 to 44 Years | 3,816 (83.6%) | 160 (4.2%) |
| 45 to 54 Years | 4,242 (84.7%) | 161 (3.8%) |
| 55 to 59 Years | 2,617 (74.0%) | 29 (1.1%) |
| 60 to 64 Years | 1,856 (47.4%) | 37 (2.0%) |
| 65 to 74 Years | 1,038 (17.6%) | 18 (1.7%) |
| 75 Years and over | 102 (2.4%) | 0 (0.0%) |
| Total | 19,882 (57.0%) | 756 (3.8%) |
Employment Status by Educational Attainment in Marinette County
According to labor force statistics for Marinette County, 76.1% of individuals (16,044) out of the total population between 25 and 64 years of age (21,083) are in the labor force, with 3.2% or 513 of them being unemployed. The group with the highest labor force participation rate are those with the educational attainment of bachelor's degree or higher, with 85.5% or 3,287 individuals in the labor force. Within the labor force, individuals with less than high school education have the highest percentage of unemployment, with 8.0% or 62 of them being unemployed.
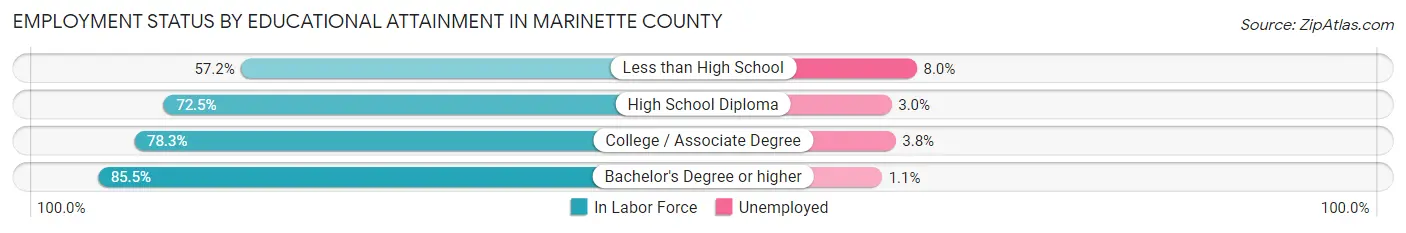
| Educational Attainment | In Labor Force | Unemployed |
| Less than High School | 780 (57.2%) | 109 (8.0%) |
| High School Diploma | 5,646 (72.5%) | 234 (3.0%) |
| College / Associate Degree | 6,334 (78.3%) | 307 (3.8%) |
| Bachelor's Degree or higher | 3,287 (85.5%) | 42 (1.1%) |
| Total | 16,044 (76.1%) | 675 (3.2%) |
Employment Occupations by Sex in Marinette County
Management, Business, Science and Arts Occupations
The most common Management, Business, Science and Arts occupations in Marinette County are Management (1,878 | 9.8%), Community & Social Service (1,326 | 6.9%), Health Diagnosing & Treating (1,309 | 6.9%), Health Technologists (775 | 4.1%), and Computers, Engineering & Science (772 | 4.0%).
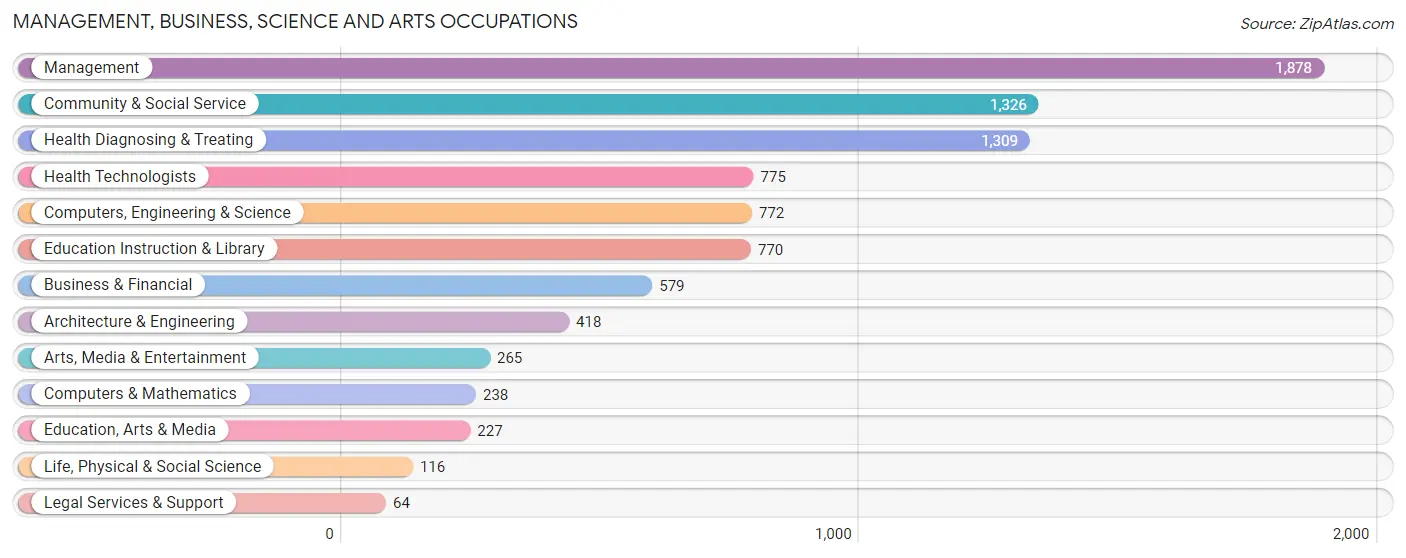
Management, Business, Science and Arts Occupations by Sex
Within the Management, Business, Science and Arts occupations in Marinette County, the most male-oriented occupations are Architecture & Engineering (89.9%), Computers, Engineering & Science (76.8%), and Life, Physical & Social Science (65.5%), while the most female-oriented occupations are Education Instruction & Library (86.5%), Legal Services & Support (85.9%), and Education, Arts & Media (83.3%).
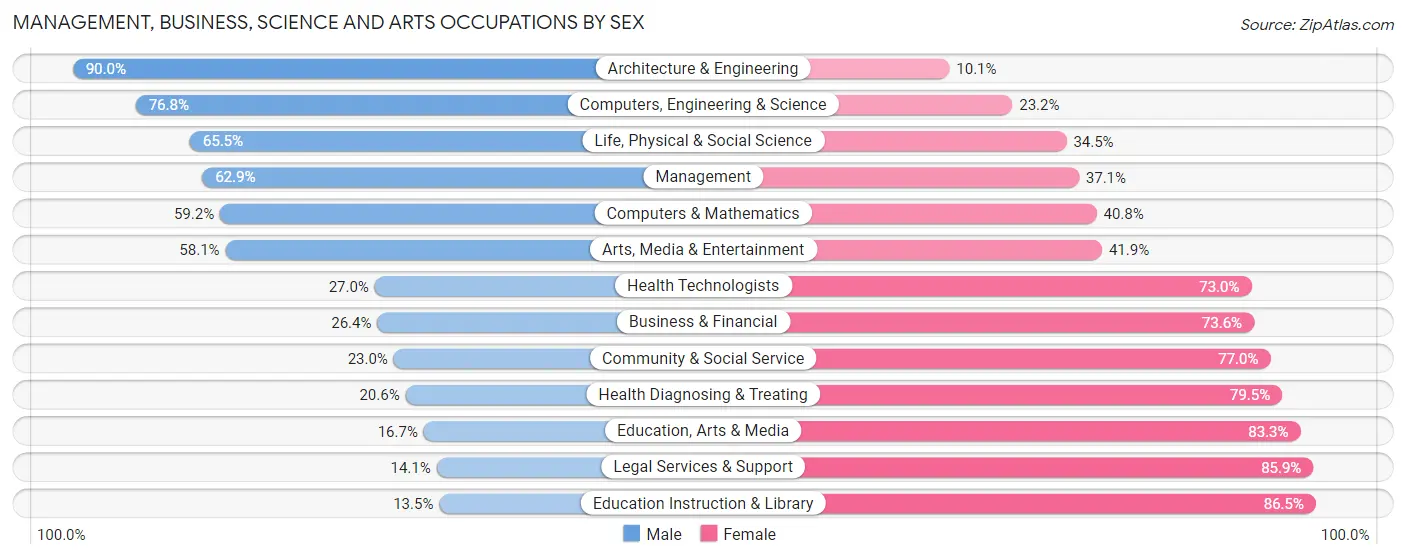
| Occupation | Male | Female |
| Management | 1,182 (62.9%) | 696 (37.1%) |
| Business & Financial | 153 (26.4%) | 426 (73.6%) |
| Computers, Engineering & Science | 593 (76.8%) | 179 (23.2%) |
| Computers & Mathematics | 141 (59.2%) | 97 (40.8%) |
| Architecture & Engineering | 376 (89.9%) | 42 (10.1%) |
| Life, Physical & Social Science | 76 (65.5%) | 40 (34.5%) |
| Community & Social Service | 305 (23.0%) | 1,021 (77.0%) |
| Education, Arts & Media | 38 (16.7%) | 189 (83.3%) |
| Legal Services & Support | 9 (14.1%) | 55 (85.9%) |
| Education Instruction & Library | 104 (13.5%) | 666 (86.5%) |
| Arts, Media & Entertainment | 154 (58.1%) | 111 (41.9%) |
| Health Diagnosing & Treating | 269 (20.5%) | 1,040 (79.4%) |
| Health Technologists | 209 (27.0%) | 566 (73.0%) |
| Total (Category) | 2,502 (42.7%) | 3,362 (57.3%) |
| Total (Overall) | 10,357 (54.2%) | 8,766 (45.8%) |
Services Occupations
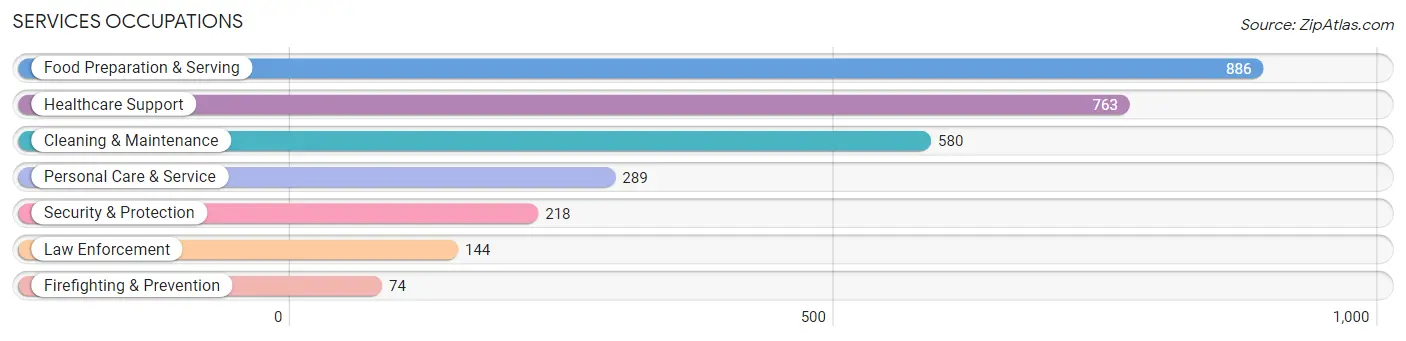
The most common Services occupations in Marinette County are Food Preparation & Serving (886 | 4.6%), Healthcare Support (763 | 4.0%), Cleaning & Maintenance (580 | 3.0%), Personal Care & Service (289 | 1.5%), and Security & Protection (218 | 1.1%).
Services Occupations by Sex
Within the Services occupations in Marinette County, the most male-oriented occupations are Law Enforcement (88.9%), Security & Protection (83.5%), and Firefighting & Prevention (73.0%), while the most female-oriented occupations are Healthcare Support (93.2%), Personal Care & Service (77.5%), and Food Preparation & Serving (71.1%).
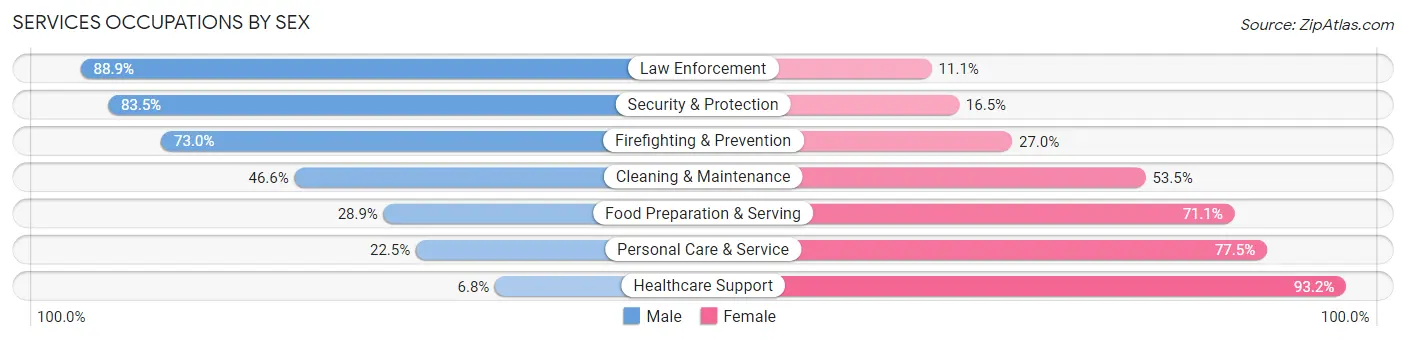
| Occupation | Male | Female |
| Healthcare Support | 52 (6.8%) | 711 (93.2%) |
| Security & Protection | 182 (83.5%) | 36 (16.5%) |
| Firefighting & Prevention | 54 (73.0%) | 20 (27.0%) |
| Law Enforcement | 128 (88.9%) | 16 (11.1%) |
| Food Preparation & Serving | 256 (28.9%) | 630 (71.1%) |
| Cleaning & Maintenance | 270 (46.6%) | 310 (53.4%) |
| Personal Care & Service | 65 (22.5%) | 224 (77.5%) |
| Total (Category) | 825 (30.1%) | 1,911 (69.9%) |
| Total (Overall) | 10,357 (54.2%) | 8,766 (45.8%) |
Sales and Office Occupations
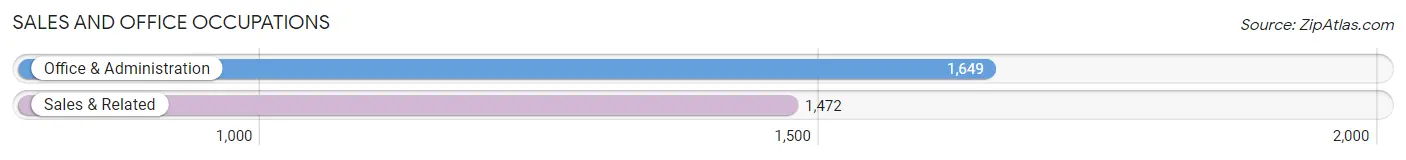
The most common Sales and Office occupations in Marinette County are Office & Administration (1,649 | 8.6%), and Sales & Related (1,472 | 7.7%).
Sales and Office Occupations by Sex
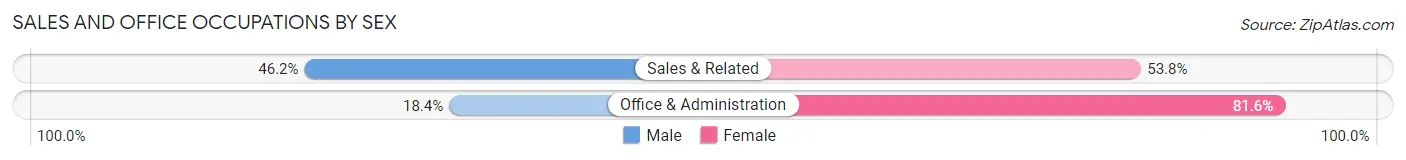
| Occupation | Male | Female |
| Sales & Related | 680 (46.2%) | 792 (53.8%) |
| Office & Administration | 303 (18.4%) | 1,346 (81.6%) |
| Total (Category) | 983 (31.5%) | 2,138 (68.5%) |
| Total (Overall) | 10,357 (54.2%) | 8,766 (45.8%) |
Natural Resources, Construction and Maintenance Occupations
The most common Natural Resources, Construction and Maintenance occupations in Marinette County are Construction & Extraction (1,059 | 5.5%), Installation, Maintenance & Repair (721 | 3.8%), and Farming, Fishing & Forestry (373 | 1.9%).

Natural Resources, Construction and Maintenance Occupations by Sex
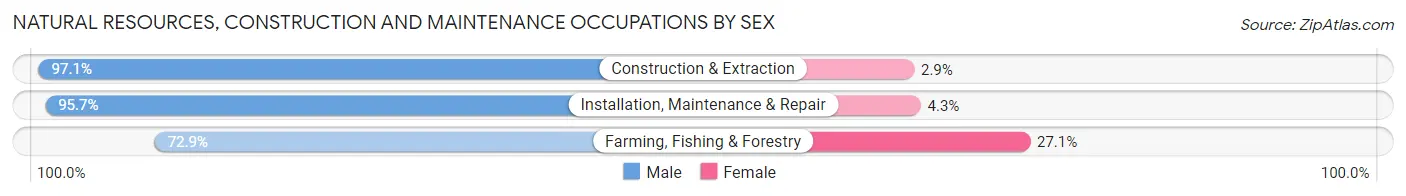
| Occupation | Male | Female |
| Farming, Fishing & Forestry | 272 (72.9%) | 101 (27.1%) |
| Construction & Extraction | 1,028 (97.1%) | 31 (2.9%) |
| Installation, Maintenance & Repair | 690 (95.7%) | 31 (4.3%) |
| Total (Category) | 1,990 (92.4%) | 163 (7.6%) |
| Total (Overall) | 10,357 (54.2%) | 8,766 (45.8%) |
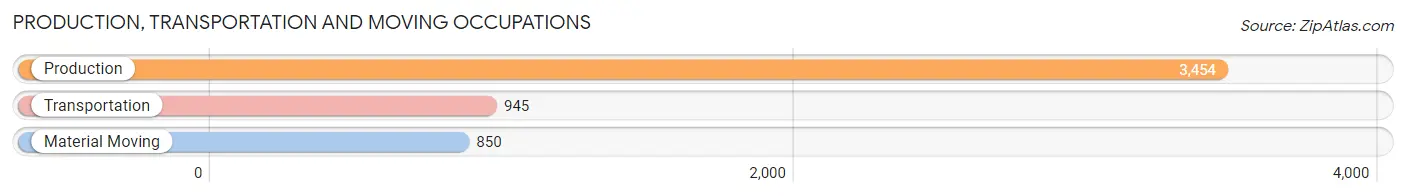
Production, Transportation and Moving Occupations
The most common Production, Transportation and Moving occupations in Marinette County are Production (3,454 | 18.1%), Transportation (945 | 4.9%), and Material Moving (850 | 4.4%).
Production, Transportation and Moving Occupations by Sex
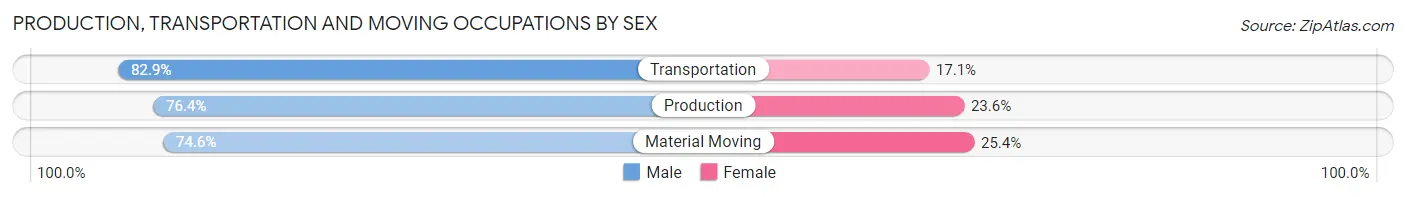
| Occupation | Male | Female |
| Production | 2,640 (76.4%) | 814 (23.6%) |
| Transportation | 783 (82.9%) | 162 (17.1%) |
| Material Moving | 634 (74.6%) | 216 (25.4%) |
| Total (Category) | 4,057 (77.3%) | 1,192 (22.7%) |
| Total (Overall) | 10,357 (54.2%) | 8,766 (45.8%) |
Employment Industries by Sex in Marinette County
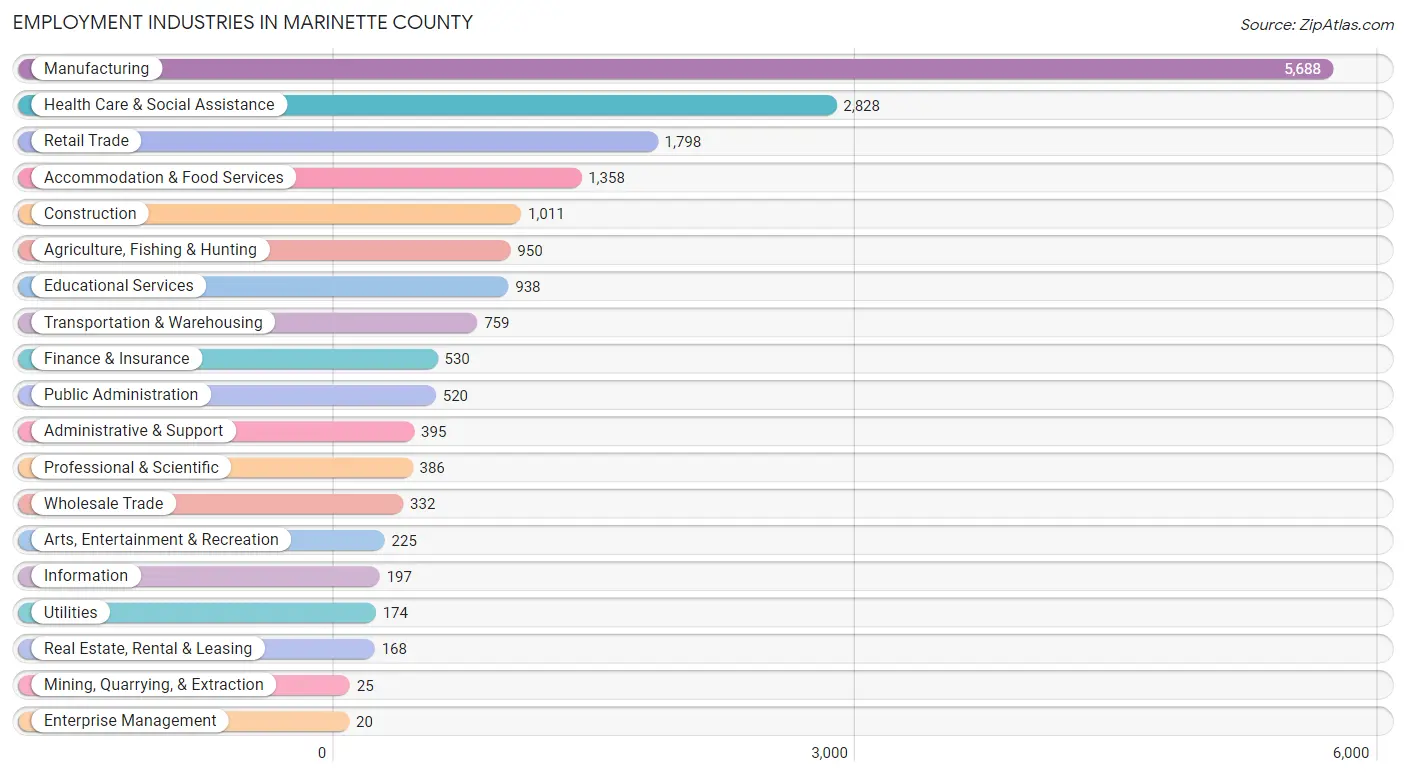
Employment Industries in Marinette County
The major employment industries in Marinette County include Manufacturing (5,688 | 29.7%), Health Care & Social Assistance (2,828 | 14.8%), Retail Trade (1,798 | 9.4%), Accommodation & Food Services (1,358 | 7.1%), and Construction (1,011 | 5.3%).
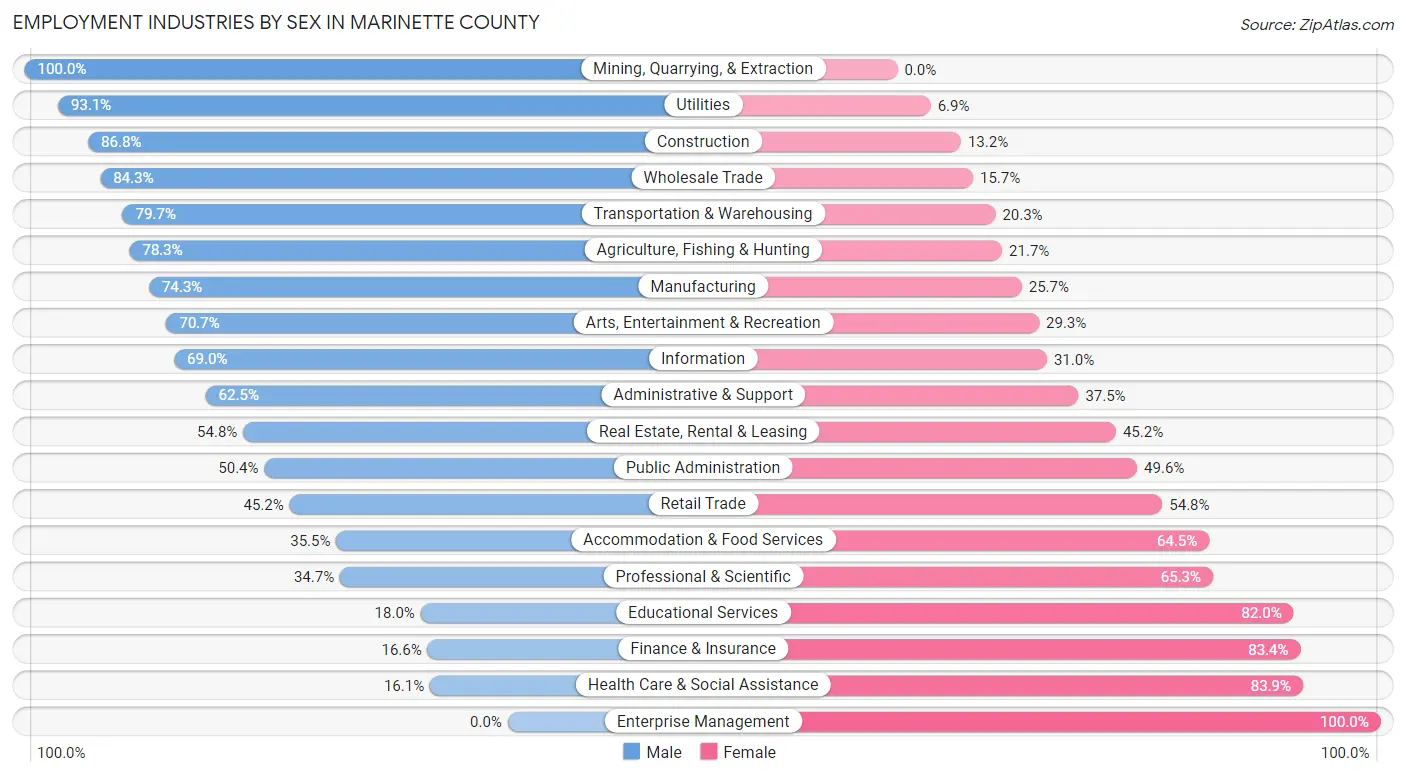
Employment Industries by Sex in Marinette County
The Marinette County industries that see more men than women are Mining, Quarrying, & Extraction (100.0%), Utilities (93.1%), and Construction (86.8%), whereas the industries that tend to have a higher number of women are Enterprise Management (100.0%), Health Care & Social Assistance (83.9%), and Finance & Insurance (83.4%).
| Industry | Male | Female |
| Agriculture, Fishing & Hunting | 744 (78.3%) | 206 (21.7%) |
| Mining, Quarrying, & Extraction | 25 (100.0%) | 0 (0.0%) |
| Construction | 878 (86.8%) | 133 (13.2%) |
| Manufacturing | 4,224 (74.3%) | 1,464 (25.7%) |
| Wholesale Trade | 280 (84.3%) | 52 (15.7%) |
| Retail Trade | 812 (45.2%) | 986 (54.8%) |
| Transportation & Warehousing | 605 (79.7%) | 154 (20.3%) |
| Utilities | 162 (93.1%) | 12 (6.9%) |
| Information | 136 (69.0%) | 61 (31.0%) |
| Finance & Insurance | 88 (16.6%) | 442 (83.4%) |
| Real Estate, Rental & Leasing | 92 (54.8%) | 76 (45.2%) |
| Professional & Scientific | 134 (34.7%) | 252 (65.3%) |
| Enterprise Management | 0 (0.0%) | 20 (100.0%) |
| Administrative & Support | 247 (62.5%) | 148 (37.5%) |
| Educational Services | 169 (18.0%) | 769 (82.0%) |
| Health Care & Social Assistance | 455 (16.1%) | 2,373 (83.9%) |
| Arts, Entertainment & Recreation | 159 (70.7%) | 66 (29.3%) |
| Accommodation & Food Services | 482 (35.5%) | 876 (64.5%) |
| Public Administration | 262 (50.4%) | 258 (49.6%) |
| Total | 10,357 (54.2%) | 8,766 (45.8%) |
Education in Marinette County
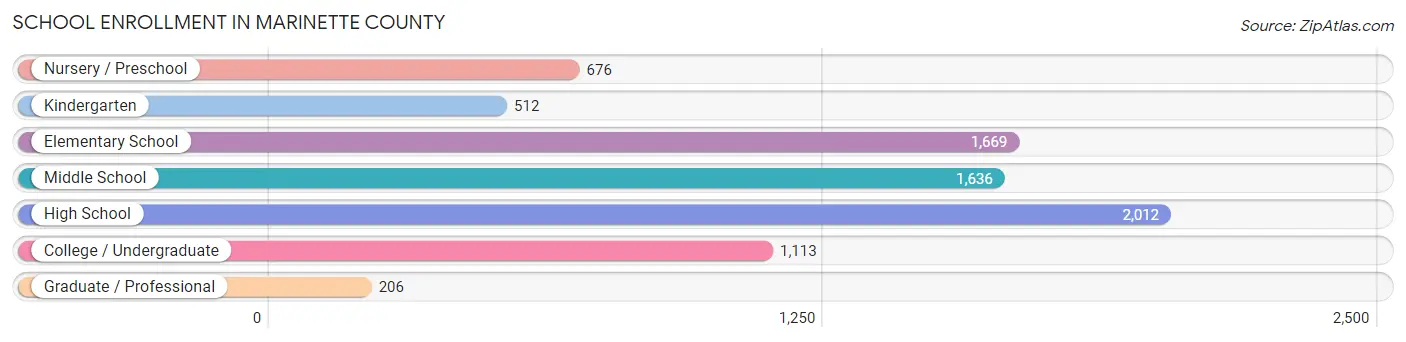
School Enrollment in Marinette County
The most common levels of schooling among the 7,824 students in Marinette County are high school (2,012 | 25.7%), elementary school (1,669 | 21.3%), and middle school (1,636 | 20.9%).
| School Level | # Students | % Students |
| Nursery / Preschool | 676 | 8.6% |
| Kindergarten | 512 | 6.5% |
| Elementary School | 1,669 | 21.3% |
| Middle School | 1,636 | 20.9% |
| High School | 2,012 | 25.7% |
| College / Undergraduate | 1,113 | 14.2% |
| Graduate / Professional | 206 | 2.6% |
| Total | 7,824 | 100.0% |
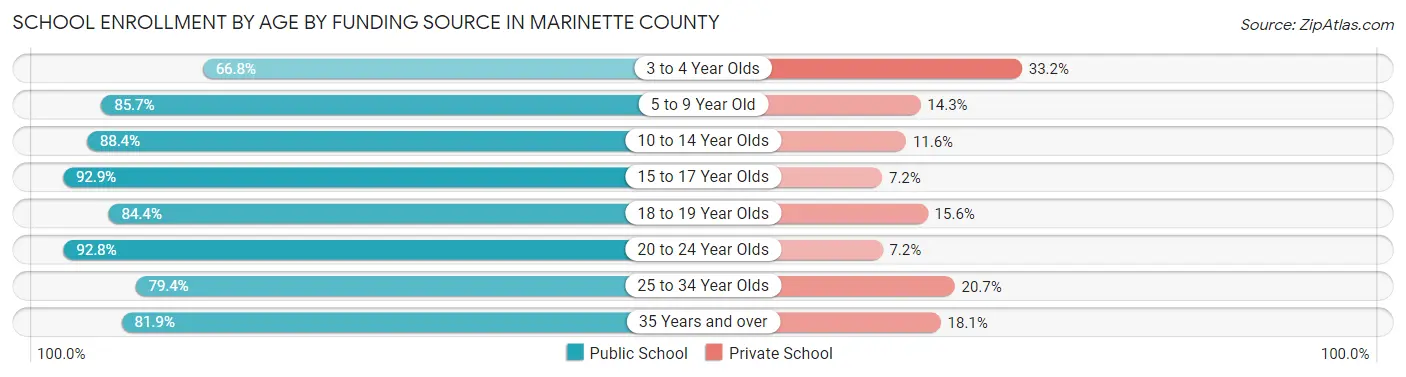
School Enrollment by Age by Funding Source in Marinette County
Out of a total of 7,824 students who are enrolled in schools in Marinette County, 1,056 (13.5%) attend a private institution, while the remaining 6,768 (86.5%) are enrolled in public schools. The age group of 3 to 4 year olds has the highest likelihood of being enrolled in private schools, with 142 (33.2% in the age bracket) enrolled. Conversely, the age group of 15 to 17 year olds has the lowest likelihood of being enrolled in a private school, with 1,428 (92.8% in the age bracket) attending a public institution.
| Age Bracket | Public School | Private School |
| 3 to 4 Year Olds | 286 (66.8%) | 142 (33.2%) |
| 5 to 9 Year Old | 1,901 (85.7%) | 317 (14.3%) |
| 10 to 14 Year Olds | 1,752 (88.4%) | 230 (11.6%) |
| 15 to 17 Year Olds | 1,428 (92.8%) | 110 (7.1%) |
| 18 to 19 Year Olds | 480 (84.4%) | 89 (15.6%) |
| 20 to 24 Year Olds | 295 (92.8%) | 23 (7.2%) |
| 25 to 34 Year Olds | 269 (79.3%) | 70 (20.6%) |
| 35 Years and over | 354 (81.9%) | 78 (18.1%) |
| Total | 6,768 (86.5%) | 1,056 (13.5%) |
Educational Attainment by Field of Study in Marinette County
Education (1,454 | 24.2%), business (1,139 | 19.0%), science & technology (741 | 12.4%), bio, nature & agricultural (544 | 9.1%), and arts & humanities (515 | 8.6%) are the most common fields of study among 5,996 individuals in Marinette County who have obtained a bachelor's degree or higher.
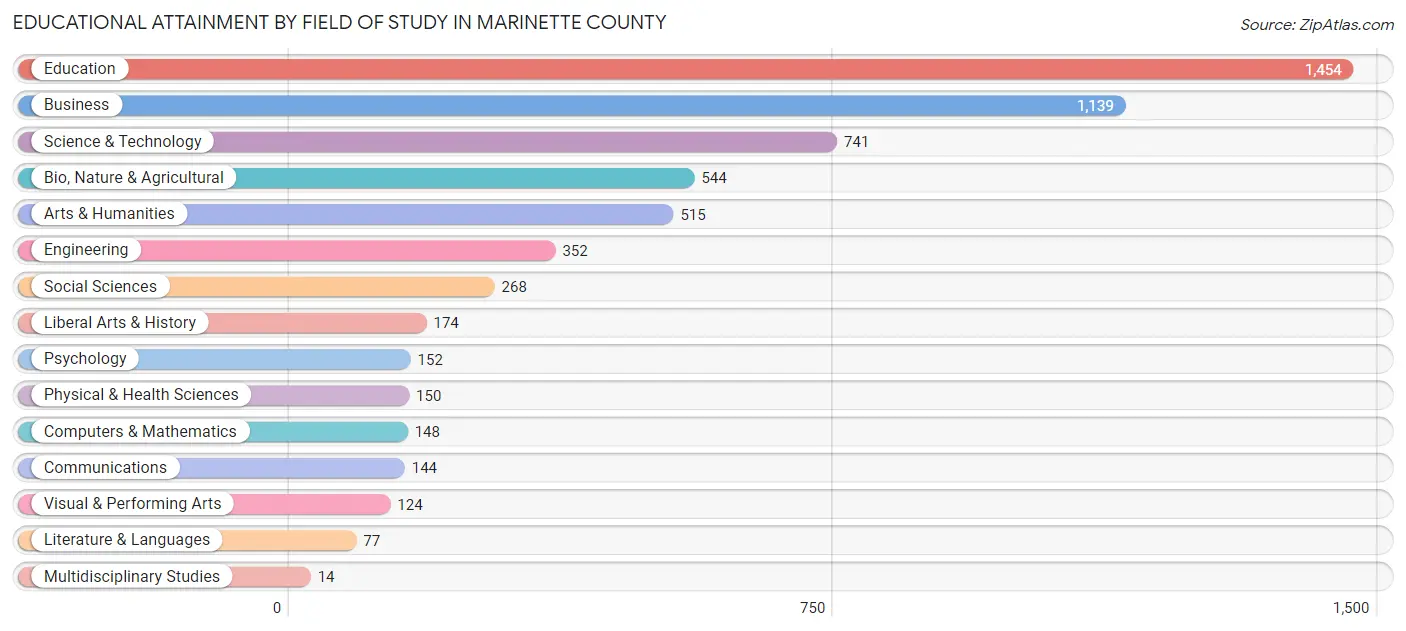
| Field of Study | # Graduates | % Graduates |
| Computers & Mathematics | 148 | 2.5% |
| Bio, Nature & Agricultural | 544 | 9.1% |
| Physical & Health Sciences | 150 | 2.5% |
| Psychology | 152 | 2.5% |
| Social Sciences | 268 | 4.5% |
| Engineering | 352 | 5.9% |
| Multidisciplinary Studies | 14 | 0.2% |
| Science & Technology | 741 | 12.4% |
| Business | 1,139 | 19.0% |
| Education | 1,454 | 24.2% |
| Literature & Languages | 77 | 1.3% |
| Liberal Arts & History | 174 | 2.9% |
| Visual & Performing Arts | 124 | 2.1% |
| Communications | 144 | 2.4% |
| Arts & Humanities | 515 | 8.6% |
| Total | 5,996 | 100.0% |
Transportation & Commute in Marinette County
Vehicle Availability by Sex in Marinette County
The most prevalent vehicle ownership categories in Marinette County are males with 2 vehicles (4,779, accounting for 47.4%) and females with 2 vehicles (3,709, making up 56.0%).
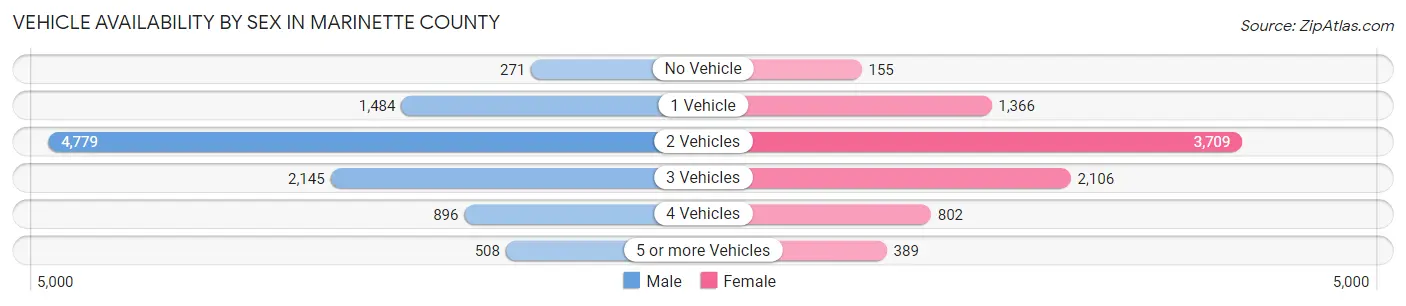
| Vehicles Available | Male | Female |
| No Vehicle | 271 (2.7%) | 155 (1.8%) |
| 1 Vehicle | 1,484 (14.7%) | 1,366 (16.0%) |
| 2 Vehicles | 4,779 (47.4%) | 3,709 (43.5%) |
| 3 Vehicles | 2,145 (21.3%) | 2,106 (24.7%) |
| 4 Vehicles | 896 (8.9%) | 802 (9.4%) |
| 5 or more Vehicles | 508 (5.0%) | 389 (4.6%) |
| Total | 10,083 (100.0%) | 8,527 (100.0%) |
Commute Time in Marinette County
The most frequently occuring commute durations in Marinette County are 5 to 9 minutes (3,793 commuters, 21.5%), 10 to 14 minutes (3,043 commuters, 17.2%), and 15 to 19 minutes (2,722 commuters, 15.4%).
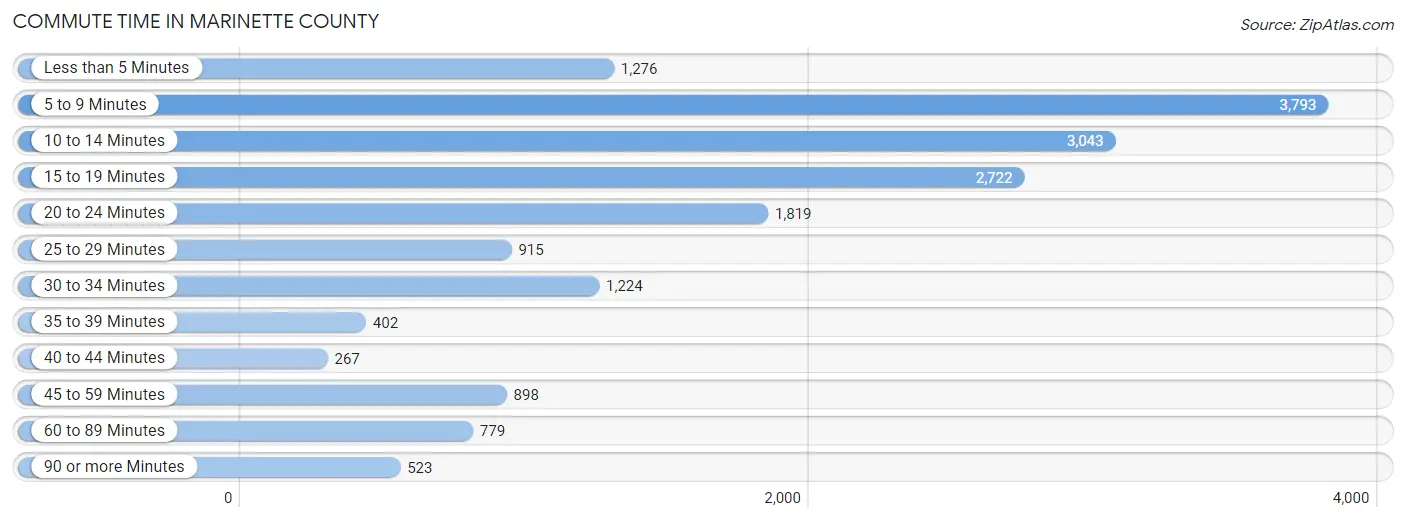
| Commute Time | # Commuters | % Commuters |
| Less than 5 Minutes | 1,276 | 7.2% |
| 5 to 9 Minutes | 3,793 | 21.5% |
| 10 to 14 Minutes | 3,043 | 17.2% |
| 15 to 19 Minutes | 2,722 | 15.4% |
| 20 to 24 Minutes | 1,819 | 10.3% |
| 25 to 29 Minutes | 915 | 5.2% |
| 30 to 34 Minutes | 1,224 | 6.9% |
| 35 to 39 Minutes | 402 | 2.3% |
| 40 to 44 Minutes | 267 | 1.5% |
| 45 to 59 Minutes | 898 | 5.1% |
| 60 to 89 Minutes | 779 | 4.4% |
| 90 or more Minutes | 523 | 3.0% |
Commute Time by Sex in Marinette County
The most common commute times in Marinette County are 5 to 9 minutes (2,095 commuters, 21.5%) for males and 5 to 9 minutes (1,698 commuters, 21.4%) for females.
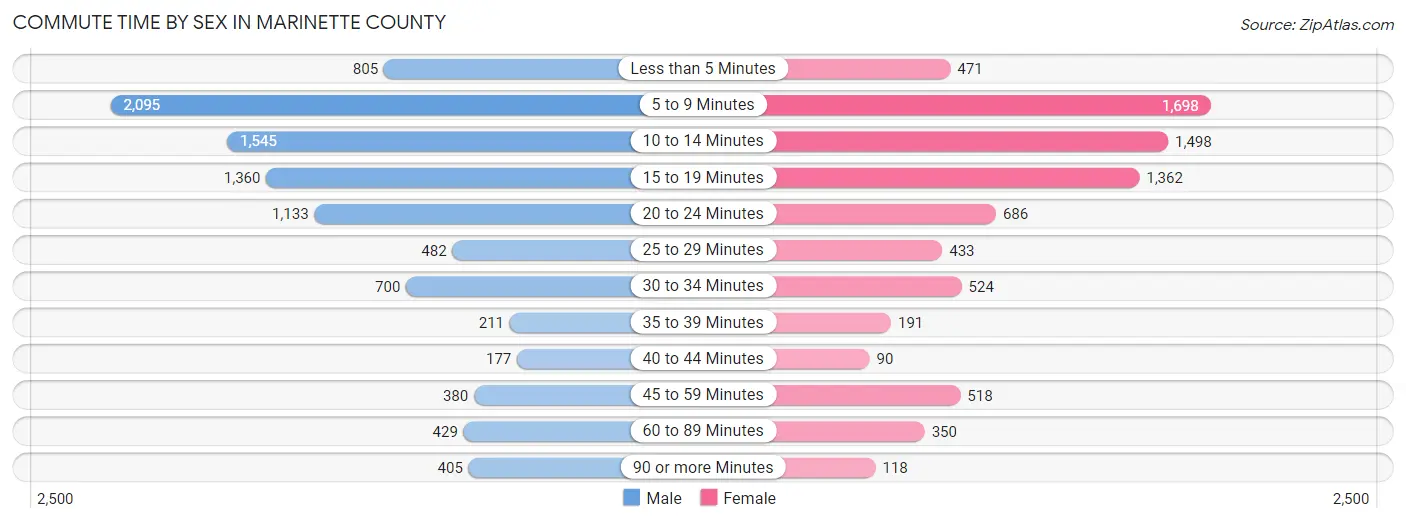
| Commute Time | Male | Female |
| Less than 5 Minutes | 805 (8.3%) | 471 (5.9%) |
| 5 to 9 Minutes | 2,095 (21.5%) | 1,698 (21.4%) |
| 10 to 14 Minutes | 1,545 (15.9%) | 1,498 (18.9%) |
| 15 to 19 Minutes | 1,360 (14.0%) | 1,362 (17.2%) |
| 20 to 24 Minutes | 1,133 (11.7%) | 686 (8.6%) |
| 25 to 29 Minutes | 482 (5.0%) | 433 (5.4%) |
| 30 to 34 Minutes | 700 (7.2%) | 524 (6.6%) |
| 35 to 39 Minutes | 211 (2.2%) | 191 (2.4%) |
| 40 to 44 Minutes | 177 (1.8%) | 90 (1.1%) |
| 45 to 59 Minutes | 380 (3.9%) | 518 (6.5%) |
| 60 to 89 Minutes | 429 (4.4%) | 350 (4.4%) |
| 90 or more Minutes | 405 (4.2%) | 118 (1.5%) |
Time of Departure to Work by Sex in Marinette County
The most frequent times of departure to work in Marinette County are 12:00 AM to 4:59 AM (1,495, 15.4%) for males and 7:30 AM to 7:59 AM (1,251, 15.8%) for females.
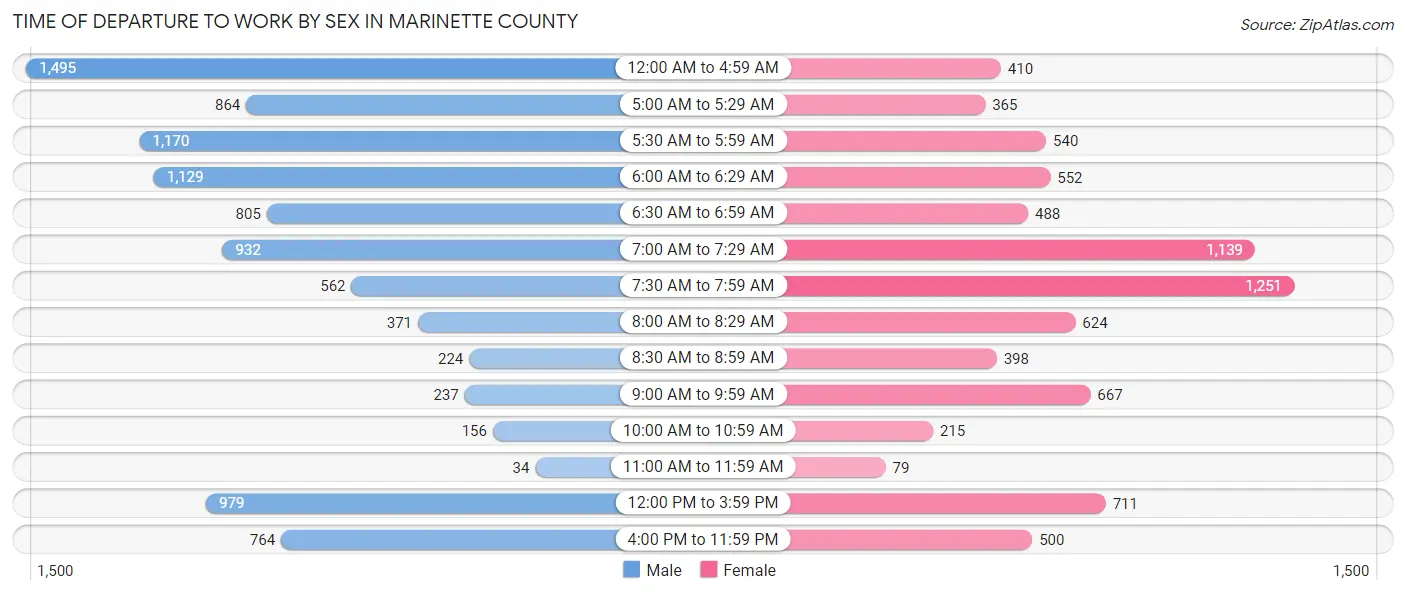
| Time of Departure | Male | Female |
| 12:00 AM to 4:59 AM | 1,495 (15.4%) | 410 (5.2%) |
| 5:00 AM to 5:29 AM | 864 (8.9%) | 365 (4.6%) |
| 5:30 AM to 5:59 AM | 1,170 (12.0%) | 540 (6.8%) |
| 6:00 AM to 6:29 AM | 1,129 (11.6%) | 552 (7.0%) |
| 6:30 AM to 6:59 AM | 805 (8.3%) | 488 (6.1%) |
| 7:00 AM to 7:29 AM | 932 (9.6%) | 1,139 (14.3%) |
| 7:30 AM to 7:59 AM | 562 (5.8%) | 1,251 (15.8%) |
| 8:00 AM to 8:29 AM | 371 (3.8%) | 624 (7.9%) |
| 8:30 AM to 8:59 AM | 224 (2.3%) | 398 (5.0%) |
| 9:00 AM to 9:59 AM | 237 (2.4%) | 667 (8.4%) |
| 10:00 AM to 10:59 AM | 156 (1.6%) | 215 (2.7%) |
| 11:00 AM to 11:59 AM | 34 (0.4%) | 79 (1.0%) |
| 12:00 PM to 3:59 PM | 979 (10.1%) | 711 (9.0%) |
| 4:00 PM to 11:59 PM | 764 (7.9%) | 500 (6.3%) |
| Total | 9,722 (100.0%) | 7,939 (100.0%) |
Housing Occupancy in Marinette County
Occupancy by Ownership in Marinette County
Of the total 18,569 dwellings in Marinette County, owner-occupied units account for 14,762 (79.5%), while renter-occupied units make up 3,807 (20.5%).
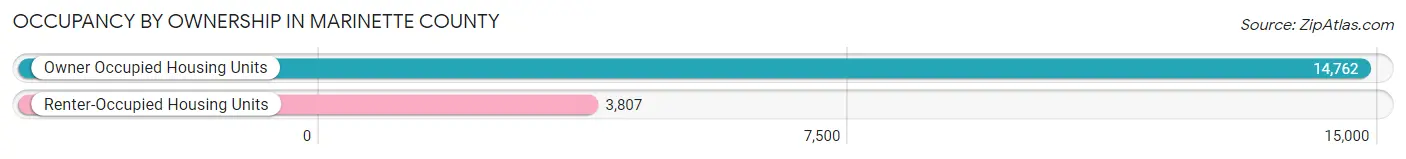
| Occupancy | # Housing Units | % Housing Units |
| Owner Occupied Housing Units | 14,762 | 79.5% |
| Renter-Occupied Housing Units | 3,807 | 20.5% |
| Total Occupied Housing Units | 18,569 | 100.0% |
Occupancy by Household Size in Marinette County
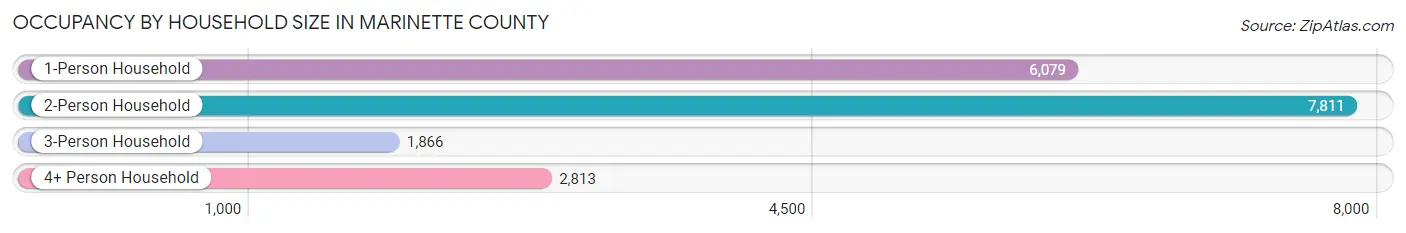
| Household Size | # Housing Units | % Housing Units |
| 1-Person Household | 6,079 | 32.7% |
| 2-Person Household | 7,811 | 42.1% |
| 3-Person Household | 1,866 | 10.1% |
| 4+ Person Household | 2,813 | 15.1% |
| Total Housing Units | 18,569 | 100.0% |
Occupancy by Ownership by Household Size in Marinette County
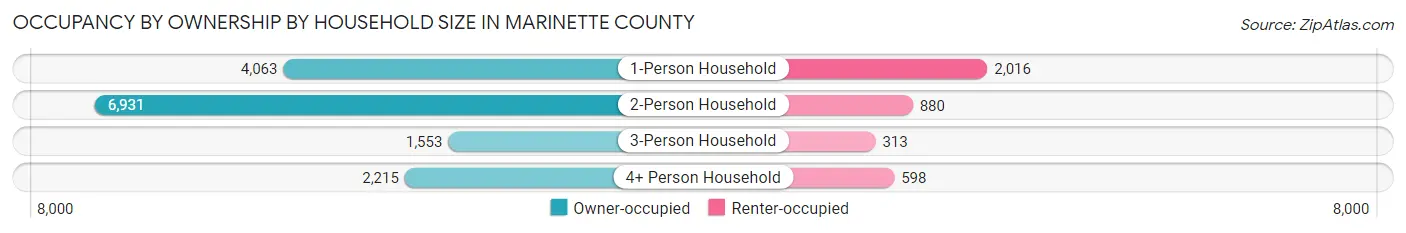
| Household Size | Owner-occupied | Renter-occupied |
| 1-Person Household | 4,063 (66.8%) | 2,016 (33.2%) |
| 2-Person Household | 6,931 (88.7%) | 880 (11.3%) |
| 3-Person Household | 1,553 (83.2%) | 313 (16.8%) |
| 4+ Person Household | 2,215 (78.7%) | 598 (21.3%) |
| Total Housing Units | 14,762 (79.5%) | 3,807 (20.5%) |
Occupancy by Educational Attainment in Marinette County
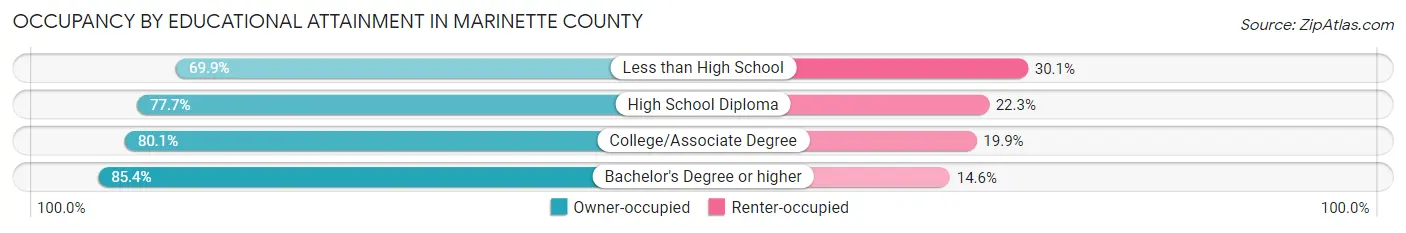
| Household Size | Owner-occupied | Renter-occupied |
| Less than High School | 940 (69.9%) | 404 (30.1%) |
| High School Diploma | 5,251 (77.7%) | 1,509 (22.3%) |
| College/Associate Degree | 5,565 (80.1%) | 1,380 (19.9%) |
| Bachelor's Degree or higher | 3,006 (85.4%) | 514 (14.6%) |
Occupancy by Age of Householder in Marinette County
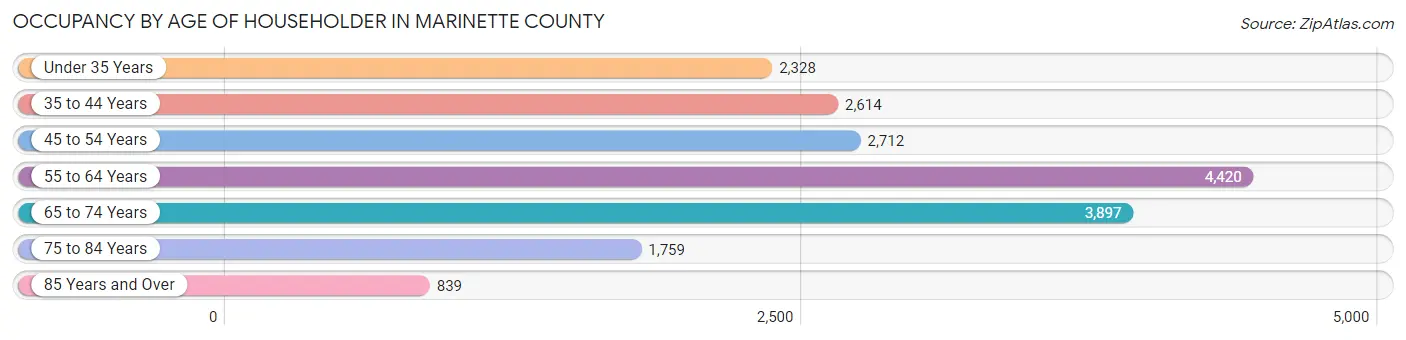
| Age Bracket | # Households | % Households |
| Under 35 Years | 2,328 | 12.5% |
| 35 to 44 Years | 2,614 | 14.1% |
| 45 to 54 Years | 2,712 | 14.6% |
| 55 to 64 Years | 4,420 | 23.8% |
| 65 to 74 Years | 3,897 | 21.0% |
| 75 to 84 Years | 1,759 | 9.5% |
| 85 Years and Over | 839 | 4.5% |
| Total | 18,569 | 100.0% |
Housing Finances in Marinette County
Median Income by Occupancy in Marinette County
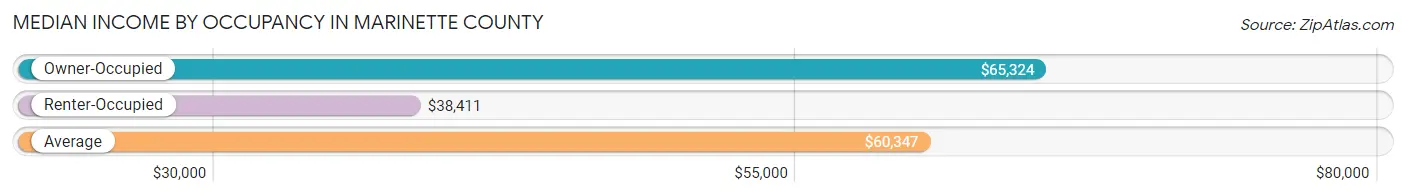
| Occupancy Type | # Households | Median Income |
| Owner-Occupied | 14,762 (79.5%) | $65,324 |
| Renter-Occupied | 3,807 (20.5%) | $38,411 |
| Average | 18,569 (100.0%) | $60,347 |
Occupancy by Householder Income Bracket in Marinette County
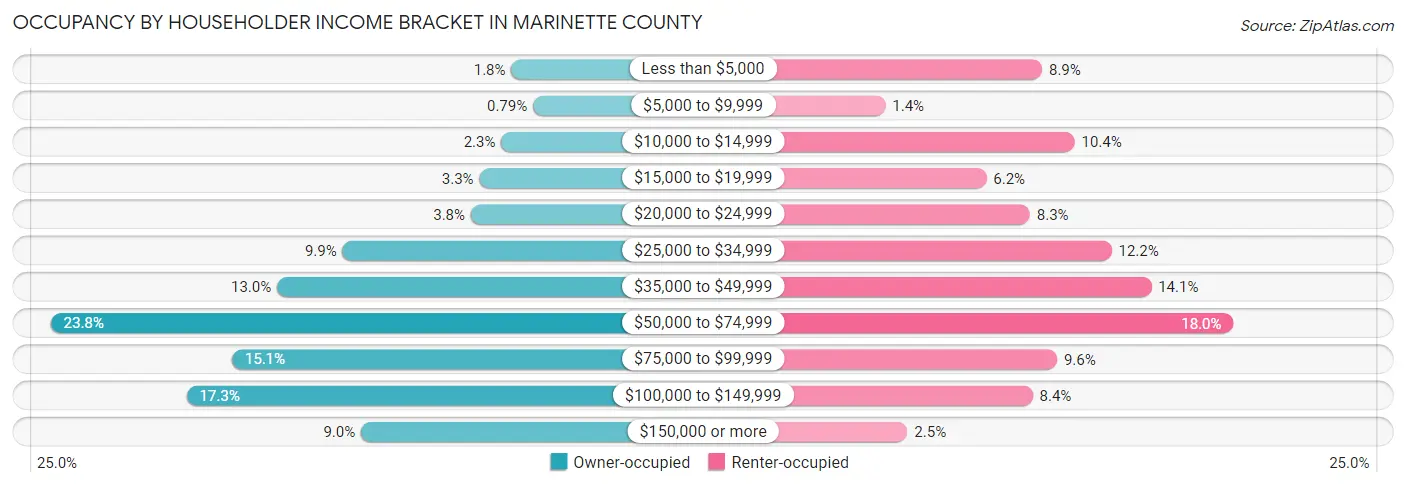
| Income Bracket | Owner-occupied | Renter-occupied |
| Less than $5,000 | 268 (1.8%) | 338 (8.9%) |
| $5,000 to $9,999 | 116 (0.8%) | 54 (1.4%) |
| $10,000 to $14,999 | 339 (2.3%) | 397 (10.4%) |
| $15,000 to $19,999 | 493 (3.3%) | 237 (6.2%) |
| $20,000 to $24,999 | 554 (3.7%) | 316 (8.3%) |
| $25,000 to $34,999 | 1,456 (9.9%) | 464 (12.2%) |
| $35,000 to $49,999 | 1,916 (13.0%) | 536 (14.1%) |
| $50,000 to $74,999 | 3,508 (23.8%) | 685 (18.0%) |
| $75,000 to $99,999 | 2,234 (15.1%) | 365 (9.6%) |
| $100,000 to $149,999 | 2,553 (17.3%) | 321 (8.4%) |
| $150,000 or more | 1,325 (9.0%) | 94 (2.5%) |
| Total | 14,762 (100.0%) | 3,807 (100.0%) |
Monthly Housing Cost Tiers in Marinette County
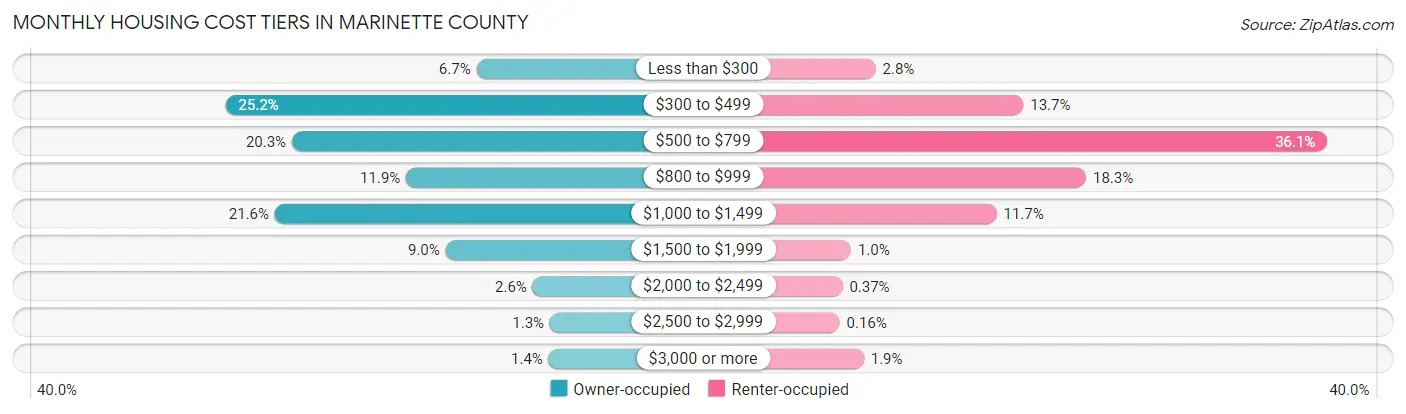
| Monthly Cost | Owner-occupied | Renter-occupied |
| Less than $300 | 992 (6.7%) | 107 (2.8%) |
| $300 to $499 | 3,722 (25.2%) | 521 (13.7%) |
| $500 to $799 | 2,998 (20.3%) | 1,373 (36.1%) |
| $800 to $999 | 1,757 (11.9%) | 697 (18.3%) |
| $1,000 to $1,499 | 3,184 (21.6%) | 446 (11.7%) |
| $1,500 to $1,999 | 1,328 (9.0%) | 38 (1.0%) |
| $2,000 to $2,499 | 381 (2.6%) | 14 (0.4%) |
| $2,500 to $2,999 | 193 (1.3%) | 6 (0.2%) |
| $3,000 or more | 207 (1.4%) | 74 (1.9%) |
| Total | 14,762 (100.0%) | 3,807 (100.0%) |
Physical Housing Characteristics in Marinette County
Housing Structures in Marinette County
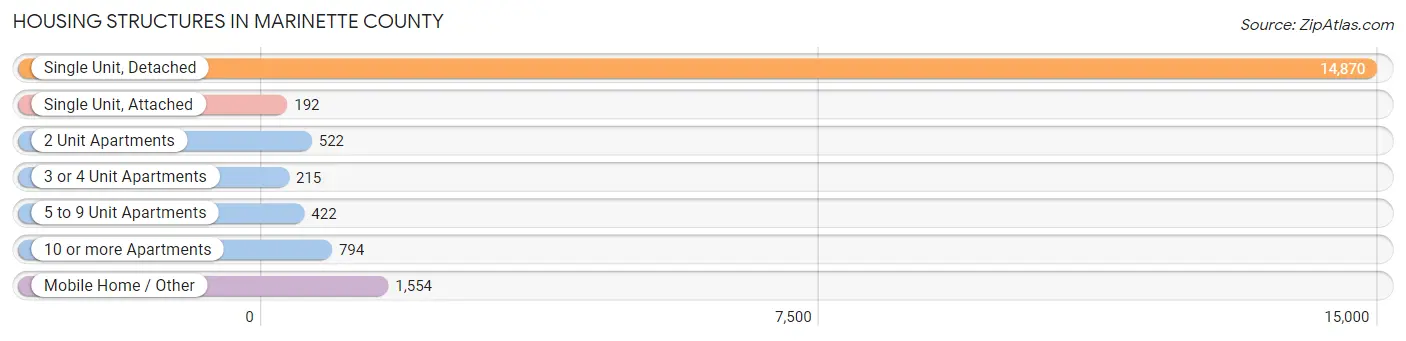
| Structure Type | # Housing Units | % Housing Units |
| Single Unit, Detached | 14,870 | 80.1% |
| Single Unit, Attached | 192 | 1.0% |
| 2 Unit Apartments | 522 | 2.8% |
| 3 or 4 Unit Apartments | 215 | 1.2% |
| 5 to 9 Unit Apartments | 422 | 2.3% |
| 10 or more Apartments | 794 | 4.3% |
| Mobile Home / Other | 1,554 | 8.4% |
| Total | 18,569 | 100.0% |
Housing Structures by Occupancy in Marinette County
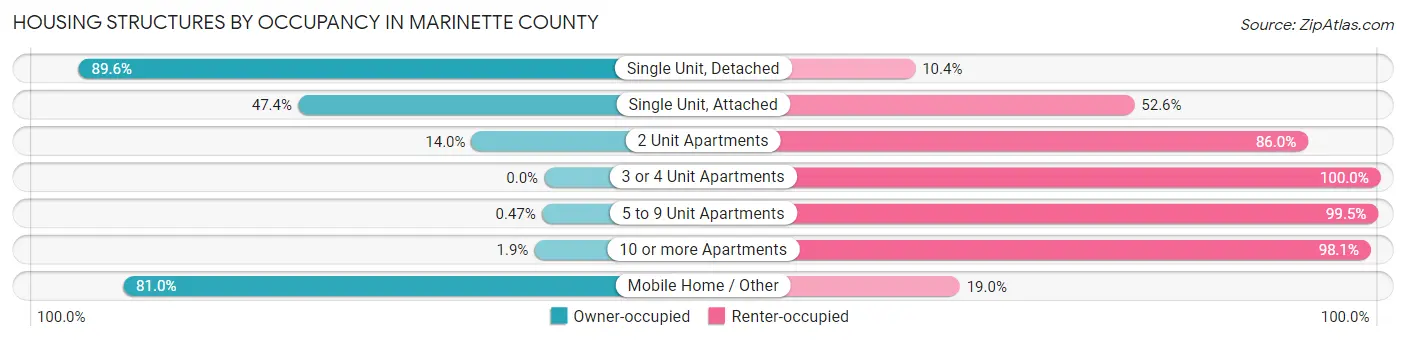
| Structure Type | Owner-occupied | Renter-occupied |
| Single Unit, Detached | 13,322 (89.6%) | 1,548 (10.4%) |
| Single Unit, Attached | 91 (47.4%) | 101 (52.6%) |
| 2 Unit Apartments | 73 (14.0%) | 449 (86.0%) |
| 3 or 4 Unit Apartments | 0 (0.0%) | 215 (100.0%) |
| 5 to 9 Unit Apartments | 2 (0.5%) | 420 (99.5%) |
| 10 or more Apartments | 15 (1.9%) | 779 (98.1%) |
| Mobile Home / Other | 1,259 (81.0%) | 295 (19.0%) |
| Total | 14,762 (79.5%) | 3,807 (20.5%) |
Housing Structures by Number of Rooms in Marinette County
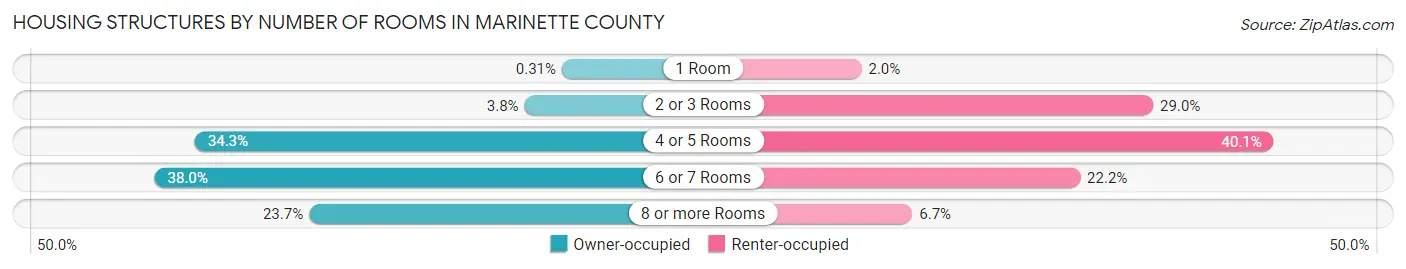
| Number of Rooms | Owner-occupied | Renter-occupied |
| 1 Room | 46 (0.3%) | 76 (2.0%) |
| 2 or 3 Rooms | 556 (3.8%) | 1,103 (29.0%) |
| 4 or 5 Rooms | 5,056 (34.3%) | 1,527 (40.1%) |
| 6 or 7 Rooms | 5,605 (38.0%) | 846 (22.2%) |
| 8 or more Rooms | 3,499 (23.7%) | 255 (6.7%) |
| Total | 14,762 (100.0%) | 3,807 (100.0%) |
Housing Structure by Heating Type in Marinette County
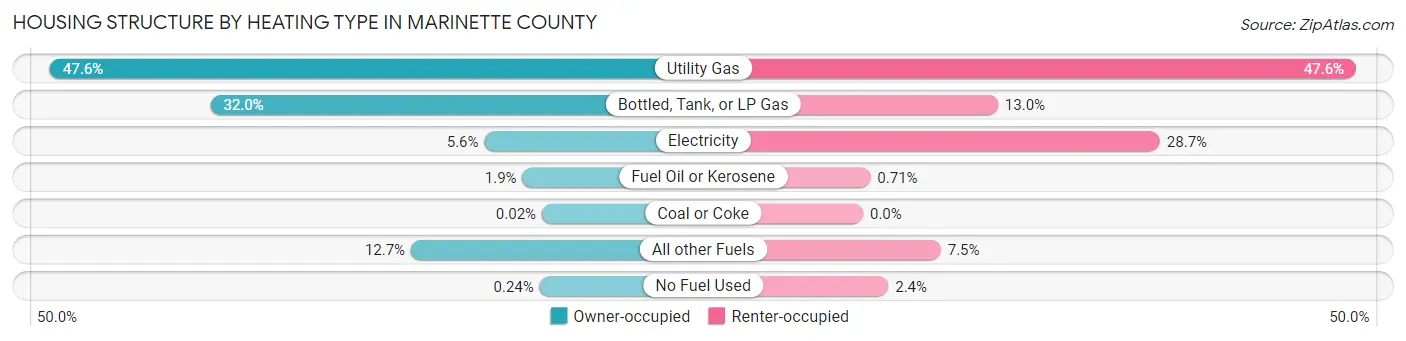
| Heating Type | Owner-occupied | Renter-occupied |
| Utility Gas | 7,020 (47.5%) | 1,813 (47.6%) |
| Bottled, Tank, or LP Gas | 4,730 (32.0%) | 496 (13.0%) |
| Electricity | 823 (5.6%) | 1,092 (28.7%) |
| Fuel Oil or Kerosene | 281 (1.9%) | 27 (0.7%) |
| Coal or Coke | 3 (0.0%) | 0 (0.0%) |
| All other Fuels | 1,870 (12.7%) | 286 (7.5%) |
| No Fuel Used | 35 (0.2%) | 93 (2.4%) |
| Total | 14,762 (100.0%) | 3,807 (100.0%) |
Household Vehicle Usage in Marinette County
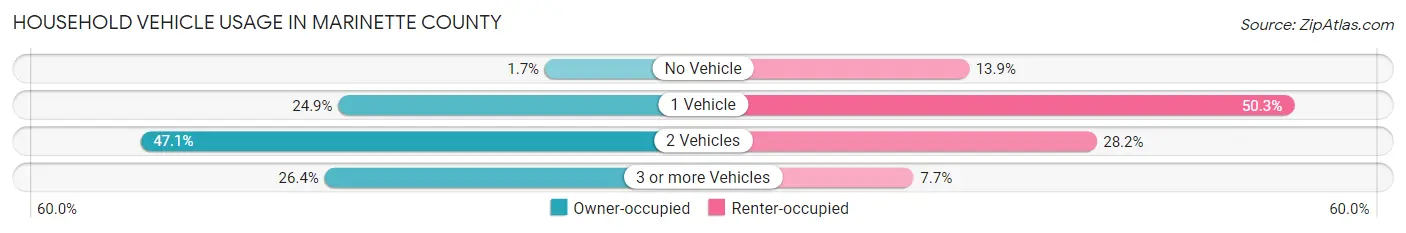
| Vehicles per Household | Owner-occupied | Renter-occupied |
| No Vehicle | 252 (1.7%) | 528 (13.9%) |
| 1 Vehicle | 3,668 (24.8%) | 1,915 (50.3%) |
| 2 Vehicles | 6,946 (47.0%) | 1,072 (28.2%) |
| 3 or more Vehicles | 3,896 (26.4%) | 292 (7.7%) |
| Total | 14,762 (100.0%) | 3,807 (100.0%) |
Real Estate & Mortgages in Marinette County
Real Estate and Mortgage Overview in Marinette County
| Characteristic | Without Mortgage | With Mortgage |
| Housing Units | 6,956 | 7,806 |
| Median Property Value | $123,700 | $155,700 |
| Median Household Income | $51,638 | $888 |
| Monthly Housing Costs | $439 | $201 |
| Real Estate Taxes | $1,748 | $67 |
Property Value by Mortgage Status in Marinette County
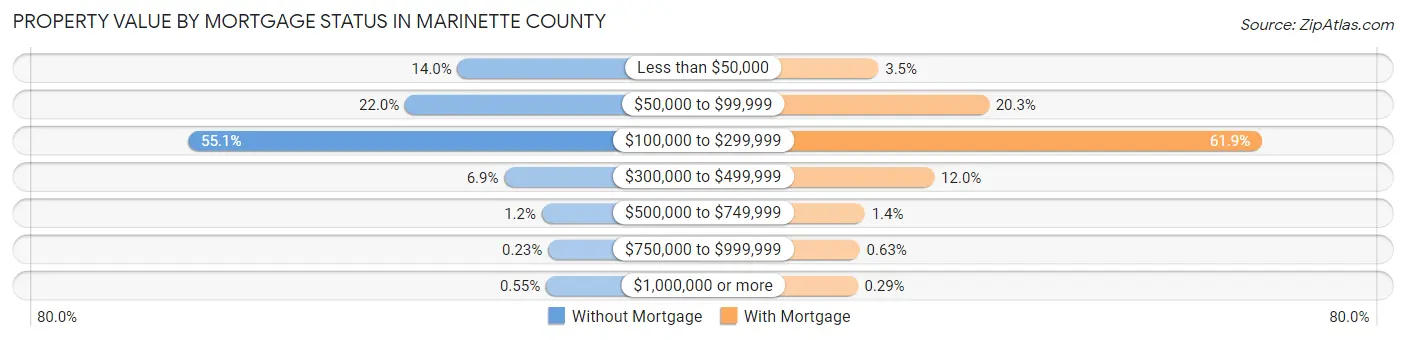
| Property Value | Without Mortgage | With Mortgage |
| Less than $50,000 | 975 (14.0%) | 271 (3.5%) |
| $50,000 to $99,999 | 1,532 (22.0%) | 1,584 (20.3%) |
| $100,000 to $299,999 | 3,832 (55.1%) | 4,835 (61.9%) |
| $300,000 to $499,999 | 480 (6.9%) | 935 (12.0%) |
| $500,000 to $749,999 | 83 (1.2%) | 109 (1.4%) |
| $750,000 to $999,999 | 16 (0.2%) | 49 (0.6%) |
| $1,000,000 or more | 38 (0.5%) | 23 (0.3%) |
| Total | 6,956 (100.0%) | 7,806 (100.0%) |
Household Income by Mortgage Status in Marinette County
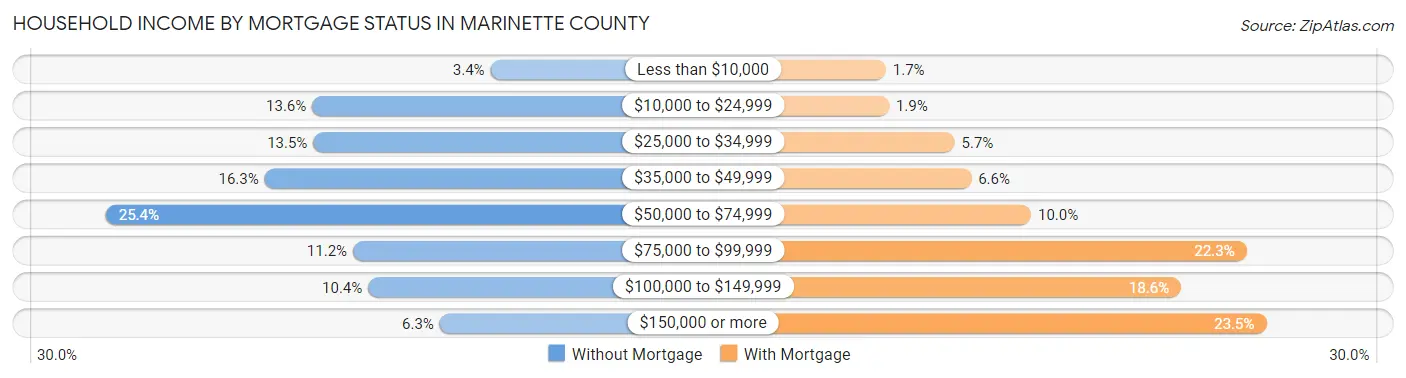
| Household Income | Without Mortgage | With Mortgage |
| Less than $10,000 | 235 (3.4%) | 135 (1.7%) |
| $10,000 to $24,999 | 944 (13.6%) | 149 (1.9%) |
| $25,000 to $34,999 | 940 (13.5%) | 442 (5.7%) |
| $35,000 to $49,999 | 1,133 (16.3%) | 516 (6.6%) |
| $50,000 to $74,999 | 1,764 (25.4%) | 783 (10.0%) |
| $75,000 to $99,999 | 782 (11.2%) | 1,744 (22.3%) |
| $100,000 to $149,999 | 721 (10.4%) | 1,452 (18.6%) |
| $150,000 or more | 437 (6.3%) | 1,832 (23.5%) |
| Total | 6,956 (100.0%) | 7,806 (100.0%) |
Property Value to Household Income Ratio in Marinette County
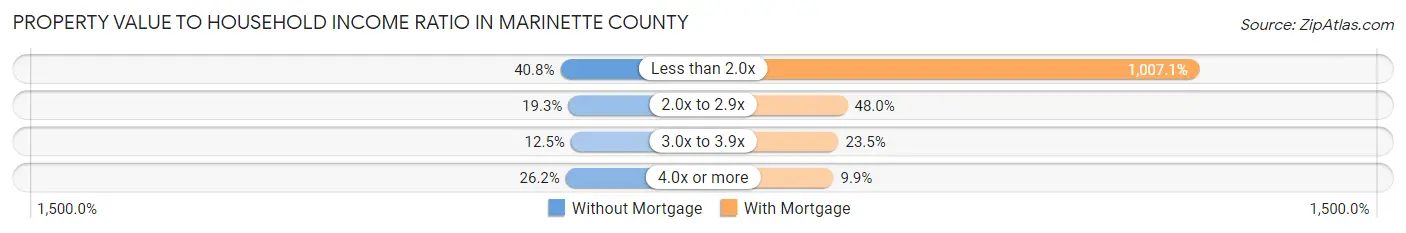
| Value-to-Income Ratio | Without Mortgage | With Mortgage |
| Less than 2.0x | 2,836 (40.8%) | 78,612 (1,007.1%) |
| 2.0x to 2.9x | 1,343 (19.3%) | 3,745 (48.0%) |
| 3.0x to 3.9x | 869 (12.5%) | 1,835 (23.5%) |
| 4.0x or more | 1,819 (26.2%) | 771 (9.9%) |
| Total | 6,956 (100.0%) | 7,806 (100.0%) |
Real Estate Taxes by Mortgage Status in Marinette County

| Property Taxes | Without Mortgage | With Mortgage |
| Less than $800 | 711 (10.2%) | 42 (0.5%) |
| $800 to $1,499 | 1,945 (28.0%) | 399 (5.1%) |
| $800 to $1,499 | 3,919 (56.3%) | 1,780 (22.8%) |
| Total | 6,956 (100.0%) | 7,806 (100.0%) |
Health & Disability in Marinette County
Health Insurance Coverage by Age in Marinette County
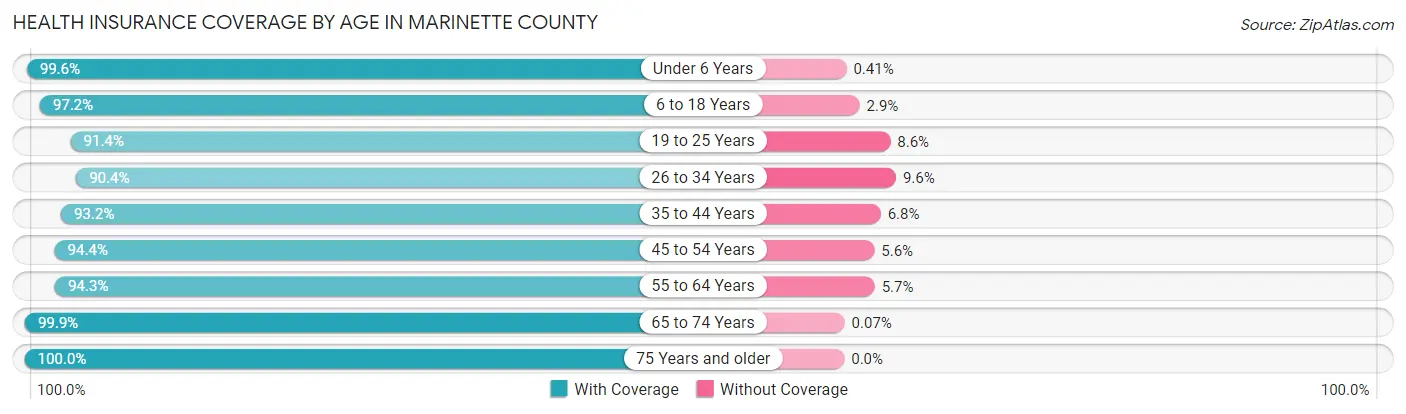
| Age Bracket | With Coverage | Without Coverage |
| Under 6 Years | 2,445 (99.6%) | 10 (0.4%) |
| 6 to 18 Years | 5,824 (97.2%) | 171 (2.9%) |
| 19 to 25 Years | 2,267 (91.4%) | 213 (8.6%) |
| 26 to 34 Years | 3,308 (90.4%) | 353 (9.6%) |
| 35 to 44 Years | 4,217 (93.2%) | 307 (6.8%) |
| 45 to 54 Years | 4,716 (94.4%) | 280 (5.6%) |
| 55 to 64 Years | 6,986 (94.3%) | 420 (5.7%) |
| 65 to 74 Years | 5,839 (99.9%) | 4 (0.1%) |
| 75 Years and older | 3,928 (100.0%) | 0 (0.0%) |
| Total | 39,530 (95.7%) | 1,758 (4.3%) |
Health Insurance Coverage by Citizenship Status in Marinette County
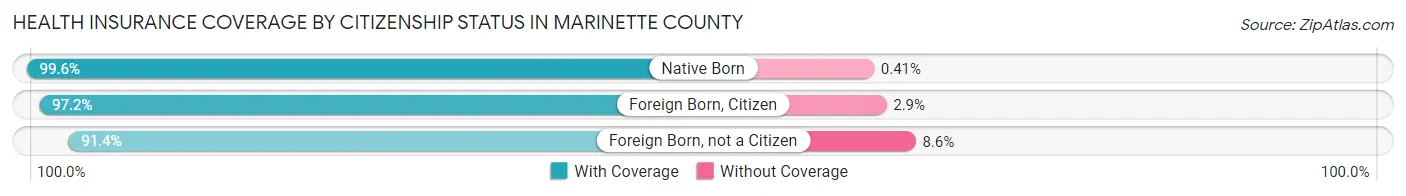
| Citizenship Status | With Coverage | Without Coverage |
| Native Born | 2,445 (99.6%) | 10 (0.4%) |
| Foreign Born, Citizen | 5,824 (97.2%) | 171 (2.9%) |
| Foreign Born, not a Citizen | 2,267 (91.4%) | 213 (8.6%) |
Health Insurance Coverage by Household Income in Marinette County
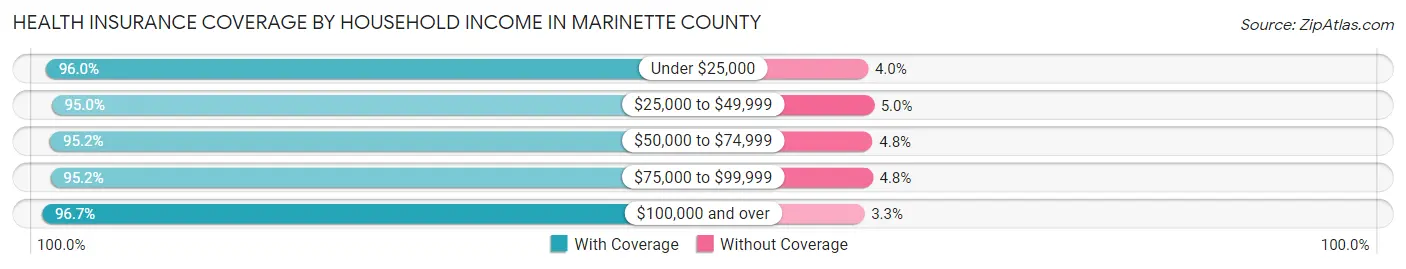
| Household Income | With Coverage | Without Coverage |
| Under $25,000 | 4,146 (96.0%) | 171 (4.0%) |
| $25,000 to $49,999 | 7,788 (95.0%) | 413 (5.0%) |
| $50,000 to $74,999 | 8,531 (95.2%) | 429 (4.8%) |
| $75,000 to $99,999 | 6,553 (95.2%) | 332 (4.8%) |
| $100,000 and over | 12,215 (96.7%) | 412 (3.3%) |
Public vs Private Health Insurance Coverage by Age in Marinette County
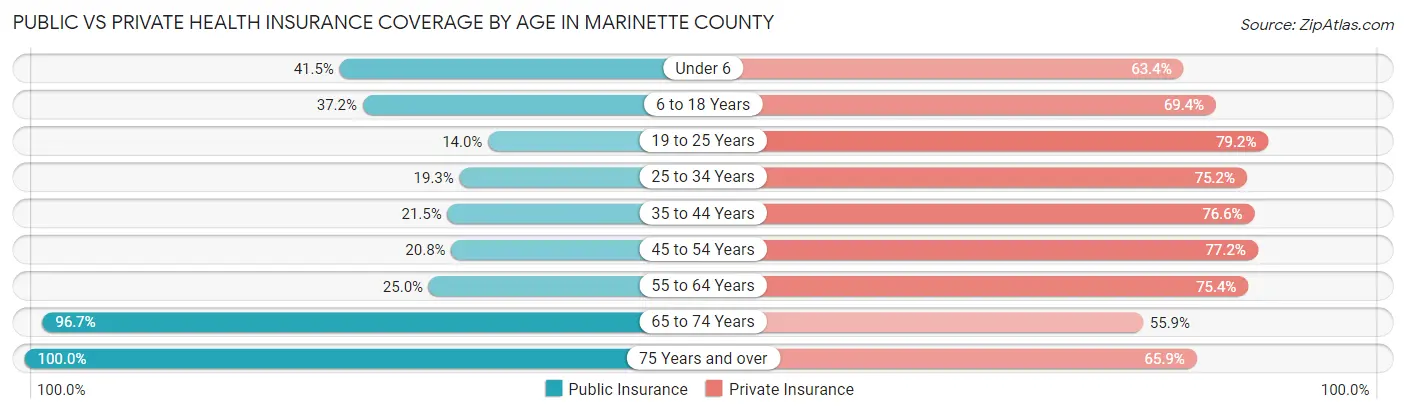
| Age Bracket | Public Insurance | Private Insurance |
| Under 6 | 1,019 (41.5%) | 1,557 (63.4%) |
| 6 to 18 Years | 2,232 (37.2%) | 4,163 (69.4%) |
| 19 to 25 Years | 346 (14.0%) | 1,963 (79.1%) |
| 25 to 34 Years | 705 (19.3%) | 2,752 (75.2%) |
| 35 to 44 Years | 972 (21.5%) | 3,465 (76.6%) |
| 45 to 54 Years | 1,038 (20.8%) | 3,856 (77.2%) |
| 55 to 64 Years | 1,848 (24.9%) | 5,586 (75.4%) |
| 65 to 74 Years | 5,650 (96.7%) | 3,265 (55.9%) |
| 75 Years and over | 3,928 (100.0%) | 2,587 (65.9%) |
| Total | 17,738 (43.0%) | 29,194 (70.7%) |
Disability Status by Sex by Age in Marinette County

| Age Bracket | Male | Female |
| Under 5 Years | 14 (1.5%) | 0 (0.0%) |
| 5 to 17 Years | 374 (12.0%) | 110 (3.8%) |
| 18 to 34 Years | 192 (5.6%) | 338 (10.4%) |
| 35 to 64 Years | 1,294 (14.8%) | 1,249 (15.2%) |
| 65 to 74 Years | 906 (30.5%) | 475 (16.5%) |
| 75 Years and over | 755 (43.1%) | 854 (39.2%) |
Disability Class by Sex by Age in Marinette County
Disability Class: Hearing Difficulty
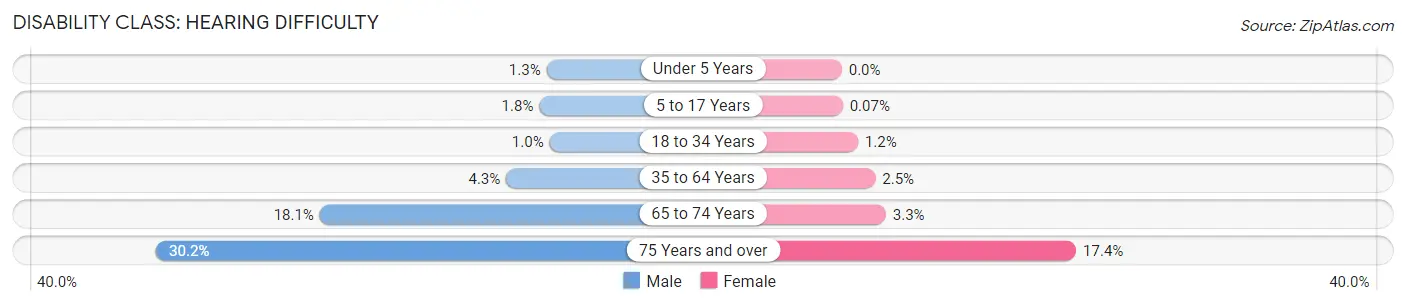
| Age Bracket | Male | Female |
| Under 5 Years | 12 (1.3%) | 0 (0.0%) |
| 5 to 17 Years | 56 (1.8%) | 2 (0.1%) |
| 18 to 34 Years | 35 (1.0%) | 39 (1.2%) |
| 35 to 64 Years | 371 (4.3%) | 204 (2.5%) |
| 65 to 74 Years | 537 (18.1%) | 94 (3.3%) |
| 75 Years and over | 529 (30.2%) | 379 (17.4%) |
Disability Class: Vision Difficulty
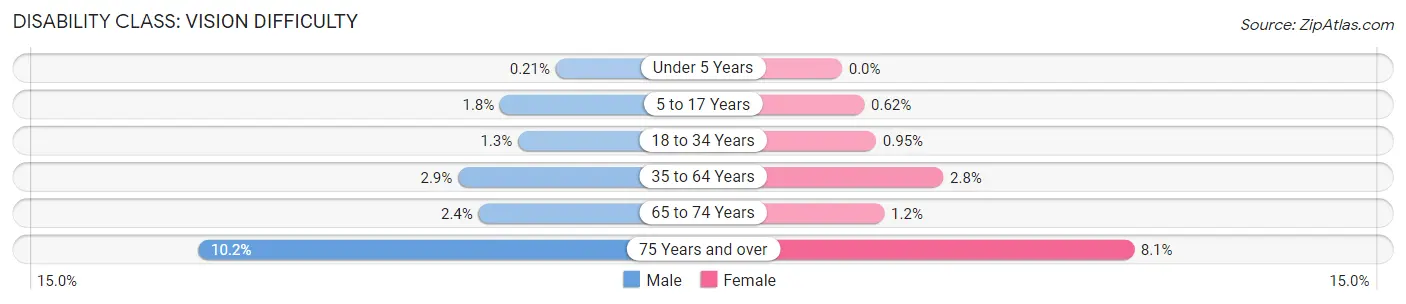
| Age Bracket | Male | Female |
| Under 5 Years | 2 (0.2%) | 0 (0.0%) |
| 5 to 17 Years | 55 (1.8%) | 18 (0.6%) |
| 18 to 34 Years | 43 (1.3%) | 31 (0.9%) |
| 35 to 64 Years | 256 (2.9%) | 231 (2.8%) |
| 65 to 74 Years | 70 (2.4%) | 34 (1.2%) |
| 75 Years and over | 178 (10.2%) | 177 (8.1%) |
Disability Class: Cognitive Difficulty
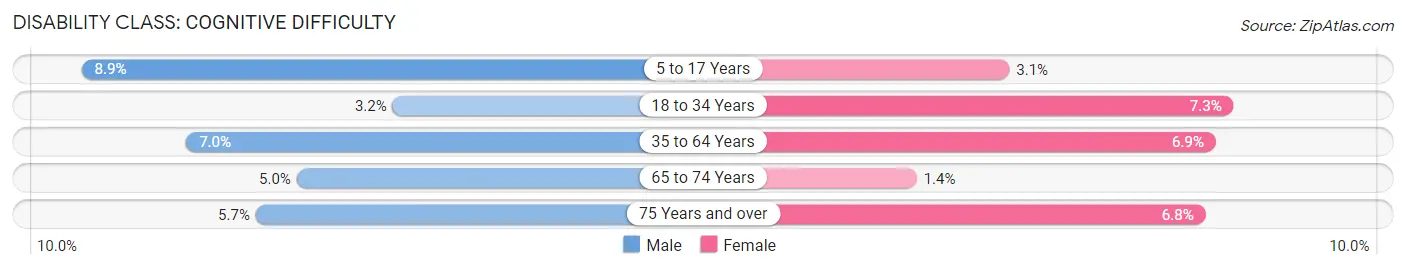
| Age Bracket | Male | Female |
| 5 to 17 Years | 279 (8.9%) | 90 (3.1%) |
| 18 to 34 Years | 108 (3.2%) | 237 (7.3%) |
| 35 to 64 Years | 611 (7.0%) | 569 (6.9%) |
| 65 to 74 Years | 147 (5.0%) | 40 (1.4%) |
| 75 Years and over | 100 (5.7%) | 147 (6.8%) |
Disability Class: Ambulatory Difficulty
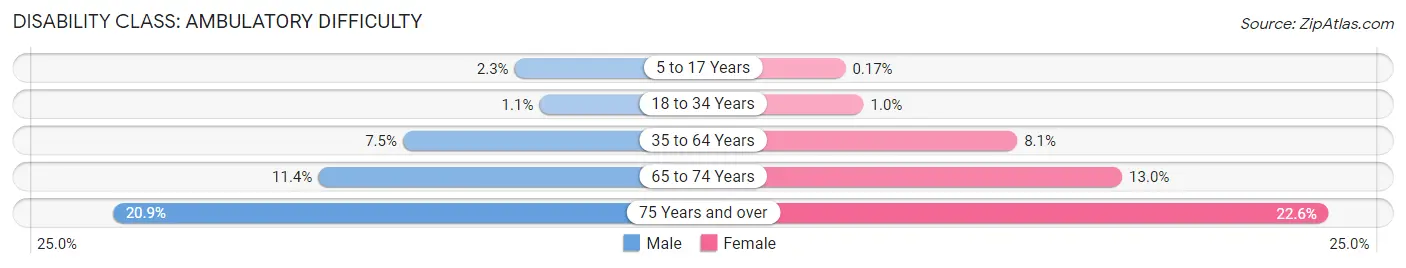
| Age Bracket | Male | Female |
| 5 to 17 Years | 71 (2.3%) | 5 (0.2%) |
| 18 to 34 Years | 38 (1.1%) | 33 (1.0%) |
| 35 to 64 Years | 650 (7.4%) | 667 (8.1%) |
| 65 to 74 Years | 338 (11.4%) | 374 (13.0%) |
| 75 Years and over | 366 (20.9%) | 492 (22.6%) |
Disability Class: Self-Care Difficulty
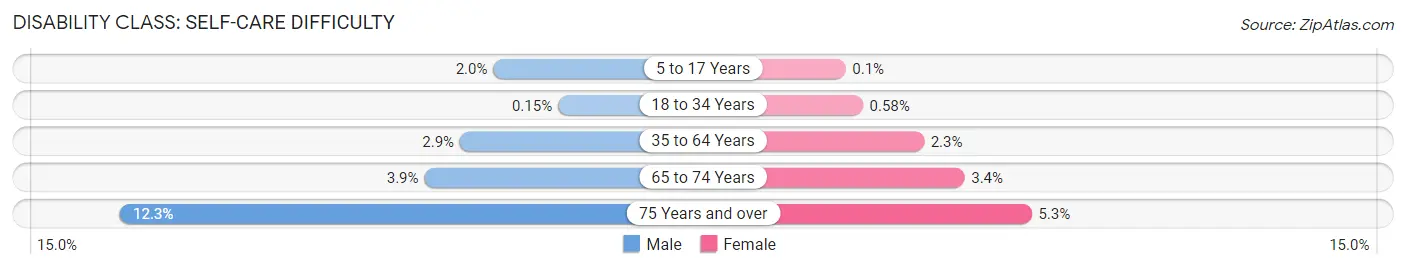
| Age Bracket | Male | Female |
| 5 to 17 Years | 61 (1.9%) | 3 (0.1%) |
| 18 to 34 Years | 5 (0.2%) | 19 (0.6%) |
| 35 to 64 Years | 251 (2.9%) | 187 (2.3%) |
| 65 to 74 Years | 115 (3.9%) | 98 (3.4%) |
| 75 Years and over | 216 (12.3%) | 115 (5.3%) |
Technology Access in Marinette County
Computing Device Access in Marinette County
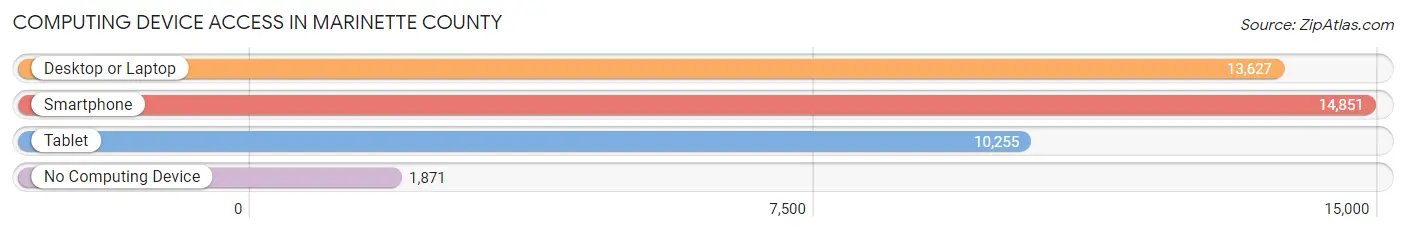
| Device Type | # Households | % Households |
| Desktop or Laptop | 13,627 | 73.4% |
| Smartphone | 14,851 | 80.0% |
| Tablet | 10,255 | 55.2% |
| No Computing Device | 1,871 | 10.1% |
| Total | 18,569 | 100.0% |
Internet Access in Marinette County
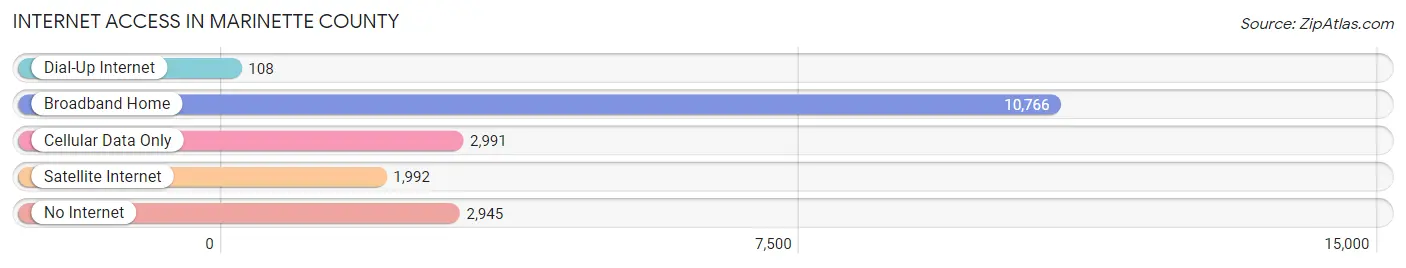
| Internet Type | # Households | % Households |
| Dial-Up Internet | 108 | 0.6% |
| Broadband Home | 10,766 | 58.0% |
| Cellular Data Only | 2,991 | 16.1% |
| Satellite Internet | 1,992 | 10.7% |
| No Internet | 2,945 | 15.9% |
| Total | 18,569 | 100.0% |
Marinette County Summary
Marinette County is located in the northeastern corner of Wisconsin, bordered by the state of Michigan to the east and Lake Michigan to the north. The county seat is Marinette, and the county is part of the Green Bay Metropolitan Statistical Area. The county was established in 1879 and named after the French explorer, Pierre Marinette.
Geography
Marinette County covers an area of 1,845 square miles and is the largest county in Wisconsin. The county is mostly rural, with a few small towns and villages scattered throughout. The terrain is mostly flat, with some rolling hills and valleys. The highest point in the county is the summit of Mount Morris, which rises to 1,945 feet above sea level. The county is home to several rivers, including the Peshtigo, Menominee, and Oconto Rivers. The county is also home to several lakes, including Lake Noquebay, Lake Poygan, and Lake Metonga.
Climate
Marinette County has a humid continental climate, with cold winters and warm summers. The average annual temperature is around 40°F, with temperatures ranging from an average low of around 20°F in the winter to an average high of around 60°F in the summer. The average annual precipitation is around 33 inches, with snowfall averaging around 50 inches per year.
Demographics
As of the 2010 census, Marinette County had a population of 41,749. The population was spread out, with 24.3% under the age of 18, 8.2% from 18 to 24, 28.2% from 25 to 44, 24.3% from 45 to 64, and 14.0% who were 65 years of age or older. The median age was 38.4 years. The gender makeup of the county was 49.7% male and 50.3% female.
The racial makeup of the county was 95.2% White, 0.7% African American, 1.2% Native American, 0.5% Asian, 0.1% Pacific Islander, 0.9% from other races, and 1.4% from two or more races. Hispanic or Latino of any race were 2.3% of the population.
Economy
Marinette County’s economy is largely based on manufacturing and agriculture. The county is home to several large manufacturing companies, including Marinette Marine, which builds ships for the U.S. Navy, and the Marinette-Menominee Paper Company. Agriculture is also an important part of the county’s economy, with dairy farming and crop production being the main agricultural activities. Tourism is also an important part of the county’s economy, with many visitors coming to the area to enjoy the county’s natural beauty and recreational opportunities.
Marinette County is also home to several educational institutions, including the University of Wisconsin-Marinette, the University of Wisconsin-Green Bay, and the University of Wisconsin-Oshkosh. The county is also home to several hospitals, including Bay Area Medical Center and Aurora BayCare Medical Center.
Marinette County is a great place to live, work, and play. With its beautiful natural scenery, strong economy, and friendly people, Marinette County is a great place to call home.
Common Questions
What is the Total Population of Marinette County?
Total Population of Marinette County is 41,827.
What is the Total Male Population of Marinette County?
Total Male Population of Marinette County is 21,241.
What is the Total Female Population of Marinette County?
Total Female Population of Marinette County is 20,586.
What is the Ratio of Males per 100 Females in Marinette County?
There are 103.18 Males per 100 Females in Marinette County.
What is the Ratio of Females per 100 Males in Marinette County?
There are 96.92 Females per 100 Males in Marinette County.
What is the Median Population Age in Marinette County?
Median Population Age in Marinette County is 48.8 Years.
What is the Average Family Size in Marinette County
Average Family Size in Marinette County is 2.8 People.
What is the Average Household Size in Marinette County
Average Household Size in Marinette County is 2.2 People.
What is Per Capita Income in Marinette County?
Per Capita income in Marinette County is $33,952.
What is the Median Family Income in Marinette County?
Median Family Income in Marinette County is $71,343.
What is the Median Household income in Marinette County?
Median Household Income in Marinette County is $60,347.
What is Income or Wage Gap in Marinette County?
Income or Wage Gap in Marinette County is 40.6%.
Women in Marinette County earn 59.4 cents for every dollar earned by a man.
What is Family Income Deficit in Marinette County?
Family Income Deficit in Marinette County is $8,479.
Families that are below poverty line in Marinette County earn $8,479 less on average than the poverty threshold level.
What is Inequality or Gini Index in Marinette County?
Inequality or Gini Index in Marinette County is 0.41.
How Large is the Labor Force in Marinette County?
There are 19,882 People in the Labor Forcein in Marinette County.
What is the Percentage of People in the Labor Force in Marinette County?
57.0% of People are in the Labor Force in Marinette County.
What is the Unemployment Rate in Marinette County?
Unemployment Rate in Marinette County is 3.8%.