Marathon County, WI
Marathon County Map
Marathon County Overview
137,820
TOTAL POPULATION
69,713
MALE POPULATION
68,107
FEMALE POPULATION
102.36
MALES / 100 FEMALES
97.70
FEMALES / 100 MALES
41.0
MEDIAN AGE
2.9
AVG FAMILY SIZE
2.4
AVG HOUSEHOLD SIZE
$38,886
PER CAPITA INCOME
$90,578
AVG FAMILY INCOME
$73,248
AVG HOUSEHOLD INCOME
25.2%
WAGE / INCOME GAP [ % ]
74.8¢/ $1
WAGE / INCOME GAP [ $ ]
$11,536
FAMILY INCOME DEFICIT
0.42
INEQUALITY / GINI INDEX
74,091
LABOR FORCE [ PEOPLE ]
67.0%
PERCENT IN LABOR FORCE
3.1%
UNEMPLOYMENT RATE
Marathon County Area Codes
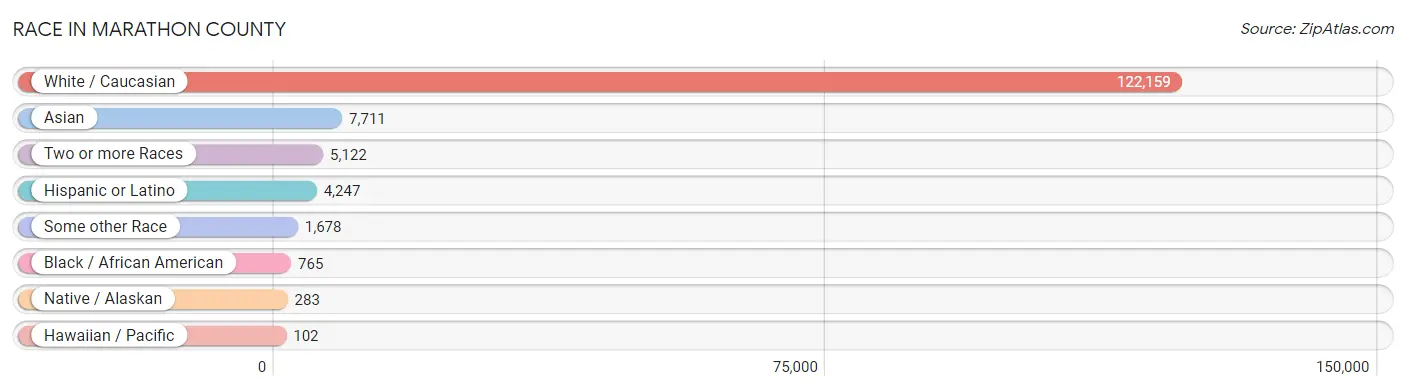
Race in Marathon County
The most populous races in Marathon County are White / Caucasian (122,159 | 88.6%), Asian (7,711 | 5.6%), and Two or more Races (5,122 | 3.7%).
| Race | # Population | % Population |
| Asian | 7,711 | 5.6% |
| Black / African American | 765 | 0.6% |
| Hawaiian / Pacific | 102 | 0.1% |
| Hispanic or Latino | 4,247 | 3.1% |
| Native / Alaskan | 283 | 0.2% |
| White / Caucasian | 122,159 | 88.6% |
| Two or more Races | 5,122 | 3.7% |
| Some other Race | 1,678 | 1.2% |
| Total | 137,820 | 100.0% |
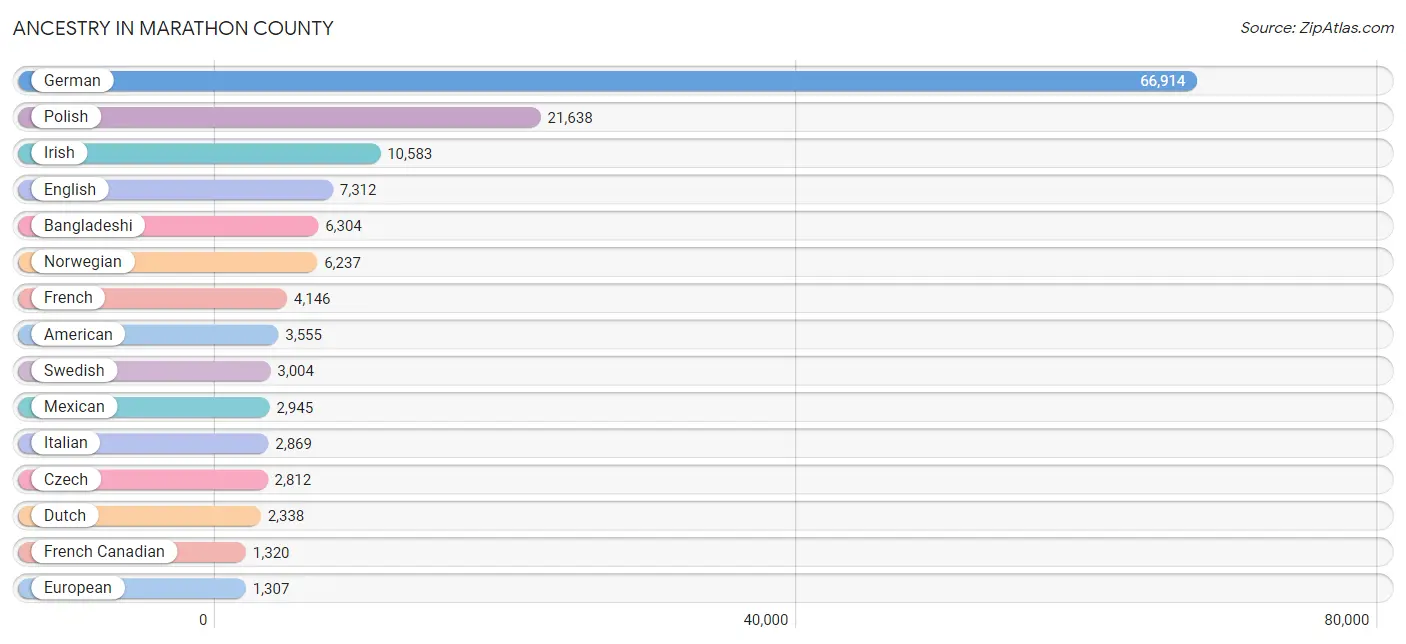
Ancestry in Marathon County
The most populous ancestries reported in Marathon County are German (66,914 | 48.5%), Polish (21,638 | 15.7%), Irish (10,583 | 7.7%), English (7,312 | 5.3%), and Bangladeshi (6,304 | 4.6%), together accounting for 81.8% of all Marathon County residents.
| Ancestry | # Population | % Population |
| African | 186 | 0.1% |
| Alaska Native | 7 | 0.0% |
| American | 3,555 | 2.6% |
| Apache | 23 | 0.0% |
| Arab | 180 | 0.1% |
| Argentinean | 11 | 0.0% |
| Armenian | 17 | 0.0% |
| Australian | 5 | 0.0% |
| Austrian | 558 | 0.4% |
| Bangladeshi | 6,304 | 4.6% |
| Basque | 5 | 0.0% |
| Belgian | 275 | 0.2% |
| Bhutanese | 161 | 0.1% |
| Blackfeet | 23 | 0.0% |
| Brazilian | 17 | 0.0% |
| British | 286 | 0.2% |
| Bulgarian | 38 | 0.0% |
| Burmese | 100 | 0.1% |
| Canadian | 160 | 0.1% |
| Celtic | 11 | 0.0% |
| Central American | 472 | 0.3% |
| Central American Indian | 8 | 0.0% |
| Cherokee | 155 | 0.1% |
| Cheyenne | 30 | 0.0% |
| Chilean | 3 | 0.0% |
| Chippewa | 461 | 0.3% |
| Choctaw | 37 | 0.0% |
| Colombian | 131 | 0.1% |
| Comanche | 23 | 0.0% |
| Costa Rican | 9 | 0.0% |
| Creek | 4 | 0.0% |
| Croatian | 274 | 0.2% |
| Cuban | 57 | 0.0% |
| Czech | 2,812 | 2.0% |
| Czechoslovakian | 166 | 0.1% |
| Danish | 679 | 0.5% |
| Dutch | 2,338 | 1.7% |
| Eastern European | 141 | 0.1% |
| Ecuadorian | 5 | 0.0% |
| Egyptian | 43 | 0.0% |
| English | 7,312 | 5.3% |
| Estonian | 5 | 0.0% |
| European | 1,307 | 0.9% |
| Fijian | 51 | 0.0% |
| Filipino | 49 | 0.0% |
| Finnish | 885 | 0.6% |
| French | 4,146 | 3.0% |
| French American Indian | 106 | 0.1% |
| French Canadian | 1,320 | 1.0% |
| German | 66,914 | 48.5% |
| Greek | 221 | 0.2% |
| Guamanian / Chamorro | 6 | 0.0% |
| Guatemalan | 30 | 0.0% |
| Honduran | 5 | 0.0% |
| Hungarian | 304 | 0.2% |
| Icelander | 12 | 0.0% |
| Indian (Asian) | 331 | 0.2% |
| Inupiat | 1 | 0.0% |
| Iranian | 3 | 0.0% |
| Irish | 10,583 | 7.7% |
| Iroquois | 57 | 0.0% |
| Italian | 2,869 | 2.1% |
| Jamaican | 50 | 0.0% |
| Japanese | 153 | 0.1% |
| Jordanian | 8 | 0.0% |
| Korean | 934 | 0.7% |
| Latvian | 75 | 0.1% |
| Lebanese | 66 | 0.1% |
| Lithuanian | 146 | 0.1% |
| Luxembourger | 55 | 0.0% |
| Malaysian | 242 | 0.2% |
| Menominee | 28 | 0.0% |
| Mexican | 2,945 | 2.1% |
| Mexican American Indian | 130 | 0.1% |
| Mongolian | 4 | 0.0% |
| Moroccan | 9 | 0.0% |
| Native Hawaiian | 127 | 0.1% |
| Navajo | 76 | 0.1% |
| Nicaraguan | 343 | 0.3% |
| Nigerian | 9 | 0.0% |
| Northern European | 407 | 0.3% |
| Norwegian | 6,237 | 4.5% |
| Pakistani | 103 | 0.1% |
| Palestinian | 12 | 0.0% |
| Panamanian | 31 | 0.0% |
| Paraguayan | 15 | 0.0% |
| Pennsylvania German | 165 | 0.1% |
| Peruvian | 32 | 0.0% |
| Polish | 21,638 | 15.7% |
| Portuguese | 106 | 0.1% |
| Potawatomi | 33 | 0.0% |
| Pueblo | 8 | 0.0% |
| Puerto Rican | 306 | 0.2% |
| Romanian | 21 | 0.0% |
| Russian | 619 | 0.4% |
| Salvadoran | 54 | 0.0% |
| Samoan | 26 | 0.0% |
| Scandinavian | 602 | 0.4% |
| Scotch-Irish | 344 | 0.3% |
| Scottish | 895 | 0.6% |
| Serbian | 12 | 0.0% |
| Sioux | 25 | 0.0% |
| Slavic | 180 | 0.1% |
| Slovak | 127 | 0.1% |
| Slovene | 125 | 0.1% |
| South African | 12 | 0.0% |
| South American | 200 | 0.2% |
| Spaniard | 62 | 0.0% |
| Spanish | 95 | 0.1% |
| Sri Lankan | 292 | 0.2% |
| Subsaharan African | 207 | 0.2% |
| Swedish | 3,004 | 2.2% |
| Swiss | 1,096 | 0.8% |
| Syrian | 7 | 0.0% |
| Thai | 873 | 0.6% |
| Ukrainian | 419 | 0.3% |
| Venezuelan | 3 | 0.0% |
| Welsh | 490 | 0.4% |
| Yugoslavian | 27 | 0.0% | View All 119 Rows |
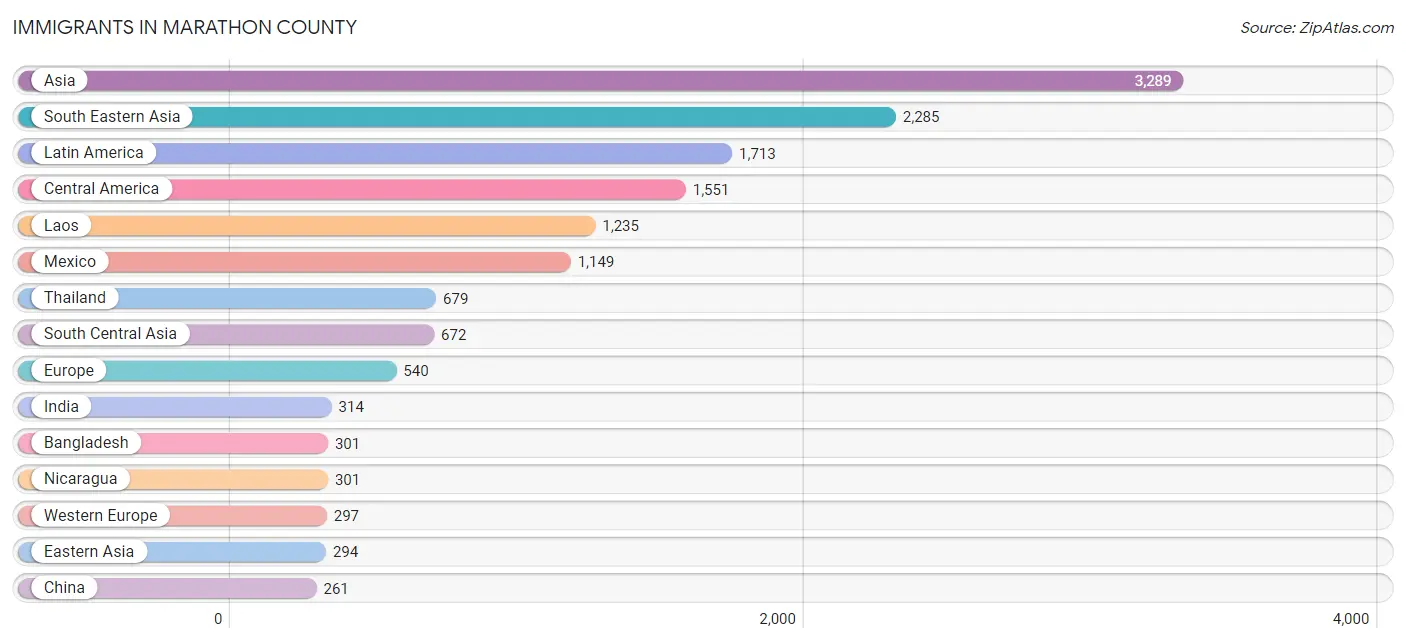
Immigrants in Marathon County
The most numerous immigrant groups reported in Marathon County came from Asia (3,289 | 2.4%), South Eastern Asia (2,285 | 1.7%), Latin America (1,713 | 1.2%), Central America (1,551 | 1.1%), and Laos (1,235 | 0.9%), together accounting for 7.3% of all Marathon County residents.
| Immigration Origin | # Population | % Population |
| Afghanistan | 48 | 0.0% |
| Africa | 108 | 0.1% |
| Argentina | 10 | 0.0% |
| Asia | 3,289 | 2.4% |
| Austria | 7 | 0.0% |
| Bangladesh | 301 | 0.2% |
| Belarus | 8 | 0.0% |
| Brazil | 33 | 0.0% |
| Bulgaria | 3 | 0.0% |
| Cambodia | 38 | 0.0% |
| Canada | 233 | 0.2% |
| Caribbean | 1 | 0.0% |
| Central America | 1,551 | 1.1% |
| Chile | 3 | 0.0% |
| China | 261 | 0.2% |
| Colombia | 84 | 0.1% |
| Costa Rica | 9 | 0.0% |
| Czechoslovakia | 1 | 0.0% |
| Denmark | 11 | 0.0% |
| Eastern Africa | 1 | 0.0% |
| Eastern Asia | 294 | 0.2% |
| Eastern Europe | 152 | 0.1% |
| Ecuador | 5 | 0.0% |
| El Salvador | 28 | 0.0% |
| England | 55 | 0.0% |
| Europe | 540 | 0.4% |
| France | 55 | 0.0% |
| Germany | 142 | 0.1% |
| Guatemala | 30 | 0.0% |
| Honduras | 5 | 0.0% |
| India | 314 | 0.2% |
| Iran | 3 | 0.0% |
| Ireland | 2 | 0.0% |
| Japan | 9 | 0.0% |
| Kazakhstan | 6 | 0.0% |
| Kenya | 1 | 0.0% |
| Korea | 24 | 0.0% |
| Laos | 1,235 | 0.9% |
| Latin America | 1,713 | 1.2% |
| Latvia | 20 | 0.0% |
| Malaysia | 15 | 0.0% |
| Mexico | 1,149 | 0.8% |
| Middle Africa | 2 | 0.0% |
| Netherlands | 63 | 0.1% |
| Nicaragua | 301 | 0.2% |
| Nigeria | 88 | 0.1% |
| Northern Europe | 91 | 0.1% |
| Norway | 2 | 0.0% |
| Panama | 29 | 0.0% |
| Peru | 8 | 0.0% |
| Philippines | 134 | 0.1% |
| Poland | 49 | 0.0% |
| Russia | 56 | 0.0% |
| Scotland | 2 | 0.0% |
| Singapore | 37 | 0.0% |
| South Africa | 17 | 0.0% |
| South America | 161 | 0.1% |
| South Central Asia | 672 | 0.5% |
| South Eastern Asia | 2,285 | 1.7% |
| Switzerland | 30 | 0.0% |
| Syria | 8 | 0.0% |
| Taiwan | 18 | 0.0% |
| Thailand | 679 | 0.5% |
| Trinidad and Tobago | 1 | 0.0% |
| Ukraine | 15 | 0.0% |
| Venezuela | 3 | 0.0% |
| Vietnam | 145 | 0.1% |
| Western Africa | 88 | 0.1% |
| Western Asia | 26 | 0.0% |
| Western Europe | 297 | 0.2% |
| Zaire | 2 | 0.0% | View All 71 Rows |
Sex and Age in Marathon County
Sex and Age in Marathon County
The most populous age groups in Marathon County are 55 to 59 Years (5,244 | 7.5%) for men and 60 to 64 Years (5,041 | 7.4%) for women.
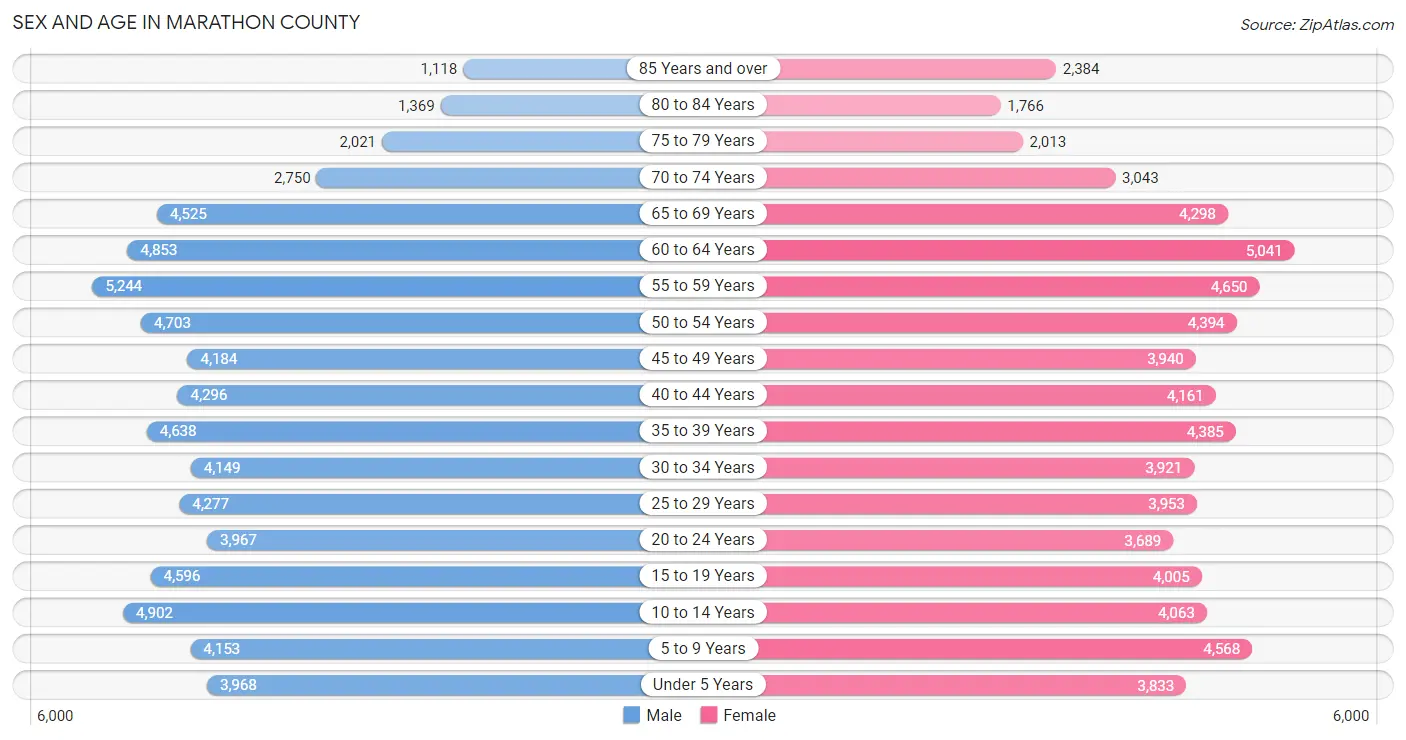
| Age Bracket | Male | Female |
| Under 5 Years | 3,968 (5.7%) | 3,833 (5.6%) |
| 5 to 9 Years | 4,153 (6.0%) | 4,568 (6.7%) |
| 10 to 14 Years | 4,902 (7.0%) | 4,063 (6.0%) |
| 15 to 19 Years | 4,596 (6.6%) | 4,005 (5.9%) |
| 20 to 24 Years | 3,967 (5.7%) | 3,689 (5.4%) |
| 25 to 29 Years | 4,277 (6.1%) | 3,953 (5.8%) |
| 30 to 34 Years | 4,149 (5.9%) | 3,921 (5.8%) |
| 35 to 39 Years | 4,638 (6.7%) | 4,385 (6.4%) |
| 40 to 44 Years | 4,296 (6.2%) | 4,161 (6.1%) |
| 45 to 49 Years | 4,184 (6.0%) | 3,940 (5.8%) |
| 50 to 54 Years | 4,703 (6.8%) | 4,394 (6.5%) |
| 55 to 59 Years | 5,244 (7.5%) | 4,650 (6.8%) |
| 60 to 64 Years | 4,853 (7.0%) | 5,041 (7.4%) |
| 65 to 69 Years | 4,525 (6.5%) | 4,298 (6.3%) |
| 70 to 74 Years | 2,750 (3.9%) | 3,043 (4.5%) |
| 75 to 79 Years | 2,021 (2.9%) | 2,013 (3.0%) |
| 80 to 84 Years | 1,369 (2.0%) | 1,766 (2.6%) |
| 85 Years and over | 1,118 (1.6%) | 2,384 (3.5%) |
| Total | 69,713 (100.0%) | 68,107 (100.0%) |
Families and Households in Marathon County
Median Family Size in Marathon County
The median family size in Marathon County is 2.92 persons per family, with married-couple families (29,938 | 81.0%) accounting for the largest median family size of 2.99 persons per family. On the other hand, single male/father families (2,726 | 7.4%) represent the smallest median family size with 2.53 persons per family.
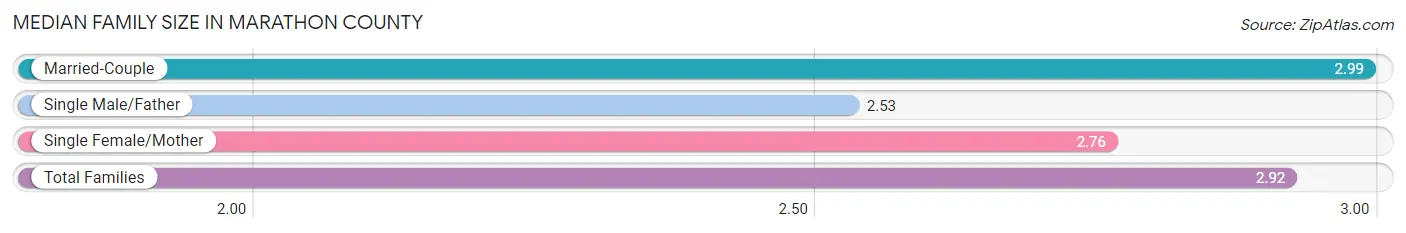
| Family Type | # Families | Family Size |
| Married-Couple | 29,938 (81.0%) | 2.99 |
| Single Male/Father | 2,726 (7.4%) | 2.53 |
| Single Female/Mother | 4,315 (11.7%) | 2.76 |
| Total Families | 36,979 (100.0%) | 2.92 |
Median Household Size in Marathon County
The median household size in Marathon County is 2.41 persons per household, with single female/mother households (4,315 | 7.6%) accounting for the largest median household size of 3.05 persons per household. non-family households (19,505 | 34.5%) represent the smallest median household size with 1.27 persons per household.
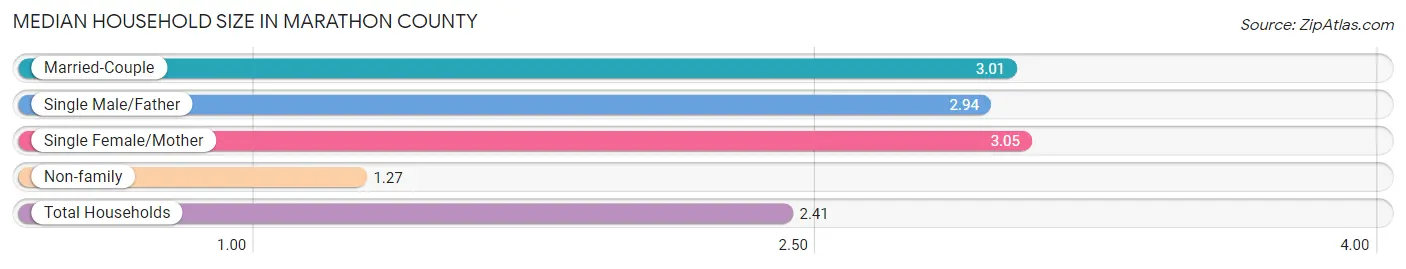
| Household Type | # Households | Household Size |
| Married-Couple | 29,938 (53.0%) | 3.01 |
| Single Male/Father | 2,726 (4.8%) | 2.94 |
| Single Female/Mother | 4,315 (7.6%) | 3.05 |
| Non-family | 19,505 (34.5%) | 1.27 |
| Total Households | 56,484 (100.0%) | 2.41 |
Household Size by Marriage Status in Marathon County
Out of a total of 56,484 households in Marathon County, 36,979 (65.5%) are family households, while 19,505 (34.5%) are nonfamily households. The most numerous type of family households are 2-person households, comprising 18,754, and the most common type of nonfamily households are 1-person households, comprising 15,316.
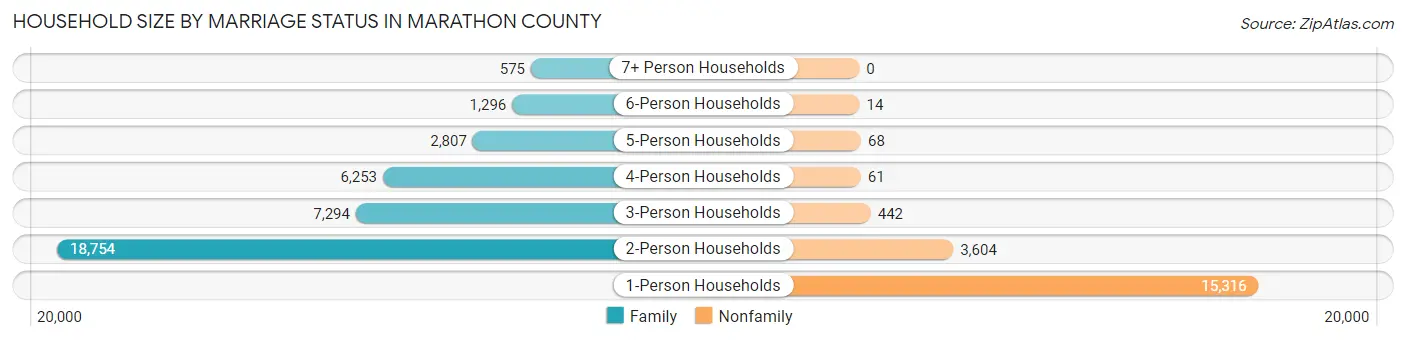
| Household Size | Family Households | Nonfamily Households |
| 1-Person Households | - | 15,316 (27.1%) |
| 2-Person Households | 18,754 (33.2%) | 3,604 (6.4%) |
| 3-Person Households | 7,294 (12.9%) | 442 (0.8%) |
| 4-Person Households | 6,253 (11.1%) | 61 (0.1%) |
| 5-Person Households | 2,807 (5.0%) | 68 (0.1%) |
| 6-Person Households | 1,296 (2.3%) | 14 (0.0%) |
| 7+ Person Households | 575 (1.0%) | 0 (0.0%) |
| Total | 36,979 (65.5%) | 19,505 (34.5%) |
Female Fertility in Marathon County
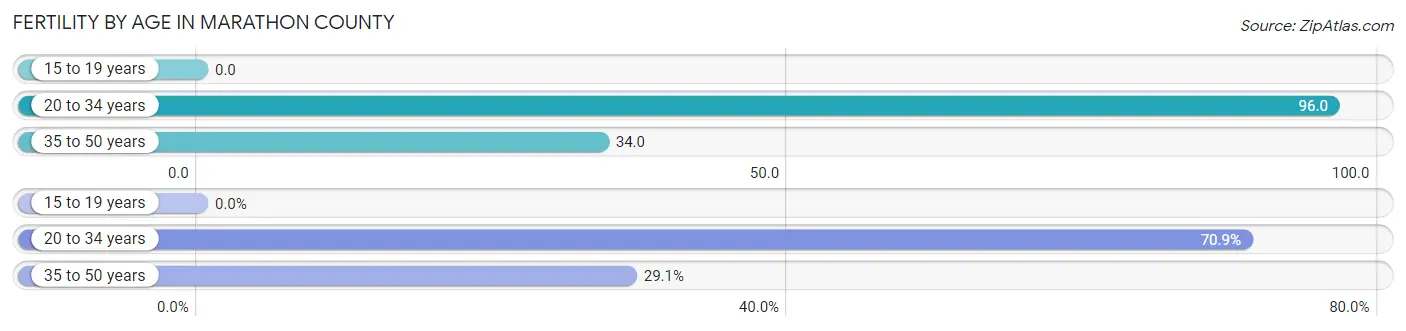
Fertility by Age in Marathon County
Average fertility rate in Marathon County is 54.0 births per 1,000 women. Women in the age bracket of 20 to 34 years have the highest fertility rate with 96.0 births per 1,000 women. Women in the age bracket of 20 to 34 years acount for 70.9% of all women with births.
| Age Bracket | Women with Births | Births / 1,000 Women |
| 15 to 19 years | 0 (0.0%) | 0.0 |
| 20 to 34 years | 1,106 (70.9%) | 96.0 |
| 35 to 50 years | 454 (29.1%) | 34.0 |
| Total | 1,560 (100.0%) | 54.0 |
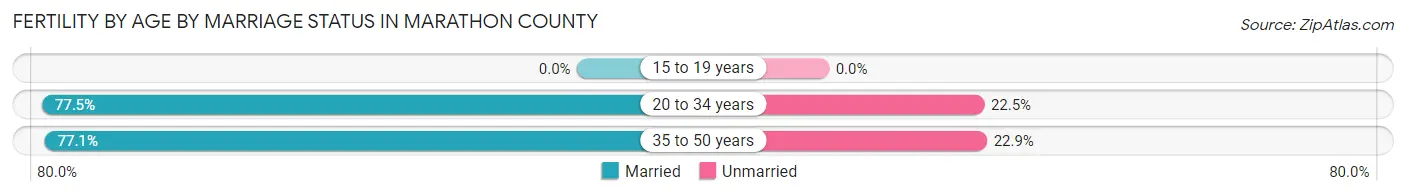
Fertility by Age by Marriage Status in Marathon County
77.4% of women with births (1,560) in Marathon County are married. The highest percentage of unmarried women with births falls into 35 to 50 years age bracket with 22.9% of them unmarried at the time of birth, while the lowest percentage of unmarried women with births belong to 20 to 34 years age bracket with 22.5% of them unmarried.
| Age Bracket | Married | Unmarried |
| 15 to 19 years | 0 (0.0%) | 0 (0.0%) |
| 20 to 34 years | 857 (77.5%) | 249 (22.5%) |
| 35 to 50 years | 350 (77.1%) | 104 (22.9%) |
| Total | 1,207 (77.4%) | 353 (22.6%) |
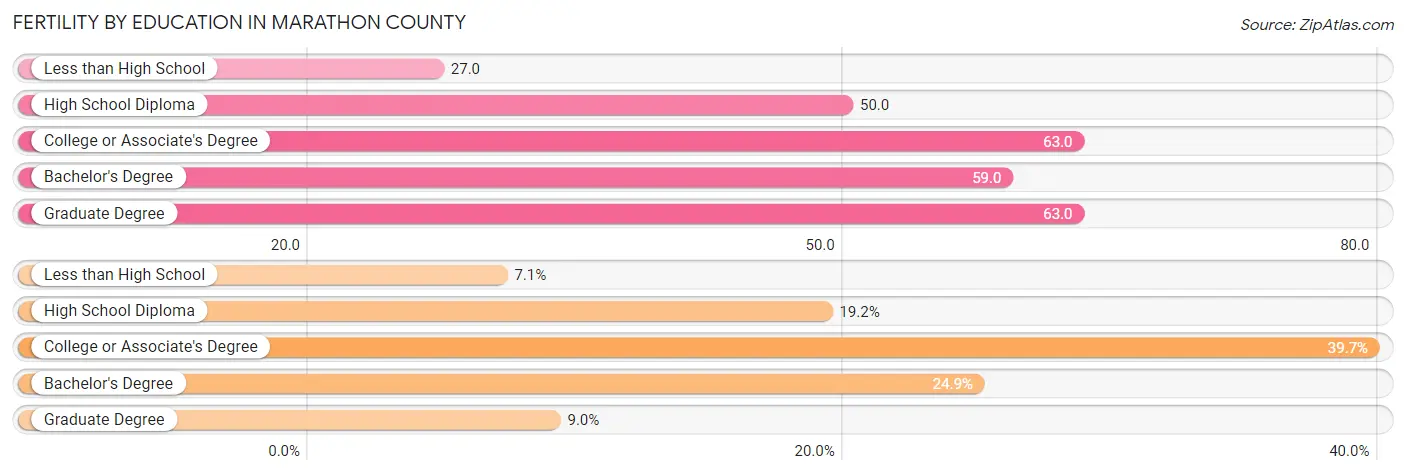
Fertility by Education in Marathon County
Average fertility rate in Marathon County is 54.0 births per 1,000 women. Women with the education attainment of college or associate's degree have the highest fertility rate of 63.0 births per 1,000 women, while women with the education attainment of less than high school have the lowest fertility at 27.0 births per 1,000 women. Women with the education attainment of college or associate's degree represent 39.7% of all women with births.
| Educational Attainment | Women with Births | Births / 1,000 Women |
| Less than High School | 110 (7.0%) | 27.0 |
| High School Diploma | 300 (19.2%) | 50.0 |
| College or Associate's Degree | 620 (39.7%) | 63.0 |
| Bachelor's Degree | 389 (24.9%) | 59.0 |
| Graduate Degree | 141 (9.0%) | 63.0 |
| Total | 1,560 (100.0%) | 54.0 |
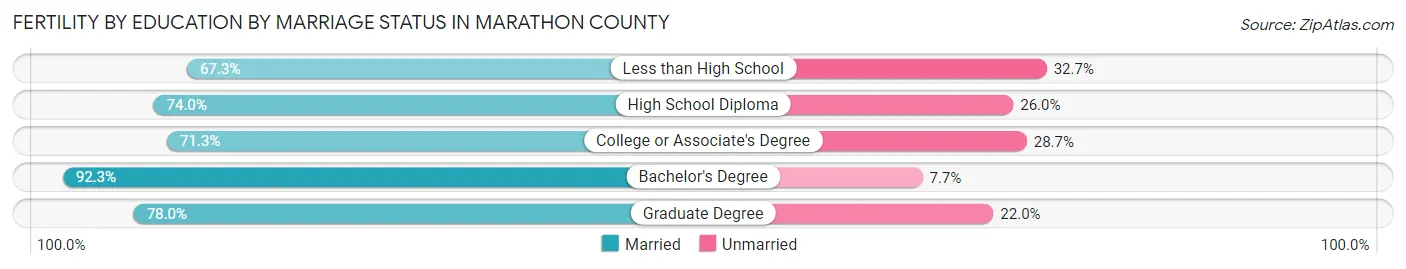
Fertility by Education by Marriage Status in Marathon County
22.6% of women with births in Marathon County are unmarried. Women with the educational attainment of bachelor's degree are most likely to be married with 92.3% of them married at childbirth, while women with the educational attainment of less than high school are least likely to be married with 32.7% of them unmarried at childbirth.
| Educational Attainment | Married | Unmarried |
| Less than High School | 74 (67.3%) | 36 (32.7%) |
| High School Diploma | 222 (74.0%) | 78 (26.0%) |
| College or Associate's Degree | 442 (71.3%) | 178 (28.7%) |
| Bachelor's Degree | 359 (92.3%) | 30 (7.7%) |
| Graduate Degree | 110 (78.0%) | 31 (22.0%) |
| Total | 1,207 (77.4%) | 353 (22.6%) |
Income in Marathon County
Income Overview in Marathon County
Per Capita Income in Marathon County is $38,886, while median incomes of families and households are $90,578 and $73,248 respectively.
| Characteristic | Number | Measure |
| Per Capita Income | 137,820 | $38,886 |
| Median Family Income | 36,979 | $90,578 |
| Mean Family Income | 36,979 | $110,158 |
| Median Household Income | 56,484 | $73,248 |
| Mean Household Income | 56,484 | $93,251 |
| Income Deficit | 36,979 | $11,536 |
| Wage / Income Gap (%) | 137,820 | 25.22% |
| Wage / Income Gap ($) | 137,820 | 74.78¢ per $1 |
| Gini / Inequality Index | 137,820 | 0.42 |
Earnings by Sex in Marathon County
Average Earnings in Marathon County are $42,690, $48,991 for men and $36,637 for women, a difference of 25.2%.
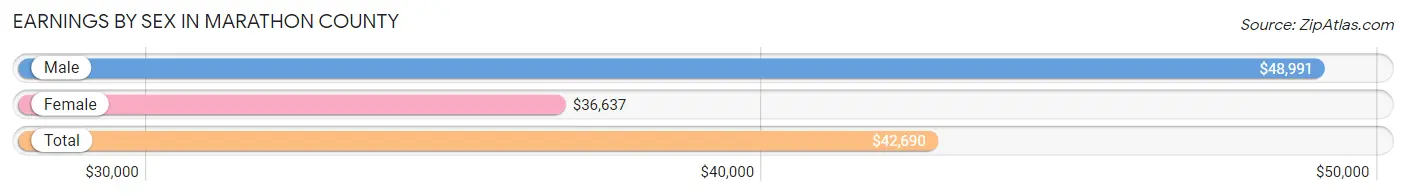
| Sex | Number | Average Earnings |
| Male | 41,561 (53.2%) | $48,991 |
| Female | 36,493 (46.8%) | $36,637 |
| Total | 78,054 (100.0%) | $42,690 |
Earnings by Sex by Income Bracket in Marathon County
The most common earnings brackets in Marathon County are $100,000+ for men (5,426 | 13.1%) and $45,000 to $49,999 for women (2,853 | 7.8%).
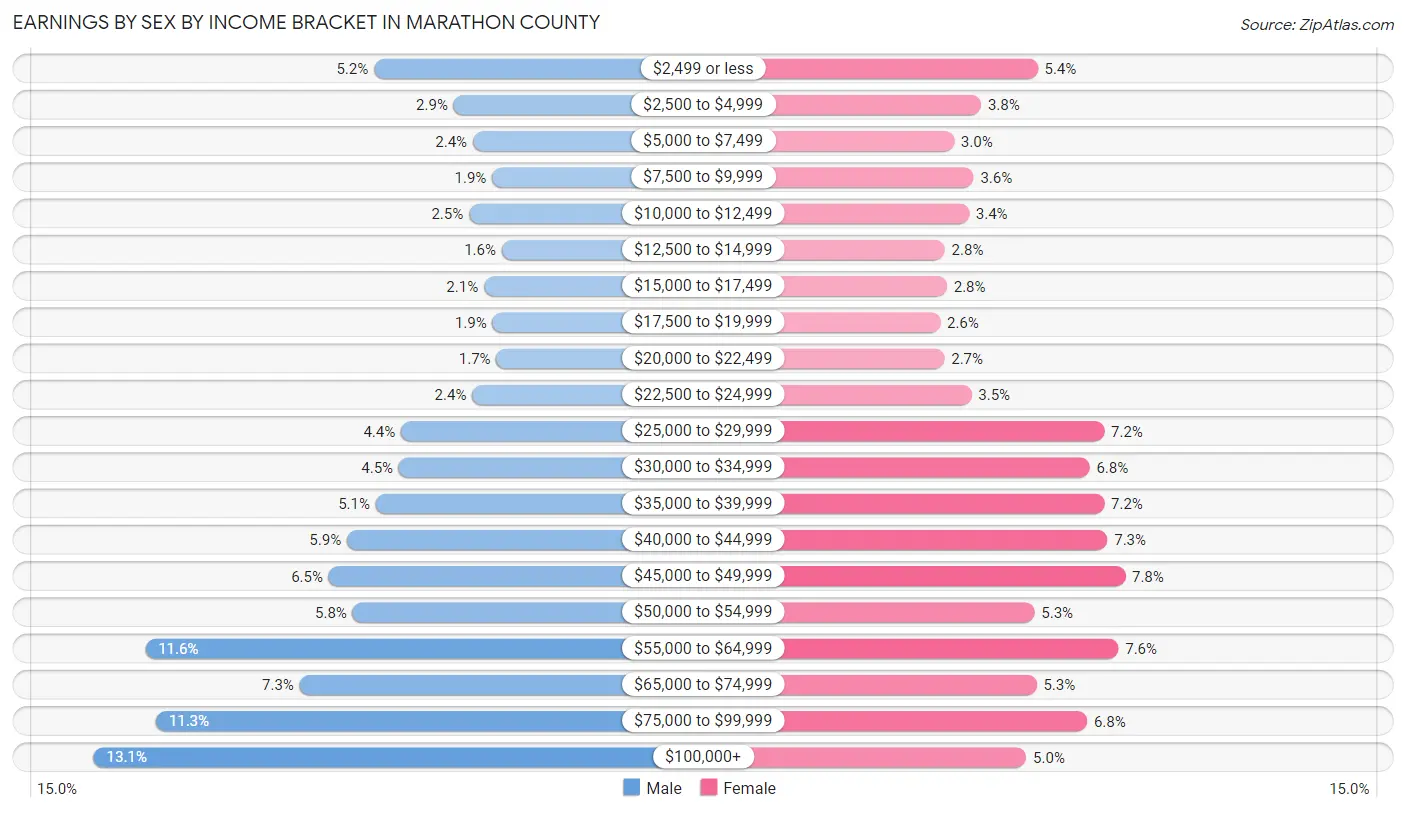
| Income | Male | Female |
| $2,499 or less | 2,151 (5.2%) | 1,957 (5.4%) |
| $2,500 to $4,999 | 1,220 (2.9%) | 1,376 (3.8%) |
| $5,000 to $7,499 | 996 (2.4%) | 1,100 (3.0%) |
| $7,500 to $9,999 | 771 (1.9%) | 1,298 (3.6%) |
| $10,000 to $12,499 | 1,045 (2.5%) | 1,251 (3.4%) |
| $12,500 to $14,999 | 659 (1.6%) | 1,005 (2.8%) |
| $15,000 to $17,499 | 869 (2.1%) | 1,027 (2.8%) |
| $17,500 to $19,999 | 769 (1.8%) | 956 (2.6%) |
| $20,000 to $22,499 | 723 (1.7%) | 999 (2.7%) |
| $22,500 to $24,999 | 1,006 (2.4%) | 1,279 (3.5%) |
| $25,000 to $29,999 | 1,835 (4.4%) | 2,638 (7.2%) |
| $30,000 to $34,999 | 1,862 (4.5%) | 2,489 (6.8%) |
| $35,000 to $39,999 | 2,132 (5.1%) | 2,637 (7.2%) |
| $40,000 to $44,999 | 2,469 (5.9%) | 2,673 (7.3%) |
| $45,000 to $49,999 | 2,680 (6.5%) | 2,853 (7.8%) |
| $50,000 to $54,999 | 2,401 (5.8%) | 1,924 (5.3%) |
| $55,000 to $64,999 | 4,826 (11.6%) | 2,783 (7.6%) |
| $65,000 to $74,999 | 3,022 (7.3%) | 1,945 (5.3%) |
| $75,000 to $99,999 | 4,699 (11.3%) | 2,463 (6.8%) |
| $100,000+ | 5,426 (13.1%) | 1,840 (5.0%) |
| Total | 41,561 (100.0%) | 36,493 (100.0%) |
Earnings by Sex by Educational Attainment in Marathon County
Average earnings in Marathon County are $54,957 for men and $40,957 for women, a difference of 25.5%. Men with an educational attainment of graduate degree enjoy the highest average annual earnings of $86,082, while those with less than high school education earn the least with $42,714. Women with an educational attainment of graduate degree earn the most with the average annual earnings of $62,775, while those with less than high school education have the smallest earnings of $27,305.
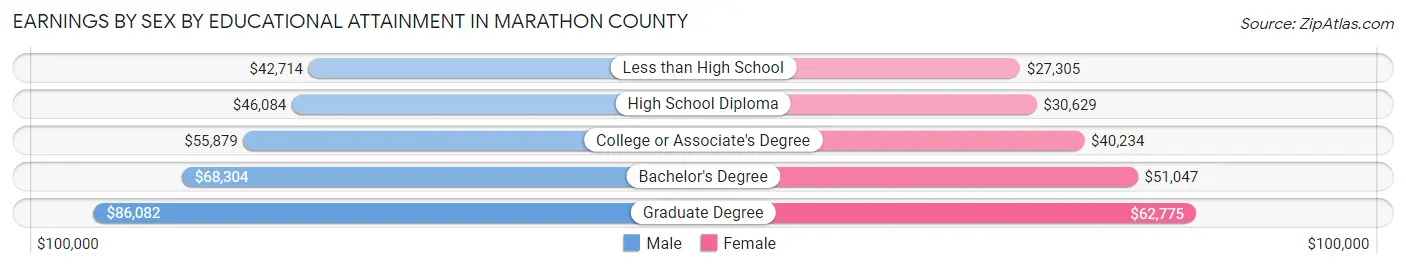
| Educational Attainment | Male Income | Female Income |
| Less than High School | $42,714 | $27,305 |
| High School Diploma | $46,084 | $30,629 |
| College or Associate's Degree | $55,879 | $40,234 |
| Bachelor's Degree | $68,304 | $51,047 |
| Graduate Degree | $86,082 | $62,775 |
| Total | $54,957 | $40,957 |
Family Income in Marathon County
Family Income Brackets in Marathon County
According to the Marathon County family income data, there are 8,912 families falling into the $100,000 to $149,999 income range, which is the most common income bracket and makes up 24.1% of all families. Conversely, the $10,000 to $14,999 income bracket is the least frequent group with only 333 families (0.9%) belonging to this category.
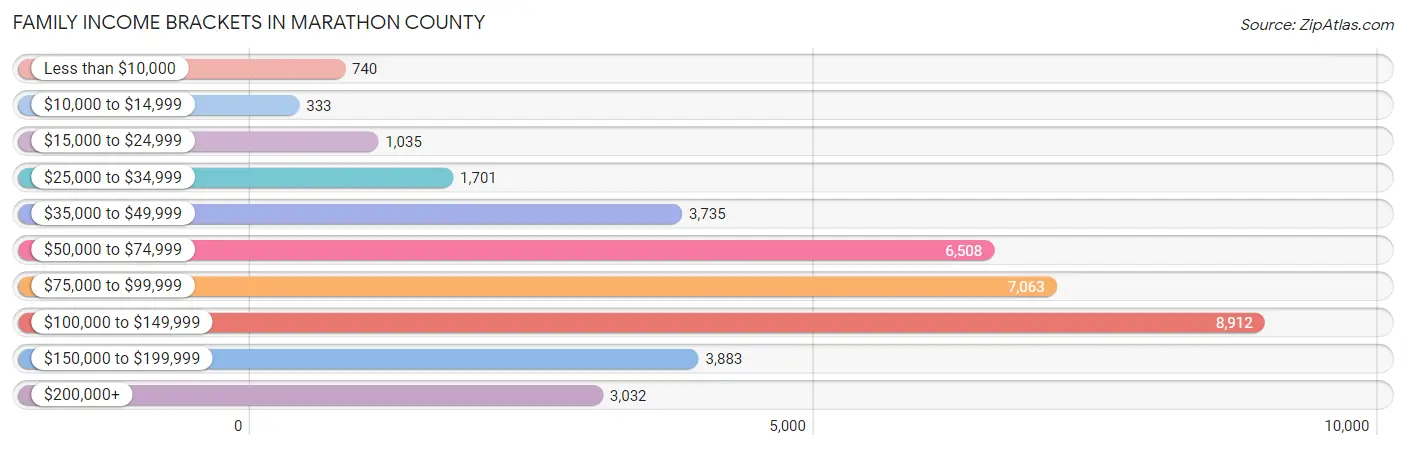
| Income Bracket | # Families | % Families |
| Less than $10,000 | 740 | 2.0% |
| $10,000 to $14,999 | 333 | 0.9% |
| $15,000 to $24,999 | 1,035 | 2.8% |
| $25,000 to $34,999 | 1,701 | 4.6% |
| $35,000 to $49,999 | 3,735 | 10.1% |
| $50,000 to $74,999 | 6,508 | 17.6% |
| $75,000 to $99,999 | 7,063 | 19.1% |
| $100,000 to $149,999 | 8,912 | 24.1% |
| $150,000 to $199,999 | 3,883 | 10.5% |
| $200,000+ | 3,032 | 8.2% |
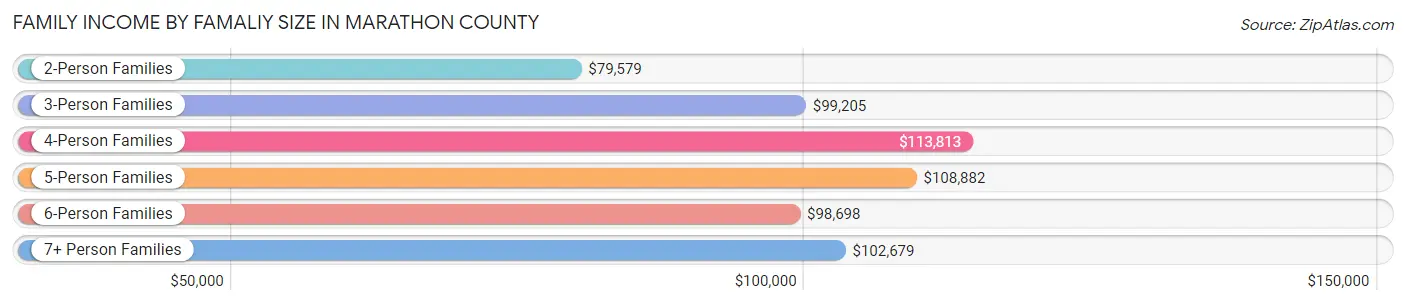
Family Income by Famaliy Size in Marathon County
4-person families (5,884 | 15.9%) account for the highest median family income in Marathon County with $113,813 per family, while 2-person families (19,810 | 53.6%) have the highest median income of $39,790 per family member.
| Income Bracket | # Families | Median Income |
| 2-Person Families | 19,810 (53.6%) | $79,579 |
| 3-Person Families | 7,076 (19.1%) | $99,205 |
| 4-Person Families | 5,884 (15.9%) | $113,813 |
| 5-Person Families | 2,587 (7.0%) | $108,882 |
| 6-Person Families | 1,101 (3.0%) | $98,698 |
| 7+ Person Families | 521 (1.4%) | $102,679 |
| Total | 36,979 (100.0%) | $90,578 |
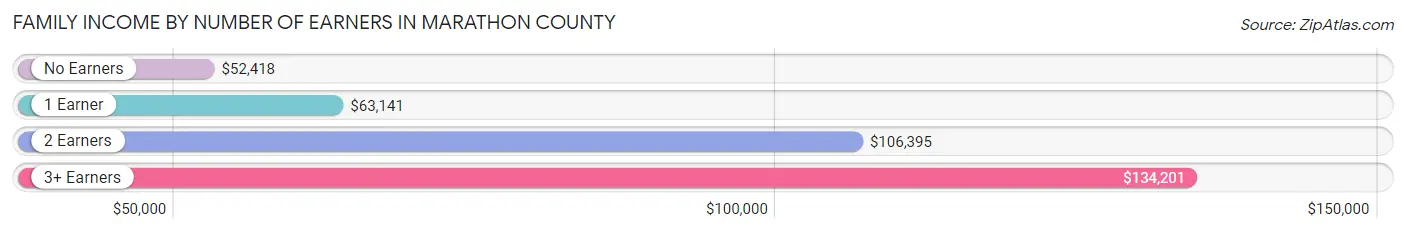
Family Income by Number of Earners in Marathon County
The median family income in Marathon County is $90,578, with families comprising 3+ earners (4,791) having the highest median family income of $134,201, while families with no earners (5,713) have the lowest median family income of $52,418, accounting for 13.0% and 15.4% of families, respectively.
| Number of Earners | # Families | Median Income |
| No Earners | 5,713 (15.4%) | $52,418 |
| 1 Earner | 9,670 (26.2%) | $63,141 |
| 2 Earners | 16,805 (45.4%) | $106,395 |
| 3+ Earners | 4,791 (13.0%) | $134,201 |
| Total | 36,979 (100.0%) | $90,578 |
Household Income in Marathon County
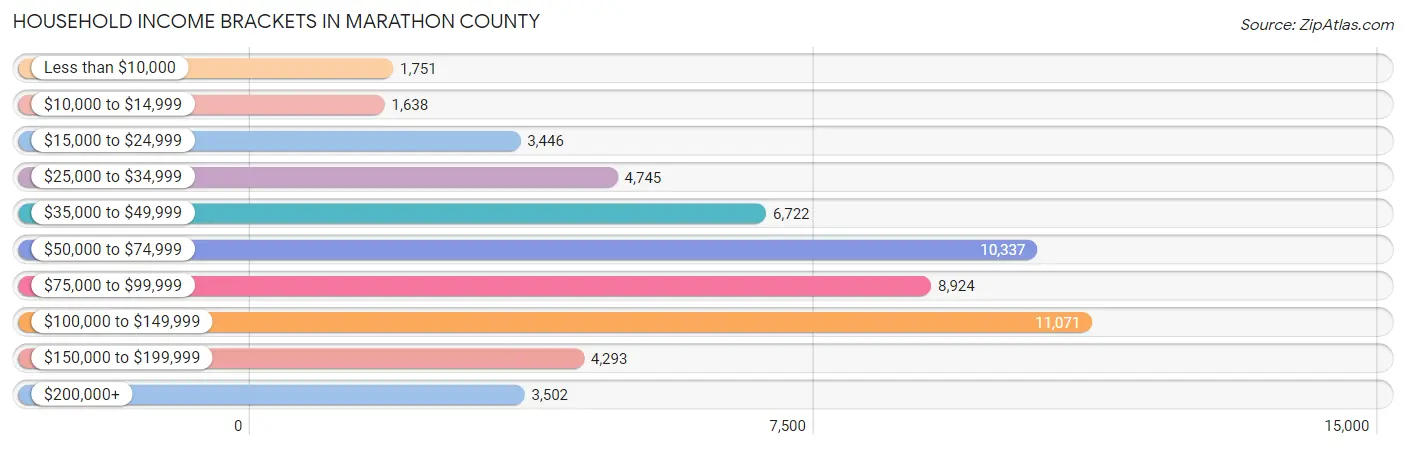
Household Income Brackets in Marathon County
With 11,071 households falling in the category, the $100,000 to $149,999 income range is the most frequent in Marathon County, accounting for 19.6% of all households. In contrast, only 1,638 households (2.9%) fall into the $10,000 to $14,999 income bracket, making it the least populous group.
| Income Bracket | # Households | % Households |
| Less than $10,000 | 1,751 | 3.1% |
| $10,000 to $14,999 | 1,638 | 2.9% |
| $15,000 to $24,999 | 3,446 | 6.1% |
| $25,000 to $34,999 | 4,745 | 8.4% |
| $35,000 to $49,999 | 6,722 | 11.9% |
| $50,000 to $74,999 | 10,337 | 18.3% |
| $75,000 to $99,999 | 8,924 | 15.8% |
| $100,000 to $149,999 | 11,071 | 19.6% |
| $150,000 to $199,999 | 4,293 | 7.6% |
| $200,000+ | 3,502 | 6.2% |
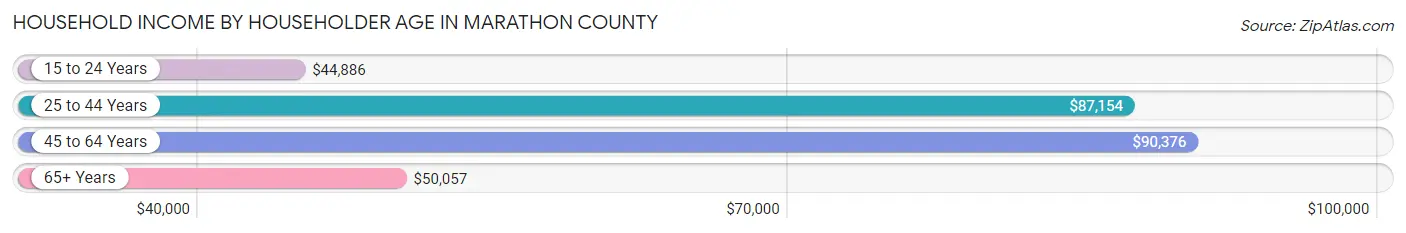
Household Income by Householder Age in Marathon County
The median household income in Marathon County is $73,248, with the highest median household income of $90,376 found in the 45 to 64 years age bracket for the primary householder. A total of 20,839 households (36.9%) fall into this category. Meanwhile, the 15 to 24 years age bracket for the primary householder has the lowest median household income of $44,886, with 2,135 households (3.8%) in this group.
| Income Bracket | # Households | Median Income |
| 15 to 24 Years | 2,135 (3.8%) | $44,886 |
| 25 to 44 Years | 17,492 (31.0%) | $87,154 |
| 45 to 64 Years | 20,839 (36.9%) | $90,376 |
| 65+ Years | 16,018 (28.4%) | $50,057 |
| Total | 56,484 (100.0%) | $73,248 |
Poverty in Marathon County
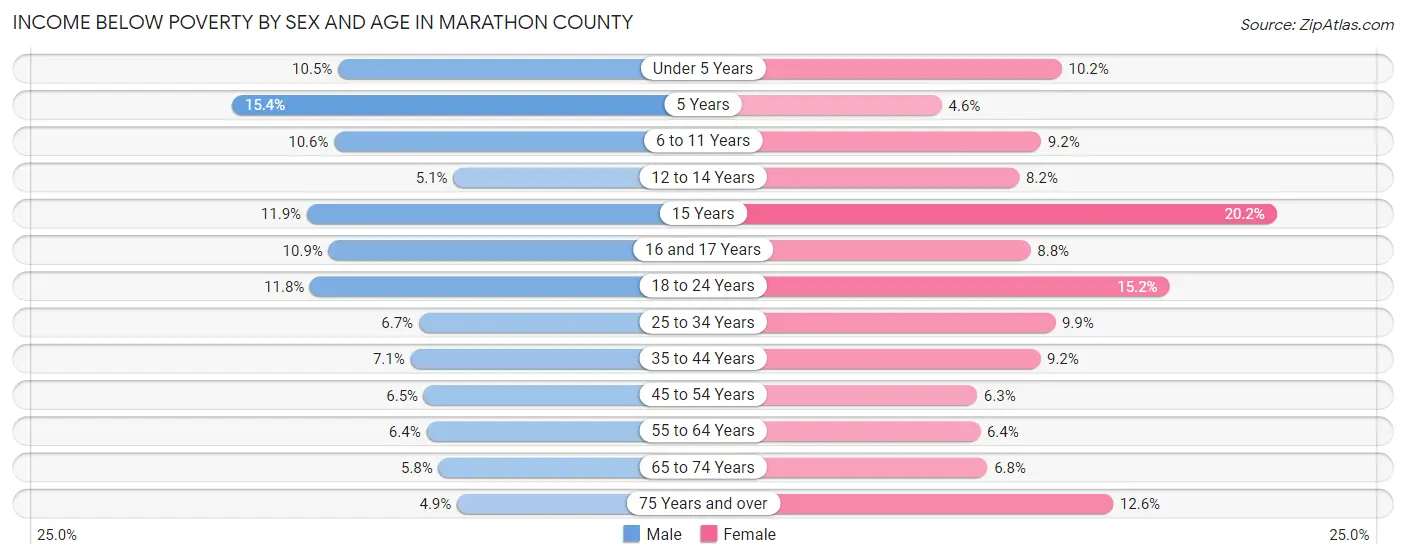
Income Below Poverty by Sex and Age in Marathon County
With 7.6% poverty level for males and 9.1% for females among the residents of Marathon County, 5 year old males and 15 year old females are the most vulnerable to poverty, with 90 males (15.4%) and 175 females (20.2%) in their respective age groups living below the poverty level.
| Age Bracket | Male | Female |
| Under 5 Years | 407 (10.4%) | 383 (10.2%) |
| 5 Years | 90 (15.4%) | 39 (4.6%) |
| 6 to 11 Years | 576 (10.6%) | 458 (9.2%) |
| 12 to 14 Years | 143 (5.1%) | 203 (8.2%) |
| 15 Years | 105 (11.9%) | 175 (20.2%) |
| 16 and 17 Years | 223 (10.9%) | 157 (8.7%) |
| 18 to 24 Years | 655 (11.7%) | 759 (15.2%) |
| 25 to 34 Years | 560 (6.7%) | 774 (9.9%) |
| 35 to 44 Years | 628 (7.1%) | 786 (9.2%) |
| 45 to 54 Years | 573 (6.5%) | 522 (6.3%) |
| 55 to 64 Years | 638 (6.4%) | 619 (6.4%) |
| 65 to 74 Years | 418 (5.8%) | 486 (6.8%) |
| 75 Years and over | 215 (4.9%) | 731 (12.6%) |
| Total | 5,231 (7.6%) | 6,092 (9.1%) |
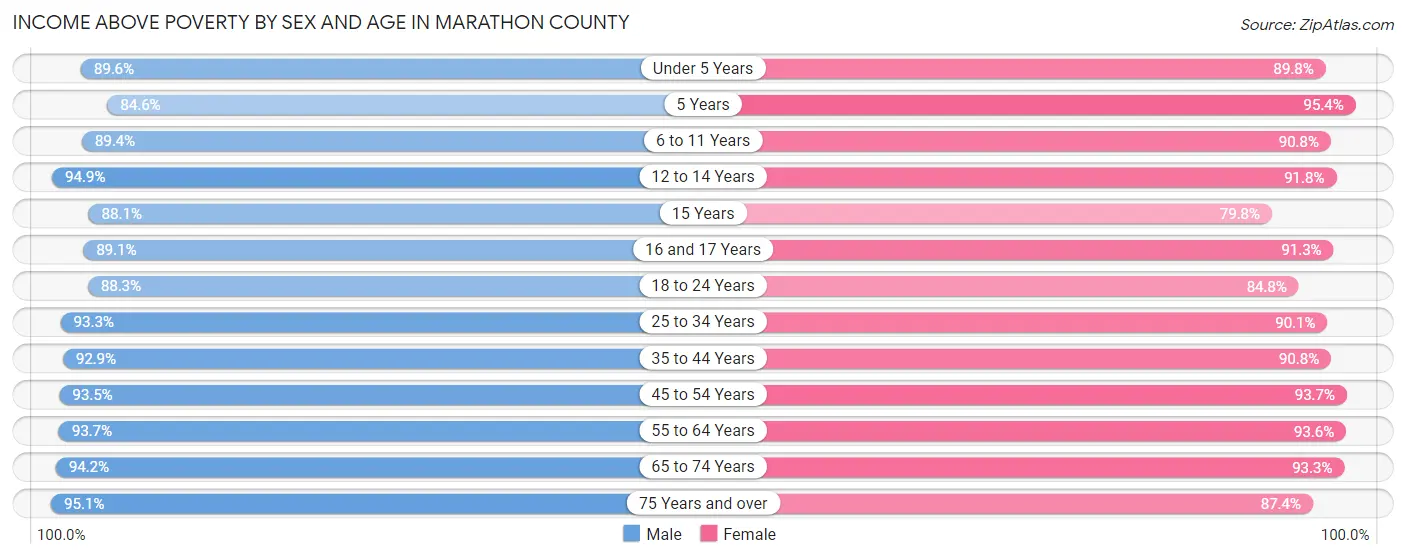
Income Above Poverty by Sex and Age in Marathon County
According to the poverty statistics in Marathon County, males aged 75 years and over and females aged 5 years are the age groups that are most secure financially, with 95.1% of males and 95.4% of females in these age groups living above the poverty line.
| Age Bracket | Male | Female |
| Under 5 Years | 3,486 (89.5%) | 3,373 (89.8%) |
| 5 Years | 495 (84.6%) | 803 (95.4%) |
| 6 to 11 Years | 4,843 (89.4%) | 4,499 (90.8%) |
| 12 to 14 Years | 2,662 (94.9%) | 2,263 (91.8%) |
| 15 Years | 777 (88.1%) | 692 (79.8%) |
| 16 and 17 Years | 1,825 (89.1%) | 1,637 (91.2%) |
| 18 to 24 Years | 4,919 (88.2%) | 4,233 (84.8%) |
| 25 to 34 Years | 7,801 (93.3%) | 7,051 (90.1%) |
| 35 to 44 Years | 8,231 (92.9%) | 7,753 (90.8%) |
| 45 to 54 Years | 8,284 (93.5%) | 7,802 (93.7%) |
| 55 to 64 Years | 9,405 (93.6%) | 9,043 (93.6%) |
| 65 to 74 Years | 6,801 (94.2%) | 6,714 (93.2%) |
| 75 Years and over | 4,144 (95.1%) | 5,080 (87.4%) |
| Total | 63,673 (92.4%) | 60,943 (90.9%) |
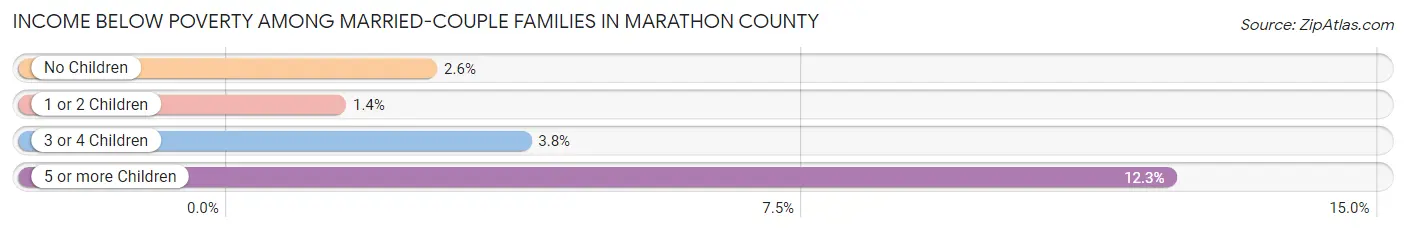
Income Below Poverty Among Married-Couple Families in Marathon County
The poverty statistics for married-couple families in Marathon County show that 2.5% or 744 of the total 29,938 families live below the poverty line. Families with 5 or more children have the highest poverty rate of 12.2%, comprising of 37 families. On the other hand, families with 1 or 2 children have the lowest poverty rate of 1.4%, which includes 115 families.
| Children | Above Poverty | Below Poverty |
| No Children | 18,335 (97.4%) | 490 (2.6%) |
| 1 or 2 Children | 8,036 (98.6%) | 115 (1.4%) |
| 3 or 4 Children | 2,558 (96.2%) | 102 (3.8%) |
| 5 or more Children | 265 (87.7%) | 37 (12.2%) |
| Total | 29,194 (97.5%) | 744 (2.5%) |
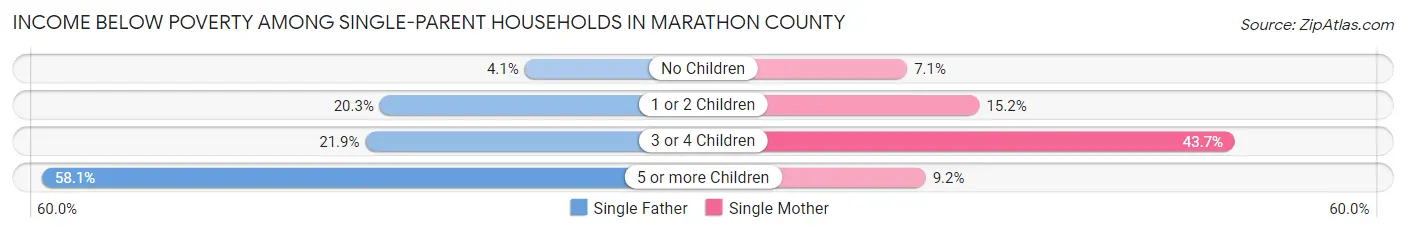
Income Below Poverty Among Single-Parent Households in Marathon County
According to the poverty data in Marathon County, 14.6% or 399 single-father households and 15.2% or 655 single-mother households are living below the poverty line. Among single-father households, those with 5 or more children have the highest poverty rate, with 18 households (58.1%) experiencing poverty. Likewise, among single-mother households, those with 3 or 4 children have the highest poverty rate, with 181 households (43.7%) falling below the poverty line.
| Children | Single Father | Single Mother |
| No Children | 43 (4.1%) | 98 (7.1%) |
| 1 or 2 Children | 306 (20.3%) | 366 (15.2%) |
| 3 or 4 Children | 32 (21.9%) | 181 (43.7%) |
| 5 or more Children | 18 (58.1%) | 10 (9.2%) |
| Total | 399 (14.6%) | 655 (15.2%) |
Income Below Poverty Among Married-Couple vs Single-Parent Households in Marathon County
The poverty data for Marathon County shows that 744 of the married-couple family households (2.5%) and 1,054 of the single-parent households (15.0%) are living below the poverty level. Within the married-couple family households, those with 5 or more children have the highest poverty rate, with 37 households (12.2%) falling below the poverty line. Among the single-parent households, those with 3 or 4 children have the highest poverty rate, with 213 household (38.0%) living below poverty.
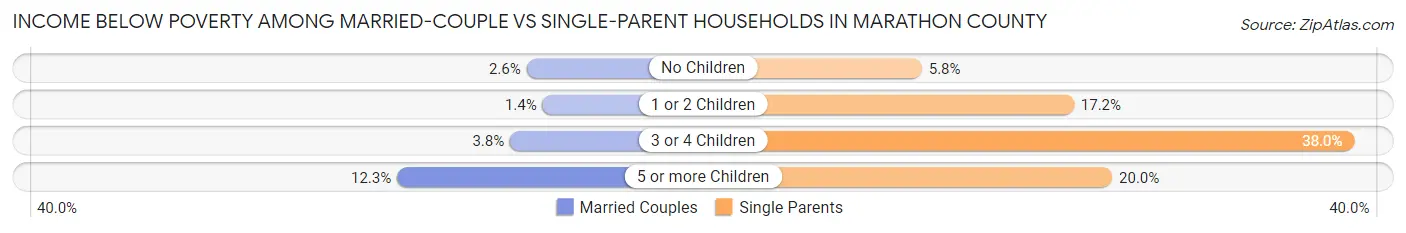
| Children | Married-Couple Families | Single-Parent Households |
| No Children | 490 (2.6%) | 141 (5.8%) |
| 1 or 2 Children | 115 (1.4%) | 672 (17.2%) |
| 3 or 4 Children | 102 (3.8%) | 213 (38.0%) |
| 5 or more Children | 37 (12.2%) | 28 (20.0%) |
| Total | 744 (2.5%) | 1,054 (15.0%) |
Employment Characteristics in Marathon County
Employment by Class of Employer in Marathon County
Among the 70,785 employed individuals in Marathon County, private company employees (50,066 | 70.7%), not-for-profit organizations (6,668 | 9.4%), and local government employees (4,913 | 6.9%) make up the most common classes of employment.
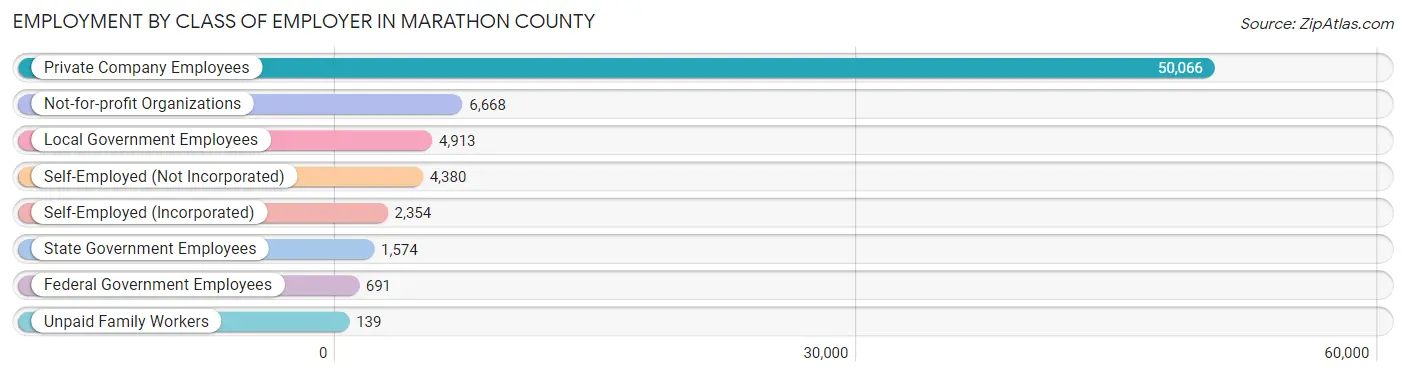
| Employer Class | # Employees | % Employees |
| Private Company Employees | 50,066 | 70.7% |
| Self-Employed (Incorporated) | 2,354 | 3.3% |
| Self-Employed (Not Incorporated) | 4,380 | 6.2% |
| Not-for-profit Organizations | 6,668 | 9.4% |
| Local Government Employees | 4,913 | 6.9% |
| State Government Employees | 1,574 | 2.2% |
| Federal Government Employees | 691 | 1.0% |
| Unpaid Family Workers | 139 | 0.2% |
| Total | 70,785 | 100.0% |
Employment Status by Age in Marathon County
According to the labor force statistics for Marathon County, out of the total population over 16 years of age (110,583), 67.0% or 74,091 individuals are in the labor force, with 3.1% or 2,297 of them unemployed. The age group with the highest labor force participation rate is 25 to 29 years, with 90.6% or 7,456 individuals in the labor force. Within the labor force, the 16 to 19 years age range has the highest percentage of unemployed individuals, with 8.6% or 363 of them being unemployed.
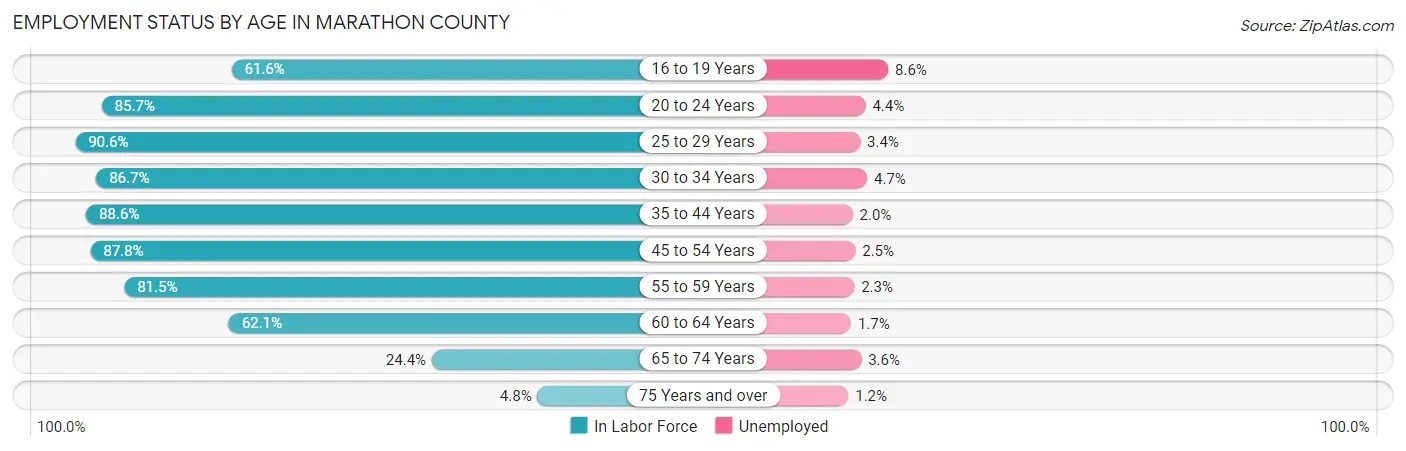
| Age Bracket | In Labor Force | Unemployed |
| 16 to 19 Years | 4,220 (61.6%) | 363 (8.6%) |
| 20 to 24 Years | 6,561 (85.7%) | 289 (4.4%) |
| 25 to 29 Years | 7,456 (90.6%) | 254 (3.4%) |
| 30 to 34 Years | 6,997 (86.7%) | 329 (4.7%) |
| 35 to 44 Years | 15,487 (88.6%) | 310 (2.0%) |
| 45 to 54 Years | 15,120 (87.8%) | 378 (2.5%) |
| 55 to 59 Years | 8,064 (81.5%) | 185 (2.3%) |
| 60 to 64 Years | 6,144 (62.1%) | 104 (1.7%) |
| 65 to 74 Years | 3,566 (24.4%) | 128 (3.6%) |
| 75 Years and over | 512 (4.8%) | 6 (1.2%) |
| Total | 74,091 (67.0%) | 2,297 (3.1%) |
Employment Status by Educational Attainment in Marathon County
According to labor force statistics for Marathon County, 83.7% of individuals (59,250) out of the total population between 25 and 64 years of age (70,789) are in the labor force, with 2.6% or 1,540 of them being unemployed. The group with the highest labor force participation rate are those with the educational attainment of bachelor's degree or higher, with 89.6% or 18,472 individuals in the labor force. Within the labor force, individuals with less than high school education have the highest percentage of unemployment, with 7.1% or 201 of them being unemployed.
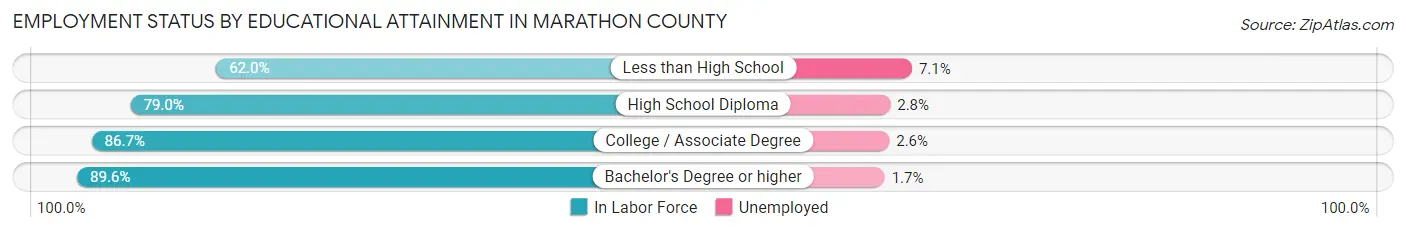
| Educational Attainment | In Labor Force | Unemployed |
| Less than High School | 2,825 (62.0%) | 324 (7.1%) |
| High School Diploma | 16,375 (79.0%) | 580 (2.8%) |
| College / Associate Degree | 21,578 (86.7%) | 647 (2.6%) |
| Bachelor's Degree or higher | 18,472 (89.6%) | 350 (1.7%) |
| Total | 59,250 (83.7%) | 1,841 (2.6%) |
Employment Occupations by Sex in Marathon County
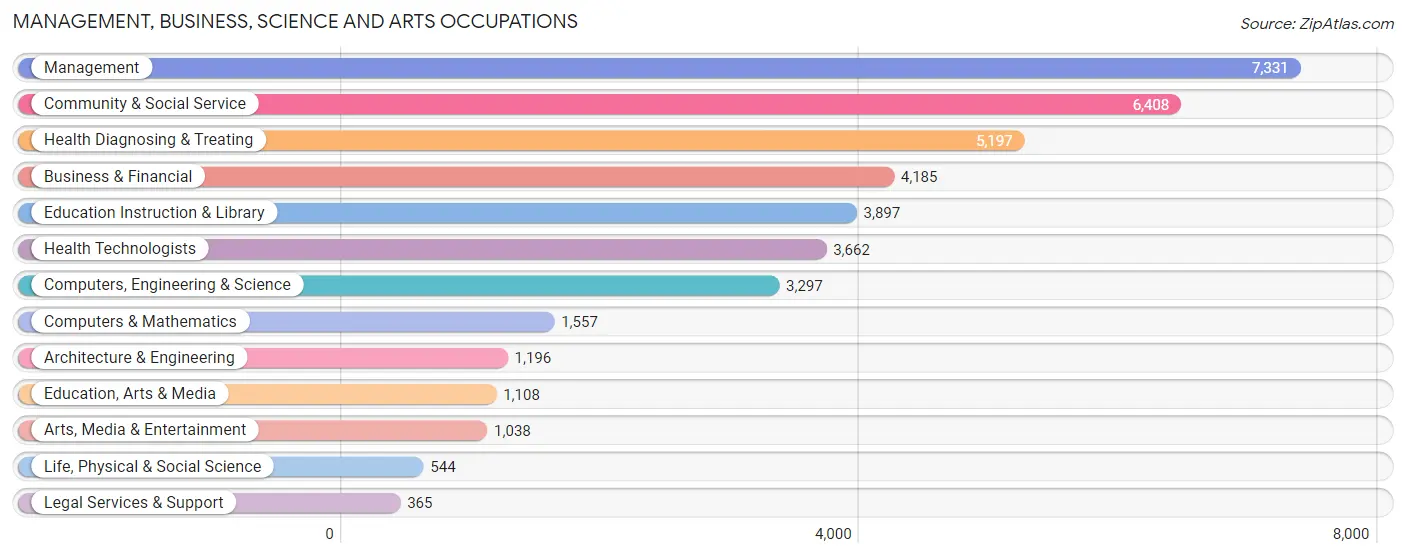
Management, Business, Science and Arts Occupations
The most common Management, Business, Science and Arts occupations in Marathon County are Management (7,331 | 10.2%), Community & Social Service (6,408 | 8.9%), Health Diagnosing & Treating (5,197 | 7.2%), Business & Financial (4,185 | 5.8%), and Education Instruction & Library (3,897 | 5.4%).
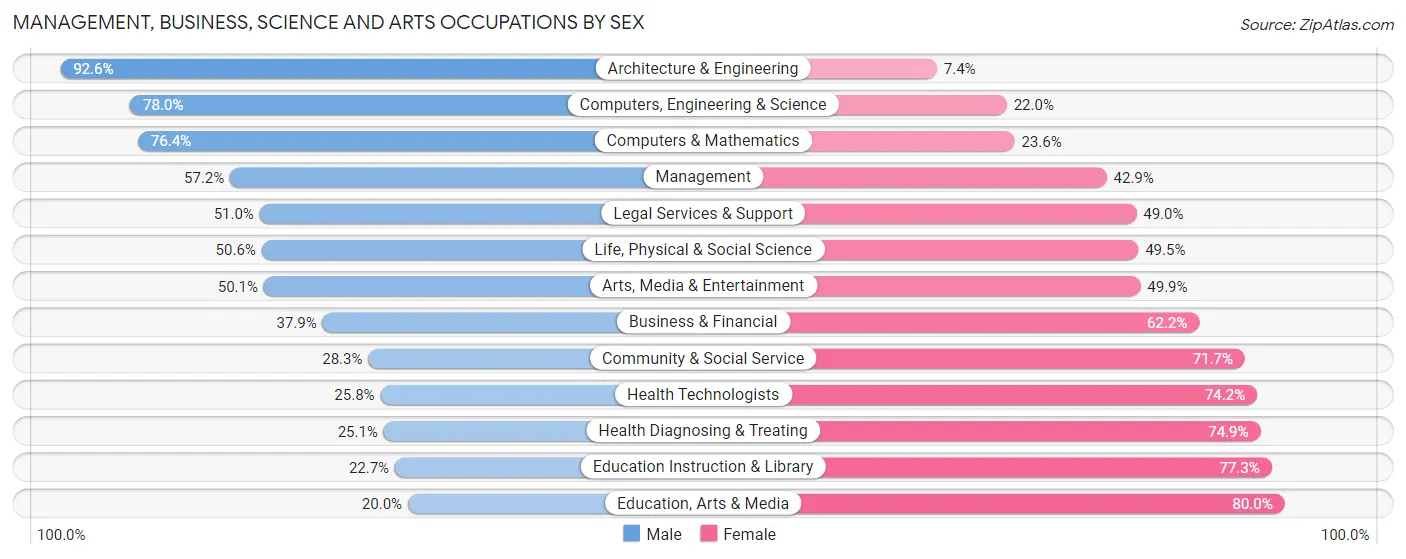
Management, Business, Science and Arts Occupations by Sex
Within the Management, Business, Science and Arts occupations in Marathon County, the most male-oriented occupations are Architecture & Engineering (92.6%), Computers, Engineering & Science (78.0%), and Computers & Mathematics (76.4%), while the most female-oriented occupations are Education, Arts & Media (80.0%), Education Instruction & Library (77.3%), and Health Diagnosing & Treating (74.9%).
| Occupation | Male | Female |
| Management | 4,190 (57.2%) | 3,141 (42.8%) |
| Business & Financial | 1,584 (37.9%) | 2,601 (62.2%) |
| Computers, Engineering & Science | 2,571 (78.0%) | 726 (22.0%) |
| Computers & Mathematics | 1,189 (76.4%) | 368 (23.6%) |
| Architecture & Engineering | 1,107 (92.6%) | 89 (7.4%) |
| Life, Physical & Social Science | 275 (50.5%) | 269 (49.4%) |
| Community & Social Service | 1,814 (28.3%) | 4,594 (71.7%) |
| Education, Arts & Media | 222 (20.0%) | 886 (80.0%) |
| Legal Services & Support | 186 (51.0%) | 179 (49.0%) |
| Education Instruction & Library | 886 (22.7%) | 3,011 (77.3%) |
| Arts, Media & Entertainment | 520 (50.1%) | 518 (49.9%) |
| Health Diagnosing & Treating | 1,304 (25.1%) | 3,893 (74.9%) |
| Health Technologists | 944 (25.8%) | 2,718 (74.2%) |
| Total (Category) | 11,463 (43.4%) | 14,955 (56.6%) |
| Total (Overall) | 37,995 (52.9%) | 33,779 (47.1%) |
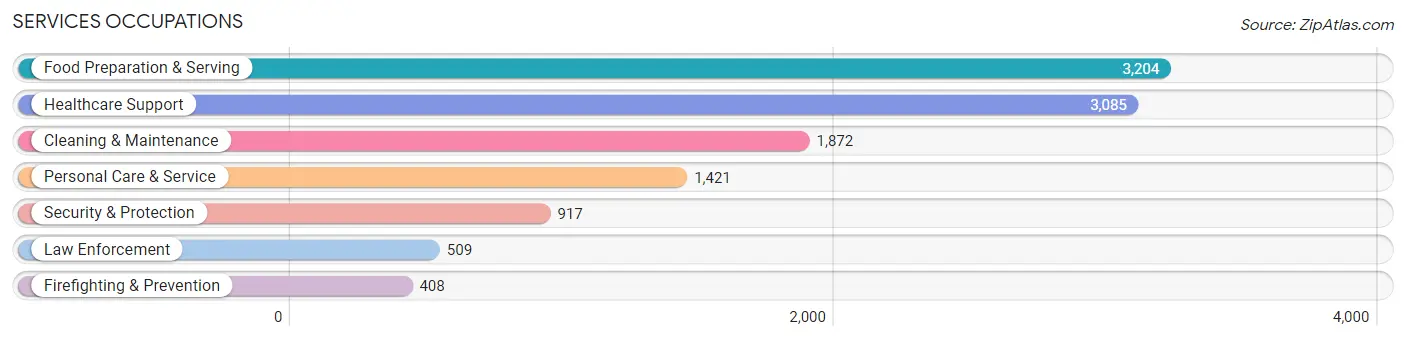
Services Occupations
The most common Services occupations in Marathon County are Food Preparation & Serving (3,204 | 4.5%), Healthcare Support (3,085 | 4.3%), Cleaning & Maintenance (1,872 | 2.6%), Personal Care & Service (1,421 | 2.0%), and Security & Protection (917 | 1.3%).
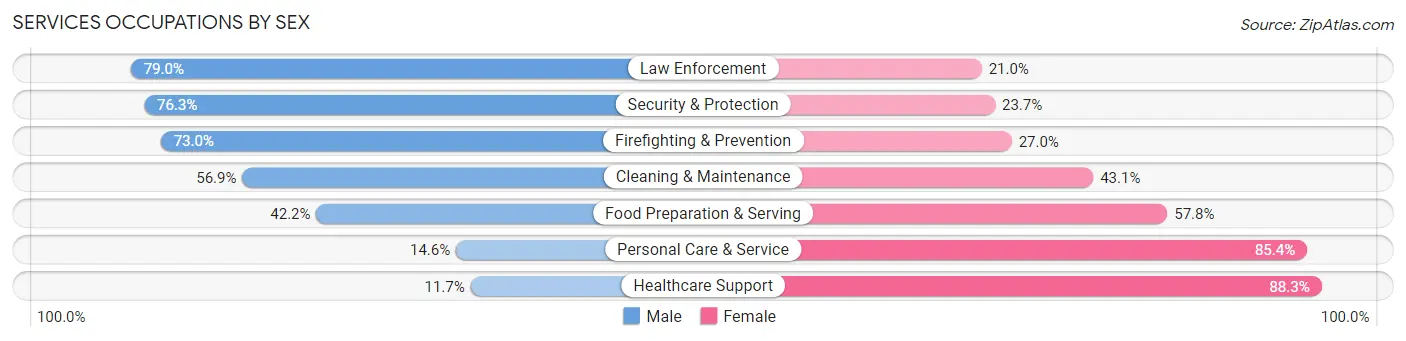
Services Occupations by Sex
Within the Services occupations in Marathon County, the most male-oriented occupations are Law Enforcement (79.0%), Security & Protection (76.3%), and Firefighting & Prevention (73.0%), while the most female-oriented occupations are Healthcare Support (88.3%), Personal Care & Service (85.4%), and Food Preparation & Serving (57.8%).
| Occupation | Male | Female |
| Healthcare Support | 361 (11.7%) | 2,724 (88.3%) |
| Security & Protection | 700 (76.3%) | 217 (23.7%) |
| Firefighting & Prevention | 298 (73.0%) | 110 (27.0%) |
| Law Enforcement | 402 (79.0%) | 107 (21.0%) |
| Food Preparation & Serving | 1,353 (42.2%) | 1,851 (57.8%) |
| Cleaning & Maintenance | 1,065 (56.9%) | 807 (43.1%) |
| Personal Care & Service | 207 (14.6%) | 1,214 (85.4%) |
| Total (Category) | 3,686 (35.1%) | 6,813 (64.9%) |
| Total (Overall) | 37,995 (52.9%) | 33,779 (47.1%) |
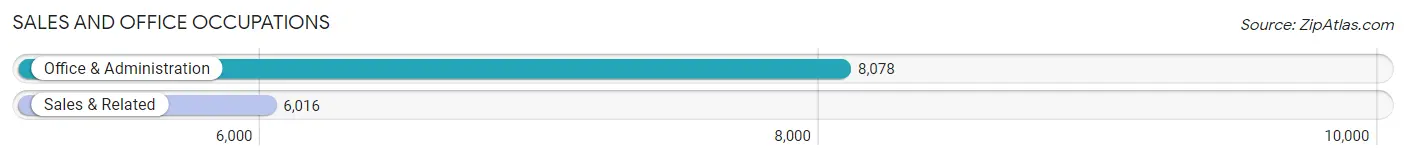
Sales and Office Occupations
The most common Sales and Office occupations in Marathon County are Office & Administration (8,078 | 11.3%), and Sales & Related (6,016 | 8.4%).
Sales and Office Occupations by Sex
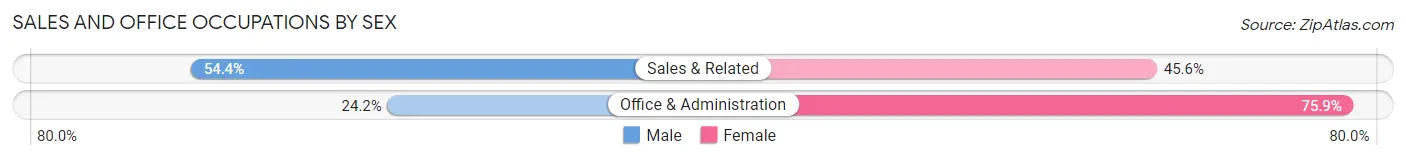
| Occupation | Male | Female |
| Sales & Related | 3,274 (54.4%) | 2,742 (45.6%) |
| Office & Administration | 1,951 (24.1%) | 6,127 (75.8%) |
| Total (Category) | 5,225 (37.1%) | 8,869 (62.9%) |
| Total (Overall) | 37,995 (52.9%) | 33,779 (47.1%) |
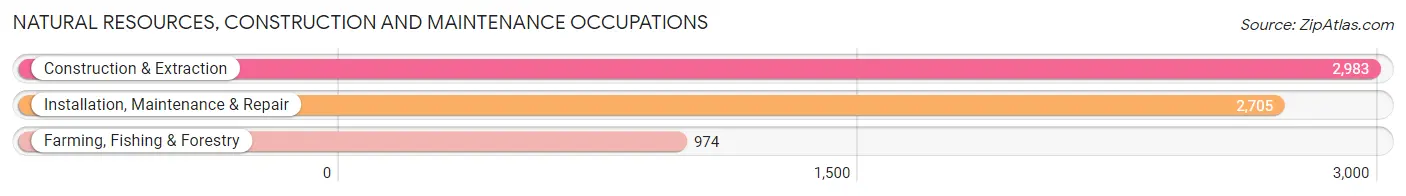
Natural Resources, Construction and Maintenance Occupations
The most common Natural Resources, Construction and Maintenance occupations in Marathon County are Construction & Extraction (2,983 | 4.2%), Installation, Maintenance & Repair (2,705 | 3.8%), and Farming, Fishing & Forestry (974 | 1.4%).
Natural Resources, Construction and Maintenance Occupations by Sex
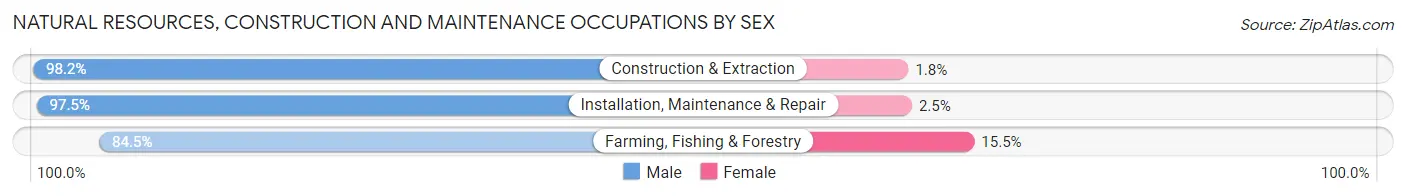
| Occupation | Male | Female |
| Farming, Fishing & Forestry | 823 (84.5%) | 151 (15.5%) |
| Construction & Extraction | 2,930 (98.2%) | 53 (1.8%) |
| Installation, Maintenance & Repair | 2,637 (97.5%) | 68 (2.5%) |
| Total (Category) | 6,390 (95.9%) | 272 (4.1%) |
| Total (Overall) | 37,995 (52.9%) | 33,779 (47.1%) |
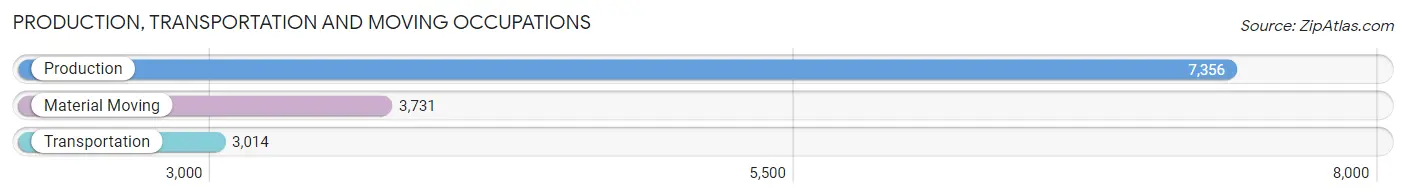
Production, Transportation and Moving Occupations
The most common Production, Transportation and Moving occupations in Marathon County are Production (7,356 | 10.2%), Material Moving (3,731 | 5.2%), and Transportation (3,014 | 4.2%).
Production, Transportation and Moving Occupations by Sex
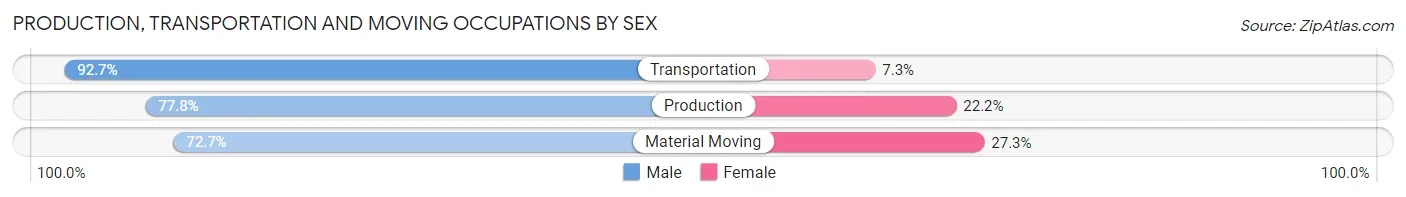
| Occupation | Male | Female |
| Production | 5,725 (77.8%) | 1,631 (22.2%) |
| Transportation | 2,794 (92.7%) | 220 (7.3%) |
| Material Moving | 2,712 (72.7%) | 1,019 (27.3%) |
| Total (Category) | 11,231 (79.6%) | 2,870 (20.3%) |
| Total (Overall) | 37,995 (52.9%) | 33,779 (47.1%) |
Employment Industries by Sex in Marathon County
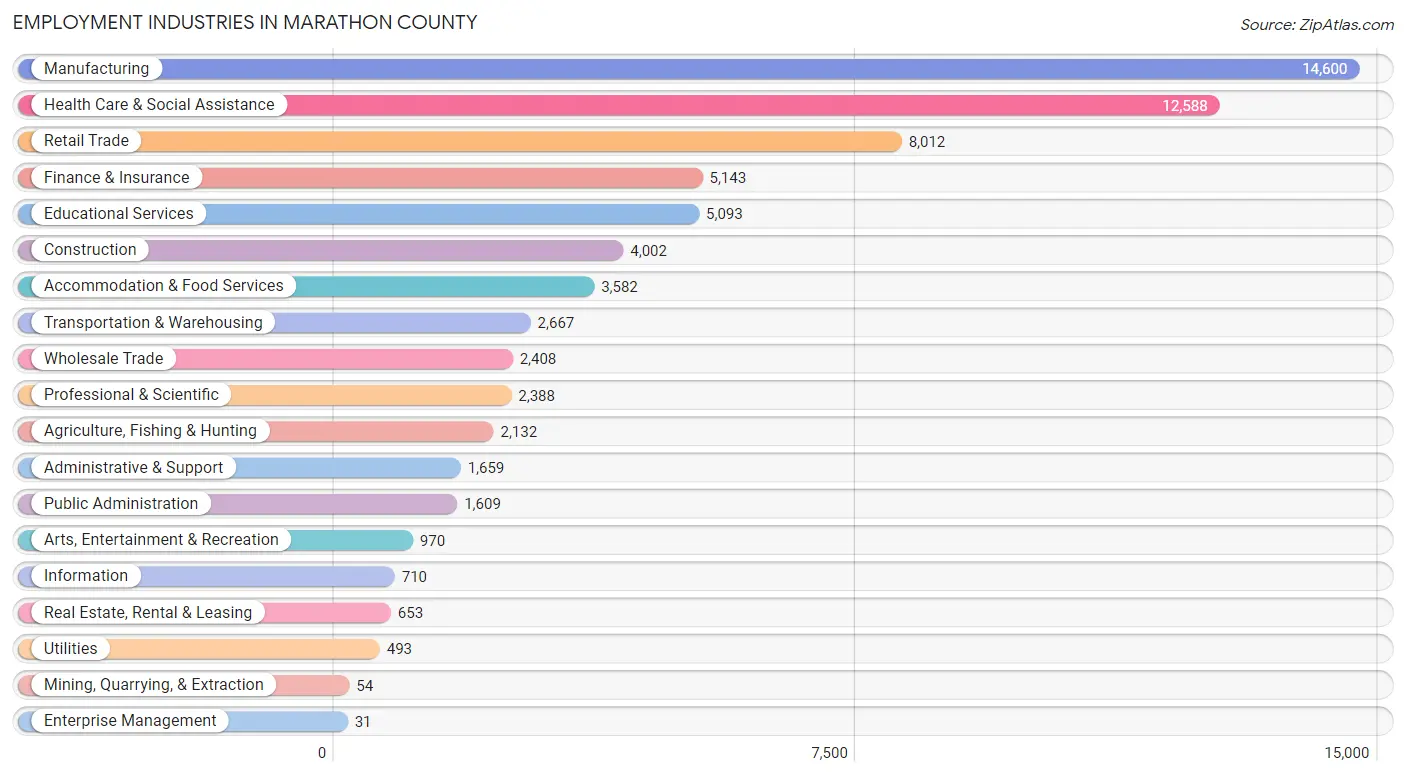
Employment Industries in Marathon County
The major employment industries in Marathon County include Manufacturing (14,600 | 20.3%), Health Care & Social Assistance (12,588 | 17.5%), Retail Trade (8,012 | 11.2%), Finance & Insurance (5,143 | 7.2%), and Educational Services (5,093 | 7.1%).
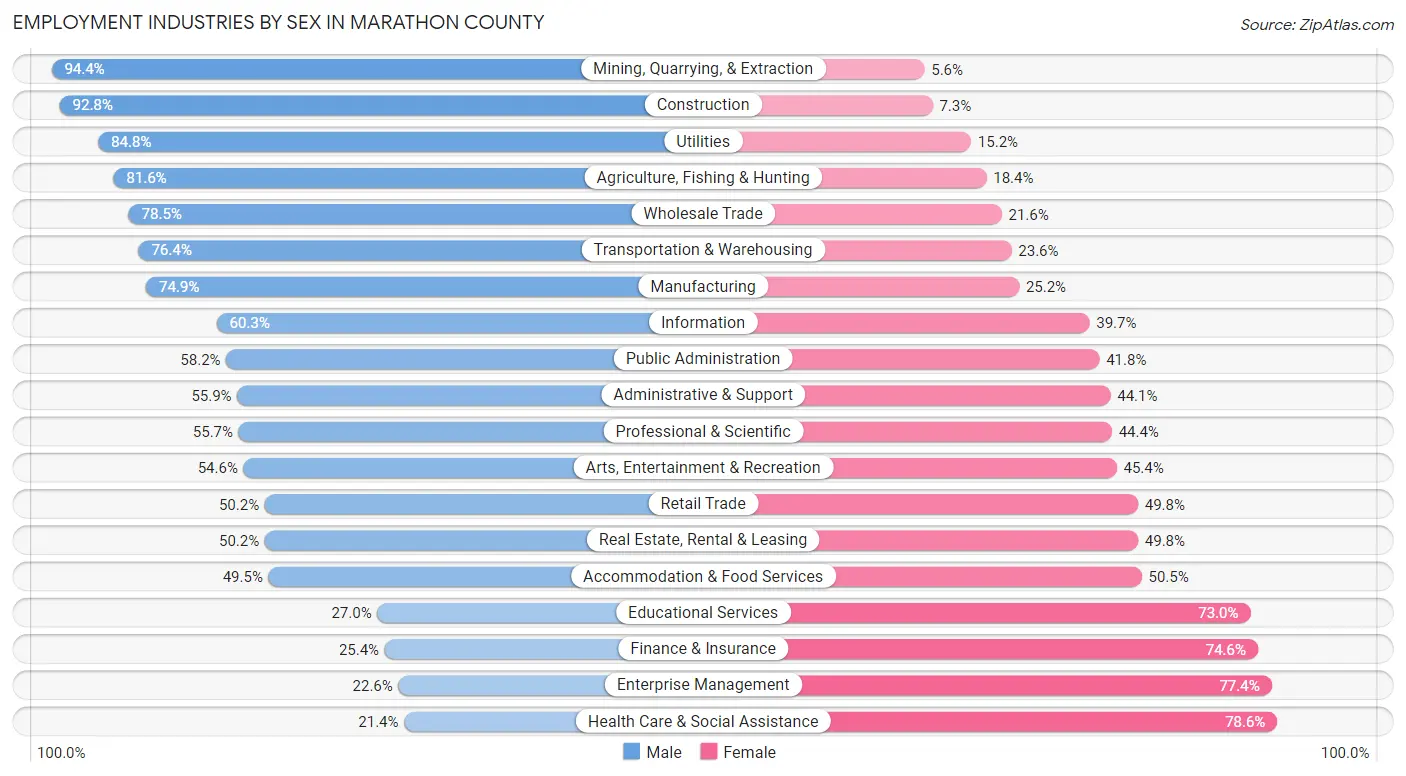
Employment Industries by Sex in Marathon County
The Marathon County industries that see more men than women are Mining, Quarrying, & Extraction (94.4%), Construction (92.7%), and Utilities (84.8%), whereas the industries that tend to have a higher number of women are Health Care & Social Assistance (78.6%), Enterprise Management (77.4%), and Finance & Insurance (74.6%).
| Industry | Male | Female |
| Agriculture, Fishing & Hunting | 1,740 (81.6%) | 392 (18.4%) |
| Mining, Quarrying, & Extraction | 51 (94.4%) | 3 (5.6%) |
| Construction | 3,712 (92.7%) | 290 (7.2%) |
| Manufacturing | 10,928 (74.9%) | 3,672 (25.2%) |
| Wholesale Trade | 1,889 (78.4%) | 519 (21.5%) |
| Retail Trade | 4,025 (50.2%) | 3,987 (49.8%) |
| Transportation & Warehousing | 2,038 (76.4%) | 629 (23.6%) |
| Utilities | 418 (84.8%) | 75 (15.2%) |
| Information | 428 (60.3%) | 282 (39.7%) |
| Finance & Insurance | 1,307 (25.4%) | 3,836 (74.6%) |
| Real Estate, Rental & Leasing | 328 (50.2%) | 325 (49.8%) |
| Professional & Scientific | 1,329 (55.6%) | 1,059 (44.4%) |
| Enterprise Management | 7 (22.6%) | 24 (77.4%) |
| Administrative & Support | 928 (55.9%) | 731 (44.1%) |
| Educational Services | 1,373 (27.0%) | 3,720 (73.0%) |
| Health Care & Social Assistance | 2,694 (21.4%) | 9,894 (78.6%) |
| Arts, Entertainment & Recreation | 530 (54.6%) | 440 (45.4%) |
| Accommodation & Food Services | 1,772 (49.5%) | 1,810 (50.5%) |
| Public Administration | 937 (58.2%) | 672 (41.8%) |
| Total | 37,995 (52.9%) | 33,779 (47.1%) |
Education in Marathon County
School Enrollment in Marathon County
The most common levels of schooling among the 30,097 students in Marathon County are elementary school (7,280 | 24.2%), middle school (7,248 | 24.1%), and high school (6,982 | 23.2%).
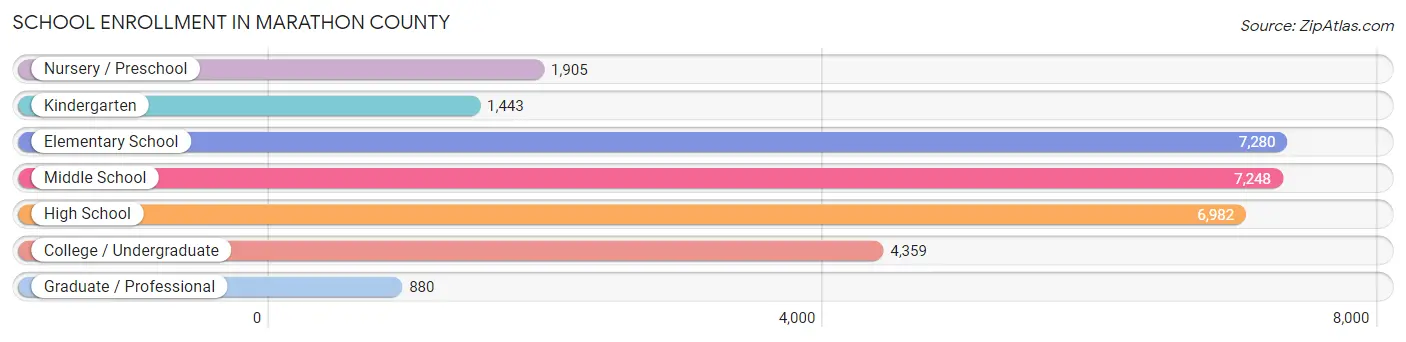
| School Level | # Students | % Students |
| Nursery / Preschool | 1,905 | 6.3% |
| Kindergarten | 1,443 | 4.8% |
| Elementary School | 7,280 | 24.2% |
| Middle School | 7,248 | 24.1% |
| High School | 6,982 | 23.2% |
| College / Undergraduate | 4,359 | 14.5% |
| Graduate / Professional | 880 | 2.9% |
| Total | 30,097 | 100.0% |
School Enrollment by Age by Funding Source in Marathon County
Out of a total of 30,097 students who are enrolled in schools in Marathon County, 4,394 (14.6%) attend a private institution, while the remaining 25,703 (85.4%) are enrolled in public schools. The age group of 3 to 4 year olds has the highest likelihood of being enrolled in private schools, with 391 (32.1% in the age bracket) enrolled. Conversely, the age group of 18 to 19 year olds has the lowest likelihood of being enrolled in a private school, with 1,808 (92.7% in the age bracket) attending a public institution.
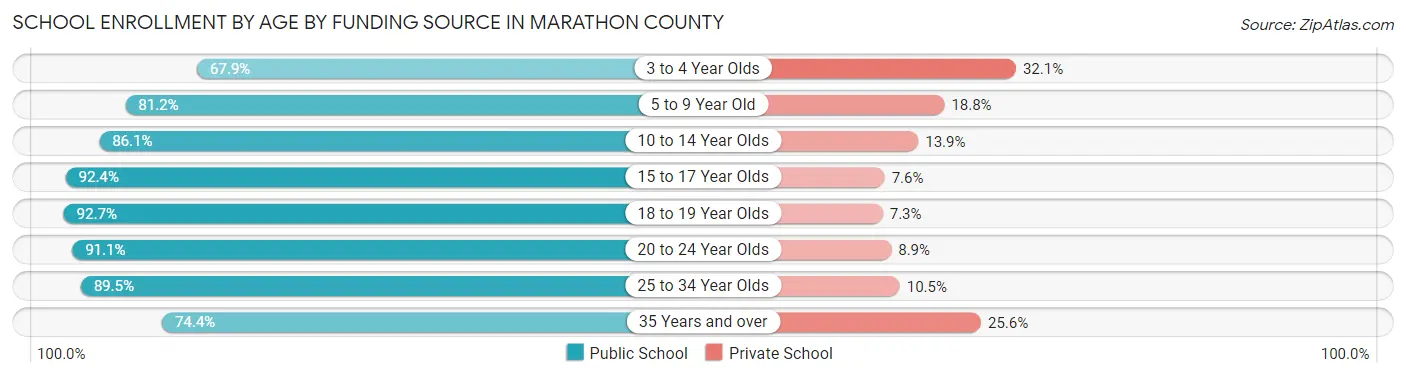
| Age Bracket | Public School | Private School |
| 3 to 4 Year Olds | 827 (67.9%) | 391 (32.1%) |
| 5 to 9 Year Old | 6,928 (81.2%) | 1,601 (18.8%) |
| 10 to 14 Year Olds | 7,501 (86.1%) | 1,211 (13.9%) |
| 15 to 17 Year Olds | 4,861 (92.4%) | 402 (7.6%) |
| 18 to 19 Year Olds | 1,808 (92.7%) | 142 (7.3%) |
| 20 to 24 Year Olds | 1,592 (91.1%) | 155 (8.9%) |
| 25 to 34 Year Olds | 1,215 (89.5%) | 142 (10.5%) |
| 35 Years and over | 983 (74.4%) | 338 (25.6%) |
| Total | 25,703 (85.4%) | 4,394 (14.6%) |
Educational Attainment by Field of Study in Marathon County
Business (5,966 | 20.8%), education (4,710 | 16.5%), science & technology (3,803 | 13.3%), bio, nature & agricultural (2,292 | 8.0%), and arts & humanities (1,933 | 6.8%) are the most common fields of study among 28,635 individuals in Marathon County who have obtained a bachelor's degree or higher.
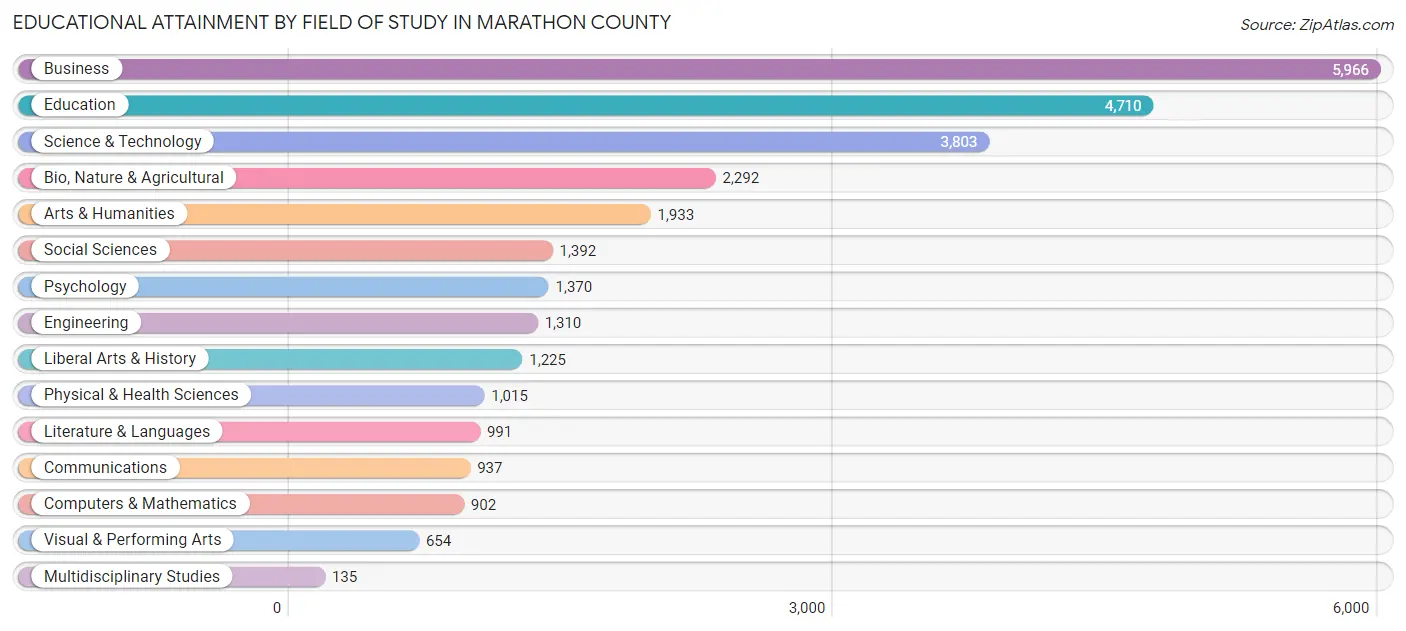
| Field of Study | # Graduates | % Graduates |
| Computers & Mathematics | 902 | 3.2% |
| Bio, Nature & Agricultural | 2,292 | 8.0% |
| Physical & Health Sciences | 1,015 | 3.5% |
| Psychology | 1,370 | 4.8% |
| Social Sciences | 1,392 | 4.9% |
| Engineering | 1,310 | 4.6% |
| Multidisciplinary Studies | 135 | 0.5% |
| Science & Technology | 3,803 | 13.3% |
| Business | 5,966 | 20.8% |
| Education | 4,710 | 16.5% |
| Literature & Languages | 991 | 3.5% |
| Liberal Arts & History | 1,225 | 4.3% |
| Visual & Performing Arts | 654 | 2.3% |
| Communications | 937 | 3.3% |
| Arts & Humanities | 1,933 | 6.8% |
| Total | 28,635 | 100.0% |
Transportation & Commute in Marathon County
Vehicle Availability by Sex in Marathon County
The most prevalent vehicle ownership categories in Marathon County are males with 2 vehicles (16,683, accounting for 44.5%) and females with 2 vehicles (14,198, making up 50.3%).
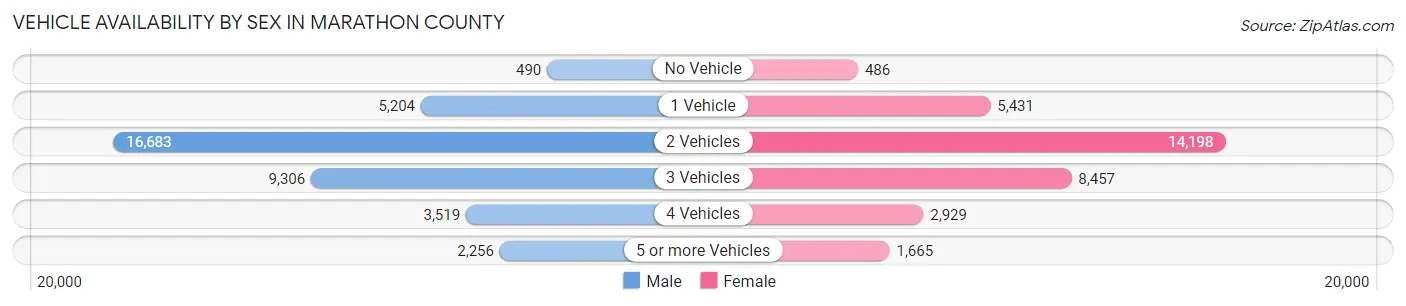
| Vehicles Available | Male | Female |
| No Vehicle | 490 (1.3%) | 486 (1.5%) |
| 1 Vehicle | 5,204 (13.9%) | 5,431 (16.4%) |
| 2 Vehicles | 16,683 (44.5%) | 14,198 (42.8%) |
| 3 Vehicles | 9,306 (24.8%) | 8,457 (25.5%) |
| 4 Vehicles | 3,519 (9.4%) | 2,929 (8.8%) |
| 5 or more Vehicles | 2,256 (6.0%) | 1,665 (5.0%) |
| Total | 37,458 (100.0%) | 33,166 (100.0%) |
Commute Time in Marathon County
The most frequently occuring commute durations in Marathon County are 15 to 19 minutes (14,051 commuters, 22.1%), 10 to 14 minutes (12,123 commuters, 19.0%), and 20 to 24 minutes (10,425 commuters, 16.4%).
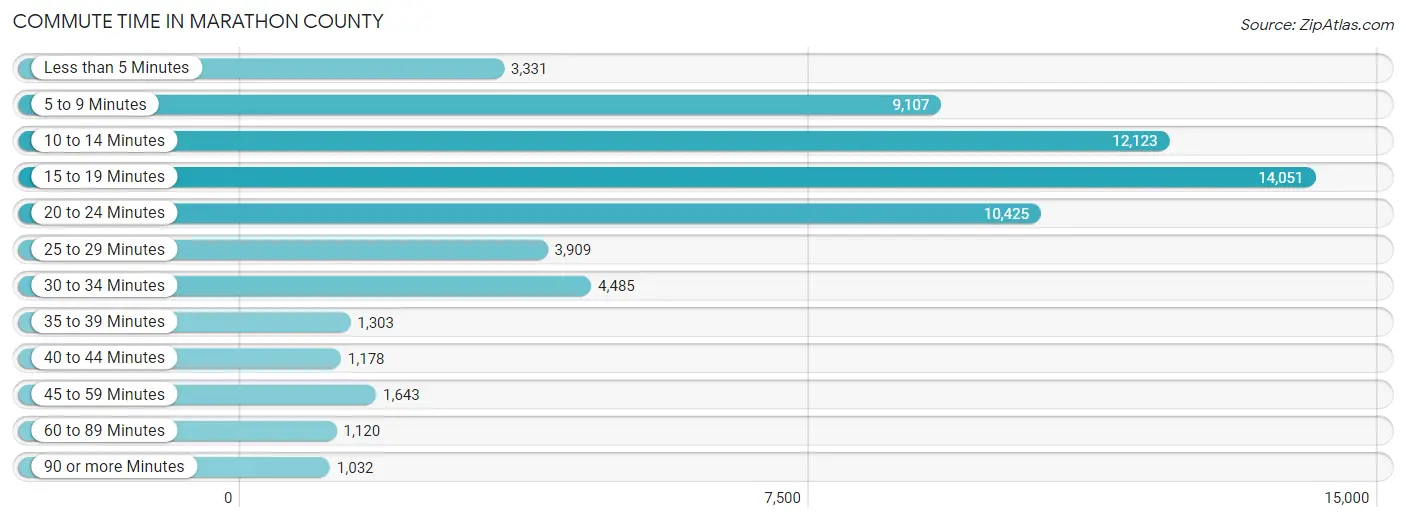
| Commute Time | # Commuters | % Commuters |
| Less than 5 Minutes | 3,331 | 5.2% |
| 5 to 9 Minutes | 9,107 | 14.3% |
| 10 to 14 Minutes | 12,123 | 19.0% |
| 15 to 19 Minutes | 14,051 | 22.1% |
| 20 to 24 Minutes | 10,425 | 16.4% |
| 25 to 29 Minutes | 3,909 | 6.1% |
| 30 to 34 Minutes | 4,485 | 7.0% |
| 35 to 39 Minutes | 1,303 | 2.1% |
| 40 to 44 Minutes | 1,178 | 1.8% |
| 45 to 59 Minutes | 1,643 | 2.6% |
| 60 to 89 Minutes | 1,120 | 1.8% |
| 90 or more Minutes | 1,032 | 1.6% |
Commute Time by Sex in Marathon County
The most common commute times in Marathon County are 15 to 19 minutes (6,904 commuters, 20.1%) for males and 15 to 19 minutes (7,147 commuters, 24.4%) for females.
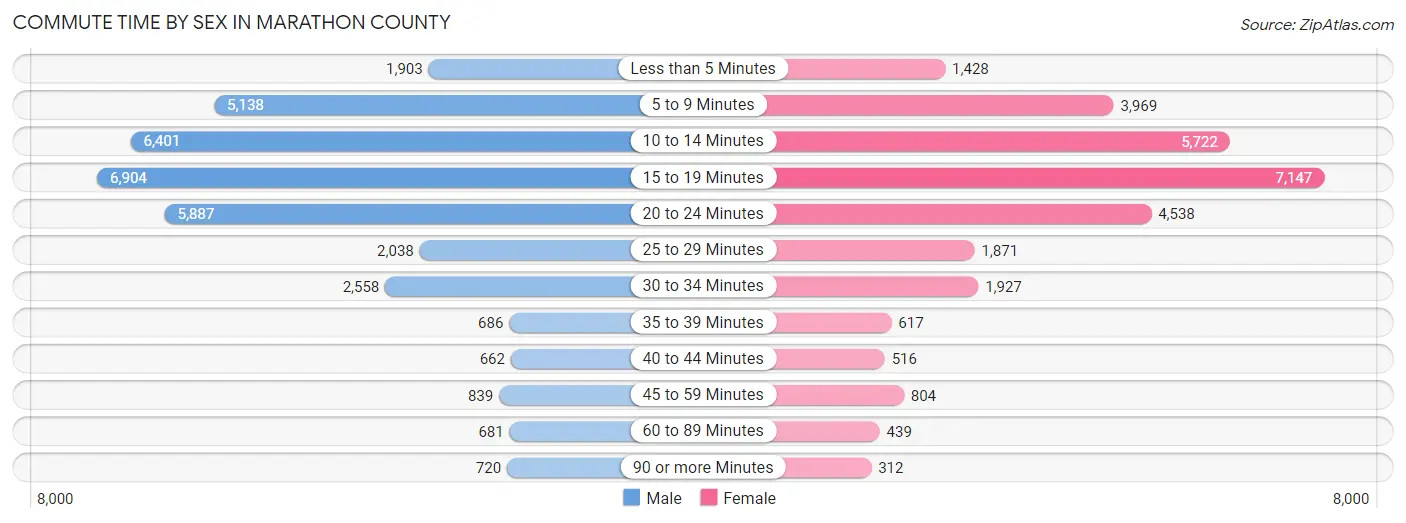
| Commute Time | Male | Female |
| Less than 5 Minutes | 1,903 (5.5%) | 1,428 (4.9%) |
| 5 to 9 Minutes | 5,138 (14.9%) | 3,969 (13.6%) |
| 10 to 14 Minutes | 6,401 (18.6%) | 5,722 (19.5%) |
| 15 to 19 Minutes | 6,904 (20.1%) | 7,147 (24.4%) |
| 20 to 24 Minutes | 5,887 (17.1%) | 4,538 (15.5%) |
| 25 to 29 Minutes | 2,038 (5.9%) | 1,871 (6.4%) |
| 30 to 34 Minutes | 2,558 (7.4%) | 1,927 (6.6%) |
| 35 to 39 Minutes | 686 (2.0%) | 617 (2.1%) |
| 40 to 44 Minutes | 662 (1.9%) | 516 (1.8%) |
| 45 to 59 Minutes | 839 (2.4%) | 804 (2.7%) |
| 60 to 89 Minutes | 681 (2.0%) | 439 (1.5%) |
| 90 or more Minutes | 720 (2.1%) | 312 (1.1%) |
Time of Departure to Work by Sex in Marathon County
The most frequent times of departure to work in Marathon County are 6:30 AM to 6:59 AM (4,847, 14.1%) for males and 7:00 AM to 7:29 AM (5,518, 18.8%) for females.
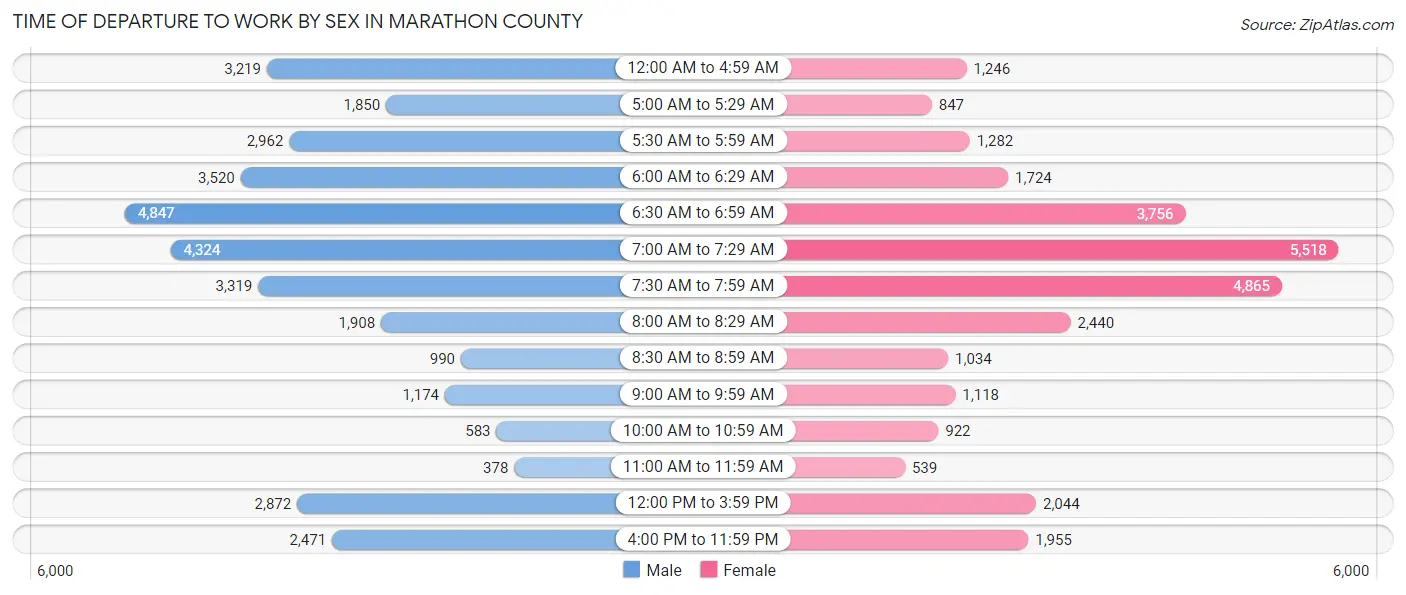
| Time of Departure | Male | Female |
| 12:00 AM to 4:59 AM | 3,219 (9.3%) | 1,246 (4.3%) |
| 5:00 AM to 5:29 AM | 1,850 (5.4%) | 847 (2.9%) |
| 5:30 AM to 5:59 AM | 2,962 (8.6%) | 1,282 (4.4%) |
| 6:00 AM to 6:29 AM | 3,520 (10.2%) | 1,724 (5.9%) |
| 6:30 AM to 6:59 AM | 4,847 (14.1%) | 3,756 (12.8%) |
| 7:00 AM to 7:29 AM | 4,324 (12.6%) | 5,518 (18.8%) |
| 7:30 AM to 7:59 AM | 3,319 (9.6%) | 4,865 (16.6%) |
| 8:00 AM to 8:29 AM | 1,908 (5.5%) | 2,440 (8.3%) |
| 8:30 AM to 8:59 AM | 990 (2.9%) | 1,034 (3.5%) |
| 9:00 AM to 9:59 AM | 1,174 (3.4%) | 1,118 (3.8%) |
| 10:00 AM to 10:59 AM | 583 (1.7%) | 922 (3.2%) |
| 11:00 AM to 11:59 AM | 378 (1.1%) | 539 (1.8%) |
| 12:00 PM to 3:59 PM | 2,872 (8.3%) | 2,044 (7.0%) |
| 4:00 PM to 11:59 PM | 2,471 (7.2%) | 1,955 (6.7%) |
| Total | 34,417 (100.0%) | 29,290 (100.0%) |
Housing Occupancy in Marathon County
Occupancy by Ownership in Marathon County
Of the total 56,484 dwellings in Marathon County, owner-occupied units account for 41,182 (72.9%), while renter-occupied units make up 15,302 (27.1%).
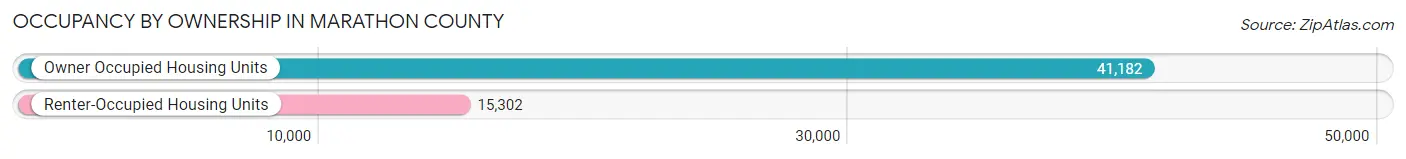
| Occupancy | # Housing Units | % Housing Units |
| Owner Occupied Housing Units | 41,182 | 72.9% |
| Renter-Occupied Housing Units | 15,302 | 27.1% |
| Total Occupied Housing Units | 56,484 | 100.0% |
Occupancy by Household Size in Marathon County
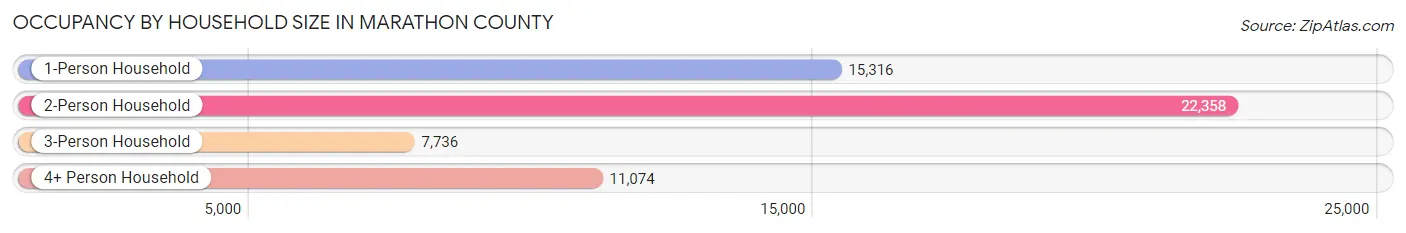
| Household Size | # Housing Units | % Housing Units |
| 1-Person Household | 15,316 | 27.1% |
| 2-Person Household | 22,358 | 39.6% |
| 3-Person Household | 7,736 | 13.7% |
| 4+ Person Household | 11,074 | 19.6% |
| Total Housing Units | 56,484 | 100.0% |
Occupancy by Ownership by Household Size in Marathon County
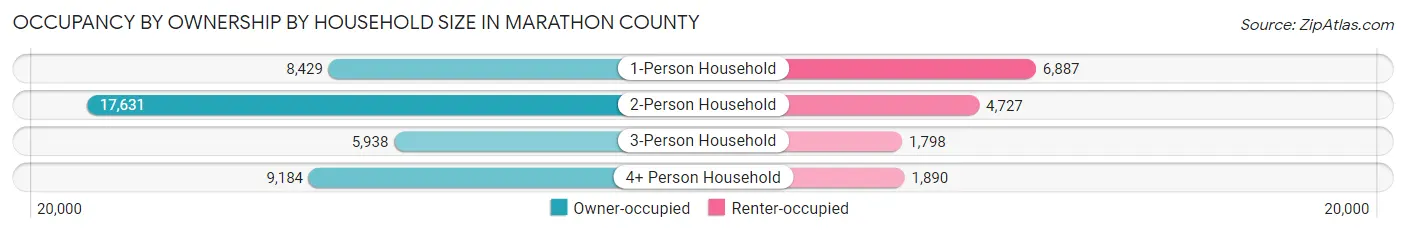
| Household Size | Owner-occupied | Renter-occupied |
| 1-Person Household | 8,429 (55.0%) | 6,887 (45.0%) |
| 2-Person Household | 17,631 (78.9%) | 4,727 (21.1%) |
| 3-Person Household | 5,938 (76.8%) | 1,798 (23.2%) |
| 4+ Person Household | 9,184 (82.9%) | 1,890 (17.1%) |
| Total Housing Units | 41,182 (72.9%) | 15,302 (27.1%) |
Occupancy by Educational Attainment in Marathon County
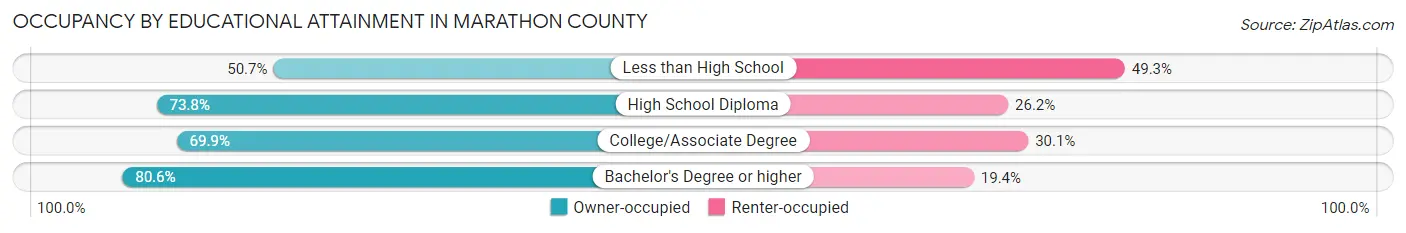
| Household Size | Owner-occupied | Renter-occupied |
| Less than High School | 1,796 (50.7%) | 1,747 (49.3%) |
| High School Diploma | 12,928 (73.8%) | 4,581 (26.2%) |
| College/Associate Degree | 13,692 (69.9%) | 5,907 (30.1%) |
| Bachelor's Degree or higher | 12,766 (80.6%) | 3,067 (19.4%) |
Occupancy by Age of Householder in Marathon County
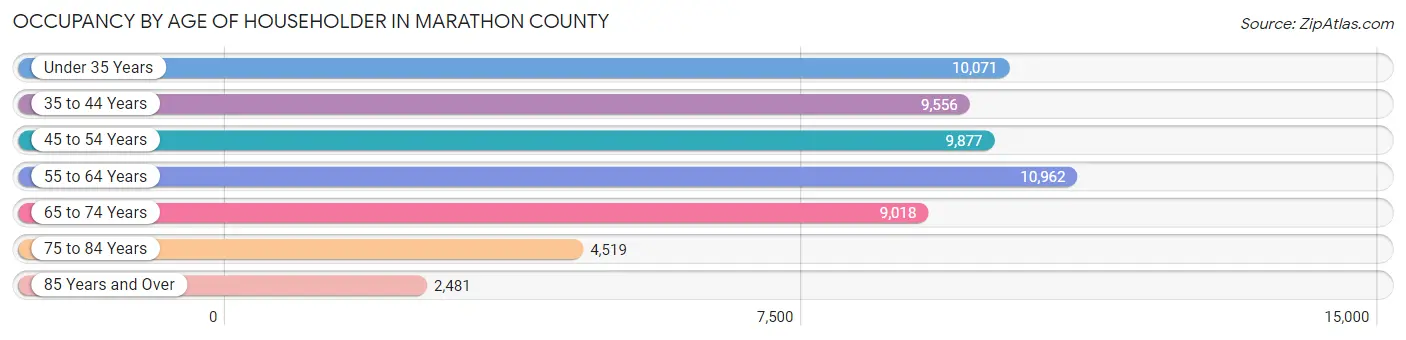
| Age Bracket | # Households | % Households |
| Under 35 Years | 10,071 | 17.8% |
| 35 to 44 Years | 9,556 | 16.9% |
| 45 to 54 Years | 9,877 | 17.5% |
| 55 to 64 Years | 10,962 | 19.4% |
| 65 to 74 Years | 9,018 | 16.0% |
| 75 to 84 Years | 4,519 | 8.0% |
| 85 Years and Over | 2,481 | 4.4% |
| Total | 56,484 | 100.0% |
Housing Finances in Marathon County
Median Income by Occupancy in Marathon County
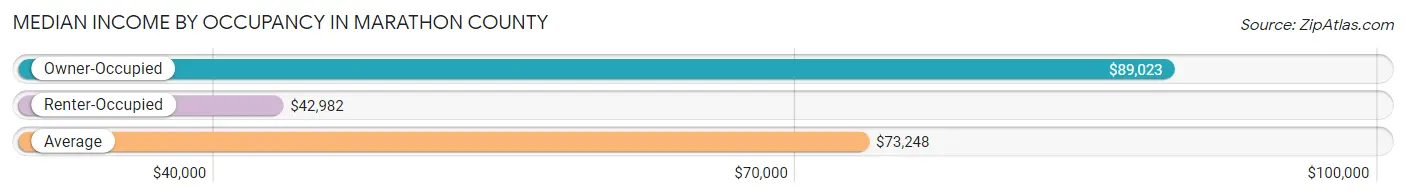
| Occupancy Type | # Households | Median Income |
| Owner-Occupied | 41,182 (72.9%) | $89,023 |
| Renter-Occupied | 15,302 (27.1%) | $42,982 |
| Average | 56,484 (100.0%) | $73,248 |
Occupancy by Householder Income Bracket in Marathon County
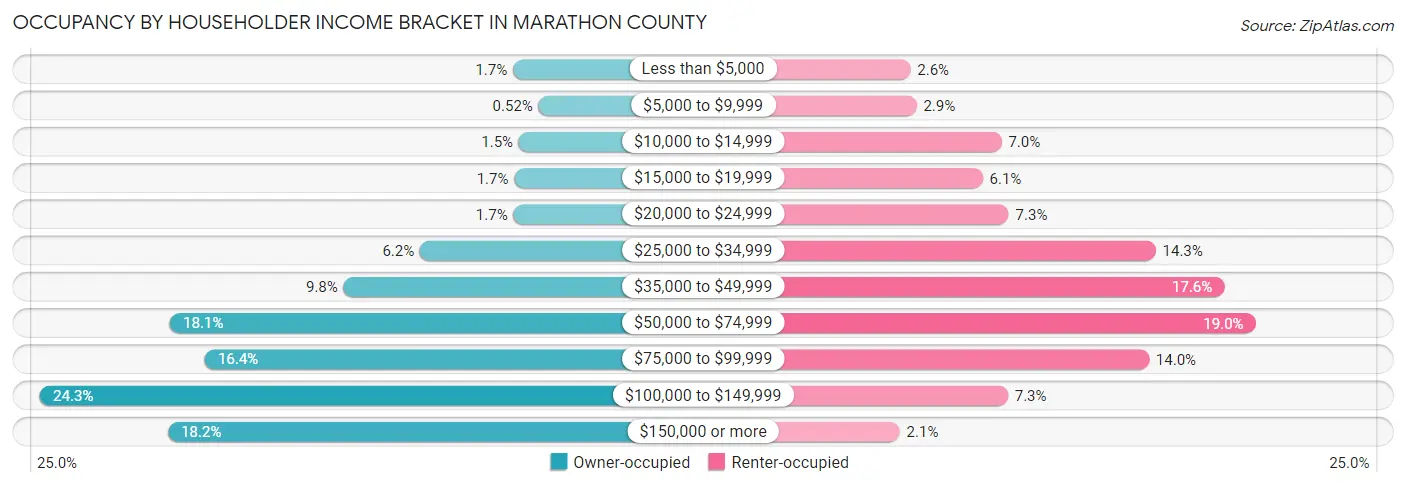
| Income Bracket | Owner-occupied | Renter-occupied |
| Less than $5,000 | 717 (1.7%) | 399 (2.6%) |
| $5,000 to $9,999 | 213 (0.5%) | 444 (2.9%) |
| $10,000 to $14,999 | 602 (1.5%) | 1,064 (7.0%) |
| $15,000 to $19,999 | 693 (1.7%) | 926 (6.0%) |
| $20,000 to $24,999 | 707 (1.7%) | 1,116 (7.3%) |
| $25,000 to $34,999 | 2,539 (6.2%) | 2,186 (14.3%) |
| $35,000 to $49,999 | 4,038 (9.8%) | 2,685 (17.5%) |
| $50,000 to $74,999 | 7,443 (18.1%) | 2,913 (19.0%) |
| $75,000 to $99,999 | 6,760 (16.4%) | 2,138 (14.0%) |
| $100,000 to $149,999 | 9,989 (24.3%) | 1,109 (7.2%) |
| $150,000 or more | 7,481 (18.2%) | 322 (2.1%) |
| Total | 41,182 (100.0%) | 15,302 (100.0%) |
Monthly Housing Cost Tiers in Marathon County
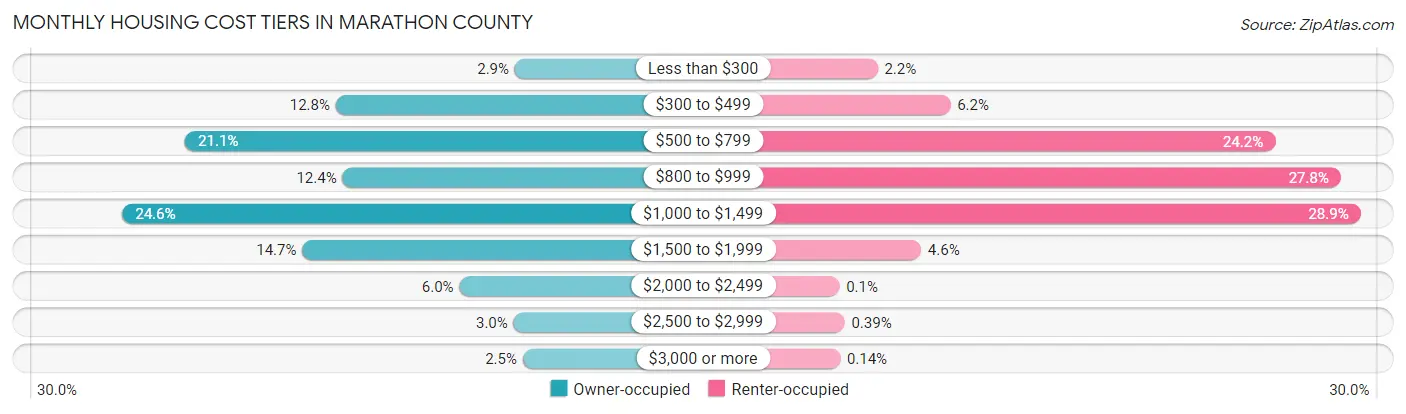
| Monthly Cost | Owner-occupied | Renter-occupied |
| Less than $300 | 1,201 (2.9%) | 338 (2.2%) |
| $300 to $499 | 5,276 (12.8%) | 954 (6.2%) |
| $500 to $799 | 8,702 (21.1%) | 3,699 (24.2%) |
| $800 to $999 | 5,122 (12.4%) | 4,254 (27.8%) |
| $1,000 to $1,499 | 10,129 (24.6%) | 4,421 (28.9%) |
| $1,500 to $1,999 | 6,036 (14.7%) | 706 (4.6%) |
| $2,000 to $2,499 | 2,463 (6.0%) | 16 (0.1%) |
| $2,500 to $2,999 | 1,232 (3.0%) | 60 (0.4%) |
| $3,000 or more | 1,021 (2.5%) | 21 (0.1%) |
| Total | 41,182 (100.0%) | 15,302 (100.0%) |
Physical Housing Characteristics in Marathon County
Housing Structures in Marathon County
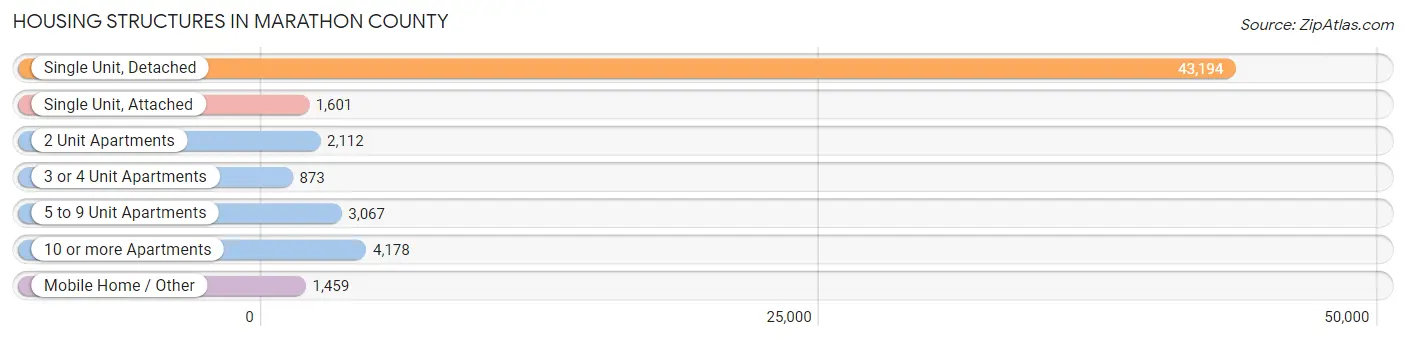
| Structure Type | # Housing Units | % Housing Units |
| Single Unit, Detached | 43,194 | 76.5% |
| Single Unit, Attached | 1,601 | 2.8% |
| 2 Unit Apartments | 2,112 | 3.7% |
| 3 or 4 Unit Apartments | 873 | 1.5% |
| 5 to 9 Unit Apartments | 3,067 | 5.4% |
| 10 or more Apartments | 4,178 | 7.4% |
| Mobile Home / Other | 1,459 | 2.6% |
| Total | 56,484 | 100.0% |
Housing Structures by Occupancy in Marathon County
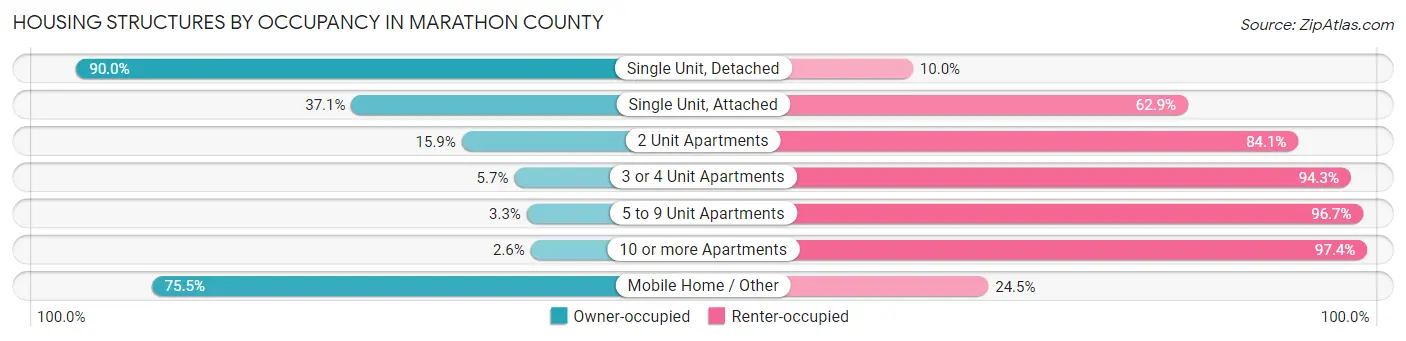
| Structure Type | Owner-occupied | Renter-occupied |
| Single Unit, Detached | 38,891 (90.0%) | 4,303 (10.0%) |
| Single Unit, Attached | 594 (37.1%) | 1,007 (62.9%) |
| 2 Unit Apartments | 335 (15.9%) | 1,777 (84.1%) |
| 3 or 4 Unit Apartments | 50 (5.7%) | 823 (94.3%) |
| 5 to 9 Unit Apartments | 102 (3.3%) | 2,965 (96.7%) |
| 10 or more Apartments | 108 (2.6%) | 4,070 (97.4%) |
| Mobile Home / Other | 1,102 (75.5%) | 357 (24.5%) |
| Total | 41,182 (72.9%) | 15,302 (27.1%) |
Housing Structures by Number of Rooms in Marathon County
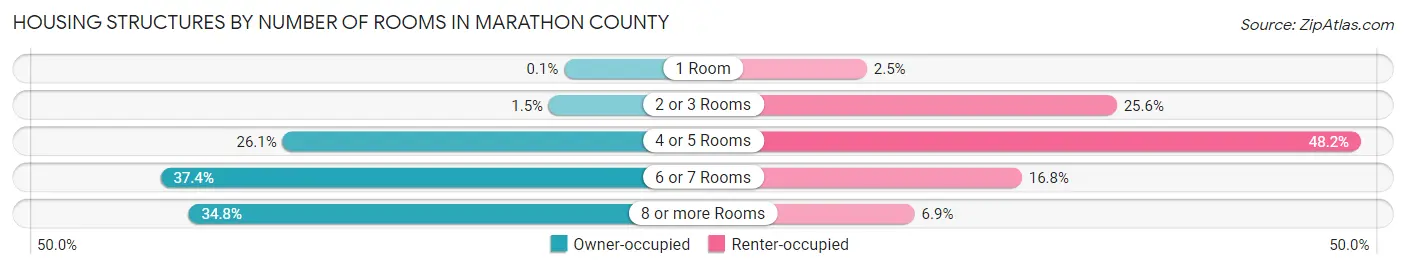
| Number of Rooms | Owner-occupied | Renter-occupied |
| 1 Room | 40 (0.1%) | 381 (2.5%) |
| 2 or 3 Rooms | 621 (1.5%) | 3,917 (25.6%) |
| 4 or 5 Rooms | 10,763 (26.1%) | 7,373 (48.2%) |
| 6 or 7 Rooms | 15,416 (37.4%) | 2,574 (16.8%) |
| 8 or more Rooms | 14,342 (34.8%) | 1,057 (6.9%) |
| Total | 41,182 (100.0%) | 15,302 (100.0%) |
Housing Structure by Heating Type in Marathon County
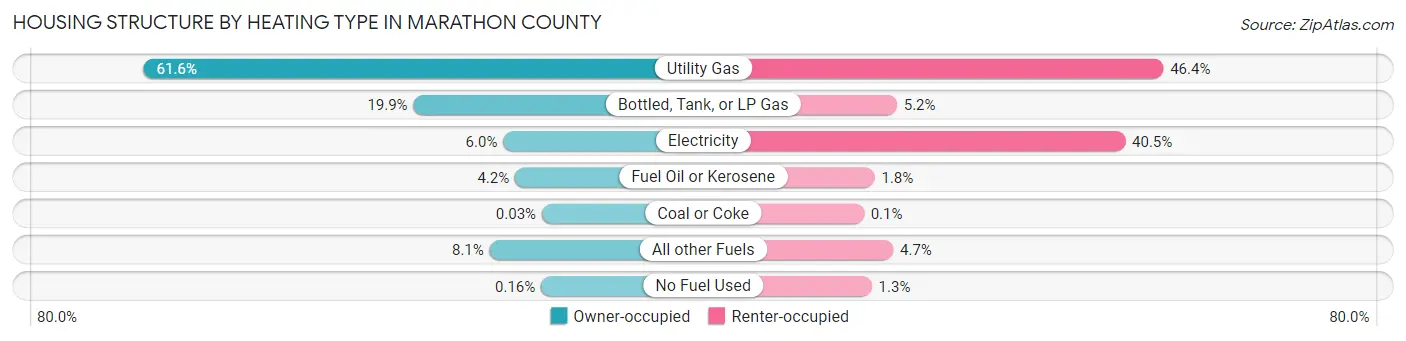
| Heating Type | Owner-occupied | Renter-occupied |
| Utility Gas | 25,374 (61.6%) | 7,102 (46.4%) |
| Bottled, Tank, or LP Gas | 8,192 (19.9%) | 799 (5.2%) |
| Electricity | 2,477 (6.0%) | 6,199 (40.5%) |
| Fuel Oil or Kerosene | 1,722 (4.2%) | 272 (1.8%) |
| Coal or Coke | 12 (0.0%) | 15 (0.1%) |
| All other Fuels | 3,341 (8.1%) | 712 (4.6%) |
| No Fuel Used | 64 (0.2%) | 203 (1.3%) |
| Total | 41,182 (100.0%) | 15,302 (100.0%) |
Household Vehicle Usage in Marathon County
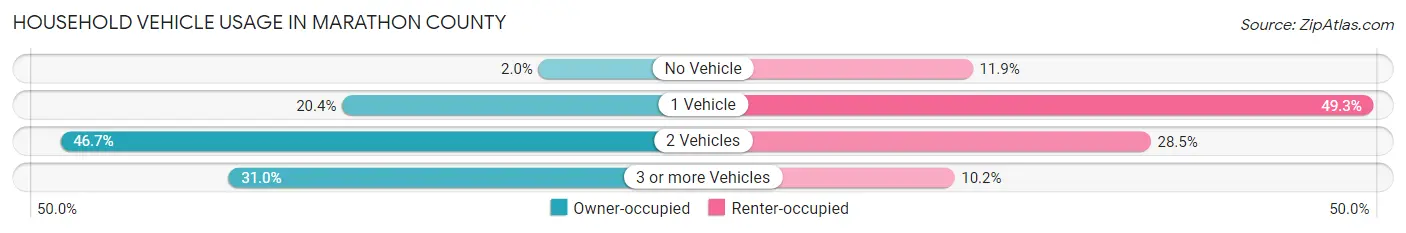
| Vehicles per Household | Owner-occupied | Renter-occupied |
| No Vehicle | 827 (2.0%) | 1,823 (11.9%) |
| 1 Vehicle | 8,379 (20.3%) | 7,550 (49.3%) |
| 2 Vehicles | 19,218 (46.7%) | 4,366 (28.5%) |
| 3 or more Vehicles | 12,758 (31.0%) | 1,563 (10.2%) |
| Total | 41,182 (100.0%) | 15,302 (100.0%) |
Real Estate & Mortgages in Marathon County
Real Estate and Mortgage Overview in Marathon County
| Characteristic | Without Mortgage | With Mortgage |
| Housing Units | 16,779 | 24,403 |
| Median Property Value | $181,900 | $202,400 |
| Median Household Income | $65,965 | $5,357 |
| Monthly Housing Costs | $557 | $1,003 |
| Real Estate Taxes | $2,978 | $211 |
Property Value by Mortgage Status in Marathon County
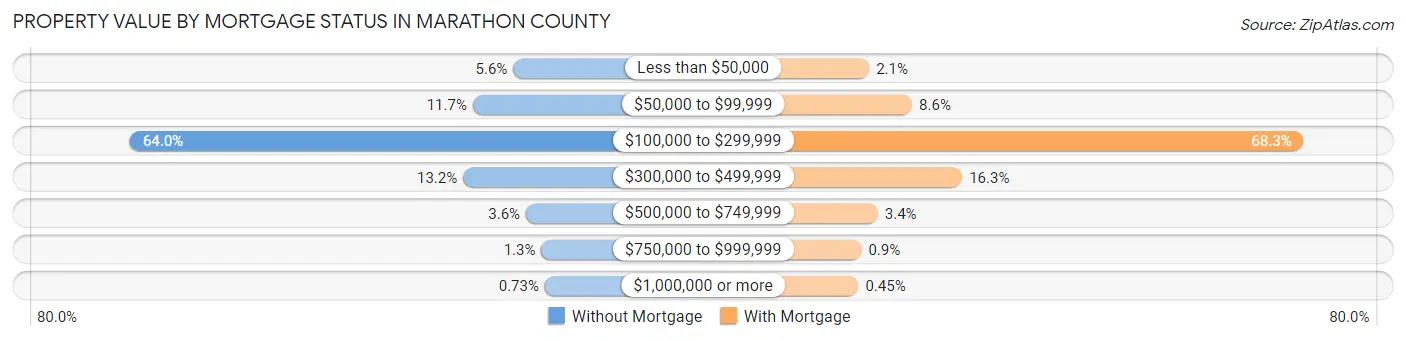
| Property Value | Without Mortgage | With Mortgage |
| Less than $50,000 | 931 (5.6%) | 507 (2.1%) |
| $50,000 to $99,999 | 1,965 (11.7%) | 2,105 (8.6%) |
| $100,000 to $299,999 | 10,730 (63.9%) | 16,662 (68.3%) |
| $300,000 to $499,999 | 2,213 (13.2%) | 3,969 (16.3%) |
| $500,000 to $749,999 | 606 (3.6%) | 830 (3.4%) |
| $750,000 to $999,999 | 212 (1.3%) | 220 (0.9%) |
| $1,000,000 or more | 122 (0.7%) | 110 (0.4%) |
| Total | 16,779 (100.0%) | 24,403 (100.0%) |
Household Income by Mortgage Status in Marathon County
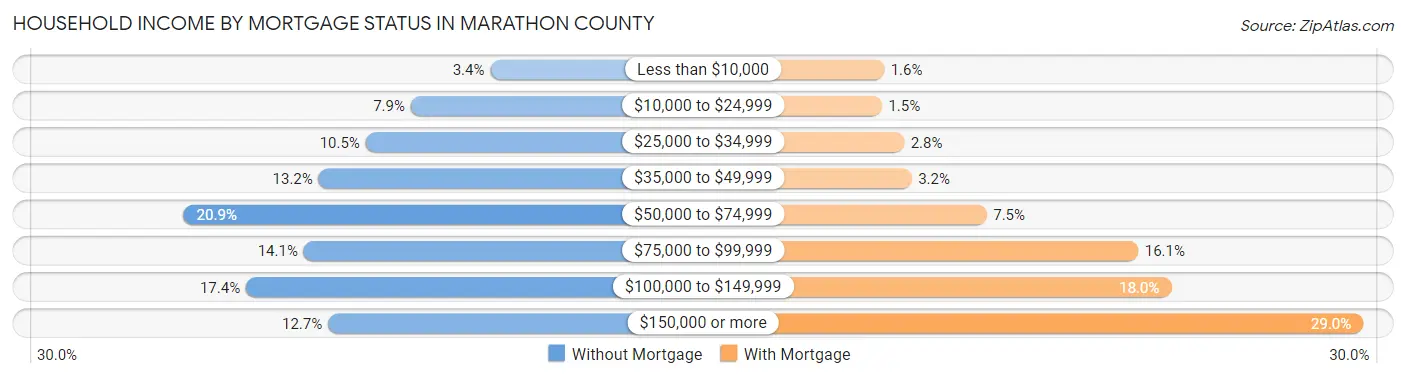
| Household Income | Without Mortgage | With Mortgage |
| Less than $10,000 | 569 (3.4%) | 394 (1.6%) |
| $10,000 to $24,999 | 1,331 (7.9%) | 361 (1.5%) |
| $25,000 to $34,999 | 1,763 (10.5%) | 671 (2.8%) |
| $35,000 to $49,999 | 2,215 (13.2%) | 776 (3.2%) |
| $50,000 to $74,999 | 3,508 (20.9%) | 1,823 (7.5%) |
| $75,000 to $99,999 | 2,358 (14.1%) | 3,935 (16.1%) |
| $100,000 to $149,999 | 2,911 (17.3%) | 4,402 (18.0%) |
| $150,000 or more | 2,124 (12.7%) | 7,078 (29.0%) |
| Total | 16,779 (100.0%) | 24,403 (100.0%) |
Property Value to Household Income Ratio in Marathon County
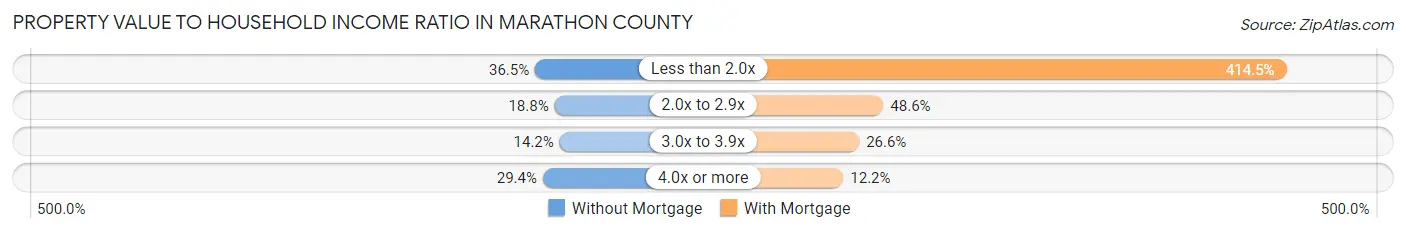
| Value-to-Income Ratio | Without Mortgage | With Mortgage |
| Less than 2.0x | 6,119 (36.5%) | 101,149 (414.5%) |
| 2.0x to 2.9x | 3,157 (18.8%) | 11,849 (48.6%) |
| 3.0x to 3.9x | 2,382 (14.2%) | 6,489 (26.6%) |
| 4.0x or more | 4,939 (29.4%) | 2,975 (12.2%) |
| Total | 16,779 (100.0%) | 24,403 (100.0%) |
Real Estate Taxes by Mortgage Status in Marathon County
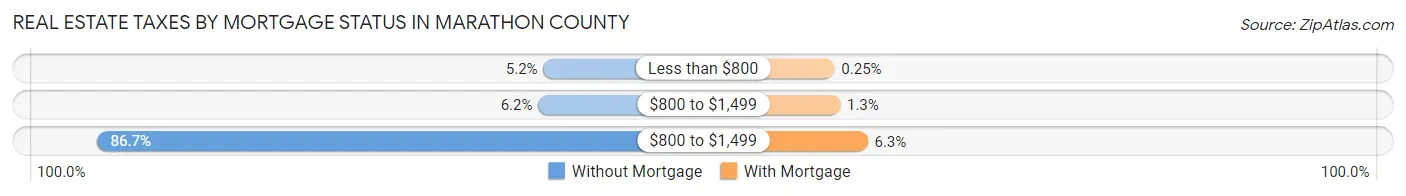
| Property Taxes | Without Mortgage | With Mortgage |
| Less than $800 | 878 (5.2%) | 61 (0.3%) |
| $800 to $1,499 | 1,036 (6.2%) | 311 (1.3%) |
| $800 to $1,499 | 14,539 (86.7%) | 1,537 (6.3%) |
| Total | 16,779 (100.0%) | 24,403 (100.0%) |
Health & Disability in Marathon County
Health Insurance Coverage by Age in Marathon County
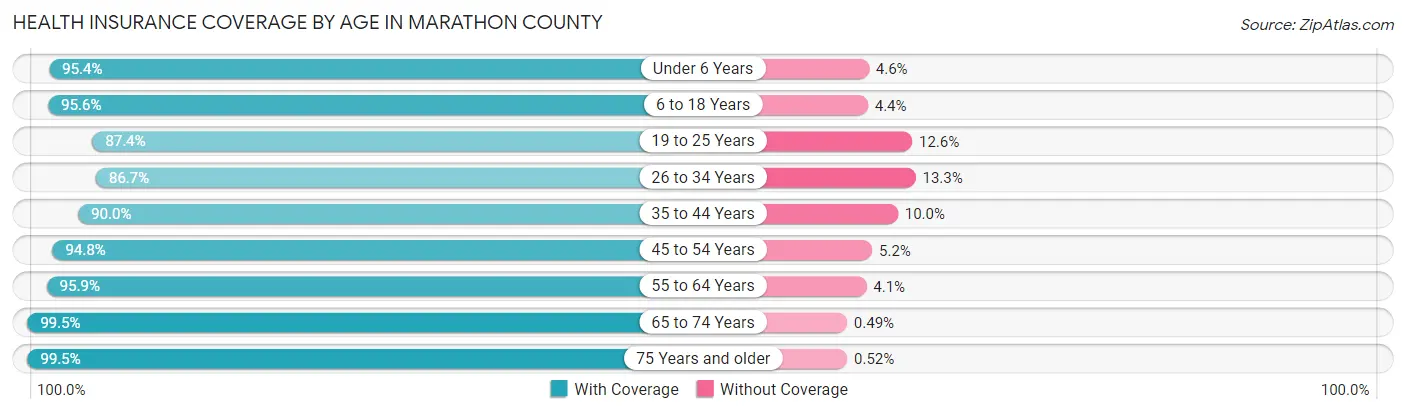
| Age Bracket | With Coverage | Without Coverage |
| Under 6 Years | 8,832 (95.4%) | 424 (4.6%) |
| 6 to 18 Years | 22,431 (95.6%) | 1,027 (4.4%) |
| 19 to 25 Years | 9,371 (87.4%) | 1,356 (12.6%) |
| 26 to 34 Years | 12,517 (86.7%) | 1,917 (13.3%) |
| 35 to 44 Years | 15,662 (90.0%) | 1,736 (10.0%) |
| 45 to 54 Years | 16,288 (94.8%) | 892 (5.2%) |
| 55 to 64 Years | 18,872 (95.9%) | 808 (4.1%) |
| 65 to 74 Years | 14,349 (99.5%) | 70 (0.5%) |
| 75 Years and older | 10,117 (99.5%) | 53 (0.5%) |
| Total | 128,439 (93.9%) | 8,283 (6.1%) |
Health Insurance Coverage by Citizenship Status in Marathon County
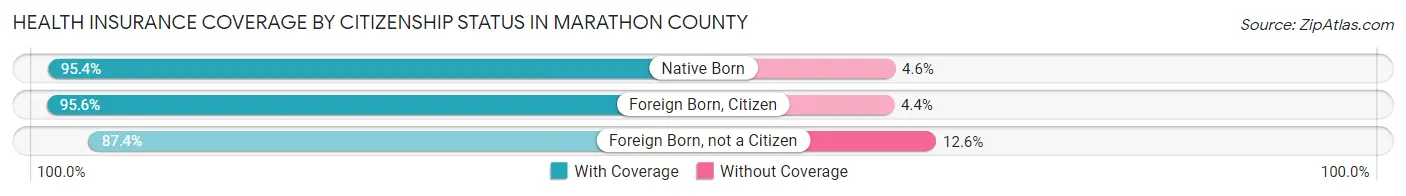
| Citizenship Status | With Coverage | Without Coverage |
| Native Born | 8,832 (95.4%) | 424 (4.6%) |
| Foreign Born, Citizen | 22,431 (95.6%) | 1,027 (4.4%) |
| Foreign Born, not a Citizen | 9,371 (87.4%) | 1,356 (12.6%) |
Health Insurance Coverage by Household Income in Marathon County
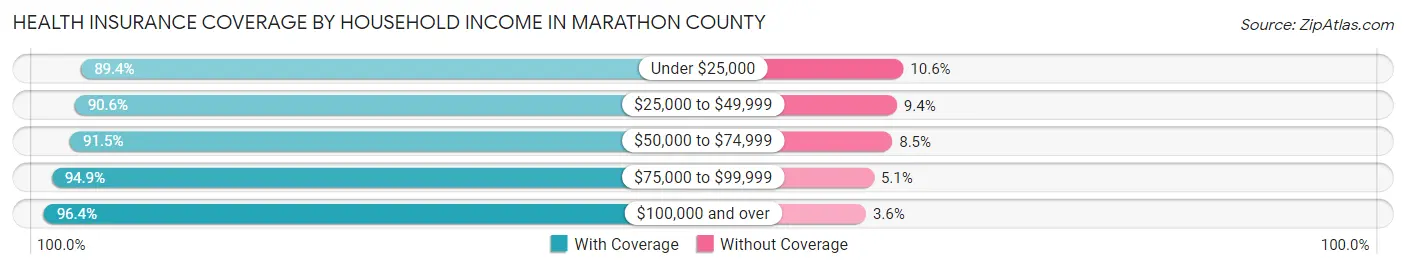
| Household Income | With Coverage | Without Coverage |
| Under $25,000 | 9,479 (89.4%) | 1,125 (10.6%) |
| $25,000 to $49,999 | 18,204 (90.6%) | 1,886 (9.4%) |
| $50,000 to $74,999 | 20,568 (91.5%) | 1,916 (8.5%) |
| $75,000 to $99,999 | 22,969 (94.9%) | 1,231 (5.1%) |
| $100,000 and over | 56,562 (96.4%) | 2,104 (3.6%) |
Public vs Private Health Insurance Coverage by Age in Marathon County
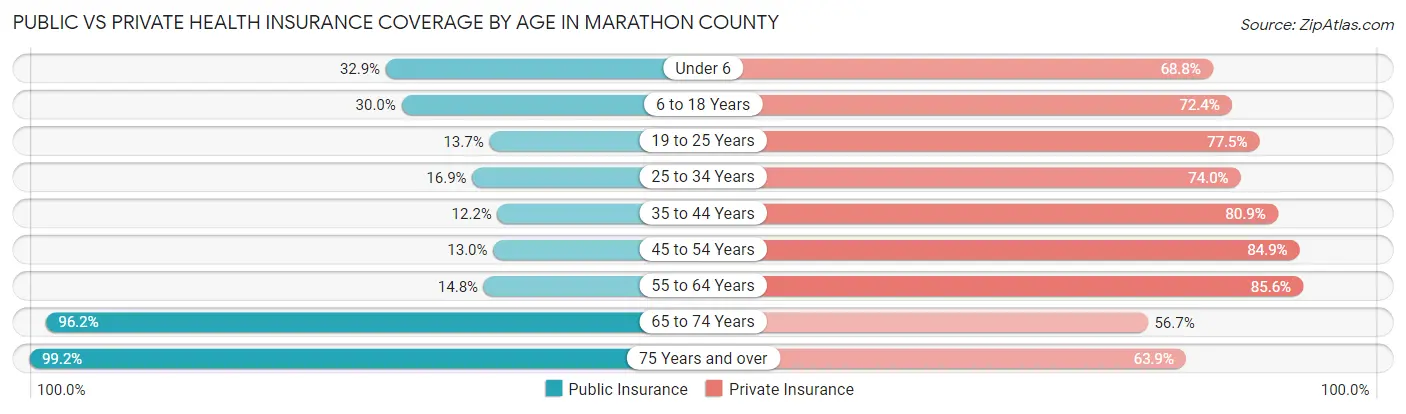
| Age Bracket | Public Insurance | Private Insurance |
| Under 6 | 3,048 (32.9%) | 6,372 (68.8%) |
| 6 to 18 Years | 7,043 (30.0%) | 16,974 (72.4%) |
| 19 to 25 Years | 1,471 (13.7%) | 8,311 (77.5%) |
| 25 to 34 Years | 2,436 (16.9%) | 10,678 (74.0%) |
| 35 to 44 Years | 2,120 (12.2%) | 14,073 (80.9%) |
| 45 to 54 Years | 2,232 (13.0%) | 14,592 (84.9%) |
| 55 to 64 Years | 2,903 (14.7%) | 16,842 (85.6%) |
| 65 to 74 Years | 13,865 (96.2%) | 8,181 (56.7%) |
| 75 Years and over | 10,088 (99.2%) | 6,494 (63.8%) |
| Total | 45,206 (33.1%) | 102,517 (75.0%) |
Disability Status by Sex by Age in Marathon County
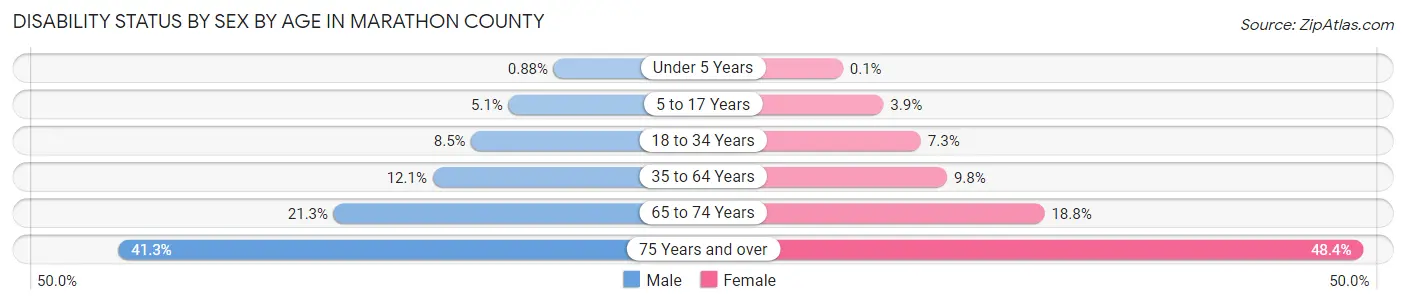
| Age Bracket | Male | Female |
| Under 5 Years | 35 (0.9%) | 4 (0.1%) |
| 5 to 17 Years | 607 (5.1%) | 436 (3.9%) |
| 18 to 34 Years | 1,191 (8.5%) | 943 (7.3%) |
| 35 to 64 Years | 3,361 (12.1%) | 2,590 (9.8%) |
| 65 to 74 Years | 1,538 (21.3%) | 1,354 (18.8%) |
| 75 Years and over | 1,800 (41.3%) | 2,812 (48.4%) |
Disability Class by Sex by Age in Marathon County
Disability Class: Hearing Difficulty
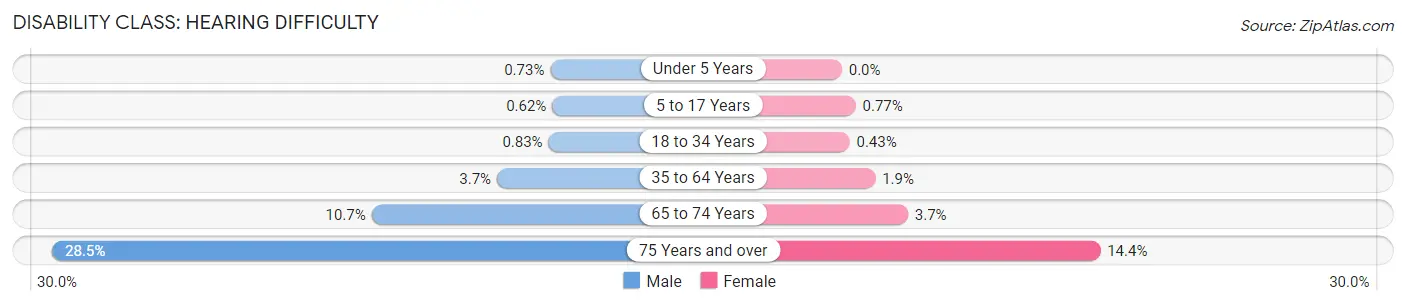
| Age Bracket | Male | Female |
| Under 5 Years | 29 (0.7%) | 0 (0.0%) |
| 5 to 17 Years | 74 (0.6%) | 87 (0.8%) |
| 18 to 34 Years | 116 (0.8%) | 55 (0.4%) |
| 35 to 64 Years | 1,025 (3.7%) | 494 (1.9%) |
| 65 to 74 Years | 771 (10.7%) | 265 (3.7%) |
| 75 Years and over | 1,241 (28.5%) | 836 (14.4%) |
Disability Class: Vision Difficulty
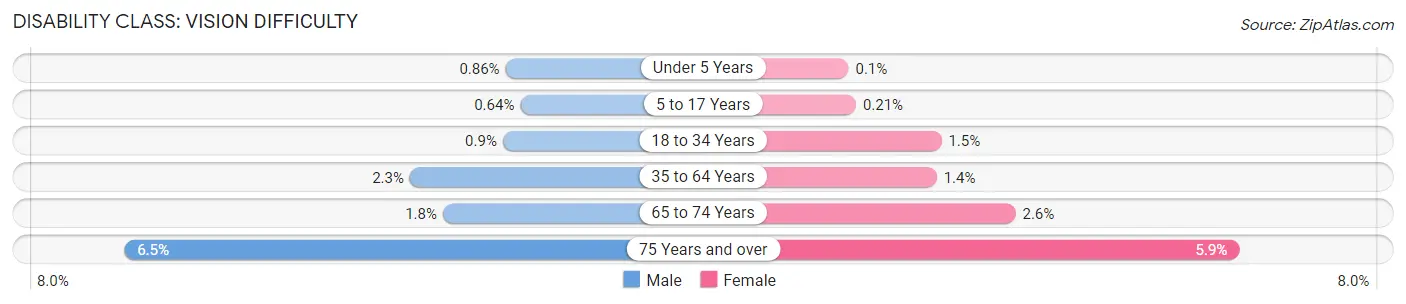
| Age Bracket | Male | Female |
| Under 5 Years | 34 (0.9%) | 4 (0.1%) |
| 5 to 17 Years | 77 (0.6%) | 24 (0.2%) |
| 18 to 34 Years | 126 (0.9%) | 190 (1.5%) |
| 35 to 64 Years | 632 (2.3%) | 374 (1.4%) |
| 65 to 74 Years | 129 (1.8%) | 186 (2.6%) |
| 75 Years and over | 284 (6.5%) | 343 (5.9%) |
Disability Class: Cognitive Difficulty
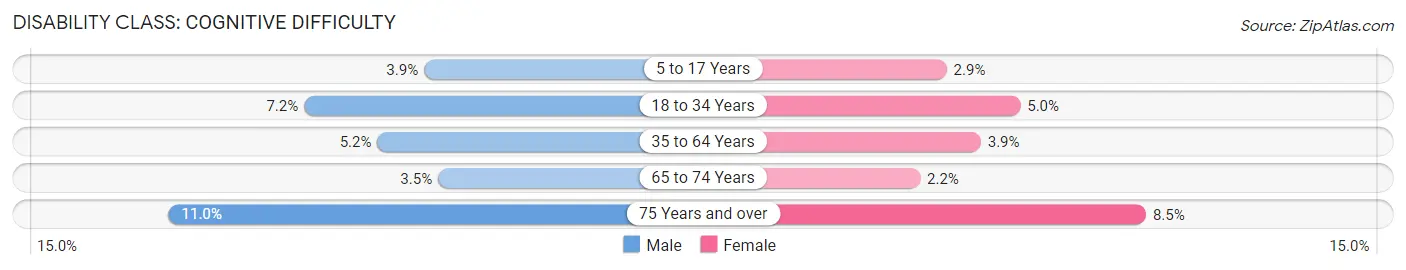
| Age Bracket | Male | Female |
| 5 to 17 Years | 465 (3.9%) | 330 (2.9%) |
| 18 to 34 Years | 1,008 (7.2%) | 638 (5.0%) |
| 35 to 64 Years | 1,437 (5.2%) | 1,027 (3.9%) |
| 65 to 74 Years | 252 (3.5%) | 157 (2.2%) |
| 75 Years and over | 479 (11.0%) | 492 (8.5%) |
Disability Class: Ambulatory Difficulty
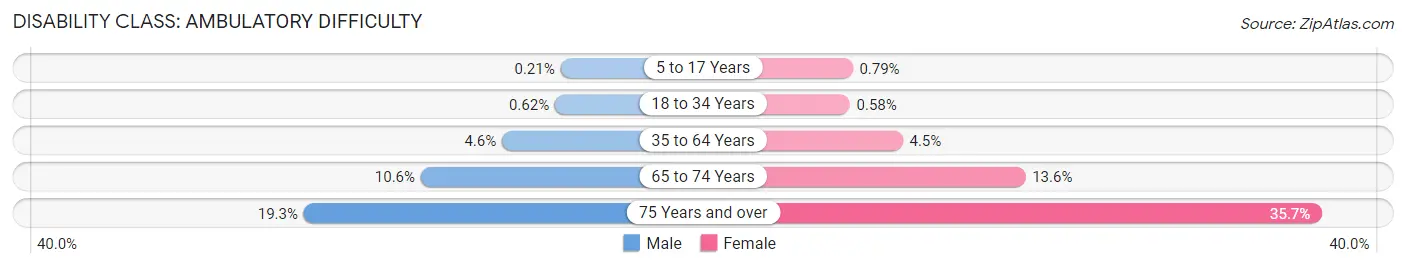
| Age Bracket | Male | Female |
| 5 to 17 Years | 25 (0.2%) | 89 (0.8%) |
| 18 to 34 Years | 87 (0.6%) | 74 (0.6%) |
| 35 to 64 Years | 1,261 (4.5%) | 1,195 (4.5%) |
| 65 to 74 Years | 764 (10.6%) | 981 (13.6%) |
| 75 Years and over | 840 (19.3%) | 2,072 (35.7%) |
Disability Class: Self-Care Difficulty
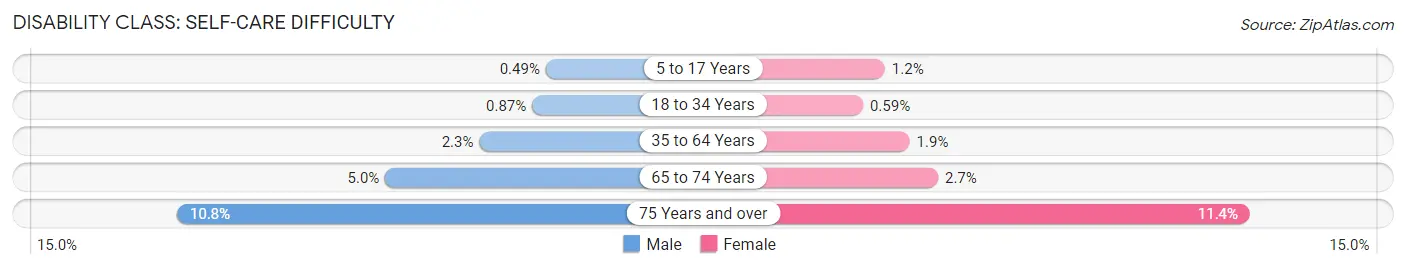
| Age Bracket | Male | Female |
| 5 to 17 Years | 59 (0.5%) | 136 (1.2%) |
| 18 to 34 Years | 121 (0.9%) | 76 (0.6%) |
| 35 to 64 Years | 648 (2.3%) | 502 (1.9%) |
| 65 to 74 Years | 358 (5.0%) | 193 (2.7%) |
| 75 Years and over | 469 (10.8%) | 660 (11.4%) |
Technology Access in Marathon County
Computing Device Access in Marathon County
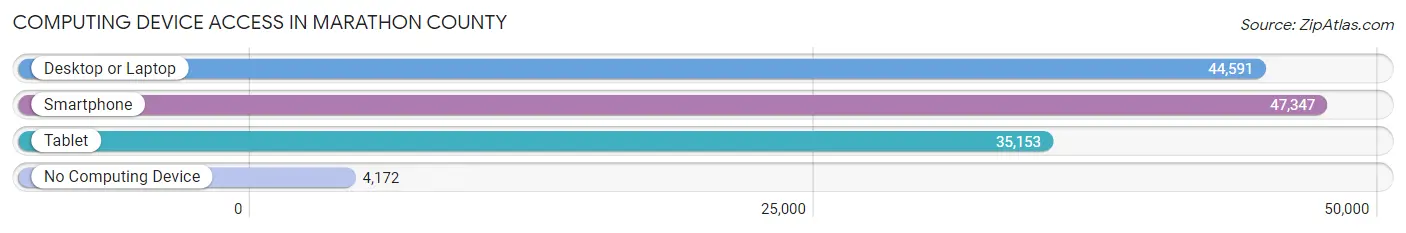
| Device Type | # Households | % Households |
| Desktop or Laptop | 44,591 | 78.9% |
| Smartphone | 47,347 | 83.8% |
| Tablet | 35,153 | 62.2% |
| No Computing Device | 4,172 | 7.4% |
| Total | 56,484 | 100.0% |
Internet Access in Marathon County
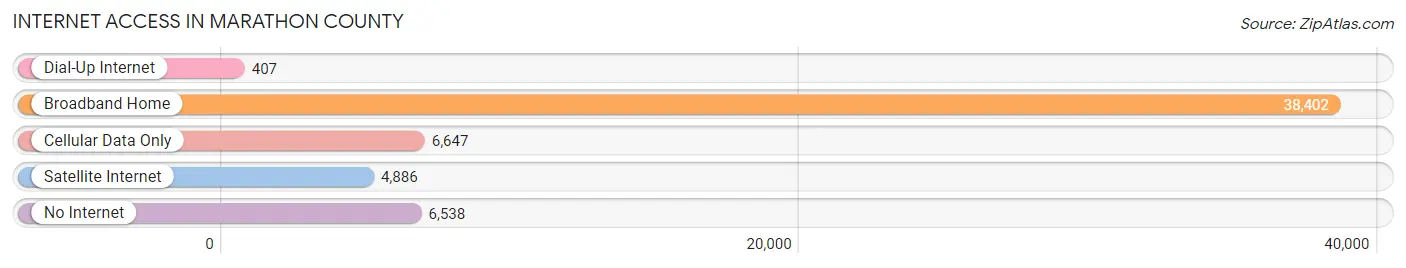
| Internet Type | # Households | % Households |
| Dial-Up Internet | 407 | 0.7% |
| Broadband Home | 38,402 | 68.0% |
| Cellular Data Only | 6,647 | 11.8% |
| Satellite Internet | 4,886 | 8.6% |
| No Internet | 6,538 | 11.6% |
| Total | 56,484 | 100.0% |
Marathon County Summary
Marathon County, Wisconsin is located in the north-central part of the state and is part of the Wausau, Wisconsin Metropolitan Statistical Area. The county was established in 1850 and is named after the ancient Greek city-state of Marathon. The county seat is Wausau, which is also the largest city in the county. As of the 2010 census, the population of Marathon County was 134,063.
Geography
Marathon County is located in the north-central part of Wisconsin and is bordered by Langlade County to the north, Lincoln County to the east, Wood County to the south, and Portage County to the west. The county covers an area of 1,543 square miles and is home to numerous lakes, rivers, and streams. The Wisconsin River runs through the county, and the Eau Claire River and the Rib River also flow through the county. The highest point in the county is located in the town of Berlin, at an elevation of 1,945 feet.
The county is divided into twenty-one townships, which are further divided into thirty-nine municipalities. The largest municipality in the county is the city of Wausau, which is also the county seat. Other major cities in the county include Schofield, Rothschild, and Mosinee.
Economy
Marathon County is home to a diverse economy, with a variety of industries providing employment opportunities. The largest employers in the county are the Wausau School District, Aspirus Wausau Hospital, and the City of Wausau. Other major employers in the county include the Marathon County government, the Wausau-Marathon County Airport, and the Wausau Center Mall.
The county is also home to a number of manufacturing companies, including Wausau Paper, Wausau Window and Wall Systems, and Wausau Tile. Agriculture is also an important part of the county’s economy, with dairy farming being the most common type of farming. Other agricultural products produced in the county include corn, soybeans, hay, and potatoes.
Demographics
As of the 2010 census, the population of Marathon County was 134,063. The population was spread out, with 24.3% under the age of 18, 10.2% from 18 to 24, 28.2% from 25 to 44, 22.7% from 45 to 64, and 14.6% who were 65 years of age or older. The median age was 36.4 years.
The racial makeup of the county was 94.2% White, 1.3% African American, 0.7% Native American, 1.7% Asian, 0.1% Pacific Islander, 0.9% from other races, and 1.1% from two or more races. Hispanic or Latino of any race were 2.7% of the population.
The median income for a household in the county was $48,945, and the median income for a family was $60,945. The per capita income for the county was $25,845. About 8.2% of families and 11.2% of the population were below the poverty line, including 15.2% of those under age 18 and 6.7% of those age 65 or over.
Marathon County is a diverse and vibrant county with a strong economy and a variety of industries providing employment opportunities. The county is home to a variety of cultures and backgrounds, making it a great place to live and work.
Common Questions
What is the Total Population of Marathon County?
Total Population of Marathon County is 137,820.
What is the Total Male Population of Marathon County?
Total Male Population of Marathon County is 69,713.
What is the Total Female Population of Marathon County?
Total Female Population of Marathon County is 68,107.
What is the Ratio of Males per 100 Females in Marathon County?
There are 102.36 Males per 100 Females in Marathon County.
What is the Ratio of Females per 100 Males in Marathon County?
There are 97.70 Females per 100 Males in Marathon County.
What is the Median Population Age in Marathon County?
Median Population Age in Marathon County is 41.0 Years.
What is the Average Family Size in Marathon County
Average Family Size in Marathon County is 2.9 People.
What is the Average Household Size in Marathon County
Average Household Size in Marathon County is 2.4 People.
What is Per Capita Income in Marathon County?
Per Capita income in Marathon County is $38,886.
What is the Median Family Income in Marathon County?
Median Family Income in Marathon County is $90,578.
What is the Median Household income in Marathon County?
Median Household Income in Marathon County is $73,248.
What is Income or Wage Gap in Marathon County?
Income or Wage Gap in Marathon County is 25.2%.
Women in Marathon County earn 74.8 cents for every dollar earned by a man.
What is Family Income Deficit in Marathon County?
Family Income Deficit in Marathon County is $11,536.
Families that are below poverty line in Marathon County earn $11,536 less on average than the poverty threshold level.
What is Inequality or Gini Index in Marathon County?
Inequality or Gini Index in Marathon County is 0.42.
How Large is the Labor Force in Marathon County?
There are 74,091 People in the Labor Forcein in Marathon County.
What is the Percentage of People in the Labor Force in Marathon County?
67.0% of People are in the Labor Force in Marathon County.
What is the Unemployment Rate in Marathon County?
Unemployment Rate in Marathon County is 3.1%.