Manitowoc County, WI
Manitowoc County Overview
81,242
TOTAL POPULATION
40,886
MALE POPULATION
40,356
FEMALE POPULATION
101.31
MALES / 100 FEMALES
98.70
FEMALES / 100 MALES
45.0
MEDIAN AGE
2.9
AVG FAMILY SIZE
2.3
AVG HOUSEHOLD SIZE
$35,854
PER CAPITA INCOME
$83,400
AVG FAMILY INCOME
$66,412
AVG HOUSEHOLD INCOME
34.4%
WAGE / INCOME GAP [ % ]
65.6¢/ $1
WAGE / INCOME GAP [ $ ]
$10,130
FAMILY INCOME DEFICIT
0.41
INEQUALITY / GINI INDEX
41,582
LABOR FORCE [ PEOPLE ]
62.3%
PERCENT IN LABOR FORCE
2.0%
UNEMPLOYMENT RATE
Manitowoc County Area Codes
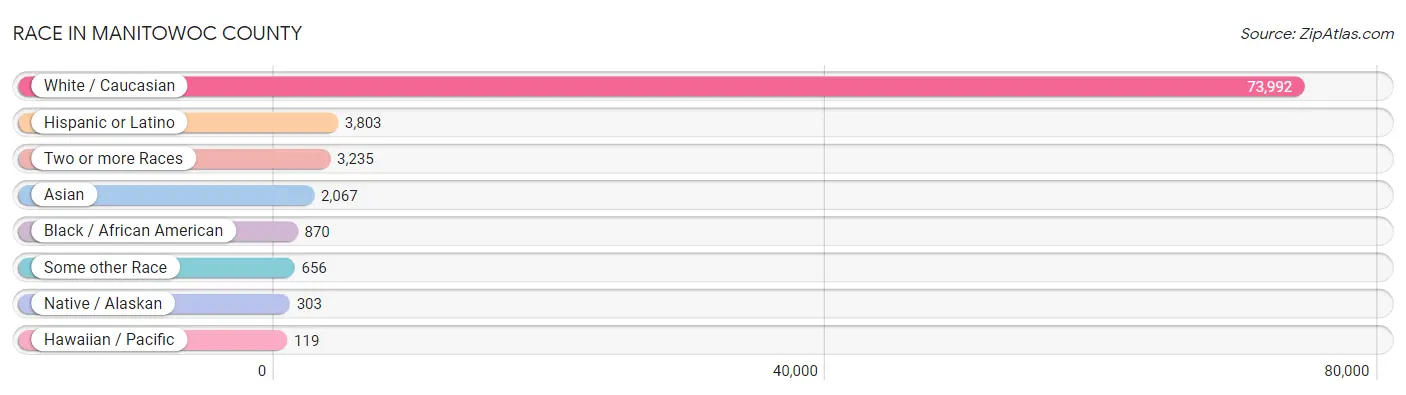
Race in Manitowoc County
The most populous races in Manitowoc County are White / Caucasian (73,992 | 91.1%), Hispanic or Latino (3,803 | 4.7%), and Two or more Races (3,235 | 4.0%).
| Race | # Population | % Population |
| Asian | 2,067 | 2.5% |
| Black / African American | 870 | 1.1% |
| Hawaiian / Pacific | 119 | 0.2% |
| Hispanic or Latino | 3,803 | 4.7% |
| Native / Alaskan | 303 | 0.4% |
| White / Caucasian | 73,992 | 91.1% |
| Two or more Races | 3,235 | 4.0% |
| Some other Race | 656 | 0.8% |
| Total | 81,242 | 100.0% |
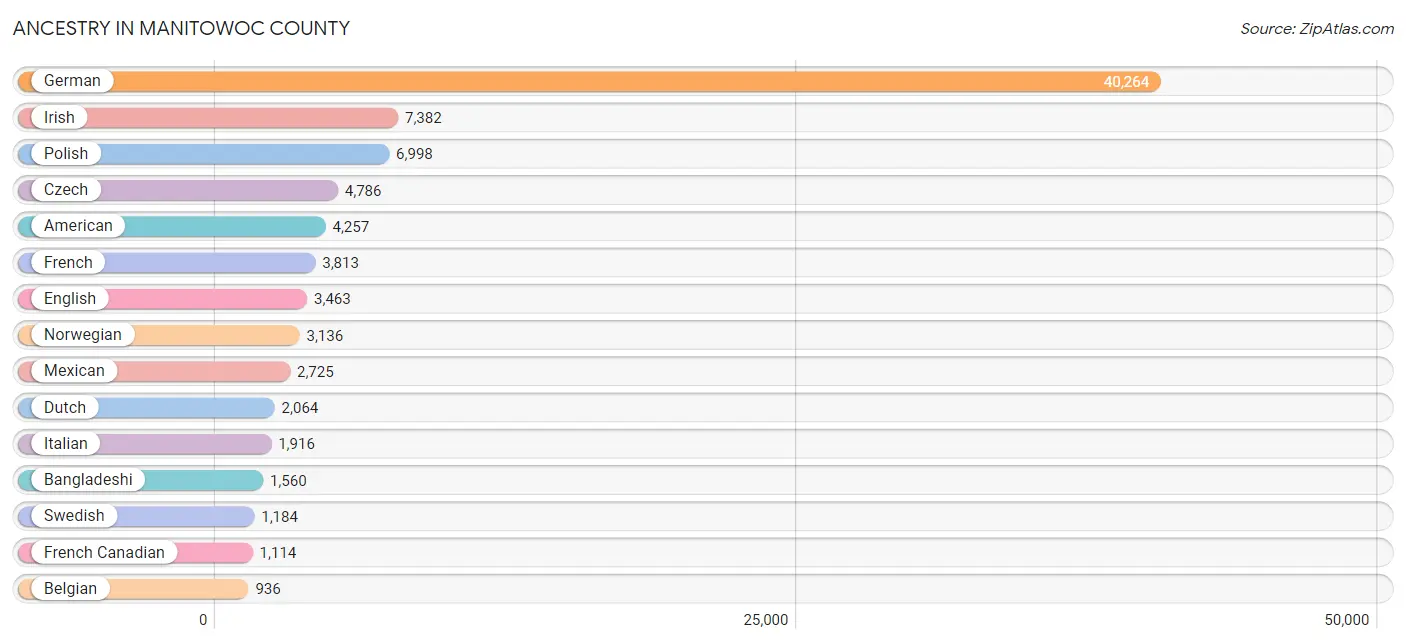
Ancestry in Manitowoc County
The most populous ancestries reported in Manitowoc County are German (40,264 | 49.6%), Irish (7,382 | 9.1%), Polish (6,998 | 8.6%), Czech (4,786 | 5.9%), and American (4,257 | 5.2%), together accounting for 78.4% of all Manitowoc County residents.
| Ancestry | # Population | % Population |
| African | 11 | 0.0% |
| Albanian | 6 | 0.0% |
| American | 4,257 | 5.2% |
| Arab | 81 | 0.1% |
| Argentinean | 2 | 0.0% |
| Armenian | 21 | 0.0% |
| Australian | 12 | 0.0% |
| Austrian | 280 | 0.3% |
| Bahamian | 13 | 0.0% |
| Bangladeshi | 1,560 | 1.9% |
| Belgian | 936 | 1.1% |
| Bhutanese | 140 | 0.2% |
| Blackfeet | 25 | 0.0% |
| British | 86 | 0.1% |
| Burmese | 60 | 0.1% |
| Cambodian | 34 | 0.0% |
| Canadian | 24 | 0.0% |
| Carpatho Rusyn | 68 | 0.1% |
| Celtic | 19 | 0.0% |
| Central American | 379 | 0.5% |
| Central American Indian | 28 | 0.0% |
| Cherokee | 101 | 0.1% |
| Chilean | 9 | 0.0% |
| Chippewa | 146 | 0.2% |
| Colombian | 20 | 0.0% |
| Costa Rican | 11 | 0.0% |
| Cree | 16 | 0.0% |
| Croatian | 127 | 0.2% |
| Cuban | 66 | 0.1% |
| Czech | 4,786 | 5.9% |
| Czechoslovakian | 142 | 0.2% |
| Danish | 688 | 0.9% |
| Dominican | 35 | 0.0% |
| Dutch | 2,064 | 2.5% |
| Dutch West Indian | 4 | 0.0% |
| Eastern European | 167 | 0.2% |
| English | 3,463 | 4.3% |
| European | 709 | 0.9% |
| Filipino | 4 | 0.0% |
| Finnish | 229 | 0.3% |
| French | 3,813 | 4.7% |
| French American Indian | 4 | 0.0% |
| French Canadian | 1,114 | 1.4% |
| German | 40,264 | 49.6% |
| Greek | 84 | 0.1% |
| Guatemalan | 143 | 0.2% |
| Guyanese | 3 | 0.0% |
| Honduran | 7 | 0.0% |
| Hungarian | 131 | 0.2% |
| Icelander | 14 | 0.0% |
| Indian (Asian) | 186 | 0.2% |
| Iranian | 38 | 0.1% |
| Irish | 7,382 | 9.1% |
| Iroquois | 125 | 0.2% |
| Italian | 1,916 | 2.4% |
| Jamaican | 4 | 0.0% |
| Korean | 254 | 0.3% |
| Latvian | 13 | 0.0% |
| Lebanese | 13 | 0.0% |
| Lithuanian | 128 | 0.2% |
| Luxembourger | 96 | 0.1% |
| Malaysian | 130 | 0.2% |
| Menominee | 84 | 0.1% |
| Mexican | 2,725 | 3.4% |
| Mexican American Indian | 4 | 0.0% |
| Native Hawaiian | 64 | 0.1% |
| Navajo | 12 | 0.0% |
| Nicaraguan | 169 | 0.2% |
| Nigerian | 1 | 0.0% |
| Northern European | 112 | 0.1% |
| Norwegian | 3,136 | 3.9% |
| Ottawa | 3 | 0.0% |
| Pakistani | 43 | 0.1% |
| Panamanian | 44 | 0.1% |
| Peruvian | 62 | 0.1% |
| Polish | 6,998 | 8.6% |
| Portuguese | 96 | 0.1% |
| Potawatomi | 5 | 0.0% |
| Puerto Rican | 194 | 0.2% |
| Romanian | 23 | 0.0% |
| Russian | 676 | 0.8% |
| Salvadoran | 5 | 0.0% |
| Scandinavian | 356 | 0.4% |
| Scotch-Irish | 221 | 0.3% |
| Scottish | 613 | 0.7% |
| Serbian | 5 | 0.0% |
| Shoshone | 3 | 0.0% |
| Slavic | 18 | 0.0% |
| Slovak | 74 | 0.1% |
| Slovene | 106 | 0.1% |
| South African | 4 | 0.0% |
| South American | 101 | 0.1% |
| Spaniard | 89 | 0.1% |
| Spanish | 95 | 0.1% |
| Spanish American Indian | 18 | 0.0% |
| Sri Lankan | 5 | 0.0% |
| Subsaharan African | 16 | 0.0% |
| Swedish | 1,184 | 1.5% |
| Swiss | 222 | 0.3% |
| Syrian | 64 | 0.1% |
| Thai | 118 | 0.2% |
| Ukrainian | 85 | 0.1% |
| Venezuelan | 8 | 0.0% |
| Welsh | 60 | 0.1% |
| Yugoslavian | 13 | 0.0% | View All 105 Rows |
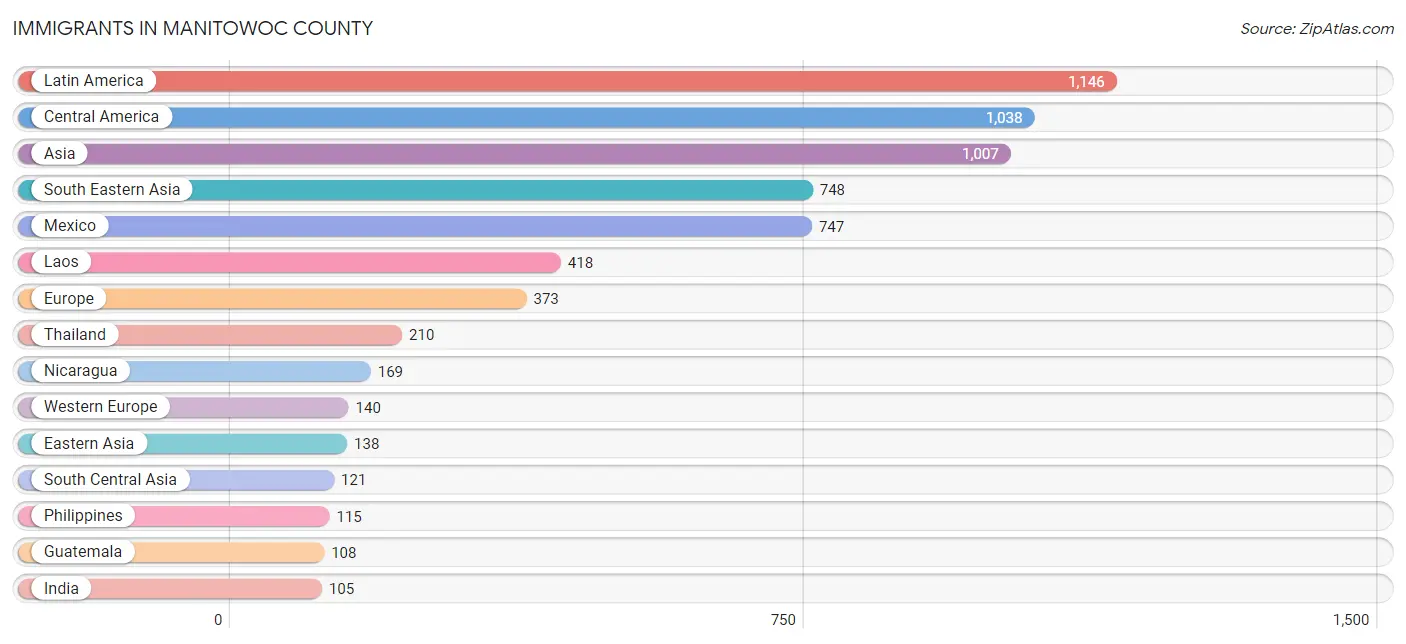
Immigrants in Manitowoc County
The most numerous immigrant groups reported in Manitowoc County came from Latin America (1,146 | 1.4%), Central America (1,038 | 1.3%), Asia (1,007 | 1.2%), South Eastern Asia (748 | 0.9%), and Mexico (747 | 0.9%), together accounting for 5.8% of all Manitowoc County residents.
| Immigration Origin | # Population | % Population |
| Africa | 6 | 0.0% |
| Argentina | 5 | 0.0% |
| Asia | 1,007 | 1.2% |
| Australia | 10 | 0.0% |
| Austria | 9 | 0.0% |
| Bosnia and Herzegovina | 6 | 0.0% |
| Canada | 13 | 0.0% |
| Caribbean | 18 | 0.0% |
| Central America | 1,038 | 1.3% |
| China | 80 | 0.1% |
| Colombia | 14 | 0.0% |
| Costa Rica | 3 | 0.0% |
| Czechoslovakia | 10 | 0.0% |
| Denmark | 11 | 0.0% |
| Dominican Republic | 18 | 0.0% |
| Eastern Africa | 2 | 0.0% |
| Eastern Asia | 138 | 0.2% |
| Eastern Europe | 99 | 0.1% |
| England | 38 | 0.1% |
| Europe | 373 | 0.5% |
| France | 13 | 0.0% |
| Germany | 97 | 0.1% |
| Greece | 18 | 0.0% |
| Guatemala | 108 | 0.1% |
| Honduras | 11 | 0.0% |
| Hungary | 2 | 0.0% |
| India | 105 | 0.1% |
| Iran | 16 | 0.0% |
| Italy | 22 | 0.0% |
| Japan | 3 | 0.0% |
| Korea | 21 | 0.0% |
| Laos | 418 | 0.5% |
| Latin America | 1,146 | 1.4% |
| Latvia | 13 | 0.0% |
| Malaysia | 5 | 0.0% |
| Mexico | 747 | 0.9% |
| Micronesia | 37 | 0.1% |
| Netherlands | 21 | 0.0% |
| Nicaragua | 169 | 0.2% |
| North Macedonia | 3 | 0.0% |
| Northern Europe | 94 | 0.1% |
| Oceania | 47 | 0.1% |
| Peru | 68 | 0.1% |
| Philippines | 115 | 0.1% |
| Poland | 19 | 0.0% |
| Romania | 7 | 0.0% |
| Russia | 14 | 0.0% |
| Scotland | 5 | 0.0% |
| Serbia | 3 | 0.0% |
| South Africa | 4 | 0.0% |
| South America | 90 | 0.1% |
| South Central Asia | 121 | 0.2% |
| South Eastern Asia | 748 | 0.9% |
| Southern Europe | 40 | 0.1% |
| Taiwan | 2 | 0.0% |
| Thailand | 210 | 0.3% |
| Ukraine | 17 | 0.0% |
| Western Europe | 140 | 0.2% |
| Zimbabwe | 2 | 0.0% | View All 59 Rows |
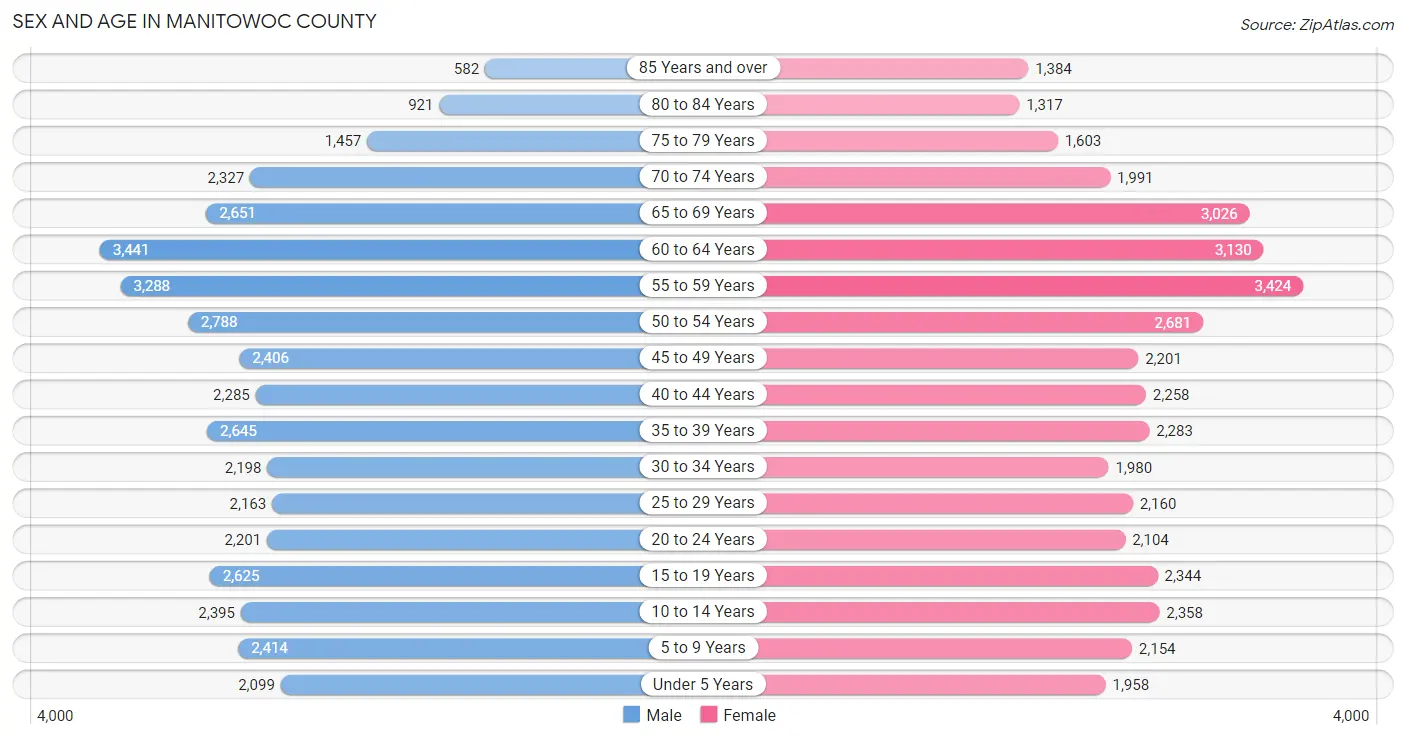
Sex and Age in Manitowoc County
Sex and Age in Manitowoc County
The most populous age groups in Manitowoc County are 60 to 64 Years (3,441 | 8.4%) for men and 55 to 59 Years (3,424 | 8.5%) for women.
| Age Bracket | Male | Female |
| Under 5 Years | 2,099 (5.1%) | 1,958 (4.9%) |
| 5 to 9 Years | 2,414 (5.9%) | 2,154 (5.3%) |
| 10 to 14 Years | 2,395 (5.9%) | 2,358 (5.8%) |
| 15 to 19 Years | 2,625 (6.4%) | 2,344 (5.8%) |
| 20 to 24 Years | 2,201 (5.4%) | 2,104 (5.2%) |
| 25 to 29 Years | 2,163 (5.3%) | 2,160 (5.3%) |
| 30 to 34 Years | 2,198 (5.4%) | 1,980 (4.9%) |
| 35 to 39 Years | 2,645 (6.5%) | 2,283 (5.7%) |
| 40 to 44 Years | 2,285 (5.6%) | 2,258 (5.6%) |
| 45 to 49 Years | 2,406 (5.9%) | 2,201 (5.4%) |
| 50 to 54 Years | 2,788 (6.8%) | 2,681 (6.6%) |
| 55 to 59 Years | 3,288 (8.0%) | 3,424 (8.5%) |
| 60 to 64 Years | 3,441 (8.4%) | 3,130 (7.8%) |
| 65 to 69 Years | 2,651 (6.5%) | 3,026 (7.5%) |
| 70 to 74 Years | 2,327 (5.7%) | 1,991 (4.9%) |
| 75 to 79 Years | 1,457 (3.6%) | 1,603 (4.0%) |
| 80 to 84 Years | 921 (2.2%) | 1,317 (3.3%) |
| 85 Years and over | 582 (1.4%) | 1,384 (3.4%) |
| Total | 40,886 (100.0%) | 40,356 (100.0%) |
Families and Households in Manitowoc County
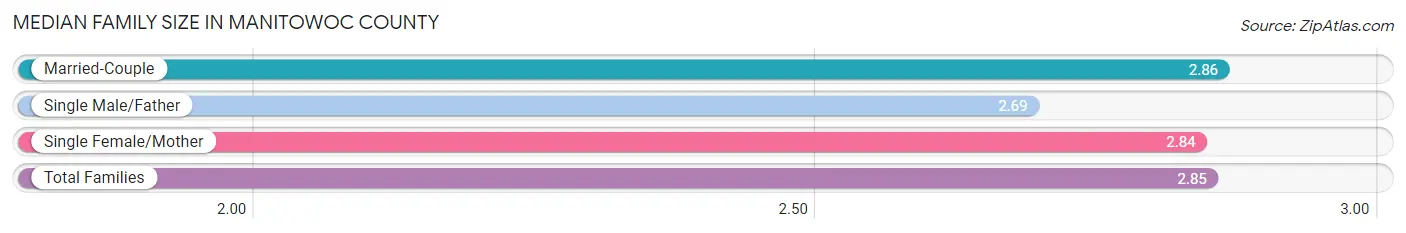
Median Family Size in Manitowoc County
The median family size in Manitowoc County is 2.85 persons per family, with married-couple families (17,082 | 78.5%) accounting for the largest median family size of 2.86 persons per family. On the other hand, single male/father families (1,628 | 7.5%) represent the smallest median family size with 2.69 persons per family.
| Family Type | # Families | Family Size |
| Married-Couple | 17,082 (78.5%) | 2.86 |
| Single Male/Father | 1,628 (7.5%) | 2.69 |
| Single Female/Mother | 3,037 (14.0%) | 2.84 |
| Total Families | 21,747 (100.0%) | 2.85 |
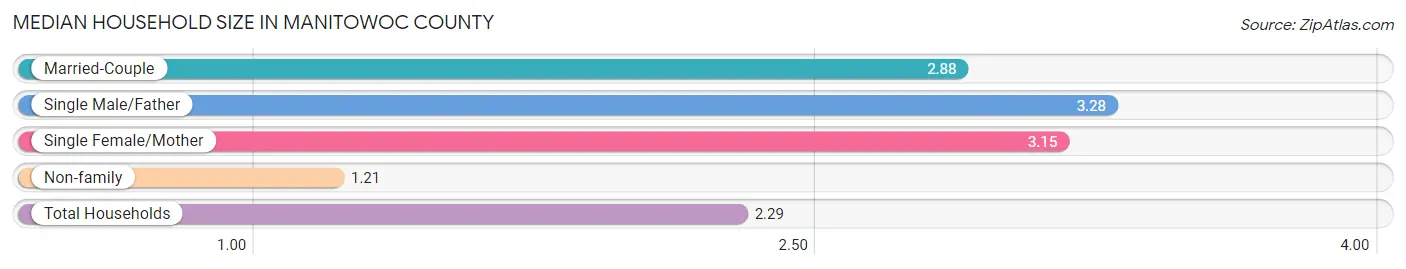
Median Household Size in Manitowoc County
The median household size in Manitowoc County is 2.29 persons per household, with single male/father households (1,628 | 4.7%) accounting for the largest median household size of 3.28 persons per household. non-family households (13,113 | 37.6%) represent the smallest median household size with 1.21 persons per household.
| Household Type | # Households | Household Size |
| Married-Couple | 17,082 (49.0%) | 2.88 |
| Single Male/Father | 1,628 (4.7%) | 3.28 |
| Single Female/Mother | 3,037 (8.7%) | 3.15 |
| Non-family | 13,113 (37.6%) | 1.21 |
| Total Households | 34,860 (100.0%) | 2.29 |
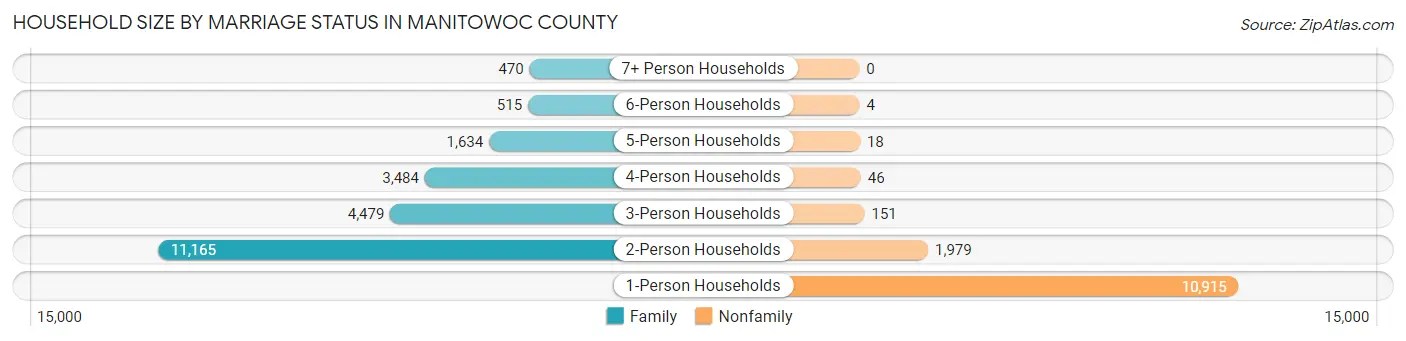
Household Size by Marriage Status in Manitowoc County
Out of a total of 34,860 households in Manitowoc County, 21,747 (62.4%) are family households, while 13,113 (37.6%) are nonfamily households. The most numerous type of family households are 2-person households, comprising 11,165, and the most common type of nonfamily households are 1-person households, comprising 10,915.
| Household Size | Family Households | Nonfamily Households |
| 1-Person Households | - | 10,915 (31.3%) |
| 2-Person Households | 11,165 (32.0%) | 1,979 (5.7%) |
| 3-Person Households | 4,479 (12.9%) | 151 (0.4%) |
| 4-Person Households | 3,484 (10.0%) | 46 (0.1%) |
| 5-Person Households | 1,634 (4.7%) | 18 (0.1%) |
| 6-Person Households | 515 (1.5%) | 4 (0.0%) |
| 7+ Person Households | 470 (1.3%) | 0 (0.0%) |
| Total | 21,747 (62.4%) | 13,113 (37.6%) |
Female Fertility in Manitowoc County
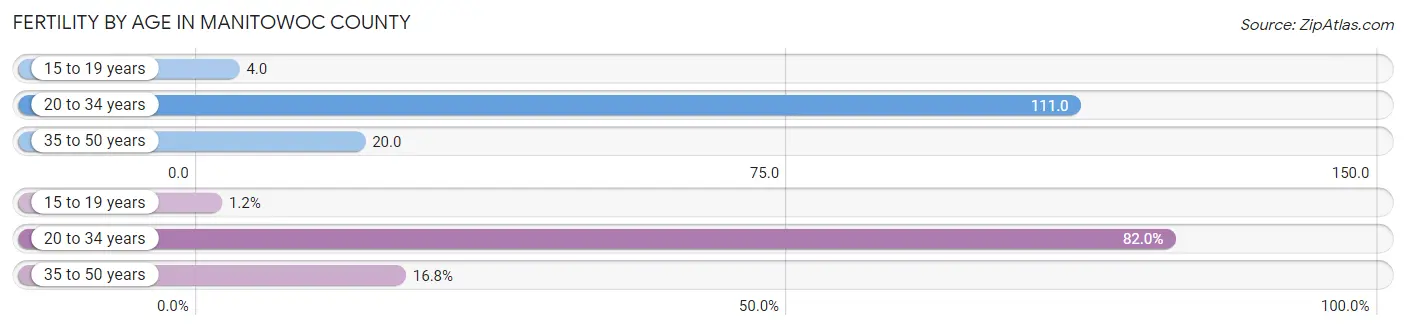
Fertility by Age in Manitowoc County
Average fertility rate in Manitowoc County is 54.0 births per 1,000 women. Women in the age bracket of 20 to 34 years have the highest fertility rate with 111.0 births per 1,000 women. Women in the age bracket of 20 to 34 years acount for 82.0% of all women with births.
| Age Bracket | Women with Births | Births / 1,000 Women |
| 15 to 19 years | 10 (1.2%) | 4.0 |
| 20 to 34 years | 694 (82.0%) | 111.0 |
| 35 to 50 years | 142 (16.8%) | 20.0 |
| Total | 846 (100.0%) | 54.0 |
Fertility by Age by Marriage Status in Manitowoc County
73.4% of women with births (846) in Manitowoc County are married. The highest percentage of unmarried women with births falls into 15 to 19 years age bracket with 100.0% of them unmarried at the time of birth, while the lowest percentage of unmarried women with births belong to 35 to 50 years age bracket with 7.8% of them unmarried.
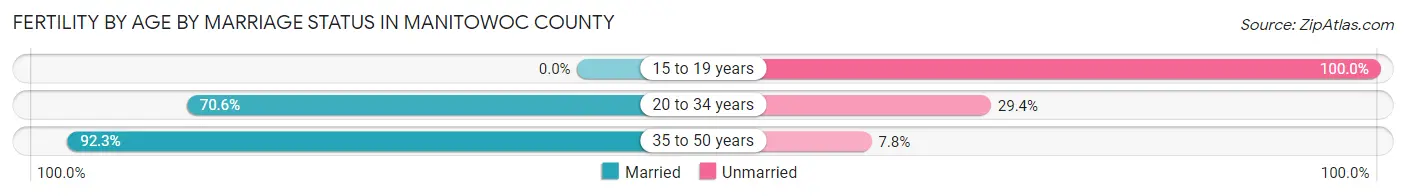
| Age Bracket | Married | Unmarried |
| 15 to 19 years | 0 (0.0%) | 10 (100.0%) |
| 20 to 34 years | 490 (70.6%) | 204 (29.4%) |
| 35 to 50 years | 131 (92.2%) | 11 (7.7%) |
| Total | 621 (73.4%) | 225 (26.6%) |
Fertility by Education in Manitowoc County
Average fertility rate in Manitowoc County is 54.0 births per 1,000 women. Women with the education attainment of graduate degree have the highest fertility rate of 79.0 births per 1,000 women, while women with the education attainment of less than high school have the lowest fertility at 25.0 births per 1,000 women. Women with the education attainment of college or associate's degree represent 34.0% of all women with births.
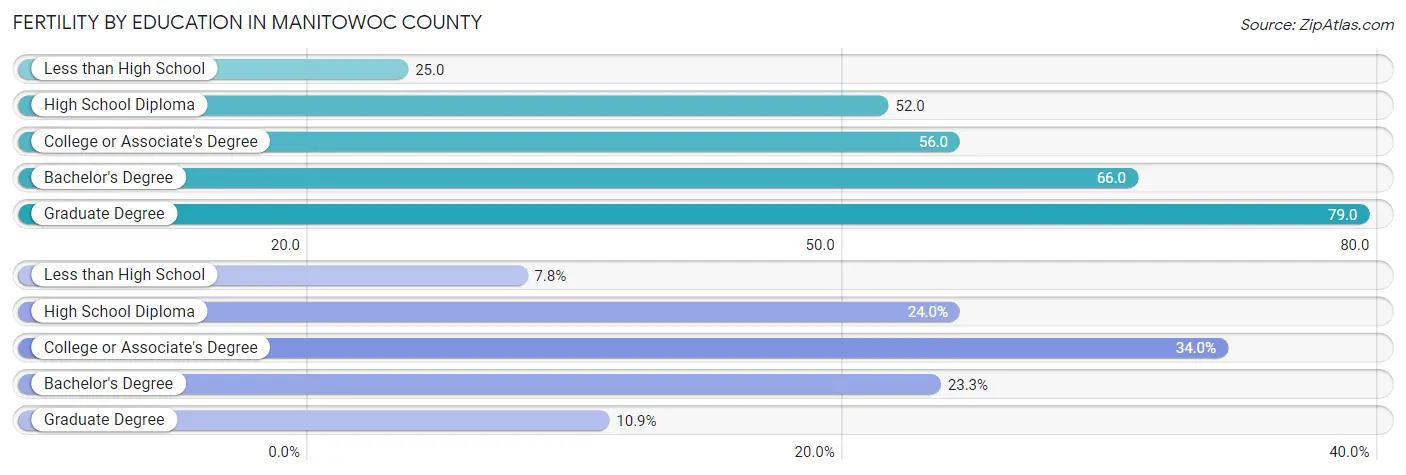
| Educational Attainment | Women with Births | Births / 1,000 Women |
| Less than High School | 66 (7.8%) | 25.0 |
| High School Diploma | 203 (24.0%) | 52.0 |
| College or Associate's Degree | 288 (34.0%) | 56.0 |
| Bachelor's Degree | 197 (23.3%) | 66.0 |
| Graduate Degree | 92 (10.9%) | 79.0 |
| Total | 846 (100.0%) | 54.0 |
Fertility by Education by Marriage Status in Manitowoc County
26.6% of women with births in Manitowoc County are unmarried. Women with the educational attainment of college or associate's degree are most likely to be married with 86.1% of them married at childbirth, while women with the educational attainment of less than high school are least likely to be married with 53.0% of them unmarried at childbirth.
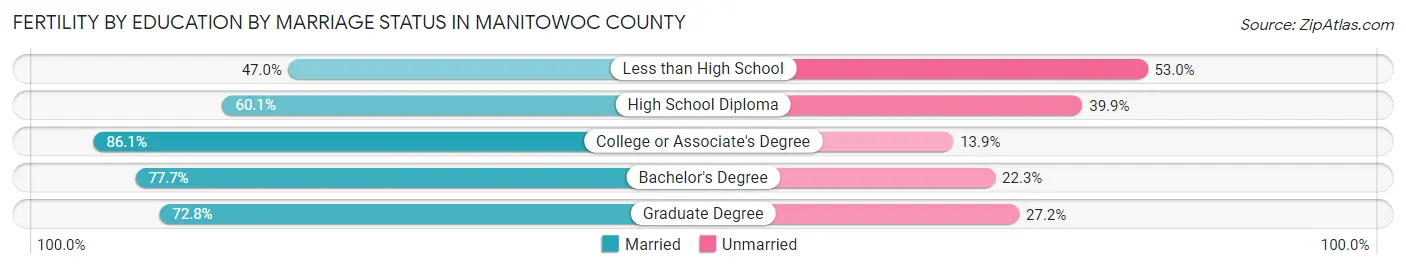
| Educational Attainment | Married | Unmarried |
| Less than High School | 31 (47.0%) | 35 (53.0%) |
| High School Diploma | 122 (60.1%) | 81 (39.9%) |
| College or Associate's Degree | 248 (86.1%) | 40 (13.9%) |
| Bachelor's Degree | 153 (77.7%) | 44 (22.3%) |
| Graduate Degree | 67 (72.8%) | 25 (27.2%) |
| Total | 621 (73.4%) | 225 (26.6%) |
Income in Manitowoc County
Income Overview in Manitowoc County
Per Capita Income in Manitowoc County is $35,854, while median incomes of families and households are $83,400 and $66,412 respectively.
| Characteristic | Number | Measure |
| Per Capita Income | 81,242 | $35,854 |
| Median Family Income | 21,747 | $83,400 |
| Mean Family Income | 21,747 | $98,944 |
| Median Household Income | 34,860 | $66,412 |
| Mean Household Income | 34,860 | $82,650 |
| Income Deficit | 21,747 | $10,130 |
| Wage / Income Gap (%) | 81,242 | 34.43% |
| Wage / Income Gap ($) | 81,242 | 65.57¢ per $1 |
| Gini / Inequality Index | 81,242 | 0.41 |
Earnings by Sex in Manitowoc County
Average Earnings in Manitowoc County are $41,131, $50,004 for men and $32,790 for women, a difference of 34.4%.
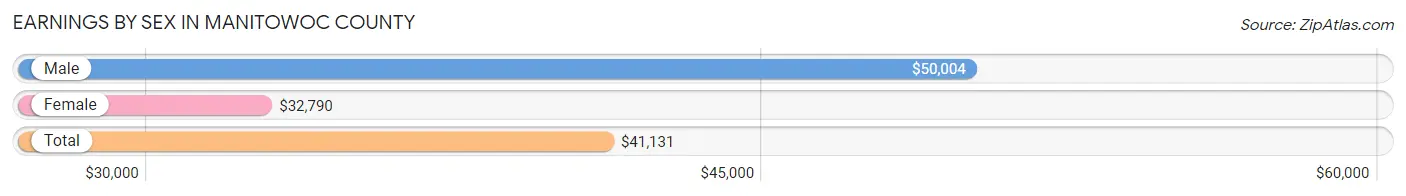
| Sex | Number | Average Earnings |
| Male | 23,968 (54.1%) | $50,004 |
| Female | 20,308 (45.9%) | $32,790 |
| Total | 44,276 (100.0%) | $41,131 |
Earnings by Sex by Income Bracket in Manitowoc County
The most common earnings brackets in Manitowoc County are $55,000 to $64,999 for men (3,034 | 12.7%) and $55,000 to $64,999 for women (1,474 | 7.3%).
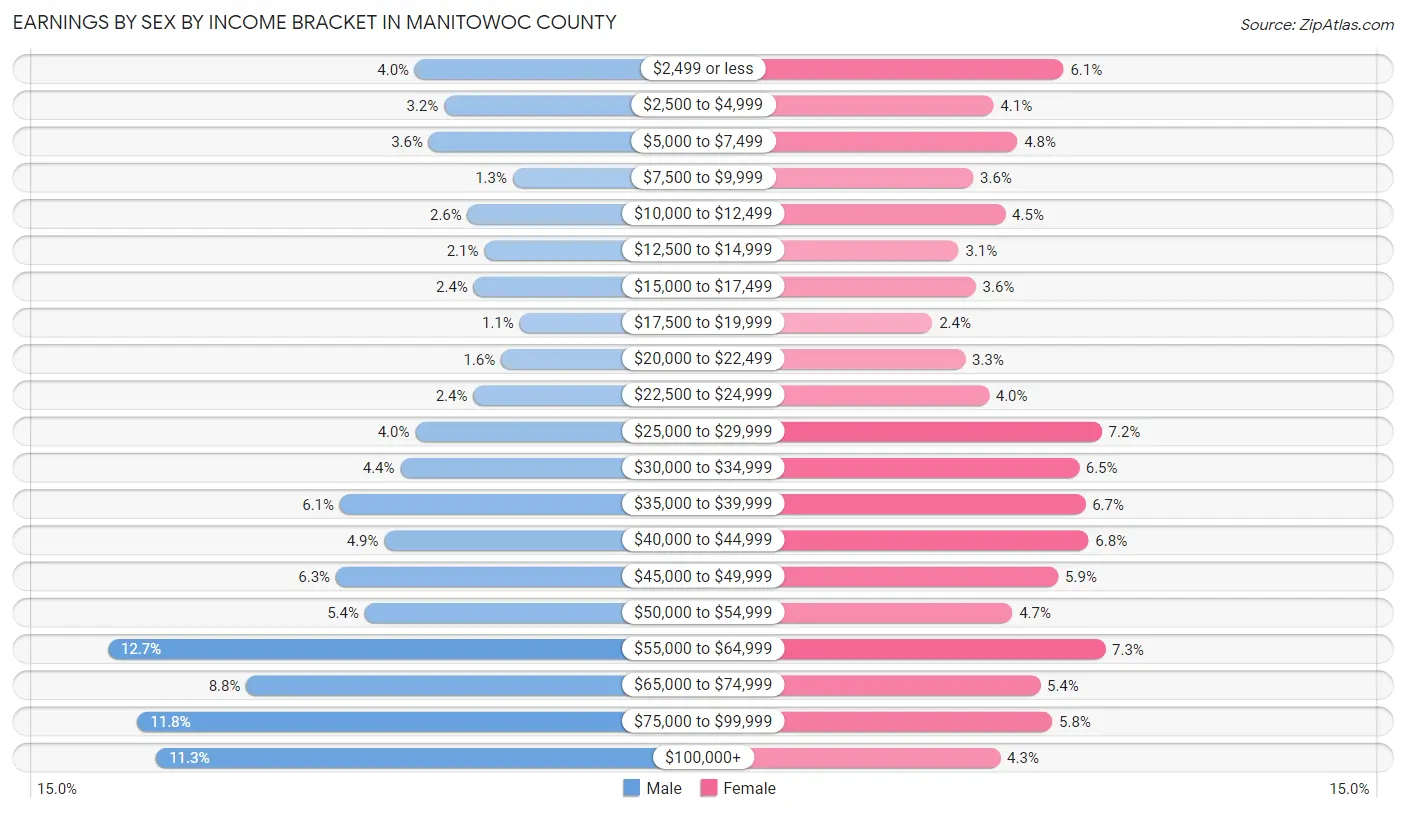
| Income | Male | Female |
| $2,499 or less | 965 (4.0%) | 1,236 (6.1%) |
| $2,500 to $4,999 | 770 (3.2%) | 837 (4.1%) |
| $5,000 to $7,499 | 873 (3.6%) | 972 (4.8%) |
| $7,500 to $9,999 | 307 (1.3%) | 721 (3.5%) |
| $10,000 to $12,499 | 612 (2.5%) | 904 (4.4%) |
| $12,500 to $14,999 | 498 (2.1%) | 638 (3.1%) |
| $15,000 to $17,499 | 570 (2.4%) | 736 (3.6%) |
| $17,500 to $19,999 | 261 (1.1%) | 488 (2.4%) |
| $20,000 to $22,499 | 385 (1.6%) | 674 (3.3%) |
| $22,500 to $24,999 | 573 (2.4%) | 810 (4.0%) |
| $25,000 to $29,999 | 963 (4.0%) | 1,454 (7.2%) |
| $30,000 to $34,999 | 1,063 (4.4%) | 1,324 (6.5%) |
| $35,000 to $39,999 | 1,472 (6.1%) | 1,361 (6.7%) |
| $40,000 to $44,999 | 1,172 (4.9%) | 1,378 (6.8%) |
| $45,000 to $49,999 | 1,499 (6.2%) | 1,207 (5.9%) |
| $50,000 to $54,999 | 1,305 (5.4%) | 945 (4.6%) |
| $55,000 to $64,999 | 3,034 (12.7%) | 1,474 (7.3%) |
| $65,000 to $74,999 | 2,103 (8.8%) | 1,103 (5.4%) |
| $75,000 to $99,999 | 2,835 (11.8%) | 1,171 (5.8%) |
| $100,000+ | 2,708 (11.3%) | 875 (4.3%) |
| Total | 23,968 (100.0%) | 20,308 (100.0%) |
Earnings by Sex by Educational Attainment in Manitowoc County
Average earnings in Manitowoc County are $55,593 for men and $36,977 for women, a difference of 33.5%. Men with an educational attainment of graduate degree enjoy the highest average annual earnings of $82,188, while those with less than high school education earn the least with $39,499. Women with an educational attainment of graduate degree earn the most with the average annual earnings of $66,577, while those with less than high school education have the smallest earnings of $27,544.
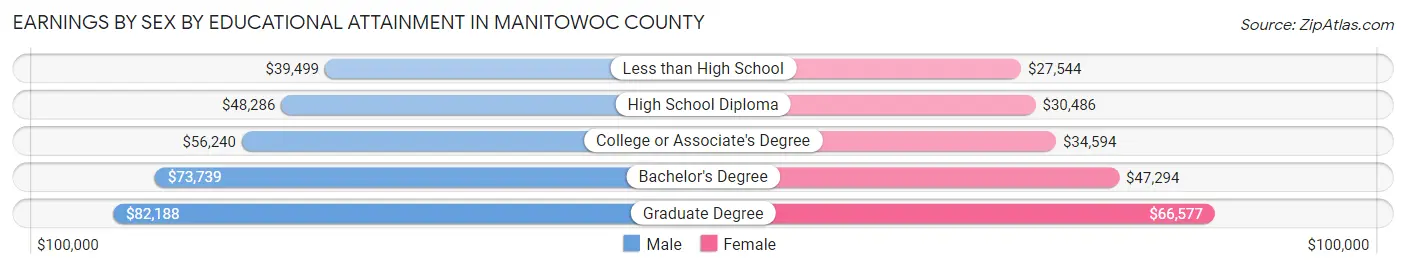
| Educational Attainment | Male Income | Female Income |
| Less than High School | $39,499 | $27,544 |
| High School Diploma | $48,286 | $30,486 |
| College or Associate's Degree | $56,240 | $34,594 |
| Bachelor's Degree | $73,739 | $47,294 |
| Graduate Degree | $82,188 | $66,577 |
| Total | $55,593 | $36,977 |
Family Income in Manitowoc County
Family Income Brackets in Manitowoc County
According to the Manitowoc County family income data, there are 4,850 families falling into the $100,000 to $149,999 income range, which is the most common income bracket and makes up 22.3% of all families. Conversely, the less than $10,000 income bracket is the least frequent group with only 435 families (2.0%) belonging to this category.
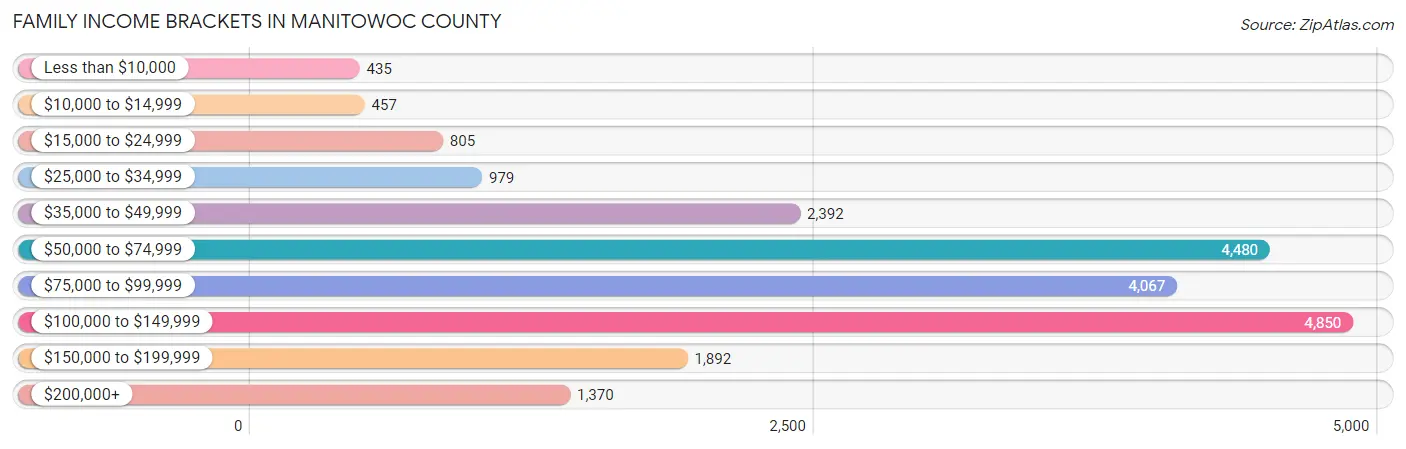
| Income Bracket | # Families | % Families |
| Less than $10,000 | 435 | 2.0% |
| $10,000 to $14,999 | 457 | 2.1% |
| $15,000 to $24,999 | 805 | 3.7% |
| $25,000 to $34,999 | 979 | 4.5% |
| $35,000 to $49,999 | 2,392 | 11.0% |
| $50,000 to $74,999 | 4,480 | 20.6% |
| $75,000 to $99,999 | 4,067 | 18.7% |
| $100,000 to $149,999 | 4,850 | 22.3% |
| $150,000 to $199,999 | 1,892 | 8.7% |
| $200,000+ | 1,370 | 6.3% |
Family Income by Famaliy Size in Manitowoc County
4-person families (3,389 | 15.6%) account for the highest median family income in Manitowoc County with $104,981 per family, while 2-person families (11,756 | 54.1%) have the highest median income of $37,404 per family member.
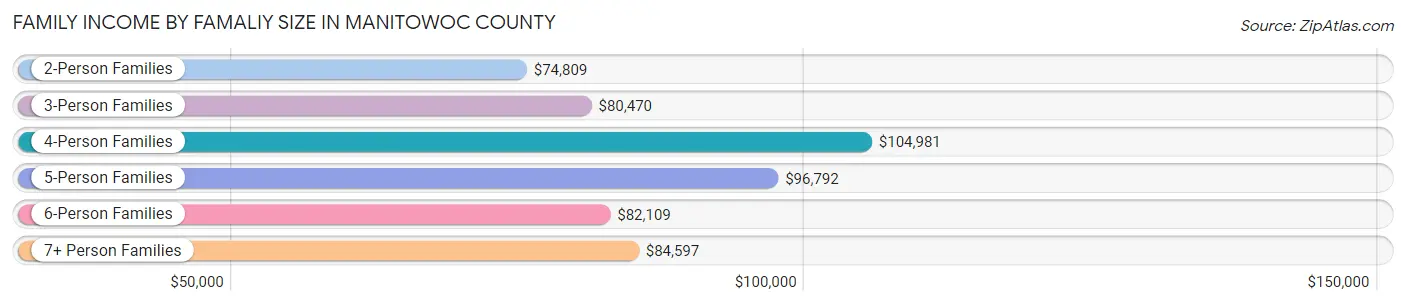
| Income Bracket | # Families | Median Income |
| 2-Person Families | 11,756 (54.1%) | $74,809 |
| 3-Person Families | 4,498 (20.7%) | $80,470 |
| 4-Person Families | 3,389 (15.6%) | $104,981 |
| 5-Person Families | 1,315 (6.0%) | $96,792 |
| 6-Person Families | 457 (2.1%) | $82,109 |
| 7+ Person Families | 332 (1.5%) | $84,597 |
| Total | 21,747 (100.0%) | $83,400 |
Family Income by Number of Earners in Manitowoc County
The median family income in Manitowoc County is $83,400, with families comprising 3+ earners (2,762) having the highest median family income of $128,413, while families with no earners (4,440) have the lowest median family income of $53,340, accounting for 12.7% and 20.4% of families, respectively.
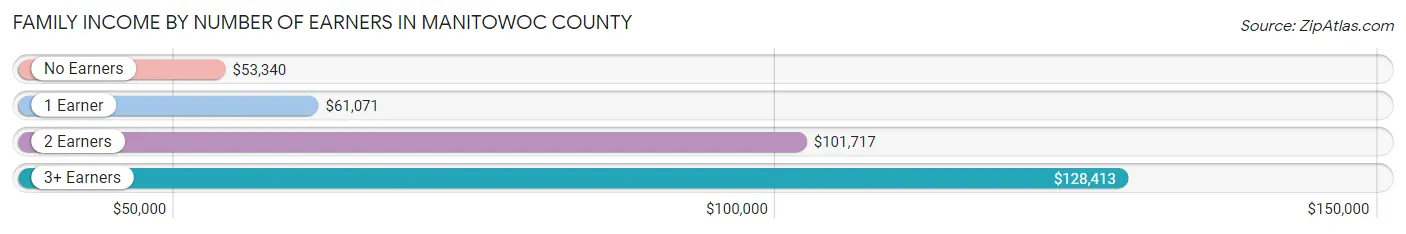
| Number of Earners | # Families | Median Income |
| No Earners | 4,440 (20.4%) | $53,340 |
| 1 Earner | 5,444 (25.0%) | $61,071 |
| 2 Earners | 9,101 (41.8%) | $101,717 |
| 3+ Earners | 2,762 (12.7%) | $128,413 |
| Total | 21,747 (100.0%) | $83,400 |
Household Income in Manitowoc County
Household Income Brackets in Manitowoc County
With 7,181 households falling in the category, the $50,000 to $74,999 income range is the most frequent in Manitowoc County, accounting for 20.6% of all households. In contrast, only 1,185 households (3.4%) fall into the less than $10,000 income bracket, making it the least populous group.
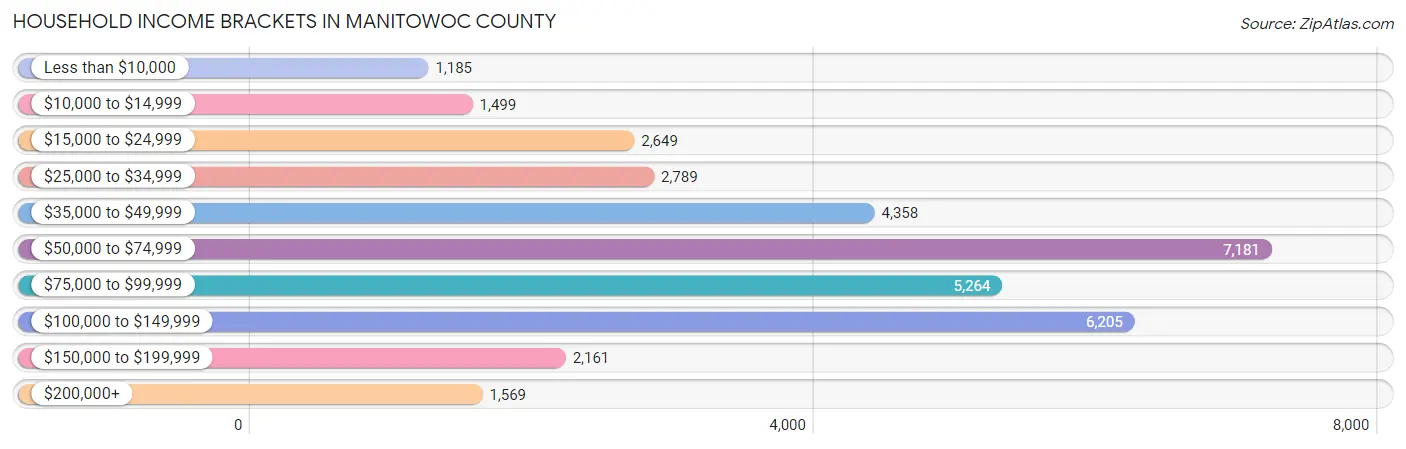
| Income Bracket | # Households | % Households |
| Less than $10,000 | 1,185 | 3.4% |
| $10,000 to $14,999 | 1,499 | 4.3% |
| $15,000 to $24,999 | 2,649 | 7.6% |
| $25,000 to $34,999 | 2,789 | 8.0% |
| $35,000 to $49,999 | 4,358 | 12.5% |
| $50,000 to $74,999 | 7,181 | 20.6% |
| $75,000 to $99,999 | 5,264 | 15.1% |
| $100,000 to $149,999 | 6,205 | 17.8% |
| $150,000 to $199,999 | 2,161 | 6.2% |
| $200,000+ | 1,569 | 4.5% |
Household Income by Householder Age in Manitowoc County
The median household income in Manitowoc County is $66,412, with the highest median household income of $81,467 found in the 45 to 64 years age bracket for the primary householder. A total of 13,979 households (40.1%) fall into this category. Meanwhile, the 65+ years age bracket for the primary householder has the lowest median household income of $48,130, with 10,585 households (30.4%) in this group.
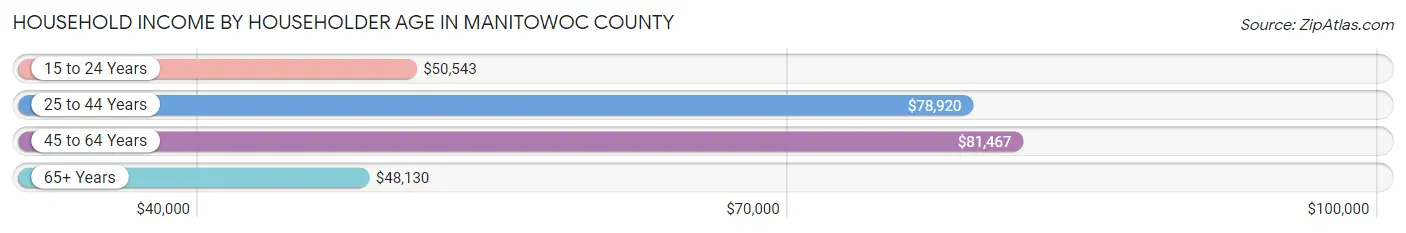
| Income Bracket | # Households | Median Income |
| 15 to 24 Years | 894 (2.6%) | $50,543 |
| 25 to 44 Years | 9,402 (27.0%) | $78,920 |
| 45 to 64 Years | 13,979 (40.1%) | $81,467 |
| 65+ Years | 10,585 (30.4%) | $48,130 |
| Total | 34,860 (100.0%) | $66,412 |
Poverty in Manitowoc County
Income Below Poverty by Sex and Age in Manitowoc County
With 7.5% poverty level for males and 12.5% for females among the residents of Manitowoc County, 15 year old males and 5 year old females are the most vulnerable to poverty, with 97 males (16.8%) and 94 females (21.6%) in their respective age groups living below the poverty level.
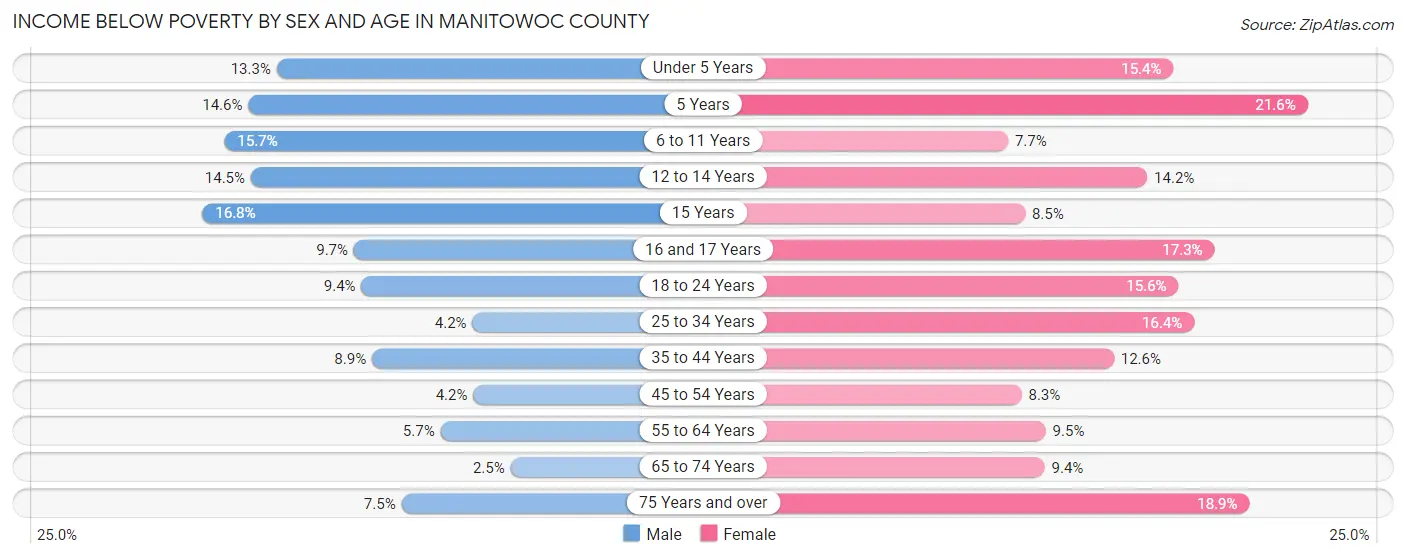
| Age Bracket | Male | Female |
| Under 5 Years | 277 (13.3%) | 292 (15.4%) |
| 5 Years | 68 (14.6%) | 94 (21.6%) |
| 6 to 11 Years | 460 (15.7%) | 192 (7.7%) |
| 12 to 14 Years | 187 (14.5%) | 205 (14.2%) |
| 15 Years | 97 (16.8%) | 46 (8.5%) |
| 16 and 17 Years | 108 (9.7%) | 177 (17.3%) |
| 18 to 24 Years | 291 (9.4%) | 442 (15.6%) |
| 25 to 34 Years | 182 (4.2%) | 677 (16.4%) |
| 35 to 44 Years | 437 (8.9%) | 573 (12.6%) |
| 45 to 54 Years | 216 (4.2%) | 407 (8.3%) |
| 55 to 64 Years | 382 (5.7%) | 620 (9.5%) |
| 65 to 74 Years | 120 (2.5%) | 470 (9.4%) |
| 75 Years and over | 214 (7.5%) | 770 (18.9%) |
| Total | 3,039 (7.5%) | 4,965 (12.5%) |
Income Above Poverty by Sex and Age in Manitowoc County
According to the poverty statistics in Manitowoc County, males aged 65 to 74 years and females aged 6 to 11 years are the age groups that are most secure financially, with 97.6% of males and 92.3% of females in these age groups living above the poverty line.
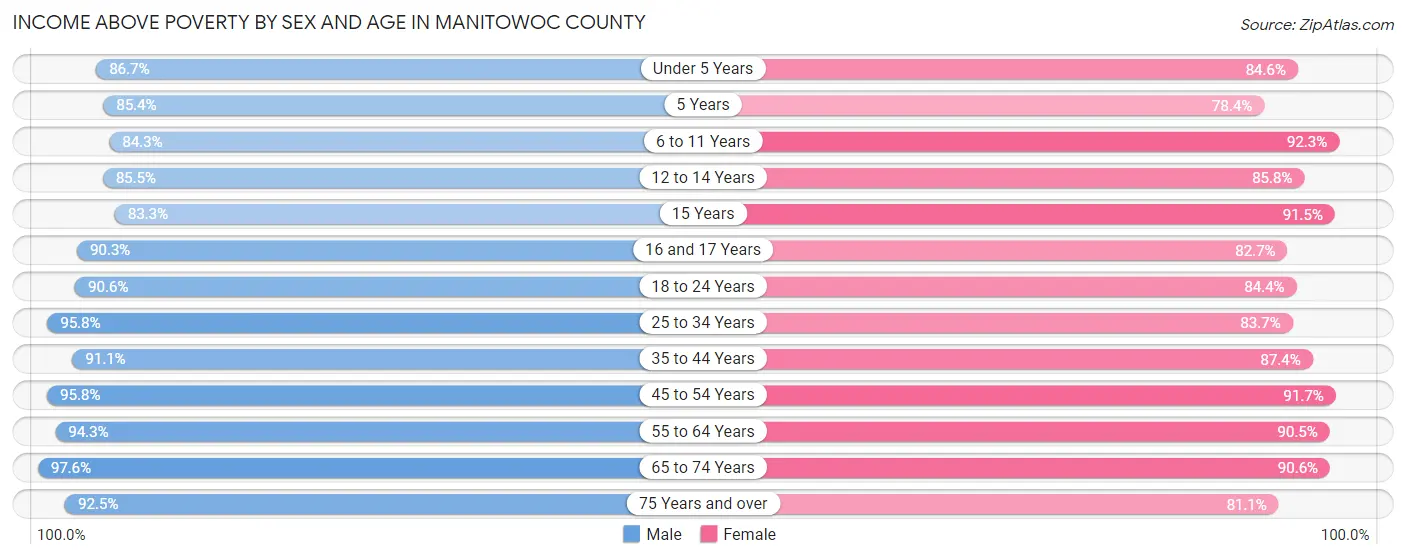
| Age Bracket | Male | Female |
| Under 5 Years | 1,805 (86.7%) | 1,607 (84.6%) |
| 5 Years | 397 (85.4%) | 341 (78.4%) |
| 6 to 11 Years | 2,464 (84.3%) | 2,299 (92.3%) |
| 12 to 14 Years | 1,103 (85.5%) | 1,242 (85.8%) |
| 15 Years | 482 (83.3%) | 495 (91.5%) |
| 16 and 17 Years | 1,003 (90.3%) | 847 (82.7%) |
| 18 to 24 Years | 2,815 (90.6%) | 2,388 (84.4%) |
| 25 to 34 Years | 4,135 (95.8%) | 3,463 (83.7%) |
| 35 to 44 Years | 4,486 (91.1%) | 3,968 (87.4%) |
| 45 to 54 Years | 4,951 (95.8%) | 4,475 (91.7%) |
| 55 to 64 Years | 6,316 (94.3%) | 5,934 (90.5%) |
| 65 to 74 Years | 4,776 (97.6%) | 4,524 (90.6%) |
| 75 Years and over | 2,637 (92.5%) | 3,302 (81.1%) |
| Total | 37,370 (92.5%) | 34,885 (87.5%) |
Income Below Poverty Among Married-Couple Families in Manitowoc County
The poverty statistics for married-couple families in Manitowoc County show that 2.4% or 414 of the total 17,082 families live below the poverty line. Families with 1 or 2 children have the highest poverty rate of 3.8%, comprising of 162 families. On the other hand, families with 3 or 4 children have the lowest poverty rate of 1.4%, which includes 18 families.
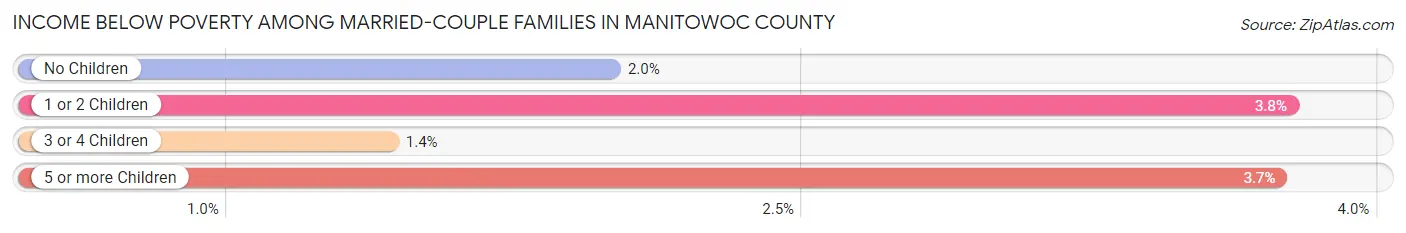
| Children | Above Poverty | Below Poverty |
| No Children | 11,075 (98.0%) | 226 (2.0%) |
| 1 or 2 Children | 4,134 (96.2%) | 162 (3.8%) |
| 3 or 4 Children | 1,253 (98.6%) | 18 (1.4%) |
| 5 or more Children | 206 (96.3%) | 8 (3.7%) |
| Total | 16,668 (97.6%) | 414 (2.4%) |
Income Below Poverty Among Single-Parent Households in Manitowoc County
According to the poverty data in Manitowoc County, 9.6% or 157 single-father households and 29.9% or 909 single-mother households are living below the poverty line. Among single-father households, those with 1 or 2 children have the highest poverty rate, with 140 households (18.8%) experiencing poverty. Likewise, among single-mother households, those with 5 or more children have the highest poverty rate, with 2 households (100.0%) falling below the poverty line.
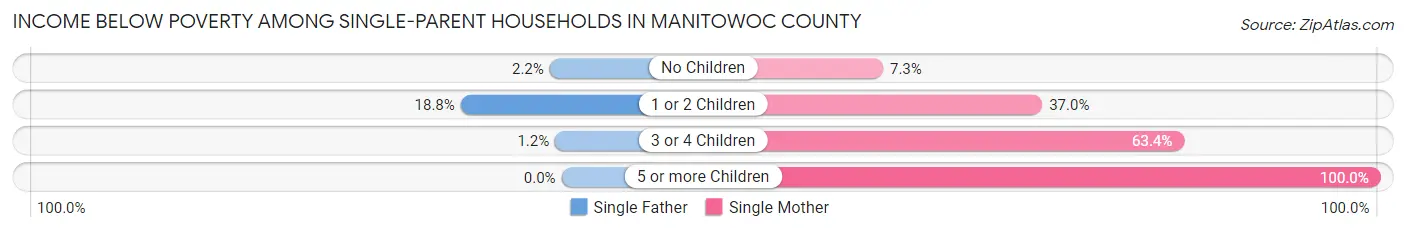
| Children | Single Father | Single Mother |
| No Children | 14 (2.2%) | 74 (7.3%) |
| 1 or 2 Children | 140 (18.8%) | 632 (37.0%) |
| 3 or 4 Children | 3 (1.2%) | 201 (63.4%) |
| 5 or more Children | 0 (0.0%) | 2 (100.0%) |
| Total | 157 (9.6%) | 909 (29.9%) |
Income Below Poverty Among Married-Couple vs Single-Parent Households in Manitowoc County
The poverty data for Manitowoc County shows that 414 of the married-couple family households (2.4%) and 1,066 of the single-parent households (22.9%) are living below the poverty level. Within the married-couple family households, those with 1 or 2 children have the highest poverty rate, with 162 households (3.8%) falling below the poverty line. Among the single-parent households, those with 5 or more children have the highest poverty rate, with 2 household (100.0%) living below poverty.
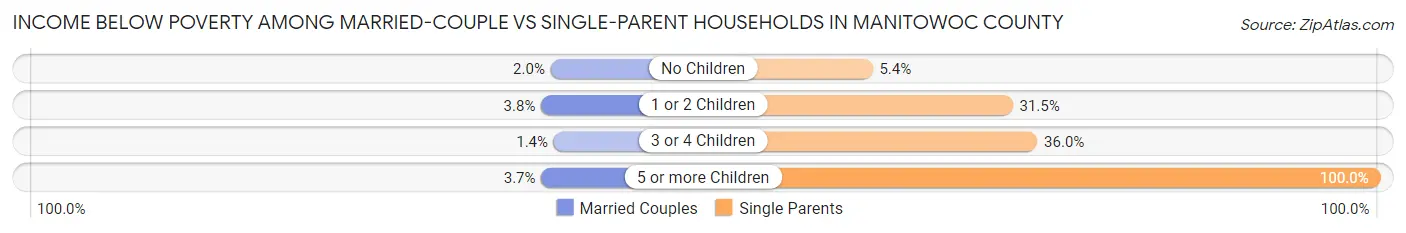
| Children | Married-Couple Families | Single-Parent Households |
| No Children | 226 (2.0%) | 88 (5.4%) |
| 1 or 2 Children | 162 (3.8%) | 772 (31.5%) |
| 3 or 4 Children | 18 (1.4%) | 204 (36.0%) |
| 5 or more Children | 8 (3.7%) | 2 (100.0%) |
| Total | 414 (2.4%) | 1,066 (22.9%) |
Employment Characteristics in Manitowoc County
Employment by Class of Employer in Manitowoc County
Among the 40,326 employed individuals in Manitowoc County, private company employees (29,632 | 73.5%), not-for-profit organizations (3,703 | 9.2%), and local government employees (2,689 | 6.7%) make up the most common classes of employment.
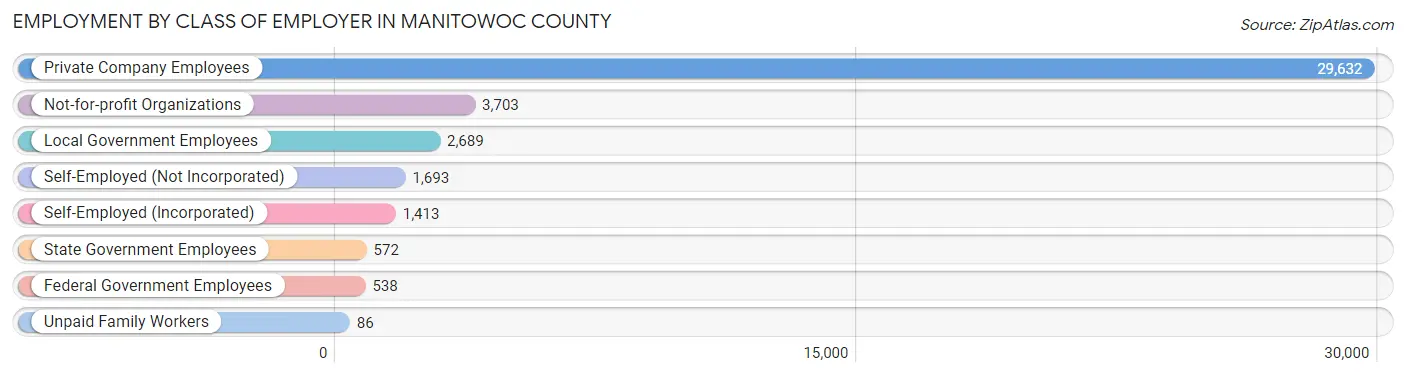
| Employer Class | # Employees | % Employees |
| Private Company Employees | 29,632 | 73.5% |
| Self-Employed (Incorporated) | 1,413 | 3.5% |
| Self-Employed (Not Incorporated) | 1,693 | 4.2% |
| Not-for-profit Organizations | 3,703 | 9.2% |
| Local Government Employees | 2,689 | 6.7% |
| State Government Employees | 572 | 1.4% |
| Federal Government Employees | 538 | 1.3% |
| Unpaid Family Workers | 86 | 0.2% |
| Total | 40,326 | 100.0% |
Employment Status by Age in Manitowoc County
According to the labor force statistics for Manitowoc County, out of the total population over 16 years of age (66,744), 62.3% or 41,582 individuals are in the labor force, with 2.0% or 832 of them unemployed. The age group with the highest labor force participation rate is 30 to 34 years, with 90.1% or 3,764 individuals in the labor force. Within the labor force, the 16 to 19 years age range has the highest percentage of unemployed individuals, with 6.6% or 140 of them being unemployed.
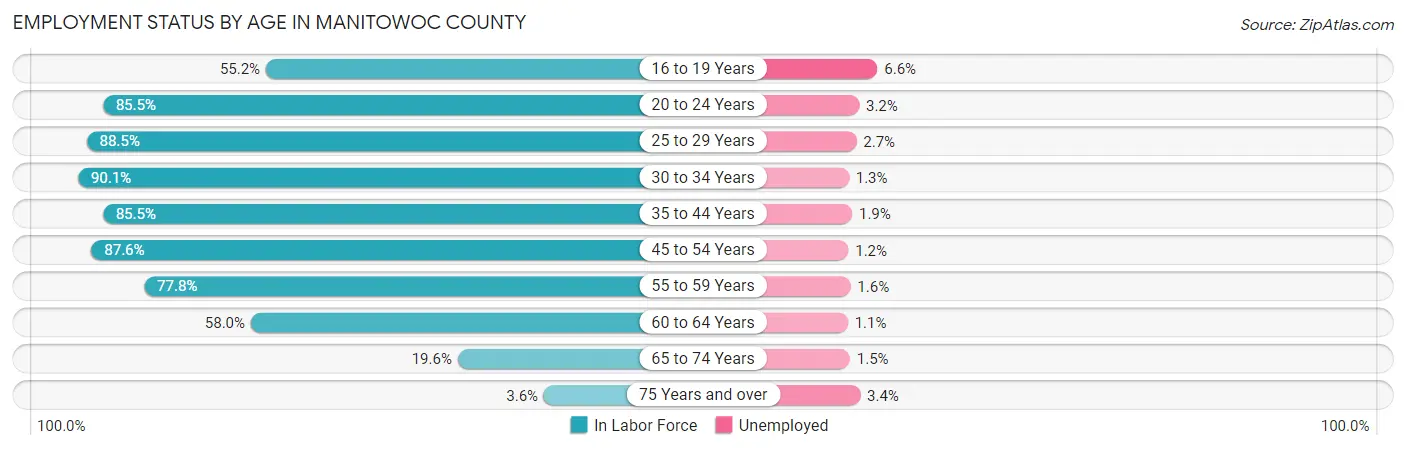
| Age Bracket | In Labor Force | Unemployed |
| 16 to 19 Years | 2,125 (55.2%) | 140 (6.6%) |
| 20 to 24 Years | 3,681 (85.5%) | 118 (3.2%) |
| 25 to 29 Years | 3,826 (88.5%) | 103 (2.7%) |
| 30 to 34 Years | 3,764 (90.1%) | 49 (1.3%) |
| 35 to 44 Years | 8,098 (85.5%) | 154 (1.9%) |
| 45 to 54 Years | 8,827 (87.6%) | 106 (1.2%) |
| 55 to 59 Years | 5,222 (77.8%) | 84 (1.6%) |
| 60 to 64 Years | 3,811 (58.0%) | 42 (1.1%) |
| 65 to 74 Years | 1,959 (19.6%) | 29 (1.5%) |
| 75 Years and over | 262 (3.6%) | 9 (3.4%) |
| Total | 41,582 (62.3%) | 832 (2.0%) |
Employment Status by Educational Attainment in Manitowoc County
According to labor force statistics for Manitowoc County, 81.2% of individuals (33,561) out of the total population between 25 and 64 years of age (41,331) are in the labor force, with 1.6% or 537 of them being unemployed. The group with the highest labor force participation rate are those with the educational attainment of bachelor's degree or higher, with 89.0% or 8,928 individuals in the labor force. Within the labor force, individuals with less than high school education have the highest percentage of unemployment, with 4.1% or 74 of them being unemployed.
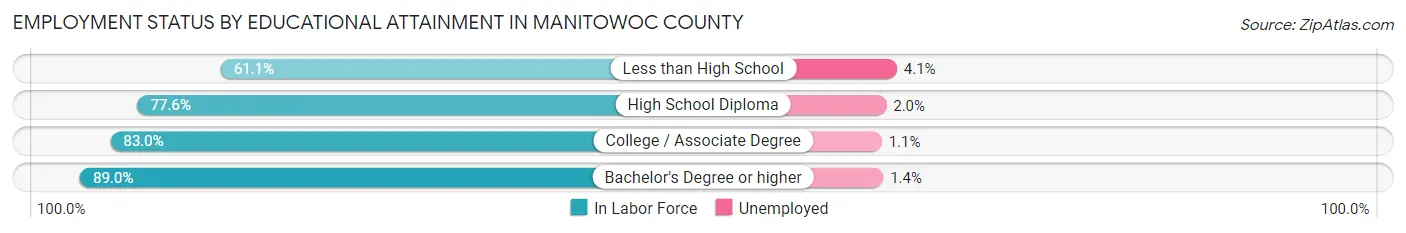
| Educational Attainment | In Labor Force | Unemployed |
| Less than High School | 1,794 (61.1%) | 120 (4.1%) |
| High School Diploma | 10,457 (77.6%) | 270 (2.0%) |
| College / Associate Degree | 12,357 (83.0%) | 164 (1.1%) |
| Bachelor's Degree or higher | 8,928 (89.0%) | 140 (1.4%) |
| Total | 33,561 (81.2%) | 661 (1.6%) |
Employment Occupations by Sex in Manitowoc County
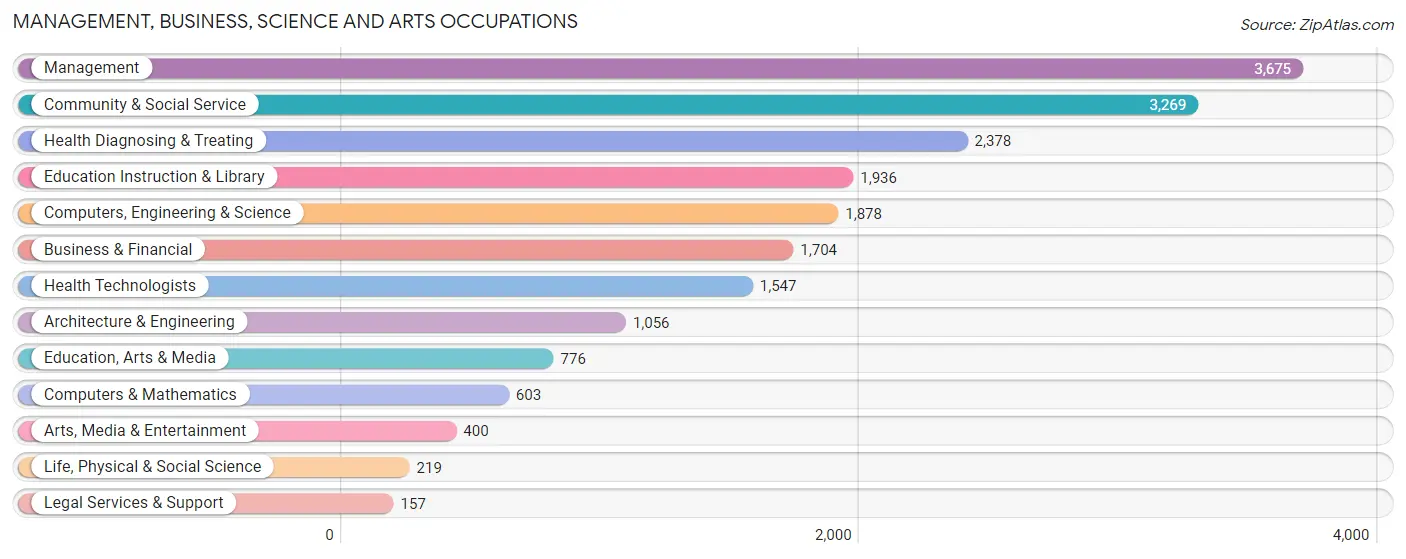
Management, Business, Science and Arts Occupations
The most common Management, Business, Science and Arts occupations in Manitowoc County are Management (3,675 | 9.0%), Community & Social Service (3,269 | 8.0%), Health Diagnosing & Treating (2,378 | 5.9%), Education Instruction & Library (1,936 | 4.8%), and Computers, Engineering & Science (1,878 | 4.6%).
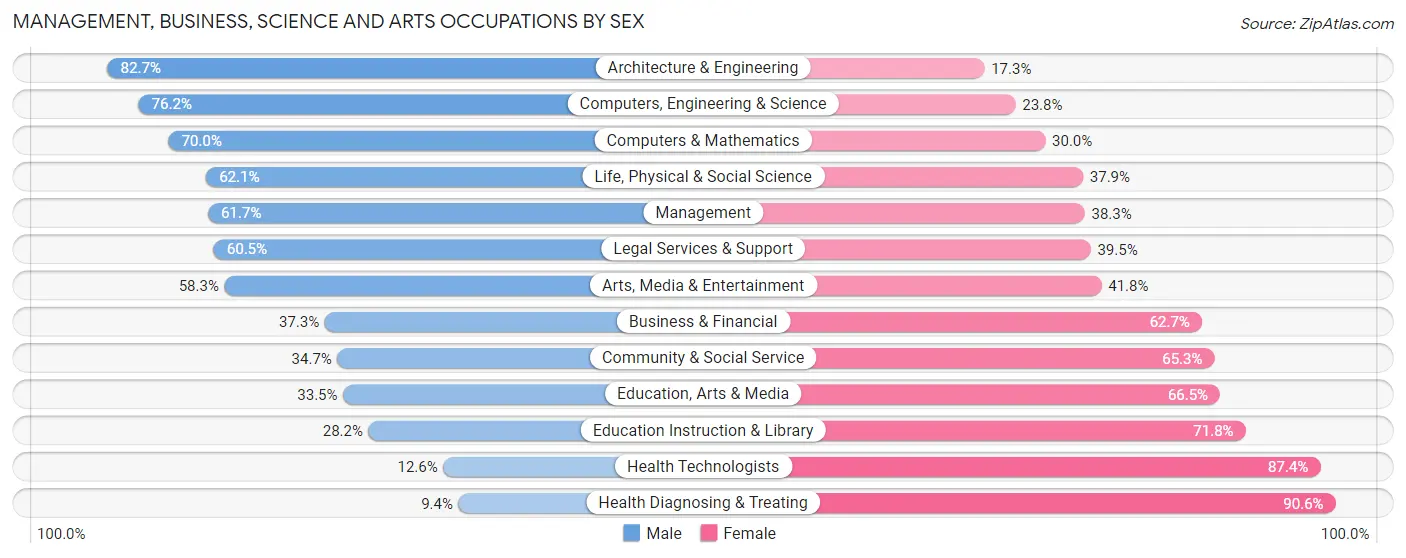
Management, Business, Science and Arts Occupations by Sex
Within the Management, Business, Science and Arts occupations in Manitowoc County, the most male-oriented occupations are Architecture & Engineering (82.7%), Computers, Engineering & Science (76.2%), and Computers & Mathematics (70.0%), while the most female-oriented occupations are Health Diagnosing & Treating (90.6%), Health Technologists (87.4%), and Education Instruction & Library (71.8%).
| Occupation | Male | Female |
| Management | 2,269 (61.7%) | 1,406 (38.3%) |
| Business & Financial | 636 (37.3%) | 1,068 (62.7%) |
| Computers, Engineering & Science | 1,431 (76.2%) | 447 (23.8%) |
| Computers & Mathematics | 422 (70.0%) | 181 (30.0%) |
| Architecture & Engineering | 873 (82.7%) | 183 (17.3%) |
| Life, Physical & Social Science | 136 (62.1%) | 83 (37.9%) |
| Community & Social Service | 1,134 (34.7%) | 2,135 (65.3%) |
| Education, Arts & Media | 260 (33.5%) | 516 (66.5%) |
| Legal Services & Support | 95 (60.5%) | 62 (39.5%) |
| Education Instruction & Library | 546 (28.2%) | 1,390 (71.8%) |
| Arts, Media & Entertainment | 233 (58.3%) | 167 (41.7%) |
| Health Diagnosing & Treating | 224 (9.4%) | 2,154 (90.6%) |
| Health Technologists | 195 (12.6%) | 1,352 (87.4%) |
| Total (Category) | 5,694 (44.1%) | 7,210 (55.9%) |
| Total (Overall) | 21,956 (54.0%) | 18,726 (46.0%) |
Services Occupations
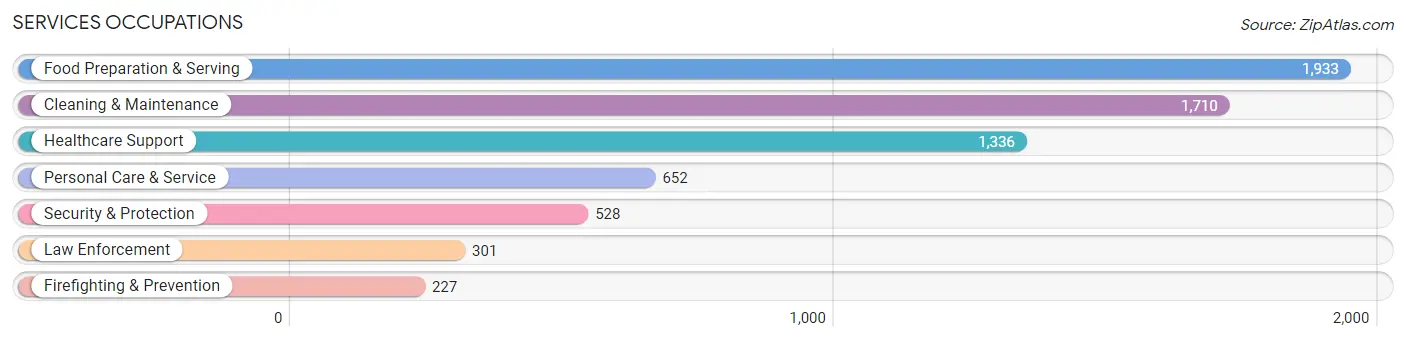
The most common Services occupations in Manitowoc County are Food Preparation & Serving (1,933 | 4.8%), Cleaning & Maintenance (1,710 | 4.2%), Healthcare Support (1,336 | 3.3%), Personal Care & Service (652 | 1.6%), and Security & Protection (528 | 1.3%).
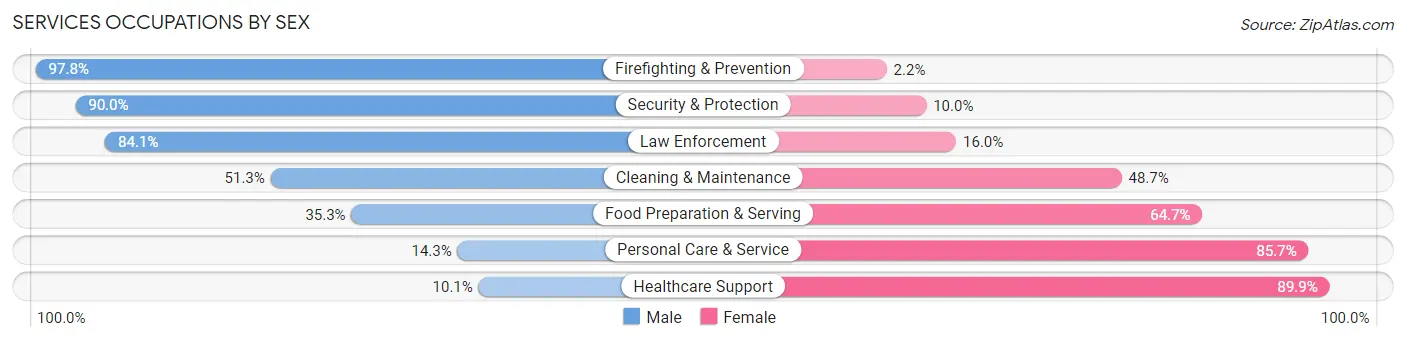
Services Occupations by Sex
Within the Services occupations in Manitowoc County, the most male-oriented occupations are Firefighting & Prevention (97.8%), Security & Protection (90.0%), and Law Enforcement (84.1%), while the most female-oriented occupations are Healthcare Support (89.9%), Personal Care & Service (85.7%), and Food Preparation & Serving (64.7%).
| Occupation | Male | Female |
| Healthcare Support | 135 (10.1%) | 1,201 (89.9%) |
| Security & Protection | 475 (90.0%) | 53 (10.0%) |
| Firefighting & Prevention | 222 (97.8%) | 5 (2.2%) |
| Law Enforcement | 253 (84.1%) | 48 (16.0%) |
| Food Preparation & Serving | 682 (35.3%) | 1,251 (64.7%) |
| Cleaning & Maintenance | 877 (51.3%) | 833 (48.7%) |
| Personal Care & Service | 93 (14.3%) | 559 (85.7%) |
| Total (Category) | 2,262 (36.7%) | 3,897 (63.3%) |
| Total (Overall) | 21,956 (54.0%) | 18,726 (46.0%) |
Sales and Office Occupations
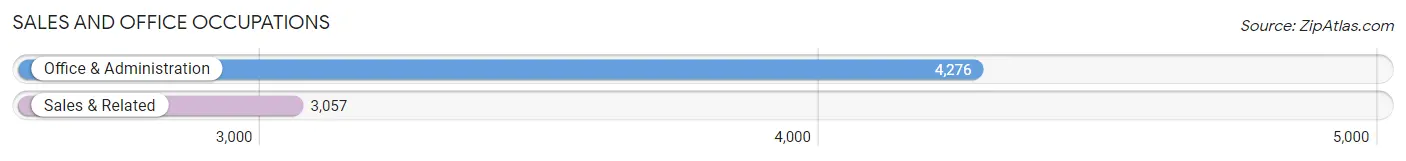
The most common Sales and Office occupations in Manitowoc County are Office & Administration (4,276 | 10.5%), and Sales & Related (3,057 | 7.5%).
Sales and Office Occupations by Sex

| Occupation | Male | Female |
| Sales & Related | 1,631 (53.3%) | 1,426 (46.7%) |
| Office & Administration | 854 (20.0%) | 3,422 (80.0%) |
| Total (Category) | 2,485 (33.9%) | 4,848 (66.1%) |
| Total (Overall) | 21,956 (54.0%) | 18,726 (46.0%) |
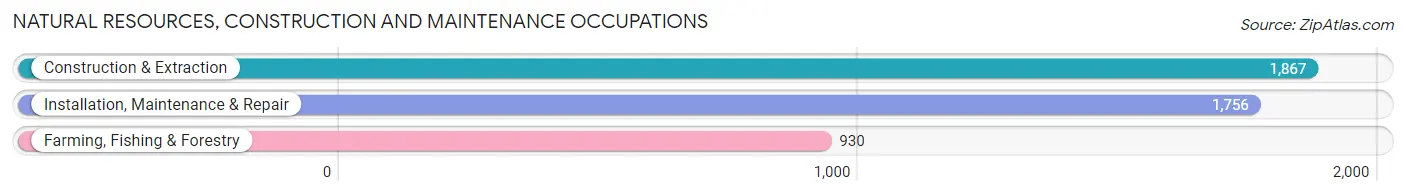
Natural Resources, Construction and Maintenance Occupations
The most common Natural Resources, Construction and Maintenance occupations in Manitowoc County are Construction & Extraction (1,867 | 4.6%), Installation, Maintenance & Repair (1,756 | 4.3%), and Farming, Fishing & Forestry (930 | 2.3%).
Natural Resources, Construction and Maintenance Occupations by Sex
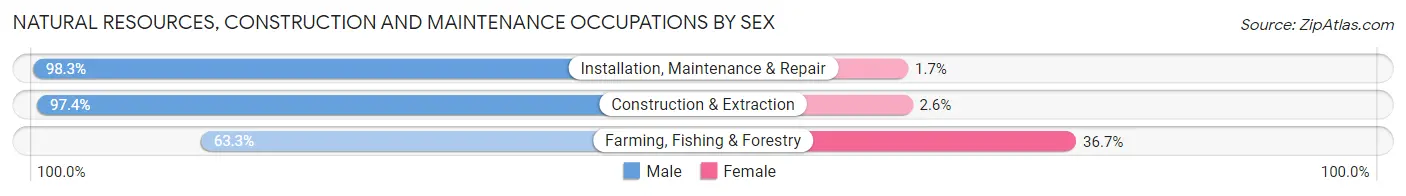
| Occupation | Male | Female |
| Farming, Fishing & Forestry | 589 (63.3%) | 341 (36.7%) |
| Construction & Extraction | 1,818 (97.4%) | 49 (2.6%) |
| Installation, Maintenance & Repair | 1,726 (98.3%) | 30 (1.7%) |
| Total (Category) | 4,133 (90.8%) | 420 (9.2%) |
| Total (Overall) | 21,956 (54.0%) | 18,726 (46.0%) |
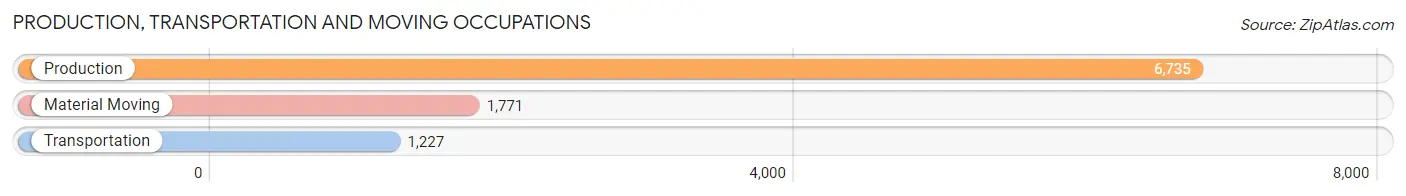
Production, Transportation and Moving Occupations
The most common Production, Transportation and Moving occupations in Manitowoc County are Production (6,735 | 16.6%), Material Moving (1,771 | 4.3%), and Transportation (1,227 | 3.0%).
Production, Transportation and Moving Occupations by Sex
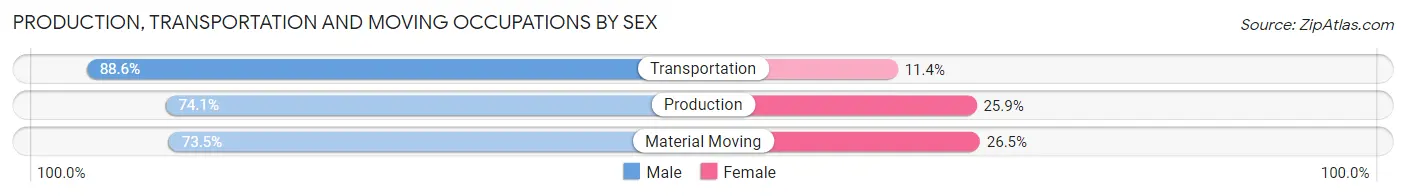
| Occupation | Male | Female |
| Production | 4,993 (74.1%) | 1,742 (25.9%) |
| Transportation | 1,087 (88.6%) | 140 (11.4%) |
| Material Moving | 1,302 (73.5%) | 469 (26.5%) |
| Total (Category) | 7,382 (75.8%) | 2,351 (24.1%) |
| Total (Overall) | 21,956 (54.0%) | 18,726 (46.0%) |
Employment Industries by Sex in Manitowoc County
Employment Industries in Manitowoc County
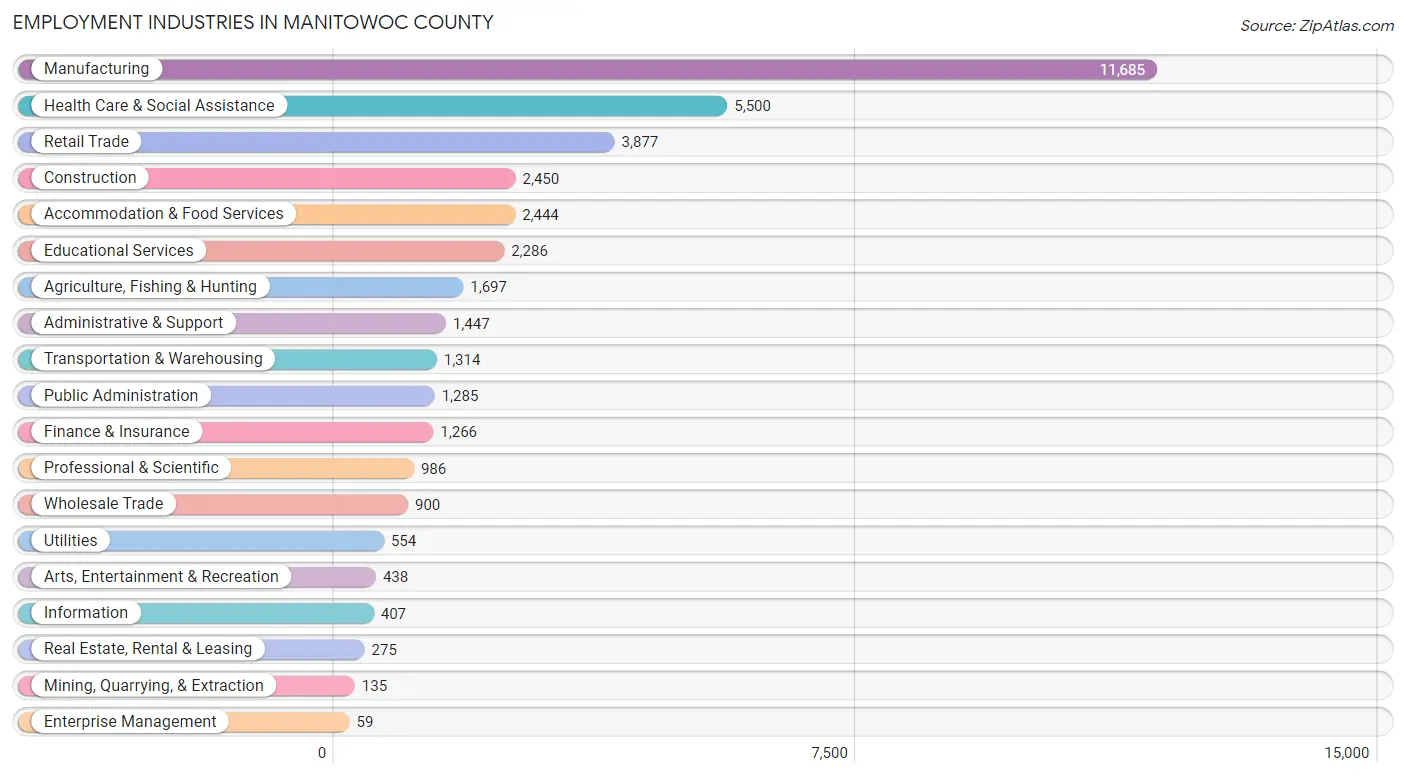
The major employment industries in Manitowoc County include Manufacturing (11,685 | 28.7%), Health Care & Social Assistance (5,500 | 13.5%), Retail Trade (3,877 | 9.5%), Construction (2,450 | 6.0%), and Accommodation & Food Services (2,444 | 6.0%).
Employment Industries by Sex in Manitowoc County
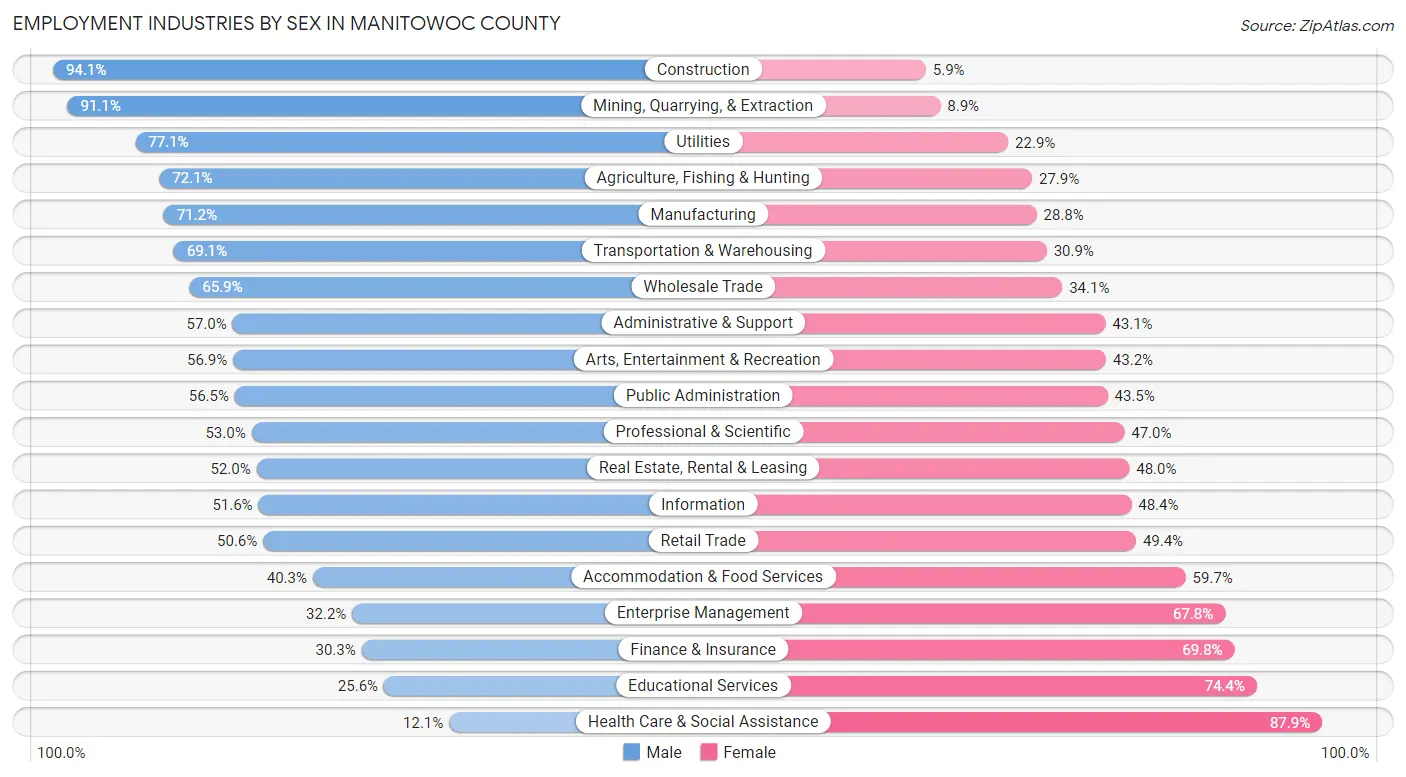
The Manitowoc County industries that see more men than women are Construction (94.1%), Mining, Quarrying, & Extraction (91.1%), and Utilities (77.1%), whereas the industries that tend to have a higher number of women are Health Care & Social Assistance (87.9%), Educational Services (74.4%), and Finance & Insurance (69.8%).
| Industry | Male | Female |
| Agriculture, Fishing & Hunting | 1,224 (72.1%) | 473 (27.9%) |
| Mining, Quarrying, & Extraction | 123 (91.1%) | 12 (8.9%) |
| Construction | 2,306 (94.1%) | 144 (5.9%) |
| Manufacturing | 8,318 (71.2%) | 3,367 (28.8%) |
| Wholesale Trade | 593 (65.9%) | 307 (34.1%) |
| Retail Trade | 1,963 (50.6%) | 1,914 (49.4%) |
| Transportation & Warehousing | 908 (69.1%) | 406 (30.9%) |
| Utilities | 427 (77.1%) | 127 (22.9%) |
| Information | 210 (51.6%) | 197 (48.4%) |
| Finance & Insurance | 383 (30.2%) | 883 (69.8%) |
| Real Estate, Rental & Leasing | 143 (52.0%) | 132 (48.0%) |
| Professional & Scientific | 523 (53.0%) | 463 (47.0%) |
| Enterprise Management | 19 (32.2%) | 40 (67.8%) |
| Administrative & Support | 824 (57.0%) | 623 (43.0%) |
| Educational Services | 586 (25.6%) | 1,700 (74.4%) |
| Health Care & Social Assistance | 667 (12.1%) | 4,833 (87.9%) |
| Arts, Entertainment & Recreation | 249 (56.9%) | 189 (43.1%) |
| Accommodation & Food Services | 986 (40.3%) | 1,458 (59.7%) |
| Public Administration | 726 (56.5%) | 559 (43.5%) |
| Total | 21,956 (54.0%) | 18,726 (46.0%) |
Education in Manitowoc County
School Enrollment in Manitowoc County
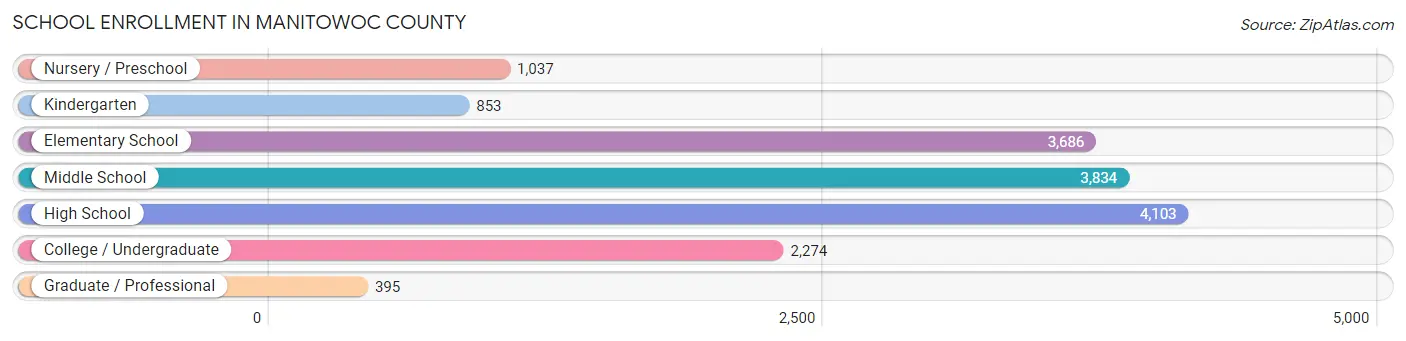
The most common levels of schooling among the 16,182 students in Manitowoc County are high school (4,103 | 25.4%), middle school (3,834 | 23.7%), and elementary school (3,686 | 22.8%).
| School Level | # Students | % Students |
| Nursery / Preschool | 1,037 | 6.4% |
| Kindergarten | 853 | 5.3% |
| Elementary School | 3,686 | 22.8% |
| Middle School | 3,834 | 23.7% |
| High School | 4,103 | 25.4% |
| College / Undergraduate | 2,274 | 14.1% |
| Graduate / Professional | 395 | 2.4% |
| Total | 16,182 | 100.0% |
School Enrollment by Age by Funding Source in Manitowoc County
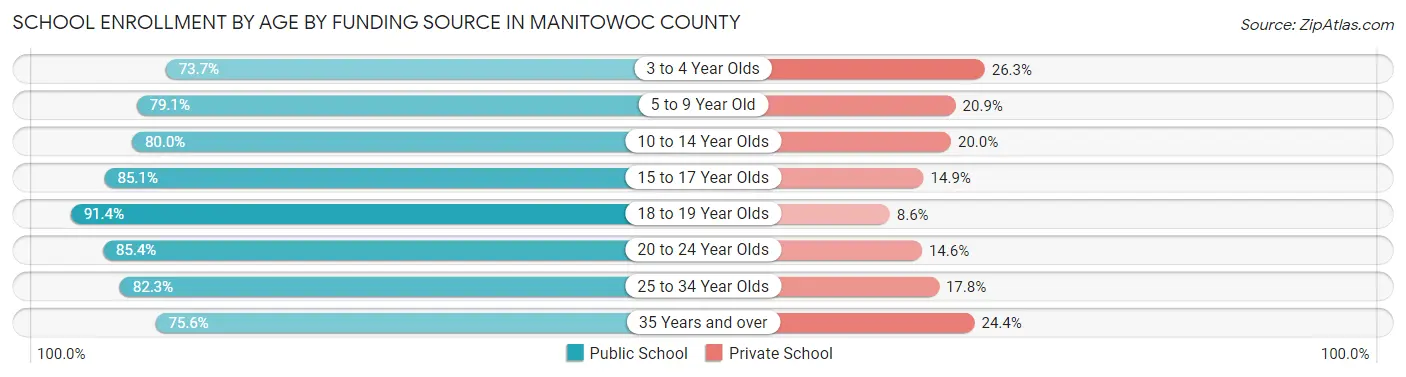
Out of a total of 16,182 students who are enrolled in schools in Manitowoc County, 3,010 (18.6%) attend a private institution, while the remaining 13,172 (81.4%) are enrolled in public schools. The age group of 3 to 4 year olds has the highest likelihood of being enrolled in private schools, with 199 (26.3% in the age bracket) enrolled. Conversely, the age group of 18 to 19 year olds has the lowest likelihood of being enrolled in a private school, with 946 (91.4% in the age bracket) attending a public institution.
| Age Bracket | Public School | Private School |
| 3 to 4 Year Olds | 558 (73.7%) | 199 (26.3%) |
| 5 to 9 Year Old | 3,440 (79.1%) | 907 (20.9%) |
| 10 to 14 Year Olds | 3,669 (80.0%) | 917 (20.0%) |
| 15 to 17 Year Olds | 2,684 (85.1%) | 470 (14.9%) |
| 18 to 19 Year Olds | 946 (91.4%) | 89 (8.6%) |
| 20 to 24 Year Olds | 872 (85.4%) | 149 (14.6%) |
| 25 to 34 Year Olds | 454 (82.3%) | 98 (17.7%) |
| 35 Years and over | 552 (75.6%) | 178 (24.4%) |
| Total | 13,172 (81.4%) | 3,010 (18.6%) |
Educational Attainment by Field of Study in Manitowoc County
Business (2,995 | 19.9%), education (2,992 | 19.9%), science & technology (2,059 | 13.7%), bio, nature & agricultural (1,069 | 7.1%), and arts & humanities (1,035 | 6.9%) are the most common fields of study among 15,053 individuals in Manitowoc County who have obtained a bachelor's degree or higher.
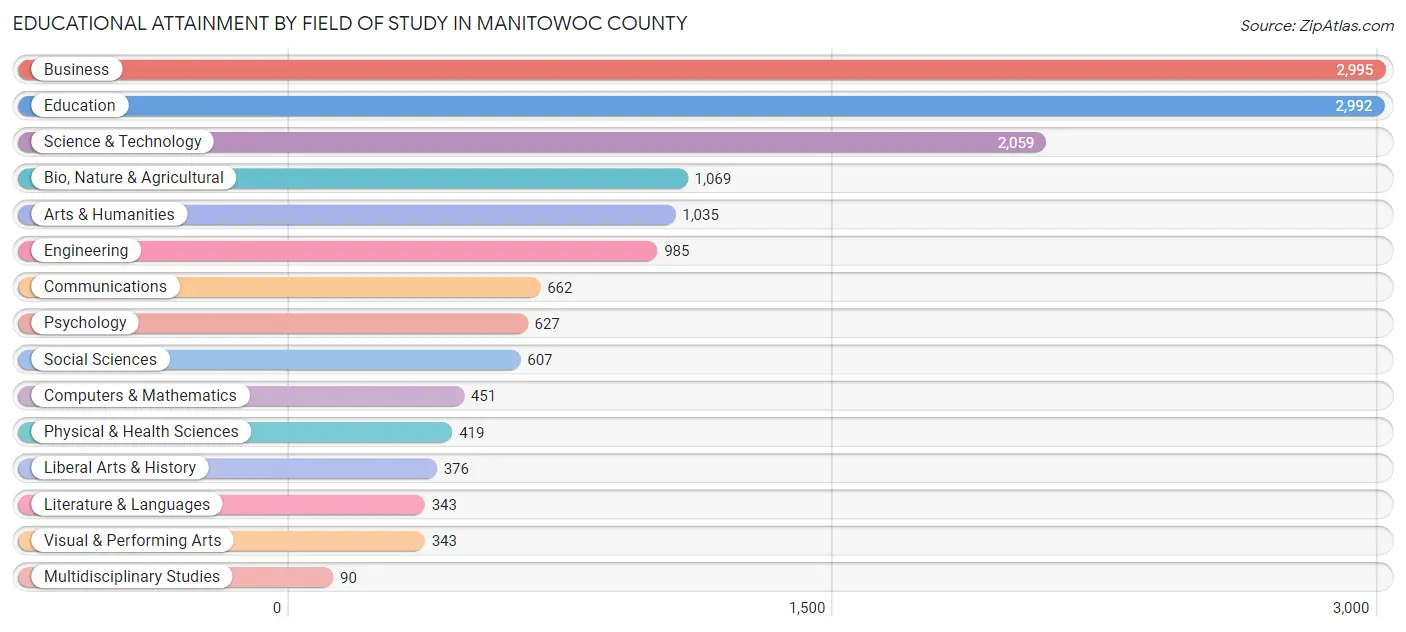
| Field of Study | # Graduates | % Graduates |
| Computers & Mathematics | 451 | 3.0% |
| Bio, Nature & Agricultural | 1,069 | 7.1% |
| Physical & Health Sciences | 419 | 2.8% |
| Psychology | 627 | 4.2% |
| Social Sciences | 607 | 4.0% |
| Engineering | 985 | 6.5% |
| Multidisciplinary Studies | 90 | 0.6% |
| Science & Technology | 2,059 | 13.7% |
| Business | 2,995 | 19.9% |
| Education | 2,992 | 19.9% |
| Literature & Languages | 343 | 2.3% |
| Liberal Arts & History | 376 | 2.5% |
| Visual & Performing Arts | 343 | 2.3% |
| Communications | 662 | 4.4% |
| Arts & Humanities | 1,035 | 6.9% |
| Total | 15,053 | 100.0% |
Transportation & Commute in Manitowoc County
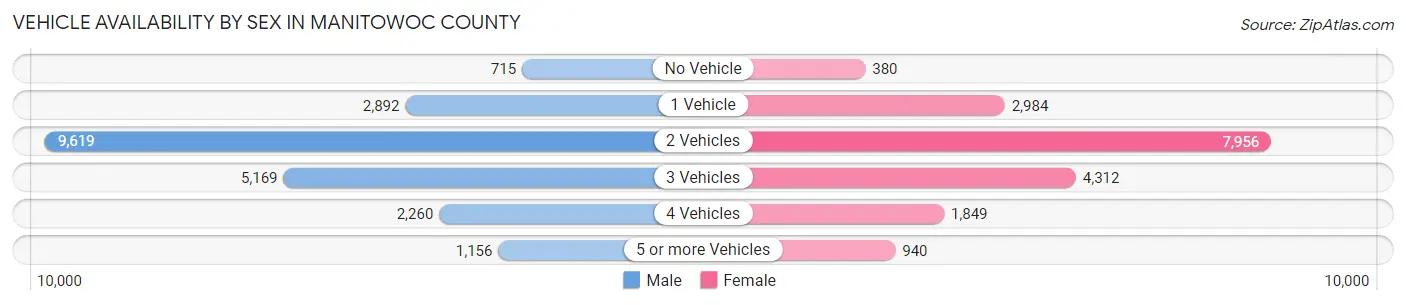
Vehicle Availability by Sex in Manitowoc County
The most prevalent vehicle ownership categories in Manitowoc County are males with 2 vehicles (9,619, accounting for 44.1%) and females with 2 vehicles (7,956, making up 52.2%).
| Vehicles Available | Male | Female |
| No Vehicle | 715 (3.3%) | 380 (2.1%) |
| 1 Vehicle | 2,892 (13.3%) | 2,984 (16.2%) |
| 2 Vehicles | 9,619 (44.1%) | 7,956 (43.2%) |
| 3 Vehicles | 5,169 (23.7%) | 4,312 (23.4%) |
| 4 Vehicles | 2,260 (10.4%) | 1,849 (10.0%) |
| 5 or more Vehicles | 1,156 (5.3%) | 940 (5.1%) |
| Total | 21,811 (100.0%) | 18,421 (100.0%) |
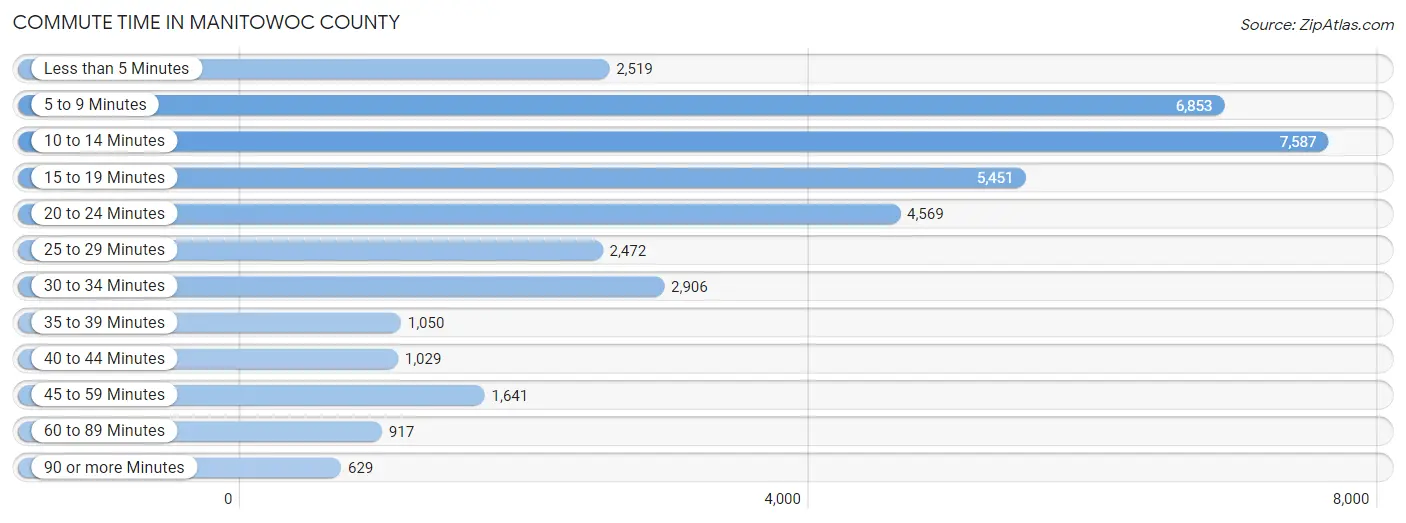
Commute Time in Manitowoc County
The most frequently occuring commute durations in Manitowoc County are 10 to 14 minutes (7,587 commuters, 20.2%), 5 to 9 minutes (6,853 commuters, 18.2%), and 15 to 19 minutes (5,451 commuters, 14.5%).
| Commute Time | # Commuters | % Commuters |
| Less than 5 Minutes | 2,519 | 6.7% |
| 5 to 9 Minutes | 6,853 | 18.2% |
| 10 to 14 Minutes | 7,587 | 20.2% |
| 15 to 19 Minutes | 5,451 | 14.5% |
| 20 to 24 Minutes | 4,569 | 12.1% |
| 25 to 29 Minutes | 2,472 | 6.6% |
| 30 to 34 Minutes | 2,906 | 7.7% |
| 35 to 39 Minutes | 1,050 | 2.8% |
| 40 to 44 Minutes | 1,029 | 2.7% |
| 45 to 59 Minutes | 1,641 | 4.4% |
| 60 to 89 Minutes | 917 | 2.4% |
| 90 or more Minutes | 629 | 1.7% |
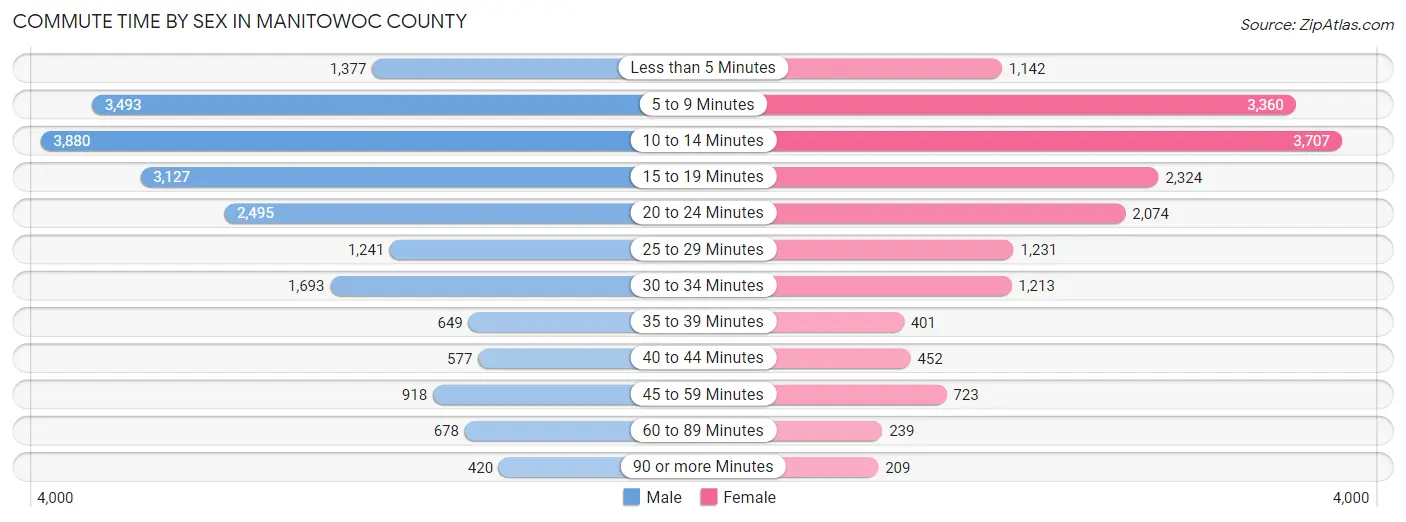
Commute Time by Sex in Manitowoc County
The most common commute times in Manitowoc County are 10 to 14 minutes (3,880 commuters, 18.9%) for males and 10 to 14 minutes (3,707 commuters, 21.7%) for females.
| Commute Time | Male | Female |
| Less than 5 Minutes | 1,377 (6.7%) | 1,142 (6.7%) |
| 5 to 9 Minutes | 3,493 (17.0%) | 3,360 (19.7%) |
| 10 to 14 Minutes | 3,880 (18.9%) | 3,707 (21.7%) |
| 15 to 19 Minutes | 3,127 (15.2%) | 2,324 (13.6%) |
| 20 to 24 Minutes | 2,495 (12.1%) | 2,074 (12.1%) |
| 25 to 29 Minutes | 1,241 (6.0%) | 1,231 (7.2%) |
| 30 to 34 Minutes | 1,693 (8.2%) | 1,213 (7.1%) |
| 35 to 39 Minutes | 649 (3.2%) | 401 (2.4%) |
| 40 to 44 Minutes | 577 (2.8%) | 452 (2.6%) |
| 45 to 59 Minutes | 918 (4.5%) | 723 (4.2%) |
| 60 to 89 Minutes | 678 (3.3%) | 239 (1.4%) |
| 90 or more Minutes | 420 (2.0%) | 209 (1.2%) |
Time of Departure to Work by Sex in Manitowoc County
The most frequent times of departure to work in Manitowoc County are 12:00 AM to 4:59 AM (2,979, 14.5%) for males and 7:30 AM to 7:59 AM (2,787, 16.3%) for females.
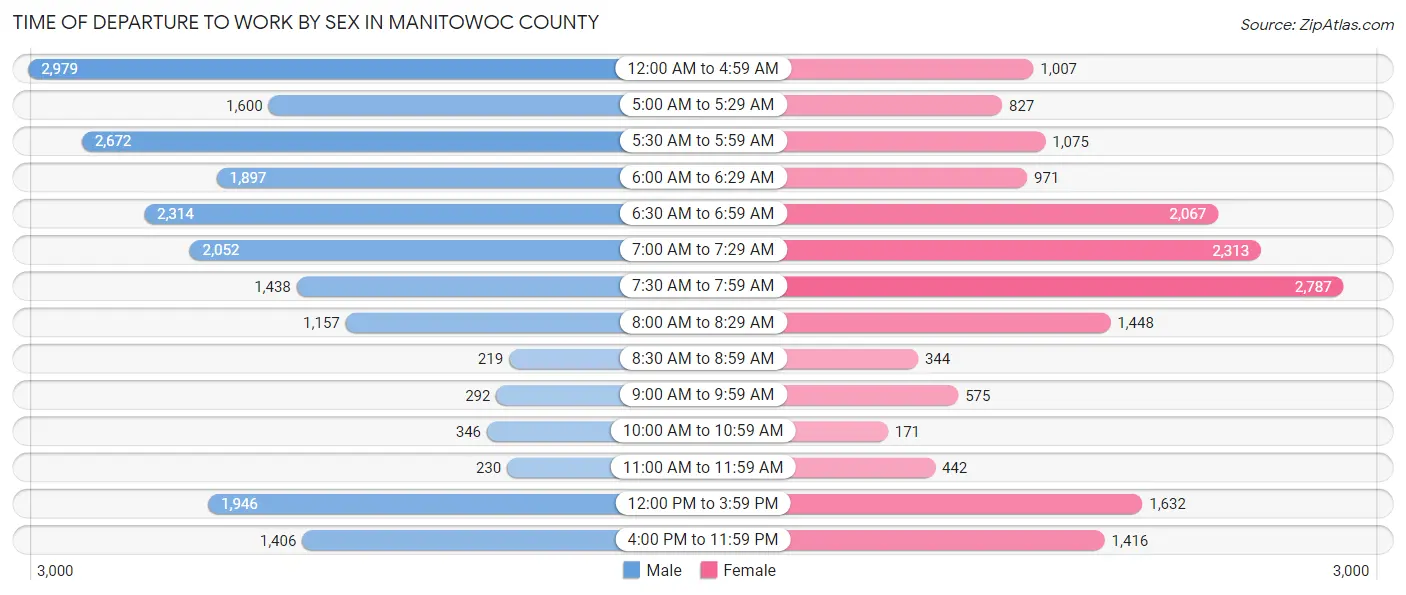
| Time of Departure | Male | Female |
| 12:00 AM to 4:59 AM | 2,979 (14.5%) | 1,007 (5.9%) |
| 5:00 AM to 5:29 AM | 1,600 (7.8%) | 827 (4.8%) |
| 5:30 AM to 5:59 AM | 2,672 (13.0%) | 1,075 (6.3%) |
| 6:00 AM to 6:29 AM | 1,897 (9.2%) | 971 (5.7%) |
| 6:30 AM to 6:59 AM | 2,314 (11.3%) | 2,067 (12.1%) |
| 7:00 AM to 7:29 AM | 2,052 (10.0%) | 2,313 (13.6%) |
| 7:30 AM to 7:59 AM | 1,438 (7.0%) | 2,787 (16.3%) |
| 8:00 AM to 8:29 AM | 1,157 (5.6%) | 1,448 (8.5%) |
| 8:30 AM to 8:59 AM | 219 (1.1%) | 344 (2.0%) |
| 9:00 AM to 9:59 AM | 292 (1.4%) | 575 (3.4%) |
| 10:00 AM to 10:59 AM | 346 (1.7%) | 171 (1.0%) |
| 11:00 AM to 11:59 AM | 230 (1.1%) | 442 (2.6%) |
| 12:00 PM to 3:59 PM | 1,946 (9.5%) | 1,632 (9.6%) |
| 4:00 PM to 11:59 PM | 1,406 (6.8%) | 1,416 (8.3%) |
| Total | 20,548 (100.0%) | 17,075 (100.0%) |
Housing Occupancy in Manitowoc County
Occupancy by Ownership in Manitowoc County
Of the total 34,860 dwellings in Manitowoc County, owner-occupied units account for 26,490 (76.0%), while renter-occupied units make up 8,370 (24.0%).
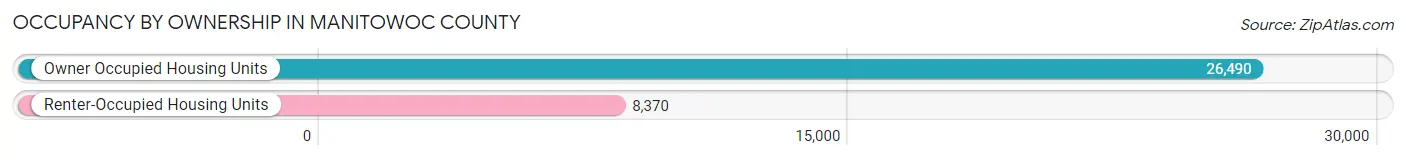
| Occupancy | # Housing Units | % Housing Units |
| Owner Occupied Housing Units | 26,490 | 76.0% |
| Renter-Occupied Housing Units | 8,370 | 24.0% |
| Total Occupied Housing Units | 34,860 | 100.0% |
Occupancy by Household Size in Manitowoc County
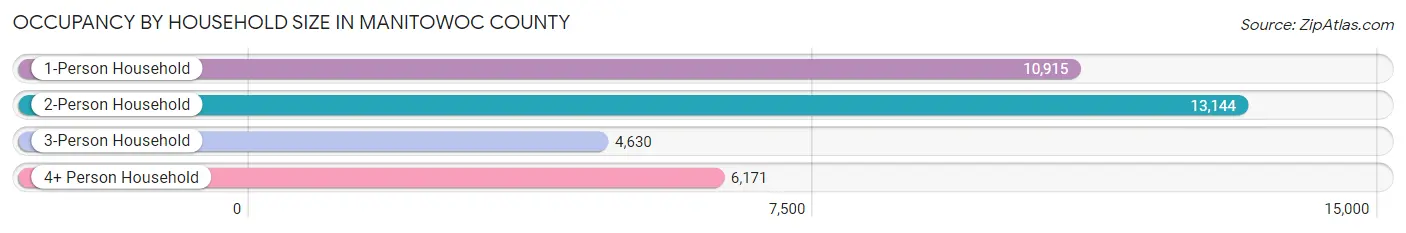
| Household Size | # Housing Units | % Housing Units |
| 1-Person Household | 10,915 | 31.3% |
| 2-Person Household | 13,144 | 37.7% |
| 3-Person Household | 4,630 | 13.3% |
| 4+ Person Household | 6,171 | 17.7% |
| Total Housing Units | 34,860 | 100.0% |
Occupancy by Ownership by Household Size in Manitowoc County
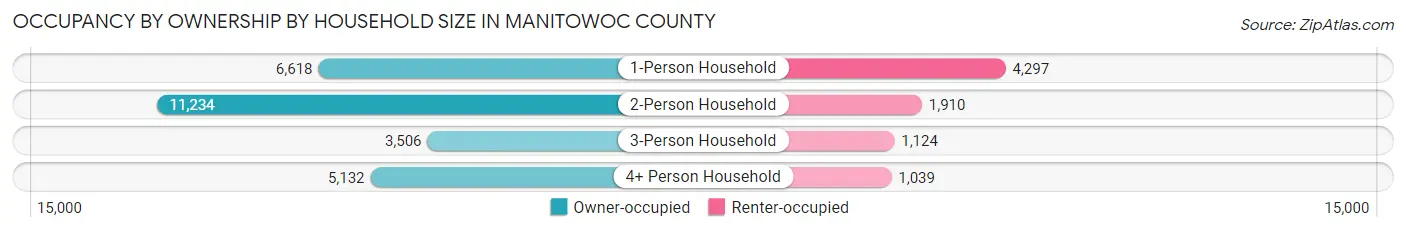
| Household Size | Owner-occupied | Renter-occupied |
| 1-Person Household | 6,618 (60.6%) | 4,297 (39.4%) |
| 2-Person Household | 11,234 (85.5%) | 1,910 (14.5%) |
| 3-Person Household | 3,506 (75.7%) | 1,124 (24.3%) |
| 4+ Person Household | 5,132 (83.2%) | 1,039 (16.8%) |
| Total Housing Units | 26,490 (76.0%) | 8,370 (24.0%) |
Occupancy by Educational Attainment in Manitowoc County
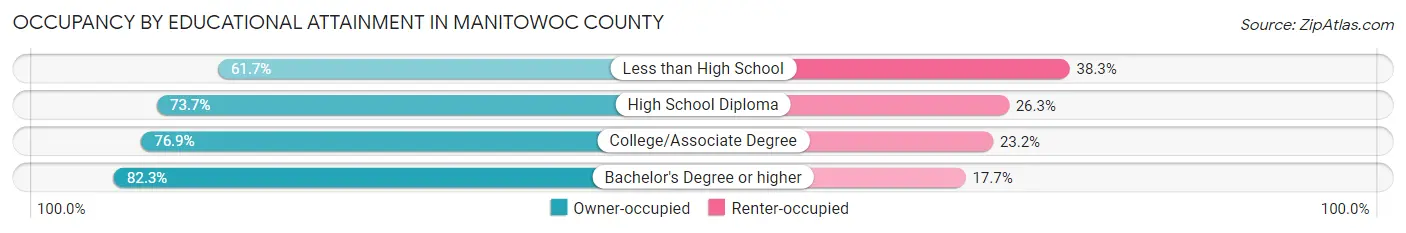
| Household Size | Owner-occupied | Renter-occupied |
| Less than High School | 1,452 (61.7%) | 903 (38.3%) |
| High School Diploma | 9,062 (73.7%) | 3,230 (26.3%) |
| College/Associate Degree | 9,273 (76.8%) | 2,794 (23.2%) |
| Bachelor's Degree or higher | 6,703 (82.3%) | 1,443 (17.7%) |
Occupancy by Age of Householder in Manitowoc County
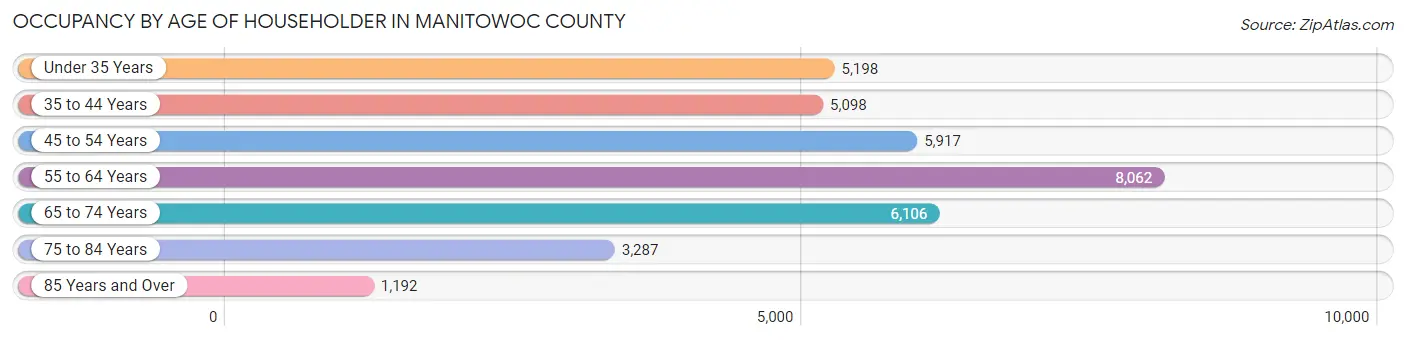
| Age Bracket | # Households | % Households |
| Under 35 Years | 5,198 | 14.9% |
| 35 to 44 Years | 5,098 | 14.6% |
| 45 to 54 Years | 5,917 | 17.0% |
| 55 to 64 Years | 8,062 | 23.1% |
| 65 to 74 Years | 6,106 | 17.5% |
| 75 to 84 Years | 3,287 | 9.4% |
| 85 Years and Over | 1,192 | 3.4% |
| Total | 34,860 | 100.0% |
Housing Finances in Manitowoc County
Median Income by Occupancy in Manitowoc County
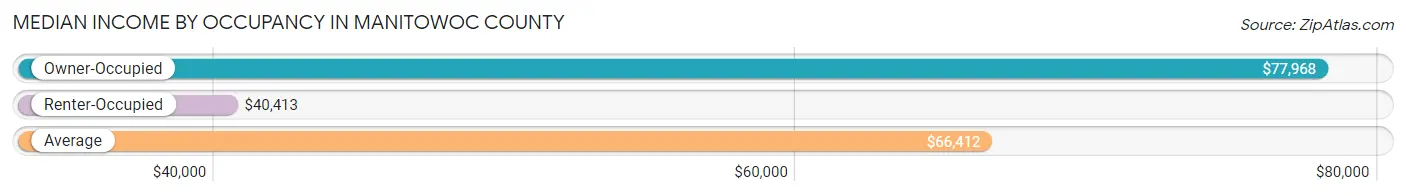
| Occupancy Type | # Households | Median Income |
| Owner-Occupied | 26,490 (76.0%) | $77,968 |
| Renter-Occupied | 8,370 (24.0%) | $40,413 |
| Average | 34,860 (100.0%) | $66,412 |
Occupancy by Householder Income Bracket in Manitowoc County
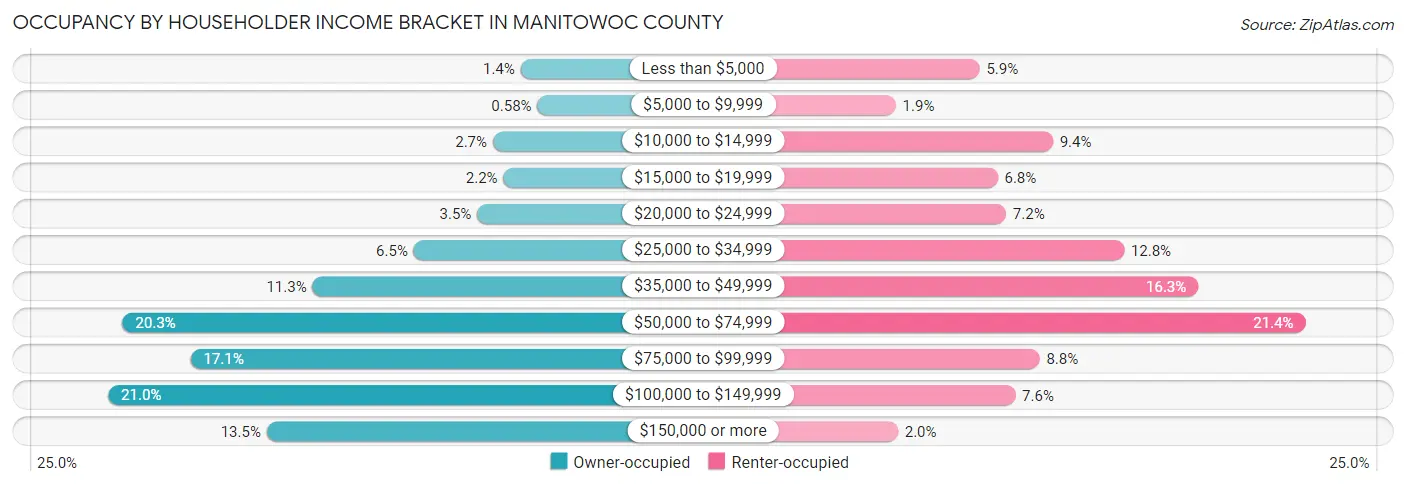
| Income Bracket | Owner-occupied | Renter-occupied |
| Less than $5,000 | 366 (1.4%) | 494 (5.9%) |
| $5,000 to $9,999 | 154 (0.6%) | 160 (1.9%) |
| $10,000 to $14,999 | 716 (2.7%) | 786 (9.4%) |
| $15,000 to $19,999 | 583 (2.2%) | 566 (6.8%) |
| $20,000 to $24,999 | 914 (3.5%) | 599 (7.2%) |
| $25,000 to $34,999 | 1,713 (6.5%) | 1,070 (12.8%) |
| $35,000 to $49,999 | 2,991 (11.3%) | 1,365 (16.3%) |
| $50,000 to $74,999 | 5,387 (20.3%) | 1,793 (21.4%) |
| $75,000 to $99,999 | 4,531 (17.1%) | 733 (8.8%) |
| $100,000 to $149,999 | 5,568 (21.0%) | 636 (7.6%) |
| $150,000 or more | 3,567 (13.5%) | 168 (2.0%) |
| Total | 26,490 (100.0%) | 8,370 (100.0%) |
Monthly Housing Cost Tiers in Manitowoc County
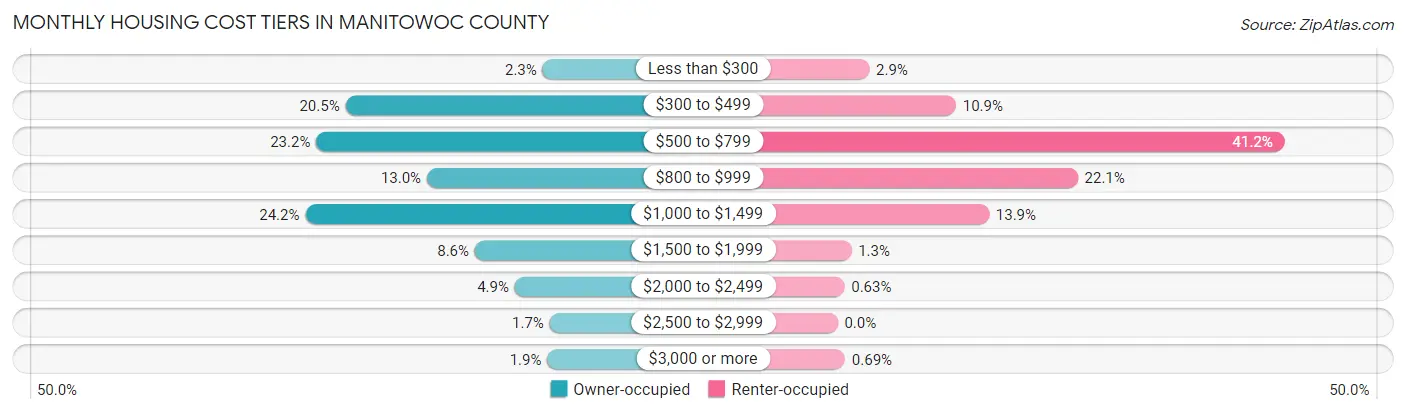
| Monthly Cost | Owner-occupied | Renter-occupied |
| Less than $300 | 613 (2.3%) | 244 (2.9%) |
| $300 to $499 | 5,419 (20.5%) | 912 (10.9%) |
| $500 to $799 | 6,133 (23.2%) | 3,446 (41.2%) |
| $800 to $999 | 3,432 (13.0%) | 1,851 (22.1%) |
| $1,000 to $1,499 | 6,401 (24.2%) | 1,167 (13.9%) |
| $1,500 to $1,999 | 2,265 (8.6%) | 106 (1.3%) |
| $2,000 to $2,499 | 1,291 (4.9%) | 53 (0.6%) |
| $2,500 to $2,999 | 439 (1.7%) | 0 (0.0%) |
| $3,000 or more | 497 (1.9%) | 58 (0.7%) |
| Total | 26,490 (100.0%) | 8,370 (100.0%) |
Physical Housing Characteristics in Manitowoc County
Housing Structures in Manitowoc County
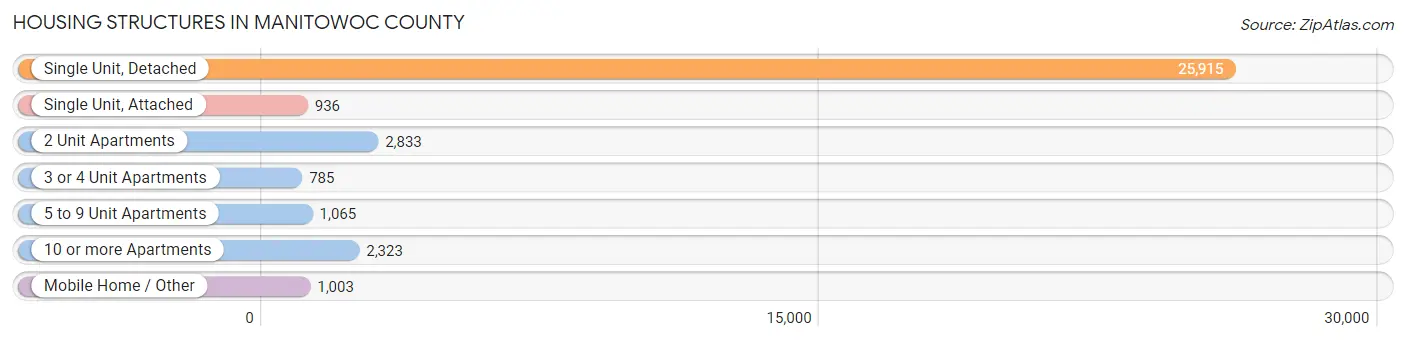
| Structure Type | # Housing Units | % Housing Units |
| Single Unit, Detached | 25,915 | 74.3% |
| Single Unit, Attached | 936 | 2.7% |
| 2 Unit Apartments | 2,833 | 8.1% |
| 3 or 4 Unit Apartments | 785 | 2.2% |
| 5 to 9 Unit Apartments | 1,065 | 3.1% |
| 10 or more Apartments | 2,323 | 6.7% |
| Mobile Home / Other | 1,003 | 2.9% |
| Total | 34,860 | 100.0% |
Housing Structures by Occupancy in Manitowoc County
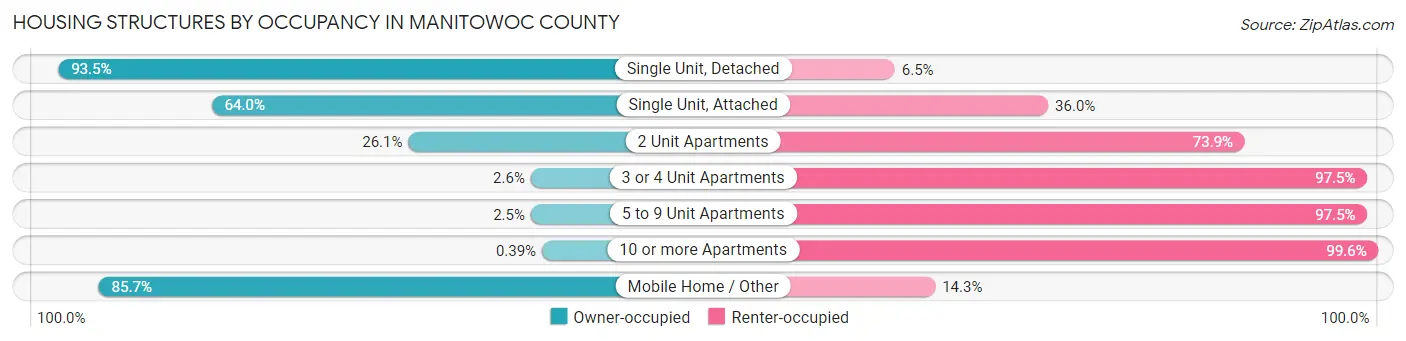
| Structure Type | Owner-occupied | Renter-occupied |
| Single Unit, Detached | 24,235 (93.5%) | 1,680 (6.5%) |
| Single Unit, Attached | 599 (64.0%) | 337 (36.0%) |
| 2 Unit Apartments | 740 (26.1%) | 2,093 (73.9%) |
| 3 or 4 Unit Apartments | 20 (2.5%) | 765 (97.5%) |
| 5 to 9 Unit Apartments | 27 (2.5%) | 1,038 (97.5%) |
| 10 or more Apartments | 9 (0.4%) | 2,314 (99.6%) |
| Mobile Home / Other | 860 (85.7%) | 143 (14.3%) |
| Total | 26,490 (76.0%) | 8,370 (24.0%) |
Housing Structures by Number of Rooms in Manitowoc County
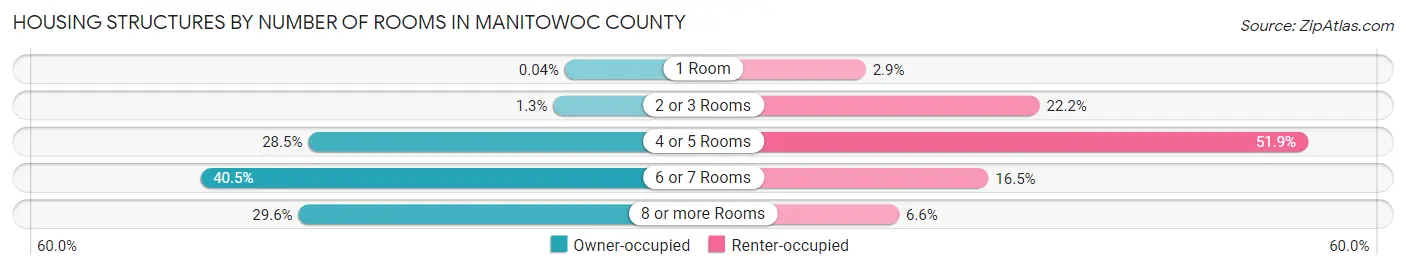
| Number of Rooms | Owner-occupied | Renter-occupied |
| 1 Room | 10 (0.0%) | 239 (2.9%) |
| 2 or 3 Rooms | 349 (1.3%) | 1,856 (22.2%) |
| 4 or 5 Rooms | 7,556 (28.5%) | 4,347 (51.9%) |
| 6 or 7 Rooms | 10,731 (40.5%) | 1,379 (16.5%) |
| 8 or more Rooms | 7,844 (29.6%) | 549 (6.6%) |
| Total | 26,490 (100.0%) | 8,370 (100.0%) |
Housing Structure by Heating Type in Manitowoc County
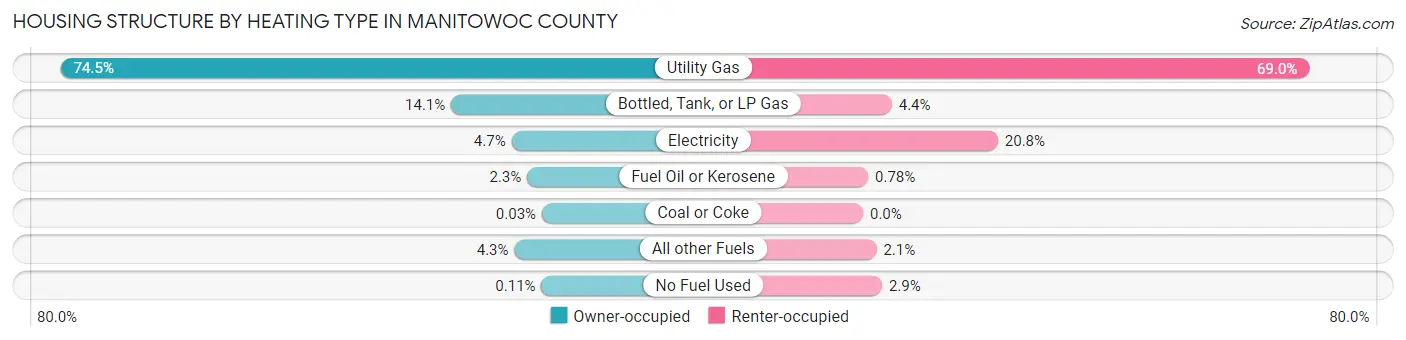
| Heating Type | Owner-occupied | Renter-occupied |
| Utility Gas | 19,723 (74.5%) | 5,772 (69.0%) |
| Bottled, Tank, or LP Gas | 3,728 (14.1%) | 372 (4.4%) |
| Electricity | 1,252 (4.7%) | 1,744 (20.8%) |
| Fuel Oil or Kerosene | 614 (2.3%) | 65 (0.8%) |
| Coal or Coke | 7 (0.0%) | 0 (0.0%) |
| All other Fuels | 1,137 (4.3%) | 173 (2.1%) |
| No Fuel Used | 29 (0.1%) | 244 (2.9%) |
| Total | 26,490 (100.0%) | 8,370 (100.0%) |
Household Vehicle Usage in Manitowoc County

| Vehicles per Household | Owner-occupied | Renter-occupied |
| No Vehicle | 470 (1.8%) | 1,575 (18.8%) |
| 1 Vehicle | 6,326 (23.9%) | 4,071 (48.6%) |
| 2 Vehicles | 12,001 (45.3%) | 2,114 (25.3%) |
| 3 or more Vehicles | 7,693 (29.0%) | 610 (7.3%) |
| Total | 26,490 (100.0%) | 8,370 (100.0%) |
Real Estate & Mortgages in Manitowoc County
Real Estate and Mortgage Overview in Manitowoc County
| Characteristic | Without Mortgage | With Mortgage |
| Housing Units | 11,934 | 14,556 |
| Median Property Value | $155,000 | $164,400 |
| Median Household Income | $60,263 | $2,366 |
| Monthly Housing Costs | $502 | $459 |
| Real Estate Taxes | $2,626 | $208 |
Property Value by Mortgage Status in Manitowoc County
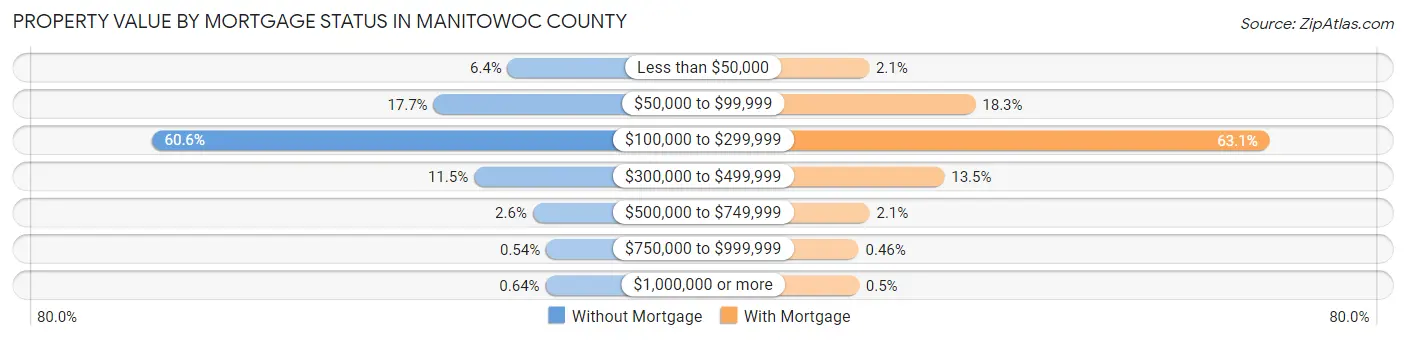
| Property Value | Without Mortgage | With Mortgage |
| Less than $50,000 | 762 (6.4%) | 299 (2.1%) |
| $50,000 to $99,999 | 2,112 (17.7%) | 2,658 (18.3%) |
| $100,000 to $299,999 | 7,237 (60.6%) | 9,181 (63.1%) |
| $300,000 to $499,999 | 1,375 (11.5%) | 1,968 (13.5%) |
| $500,000 to $749,999 | 307 (2.6%) | 310 (2.1%) |
| $750,000 to $999,999 | 65 (0.5%) | 67 (0.5%) |
| $1,000,000 or more | 76 (0.6%) | 73 (0.5%) |
| Total | 11,934 (100.0%) | 14,556 (100.0%) |
Household Income by Mortgage Status in Manitowoc County
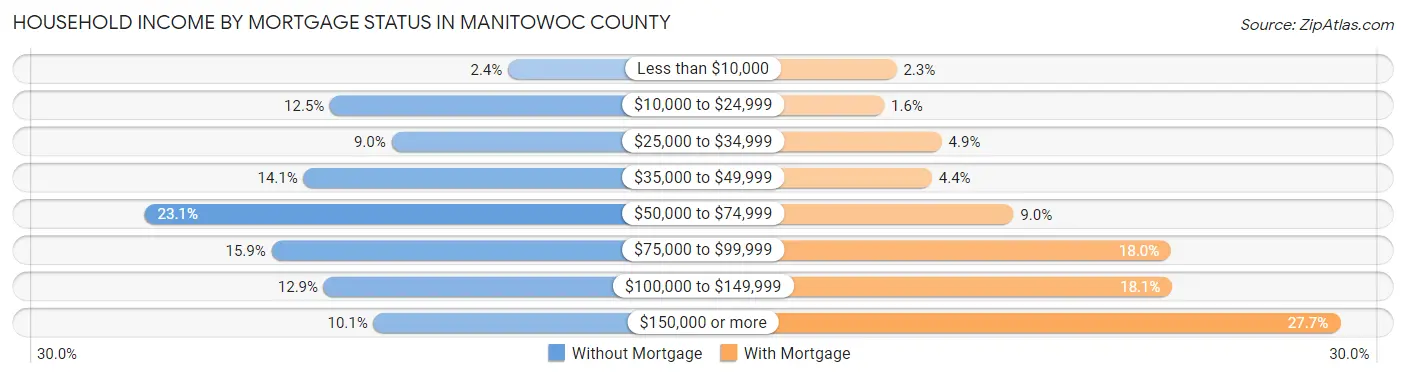
| Household Income | Without Mortgage | With Mortgage |
| Less than $10,000 | 283 (2.4%) | 340 (2.3%) |
| $10,000 to $24,999 | 1,497 (12.5%) | 237 (1.6%) |
| $25,000 to $34,999 | 1,078 (9.0%) | 716 (4.9%) |
| $35,000 to $49,999 | 1,678 (14.1%) | 635 (4.4%) |
| $50,000 to $74,999 | 2,762 (23.1%) | 1,313 (9.0%) |
| $75,000 to $99,999 | 1,896 (15.9%) | 2,625 (18.0%) |
| $100,000 to $149,999 | 1,539 (12.9%) | 2,635 (18.1%) |
| $150,000 or more | 1,201 (10.1%) | 4,029 (27.7%) |
| Total | 11,934 (100.0%) | 14,556 (100.0%) |
Property Value to Household Income Ratio in Manitowoc County
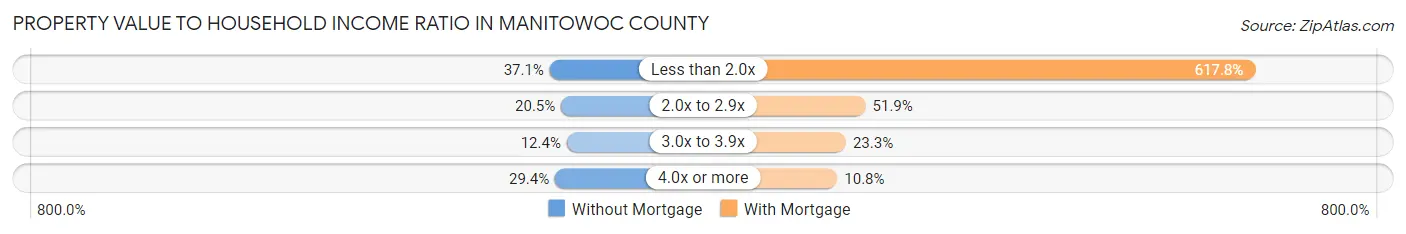
| Value-to-Income Ratio | Without Mortgage | With Mortgage |
| Less than 2.0x | 4,426 (37.1%) | 89,932 (617.8%) |
| 2.0x to 2.9x | 2,443 (20.5%) | 7,549 (51.9%) |
| 3.0x to 3.9x | 1,474 (12.3%) | 3,394 (23.3%) |
| 4.0x or more | 3,505 (29.4%) | 1,574 (10.8%) |
| Total | 11,934 (100.0%) | 14,556 (100.0%) |
Real Estate Taxes by Mortgage Status in Manitowoc County
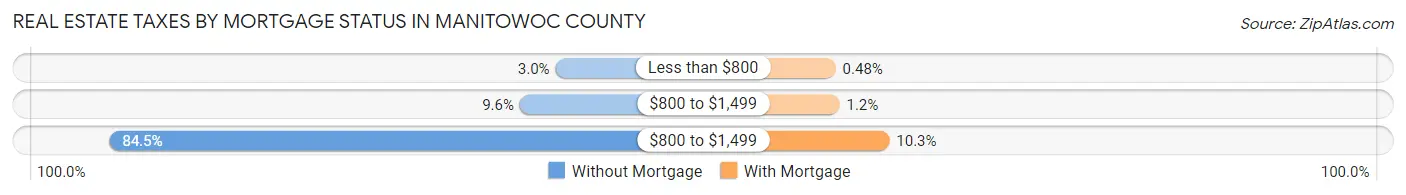
| Property Taxes | Without Mortgage | With Mortgage |
| Less than $800 | 363 (3.0%) | 70 (0.5%) |
| $800 to $1,499 | 1,140 (9.6%) | 173 (1.2%) |
| $800 to $1,499 | 10,088 (84.5%) | 1,498 (10.3%) |
| Total | 11,934 (100.0%) | 14,556 (100.0%) |
Health & Disability in Manitowoc County
Health Insurance Coverage by Age in Manitowoc County
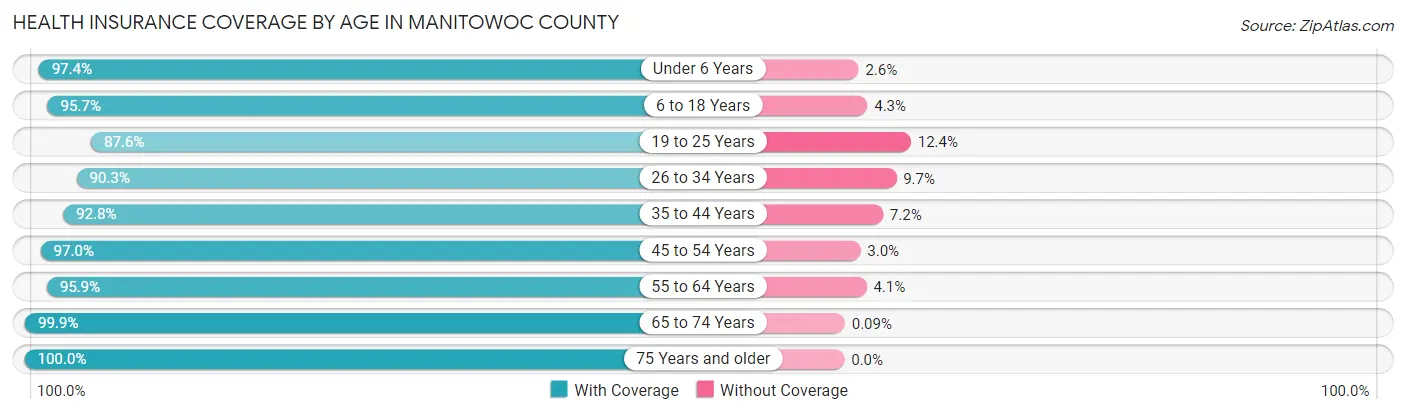
| Age Bracket | With Coverage | Without Coverage |
| Under 6 Years | 4,835 (97.4%) | 131 (2.6%) |
| 6 to 18 Years | 12,146 (95.7%) | 545 (4.3%) |
| 19 to 25 Years | 5,070 (87.6%) | 718 (12.4%) |
| 26 to 34 Years | 6,885 (90.3%) | 738 (9.7%) |
| 35 to 44 Years | 8,764 (92.8%) | 680 (7.2%) |
| 45 to 54 Years | 9,744 (97.0%) | 300 (3.0%) |
| 55 to 64 Years | 12,703 (95.9%) | 549 (4.1%) |
| 65 to 74 Years | 9,881 (99.9%) | 9 (0.1%) |
| 75 Years and older | 6,923 (100.0%) | 0 (0.0%) |
| Total | 76,951 (95.5%) | 3,670 (4.5%) |
Health Insurance Coverage by Citizenship Status in Manitowoc County
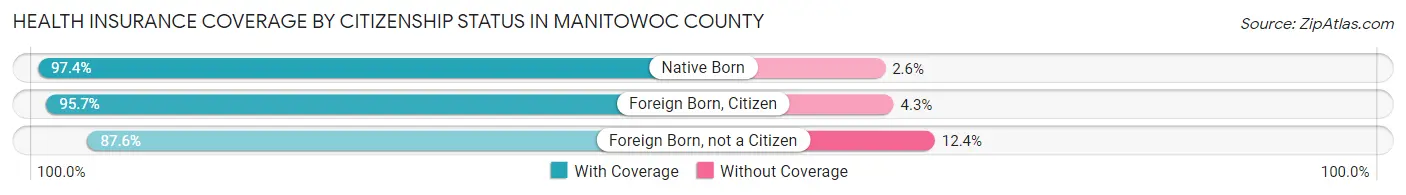
| Citizenship Status | With Coverage | Without Coverage |
| Native Born | 4,835 (97.4%) | 131 (2.6%) |
| Foreign Born, Citizen | 12,146 (95.7%) | 545 (4.3%) |
| Foreign Born, not a Citizen | 5,070 (87.6%) | 718 (12.4%) |
Health Insurance Coverage by Household Income in Manitowoc County
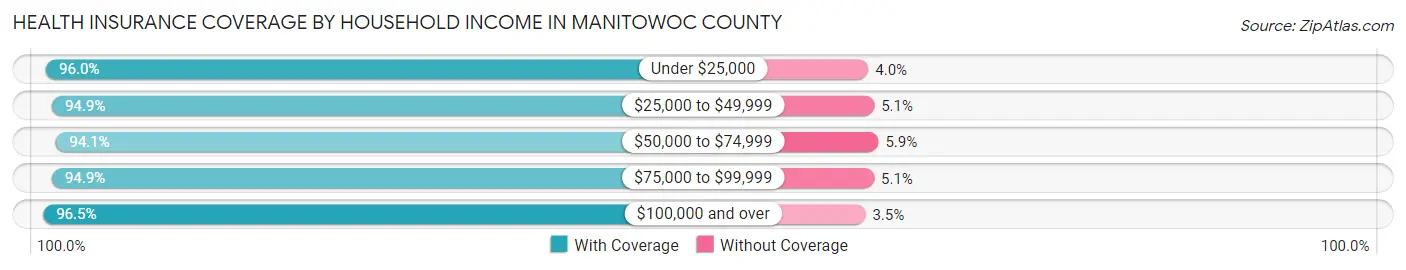
| Household Income | With Coverage | Without Coverage |
| Under $25,000 | 7,428 (96.0%) | 313 (4.0%) |
| $25,000 to $49,999 | 11,920 (94.9%) | 646 (5.1%) |
| $50,000 to $74,999 | 14,830 (94.1%) | 937 (5.9%) |
| $75,000 to $99,999 | 13,181 (94.9%) | 712 (5.1%) |
| $100,000 and over | 28,834 (96.5%) | 1,045 (3.5%) |
Public vs Private Health Insurance Coverage by Age in Manitowoc County
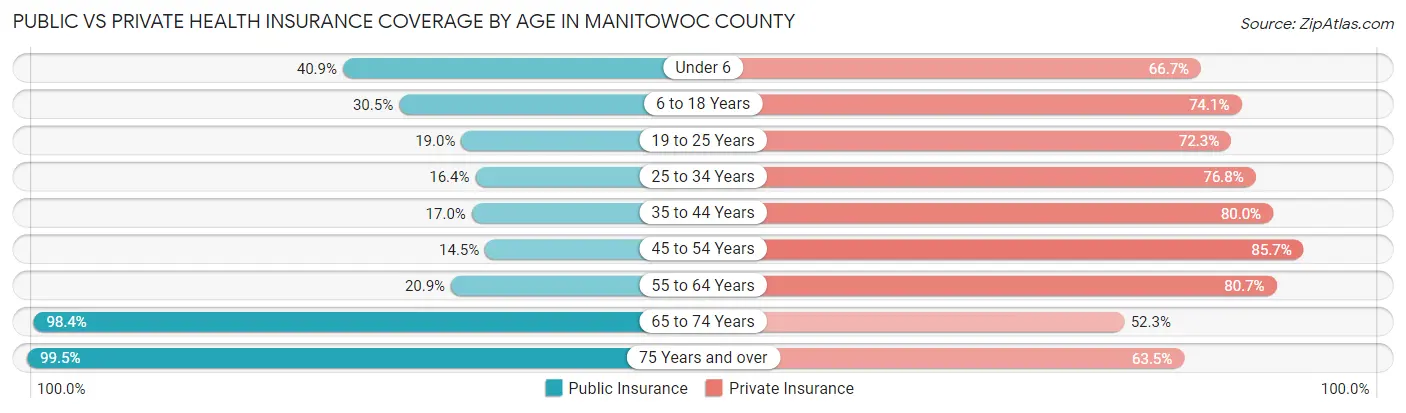
| Age Bracket | Public Insurance | Private Insurance |
| Under 6 | 2,033 (40.9%) | 3,310 (66.6%) |
| 6 to 18 Years | 3,872 (30.5%) | 9,409 (74.1%) |
| 19 to 25 Years | 1,097 (19.0%) | 4,182 (72.3%) |
| 25 to 34 Years | 1,246 (16.4%) | 5,854 (76.8%) |
| 35 to 44 Years | 1,607 (17.0%) | 7,557 (80.0%) |
| 45 to 54 Years | 1,458 (14.5%) | 8,609 (85.7%) |
| 55 to 64 Years | 2,765 (20.9%) | 10,689 (80.7%) |
| 65 to 74 Years | 9,727 (98.4%) | 5,175 (52.3%) |
| 75 Years and over | 6,890 (99.5%) | 4,398 (63.5%) |
| Total | 30,695 (38.1%) | 59,183 (73.4%) |
Disability Status by Sex by Age in Manitowoc County
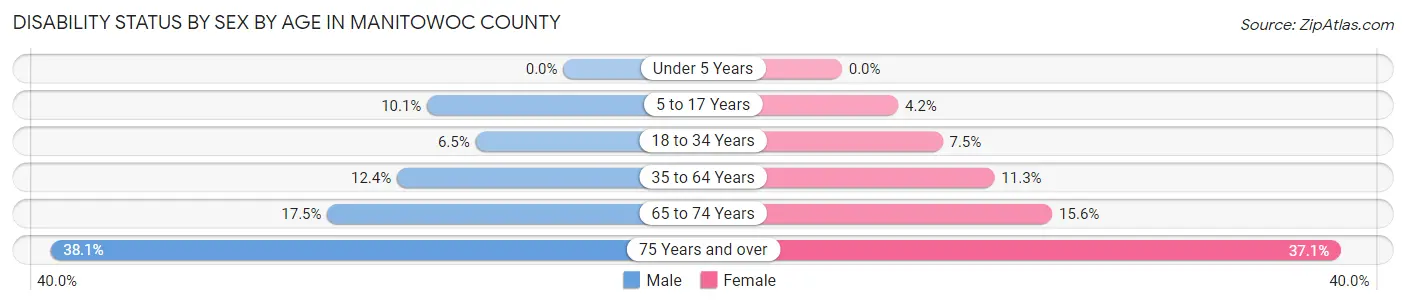
| Age Bracket | Male | Female |
| Under 5 Years | 0 (0.0%) | 0 (0.0%) |
| 5 to 17 Years | 657 (10.1%) | 254 (4.2%) |
| 18 to 34 Years | 483 (6.5%) | 525 (7.5%) |
| 35 to 64 Years | 2,071 (12.3%) | 1,810 (11.3%) |
| 65 to 74 Years | 858 (17.5%) | 780 (15.6%) |
| 75 Years and over | 1,086 (38.1%) | 1,509 (37.1%) |
Disability Class by Sex by Age in Manitowoc County
Disability Class: Hearing Difficulty
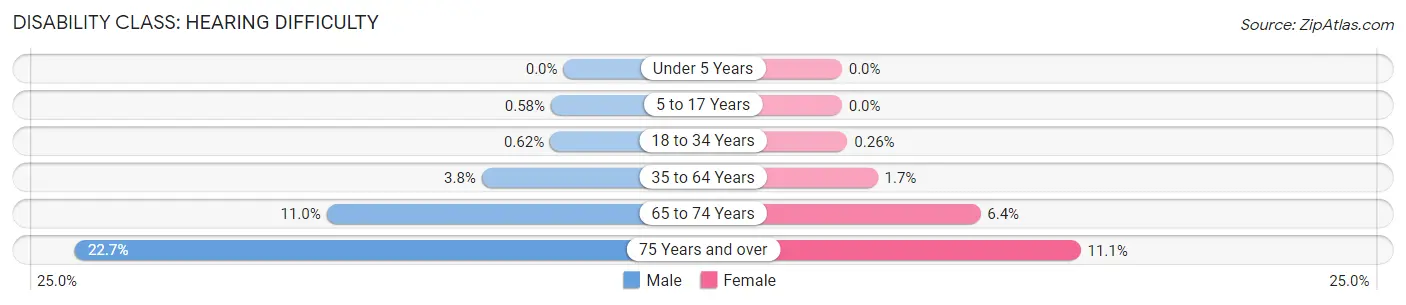
| Age Bracket | Male | Female |
| Under 5 Years | 0 (0.0%) | 0 (0.0%) |
| 5 to 17 Years | 38 (0.6%) | 0 (0.0%) |
| 18 to 34 Years | 46 (0.6%) | 18 (0.3%) |
| 35 to 64 Years | 636 (3.8%) | 265 (1.7%) |
| 65 to 74 Years | 538 (11.0%) | 321 (6.4%) |
| 75 Years and over | 646 (22.7%) | 451 (11.1%) |
Disability Class: Vision Difficulty
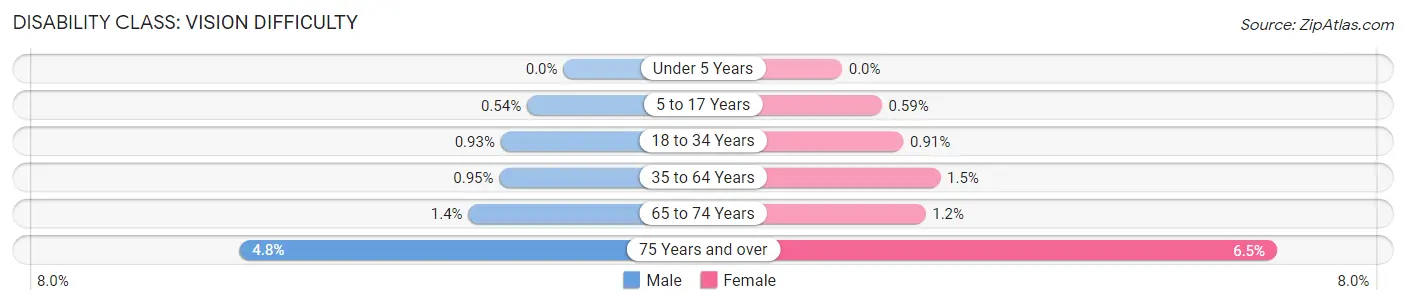
| Age Bracket | Male | Female |
| Under 5 Years | 0 (0.0%) | 0 (0.0%) |
| 5 to 17 Years | 35 (0.5%) | 36 (0.6%) |
| 18 to 34 Years | 69 (0.9%) | 64 (0.9%) |
| 35 to 64 Years | 160 (0.9%) | 234 (1.5%) |
| 65 to 74 Years | 69 (1.4%) | 62 (1.2%) |
| 75 Years and over | 137 (4.8%) | 263 (6.5%) |
Disability Class: Cognitive Difficulty
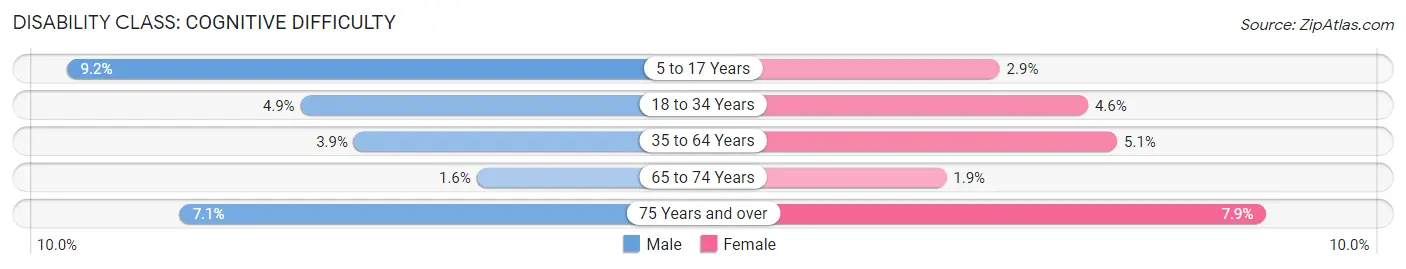
| Age Bracket | Male | Female |
| 5 to 17 Years | 598 (9.2%) | 178 (2.9%) |
| 18 to 34 Years | 362 (4.9%) | 321 (4.6%) |
| 35 to 64 Years | 652 (3.9%) | 816 (5.1%) |
| 65 to 74 Years | 79 (1.6%) | 97 (1.9%) |
| 75 Years and over | 203 (7.1%) | 320 (7.9%) |
Disability Class: Ambulatory Difficulty
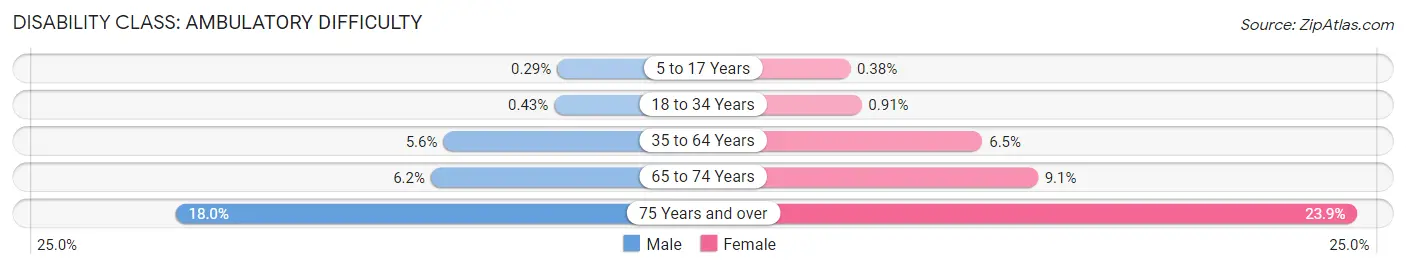
| Age Bracket | Male | Female |
| 5 to 17 Years | 19 (0.3%) | 23 (0.4%) |
| 18 to 34 Years | 32 (0.4%) | 64 (0.9%) |
| 35 to 64 Years | 934 (5.6%) | 1,042 (6.5%) |
| 65 to 74 Years | 301 (6.1%) | 454 (9.1%) |
| 75 Years and over | 513 (18.0%) | 974 (23.9%) |
Disability Class: Self-Care Difficulty
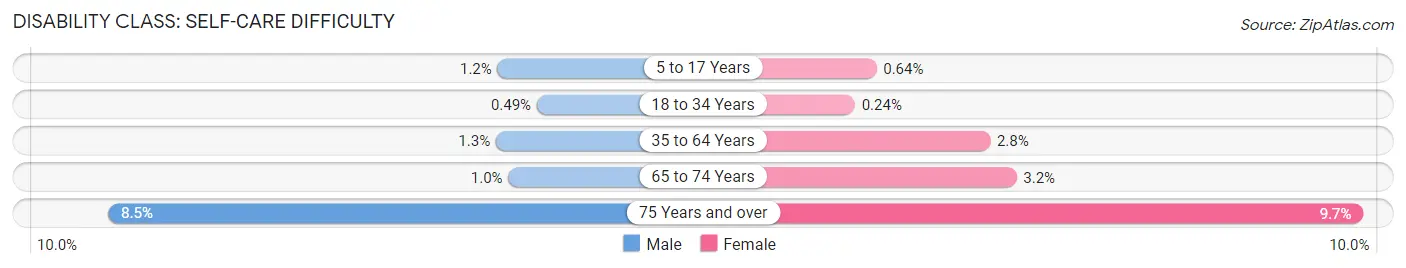
| Age Bracket | Male | Female |
| 5 to 17 Years | 79 (1.2%) | 39 (0.6%) |
| 18 to 34 Years | 36 (0.5%) | 17 (0.2%) |
| 35 to 64 Years | 210 (1.3%) | 440 (2.8%) |
| 65 to 74 Years | 50 (1.0%) | 162 (3.2%) |
| 75 Years and over | 241 (8.5%) | 394 (9.7%) |
Technology Access in Manitowoc County
Computing Device Access in Manitowoc County
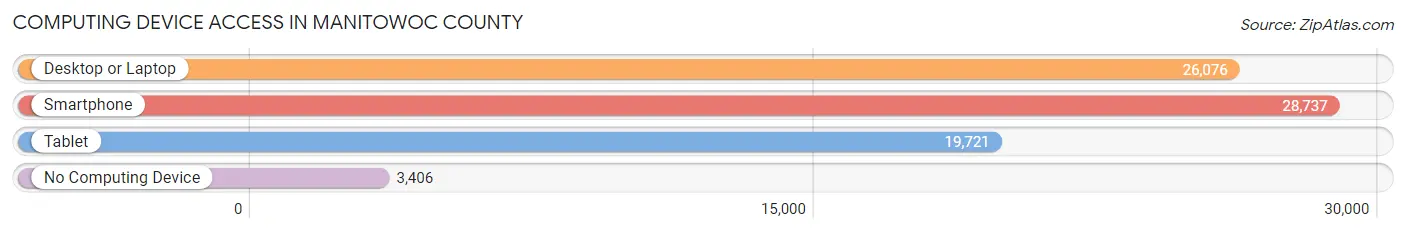
| Device Type | # Households | % Households |
| Desktop or Laptop | 26,076 | 74.8% |
| Smartphone | 28,737 | 82.4% |
| Tablet | 19,721 | 56.6% |
| No Computing Device | 3,406 | 9.8% |
| Total | 34,860 | 100.0% |
Internet Access in Manitowoc County
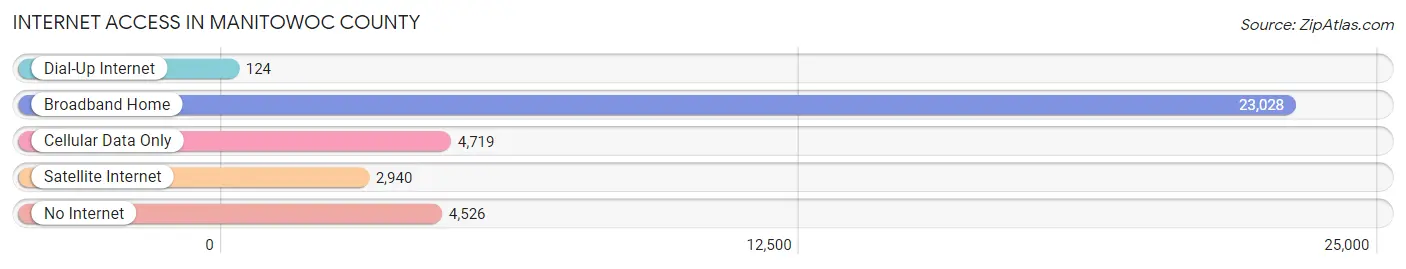
| Internet Type | # Households | % Households |
| Dial-Up Internet | 124 | 0.4% |
| Broadband Home | 23,028 | 66.1% |
| Cellular Data Only | 4,719 | 13.5% |
| Satellite Internet | 2,940 | 8.4% |
| No Internet | 4,526 | 13.0% |
| Total | 34,860 | 100.0% |
Manitowoc County Summary
Manitowoc County is located in the east-central part of Wisconsin, along the western shore of Lake Michigan. It is bordered by Calumet County to the north, Sheboygan County to the east, and Kewaunee County to the south. The county seat is Manitowoc, and the largest city is Two Rivers. The county has a total area of 837 square miles, of which 790 square miles is land and 47 square miles is water.
History
Manitowoc County was first settled by French fur traders in the late 1700s. The area was part of the Northwest Territory until 1836, when it became part of the Wisconsin Territory. In 1848, Manitowoc County was officially established. The county was named after the Native American word for “spirit-land” or “home of the great spirit.”
The county was largely agricultural in the 19th century, with the main crops being wheat, oats, and barley. In the late 19th century, the county began to industrialize, with the development of the Manitowoc Shipbuilding Company and the Two Rivers Paper Company. The county also became a major center for the production of cheese and dairy products.
Geography
Manitowoc County is located in the east-central part of Wisconsin, along the western shore of Lake Michigan. The county is mostly flat, with some rolling hills in the northern and eastern parts. The county is drained by the Manitowoc River, which flows through the county from north to south. The county is home to several lakes, including Silver Lake, Lake Michigan, and Lake Winnebago.
Economy
Manitowoc County’s economy is largely based on manufacturing and agriculture. The county is home to several large manufacturing companies, including Manitowoc Company, S.C. Johnson & Son, and Johnsonville Sausage. The county is also home to several agricultural businesses, including dairy farms, vegetable farms, and fruit orchards.
The county is also home to several tourist attractions, including the Wisconsin Maritime Museum, the Rahr-West Art Museum, and the Lincoln Park Zoo. The county is also home to several festivals, including the Manitowoc County Fair and the Two Rivers Waterfront Festival.
Demographics
As of the 2010 census, Manitowoc County had a population of 81,442. The population was spread out with 19.7% under the age of 18, 10.2% from 18 to 24, 24.2% from 25 to 44, 28.2% from 45 to 64, and 17.7% who were 65 years of age or older. The median age was 40.7 years.
The racial makeup of the county was 95.2% White, 0.7% African American, 0.4% Native American, 1.3% Asian, 0.1% Pacific Islander, 1.2% from other races, and 1.1% from two or more races. Hispanic or Latino of any race were 3.2% of the population.
The median income for a household in the county was $50,945, and the median income for a family was $62,945. The per capita income for the county was $25,945. About 6.2% of families and 8.7% of the population were below the poverty line, including 11.2% of those under age 18 and 6.2% of those age 65 or over.
Common Questions
What is the Total Population of Manitowoc County?
Total Population of Manitowoc County is 81,242.
What is the Total Male Population of Manitowoc County?
Total Male Population of Manitowoc County is 40,886.
What is the Total Female Population of Manitowoc County?
Total Female Population of Manitowoc County is 40,356.
What is the Ratio of Males per 100 Females in Manitowoc County?
There are 101.31 Males per 100 Females in Manitowoc County.
What is the Ratio of Females per 100 Males in Manitowoc County?
There are 98.70 Females per 100 Males in Manitowoc County.
What is the Median Population Age in Manitowoc County?
Median Population Age in Manitowoc County is 45.0 Years.
What is the Average Family Size in Manitowoc County
Average Family Size in Manitowoc County is 2.9 People.
What is the Average Household Size in Manitowoc County
Average Household Size in Manitowoc County is 2.3 People.
What is Per Capita Income in Manitowoc County?
Per Capita income in Manitowoc County is $35,854.
What is the Median Family Income in Manitowoc County?
Median Family Income in Manitowoc County is $83,400.
What is the Median Household income in Manitowoc County?
Median Household Income in Manitowoc County is $66,412.
What is Income or Wage Gap in Manitowoc County?
Income or Wage Gap in Manitowoc County is 34.4%.
Women in Manitowoc County earn 65.6 cents for every dollar earned by a man.
What is Family Income Deficit in Manitowoc County?
Family Income Deficit in Manitowoc County is $10,130.
Families that are below poverty line in Manitowoc County earn $10,130 less on average than the poverty threshold level.
What is Inequality or Gini Index in Manitowoc County?
Inequality or Gini Index in Manitowoc County is 0.41.
How Large is the Labor Force in Manitowoc County?
There are 41,582 People in the Labor Forcein in Manitowoc County.
What is the Percentage of People in the Labor Force in Manitowoc County?
62.3% of People are in the Labor Force in Manitowoc County.
What is the Unemployment Rate in Manitowoc County?
Unemployment Rate in Manitowoc County is 2.0%.