Langlade County, WI
Langlade County Map
Langlade County Overview
19,512
TOTAL POPULATION
9,907
MALE POPULATION
9,605
FEMALE POPULATION
103.14
MALES / 100 FEMALES
96.95
FEMALES / 100 MALES
48.6
MEDIAN AGE
2.9
AVG FAMILY SIZE
2.3
AVG HOUSEHOLD SIZE
$32,989
PER CAPITA INCOME
$72,459
AVG FAMILY INCOME
$55,091
AVG HOUSEHOLD INCOME
20.5%
WAGE / INCOME GAP [ % ]
79.5¢/ $1
WAGE / INCOME GAP [ $ ]
$12,165
FAMILY INCOME DEFICIT
0.44
INEQUALITY / GINI INDEX
9,402
LABOR FORCE [ PEOPLE ]
57.9%
PERCENT IN LABOR FORCE
4.9%
UNEMPLOYMENT RATE
Langlade County Area Codes
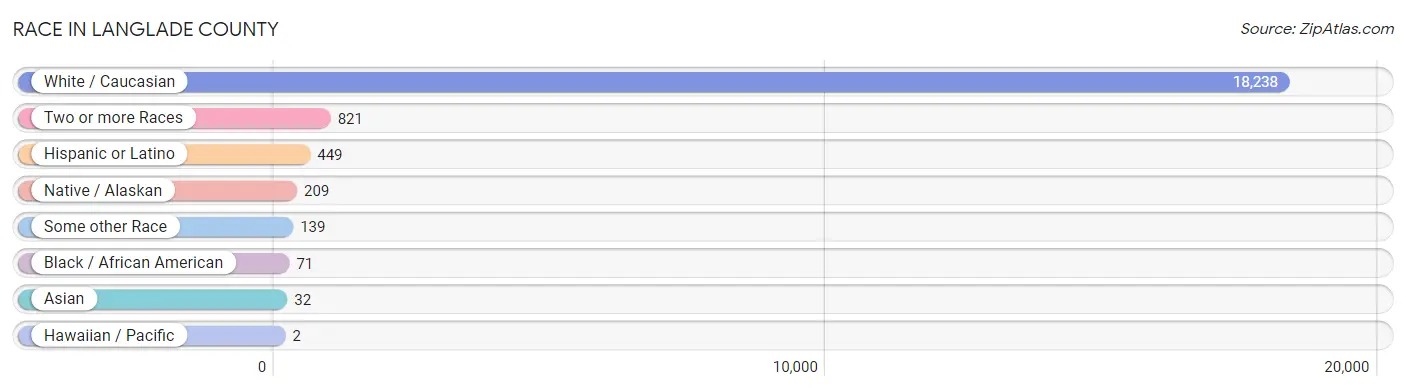
Race in Langlade County
The most populous races in Langlade County are White / Caucasian (18,238 | 93.5%), Two or more Races (821 | 4.2%), and Hispanic or Latino (449 | 2.3%).
| Race | # Population | % Population |
| Asian | 32 | 0.2% |
| Black / African American | 71 | 0.4% |
| Hawaiian / Pacific | 2 | 0.0% |
| Hispanic or Latino | 449 | 2.3% |
| Native / Alaskan | 209 | 1.1% |
| White / Caucasian | 18,238 | 93.5% |
| Two or more Races | 821 | 4.2% |
| Some other Race | 139 | 0.7% |
| Total | 19,512 | 100.0% |
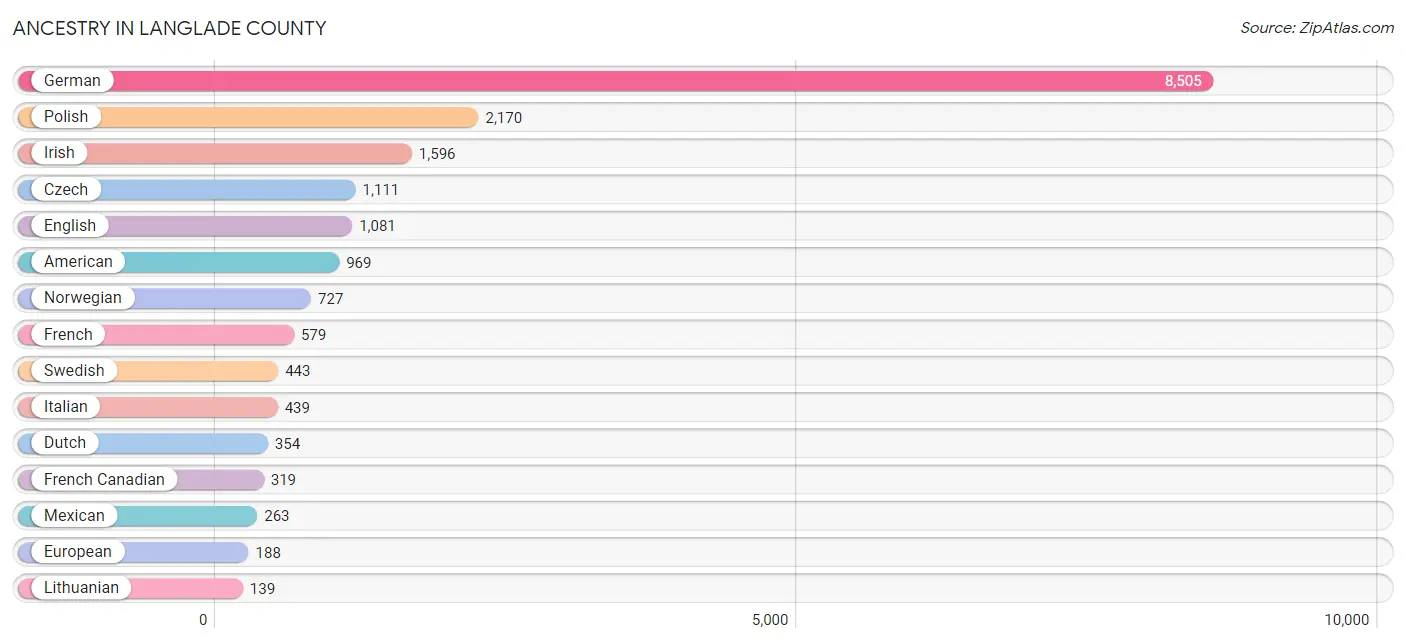
Ancestry in Langlade County
The most populous ancestries reported in Langlade County are German (8,505 | 43.6%), Polish (2,170 | 11.1%), Irish (1,596 | 8.2%), Czech (1,111 | 5.7%), and English (1,081 | 5.5%), together accounting for 74.1% of all Langlade County residents.
| Ancestry | # Population | % Population |
| American | 969 | 5.0% |
| Arab | 2 | 0.0% |
| Argentinean | 3 | 0.0% |
| Austrian | 63 | 0.3% |
| Belgian | 120 | 0.6% |
| Bhutanese | 39 | 0.2% |
| Blackfeet | 2 | 0.0% |
| British | 25 | 0.1% |
| Bulgarian | 2 | 0.0% |
| Burmese | 9 | 0.1% |
| Canadian | 1 | 0.0% |
| Central American | 33 | 0.2% |
| Central American Indian | 31 | 0.2% |
| Cherokee | 1 | 0.0% |
| Chippewa | 96 | 0.5% |
| Creek | 6 | 0.0% |
| Croatian | 87 | 0.4% |
| Cuban | 1 | 0.0% |
| Czech | 1,111 | 5.7% |
| Czechoslovakian | 37 | 0.2% |
| Danish | 78 | 0.4% |
| Dutch | 354 | 1.8% |
| Eastern European | 24 | 0.1% |
| English | 1,081 | 5.5% |
| Ethiopian | 20 | 0.1% |
| European | 188 | 1.0% |
| Finnish | 50 | 0.3% |
| French | 579 | 3.0% |
| French Canadian | 319 | 1.6% |
| German | 8,505 | 43.6% |
| Greek | 16 | 0.1% |
| Guatemalan | 11 | 0.1% |
| Honduran | 16 | 0.1% |
| Hungarian | 91 | 0.5% |
| Icelander | 3 | 0.0% |
| Indian (Asian) | 4 | 0.0% |
| Irish | 1,596 | 8.2% |
| Iroquois | 64 | 0.3% |
| Italian | 439 | 2.2% |
| Korean | 90 | 0.5% |
| Latvian | 7 | 0.0% |
| Lebanese | 2 | 0.0% |
| Lithuanian | 139 | 0.7% |
| Luxembourger | 32 | 0.2% |
| Menominee | 44 | 0.2% |
| Mexican | 263 | 1.3% |
| Mexican American Indian | 29 | 0.2% |
| Native Hawaiian | 2 | 0.0% |
| Northern European | 10 | 0.1% |
| Norwegian | 727 | 3.7% |
| Ottawa | 5 | 0.0% |
| Panamanian | 6 | 0.0% |
| Polish | 2,170 | 11.1% |
| Portuguese | 17 | 0.1% |
| Potawatomi | 52 | 0.3% |
| Puerto Rican | 134 | 0.7% |
| Russian | 135 | 0.7% |
| Scandinavian | 79 | 0.4% |
| Scotch-Irish | 135 | 0.7% |
| Scottish | 105 | 0.5% |
| Slavic | 109 | 0.6% |
| Slovak | 7 | 0.0% |
| Slovene | 20 | 0.1% |
| South American | 7 | 0.0% |
| Spaniard | 3 | 0.0% |
| Spanish | 7 | 0.0% |
| Sri Lankan | 1 | 0.0% |
| Subsaharan African | 20 | 0.1% |
| Swedish | 443 | 2.3% |
| Swiss | 63 | 0.3% |
| Thai | 1 | 0.0% |
| Ukrainian | 7 | 0.0% |
| Venezuelan | 3 | 0.0% |
| Welsh | 58 | 0.3% |
| Yugoslavian | 4 | 0.0% | View All 75 Rows |
Immigrants in Langlade County
The most numerous immigrant groups reported in Langlade County came from Latin America (83 | 0.4%), Central America (81 | 0.4%), Europe (68 | 0.4%), Mexico (45 | 0.2%), and Germany (31 | 0.2%), together accounting for 1.6% of all Langlade County residents.

| Immigration Origin | # Population | % Population |
| Africa | 20 | 0.1% |
| Asia | 30 | 0.2% |
| Barbados | 2 | 0.0% |
| Caribbean | 2 | 0.0% |
| Central America | 81 | 0.4% |
| China | 3 | 0.0% |
| Eastern Africa | 20 | 0.1% |
| Eastern Asia | 11 | 0.1% |
| Eastern Europe | 30 | 0.2% |
| England | 4 | 0.0% |
| Ethiopia | 20 | 0.1% |
| Europe | 68 | 0.4% |
| Germany | 31 | 0.2% |
| Guatemala | 3 | 0.0% |
| Honduras | 16 | 0.1% |
| Hungary | 22 | 0.1% |
| Korea | 8 | 0.0% |
| Latin America | 83 | 0.4% |
| Latvia | 7 | 0.0% |
| Mexico | 45 | 0.2% |
| Northern Europe | 7 | 0.0% |
| Norway | 3 | 0.0% |
| Panama | 17 | 0.1% |
| Philippines | 19 | 0.1% |
| Russia | 1 | 0.0% |
| South Eastern Asia | 19 | 0.1% |
| Western Europe | 31 | 0.2% | View All 27 Rows |
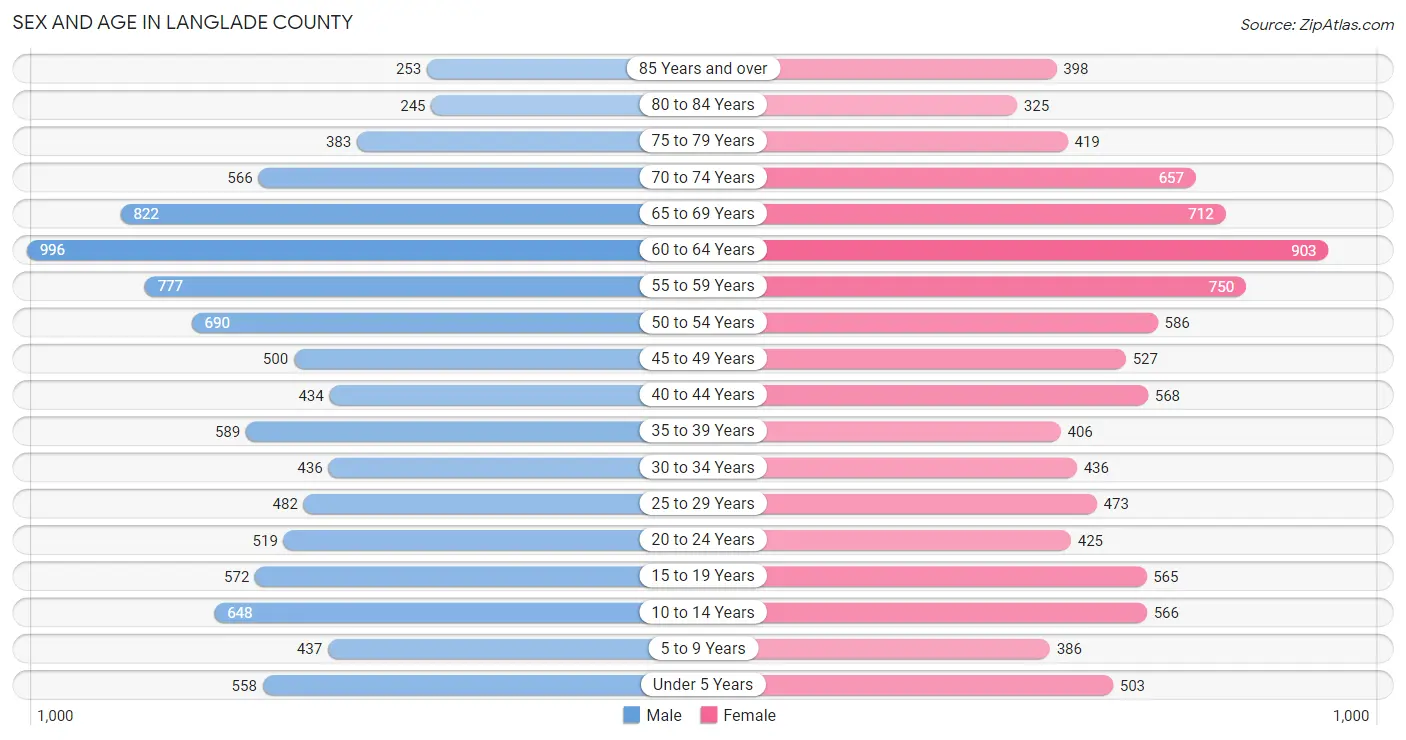
Sex and Age in Langlade County
Sex and Age in Langlade County
The most populous age groups in Langlade County are 60 to 64 Years (996 | 10.1%) for men and 60 to 64 Years (903 | 9.4%) for women.
| Age Bracket | Male | Female |
| Under 5 Years | 558 (5.6%) | 503 (5.2%) |
| 5 to 9 Years | 437 (4.4%) | 386 (4.0%) |
| 10 to 14 Years | 648 (6.5%) | 566 (5.9%) |
| 15 to 19 Years | 572 (5.8%) | 565 (5.9%) |
| 20 to 24 Years | 519 (5.2%) | 425 (4.4%) |
| 25 to 29 Years | 482 (4.9%) | 473 (4.9%) |
| 30 to 34 Years | 436 (4.4%) | 436 (4.5%) |
| 35 to 39 Years | 589 (5.9%) | 406 (4.2%) |
| 40 to 44 Years | 434 (4.4%) | 568 (5.9%) |
| 45 to 49 Years | 500 (5.1%) | 527 (5.5%) |
| 50 to 54 Years | 690 (7.0%) | 586 (6.1%) |
| 55 to 59 Years | 777 (7.8%) | 750 (7.8%) |
| 60 to 64 Years | 996 (10.1%) | 903 (9.4%) |
| 65 to 69 Years | 822 (8.3%) | 712 (7.4%) |
| 70 to 74 Years | 566 (5.7%) | 657 (6.8%) |
| 75 to 79 Years | 383 (3.9%) | 419 (4.4%) |
| 80 to 84 Years | 245 (2.5%) | 325 (3.4%) |
| 85 Years and over | 253 (2.5%) | 398 (4.1%) |
| Total | 9,907 (100.0%) | 9,605 (100.0%) |
Families and Households in Langlade County
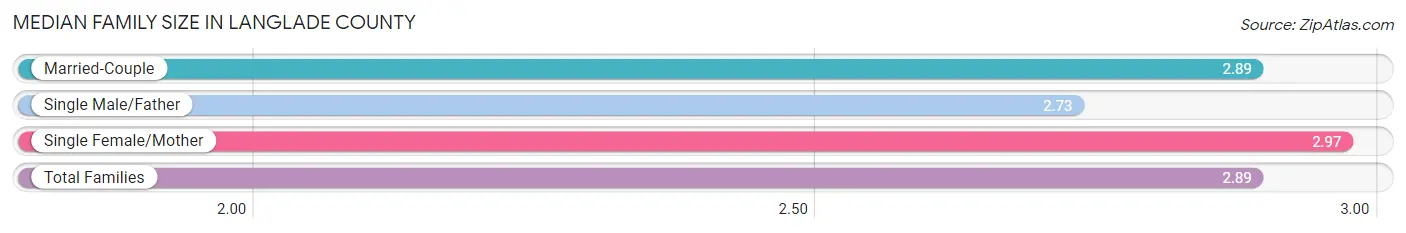
Median Family Size in Langlade County
The median family size in Langlade County is 2.89 persons per family, with single female/mother families (685 | 13.0%) accounting for the largest median family size of 2.97 persons per family. On the other hand, single male/father families (380 | 7.2%) represent the smallest median family size with 2.73 persons per family.
| Family Type | # Families | Family Size |
| Married-Couple | 4,197 (79.8%) | 2.89 |
| Single Male/Father | 380 (7.2%) | 2.73 |
| Single Female/Mother | 685 (13.0%) | 2.97 |
| Total Families | 5,262 (100.0%) | 2.89 |
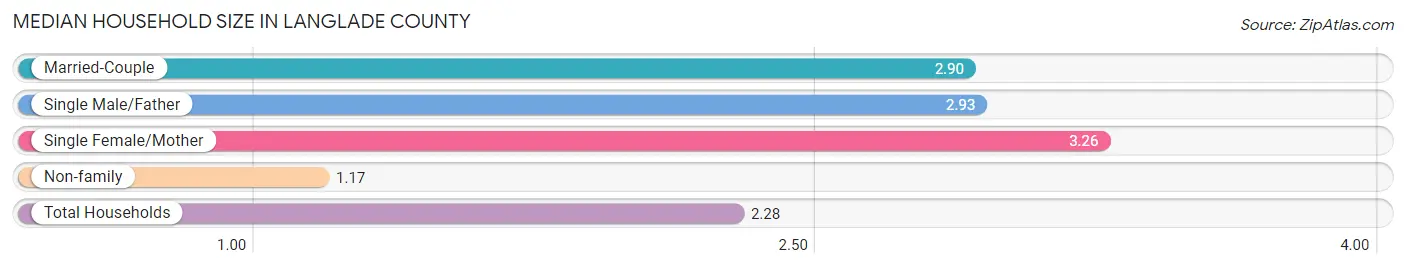
Median Household Size in Langlade County
The median household size in Langlade County is 2.28 persons per household, with single female/mother households (685 | 8.1%) accounting for the largest median household size of 3.26 persons per household. non-family households (3,181 | 37.7%) represent the smallest median household size with 1.17 persons per household.
| Household Type | # Households | Household Size |
| Married-Couple | 4,197 (49.7%) | 2.90 |
| Single Male/Father | 380 (4.5%) | 2.93 |
| Single Female/Mother | 685 (8.1%) | 3.26 |
| Non-family | 3,181 (37.7%) | 1.17 |
| Total Households | 8,443 (100.0%) | 2.28 |
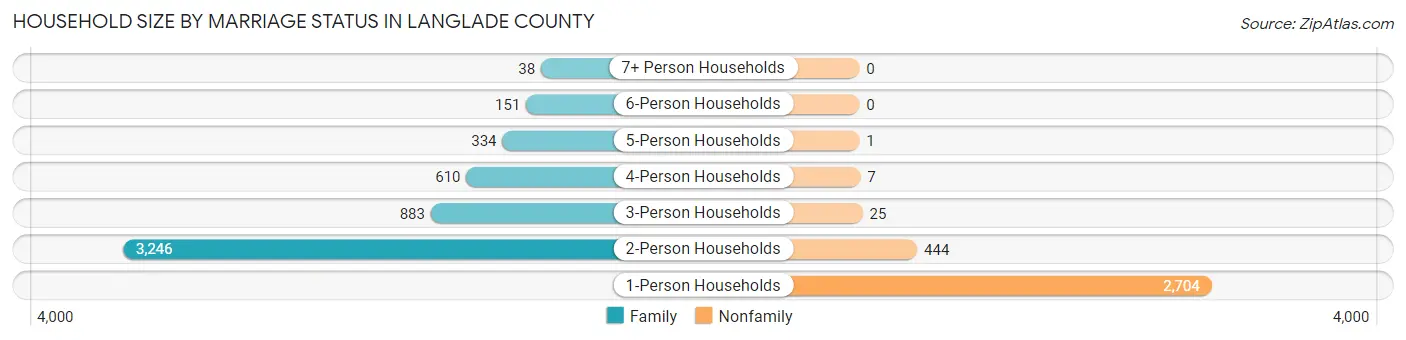
Household Size by Marriage Status in Langlade County
Out of a total of 8,443 households in Langlade County, 5,262 (62.3%) are family households, while 3,181 (37.7%) are nonfamily households. The most numerous type of family households are 2-person households, comprising 3,246, and the most common type of nonfamily households are 1-person households, comprising 2,704.
| Household Size | Family Households | Nonfamily Households |
| 1-Person Households | - | 2,704 (32.0%) |
| 2-Person Households | 3,246 (38.5%) | 444 (5.3%) |
| 3-Person Households | 883 (10.5%) | 25 (0.3%) |
| 4-Person Households | 610 (7.2%) | 7 (0.1%) |
| 5-Person Households | 334 (4.0%) | 1 (0.0%) |
| 6-Person Households | 151 (1.8%) | 0 (0.0%) |
| 7+ Person Households | 38 (0.4%) | 0 (0.0%) |
| Total | 5,262 (62.3%) | 3,181 (37.7%) |
Female Fertility in Langlade County
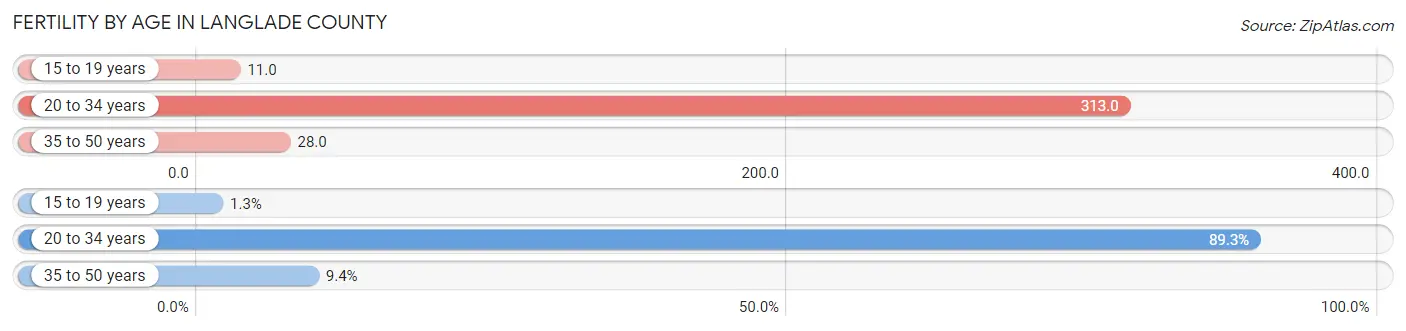
Fertility by Age in Langlade County
Average fertility rate in Langlade County is 134.0 births per 1,000 women. Women in the age bracket of 20 to 34 years have the highest fertility rate with 313.0 births per 1,000 women. Women in the age bracket of 20 to 34 years acount for 89.3% of all women with births.
| Age Bracket | Women with Births | Births / 1,000 Women |
| 15 to 19 years | 6 (1.3%) | 11.0 |
| 20 to 34 years | 418 (89.3%) | 313.0 |
| 35 to 50 years | 44 (9.4%) | 28.0 |
| Total | 468 (100.0%) | 134.0 |
Fertility by Age by Marriage Status in Langlade County
80.8% of women with births (468) in Langlade County are married. The highest percentage of unmarried women with births falls into 15 to 19 years age bracket with 100.0% of them unmarried at the time of birth, while the lowest percentage of unmarried women with births belong to 35 to 50 years age bracket with 11.4% of them unmarried.
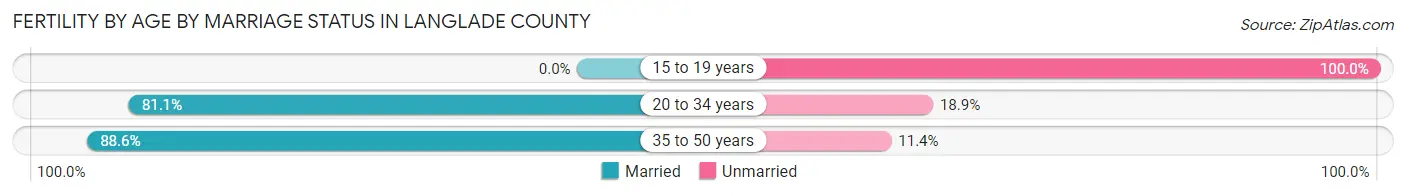
| Age Bracket | Married | Unmarried |
| 15 to 19 years | 0 (0.0%) | 6 (100.0%) |
| 20 to 34 years | 339 (81.1%) | 79 (18.9%) |
| 35 to 50 years | 39 (88.6%) | 5 (11.4%) |
| Total | 378 (80.8%) | 90 (19.2%) |
Fertility by Education in Langlade County
Average fertility rate in Langlade County is 134.0 births per 1,000 women. Women with the education attainment of high school diploma have the highest fertility rate of 188.0 births per 1,000 women, while women with the education attainment of graduate degree have the lowest fertility at 38.0 births per 1,000 women. Women with the education attainment of college or associate's degree represent 42.3% of all women with births.
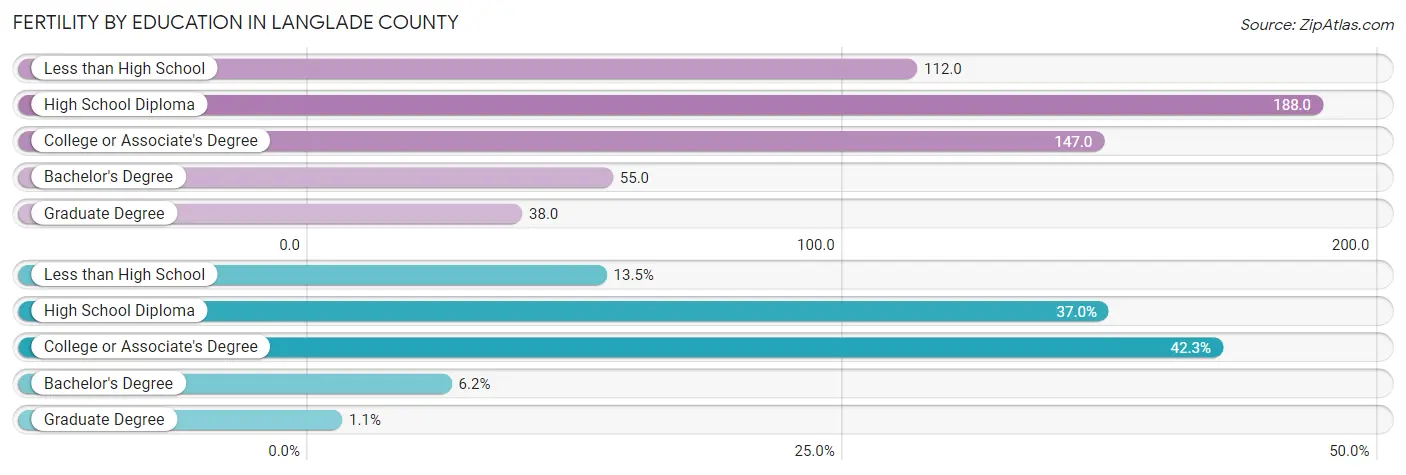
| Educational Attainment | Women with Births | Births / 1,000 Women |
| Less than High School | 63 (13.5%) | 112.0 |
| High School Diploma | 173 (37.0%) | 188.0 |
| College or Associate's Degree | 198 (42.3%) | 147.0 |
| Bachelor's Degree | 29 (6.2%) | 55.0 |
| Graduate Degree | 5 (1.1%) | 38.0 |
| Total | 468 (100.0%) | 134.0 |
Fertility by Education by Marriage Status in Langlade County
19.2% of women with births in Langlade County are unmarried. Women with the educational attainment of bachelor's degree are most likely to be married with 100.0% of them married at childbirth, while women with the educational attainment of less than high school are least likely to be married with 31.8% of them unmarried at childbirth.
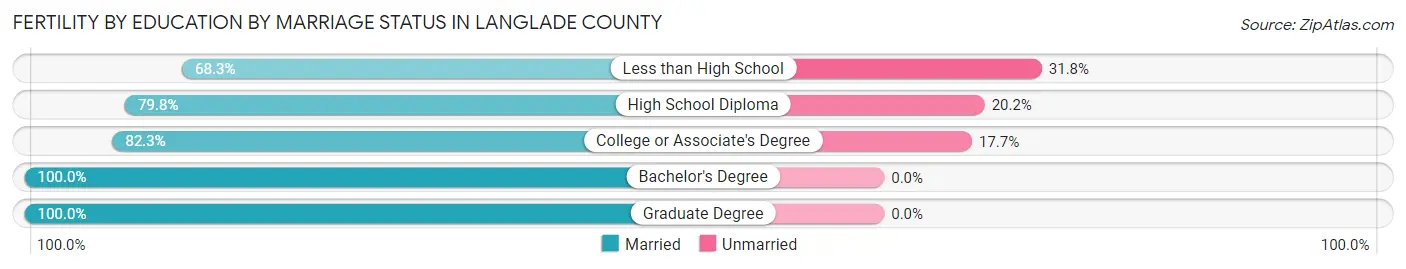
| Educational Attainment | Married | Unmarried |
| Less than High School | 43 (68.2%) | 20 (31.8%) |
| High School Diploma | 138 (79.8%) | 35 (20.2%) |
| College or Associate's Degree | 163 (82.3%) | 35 (17.7%) |
| Bachelor's Degree | 29 (100.0%) | 0 (0.0%) |
| Graduate Degree | 5 (100.0%) | 0 (0.0%) |
| Total | 378 (80.8%) | 90 (19.2%) |
Income in Langlade County
Income Overview in Langlade County
Per Capita Income in Langlade County is $32,989, while median incomes of families and households are $72,459 and $55,091 respectively.
| Characteristic | Number | Measure |
| Per Capita Income | 19,512 | $32,989 |
| Median Family Income | 5,262 | $72,459 |
| Mean Family Income | 5,262 | $89,827 |
| Median Household Income | 8,443 | $55,091 |
| Mean Household Income | 8,443 | $73,590 |
| Income Deficit | 5,262 | $12,165 |
| Wage / Income Gap (%) | 19,512 | 20.55% |
| Wage / Income Gap ($) | 19,512 | 79.45¢ per $1 |
| Gini / Inequality Index | 19,512 | 0.44 |
Earnings by Sex in Langlade County
Average Earnings in Langlade County are $36,742, $39,758 for men and $31,589 for women, a difference of 20.5%.
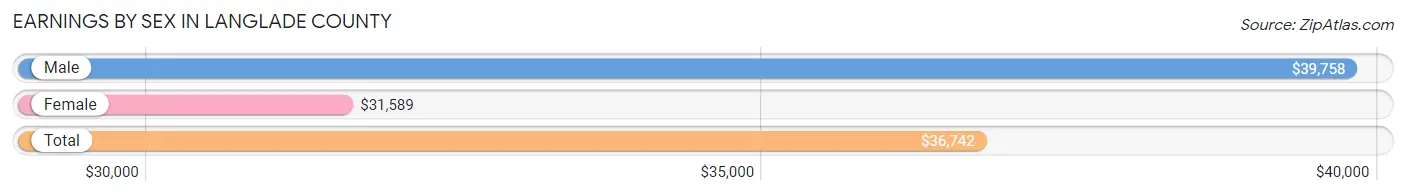
| Sex | Number | Average Earnings |
| Male | 5,252 (53.8%) | $39,758 |
| Female | 4,517 (46.2%) | $31,589 |
| Total | 9,769 (100.0%) | $36,742 |
Earnings by Sex by Income Bracket in Langlade County
The most common earnings brackets in Langlade County are $35,000 to $39,999 for men (503 | 9.6%) and $25,000 to $29,999 for women (372 | 8.2%).
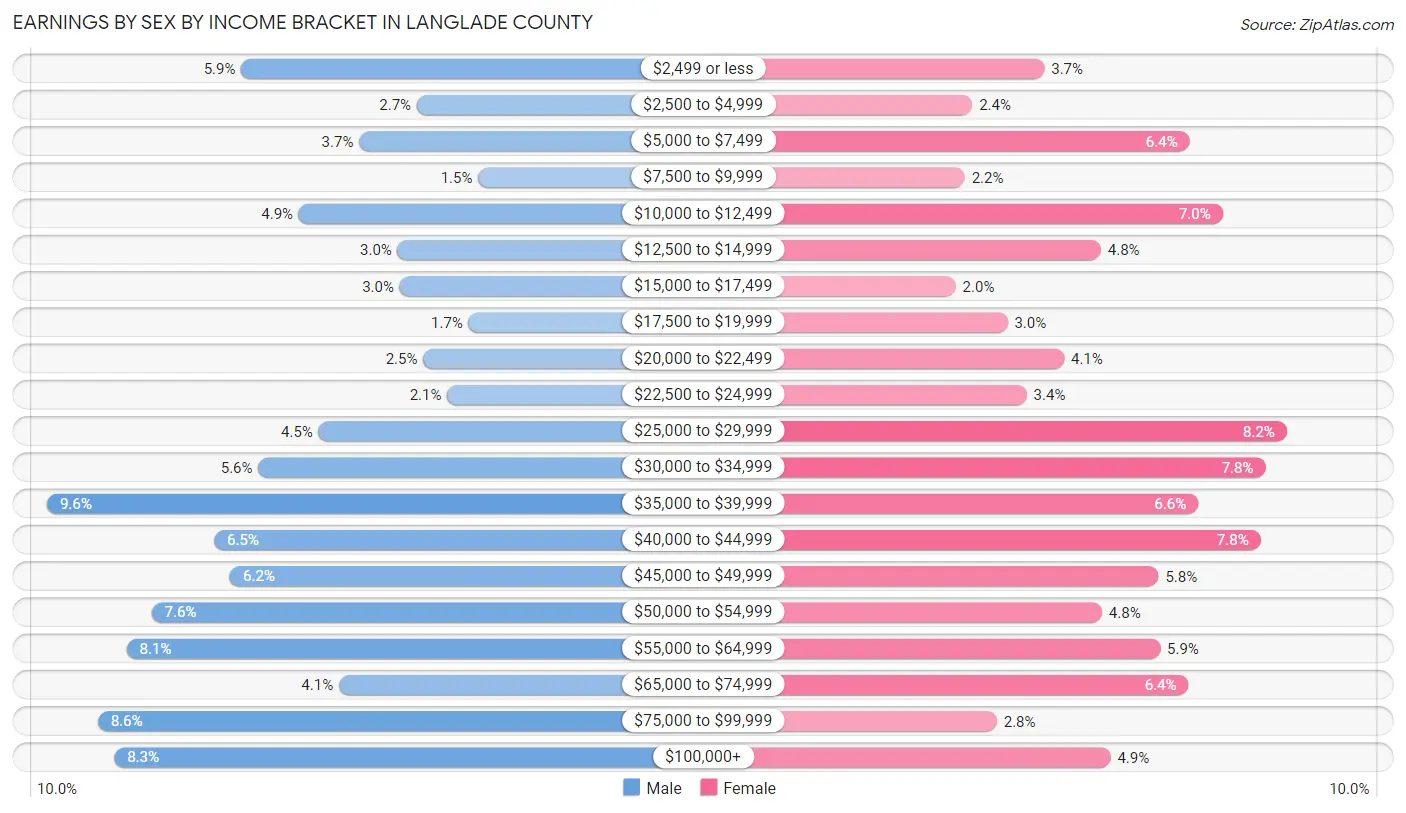
| Income | Male | Female |
| $2,499 or less | 312 (5.9%) | 167 (3.7%) |
| $2,500 to $4,999 | 139 (2.6%) | 106 (2.4%) |
| $5,000 to $7,499 | 196 (3.7%) | 290 (6.4%) |
| $7,500 to $9,999 | 79 (1.5%) | 100 (2.2%) |
| $10,000 to $12,499 | 255 (4.9%) | 318 (7.0%) |
| $12,500 to $14,999 | 158 (3.0%) | 215 (4.8%) |
| $15,000 to $17,499 | 156 (3.0%) | 92 (2.0%) |
| $17,500 to $19,999 | 88 (1.7%) | 136 (3.0%) |
| $20,000 to $22,499 | 133 (2.5%) | 184 (4.1%) |
| $22,500 to $24,999 | 109 (2.1%) | 152 (3.4%) |
| $25,000 to $29,999 | 236 (4.5%) | 372 (8.2%) |
| $30,000 to $34,999 | 295 (5.6%) | 354 (7.8%) |
| $35,000 to $39,999 | 503 (9.6%) | 297 (6.6%) |
| $40,000 to $44,999 | 339 (6.5%) | 350 (7.7%) |
| $45,000 to $49,999 | 323 (6.1%) | 264 (5.8%) |
| $50,000 to $54,999 | 400 (7.6%) | 216 (4.8%) |
| $55,000 to $64,999 | 425 (8.1%) | 265 (5.9%) |
| $65,000 to $74,999 | 216 (4.1%) | 289 (6.4%) |
| $75,000 to $99,999 | 453 (8.6%) | 127 (2.8%) |
| $100,000+ | 437 (8.3%) | 223 (4.9%) |
| Total | 5,252 (100.0%) | 4,517 (100.0%) |
Earnings by Sex by Educational Attainment in Langlade County
Average earnings in Langlade County are $42,319 for men and $35,799 for women, a difference of 15.4%. Men with an educational attainment of graduate degree enjoy the highest average annual earnings of $88,306, while those with less than high school education earn the least with $29,185. Women with an educational attainment of bachelor's degree earn the most with the average annual earnings of $54,621, while those with high school diploma education have the smallest earnings of $29,360.
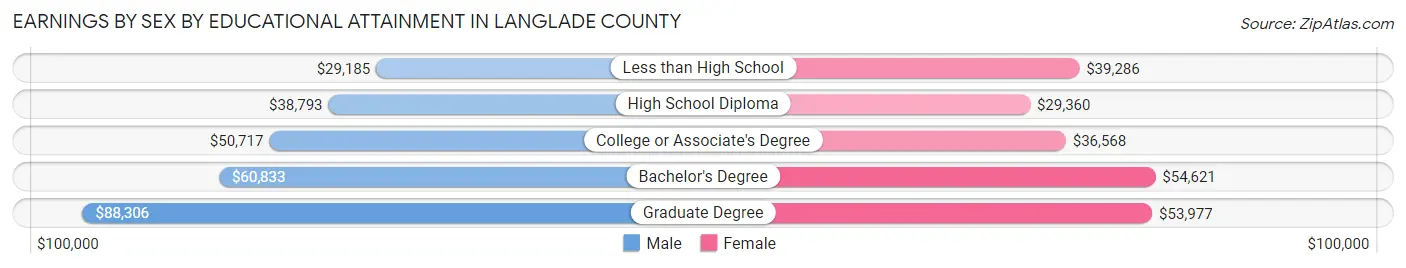
| Educational Attainment | Male Income | Female Income |
| Less than High School | $29,185 | $39,286 |
| High School Diploma | $38,793 | $29,360 |
| College or Associate's Degree | $50,717 | $36,568 |
| Bachelor's Degree | $60,833 | $54,621 |
| Graduate Degree | $88,306 | $53,977 |
| Total | $42,319 | $35,799 |
Family Income in Langlade County
Family Income Brackets in Langlade County
According to the Langlade County family income data, there are 1,184 families falling into the $50,000 to $74,999 income range, which is the most common income bracket and makes up 22.5% of all families. Conversely, the $10,000 to $14,999 income bracket is the least frequent group with only 68 families (1.3%) belonging to this category.
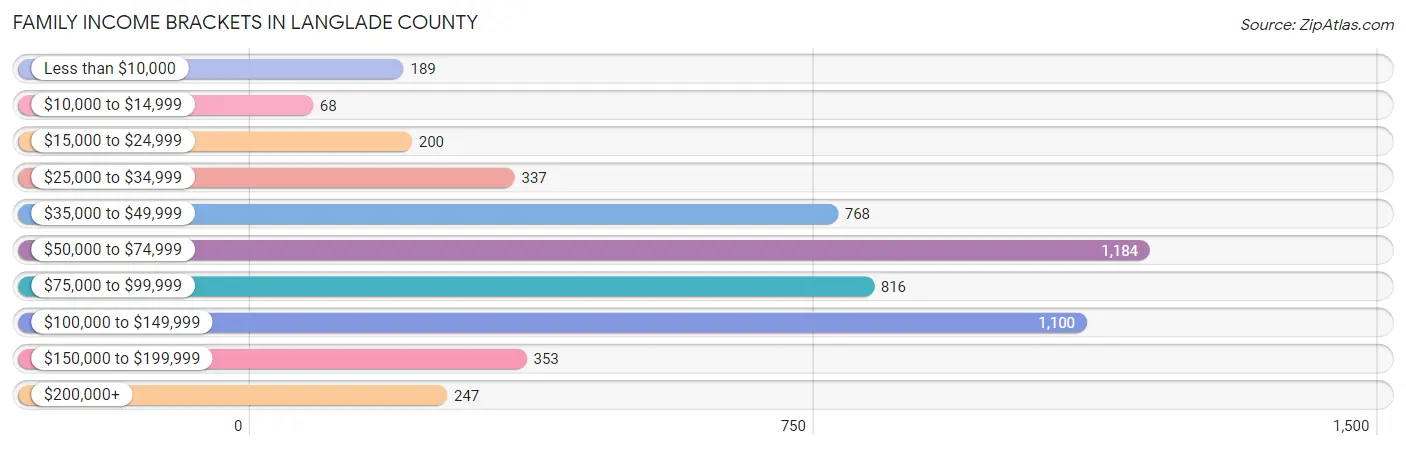
| Income Bracket | # Families | % Families |
| Less than $10,000 | 189 | 3.6% |
| $10,000 to $14,999 | 68 | 1.3% |
| $15,000 to $24,999 | 200 | 3.8% |
| $25,000 to $34,999 | 337 | 6.4% |
| $35,000 to $49,999 | 768 | 14.6% |
| $50,000 to $74,999 | 1,184 | 22.5% |
| $75,000 to $99,999 | 816 | 15.5% |
| $100,000 to $149,999 | 1,100 | 20.9% |
| $150,000 to $199,999 | 353 | 6.7% |
| $200,000+ | 247 | 4.7% |
Family Income by Famaliy Size in Langlade County
4-person families (532 | 10.1%) account for the highest median family income in Langlade County with $103,571 per family, while 2-person families (3,400 | 64.6%) have the highest median income of $33,872 per family member.
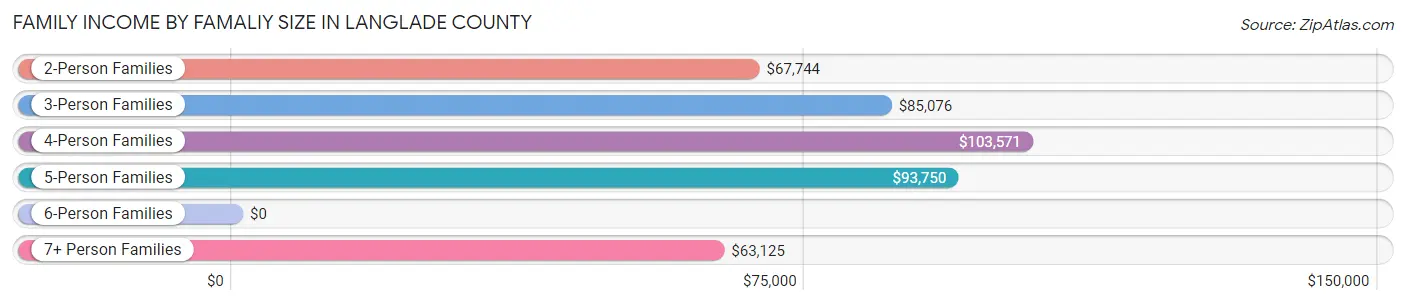
| Income Bracket | # Families | Median Income |
| 2-Person Families | 3,400 (64.6%) | $67,744 |
| 3-Person Families | 824 (15.7%) | $85,076 |
| 4-Person Families | 532 (10.1%) | $103,571 |
| 5-Person Families | 349 (6.6%) | $93,750 |
| 6-Person Families | 124 (2.4%) | $0 |
| 7+ Person Families | 33 (0.6%) | $63,125 |
| Total | 5,262 (100.0%) | $72,459 |
Family Income by Number of Earners in Langlade County
The median family income in Langlade County is $72,459, with families comprising 3+ earners (395) having the highest median family income of $119,750, while families with no earners (1,157) have the lowest median family income of $47,688, accounting for 7.5% and 22.0% of families, respectively.
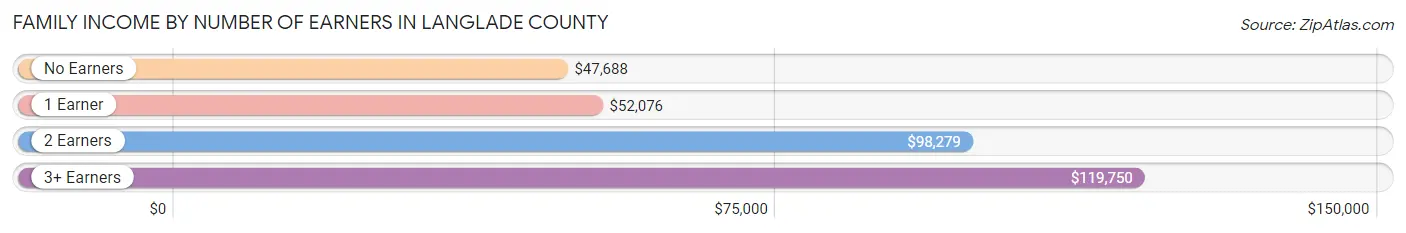
| Number of Earners | # Families | Median Income |
| No Earners | 1,157 (22.0%) | $47,688 |
| 1 Earner | 1,676 (31.9%) | $52,076 |
| 2 Earners | 2,034 (38.7%) | $98,279 |
| 3+ Earners | 395 (7.5%) | $119,750 |
| Total | 5,262 (100.0%) | $72,459 |
Household Income in Langlade County
Household Income Brackets in Langlade County
With 1,697 households falling in the category, the $50,000 to $74,999 income range is the most frequent in Langlade County, accounting for 20.1% of all households. In contrast, only 279 households (3.3%) fall into the $200,000+ income bracket, making it the least populous group.
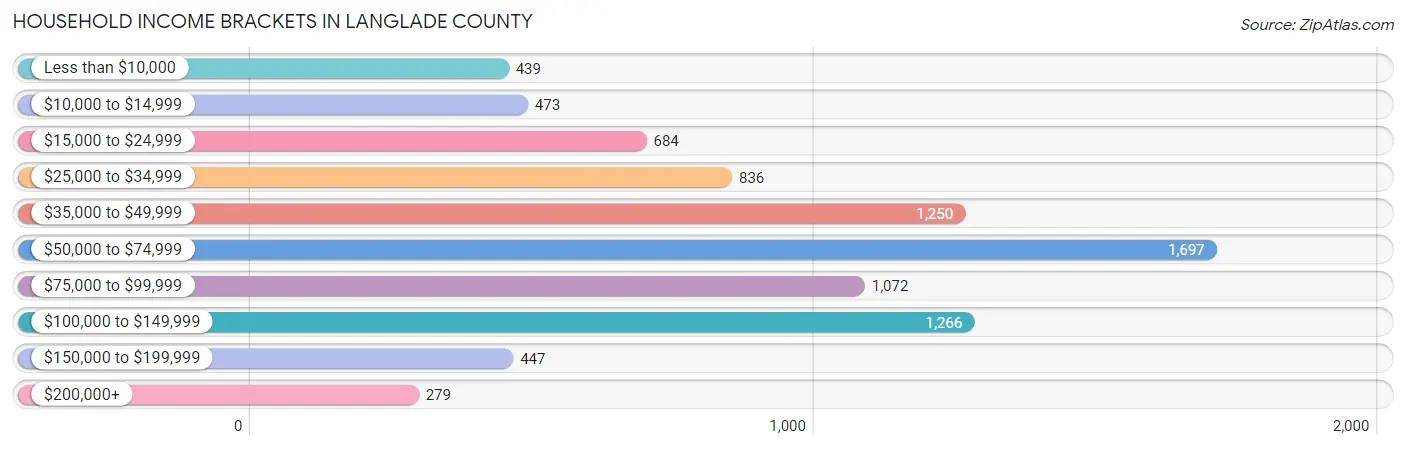
| Income Bracket | # Households | % Households |
| Less than $10,000 | 439 | 5.2% |
| $10,000 to $14,999 | 473 | 5.6% |
| $15,000 to $24,999 | 684 | 8.1% |
| $25,000 to $34,999 | 836 | 9.9% |
| $35,000 to $49,999 | 1,250 | 14.8% |
| $50,000 to $74,999 | 1,697 | 20.1% |
| $75,000 to $99,999 | 1,072 | 12.7% |
| $100,000 to $149,999 | 1,266 | 15.0% |
| $150,000 to $199,999 | 447 | 5.3% |
| $200,000+ | 279 | 3.3% |
Household Income by Householder Age in Langlade County
The median household income in Langlade County is $55,091, with the highest median household income of $71,523 found in the 25 to 44 years age bracket for the primary householder. A total of 1,821 households (21.6%) fall into this category. Meanwhile, the 65+ years age bracket for the primary householder has the lowest median household income of $41,596, with 3,126 households (37.0%) in this group.
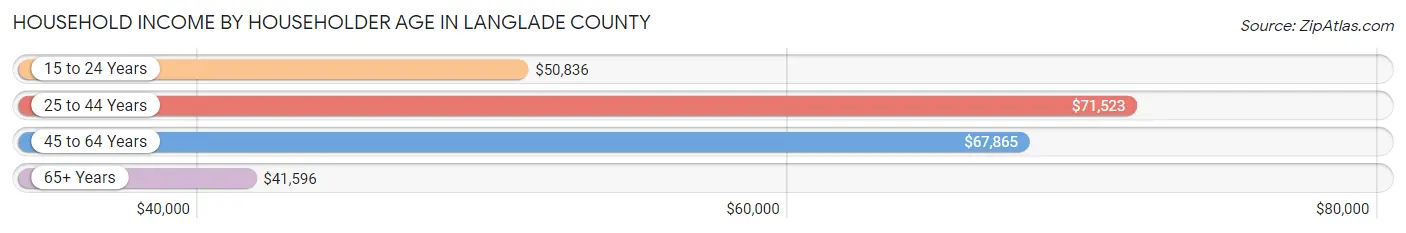
| Income Bracket | # Households | Median Income |
| 15 to 24 Years | 263 (3.1%) | $50,836 |
| 25 to 44 Years | 1,821 (21.6%) | $71,523 |
| 45 to 64 Years | 3,233 (38.3%) | $67,865 |
| 65+ Years | 3,126 (37.0%) | $41,596 |
| Total | 8,443 (100.0%) | $55,091 |
Poverty in Langlade County
Income Below Poverty by Sex and Age in Langlade County
With 10.9% poverty level for males and 13.6% for females among the residents of Langlade County, 16 and 17 year old males and 18 to 24 year old females are the most vulnerable to poverty, with 68 males (25.7%) and 220 females (33.6%) in their respective age groups living below the poverty level.
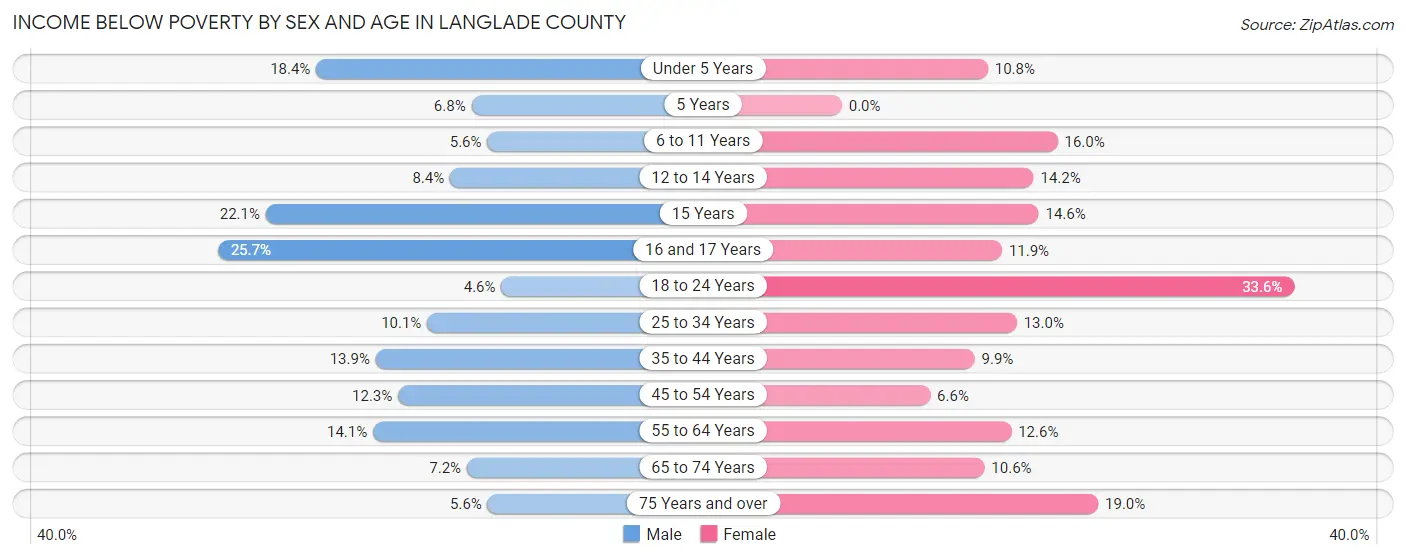
| Age Bracket | Male | Female |
| Under 5 Years | 100 (18.3%) | 54 (10.8%) |
| 5 Years | 3 (6.8%) | 0 (0.0%) |
| 6 to 11 Years | 31 (5.6%) | 91 (16.0%) |
| 12 to 14 Years | 38 (8.4%) | 43 (14.2%) |
| 15 Years | 19 (22.1%) | 13 (14.6%) |
| 16 and 17 Years | 68 (25.7%) | 29 (11.9%) |
| 18 to 24 Years | 33 (4.6%) | 220 (33.6%) |
| 25 to 34 Years | 91 (10.1%) | 117 (13.0%) |
| 35 to 44 Years | 138 (13.9%) | 96 (9.9%) |
| 45 to 54 Years | 145 (12.3%) | 73 (6.6%) |
| 55 to 64 Years | 250 (14.1%) | 207 (12.6%) |
| 65 to 74 Years | 99 (7.2%) | 145 (10.6%) |
| 75 Years and over | 49 (5.6%) | 205 (19.0%) |
| Total | 1,064 (10.9%) | 1,293 (13.6%) |
Income Above Poverty by Sex and Age in Langlade County
According to the poverty statistics in Langlade County, males aged 18 to 24 years and females aged 5 years are the age groups that are most secure financially, with 95.4% of males and 100.0% of females in these age groups living above the poverty line.
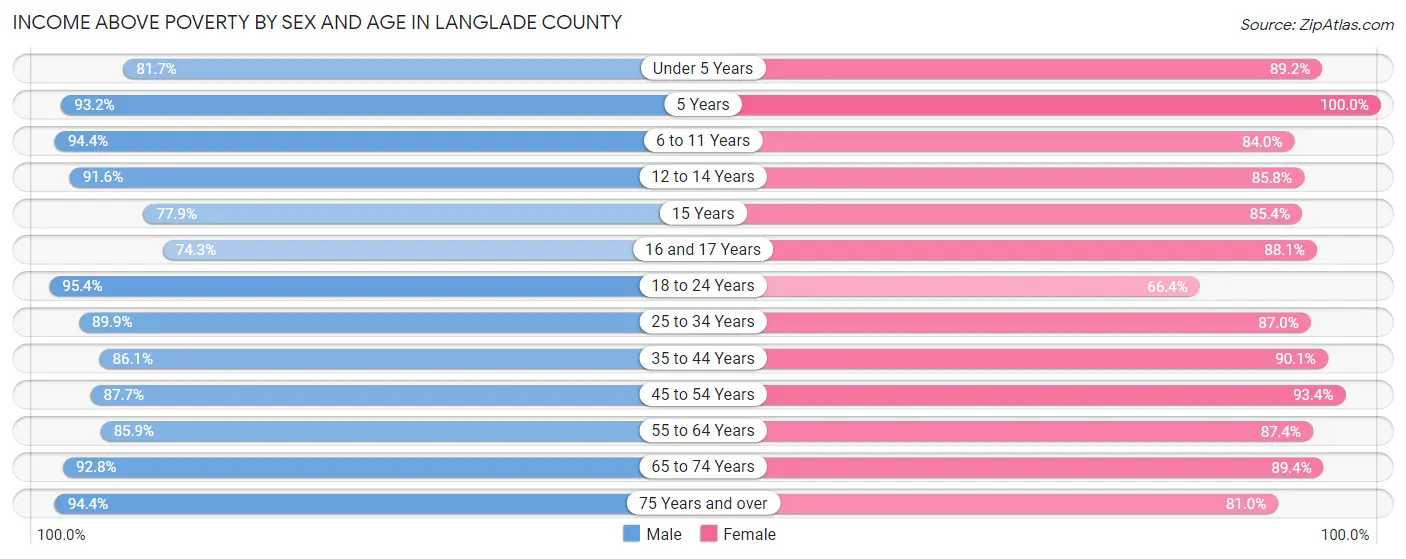
| Age Bracket | Male | Female |
| Under 5 Years | 445 (81.7%) | 444 (89.2%) |
| 5 Years | 41 (93.2%) | 64 (100.0%) |
| 6 to 11 Years | 519 (94.4%) | 477 (84.0%) |
| 12 to 14 Years | 414 (91.6%) | 259 (85.8%) |
| 15 Years | 67 (77.9%) | 76 (85.4%) |
| 16 and 17 Years | 197 (74.3%) | 215 (88.1%) |
| 18 to 24 Years | 685 (95.4%) | 435 (66.4%) |
| 25 to 34 Years | 809 (89.9%) | 784 (87.0%) |
| 35 to 44 Years | 853 (86.1%) | 878 (90.1%) |
| 45 to 54 Years | 1,037 (87.7%) | 1,040 (93.4%) |
| 55 to 64 Years | 1,519 (85.9%) | 1,438 (87.4%) |
| 65 to 74 Years | 1,284 (92.8%) | 1,224 (89.4%) |
| 75 Years and over | 823 (94.4%) | 872 (81.0%) |
| Total | 8,693 (89.1%) | 8,206 (86.4%) |
Income Below Poverty Among Married-Couple Families in Langlade County
The poverty statistics for married-couple families in Langlade County show that 3.9% or 164 of the total 4,197 families live below the poverty line. Families with 3 or 4 children have the highest poverty rate of 10.2%, comprising of 30 families. On the other hand, families with 5 or more children have the lowest poverty rate of 0.0%, which includes 0 families.
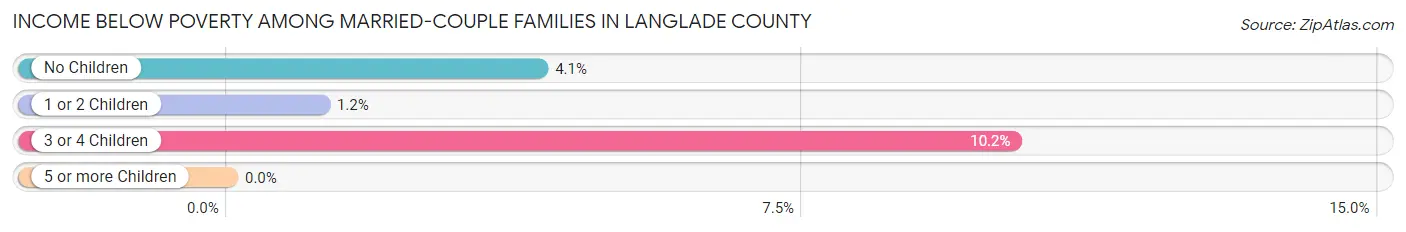
| Children | Above Poverty | Below Poverty |
| No Children | 2,937 (96.0%) | 124 (4.1%) |
| 1 or 2 Children | 824 (98.8%) | 10 (1.2%) |
| 3 or 4 Children | 263 (89.8%) | 30 (10.2%) |
| 5 or more Children | 9 (100.0%) | 0 (0.0%) |
| Total | 4,033 (96.1%) | 164 (3.9%) |
Income Below Poverty Among Single-Parent Households in Langlade County
According to the poverty data in Langlade County, 14.2% or 54 single-father households and 23.1% or 158 single-mother households are living below the poverty line. Among single-father households, those with 5 or more children have the highest poverty rate, with 2 households (100.0%) experiencing poverty. Likewise, among single-mother households, those with 5 or more children have the highest poverty rate, with 10 households (100.0%) falling below the poverty line.
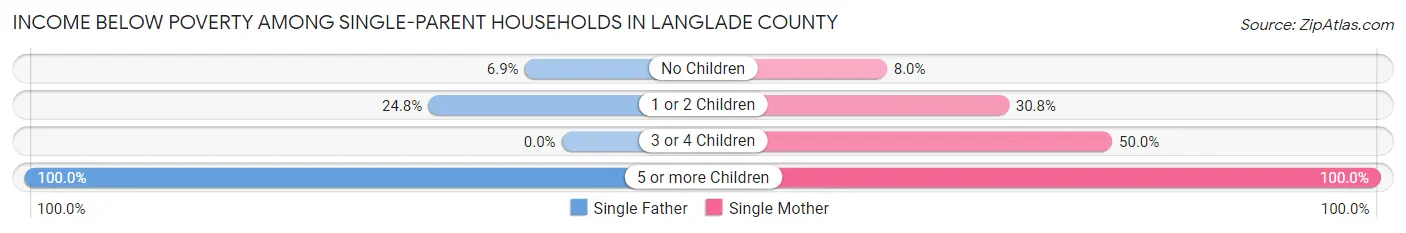
| Children | Single Father | Single Mother |
| No Children | 14 (6.9%) | 22 (8.0%) |
| 1 or 2 Children | 38 (24.8%) | 119 (30.7%) |
| 3 or 4 Children | 0 (0.0%) | 7 (50.0%) |
| 5 or more Children | 2 (100.0%) | 10 (100.0%) |
| Total | 54 (14.2%) | 158 (23.1%) |
Income Below Poverty Among Married-Couple vs Single-Parent Households in Langlade County
The poverty data for Langlade County shows that 164 of the married-couple family households (3.9%) and 212 of the single-parent households (19.9%) are living below the poverty level. Within the married-couple family households, those with 3 or 4 children have the highest poverty rate, with 30 households (10.2%) falling below the poverty line. Among the single-parent households, those with 5 or more children have the highest poverty rate, with 12 household (100.0%) living below poverty.
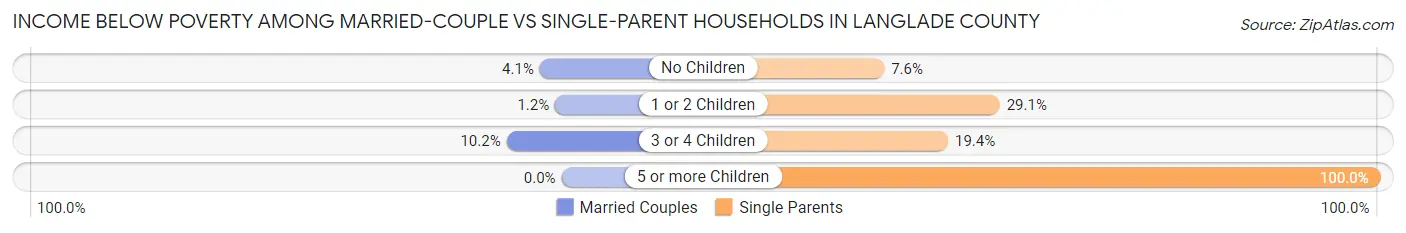
| Children | Married-Couple Families | Single-Parent Households |
| No Children | 124 (4.1%) | 36 (7.5%) |
| 1 or 2 Children | 10 (1.2%) | 157 (29.1%) |
| 3 or 4 Children | 30 (10.2%) | 7 (19.4%) |
| 5 or more Children | 0 (0.0%) | 12 (100.0%) |
| Total | 164 (3.9%) | 212 (19.9%) |
Employment Characteristics in Langlade County
Employment by Class of Employer in Langlade County
Among the 8,688 employed individuals in Langlade County, private company employees (6,214 | 71.5%), self-employed (not incorporated) (635 | 7.3%), and local government employees (605 | 7.0%) make up the most common classes of employment.
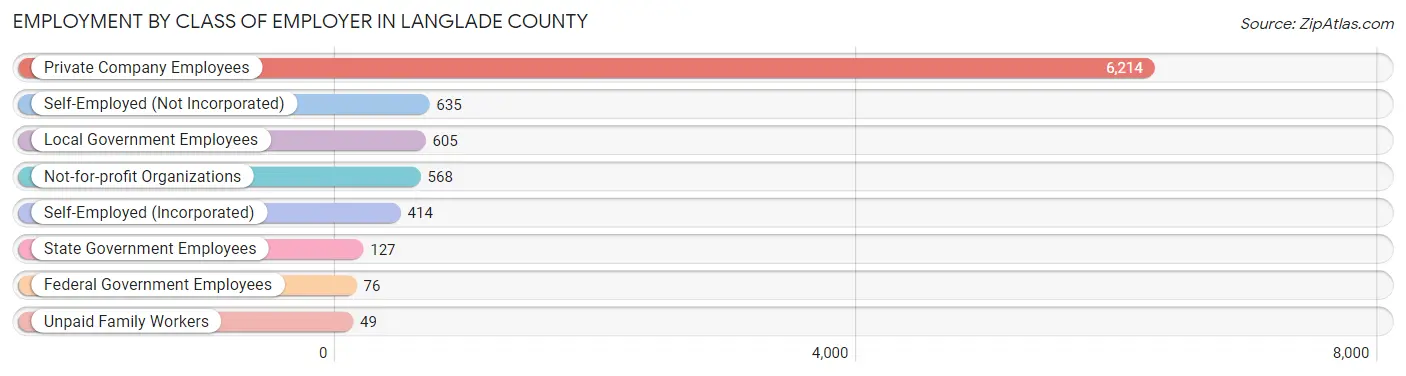
| Employer Class | # Employees | % Employees |
| Private Company Employees | 6,214 | 71.5% |
| Self-Employed (Incorporated) | 414 | 4.8% |
| Self-Employed (Not Incorporated) | 635 | 7.3% |
| Not-for-profit Organizations | 568 | 6.5% |
| Local Government Employees | 605 | 7.0% |
| State Government Employees | 127 | 1.5% |
| Federal Government Employees | 76 | 0.9% |
| Unpaid Family Workers | 49 | 0.6% |
| Total | 8,688 | 100.0% |
Employment Status by Age in Langlade County
According to the labor force statistics for Langlade County, out of the total population over 16 years of age (16,238), 57.9% or 9,402 individuals are in the labor force, with 4.9% or 461 of them unemployed. The age group with the highest labor force participation rate is 20 to 24 years, with 89.3% or 843 individuals in the labor force. Within the labor force, the 25 to 29 years age range has the highest percentage of unemployed individuals, with 9.0% or 57 of them being unemployed.
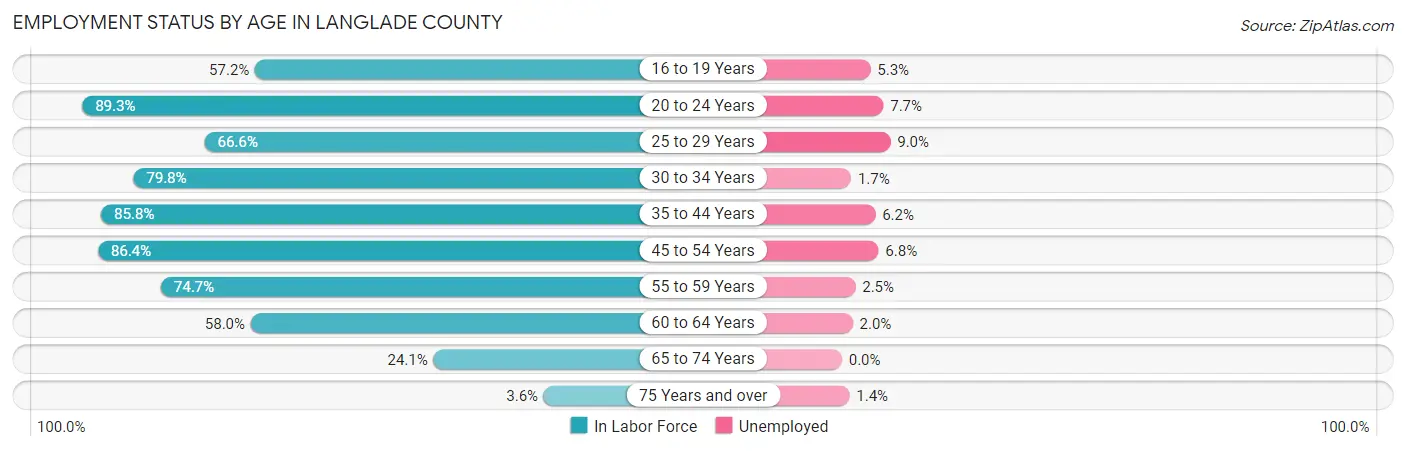
| Age Bracket | In Labor Force | Unemployed |
| 16 to 19 Years | 550 (57.2%) | 29 (5.3%) |
| 20 to 24 Years | 843 (89.3%) | 65 (7.7%) |
| 25 to 29 Years | 636 (66.6%) | 57 (9.0%) |
| 30 to 34 Years | 696 (79.8%) | 12 (1.7%) |
| 35 to 44 Years | 1,713 (85.8%) | 106 (6.2%) |
| 45 to 54 Years | 1,990 (86.4%) | 135 (6.8%) |
| 55 to 59 Years | 1,141 (74.7%) | 29 (2.5%) |
| 60 to 64 Years | 1,101 (58.0%) | 22 (2.0%) |
| 65 to 74 Years | 664 (24.1%) | 0 (0.0%) |
| 75 Years and over | 73 (3.6%) | 1 (1.4%) |
| Total | 9,402 (57.9%) | 461 (4.9%) |
Employment Status by Educational Attainment in Langlade County
According to labor force statistics for Langlade County, 76.2% of individuals (7,279) out of the total population between 25 and 64 years of age (9,553) are in the labor force, with 5.0% or 364 of them being unemployed. The group with the highest labor force participation rate are those with the educational attainment of bachelor's degree or higher, with 83.2% or 1,345 individuals in the labor force. Within the labor force, individuals with less than high school education have the highest percentage of unemployment, with 15.1% or 95 of them being unemployed.
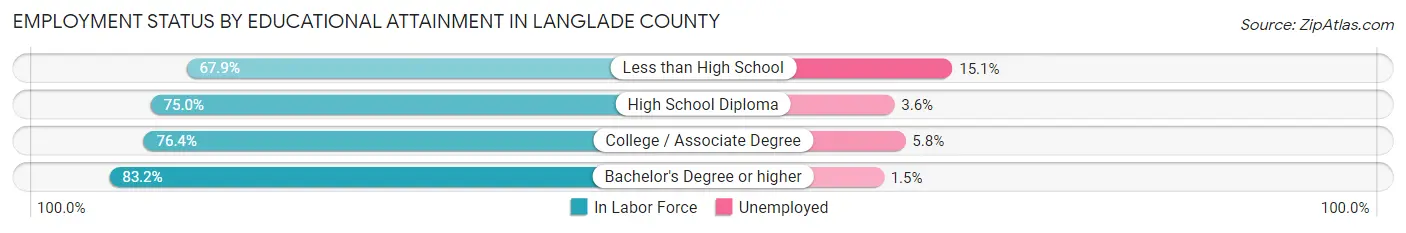
| Educational Attainment | In Labor Force | Unemployed |
| Less than High School | 629 (67.9%) | 140 (15.1%) |
| High School Diploma | 2,748 (75.0%) | 132 (3.6%) |
| College / Associate Degree | 2,556 (76.4%) | 194 (5.8%) |
| Bachelor's Degree or higher | 1,345 (83.2%) | 24 (1.5%) |
| Total | 7,279 (76.2%) | 478 (5.0%) |
Employment Occupations by Sex in Langlade County
Management, Business, Science and Arts Occupations
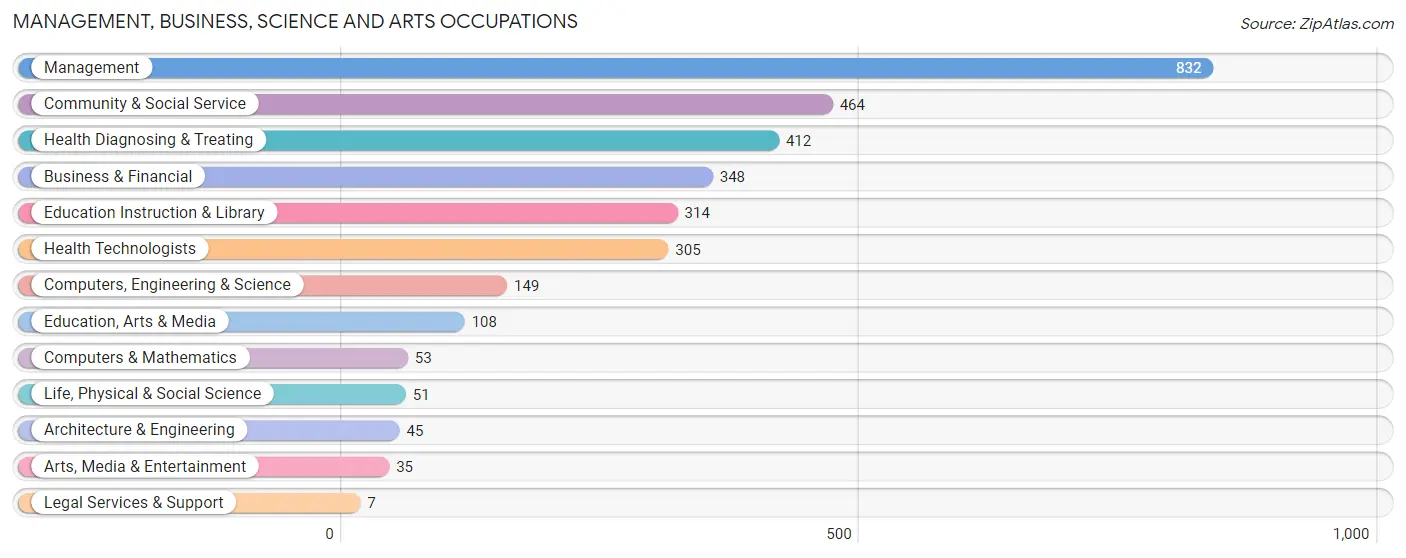
The most common Management, Business, Science and Arts occupations in Langlade County are Management (832 | 9.3%), Community & Social Service (464 | 5.2%), Health Diagnosing & Treating (412 | 4.6%), Business & Financial (348 | 3.9%), and Education Instruction & Library (314 | 3.5%).
Management, Business, Science and Arts Occupations by Sex
Within the Management, Business, Science and Arts occupations in Langlade County, the most male-oriented occupations are Architecture & Engineering (88.9%), Computers & Mathematics (83.0%), and Computers, Engineering & Science (78.5%), while the most female-oriented occupations are Education Instruction & Library (86.3%), Health Diagnosing & Treating (84.0%), and Health Technologists (83.9%).
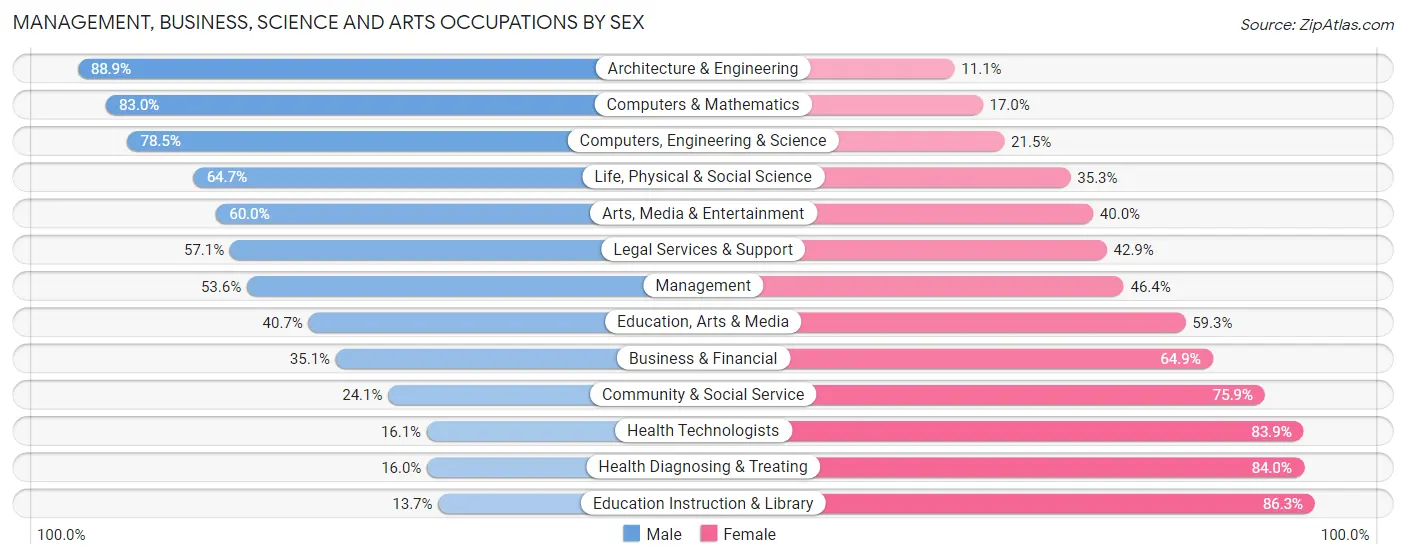
| Occupation | Male | Female |
| Management | 446 (53.6%) | 386 (46.4%) |
| Business & Financial | 122 (35.1%) | 226 (64.9%) |
| Computers, Engineering & Science | 117 (78.5%) | 32 (21.5%) |
| Computers & Mathematics | 44 (83.0%) | 9 (17.0%) |
| Architecture & Engineering | 40 (88.9%) | 5 (11.1%) |
| Life, Physical & Social Science | 33 (64.7%) | 18 (35.3%) |
| Community & Social Service | 112 (24.1%) | 352 (75.9%) |
| Education, Arts & Media | 44 (40.7%) | 64 (59.3%) |
| Legal Services & Support | 4 (57.1%) | 3 (42.9%) |
| Education Instruction & Library | 43 (13.7%) | 271 (86.3%) |
| Arts, Media & Entertainment | 21 (60.0%) | 14 (40.0%) |
| Health Diagnosing & Treating | 66 (16.0%) | 346 (84.0%) |
| Health Technologists | 49 (16.1%) | 256 (83.9%) |
| Total (Category) | 863 (39.1%) | 1,342 (60.9%) |
| Total (Overall) | 4,817 (53.8%) | 4,131 (46.2%) |
Services Occupations
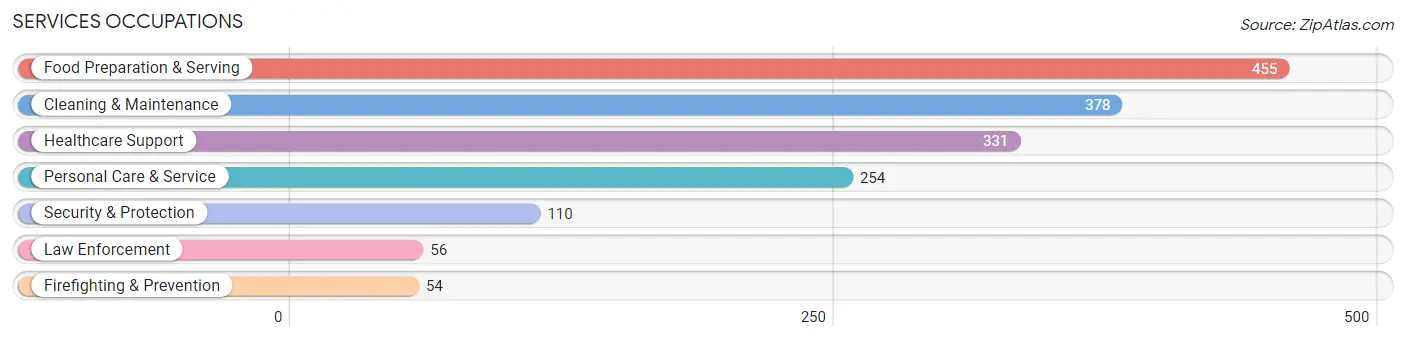
The most common Services occupations in Langlade County are Food Preparation & Serving (455 | 5.1%), Cleaning & Maintenance (378 | 4.2%), Healthcare Support (331 | 3.7%), Personal Care & Service (254 | 2.8%), and Security & Protection (110 | 1.2%).
Services Occupations by Sex
Within the Services occupations in Langlade County, the most male-oriented occupations are Law Enforcement (82.1%), Cleaning & Maintenance (80.7%), and Security & Protection (62.7%), while the most female-oriented occupations are Personal Care & Service (95.7%), Healthcare Support (93.7%), and Firefighting & Prevention (57.4%).
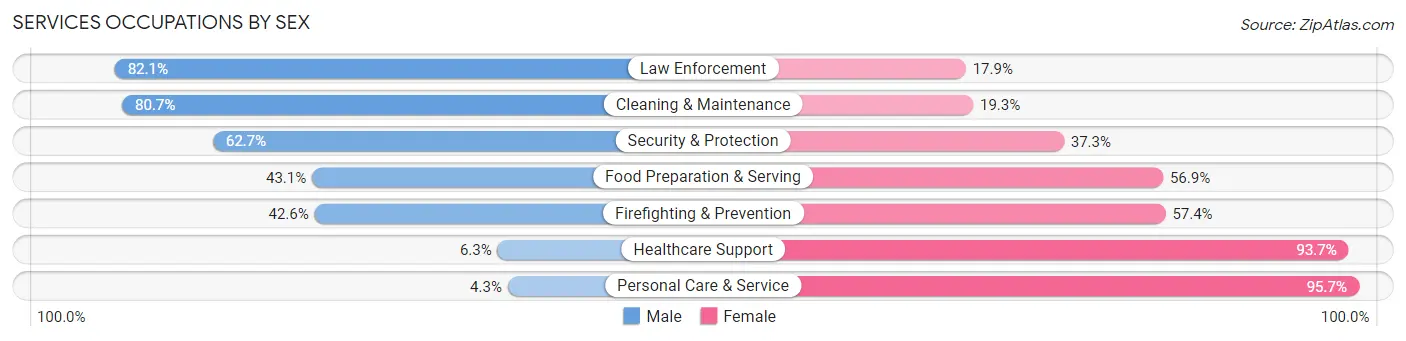
| Occupation | Male | Female |
| Healthcare Support | 21 (6.3%) | 310 (93.7%) |
| Security & Protection | 69 (62.7%) | 41 (37.3%) |
| Firefighting & Prevention | 23 (42.6%) | 31 (57.4%) |
| Law Enforcement | 46 (82.1%) | 10 (17.9%) |
| Food Preparation & Serving | 196 (43.1%) | 259 (56.9%) |
| Cleaning & Maintenance | 305 (80.7%) | 73 (19.3%) |
| Personal Care & Service | 11 (4.3%) | 243 (95.7%) |
| Total (Category) | 602 (39.4%) | 926 (60.6%) |
| Total (Overall) | 4,817 (53.8%) | 4,131 (46.2%) |
Sales and Office Occupations
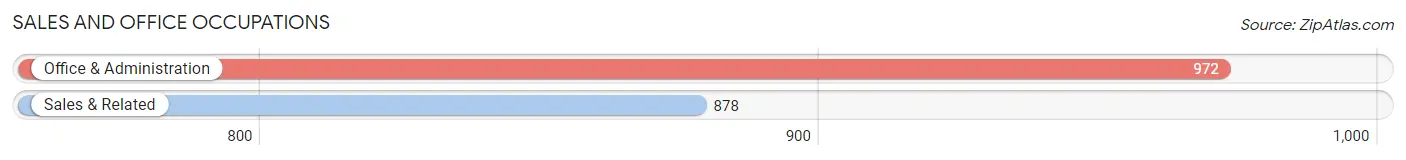
The most common Sales and Office occupations in Langlade County are Office & Administration (972 | 10.9%), and Sales & Related (878 | 9.8%).
Sales and Office Occupations by Sex

| Occupation | Male | Female |
| Sales & Related | 455 (51.8%) | 423 (48.2%) |
| Office & Administration | 172 (17.7%) | 800 (82.3%) |
| Total (Category) | 627 (33.9%) | 1,223 (66.1%) |
| Total (Overall) | 4,817 (53.8%) | 4,131 (46.2%) |
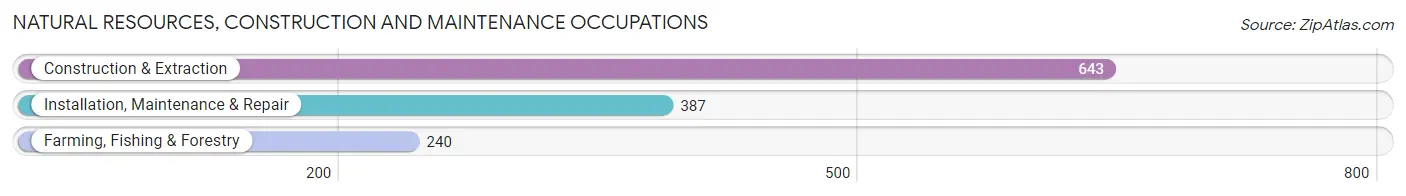
Natural Resources, Construction and Maintenance Occupations
The most common Natural Resources, Construction and Maintenance occupations in Langlade County are Construction & Extraction (643 | 7.2%), Installation, Maintenance & Repair (387 | 4.3%), and Farming, Fishing & Forestry (240 | 2.7%).
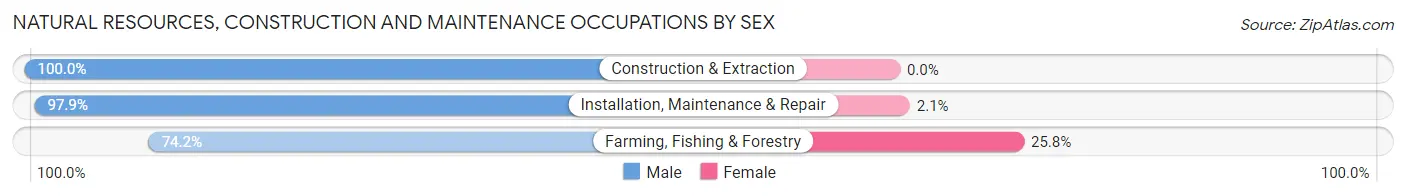
Natural Resources, Construction and Maintenance Occupations by Sex
| Occupation | Male | Female |
| Farming, Fishing & Forestry | 178 (74.2%) | 62 (25.8%) |
| Construction & Extraction | 643 (100.0%) | 0 (0.0%) |
| Installation, Maintenance & Repair | 379 (97.9%) | 8 (2.1%) |
| Total (Category) | 1,200 (94.5%) | 70 (5.5%) |
| Total (Overall) | 4,817 (53.8%) | 4,131 (46.2%) |
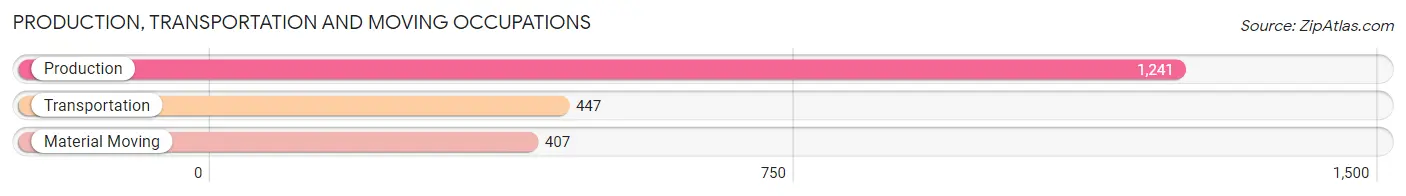
Production, Transportation and Moving Occupations
The most common Production, Transportation and Moving occupations in Langlade County are Production (1,241 | 13.9%), Transportation (447 | 5.0%), and Material Moving (407 | 4.5%).
Production, Transportation and Moving Occupations by Sex

| Occupation | Male | Female |
| Production | 862 (69.5%) | 379 (30.5%) |
| Transportation | 423 (94.6%) | 24 (5.4%) |
| Material Moving | 240 (59.0%) | 167 (41.0%) |
| Total (Category) | 1,525 (72.8%) | 570 (27.2%) |
| Total (Overall) | 4,817 (53.8%) | 4,131 (46.2%) |
Employment Industries by Sex in Langlade County
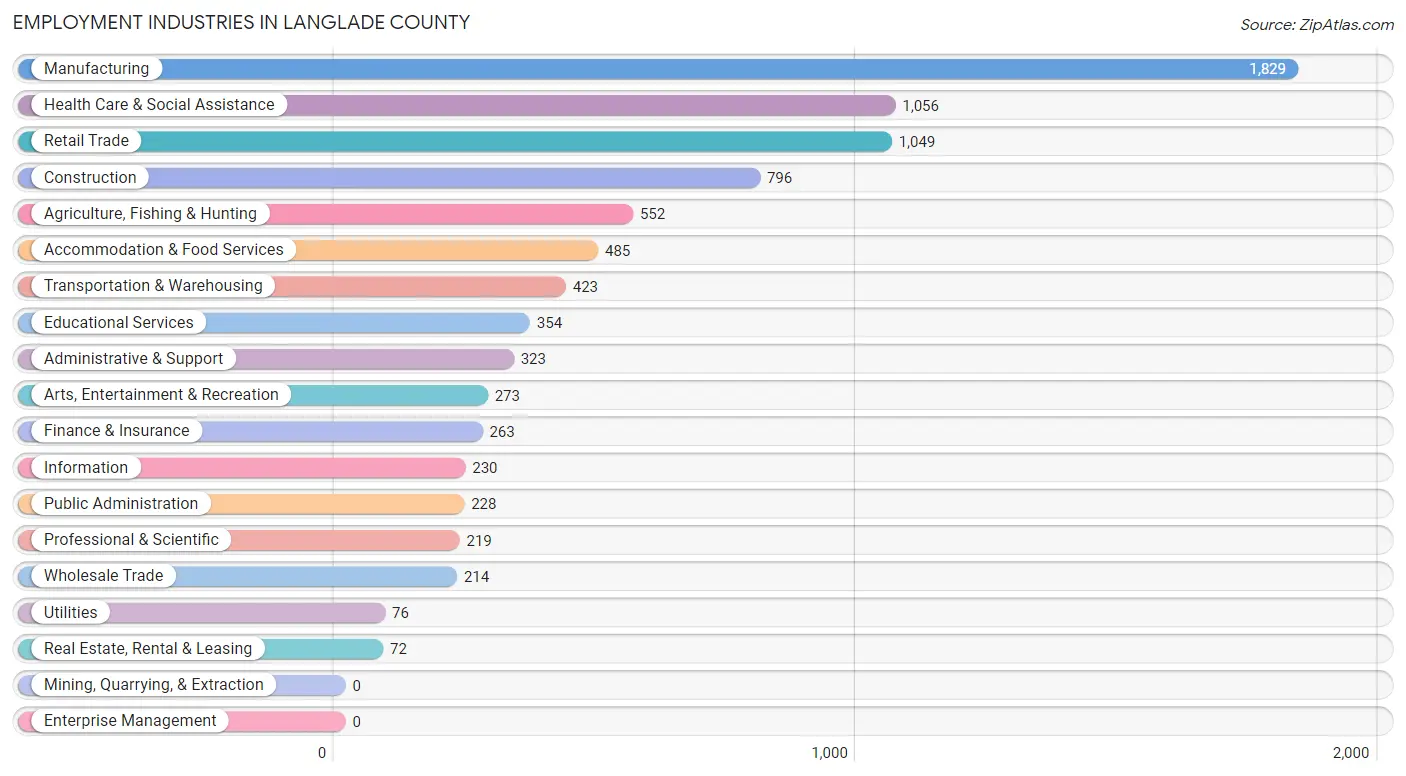
Employment Industries in Langlade County
The major employment industries in Langlade County include Manufacturing (1,829 | 20.4%), Health Care & Social Assistance (1,056 | 11.8%), Retail Trade (1,049 | 11.7%), Construction (796 | 8.9%), and Agriculture, Fishing & Hunting (552 | 6.2%).
Employment Industries by Sex in Langlade County
The Langlade County industries that see more men than women are Utilities (96.1%), Construction (93.0%), and Wholesale Trade (77.6%), whereas the industries that tend to have a higher number of women are Health Care & Social Assistance (81.6%), Educational Services (80.5%), and Finance & Insurance (70.0%).
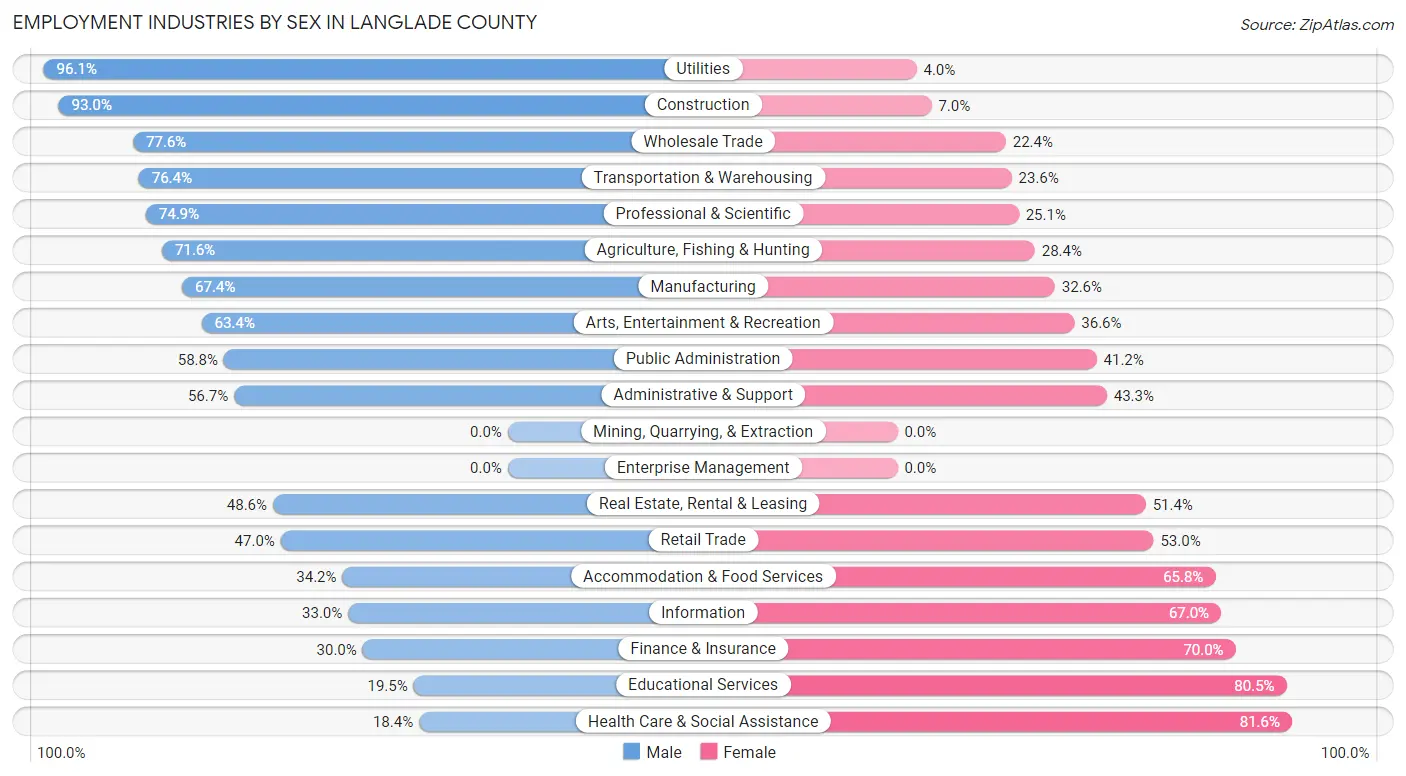
| Industry | Male | Female |
| Agriculture, Fishing & Hunting | 395 (71.6%) | 157 (28.4%) |
| Mining, Quarrying, & Extraction | 0 (0.0%) | 0 (0.0%) |
| Construction | 740 (93.0%) | 56 (7.0%) |
| Manufacturing | 1,233 (67.4%) | 596 (32.6%) |
| Wholesale Trade | 166 (77.6%) | 48 (22.4%) |
| Retail Trade | 493 (47.0%) | 556 (53.0%) |
| Transportation & Warehousing | 323 (76.4%) | 100 (23.6%) |
| Utilities | 73 (96.1%) | 3 (4.0%) |
| Information | 76 (33.0%) | 154 (67.0%) |
| Finance & Insurance | 79 (30.0%) | 184 (70.0%) |
| Real Estate, Rental & Leasing | 35 (48.6%) | 37 (51.4%) |
| Professional & Scientific | 164 (74.9%) | 55 (25.1%) |
| Enterprise Management | 0 (0.0%) | 0 (0.0%) |
| Administrative & Support | 183 (56.7%) | 140 (43.3%) |
| Educational Services | 69 (19.5%) | 285 (80.5%) |
| Health Care & Social Assistance | 194 (18.4%) | 862 (81.6%) |
| Arts, Entertainment & Recreation | 173 (63.4%) | 100 (36.6%) |
| Accommodation & Food Services | 166 (34.2%) | 319 (65.8%) |
| Public Administration | 134 (58.8%) | 94 (41.2%) |
| Total | 4,817 (53.8%) | 4,131 (46.2%) |
Education in Langlade County
School Enrollment in Langlade County
The most common levels of schooling among the 3,471 students in Langlade County are high school (945 | 27.2%), middle school (924 | 26.6%), and elementary school (659 | 19.0%).
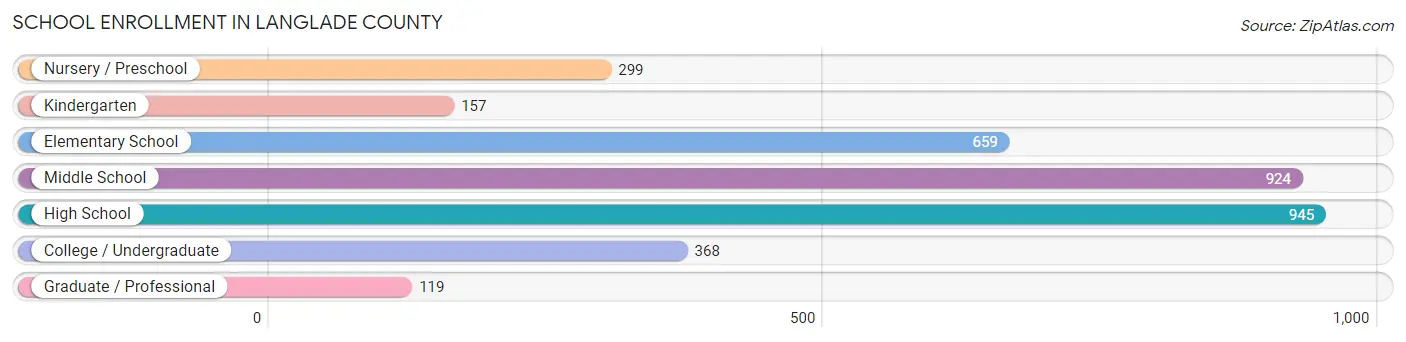
| School Level | # Students | % Students |
| Nursery / Preschool | 299 | 8.6% |
| Kindergarten | 157 | 4.5% |
| Elementary School | 659 | 19.0% |
| Middle School | 924 | 26.6% |
| High School | 945 | 27.2% |
| College / Undergraduate | 368 | 10.6% |
| Graduate / Professional | 119 | 3.4% |
| Total | 3,471 | 100.0% |
School Enrollment by Age by Funding Source in Langlade County
Out of a total of 3,471 students who are enrolled in schools in Langlade County, 677 (19.5%) attend a private institution, while the remaining 2,794 (80.5%) are enrolled in public schools. The age group of 25 to 34 year olds has the highest likelihood of being enrolled in private schools, with 41 (40.6% in the age bracket) enrolled. Conversely, the age group of 20 to 24 year olds has the lowest likelihood of being enrolled in a private school, with 152 (92.1% in the age bracket) attending a public institution.
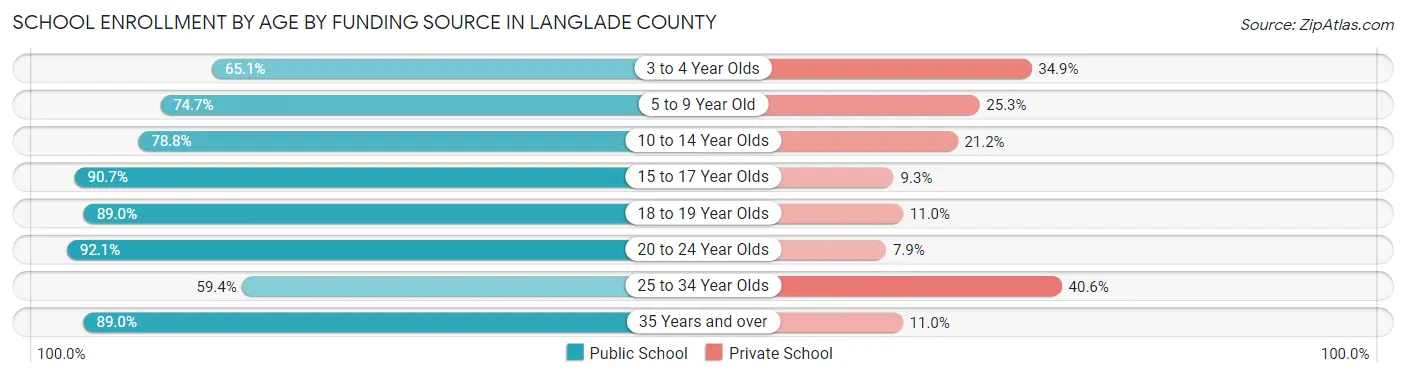
| Age Bracket | Public School | Private School |
| 3 to 4 Year Olds | 162 (65.1%) | 87 (34.9%) |
| 5 to 9 Year Old | 550 (74.7%) | 186 (25.3%) |
| 10 to 14 Year Olds | 911 (78.8%) | 245 (21.2%) |
| 15 to 17 Year Olds | 594 (90.7%) | 61 (9.3%) |
| 18 to 19 Year Olds | 210 (89.0%) | 26 (11.0%) |
| 20 to 24 Year Olds | 152 (92.1%) | 13 (7.9%) |
| 25 to 34 Year Olds | 60 (59.4%) | 41 (40.6%) |
| 35 Years and over | 154 (89.0%) | 19 (11.0%) |
| Total | 2,794 (80.5%) | 677 (19.5%) |
Educational Attainment by Field of Study in Langlade County
Business (554 | 22.6%), education (474 | 19.3%), bio, nature & agricultural (287 | 11.7%), arts & humanities (278 | 11.3%), and science & technology (269 | 11.0%) are the most common fields of study among 2,454 individuals in Langlade County who have obtained a bachelor's degree or higher.
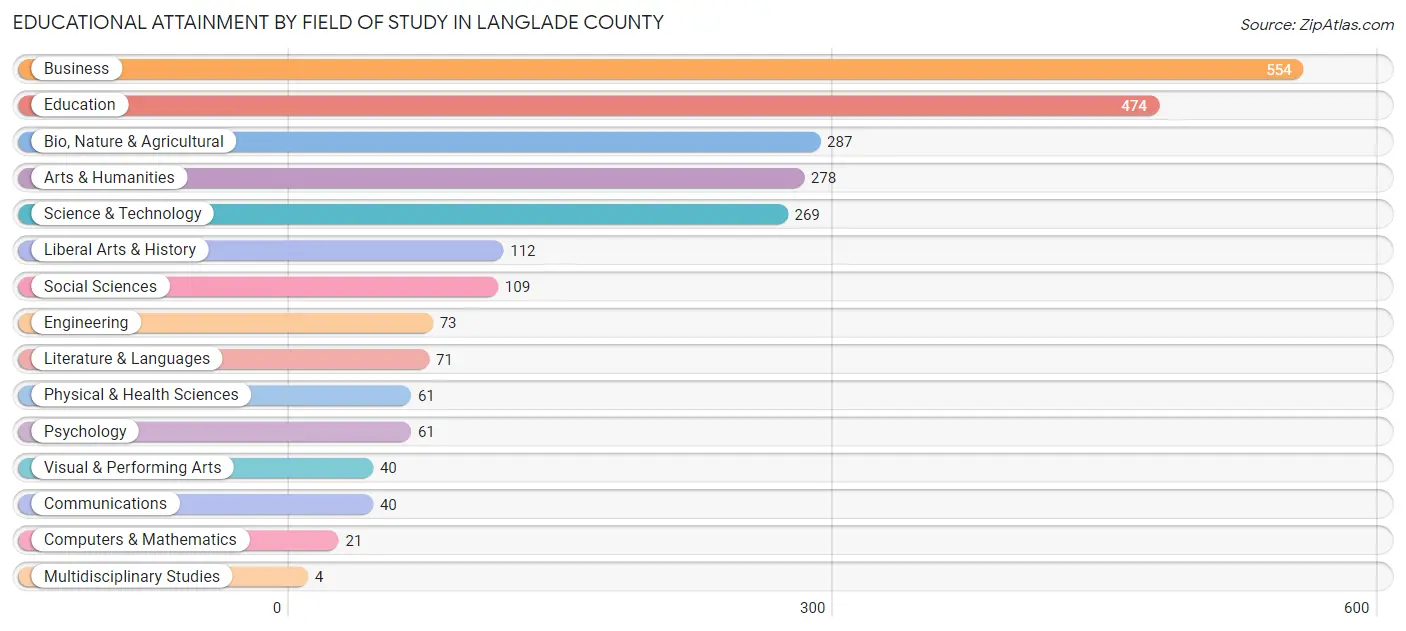
| Field of Study | # Graduates | % Graduates |
| Computers & Mathematics | 21 | 0.9% |
| Bio, Nature & Agricultural | 287 | 11.7% |
| Physical & Health Sciences | 61 | 2.5% |
| Psychology | 61 | 2.5% |
| Social Sciences | 109 | 4.4% |
| Engineering | 73 | 3.0% |
| Multidisciplinary Studies | 4 | 0.2% |
| Science & Technology | 269 | 11.0% |
| Business | 554 | 22.6% |
| Education | 474 | 19.3% |
| Literature & Languages | 71 | 2.9% |
| Liberal Arts & History | 112 | 4.6% |
| Visual & Performing Arts | 40 | 1.6% |
| Communications | 40 | 1.6% |
| Arts & Humanities | 278 | 11.3% |
| Total | 2,454 | 100.0% |
Transportation & Commute in Langlade County
Vehicle Availability by Sex in Langlade County
The most prevalent vehicle ownership categories in Langlade County are males with 2 vehicles (2,444, accounting for 51.6%) and females with 2 vehicles (1,840, making up 62.1%).
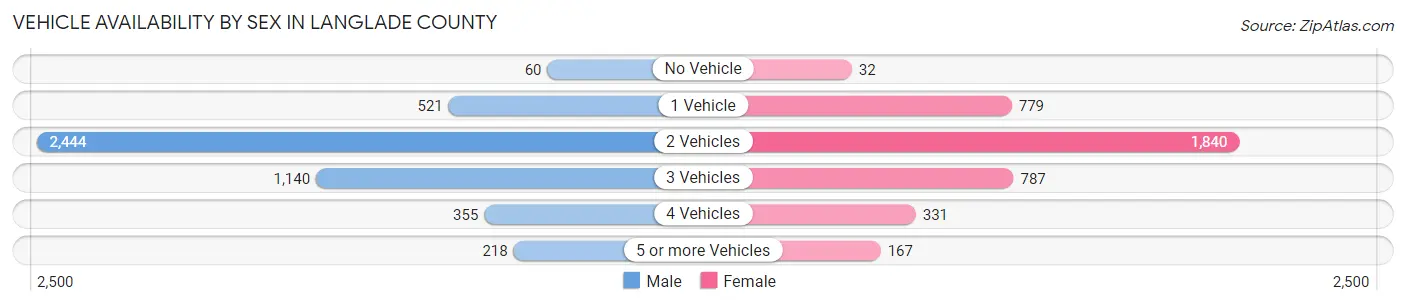
| Vehicles Available | Male | Female |
| No Vehicle | 60 (1.3%) | 32 (0.8%) |
| 1 Vehicle | 521 (11.0%) | 779 (19.8%) |
| 2 Vehicles | 2,444 (51.6%) | 1,840 (46.8%) |
| 3 Vehicles | 1,140 (24.1%) | 787 (20.0%) |
| 4 Vehicles | 355 (7.5%) | 331 (8.4%) |
| 5 or more Vehicles | 218 (4.6%) | 167 (4.2%) |
| Total | 4,738 (100.0%) | 3,936 (100.0%) |
Commute Time in Langlade County
The most frequently occuring commute durations in Langlade County are 5 to 9 minutes (1,595 commuters, 19.5%), 10 to 14 minutes (1,366 commuters, 16.7%), and 15 to 19 minutes (1,222 commuters, 14.9%).
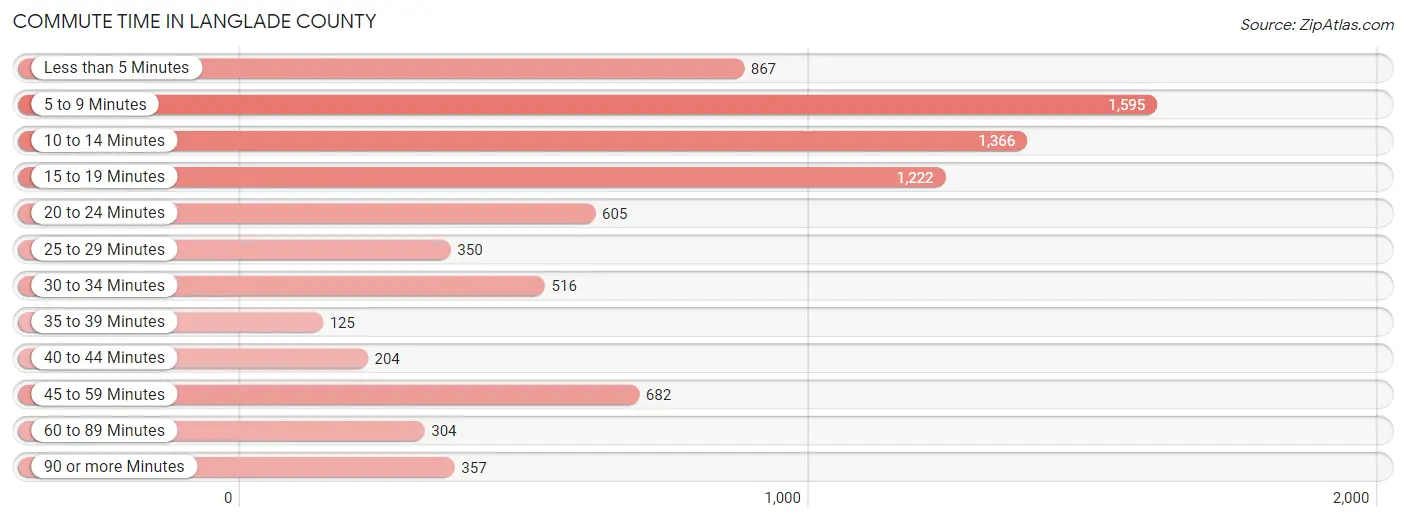
| Commute Time | # Commuters | % Commuters |
| Less than 5 Minutes | 867 | 10.6% |
| 5 to 9 Minutes | 1,595 | 19.5% |
| 10 to 14 Minutes | 1,366 | 16.7% |
| 15 to 19 Minutes | 1,222 | 14.9% |
| 20 to 24 Minutes | 605 | 7.4% |
| 25 to 29 Minutes | 350 | 4.3% |
| 30 to 34 Minutes | 516 | 6.3% |
| 35 to 39 Minutes | 125 | 1.5% |
| 40 to 44 Minutes | 204 | 2.5% |
| 45 to 59 Minutes | 682 | 8.3% |
| 60 to 89 Minutes | 304 | 3.7% |
| 90 or more Minutes | 357 | 4.4% |
Commute Time by Sex in Langlade County
The most common commute times in Langlade County are 15 to 19 minutes (738 commuters, 16.3%) for males and 5 to 9 minutes (875 commuters, 23.8%) for females.
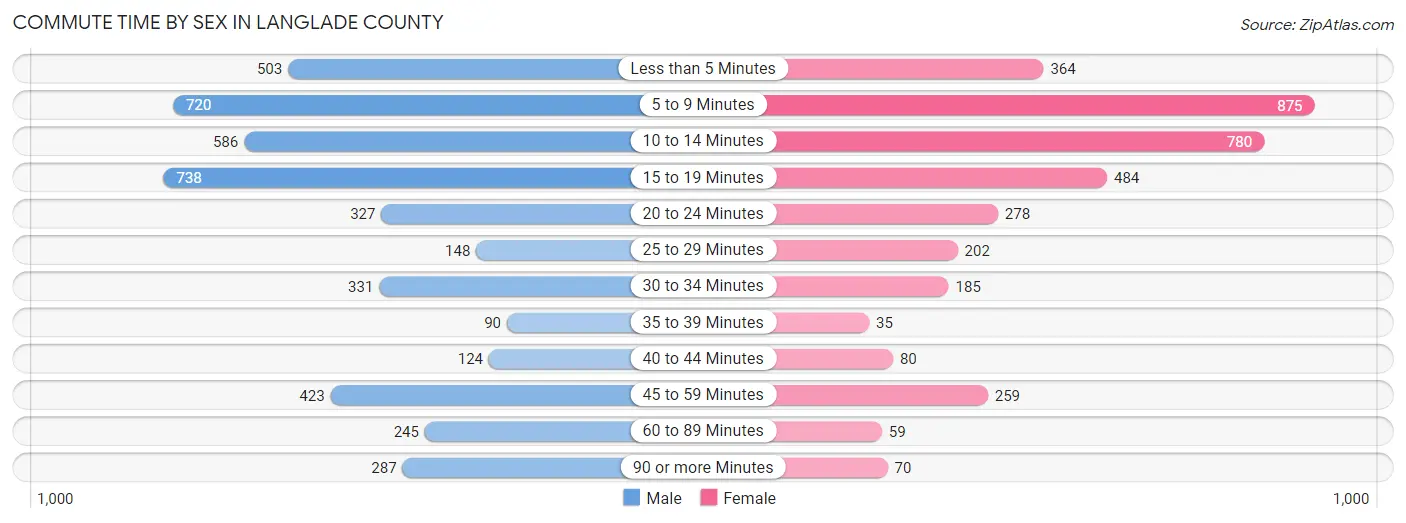
| Commute Time | Male | Female |
| Less than 5 Minutes | 503 (11.1%) | 364 (9.9%) |
| 5 to 9 Minutes | 720 (15.9%) | 875 (23.8%) |
| 10 to 14 Minutes | 586 (13.0%) | 780 (21.2%) |
| 15 to 19 Minutes | 738 (16.3%) | 484 (13.2%) |
| 20 to 24 Minutes | 327 (7.2%) | 278 (7.6%) |
| 25 to 29 Minutes | 148 (3.3%) | 202 (5.5%) |
| 30 to 34 Minutes | 331 (7.3%) | 185 (5.0%) |
| 35 to 39 Minutes | 90 (2.0%) | 35 (0.9%) |
| 40 to 44 Minutes | 124 (2.7%) | 80 (2.2%) |
| 45 to 59 Minutes | 423 (9.3%) | 259 (7.1%) |
| 60 to 89 Minutes | 245 (5.4%) | 59 (1.6%) |
| 90 or more Minutes | 287 (6.4%) | 70 (1.9%) |
Time of Departure to Work by Sex in Langlade County
The most frequent times of departure to work in Langlade County are 12:00 AM to 4:59 AM (594, 13.1%) for males and 7:30 AM to 7:59 AM (545, 14.8%) for females.
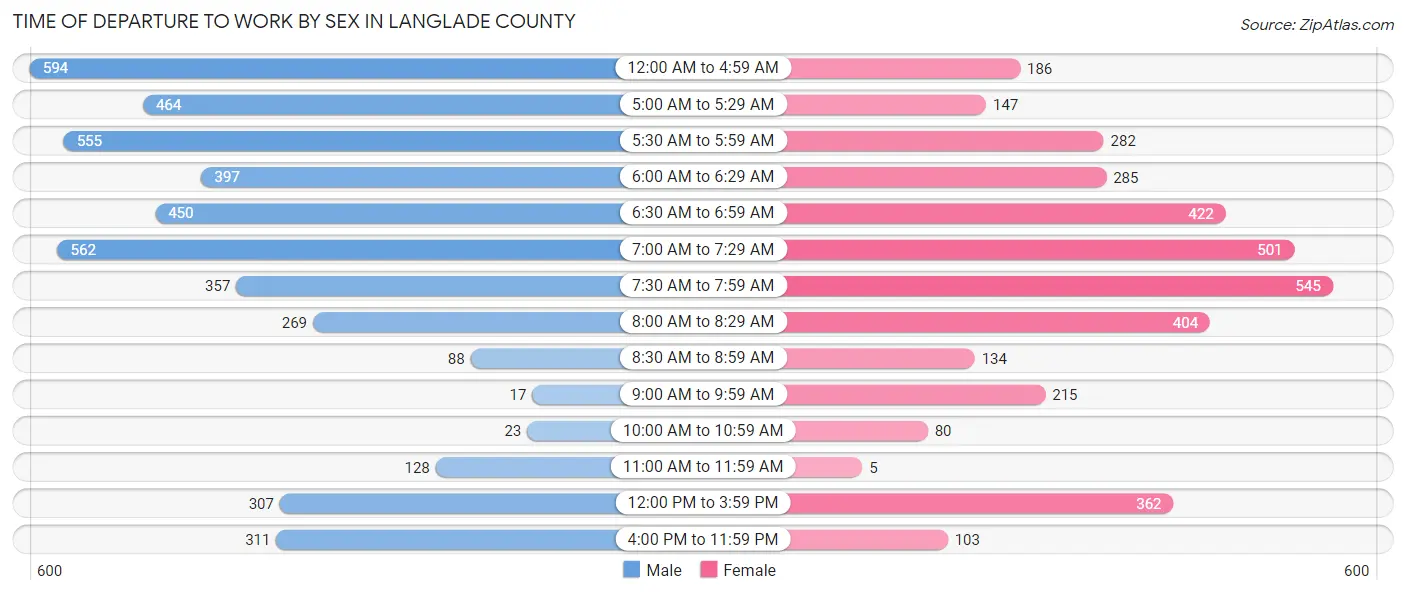
| Time of Departure | Male | Female |
| 12:00 AM to 4:59 AM | 594 (13.1%) | 186 (5.1%) |
| 5:00 AM to 5:29 AM | 464 (10.3%) | 147 (4.0%) |
| 5:30 AM to 5:59 AM | 555 (12.3%) | 282 (7.7%) |
| 6:00 AM to 6:29 AM | 397 (8.8%) | 285 (7.8%) |
| 6:30 AM to 6:59 AM | 450 (10.0%) | 422 (11.5%) |
| 7:00 AM to 7:29 AM | 562 (12.4%) | 501 (13.7%) |
| 7:30 AM to 7:59 AM | 357 (7.9%) | 545 (14.8%) |
| 8:00 AM to 8:29 AM | 269 (5.9%) | 404 (11.0%) |
| 8:30 AM to 8:59 AM | 88 (1.9%) | 134 (3.6%) |
| 9:00 AM to 9:59 AM | 17 (0.4%) | 215 (5.9%) |
| 10:00 AM to 10:59 AM | 23 (0.5%) | 80 (2.2%) |
| 11:00 AM to 11:59 AM | 128 (2.8%) | 5 (0.1%) |
| 12:00 PM to 3:59 PM | 307 (6.8%) | 362 (9.9%) |
| 4:00 PM to 11:59 PM | 311 (6.9%) | 103 (2.8%) |
| Total | 4,522 (100.0%) | 3,671 (100.0%) |
Housing Occupancy in Langlade County
Occupancy by Ownership in Langlade County
Of the total 8,443 dwellings in Langlade County, owner-occupied units account for 6,504 (77.0%), while renter-occupied units make up 1,939 (23.0%).
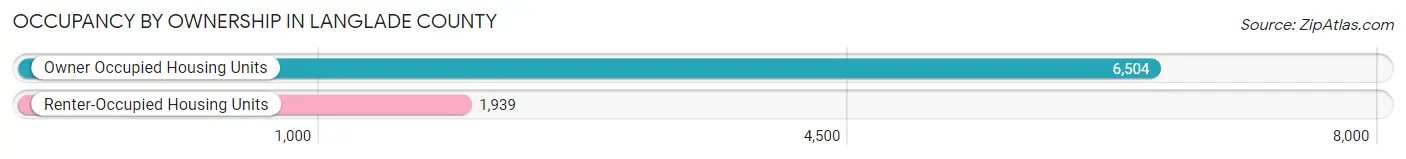
| Occupancy | # Housing Units | % Housing Units |
| Owner Occupied Housing Units | 6,504 | 77.0% |
| Renter-Occupied Housing Units | 1,939 | 23.0% |
| Total Occupied Housing Units | 8,443 | 100.0% |
Occupancy by Household Size in Langlade County
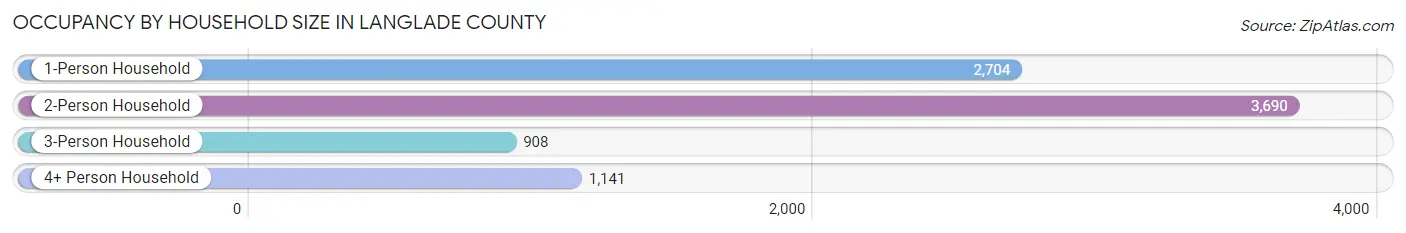
| Household Size | # Housing Units | % Housing Units |
| 1-Person Household | 2,704 | 32.0% |
| 2-Person Household | 3,690 | 43.7% |
| 3-Person Household | 908 | 10.7% |
| 4+ Person Household | 1,141 | 13.5% |
| Total Housing Units | 8,443 | 100.0% |
Occupancy by Ownership by Household Size in Langlade County
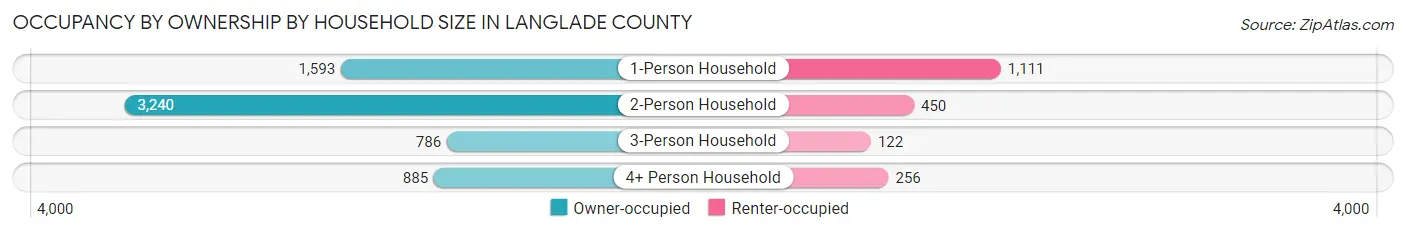
| Household Size | Owner-occupied | Renter-occupied |
| 1-Person Household | 1,593 (58.9%) | 1,111 (41.1%) |
| 2-Person Household | 3,240 (87.8%) | 450 (12.2%) |
| 3-Person Household | 786 (86.6%) | 122 (13.4%) |
| 4+ Person Household | 885 (77.6%) | 256 (22.4%) |
| Total Housing Units | 6,504 (77.0%) | 1,939 (23.0%) |
Occupancy by Educational Attainment in Langlade County
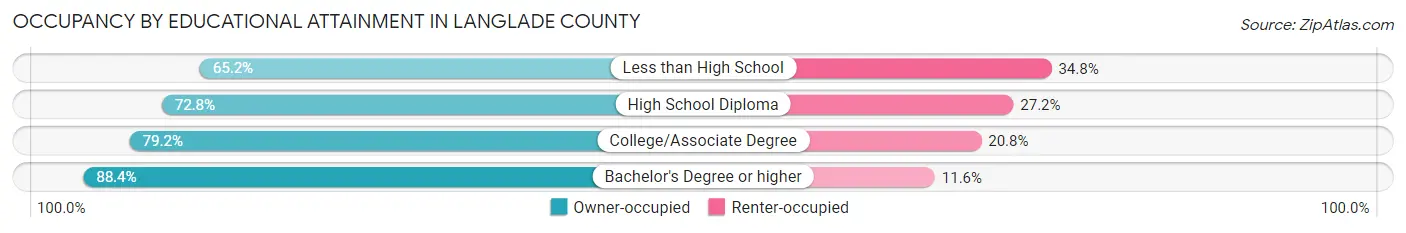
| Household Size | Owner-occupied | Renter-occupied |
| Less than High School | 518 (65.2%) | 276 (34.8%) |
| High School Diploma | 2,329 (72.8%) | 870 (27.2%) |
| College/Associate Degree | 2,366 (79.2%) | 623 (20.8%) |
| Bachelor's Degree or higher | 1,291 (88.4%) | 170 (11.6%) |
Occupancy by Age of Householder in Langlade County
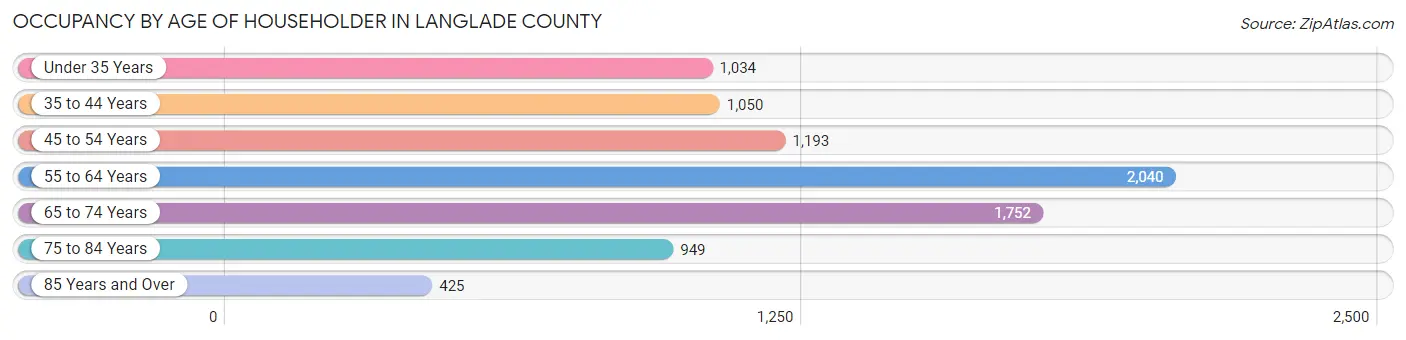
| Age Bracket | # Households | % Households |
| Under 35 Years | 1,034 | 12.2% |
| 35 to 44 Years | 1,050 | 12.4% |
| 45 to 54 Years | 1,193 | 14.1% |
| 55 to 64 Years | 2,040 | 24.2% |
| 65 to 74 Years | 1,752 | 20.7% |
| 75 to 84 Years | 949 | 11.2% |
| 85 Years and Over | 425 | 5.0% |
| Total | 8,443 | 100.0% |
Housing Finances in Langlade County
Median Income by Occupancy in Langlade County
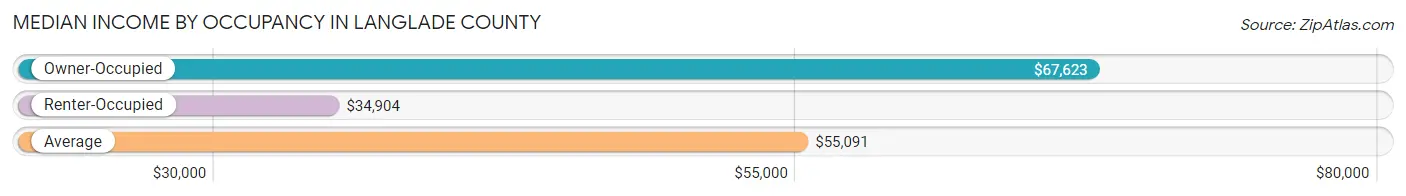
| Occupancy Type | # Households | Median Income |
| Owner-Occupied | 6,504 (77.0%) | $67,623 |
| Renter-Occupied | 1,939 (23.0%) | $34,904 |
| Average | 8,443 (100.0%) | $55,091 |
Occupancy by Householder Income Bracket in Langlade County
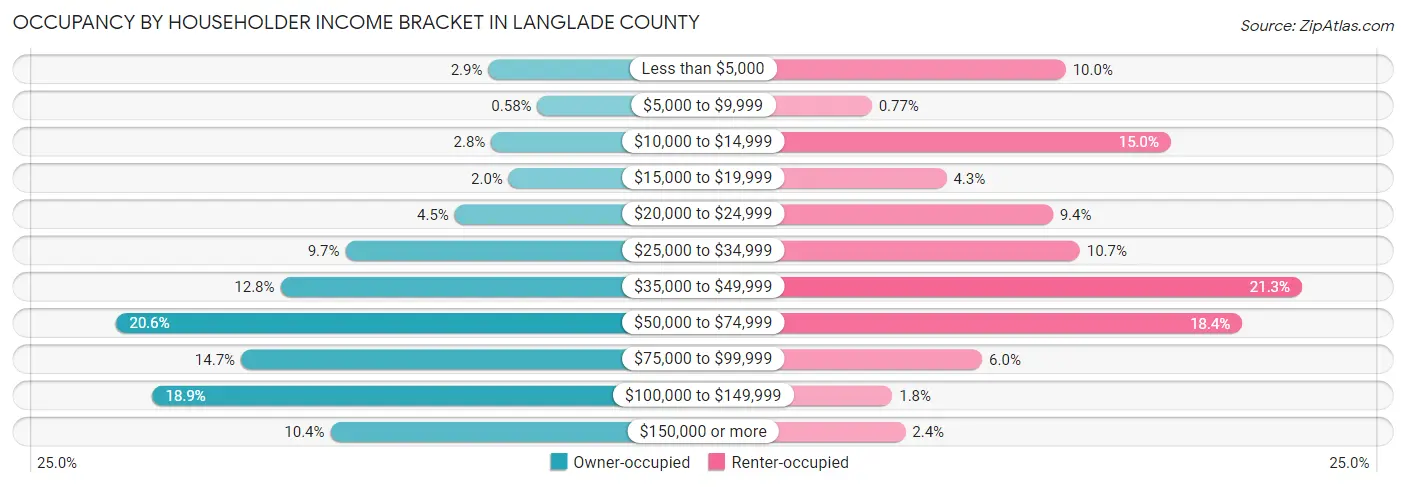
| Income Bracket | Owner-occupied | Renter-occupied |
| Less than $5,000 | 190 (2.9%) | 194 (10.0%) |
| $5,000 to $9,999 | 38 (0.6%) | 15 (0.8%) |
| $10,000 to $14,999 | 181 (2.8%) | 291 (15.0%) |
| $15,000 to $19,999 | 127 (1.9%) | 84 (4.3%) |
| $20,000 to $24,999 | 294 (4.5%) | 182 (9.4%) |
| $25,000 to $34,999 | 633 (9.7%) | 207 (10.7%) |
| $35,000 to $49,999 | 834 (12.8%) | 412 (21.2%) |
| $50,000 to $74,999 | 1,342 (20.6%) | 357 (18.4%) |
| $75,000 to $99,999 | 956 (14.7%) | 117 (6.0%) |
| $100,000 to $149,999 | 1,230 (18.9%) | 34 (1.8%) |
| $150,000 or more | 679 (10.4%) | 46 (2.4%) |
| Total | 6,504 (100.0%) | 1,939 (100.0%) |
Monthly Housing Cost Tiers in Langlade County
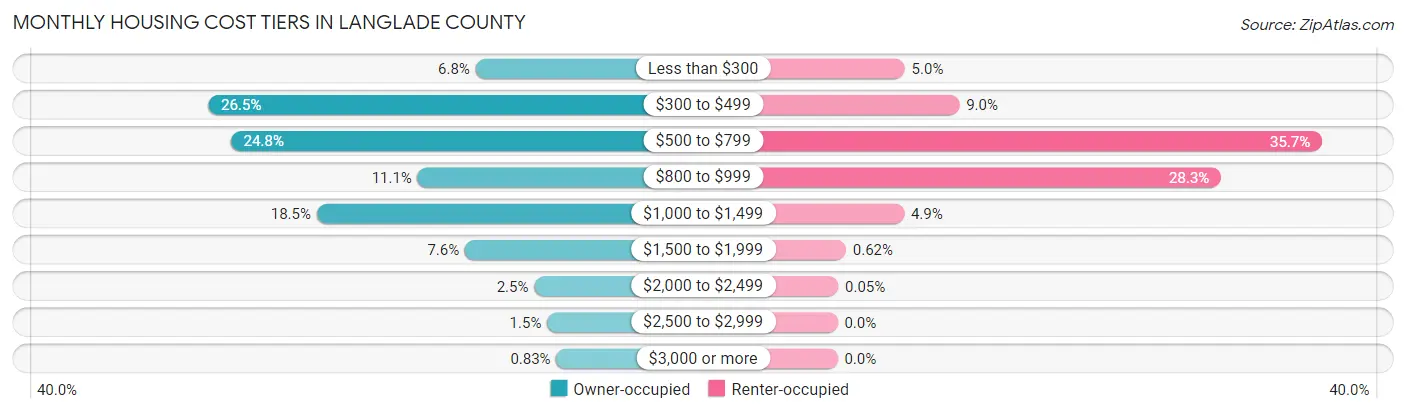
| Monthly Cost | Owner-occupied | Renter-occupied |
| Less than $300 | 441 (6.8%) | 96 (5.0%) |
| $300 to $499 | 1,723 (26.5%) | 174 (9.0%) |
| $500 to $799 | 1,615 (24.8%) | 692 (35.7%) |
| $800 to $999 | 719 (11.1%) | 548 (28.3%) |
| $1,000 to $1,499 | 1,202 (18.5%) | 95 (4.9%) |
| $1,500 to $1,999 | 492 (7.6%) | 12 (0.6%) |
| $2,000 to $2,499 | 160 (2.5%) | 1 (0.1%) |
| $2,500 to $2,999 | 98 (1.5%) | 0 (0.0%) |
| $3,000 or more | 54 (0.8%) | 0 (0.0%) |
| Total | 6,504 (100.0%) | 1,939 (100.0%) |
Physical Housing Characteristics in Langlade County
Housing Structures in Langlade County
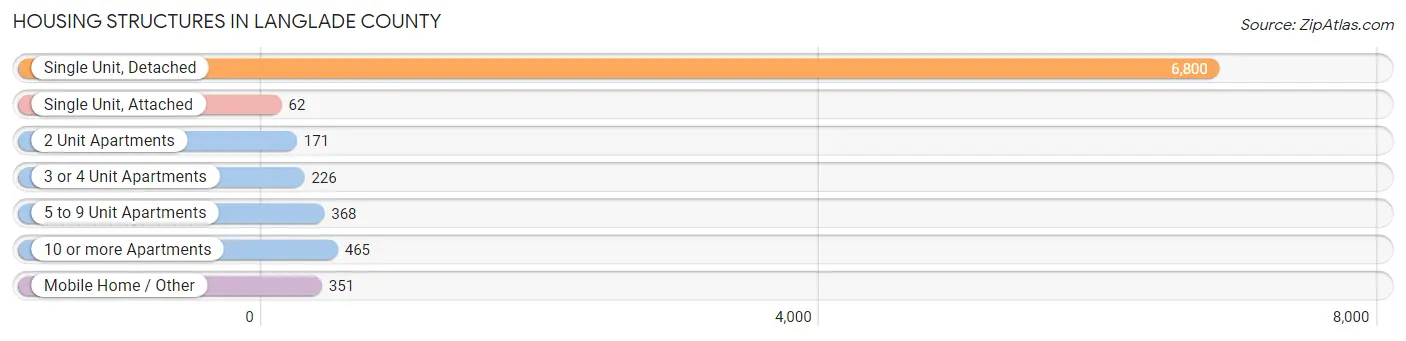
| Structure Type | # Housing Units | % Housing Units |
| Single Unit, Detached | 6,800 | 80.5% |
| Single Unit, Attached | 62 | 0.7% |
| 2 Unit Apartments | 171 | 2.0% |
| 3 or 4 Unit Apartments | 226 | 2.7% |
| 5 to 9 Unit Apartments | 368 | 4.4% |
| 10 or more Apartments | 465 | 5.5% |
| Mobile Home / Other | 351 | 4.2% |
| Total | 8,443 | 100.0% |
Housing Structures by Occupancy in Langlade County
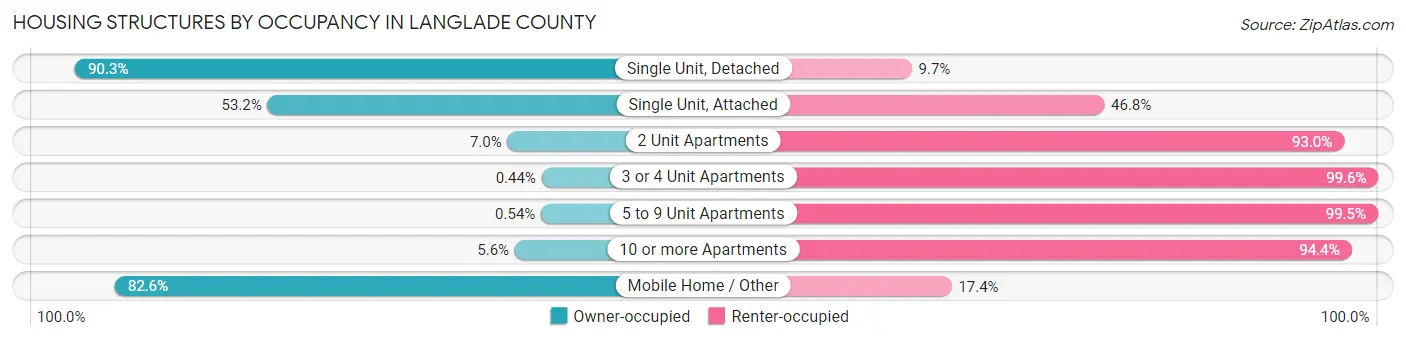
| Structure Type | Owner-occupied | Renter-occupied |
| Single Unit, Detached | 6,140 (90.3%) | 660 (9.7%) |
| Single Unit, Attached | 33 (53.2%) | 29 (46.8%) |
| 2 Unit Apartments | 12 (7.0%) | 159 (93.0%) |
| 3 or 4 Unit Apartments | 1 (0.4%) | 225 (99.6%) |
| 5 to 9 Unit Apartments | 2 (0.5%) | 366 (99.5%) |
| 10 or more Apartments | 26 (5.6%) | 439 (94.4%) |
| Mobile Home / Other | 290 (82.6%) | 61 (17.4%) |
| Total | 6,504 (77.0%) | 1,939 (23.0%) |
Housing Structures by Number of Rooms in Langlade County
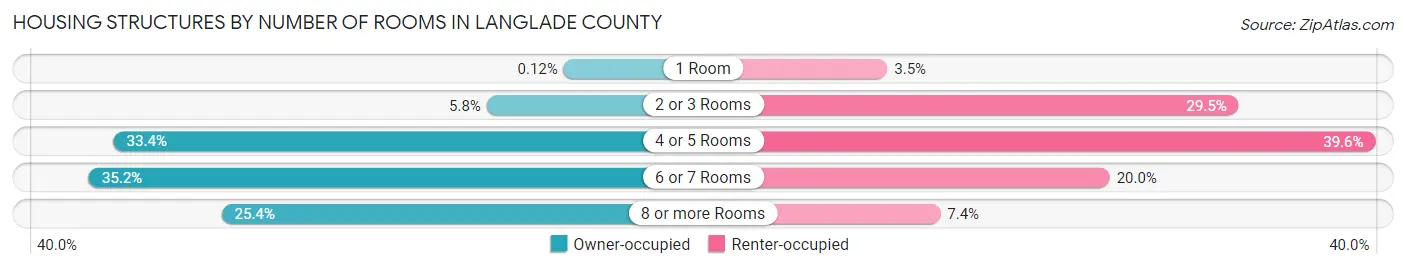
| Number of Rooms | Owner-occupied | Renter-occupied |
| 1 Room | 8 (0.1%) | 68 (3.5%) |
| 2 or 3 Rooms | 378 (5.8%) | 572 (29.5%) |
| 4 or 5 Rooms | 2,173 (33.4%) | 768 (39.6%) |
| 6 or 7 Rooms | 2,292 (35.2%) | 387 (20.0%) |
| 8 or more Rooms | 1,653 (25.4%) | 144 (7.4%) |
| Total | 6,504 (100.0%) | 1,939 (100.0%) |
Housing Structure by Heating Type in Langlade County
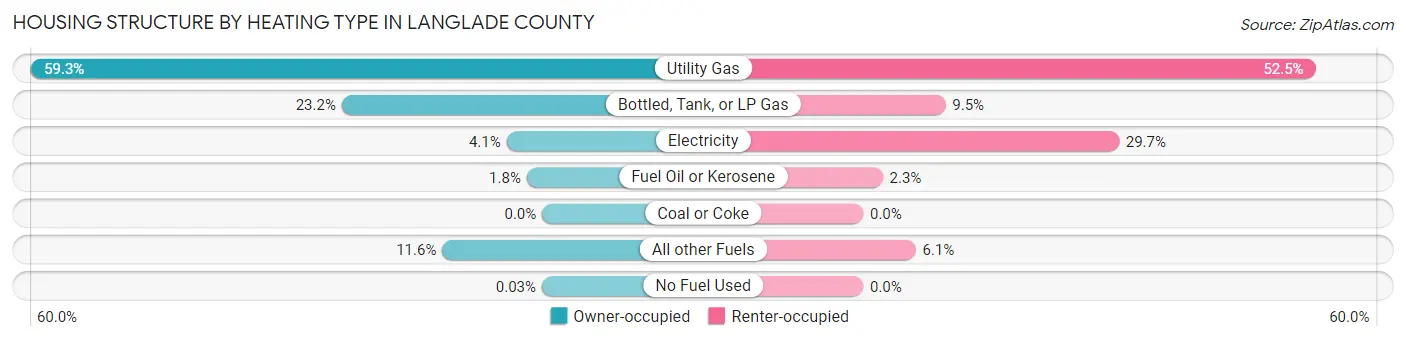
| Heating Type | Owner-occupied | Renter-occupied |
| Utility Gas | 3,854 (59.3%) | 1,017 (52.4%) |
| Bottled, Tank, or LP Gas | 1,511 (23.2%) | 185 (9.5%) |
| Electricity | 268 (4.1%) | 575 (29.6%) |
| Fuel Oil or Kerosene | 116 (1.8%) | 44 (2.3%) |
| Coal or Coke | 0 (0.0%) | 0 (0.0%) |
| All other Fuels | 753 (11.6%) | 118 (6.1%) |
| No Fuel Used | 2 (0.0%) | 0 (0.0%) |
| Total | 6,504 (100.0%) | 1,939 (100.0%) |
Household Vehicle Usage in Langlade County
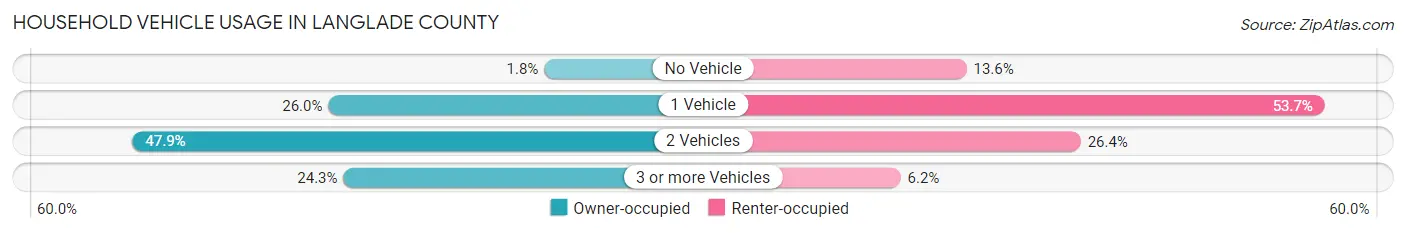
| Vehicles per Household | Owner-occupied | Renter-occupied |
| No Vehicle | 117 (1.8%) | 264 (13.6%) |
| 1 Vehicle | 1,690 (26.0%) | 1,042 (53.7%) |
| 2 Vehicles | 3,117 (47.9%) | 512 (26.4%) |
| 3 or more Vehicles | 1,580 (24.3%) | 121 (6.2%) |
| Total | 6,504 (100.0%) | 1,939 (100.0%) |
Real Estate & Mortgages in Langlade County
Real Estate and Mortgage Overview in Langlade County
| Characteristic | Without Mortgage | With Mortgage |
| Housing Units | 3,290 | 3,214 |
| Median Property Value | $142,400 | $134,900 |
| Median Household Income | $56,543 | $438 |
| Monthly Housing Costs | $441 | $31 |
| Real Estate Taxes | $1,956 | $8 |
Property Value by Mortgage Status in Langlade County
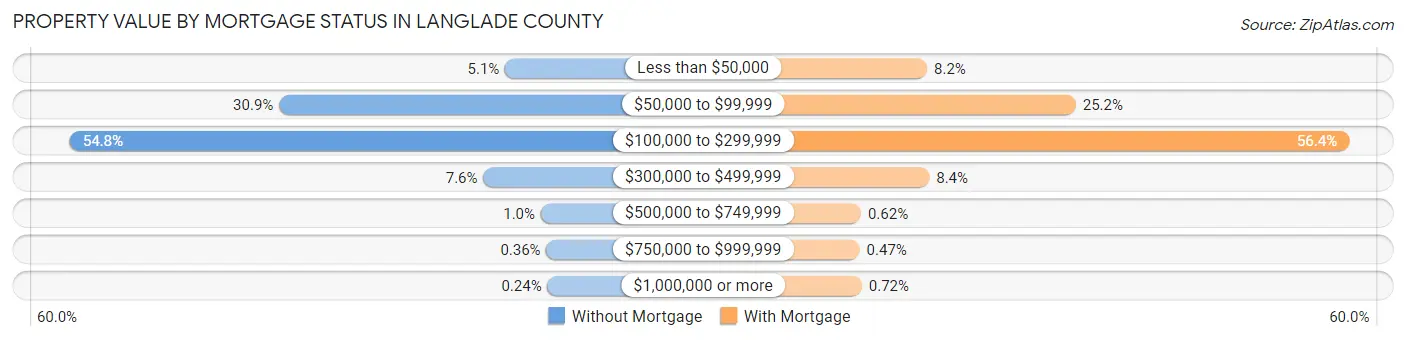
| Property Value | Without Mortgage | With Mortgage |
| Less than $50,000 | 167 (5.1%) | 263 (8.2%) |
| $50,000 to $99,999 | 1,017 (30.9%) | 809 (25.2%) |
| $100,000 to $299,999 | 1,804 (54.8%) | 1,813 (56.4%) |
| $300,000 to $499,999 | 249 (7.6%) | 271 (8.4%) |
| $500,000 to $749,999 | 33 (1.0%) | 20 (0.6%) |
| $750,000 to $999,999 | 12 (0.4%) | 15 (0.5%) |
| $1,000,000 or more | 8 (0.2%) | 23 (0.7%) |
| Total | 3,290 (100.0%) | 3,214 (100.0%) |
Household Income by Mortgage Status in Langlade County
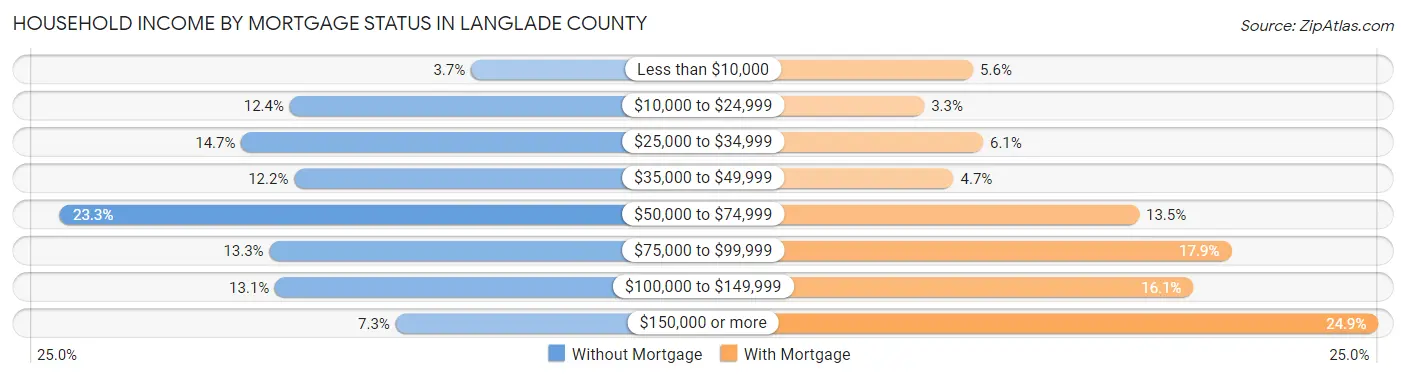
| Household Income | Without Mortgage | With Mortgage |
| Less than $10,000 | 123 (3.7%) | 180 (5.6%) |
| $10,000 to $24,999 | 407 (12.4%) | 105 (3.3%) |
| $25,000 to $34,999 | 483 (14.7%) | 195 (6.1%) |
| $35,000 to $49,999 | 400 (12.2%) | 150 (4.7%) |
| $50,000 to $74,999 | 767 (23.3%) | 434 (13.5%) |
| $75,000 to $99,999 | 439 (13.3%) | 575 (17.9%) |
| $100,000 to $149,999 | 430 (13.1%) | 517 (16.1%) |
| $150,000 or more | 241 (7.3%) | 800 (24.9%) |
| Total | 3,290 (100.0%) | 3,214 (100.0%) |
Property Value to Household Income Ratio in Langlade County
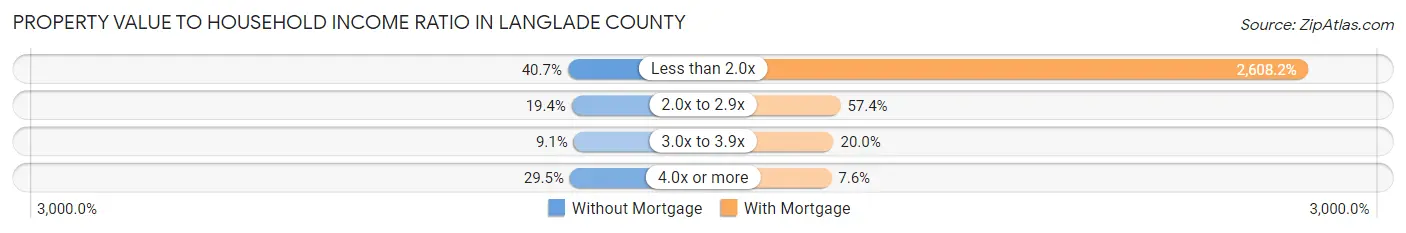
| Value-to-Income Ratio | Without Mortgage | With Mortgage |
| Less than 2.0x | 1,340 (40.7%) | 83,827 (2,608.2%) |
| 2.0x to 2.9x | 637 (19.4%) | 1,844 (57.4%) |
| 3.0x to 3.9x | 300 (9.1%) | 642 (20.0%) |
| 4.0x or more | 970 (29.5%) | 243 (7.6%) |
| Total | 3,290 (100.0%) | 3,214 (100.0%) |
Real Estate Taxes by Mortgage Status in Langlade County
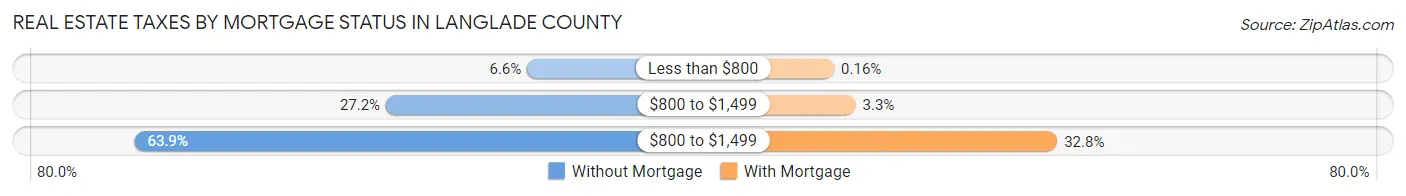
| Property Taxes | Without Mortgage | With Mortgage |
| Less than $800 | 216 (6.6%) | 5 (0.2%) |
| $800 to $1,499 | 895 (27.2%) | 106 (3.3%) |
| $800 to $1,499 | 2,103 (63.9%) | 1,053 (32.8%) |
| Total | 3,290 (100.0%) | 3,214 (100.0%) |
Health & Disability in Langlade County
Health Insurance Coverage by Age in Langlade County
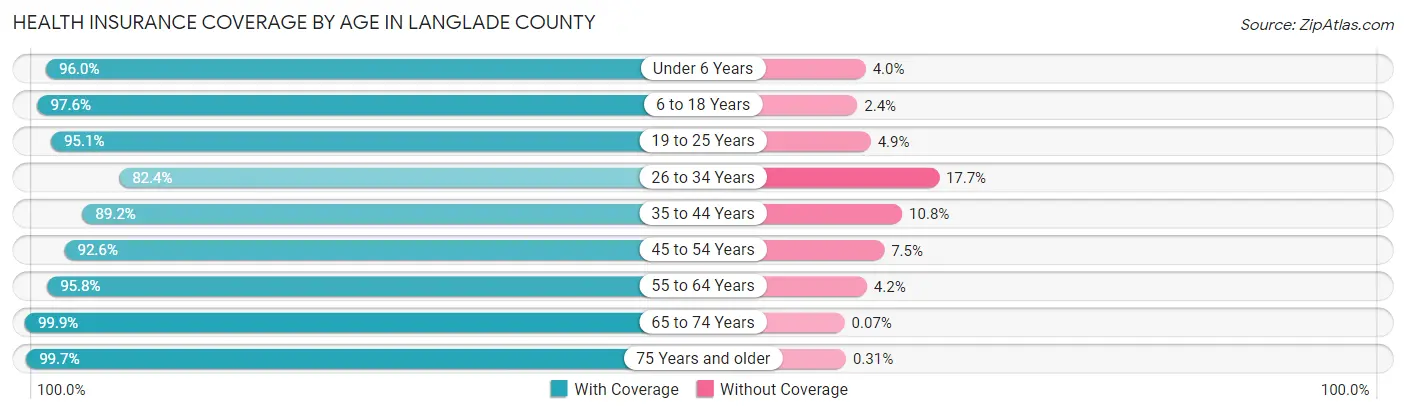
| Age Bracket | With Coverage | Without Coverage |
| Under 6 Years | 1,129 (96.0%) | 47 (4.0%) |
| 6 to 18 Years | 2,803 (97.6%) | 70 (2.4%) |
| 19 to 25 Years | 1,272 (95.1%) | 66 (4.9%) |
| 26 to 34 Years | 1,292 (82.4%) | 277 (17.6%) |
| 35 to 44 Years | 1,753 (89.2%) | 212 (10.8%) |
| 45 to 54 Years | 2,124 (92.5%) | 171 (7.4%) |
| 55 to 64 Years | 3,270 (95.8%) | 144 (4.2%) |
| 65 to 74 Years | 2,750 (99.9%) | 2 (0.1%) |
| 75 Years and older | 1,943 (99.7%) | 6 (0.3%) |
| Total | 18,336 (94.9%) | 995 (5.1%) |
Health Insurance Coverage by Citizenship Status in Langlade County
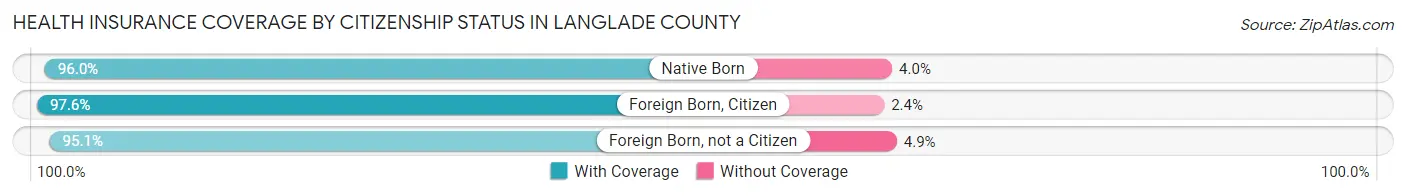
| Citizenship Status | With Coverage | Without Coverage |
| Native Born | 1,129 (96.0%) | 47 (4.0%) |
| Foreign Born, Citizen | 2,803 (97.6%) | 70 (2.4%) |
| Foreign Born, not a Citizen | 1,272 (95.1%) | 66 (4.9%) |
Health Insurance Coverage by Household Income in Langlade County
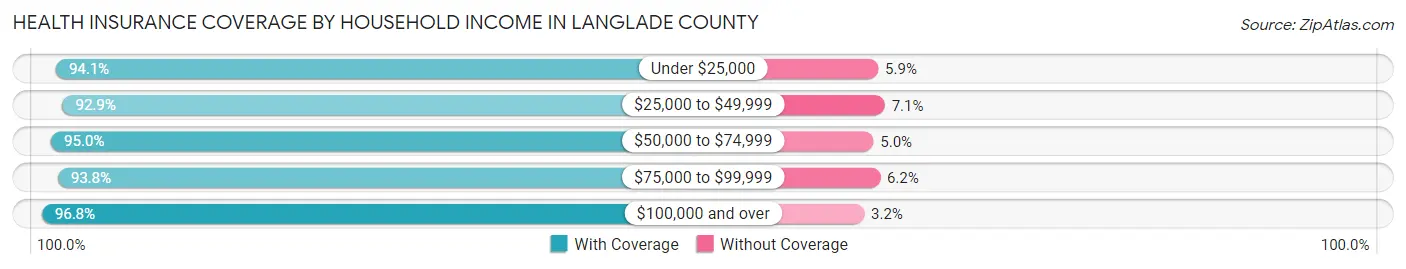
| Household Income | With Coverage | Without Coverage |
| Under $25,000 | 2,273 (94.1%) | 142 (5.9%) |
| $25,000 to $49,999 | 3,760 (92.9%) | 288 (7.1%) |
| $50,000 to $74,999 | 3,769 (95.0%) | 197 (5.0%) |
| $75,000 to $99,999 | 2,563 (93.8%) | 170 (6.2%) |
| $100,000 and over | 5,913 (96.8%) | 198 (3.2%) |
Public vs Private Health Insurance Coverage by Age in Langlade County
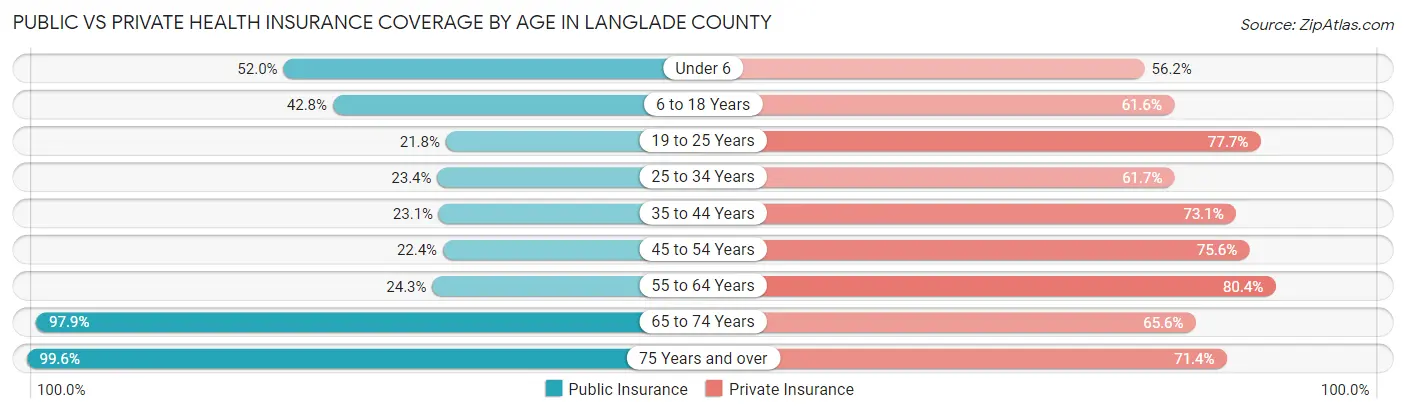
| Age Bracket | Public Insurance | Private Insurance |
| Under 6 | 611 (52.0%) | 661 (56.2%) |
| 6 to 18 Years | 1,229 (42.8%) | 1,770 (61.6%) |
| 19 to 25 Years | 292 (21.8%) | 1,039 (77.6%) |
| 25 to 34 Years | 367 (23.4%) | 968 (61.7%) |
| 35 to 44 Years | 454 (23.1%) | 1,436 (73.1%) |
| 45 to 54 Years | 513 (22.4%) | 1,735 (75.6%) |
| 55 to 64 Years | 830 (24.3%) | 2,746 (80.4%) |
| 65 to 74 Years | 2,693 (97.9%) | 1,806 (65.6%) |
| 75 Years and over | 1,942 (99.6%) | 1,391 (71.4%) |
| Total | 8,931 (46.2%) | 13,552 (70.1%) |
Disability Status by Sex by Age in Langlade County
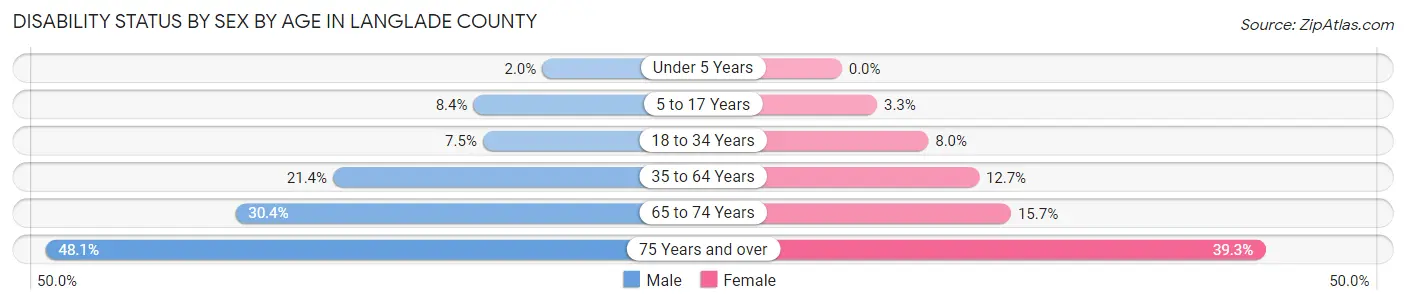
| Age Bracket | Male | Female |
| Under 5 Years | 11 (2.0%) | 0 (0.0%) |
| 5 to 17 Years | 120 (8.4%) | 42 (3.3%) |
| 18 to 34 Years | 121 (7.5%) | 125 (8.0%) |
| 35 to 64 Years | 843 (21.4%) | 475 (12.7%) |
| 65 to 74 Years | 421 (30.4%) | 215 (15.7%) |
| 75 Years and over | 419 (48.0%) | 423 (39.3%) |
Disability Class by Sex by Age in Langlade County
Disability Class: Hearing Difficulty
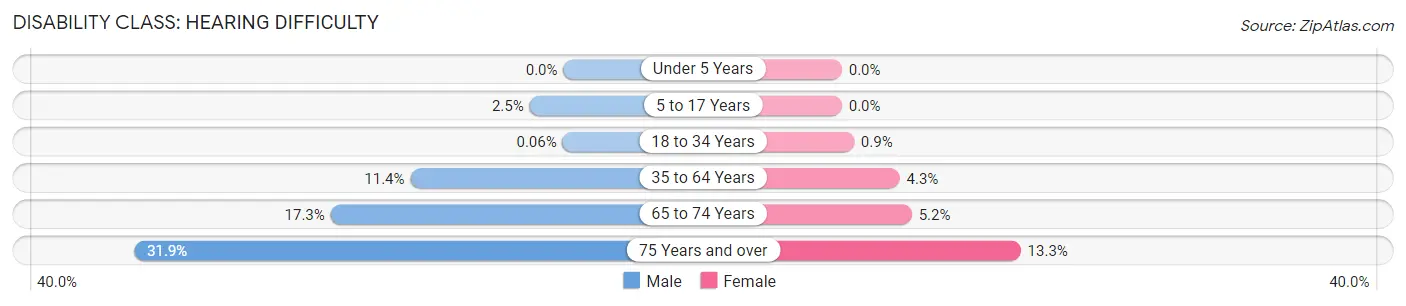
| Age Bracket | Male | Female |
| Under 5 Years | 0 (0.0%) | 0 (0.0%) |
| 5 to 17 Years | 36 (2.5%) | 0 (0.0%) |
| 18 to 34 Years | 1 (0.1%) | 14 (0.9%) |
| 35 to 64 Years | 448 (11.4%) | 160 (4.3%) |
| 65 to 74 Years | 239 (17.3%) | 71 (5.2%) |
| 75 Years and over | 278 (31.9%) | 143 (13.3%) |
Disability Class: Vision Difficulty
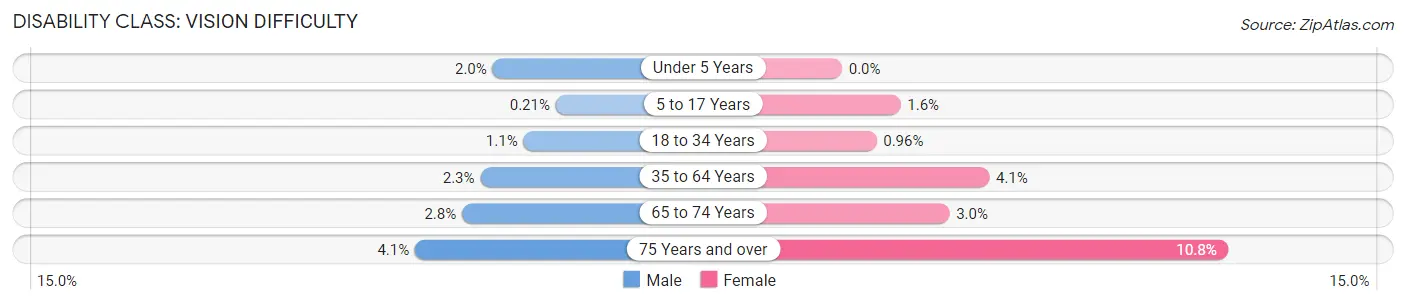
| Age Bracket | Male | Female |
| Under 5 Years | 11 (2.0%) | 0 (0.0%) |
| 5 to 17 Years | 3 (0.2%) | 21 (1.6%) |
| 18 to 34 Years | 18 (1.1%) | 15 (1.0%) |
| 35 to 64 Years | 91 (2.3%) | 153 (4.1%) |
| 65 to 74 Years | 39 (2.8%) | 41 (3.0%) |
| 75 Years and over | 36 (4.1%) | 116 (10.8%) |
Disability Class: Cognitive Difficulty
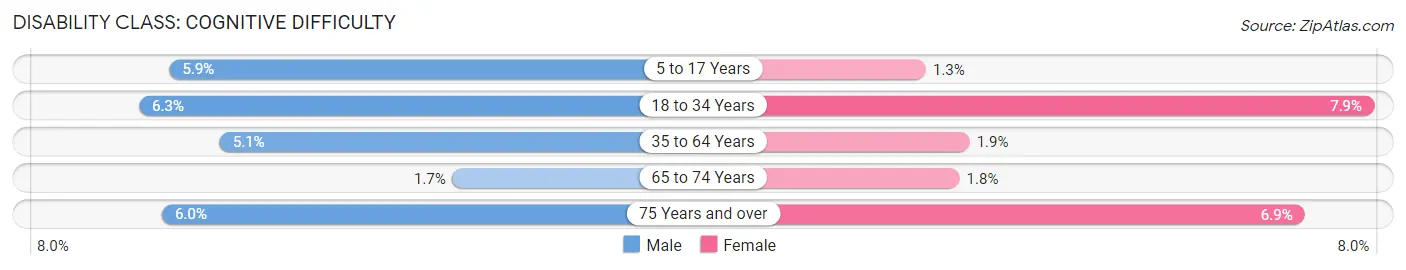
| Age Bracket | Male | Female |
| 5 to 17 Years | 84 (5.9%) | 16 (1.3%) |
| 18 to 34 Years | 102 (6.3%) | 123 (7.9%) |
| 35 to 64 Years | 201 (5.1%) | 71 (1.9%) |
| 65 to 74 Years | 23 (1.7%) | 24 (1.8%) |
| 75 Years and over | 52 (6.0%) | 74 (6.9%) |
Disability Class: Ambulatory Difficulty
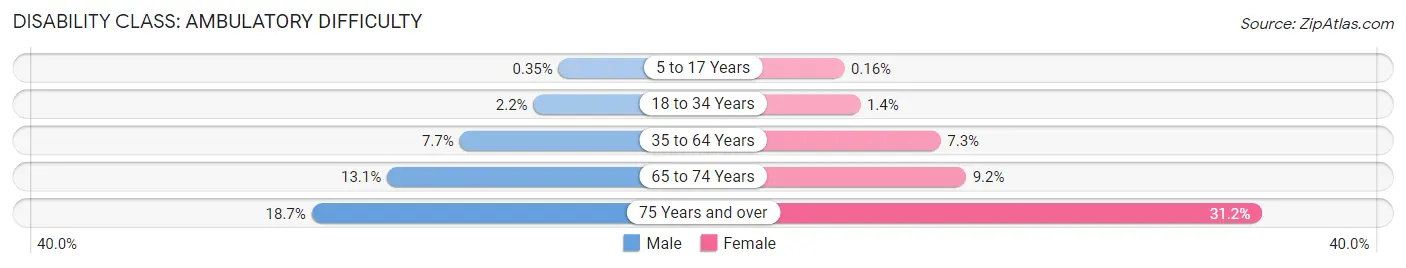
| Age Bracket | Male | Female |
| 5 to 17 Years | 5 (0.4%) | 2 (0.2%) |
| 18 to 34 Years | 36 (2.2%) | 21 (1.3%) |
| 35 to 64 Years | 304 (7.7%) | 273 (7.3%) |
| 65 to 74 Years | 181 (13.1%) | 126 (9.2%) |
| 75 Years and over | 163 (18.7%) | 336 (31.2%) |
Disability Class: Self-Care Difficulty
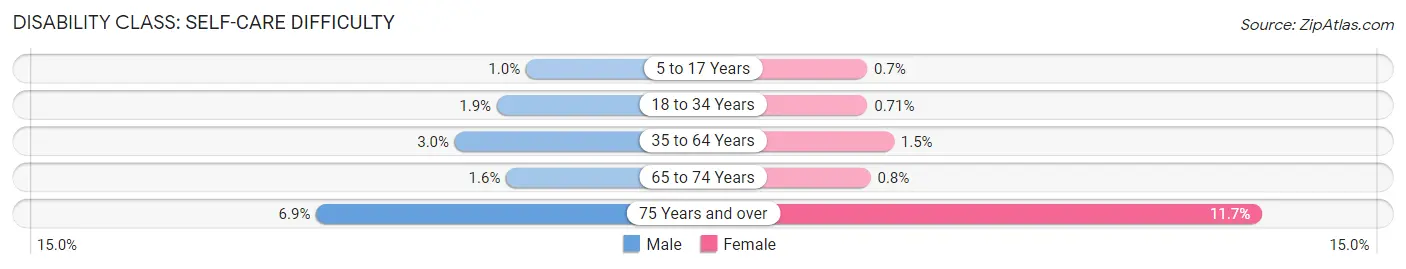
| Age Bracket | Male | Female |
| 5 to 17 Years | 15 (1.0%) | 9 (0.7%) |
| 18 to 34 Years | 30 (1.8%) | 11 (0.7%) |
| 35 to 64 Years | 119 (3.0%) | 54 (1.5%) |
| 65 to 74 Years | 22 (1.6%) | 11 (0.8%) |
| 75 Years and over | 60 (6.9%) | 126 (11.7%) |
Technology Access in Langlade County
Computing Device Access in Langlade County
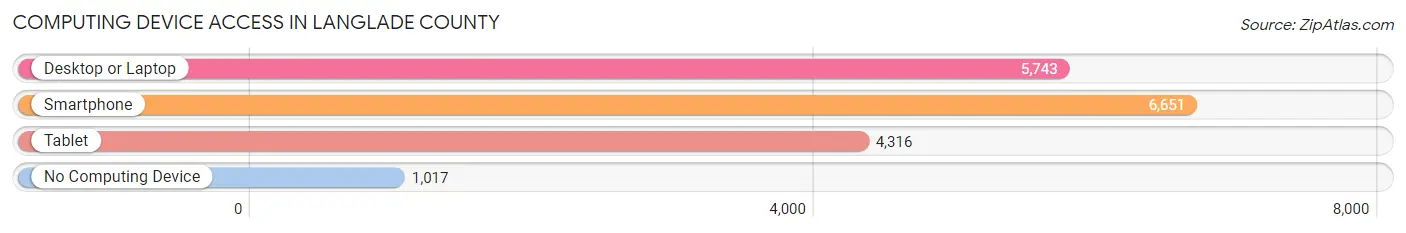
| Device Type | # Households | % Households |
| Desktop or Laptop | 5,743 | 68.0% |
| Smartphone | 6,651 | 78.8% |
| Tablet | 4,316 | 51.1% |
| No Computing Device | 1,017 | 12.0% |
| Total | 8,443 | 100.0% |
Internet Access in Langlade County
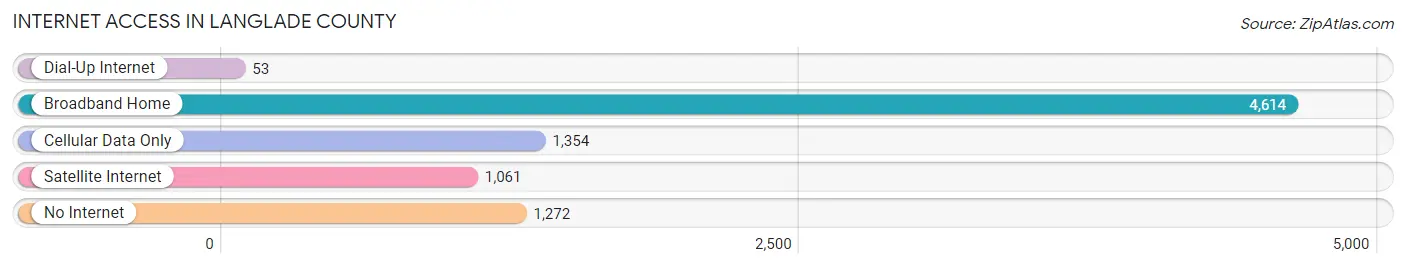
| Internet Type | # Households | % Households |
| Dial-Up Internet | 53 | 0.6% |
| Broadband Home | 4,614 | 54.6% |
| Cellular Data Only | 1,354 | 16.0% |
| Satellite Internet | 1,061 | 12.6% |
| No Internet | 1,272 | 15.1% |
| Total | 8,443 | 100.0% |
Langlade County Summary
Langlade County is located in the north-central region of Wisconsin, and is part of the Wausau, WI Metropolitan Statistical Area. The county seat is Antigo, and the county is named after Charles Langlade, an early French-Canadian fur trader and war leader of the Menominee tribe. As of the 2010 census, the population of Langlade County was 19,971.
Geography
Langlade County is located in the north-central region of Wisconsin, and is bordered by Oneida County to the north, Lincoln County to the east, Marathon County to the south, and Shawano County to the west. The county has a total area of 1,092 square miles, of which 1,082 square miles is land and 10 square miles is water. The Wolf River, which is a tributary of the Fox River, runs through the county. The highest point in the county is located in the town of Upham, at an elevation of 1,845 feet.
Demographics
As of the 2010 census, there were 19,971 people, 8,072 households, and 5,541 families residing in the county. The population density was 18.4 people per square mile. The racial makeup of the county was 97.2% White, 0.3% Black or African American, 0.7% Native American, 0.3% Asian, 0.2% from other races, and 1.3% from two or more races. 1.3% of the population were Hispanic or Latino of any race.
The median income for a household in the county was $41,945, and the median income for a family was $50,945. The per capita income for the county was $20,945. About 8.2% of families and 11.2% of the population were below the poverty line, including 14.2% of those under age 18 and 8.2% of those age 65 or over.
Economy
Langlade County is largely rural, and the economy is largely based on agriculture and forestry. The county is home to several large dairy farms, as well as a number of smaller farms that produce a variety of crops, including corn, soybeans, hay, and wheat. The county is also home to several large paper mills, which are the largest employers in the county. Other major employers in the county include the Antigo School District, Langlade Hospital, and the Langlade County government.
History
Langlade County was established in 1879, and was named after Charles Langlade, an early French-Canadian fur trader and war leader of the Menominee tribe. The county was originally part of Shawano County, and was created from parts of Shawano, Oneida, and Lincoln counties. The county seat was originally located in the town of Neva, but was moved to the city of Antigo in 1883.
The county was largely rural until the early 20th century, when the logging industry began to boom. The county was home to several large paper mills, which provided jobs for many of the county's residents. The county also saw an influx of immigrants from Europe, particularly from Germany and Poland.
In the late 20th century, the county saw a decline in the logging industry, and the paper mills began to close. The county has since shifted to a more diversified economy, with agriculture and tourism becoming increasingly important. The county is also home to several large dairy farms, and is a popular destination for outdoor recreation, such as fishing, hunting, and camping.
Common Questions
What is the Total Population of Langlade County?
Total Population of Langlade County is 19,512.
What is the Total Male Population of Langlade County?
Total Male Population of Langlade County is 9,907.
What is the Total Female Population of Langlade County?
Total Female Population of Langlade County is 9,605.
What is the Ratio of Males per 100 Females in Langlade County?
There are 103.14 Males per 100 Females in Langlade County.
What is the Ratio of Females per 100 Males in Langlade County?
There are 96.95 Females per 100 Males in Langlade County.
What is the Median Population Age in Langlade County?
Median Population Age in Langlade County is 48.6 Years.
What is the Average Family Size in Langlade County
Average Family Size in Langlade County is 2.9 People.
What is the Average Household Size in Langlade County
Average Household Size in Langlade County is 2.3 People.
What is Per Capita Income in Langlade County?
Per Capita income in Langlade County is $32,989.
What is the Median Family Income in Langlade County?
Median Family Income in Langlade County is $72,459.
What is the Median Household income in Langlade County?
Median Household Income in Langlade County is $55,091.
What is Income or Wage Gap in Langlade County?
Income or Wage Gap in Langlade County is 20.5%.
Women in Langlade County earn 79.5 cents for every dollar earned by a man.
What is Family Income Deficit in Langlade County?
Family Income Deficit in Langlade County is $12,165.
Families that are below poverty line in Langlade County earn $12,165 less on average than the poverty threshold level.
What is Inequality or Gini Index in Langlade County?
Inequality or Gini Index in Langlade County is 0.44.
How Large is the Labor Force in Langlade County?
There are 9,402 People in the Labor Forcein in Langlade County.
What is the Percentage of People in the Labor Force in Langlade County?
57.9% of People are in the Labor Force in Langlade County.
What is the Unemployment Rate in Langlade County?
Unemployment Rate in Langlade County is 4.9%.