Lafayette County, WI
Lafayette County Map
Lafayette County Overview
16,716
TOTAL POPULATION
8,538
MALE POPULATION
8,178
FEMALE POPULATION
104.40
MALES / 100 FEMALES
95.78
FEMALES / 100 MALES
41.7
MEDIAN AGE
3.0
AVG FAMILY SIZE
2.5
AVG HOUSEHOLD SIZE
$33,484
PER CAPITA INCOME
$82,434
AVG FAMILY INCOME
$69,293
AVG HOUSEHOLD INCOME
25.1%
WAGE / INCOME GAP [ % ]
74.9¢/ $1
WAGE / INCOME GAP [ $ ]
$13,253
FAMILY INCOME DEFICIT
0.41
INEQUALITY / GINI INDEX
8,603
LABOR FORCE [ PEOPLE ]
65.3%
PERCENT IN LABOR FORCE
2.4%
UNEMPLOYMENT RATE
Lafayette County Area Codes
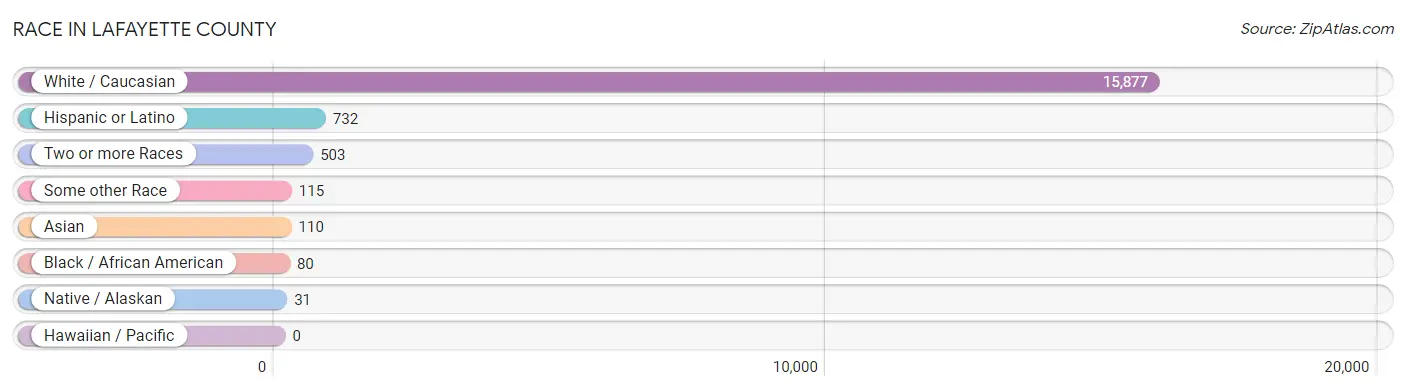
Race in Lafayette County
The most populous races in Lafayette County are White / Caucasian (15,877 | 95.0%), Hispanic or Latino (732 | 4.4%), and Two or more Races (503 | 3.0%).
| Race | # Population | % Population |
| Asian | 110 | 0.7% |
| Black / African American | 80 | 0.5% |
| Hawaiian / Pacific | 0 | 0.0% |
| Hispanic or Latino | 732 | 4.4% |
| Native / Alaskan | 31 | 0.2% |
| White / Caucasian | 15,877 | 95.0% |
| Two or more Races | 503 | 3.0% |
| Some other Race | 115 | 0.7% |
| Total | 16,716 | 100.0% |
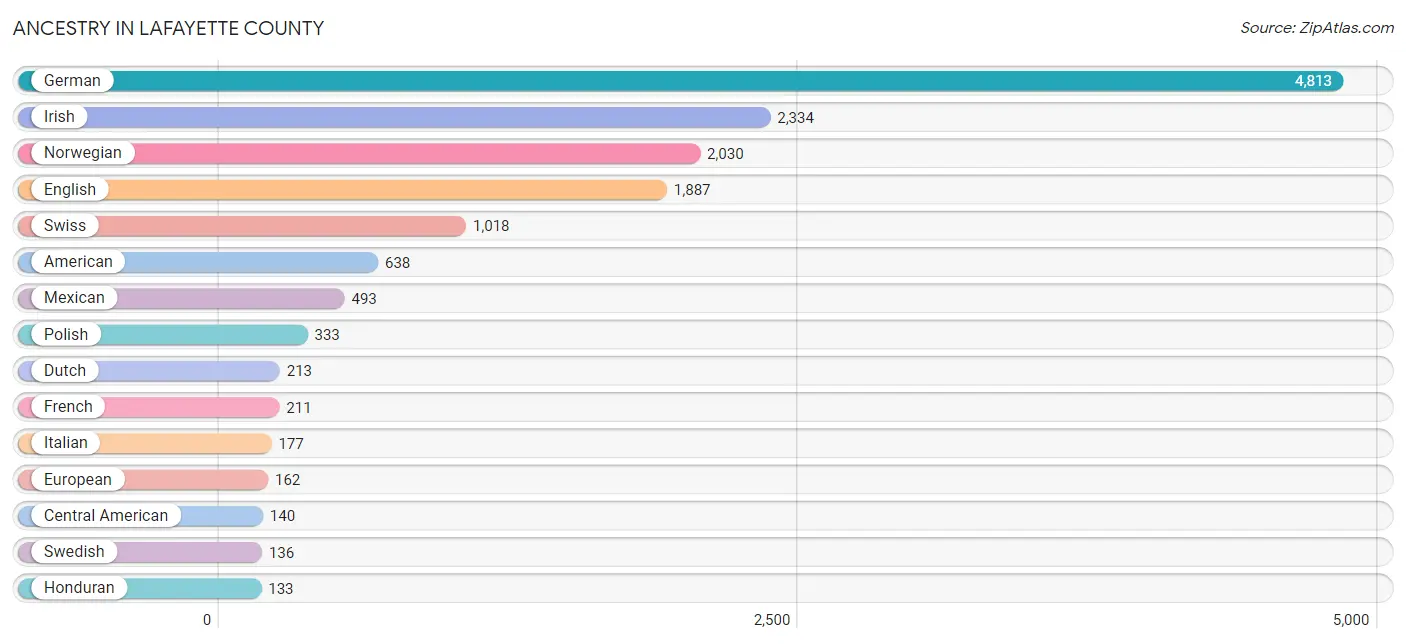
Ancestry in Lafayette County
The most populous ancestries reported in Lafayette County are German (4,813 | 28.8%), Irish (2,334 | 14.0%), Norwegian (2,030 | 12.1%), English (1,887 | 11.3%), and Swiss (1,018 | 6.1%), together accounting for 72.3% of all Lafayette County residents.
| Ancestry | # Population | % Population |
| American | 638 | 3.8% |
| Arab | 1 | 0.0% |
| Australian | 4 | 0.0% |
| Austrian | 14 | 0.1% |
| Bangladeshi | 9 | 0.1% |
| Belgian | 29 | 0.2% |
| Bhutanese | 6 | 0.0% |
| Brazilian | 4 | 0.0% |
| British | 32 | 0.2% |
| Burmese | 27 | 0.2% |
| Central American | 140 | 0.8% |
| Central American Indian | 2 | 0.0% |
| Cherokee | 13 | 0.1% |
| Chippewa | 10 | 0.1% |
| Colombian | 4 | 0.0% |
| Croatian | 2 | 0.0% |
| Cuban | 20 | 0.1% |
| Czech | 70 | 0.4% |
| Czechoslovakian | 13 | 0.1% |
| Danish | 52 | 0.3% |
| Dutch | 213 | 1.3% |
| Eastern European | 7 | 0.0% |
| English | 1,887 | 11.3% |
| Ethiopian | 4 | 0.0% |
| European | 162 | 1.0% |
| Finnish | 3 | 0.0% |
| French | 211 | 1.3% |
| French Canadian | 41 | 0.3% |
| German | 4,813 | 28.8% |
| Greek | 40 | 0.2% |
| Guatemalan | 7 | 0.0% |
| Honduran | 133 | 0.8% |
| Hungarian | 25 | 0.2% |
| Indian (Asian) | 35 | 0.2% |
| Iranian | 1 | 0.0% |
| Irish | 2,334 | 14.0% |
| Iroquois | 1 | 0.0% |
| Italian | 177 | 1.1% |
| Korean | 18 | 0.1% |
| Lebanese | 1 | 0.0% |
| Luxembourger | 4 | 0.0% |
| Macedonian | 1 | 0.0% |
| Menominee | 21 | 0.1% |
| Mexican | 493 | 2.9% |
| Northern European | 4 | 0.0% |
| Norwegian | 2,030 | 12.1% |
| Pakistani | 4 | 0.0% |
| Pennsylvania German | 54 | 0.3% |
| Peruvian | 5 | 0.0% |
| Polish | 333 | 2.0% |
| Portuguese | 4 | 0.0% |
| Puerto Rican | 19 | 0.1% |
| Russian | 17 | 0.1% |
| Scandinavian | 65 | 0.4% |
| Scotch-Irish | 56 | 0.3% |
| Scottish | 125 | 0.7% |
| Sioux | 5 | 0.0% |
| Slavic | 1 | 0.0% |
| Slovak | 4 | 0.0% |
| Slovene | 2 | 0.0% |
| South American | 9 | 0.1% |
| Spanish | 13 | 0.1% |
| Subsaharan African | 4 | 0.0% |
| Swedish | 136 | 0.8% |
| Swiss | 1,018 | 6.1% |
| Thai | 25 | 0.2% |
| Turkish | 26 | 0.2% |
| Ukrainian | 4 | 0.0% |
| Welsh | 63 | 0.4% |
| Yugoslavian | 1 | 0.0% | View All 70 Rows |
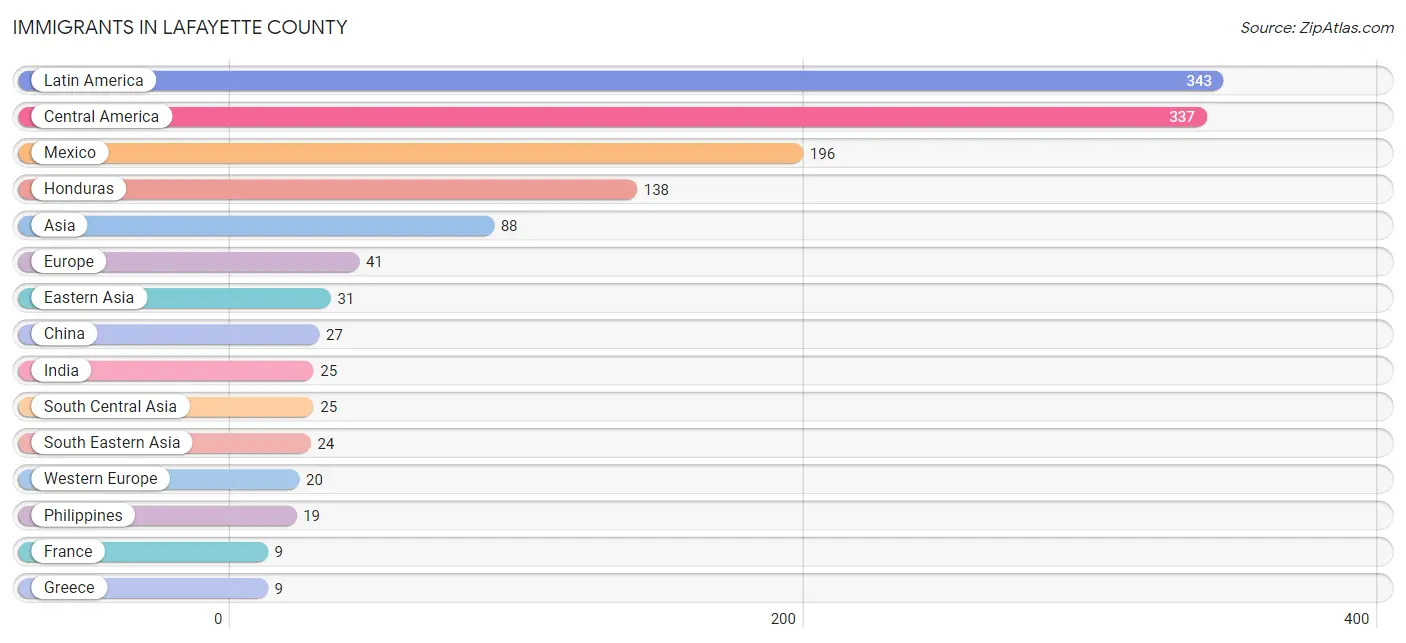
Immigrants in Lafayette County
The most numerous immigrant groups reported in Lafayette County came from Latin America (343 | 2.1%), Central America (337 | 2.0%), Mexico (196 | 1.2%), Honduras (138 | 0.8%), and Asia (88 | 0.5%), together accounting for 6.6% of all Lafayette County residents.
| Immigration Origin | # Population | % Population |
| Africa | 4 | 0.0% |
| Asia | 88 | 0.5% |
| Belgium | 2 | 0.0% |
| Brazil | 6 | 0.0% |
| Central America | 337 | 2.0% |
| China | 27 | 0.2% |
| Eastern Asia | 31 | 0.2% |
| Eastern Europe | 3 | 0.0% |
| England | 7 | 0.0% |
| Europe | 41 | 0.3% |
| France | 9 | 0.1% |
| Germany | 4 | 0.0% |
| Greece | 9 | 0.1% |
| Guatemala | 3 | 0.0% |
| Honduras | 138 | 0.8% |
| India | 25 | 0.2% |
| Korea | 4 | 0.0% |
| Laos | 5 | 0.0% |
| Latin America | 343 | 2.1% |
| Mexico | 196 | 1.2% |
| Netherlands | 5 | 0.0% |
| Northern Europe | 9 | 0.1% |
| Norway | 2 | 0.0% |
| Philippines | 19 | 0.1% |
| Poland | 2 | 0.0% |
| Russia | 1 | 0.0% |
| South Africa | 4 | 0.0% |
| South America | 6 | 0.0% |
| South Central Asia | 25 | 0.2% |
| South Eastern Asia | 24 | 0.1% |
| Southern Europe | 9 | 0.1% |
| Turkey | 8 | 0.1% |
| Western Asia | 8 | 0.1% |
| Western Europe | 20 | 0.1% | View All 34 Rows |
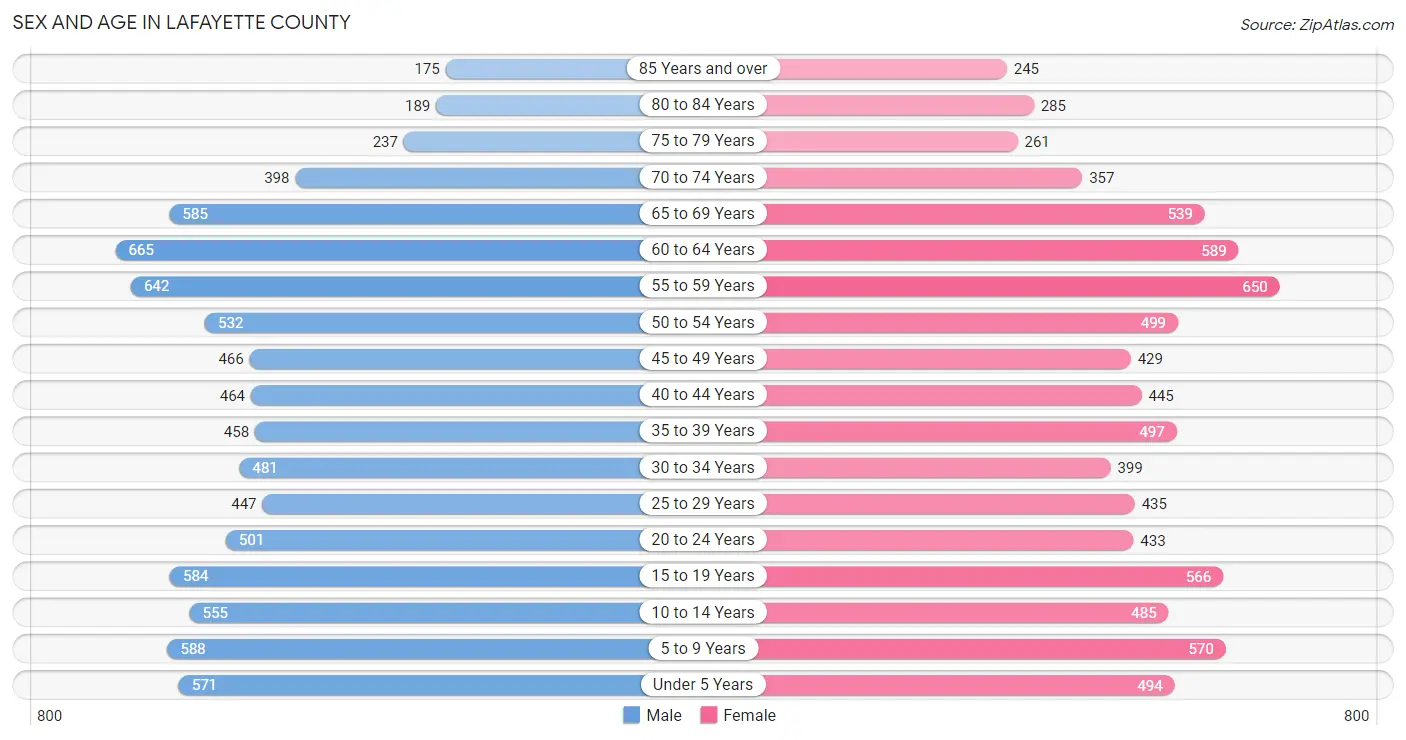
Sex and Age in Lafayette County
Sex and Age in Lafayette County
The most populous age groups in Lafayette County are 60 to 64 Years (665 | 7.8%) for men and 55 to 59 Years (650 | 8.0%) for women.
| Age Bracket | Male | Female |
| Under 5 Years | 571 (6.7%) | 494 (6.0%) |
| 5 to 9 Years | 588 (6.9%) | 570 (7.0%) |
| 10 to 14 Years | 555 (6.5%) | 485 (5.9%) |
| 15 to 19 Years | 584 (6.8%) | 566 (6.9%) |
| 20 to 24 Years | 501 (5.9%) | 433 (5.3%) |
| 25 to 29 Years | 447 (5.2%) | 435 (5.3%) |
| 30 to 34 Years | 481 (5.6%) | 399 (4.9%) |
| 35 to 39 Years | 458 (5.4%) | 497 (6.1%) |
| 40 to 44 Years | 464 (5.4%) | 445 (5.4%) |
| 45 to 49 Years | 466 (5.5%) | 429 (5.2%) |
| 50 to 54 Years | 532 (6.2%) | 499 (6.1%) |
| 55 to 59 Years | 642 (7.5%) | 650 (8.0%) |
| 60 to 64 Years | 665 (7.8%) | 589 (7.2%) |
| 65 to 69 Years | 585 (6.9%) | 539 (6.6%) |
| 70 to 74 Years | 398 (4.7%) | 357 (4.4%) |
| 75 to 79 Years | 237 (2.8%) | 261 (3.2%) |
| 80 to 84 Years | 189 (2.2%) | 285 (3.5%) |
| 85 Years and over | 175 (2.1%) | 245 (3.0%) |
| Total | 8,538 (100.0%) | 8,178 (100.0%) |
Families and Households in Lafayette County
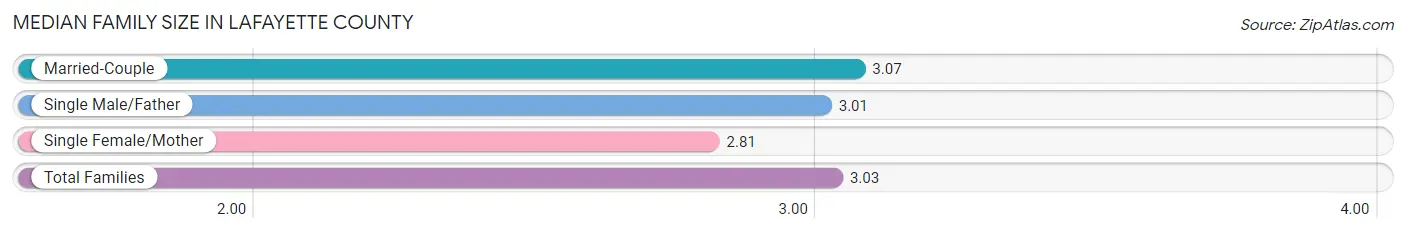
Median Family Size in Lafayette County
The median family size in Lafayette County is 3.03 persons per family, with married-couple families (3,508 | 80.0%) accounting for the largest median family size of 3.07 persons per family. On the other hand, single female/mother families (547 | 12.5%) represent the smallest median family size with 2.81 persons per family.
| Family Type | # Families | Family Size |
| Married-Couple | 3,508 (80.0%) | 3.07 |
| Single Male/Father | 330 (7.5%) | 3.01 |
| Single Female/Mother | 547 (12.5%) | 2.81 |
| Total Families | 4,385 (100.0%) | 3.03 |
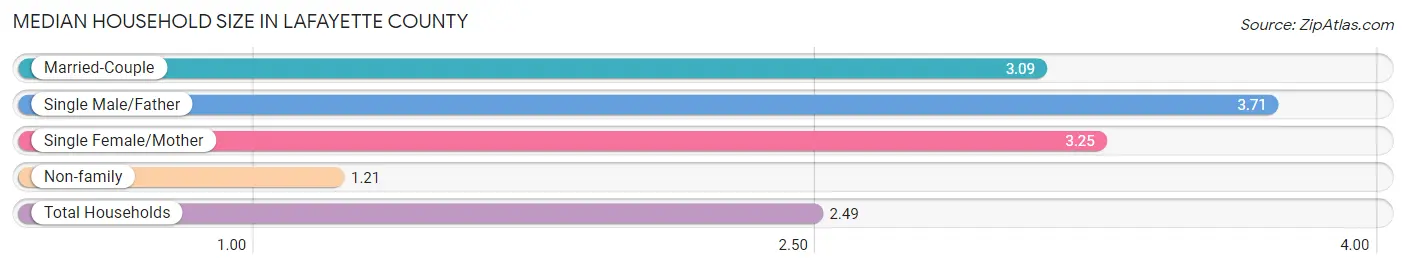
Median Household Size in Lafayette County
The median household size in Lafayette County is 2.49 persons per household, with single male/father households (330 | 5.0%) accounting for the largest median household size of 3.71 persons per household. non-family households (2,267 | 34.1%) represent the smallest median household size with 1.21 persons per household.
| Household Type | # Households | Household Size |
| Married-Couple | 3,508 (52.7%) | 3.09 |
| Single Male/Father | 330 (5.0%) | 3.71 |
| Single Female/Mother | 547 (8.2%) | 3.25 |
| Non-family | 2,267 (34.1%) | 1.21 |
| Total Households | 6,652 (100.0%) | 2.49 |
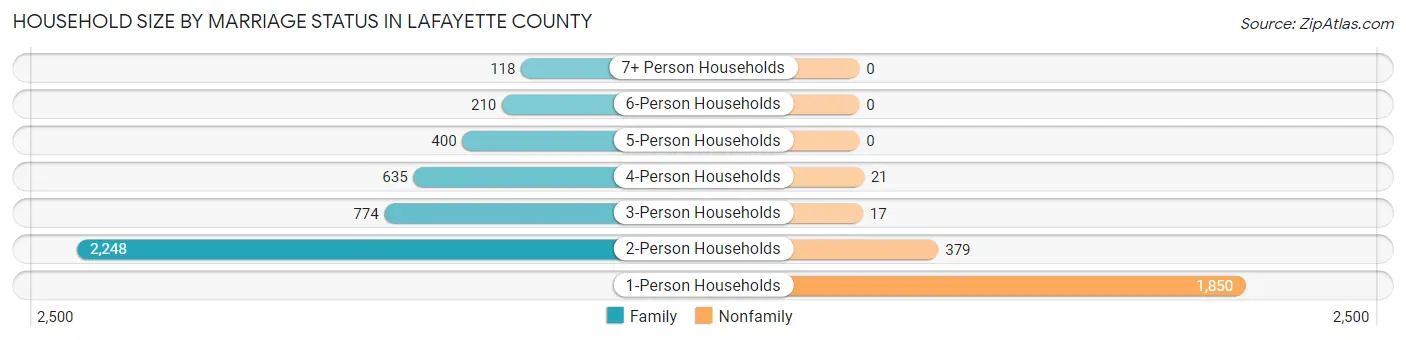
Household Size by Marriage Status in Lafayette County
Out of a total of 6,652 households in Lafayette County, 4,385 (65.9%) are family households, while 2,267 (34.1%) are nonfamily households. The most numerous type of family households are 2-person households, comprising 2,248, and the most common type of nonfamily households are 1-person households, comprising 1,850.
| Household Size | Family Households | Nonfamily Households |
| 1-Person Households | - | 1,850 (27.8%) |
| 2-Person Households | 2,248 (33.8%) | 379 (5.7%) |
| 3-Person Households | 774 (11.6%) | 17 (0.3%) |
| 4-Person Households | 635 (9.6%) | 21 (0.3%) |
| 5-Person Households | 400 (6.0%) | 0 (0.0%) |
| 6-Person Households | 210 (3.2%) | 0 (0.0%) |
| 7+ Person Households | 118 (1.8%) | 0 (0.0%) |
| Total | 4,385 (65.9%) | 2,267 (34.1%) |
Female Fertility in Lafayette County
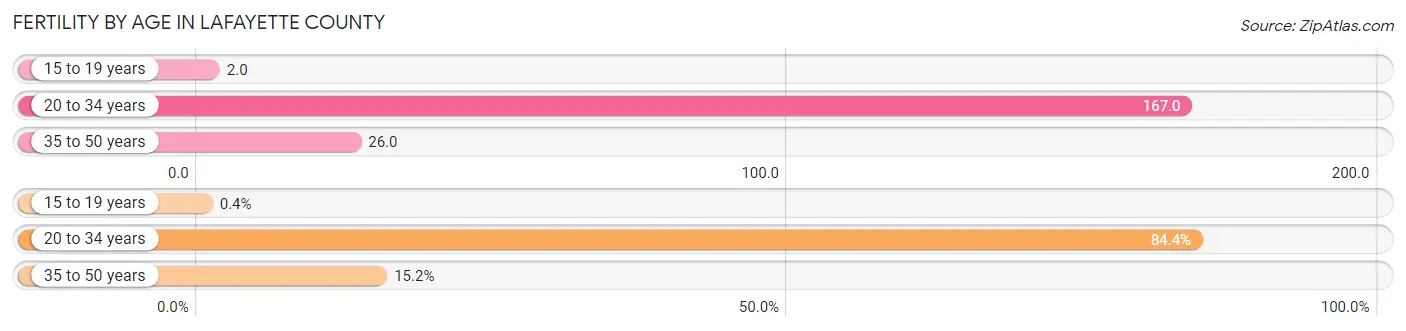
Fertility by Age in Lafayette County
Average fertility rate in Lafayette County is 76.0 births per 1,000 women. Women in the age bracket of 20 to 34 years have the highest fertility rate with 167.0 births per 1,000 women. Women in the age bracket of 20 to 34 years acount for 84.4% of all women with births.
| Age Bracket | Women with Births | Births / 1,000 Women |
| 15 to 19 years | 1 (0.4%) | 2.0 |
| 20 to 34 years | 211 (84.4%) | 167.0 |
| 35 to 50 years | 38 (15.2%) | 26.0 |
| Total | 250 (100.0%) | 76.0 |
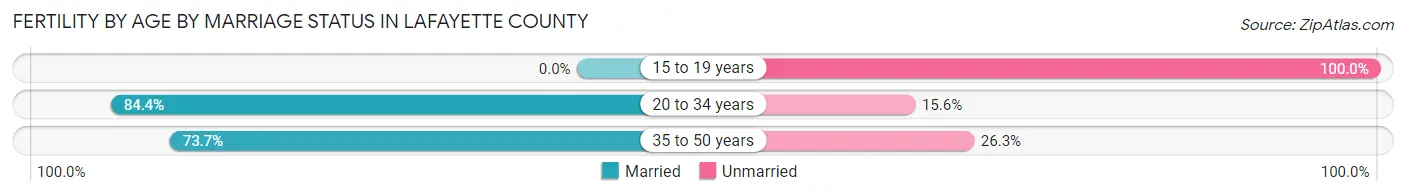
Fertility by Age by Marriage Status in Lafayette County
82.4% of women with births (250) in Lafayette County are married. The highest percentage of unmarried women with births falls into 15 to 19 years age bracket with 100.0% of them unmarried at the time of birth, while the lowest percentage of unmarried women with births belong to 20 to 34 years age bracket with 15.6% of them unmarried.
| Age Bracket | Married | Unmarried |
| 15 to 19 years | 0 (0.0%) | 1 (100.0%) |
| 20 to 34 years | 178 (84.4%) | 33 (15.6%) |
| 35 to 50 years | 28 (73.7%) | 10 (26.3%) |
| Total | 206 (82.4%) | 44 (17.6%) |
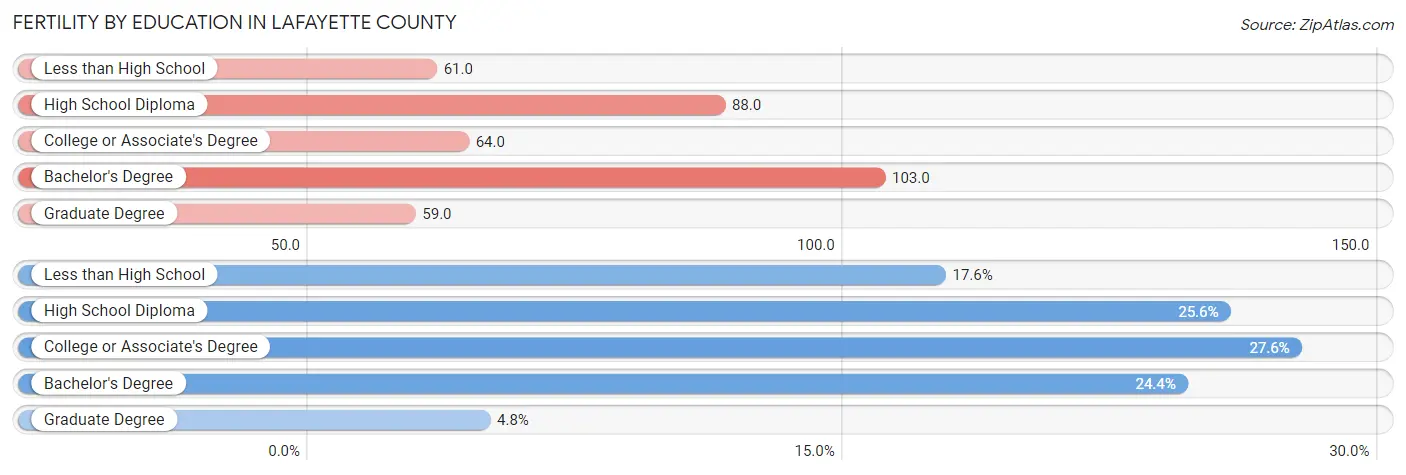
Fertility by Education in Lafayette County
Average fertility rate in Lafayette County is 76.0 births per 1,000 women. Women with the education attainment of bachelor's degree have the highest fertility rate of 103.0 births per 1,000 women, while women with the education attainment of graduate degree have the lowest fertility at 59.0 births per 1,000 women. Women with the education attainment of college or associate's degree represent 27.6% of all women with births.
| Educational Attainment | Women with Births | Births / 1,000 Women |
| Less than High School | 44 (17.6%) | 61.0 |
| High School Diploma | 64 (25.6%) | 88.0 |
| College or Associate's Degree | 69 (27.6%) | 64.0 |
| Bachelor's Degree | 61 (24.4%) | 103.0 |
| Graduate Degree | 12 (4.8%) | 59.0 |
| Total | 250 (100.0%) | 76.0 |
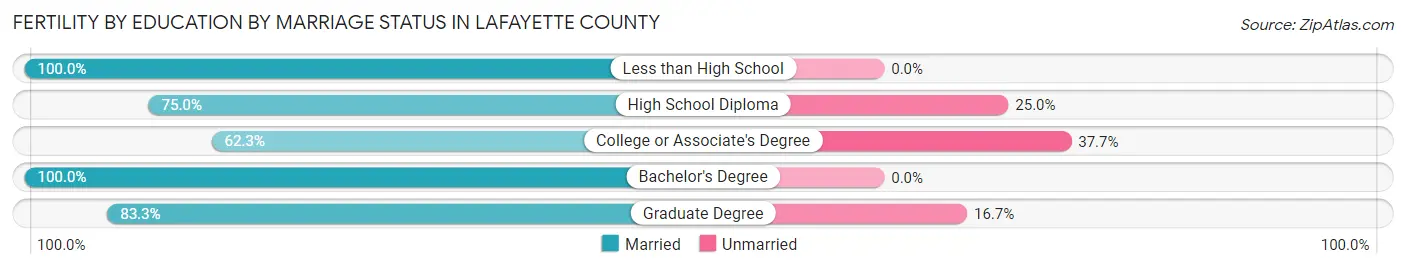
Fertility by Education by Marriage Status in Lafayette County
17.6% of women with births in Lafayette County are unmarried. Women with the educational attainment of less than high school are most likely to be married with 100.0% of them married at childbirth, while women with the educational attainment of college or associate's degree are least likely to be married with 37.7% of them unmarried at childbirth.
| Educational Attainment | Married | Unmarried |
| Less than High School | 44 (100.0%) | 0 (0.0%) |
| High School Diploma | 48 (75.0%) | 16 (25.0%) |
| College or Associate's Degree | 43 (62.3%) | 26 (37.7%) |
| Bachelor's Degree | 61 (100.0%) | 0 (0.0%) |
| Graduate Degree | 10 (83.3%) | 2 (16.7%) |
| Total | 206 (82.4%) | 44 (17.6%) |
Income in Lafayette County
Income Overview in Lafayette County
Per Capita Income in Lafayette County is $33,484, while median incomes of families and households are $82,434 and $69,293 respectively.
| Characteristic | Number | Measure |
| Per Capita Income | 16,716 | $33,484 |
| Median Family Income | 4,385 | $82,434 |
| Mean Family Income | 4,385 | $95,446 |
| Median Household Income | 6,652 | $69,293 |
| Mean Household Income | 6,652 | $83,219 |
| Income Deficit | 4,385 | $13,253 |
| Wage / Income Gap (%) | 16,716 | 25.06% |
| Wage / Income Gap ($) | 16,716 | 74.94¢ per $1 |
| Gini / Inequality Index | 16,716 | 0.41 |
Earnings by Sex in Lafayette County
Average Earnings in Lafayette County are $41,125, $46,800 for men and $35,071 for women, a difference of 25.1%.
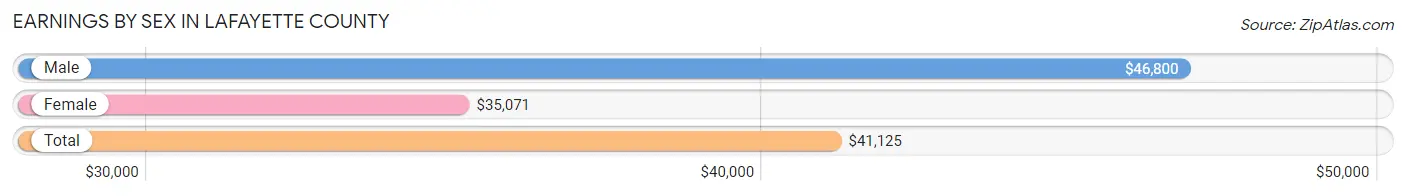
| Sex | Number | Average Earnings |
| Male | 4,895 (54.4%) | $46,800 |
| Female | 4,103 (45.6%) | $35,071 |
| Total | 8,998 (100.0%) | $41,125 |
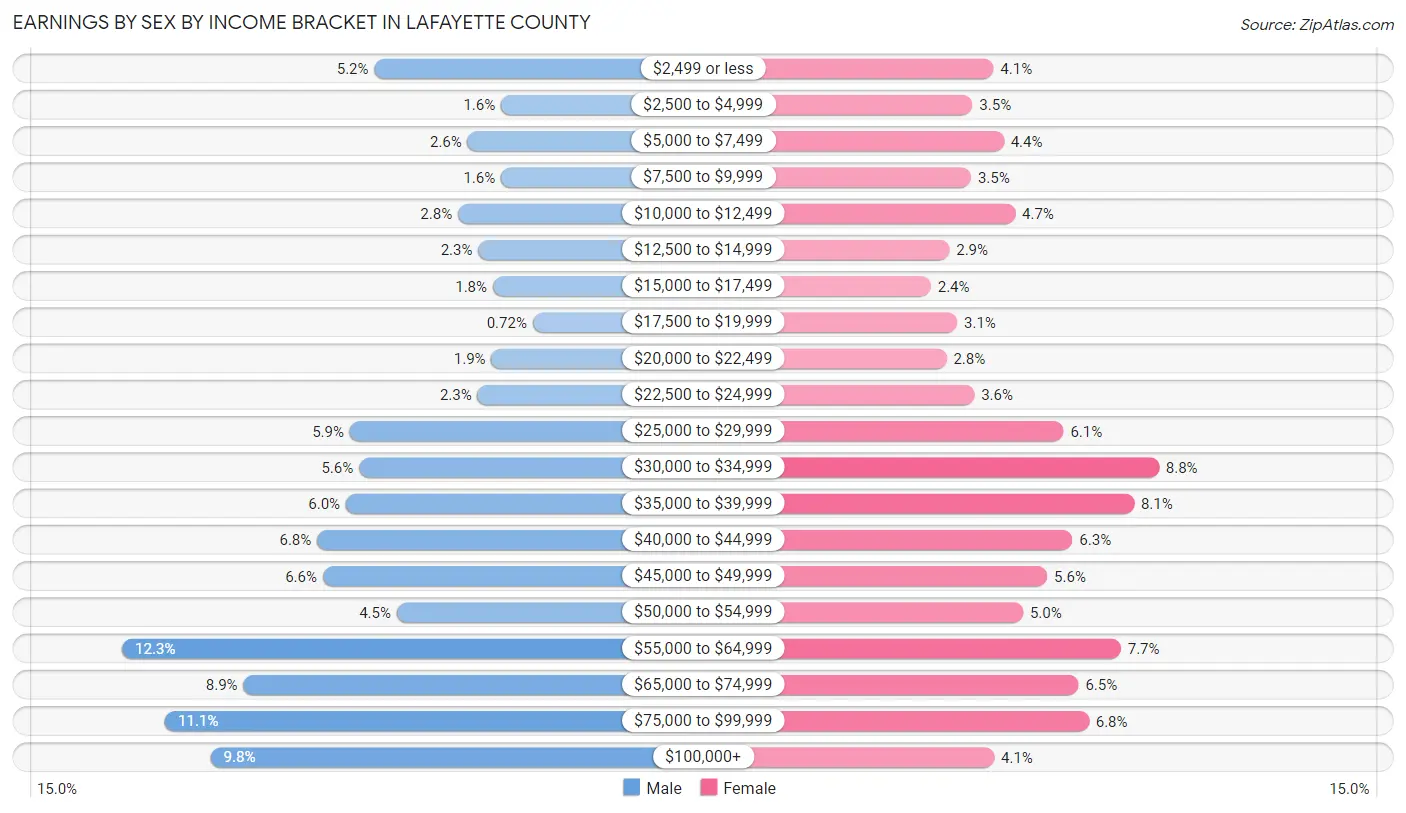
Earnings by Sex by Income Bracket in Lafayette County
The most common earnings brackets in Lafayette County are $55,000 to $64,999 for men (600 | 12.3%) and $30,000 to $34,999 for women (360 | 8.8%).
| Income | Male | Female |
| $2,499 or less | 253 (5.2%) | 169 (4.1%) |
| $2,500 to $4,999 | 79 (1.6%) | 145 (3.5%) |
| $5,000 to $7,499 | 125 (2.5%) | 181 (4.4%) |
| $7,500 to $9,999 | 79 (1.6%) | 143 (3.5%) |
| $10,000 to $12,499 | 138 (2.8%) | 194 (4.7%) |
| $12,500 to $14,999 | 110 (2.2%) | 118 (2.9%) |
| $15,000 to $17,499 | 90 (1.8%) | 97 (2.4%) |
| $17,500 to $19,999 | 35 (0.7%) | 127 (3.1%) |
| $20,000 to $22,499 | 92 (1.9%) | 115 (2.8%) |
| $22,500 to $24,999 | 111 (2.3%) | 147 (3.6%) |
| $25,000 to $29,999 | 287 (5.9%) | 250 (6.1%) |
| $30,000 to $34,999 | 274 (5.6%) | 360 (8.8%) |
| $35,000 to $39,999 | 292 (6.0%) | 331 (8.1%) |
| $40,000 to $44,999 | 332 (6.8%) | 260 (6.3%) |
| $45,000 to $49,999 | 324 (6.6%) | 231 (5.6%) |
| $50,000 to $54,999 | 222 (4.5%) | 203 (5.0%) |
| $55,000 to $64,999 | 600 (12.3%) | 316 (7.7%) |
| $65,000 to $74,999 | 433 (8.8%) | 267 (6.5%) |
| $75,000 to $99,999 | 541 (11.1%) | 279 (6.8%) |
| $100,000+ | 478 (9.8%) | 170 (4.1%) |
| Total | 4,895 (100.0%) | 4,103 (100.0%) |
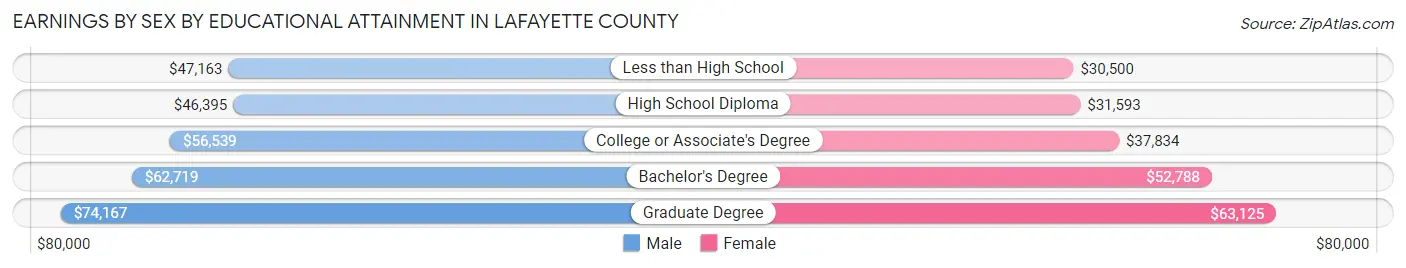
Earnings by Sex by Educational Attainment in Lafayette County
Average earnings in Lafayette County are $52,058 for men and $39,185 for women, a difference of 24.7%. Men with an educational attainment of graduate degree enjoy the highest average annual earnings of $74,167, while those with high school diploma education earn the least with $46,395. Women with an educational attainment of graduate degree earn the most with the average annual earnings of $63,125, while those with less than high school education have the smallest earnings of $30,500.
| Educational Attainment | Male Income | Female Income |
| Less than High School | $47,163 | $30,500 |
| High School Diploma | $46,395 | $31,593 |
| College or Associate's Degree | $56,539 | $37,834 |
| Bachelor's Degree | $62,719 | $52,788 |
| Graduate Degree | $74,167 | $63,125 |
| Total | $52,058 | $39,185 |
Family Income in Lafayette County
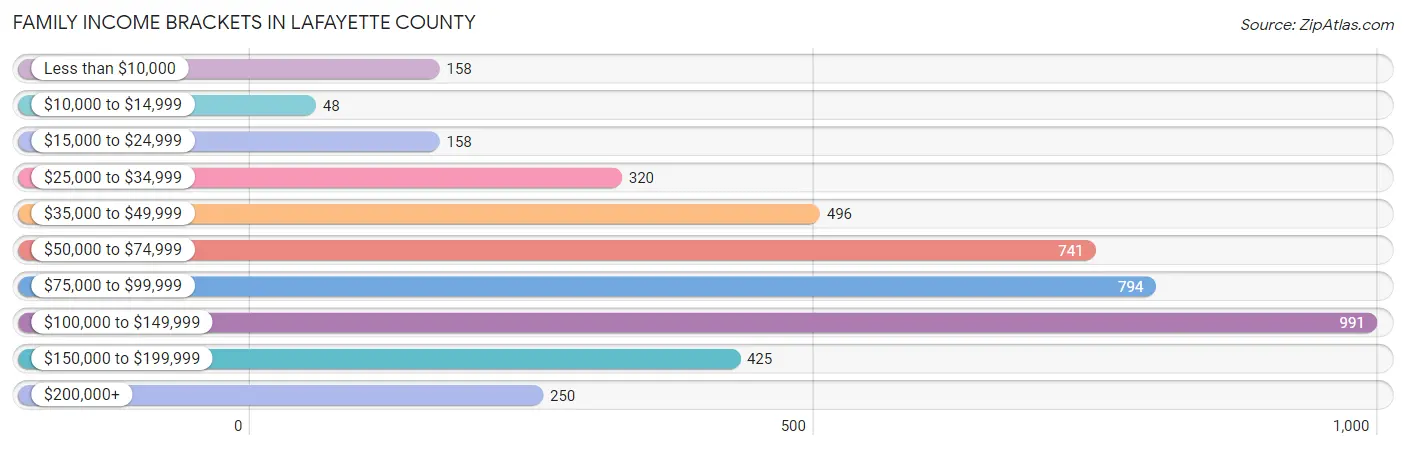
Family Income Brackets in Lafayette County
According to the Lafayette County family income data, there are 991 families falling into the $100,000 to $149,999 income range, which is the most common income bracket and makes up 22.6% of all families. Conversely, the $10,000 to $14,999 income bracket is the least frequent group with only 48 families (1.1%) belonging to this category.
| Income Bracket | # Families | % Families |
| Less than $10,000 | 158 | 3.6% |
| $10,000 to $14,999 | 48 | 1.1% |
| $15,000 to $24,999 | 158 | 3.6% |
| $25,000 to $34,999 | 320 | 7.3% |
| $35,000 to $49,999 | 496 | 11.3% |
| $50,000 to $74,999 | 741 | 16.9% |
| $75,000 to $99,999 | 794 | 18.1% |
| $100,000 to $149,999 | 991 | 22.6% |
| $150,000 to $199,999 | 425 | 9.7% |
| $200,000+ | 250 | 5.7% |
Family Income by Famaliy Size in Lafayette County
6-person families (177 | 4.0%) account for the highest median family income in Lafayette County with $115,972 per family, while 2-person families (2,444 | 55.7%) have the highest median income of $36,579 per family member.

| Income Bracket | # Families | Median Income |
| 2-Person Families | 2,444 (55.7%) | $73,158 |
| 3-Person Families | 696 (15.9%) | $94,545 |
| 4-Person Families | 572 (13.0%) | $92,000 |
| 5-Person Families | 383 (8.7%) | $101,875 |
| 6-Person Families | 177 (4.0%) | $115,972 |
| 7+ Person Families | 113 (2.6%) | $89,375 |
| Total | 4,385 (100.0%) | $82,434 |
Family Income by Number of Earners in Lafayette County
The median family income in Lafayette County is $82,434, with families comprising 3+ earners (457) having the highest median family income of $139,338, while families with no earners (661) have the lowest median family income of $41,902, accounting for 10.4% and 15.1% of families, respectively.
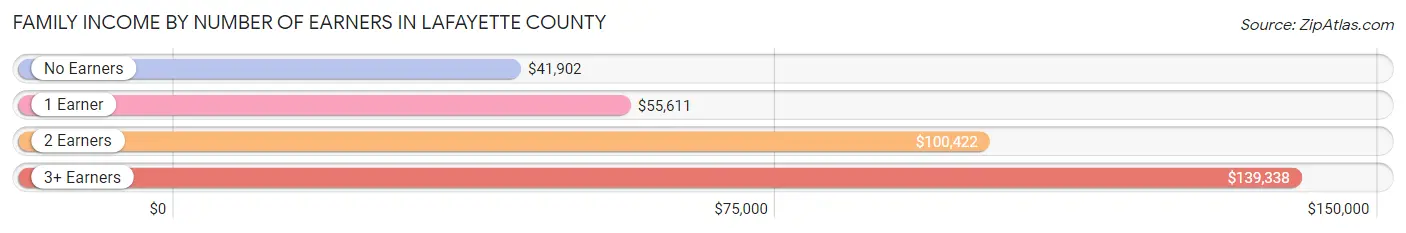
| Number of Earners | # Families | Median Income |
| No Earners | 661 (15.1%) | $41,902 |
| 1 Earner | 1,268 (28.9%) | $55,611 |
| 2 Earners | 1,999 (45.6%) | $100,422 |
| 3+ Earners | 457 (10.4%) | $139,338 |
| Total | 4,385 (100.0%) | $82,434 |
Household Income in Lafayette County
Household Income Brackets in Lafayette County
With 1,231 households falling in the category, the $100,000 to $149,999 income range is the most frequent in Lafayette County, accounting for 18.5% of all households. In contrast, only 213 households (3.2%) fall into the $10,000 to $14,999 income bracket, making it the least populous group.
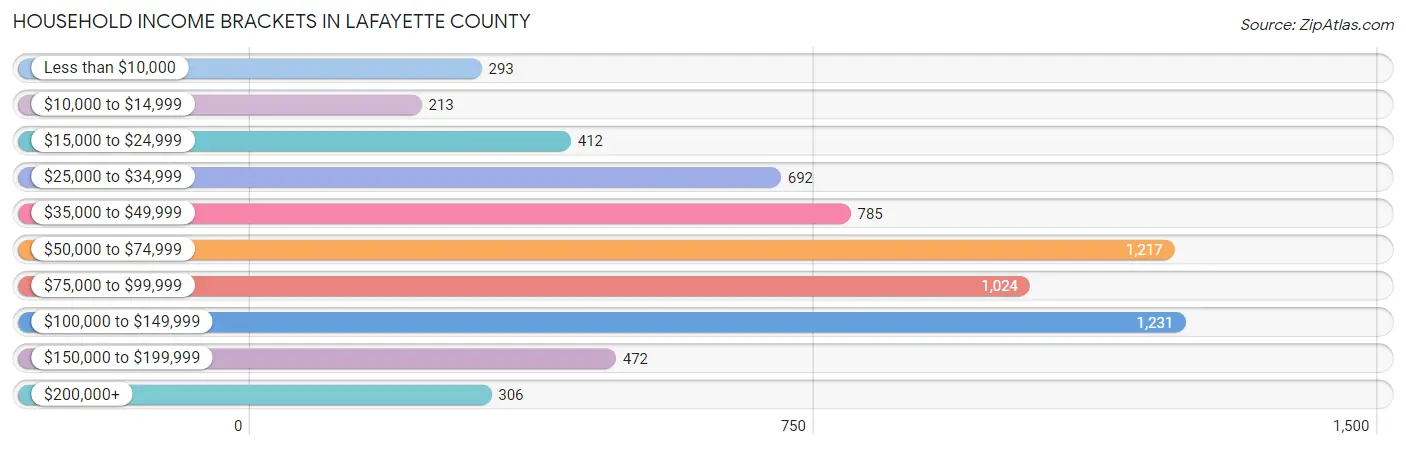
| Income Bracket | # Households | % Households |
| Less than $10,000 | 293 | 4.4% |
| $10,000 to $14,999 | 213 | 3.2% |
| $15,000 to $24,999 | 412 | 6.2% |
| $25,000 to $34,999 | 692 | 10.4% |
| $35,000 to $49,999 | 785 | 11.8% |
| $50,000 to $74,999 | 1,217 | 18.3% |
| $75,000 to $99,999 | 1,024 | 15.4% |
| $100,000 to $149,999 | 1,231 | 18.5% |
| $150,000 to $199,999 | 472 | 7.1% |
| $200,000+ | 306 | 4.6% |
Household Income by Householder Age in Lafayette County
The median household income in Lafayette County is $69,293, with the highest median household income of $84,841 found in the 25 to 44 years age bracket for the primary householder. A total of 1,776 households (26.7%) fall into this category. Meanwhile, the 65+ years age bracket for the primary householder has the lowest median household income of $44,299, with 2,169 households (32.6%) in this group.
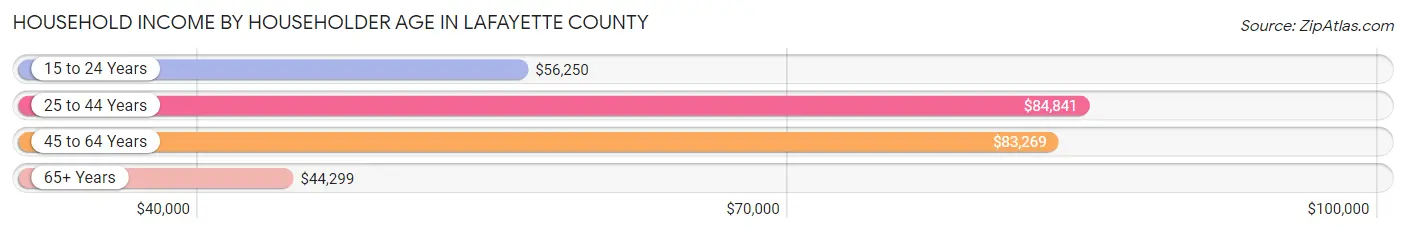
| Income Bracket | # Households | Median Income |
| 15 to 24 Years | 209 (3.1%) | $56,250 |
| 25 to 44 Years | 1,776 (26.7%) | $84,841 |
| 45 to 64 Years | 2,498 (37.6%) | $83,269 |
| 65+ Years | 2,169 (32.6%) | $44,299 |
| Total | 6,652 (100.0%) | $69,293 |
Poverty in Lafayette County
Income Below Poverty by Sex and Age in Lafayette County
With 9.4% poverty level for males and 11.7% for females among the residents of Lafayette County, 15 year old males and 15 year old females are the most vulnerable to poverty, with 32 males (25.4%) and 40 females (26.1%) in their respective age groups living below the poverty level.
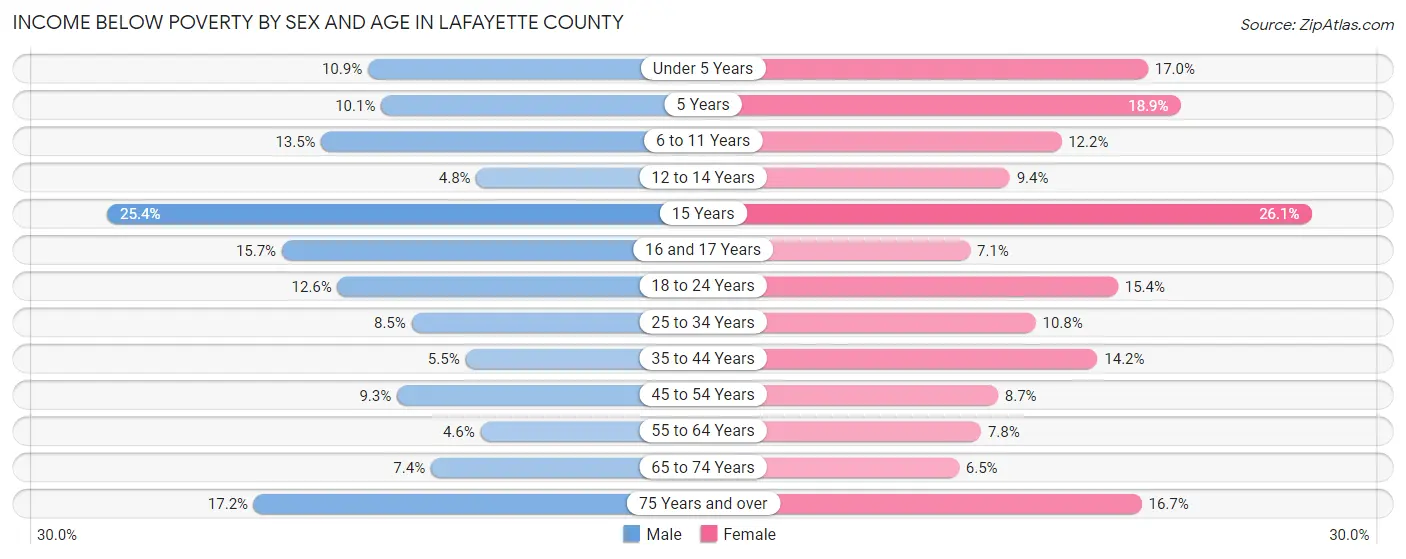
| Age Bracket | Male | Female |
| Under 5 Years | 62 (10.9%) | 83 (17.0%) |
| 5 Years | 7 (10.1%) | 23 (18.9%) |
| 6 to 11 Years | 101 (13.5%) | 72 (12.2%) |
| 12 to 14 Years | 15 (4.8%) | 30 (9.3%) |
| 15 Years | 32 (25.4%) | 40 (26.1%) |
| 16 and 17 Years | 42 (15.7%) | 15 (7.1%) |
| 18 to 24 Years | 85 (12.6%) | 97 (15.4%) |
| 25 to 34 Years | 78 (8.5%) | 90 (10.8%) |
| 35 to 44 Years | 50 (5.4%) | 134 (14.2%) |
| 45 to 54 Years | 92 (9.3%) | 80 (8.7%) |
| 55 to 64 Years | 60 (4.6%) | 96 (7.7%) |
| 65 to 74 Years | 71 (7.4%) | 58 (6.5%) |
| 75 Years and over | 102 (17.2%) | 129 (16.7%) |
| Total | 797 (9.4%) | 947 (11.7%) |
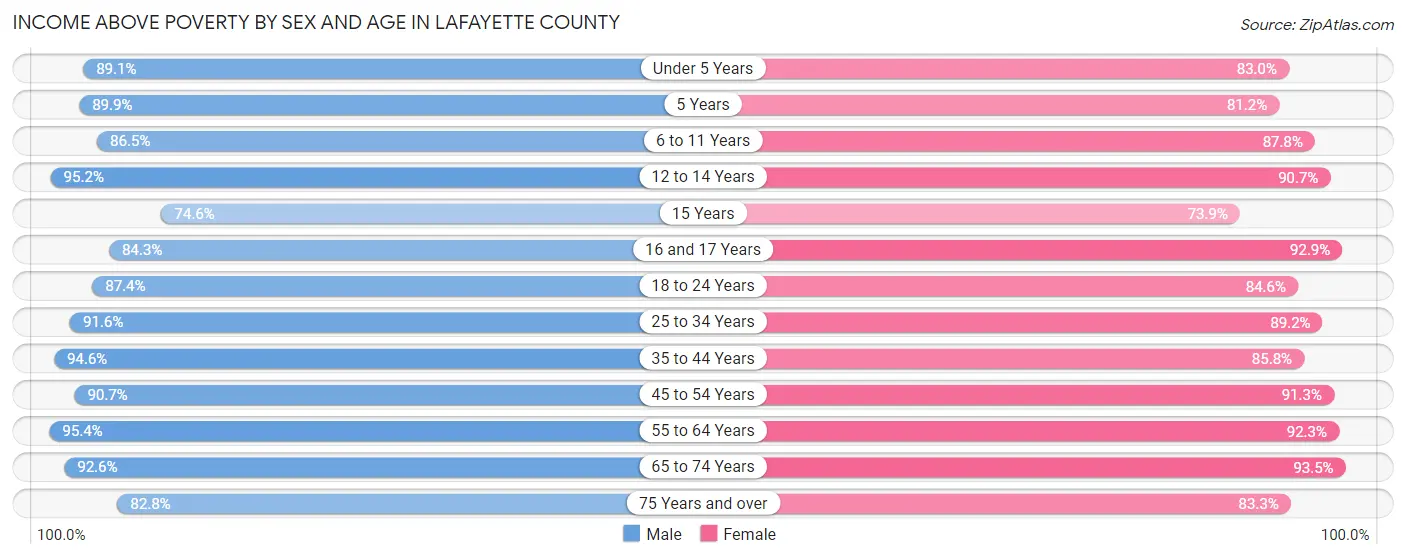
Income Above Poverty by Sex and Age in Lafayette County
According to the poverty statistics in Lafayette County, males aged 55 to 64 years and females aged 65 to 74 years are the age groups that are most secure financially, with 95.4% of males and 93.5% of females in these age groups living above the poverty line.
| Age Bracket | Male | Female |
| Under 5 Years | 508 (89.1%) | 404 (83.0%) |
| 5 Years | 62 (89.9%) | 99 (81.1%) |
| 6 to 11 Years | 649 (86.5%) | 517 (87.8%) |
| 12 to 14 Years | 295 (95.2%) | 291 (90.6%) |
| 15 Years | 94 (74.6%) | 113 (73.9%) |
| 16 and 17 Years | 226 (84.3%) | 195 (92.9%) |
| 18 to 24 Years | 591 (87.4%) | 534 (84.6%) |
| 25 to 34 Years | 845 (91.5%) | 744 (89.2%) |
| 35 to 44 Years | 867 (94.6%) | 808 (85.8%) |
| 45 to 54 Years | 902 (90.7%) | 841 (91.3%) |
| 55 to 64 Years | 1,242 (95.4%) | 1,142 (92.2%) |
| 65 to 74 Years | 892 (92.6%) | 832 (93.5%) |
| 75 Years and over | 490 (82.8%) | 644 (83.3%) |
| Total | 7,663 (90.6%) | 7,164 (88.3%) |
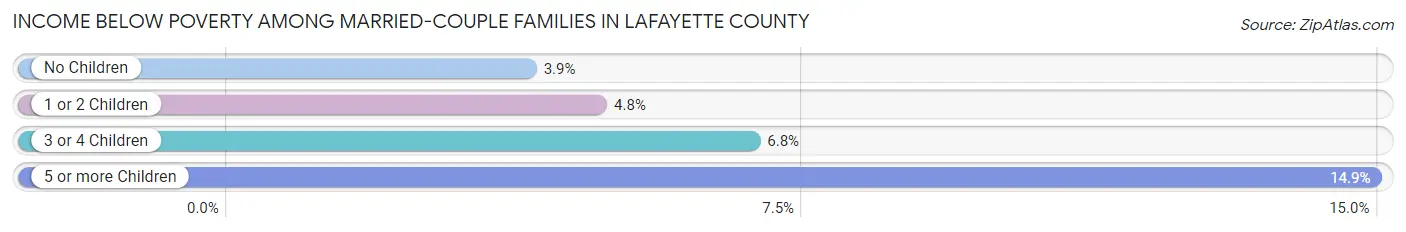
Income Below Poverty Among Married-Couple Families in Lafayette County
The poverty statistics for married-couple families in Lafayette County show that 4.7% or 166 of the total 3,508 families live below the poverty line. Families with 5 or more children have the highest poverty rate of 14.9%, comprising of 13 families. On the other hand, families with no children have the lowest poverty rate of 3.9%, which includes 87 families.
| Children | Above Poverty | Below Poverty |
| No Children | 2,141 (96.1%) | 87 (3.9%) |
| 1 or 2 Children | 731 (95.2%) | 37 (4.8%) |
| 3 or 4 Children | 396 (93.2%) | 29 (6.8%) |
| 5 or more Children | 74 (85.1%) | 13 (14.9%) |
| Total | 3,342 (95.3%) | 166 (4.7%) |
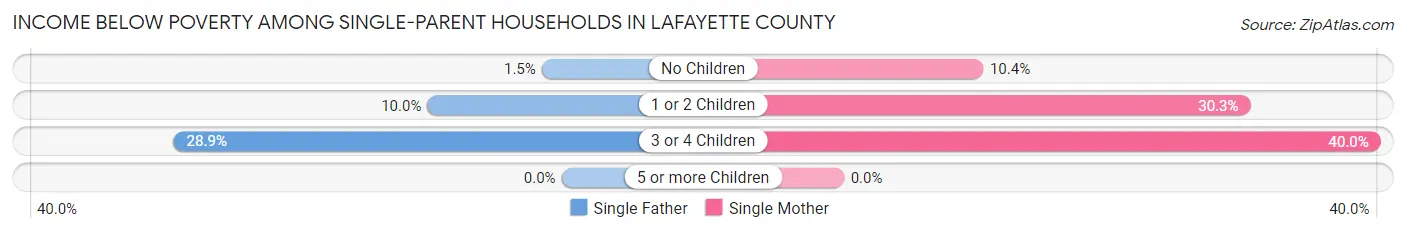
Income Below Poverty Among Single-Parent Households in Lafayette County
According to the poverty data in Lafayette County, 9.1% or 30 single-father households and 25.2% or 138 single-mother households are living below the poverty line. Among single-father households, those with 3 or 4 children have the highest poverty rate, with 13 households (28.9%) experiencing poverty. Likewise, among single-mother households, those with 3 or 4 children have the highest poverty rate, with 36 households (40.0%) falling below the poverty line.
| Children | Single Father | Single Mother |
| No Children | 2 (1.5%) | 19 (10.4%) |
| 1 or 2 Children | 15 (10.0%) | 83 (30.3%) |
| 3 or 4 Children | 13 (28.9%) | 36 (40.0%) |
| 5 or more Children | 0 (0.0%) | 0 (0.0%) |
| Total | 30 (9.1%) | 138 (25.2%) |
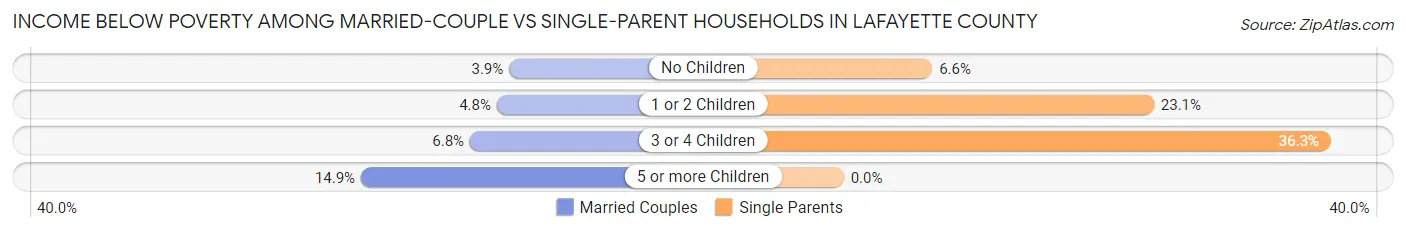
Income Below Poverty Among Married-Couple vs Single-Parent Households in Lafayette County
The poverty data for Lafayette County shows that 166 of the married-couple family households (4.7%) and 168 of the single-parent households (19.2%) are living below the poverty level. Within the married-couple family households, those with 5 or more children have the highest poverty rate, with 13 households (14.9%) falling below the poverty line. Among the single-parent households, those with 3 or 4 children have the highest poverty rate, with 49 household (36.3%) living below poverty.
| Children | Married-Couple Families | Single-Parent Households |
| No Children | 87 (3.9%) | 21 (6.6%) |
| 1 or 2 Children | 37 (4.8%) | 98 (23.1%) |
| 3 or 4 Children | 29 (6.8%) | 49 (36.3%) |
| 5 or more Children | 13 (14.9%) | 0 (0.0%) |
| Total | 166 (4.7%) | 168 (19.2%) |
Employment Characteristics in Lafayette County
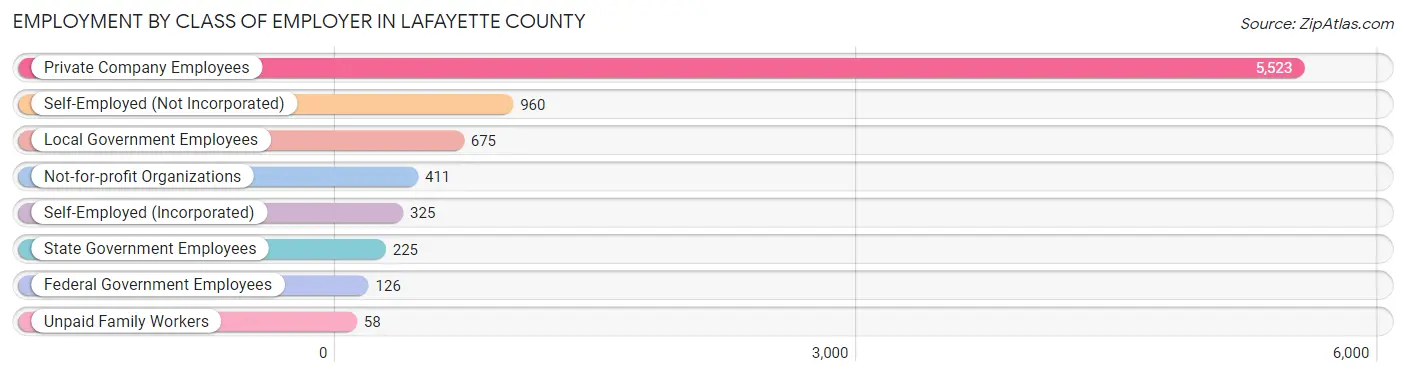
Employment by Class of Employer in Lafayette County
Among the 8,303 employed individuals in Lafayette County, private company employees (5,523 | 66.5%), self-employed (not incorporated) (960 | 11.6%), and local government employees (675 | 8.1%) make up the most common classes of employment.
| Employer Class | # Employees | % Employees |
| Private Company Employees | 5,523 | 66.5% |
| Self-Employed (Incorporated) | 325 | 3.9% |
| Self-Employed (Not Incorporated) | 960 | 11.6% |
| Not-for-profit Organizations | 411 | 5.0% |
| Local Government Employees | 675 | 8.1% |
| State Government Employees | 225 | 2.7% |
| Federal Government Employees | 126 | 1.5% |
| Unpaid Family Workers | 58 | 0.7% |
| Total | 8,303 | 100.0% |
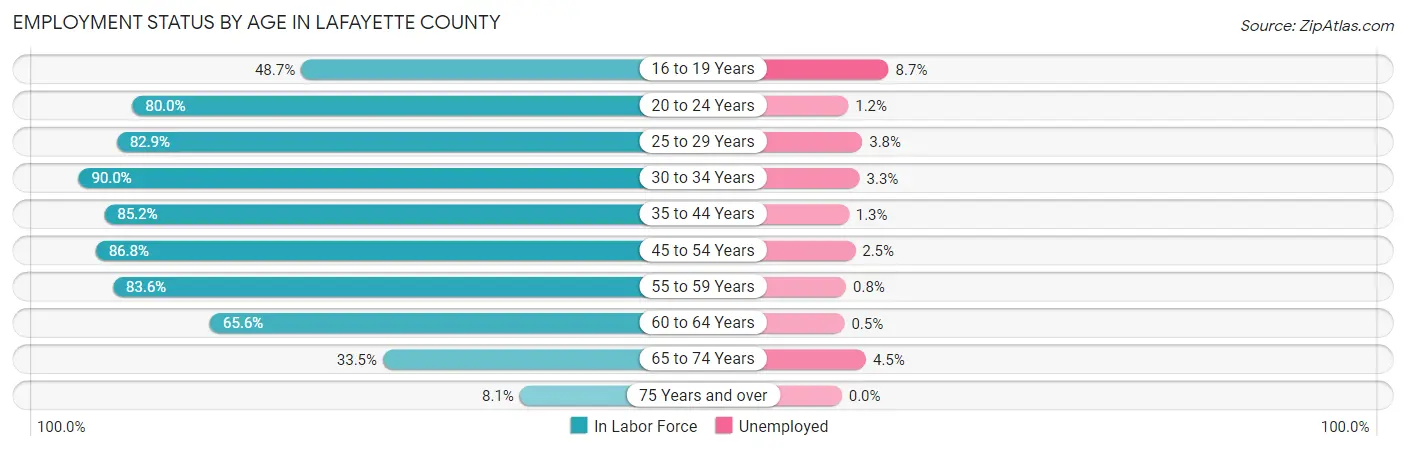
Employment Status by Age in Lafayette County
According to the labor force statistics for Lafayette County, out of the total population over 16 years of age (13,174), 65.3% or 8,603 individuals are in the labor force, with 2.4% or 206 of them unemployed. The age group with the highest labor force participation rate is 30 to 34 years, with 90.0% or 792 individuals in the labor force. Within the labor force, the 16 to 19 years age range has the highest percentage of unemployed individuals, with 8.7% or 37 of them being unemployed.
| Age Bracket | In Labor Force | Unemployed |
| 16 to 19 Years | 424 (48.7%) | 37 (8.7%) |
| 20 to 24 Years | 747 (80.0%) | 9 (1.2%) |
| 25 to 29 Years | 731 (82.9%) | 28 (3.8%) |
| 30 to 34 Years | 792 (90.0%) | 26 (3.3%) |
| 35 to 44 Years | 1,588 (85.2%) | 21 (1.3%) |
| 45 to 54 Years | 1,672 (86.8%) | 42 (2.5%) |
| 55 to 59 Years | 1,080 (83.6%) | 9 (0.8%) |
| 60 to 64 Years | 823 (65.6%) | 4 (0.5%) |
| 65 to 74 Years | 629 (33.5%) | 28 (4.5%) |
| 75 Years and over | 113 (8.1%) | 0 (0.0%) |
| Total | 8,603 (65.3%) | 206 (2.4%) |
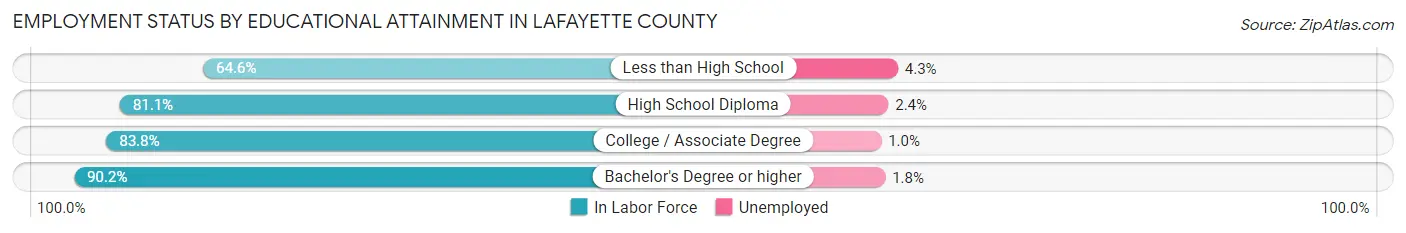
Employment Status by Educational Attainment in Lafayette County
According to labor force statistics for Lafayette County, 82.5% of individuals (6,681) out of the total population between 25 and 64 years of age (8,098) are in the labor force, with 1.9% or 127 of them being unemployed. The group with the highest labor force participation rate are those with the educational attainment of bachelor's degree or higher, with 90.2% or 1,624 individuals in the labor force. Within the labor force, individuals with less than high school education have the highest percentage of unemployment, with 4.3% or 20 of them being unemployed.
| Educational Attainment | In Labor Force | Unemployed |
| Less than High School | 463 (64.6%) | 31 (4.3%) |
| High School Diploma | 2,353 (81.1%) | 70 (2.4%) |
| College / Associate Degree | 2,246 (83.8%) | 27 (1.0%) |
| Bachelor's Degree or higher | 1,624 (90.2%) | 32 (1.8%) |
| Total | 6,681 (82.5%) | 154 (1.9%) |
Employment Occupations by Sex in Lafayette County
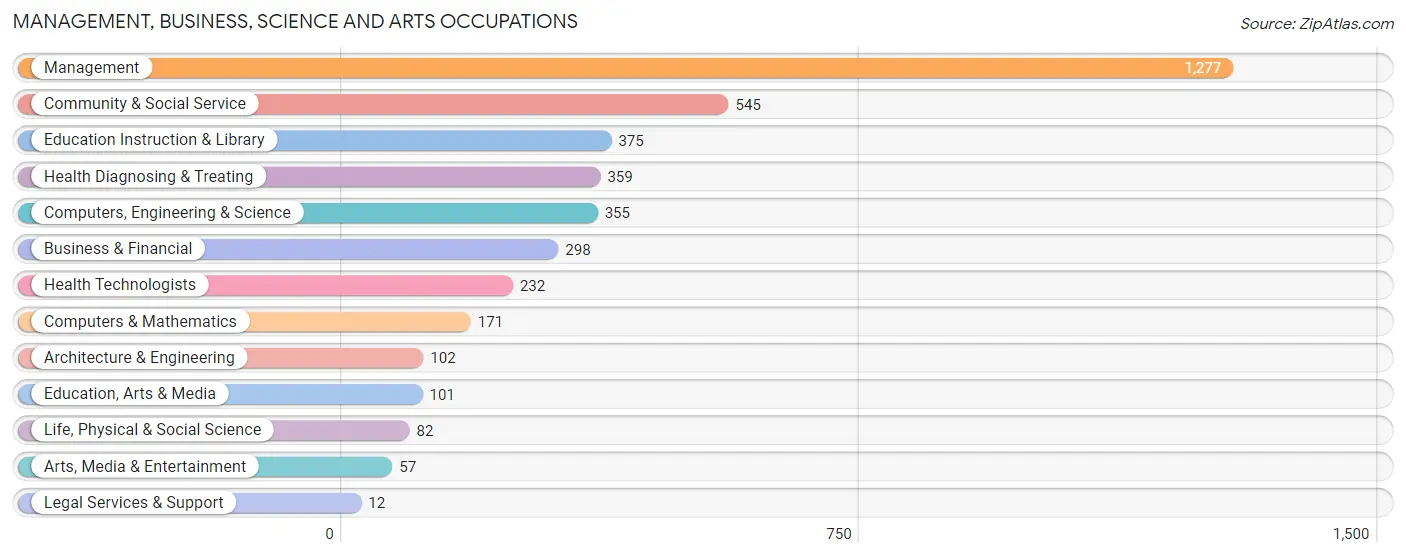
Management, Business, Science and Arts Occupations
The most common Management, Business, Science and Arts occupations in Lafayette County are Management (1,277 | 15.2%), Community & Social Service (545 | 6.5%), Education Instruction & Library (375 | 4.5%), Health Diagnosing & Treating (359 | 4.3%), and Computers, Engineering & Science (355 | 4.2%).
Management, Business, Science and Arts Occupations by Sex
Within the Management, Business, Science and Arts occupations in Lafayette County, the most male-oriented occupations are Architecture & Engineering (80.4%), Management (70.1%), and Computers, Engineering & Science (52.4%), while the most female-oriented occupations are Legal Services & Support (100.0%), Health Diagnosing & Treating (93.6%), and Health Technologists (90.5%).
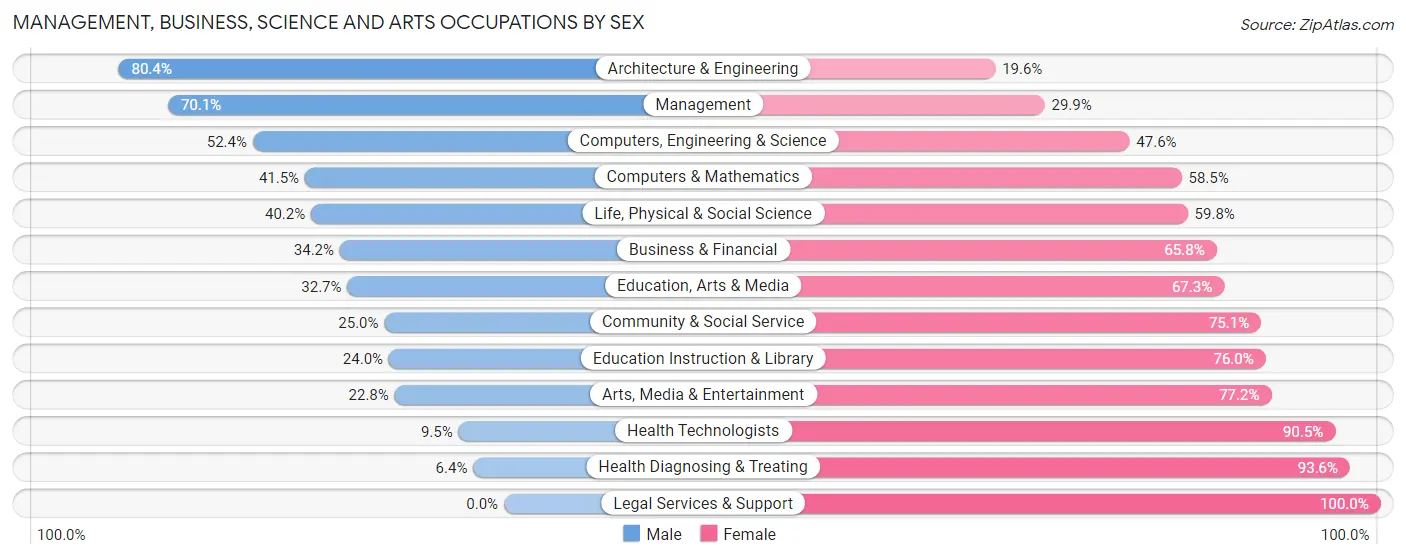
| Occupation | Male | Female |
| Management | 895 (70.1%) | 382 (29.9%) |
| Business & Financial | 102 (34.2%) | 196 (65.8%) |
| Computers, Engineering & Science | 186 (52.4%) | 169 (47.6%) |
| Computers & Mathematics | 71 (41.5%) | 100 (58.5%) |
| Architecture & Engineering | 82 (80.4%) | 20 (19.6%) |
| Life, Physical & Social Science | 33 (40.2%) | 49 (59.8%) |
| Community & Social Service | 136 (24.9%) | 409 (75.0%) |
| Education, Arts & Media | 33 (32.7%) | 68 (67.3%) |
| Legal Services & Support | 0 (0.0%) | 12 (100.0%) |
| Education Instruction & Library | 90 (24.0%) | 285 (76.0%) |
| Arts, Media & Entertainment | 13 (22.8%) | 44 (77.2%) |
| Health Diagnosing & Treating | 23 (6.4%) | 336 (93.6%) |
| Health Technologists | 22 (9.5%) | 210 (90.5%) |
| Total (Category) | 1,342 (47.3%) | 1,492 (52.6%) |
| Total (Overall) | 4,585 (54.6%) | 3,806 (45.4%) |
Services Occupations
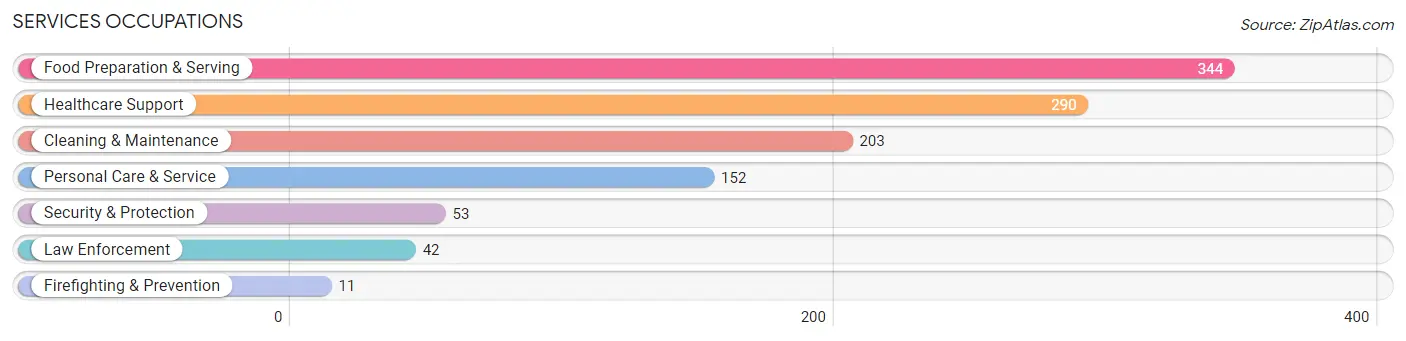
The most common Services occupations in Lafayette County are Food Preparation & Serving (344 | 4.1%), Healthcare Support (290 | 3.5%), Cleaning & Maintenance (203 | 2.4%), Personal Care & Service (152 | 1.8%), and Security & Protection (53 | 0.6%).
Services Occupations by Sex
Within the Services occupations in Lafayette County, the most male-oriented occupations are Law Enforcement (73.8%), Security & Protection (73.6%), and Firefighting & Prevention (72.7%), while the most female-oriented occupations are Healthcare Support (95.2%), Personal Care & Service (83.6%), and Food Preparation & Serving (73.3%).
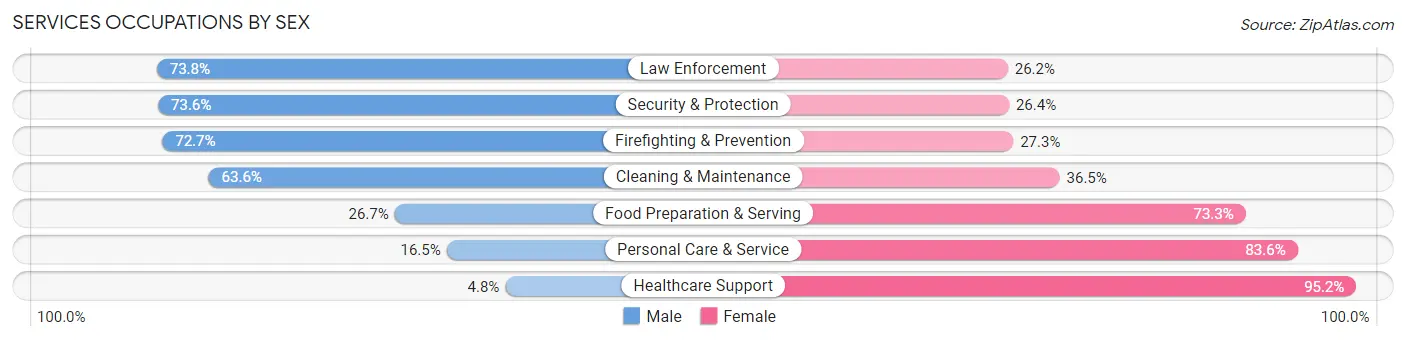
| Occupation | Male | Female |
| Healthcare Support | 14 (4.8%) | 276 (95.2%) |
| Security & Protection | 39 (73.6%) | 14 (26.4%) |
| Firefighting & Prevention | 8 (72.7%) | 3 (27.3%) |
| Law Enforcement | 31 (73.8%) | 11 (26.2%) |
| Food Preparation & Serving | 92 (26.7%) | 252 (73.3%) |
| Cleaning & Maintenance | 129 (63.5%) | 74 (36.4%) |
| Personal Care & Service | 25 (16.5%) | 127 (83.6%) |
| Total (Category) | 299 (28.7%) | 743 (71.3%) |
| Total (Overall) | 4,585 (54.6%) | 3,806 (45.4%) |
Sales and Office Occupations
The most common Sales and Office occupations in Lafayette County are Office & Administration (857 | 10.2%), and Sales & Related (653 | 7.8%).

Sales and Office Occupations by Sex
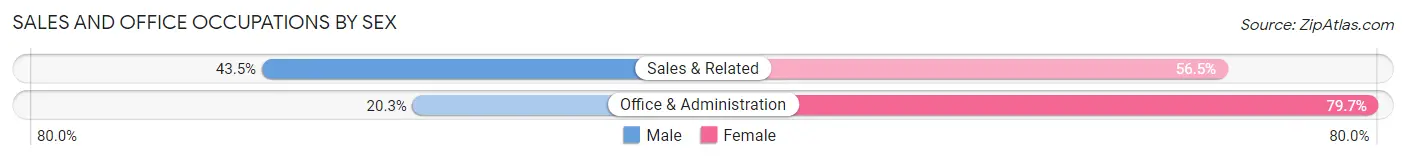
| Occupation | Male | Female |
| Sales & Related | 284 (43.5%) | 369 (56.5%) |
| Office & Administration | 174 (20.3%) | 683 (79.7%) |
| Total (Category) | 458 (30.3%) | 1,052 (69.7%) |
| Total (Overall) | 4,585 (54.6%) | 3,806 (45.4%) |
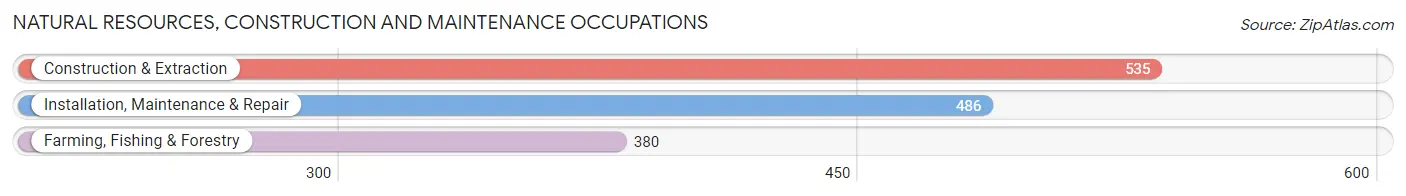
Natural Resources, Construction and Maintenance Occupations
The most common Natural Resources, Construction and Maintenance occupations in Lafayette County are Construction & Extraction (535 | 6.4%), Installation, Maintenance & Repair (486 | 5.8%), and Farming, Fishing & Forestry (380 | 4.5%).
Natural Resources, Construction and Maintenance Occupations by Sex
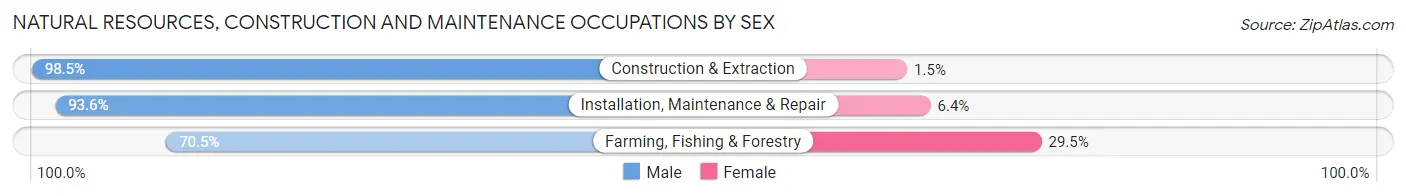
| Occupation | Male | Female |
| Farming, Fishing & Forestry | 268 (70.5%) | 112 (29.5%) |
| Construction & Extraction | 527 (98.5%) | 8 (1.5%) |
| Installation, Maintenance & Repair | 455 (93.6%) | 31 (6.4%) |
| Total (Category) | 1,250 (89.2%) | 151 (10.8%) |
| Total (Overall) | 4,585 (54.6%) | 3,806 (45.4%) |
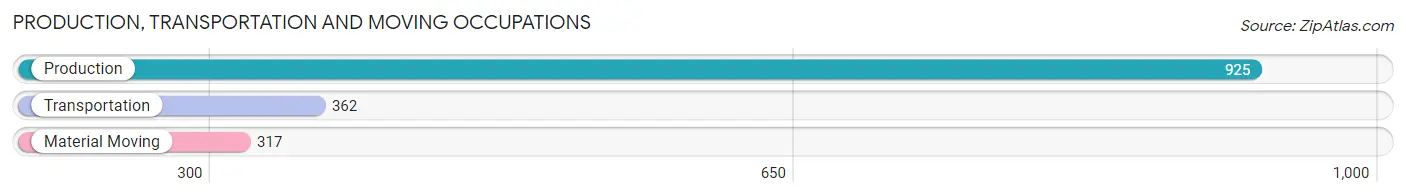
Production, Transportation and Moving Occupations
The most common Production, Transportation and Moving occupations in Lafayette County are Production (925 | 11.0%), Transportation (362 | 4.3%), and Material Moving (317 | 3.8%).
Production, Transportation and Moving Occupations by Sex
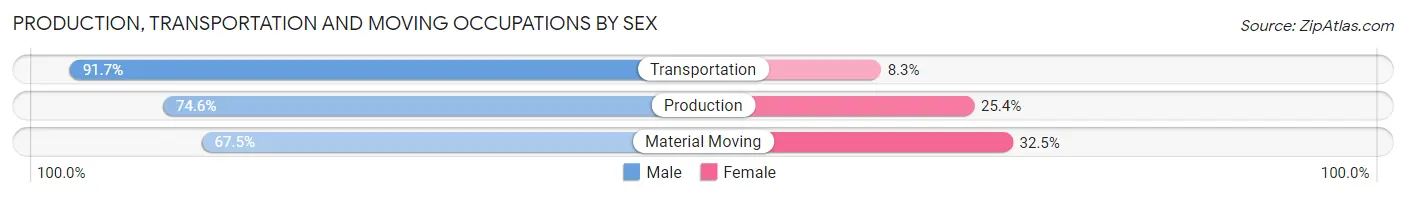
| Occupation | Male | Female |
| Production | 690 (74.6%) | 235 (25.4%) |
| Transportation | 332 (91.7%) | 30 (8.3%) |
| Material Moving | 214 (67.5%) | 103 (32.5%) |
| Total (Category) | 1,236 (77.1%) | 368 (22.9%) |
| Total (Overall) | 4,585 (54.6%) | 3,806 (45.4%) |
Employment Industries by Sex in Lafayette County
Employment Industries in Lafayette County
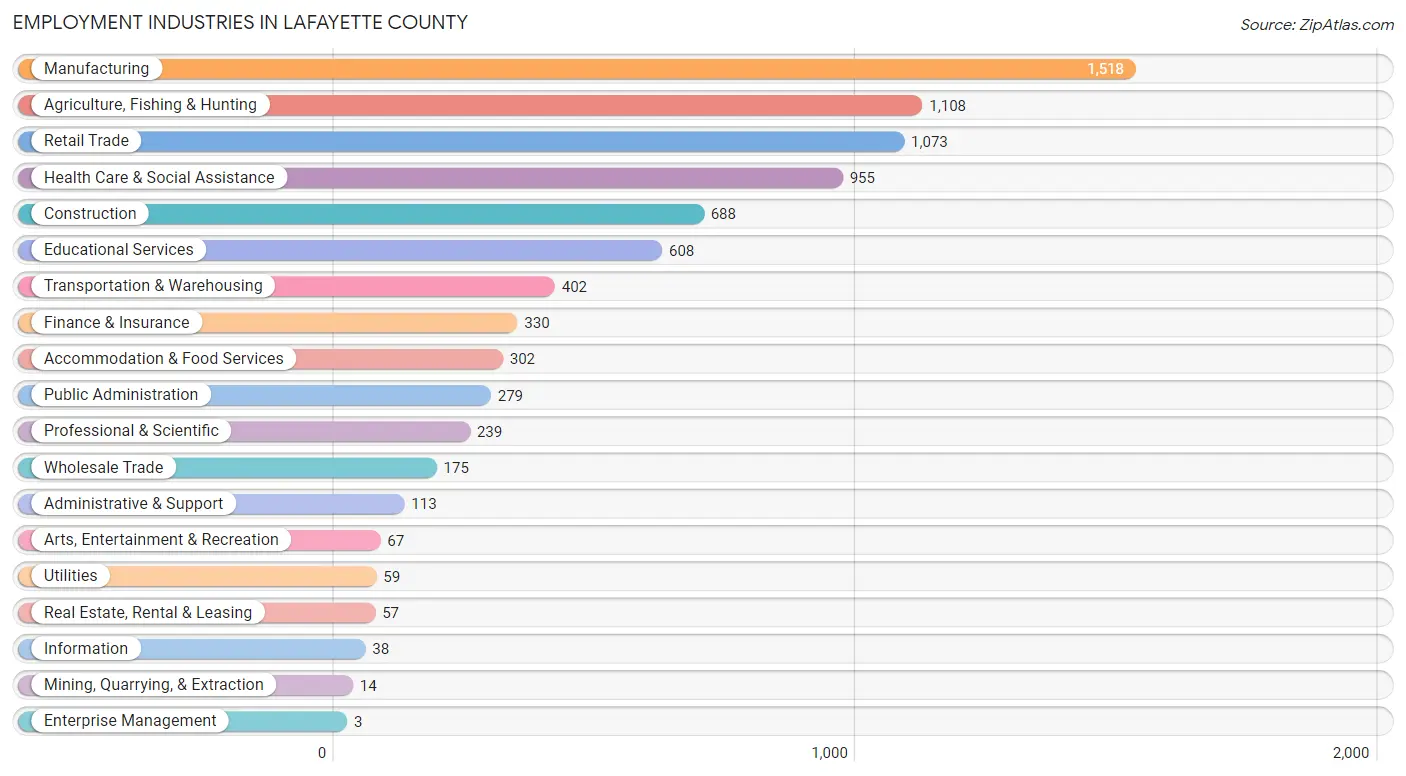
The major employment industries in Lafayette County include Manufacturing (1,518 | 18.1%), Agriculture, Fishing & Hunting (1,108 | 13.2%), Retail Trade (1,073 | 12.8%), Health Care & Social Assistance (955 | 11.4%), and Construction (688 | 8.2%).
Employment Industries by Sex in Lafayette County
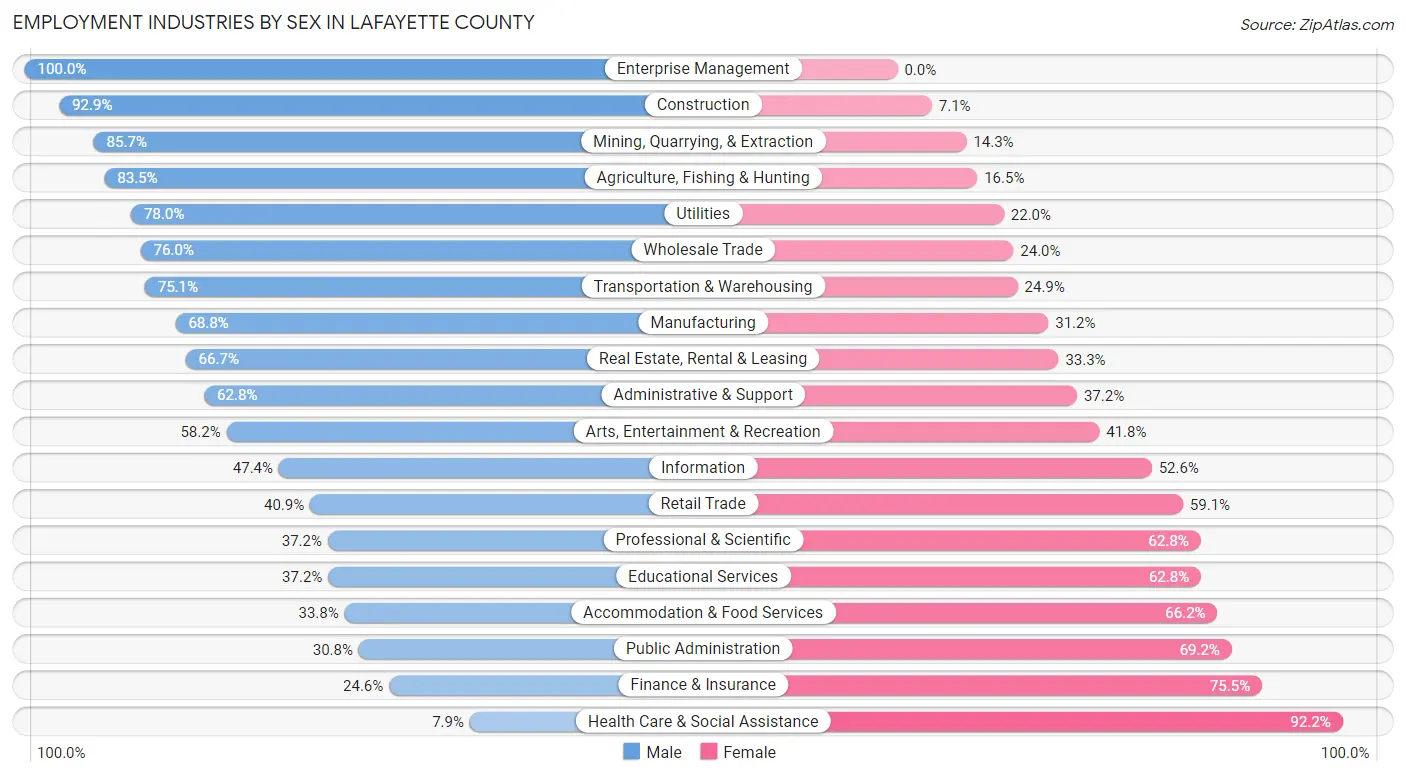
The Lafayette County industries that see more men than women are Enterprise Management (100.0%), Construction (92.9%), and Mining, Quarrying, & Extraction (85.7%), whereas the industries that tend to have a higher number of women are Health Care & Social Assistance (92.1%), Finance & Insurance (75.4%), and Public Administration (69.2%).
| Industry | Male | Female |
| Agriculture, Fishing & Hunting | 925 (83.5%) | 183 (16.5%) |
| Mining, Quarrying, & Extraction | 12 (85.7%) | 2 (14.3%) |
| Construction | 639 (92.9%) | 49 (7.1%) |
| Manufacturing | 1,044 (68.8%) | 474 (31.2%) |
| Wholesale Trade | 133 (76.0%) | 42 (24.0%) |
| Retail Trade | 439 (40.9%) | 634 (59.1%) |
| Transportation & Warehousing | 302 (75.1%) | 100 (24.9%) |
| Utilities | 46 (78.0%) | 13 (22.0%) |
| Information | 18 (47.4%) | 20 (52.6%) |
| Finance & Insurance | 81 (24.5%) | 249 (75.4%) |
| Real Estate, Rental & Leasing | 38 (66.7%) | 19 (33.3%) |
| Professional & Scientific | 89 (37.2%) | 150 (62.8%) |
| Enterprise Management | 3 (100.0%) | 0 (0.0%) |
| Administrative & Support | 71 (62.8%) | 42 (37.2%) |
| Educational Services | 226 (37.2%) | 382 (62.8%) |
| Health Care & Social Assistance | 75 (7.9%) | 880 (92.1%) |
| Arts, Entertainment & Recreation | 39 (58.2%) | 28 (41.8%) |
| Accommodation & Food Services | 102 (33.8%) | 200 (66.2%) |
| Public Administration | 86 (30.8%) | 193 (69.2%) |
| Total | 4,585 (54.6%) | 3,806 (45.4%) |
Education in Lafayette County
School Enrollment in Lafayette County
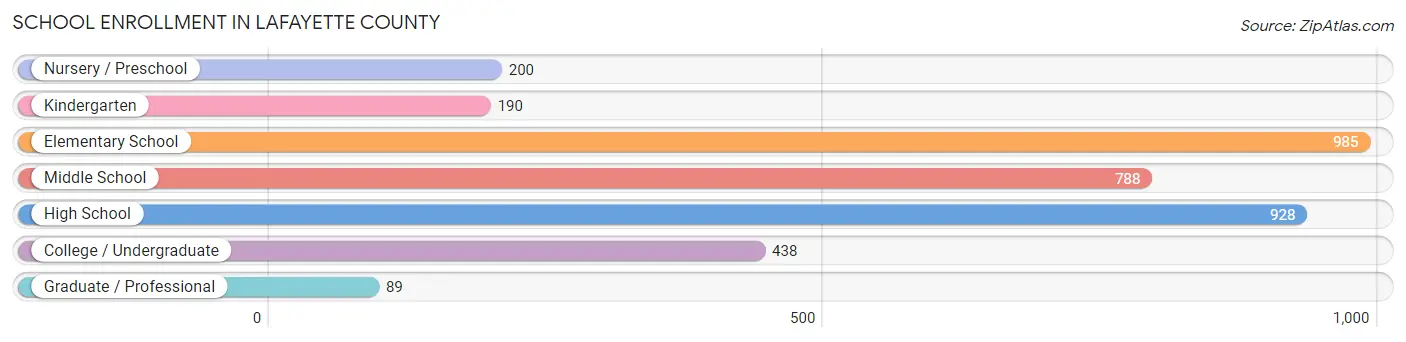
The most common levels of schooling among the 3,618 students in Lafayette County are elementary school (985 | 27.2%), high school (928 | 25.7%), and middle school (788 | 21.8%).
| School Level | # Students | % Students |
| Nursery / Preschool | 200 | 5.5% |
| Kindergarten | 190 | 5.2% |
| Elementary School | 985 | 27.2% |
| Middle School | 788 | 21.8% |
| High School | 928 | 25.7% |
| College / Undergraduate | 438 | 12.1% |
| Graduate / Professional | 89 | 2.5% |
| Total | 3,618 | 100.0% |
School Enrollment by Age by Funding Source in Lafayette County
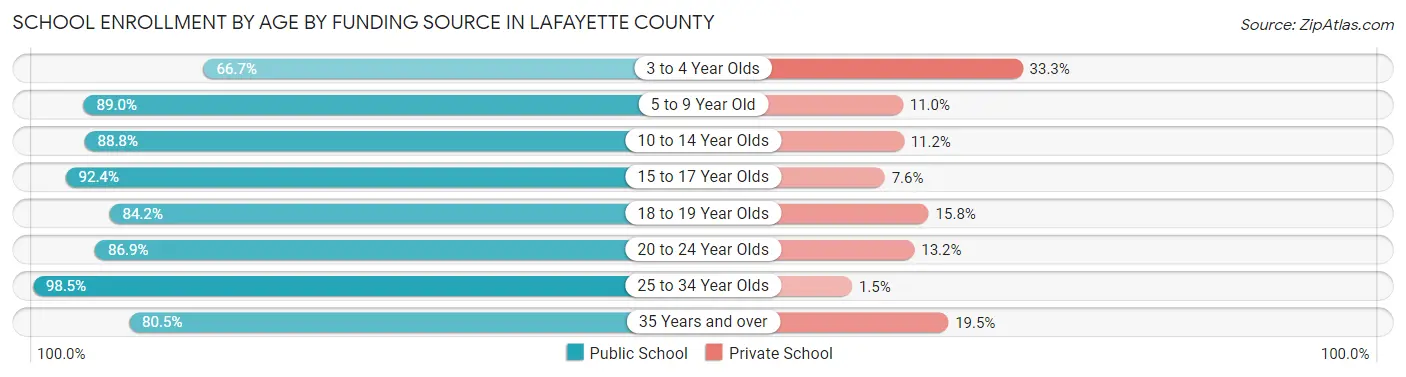
Out of a total of 3,618 students who are enrolled in schools in Lafayette County, 427 (11.8%) attend a private institution, while the remaining 3,191 (88.2%) are enrolled in public schools. The age group of 3 to 4 year olds has the highest likelihood of being enrolled in private schools, with 44 (33.3% in the age bracket) enrolled. Conversely, the age group of 25 to 34 year olds has the lowest likelihood of being enrolled in a private school, with 64 (98.5% in the age bracket) attending a public institution.
| Age Bracket | Public School | Private School |
| 3 to 4 Year Olds | 88 (66.7%) | 44 (33.3%) |
| 5 to 9 Year Old | 978 (89.0%) | 121 (11.0%) |
| 10 to 14 Year Olds | 898 (88.8%) | 113 (11.2%) |
| 15 to 17 Year Olds | 653 (92.4%) | 54 (7.6%) |
| 18 to 19 Year Olds | 234 (84.2%) | 44 (15.8%) |
| 20 to 24 Year Olds | 185 (86.9%) | 28 (13.2%) |
| 25 to 34 Year Olds | 64 (98.5%) | 1 (1.5%) |
| 35 Years and over | 91 (80.5%) | 22 (19.5%) |
| Total | 3,191 (88.2%) | 427 (11.8%) |
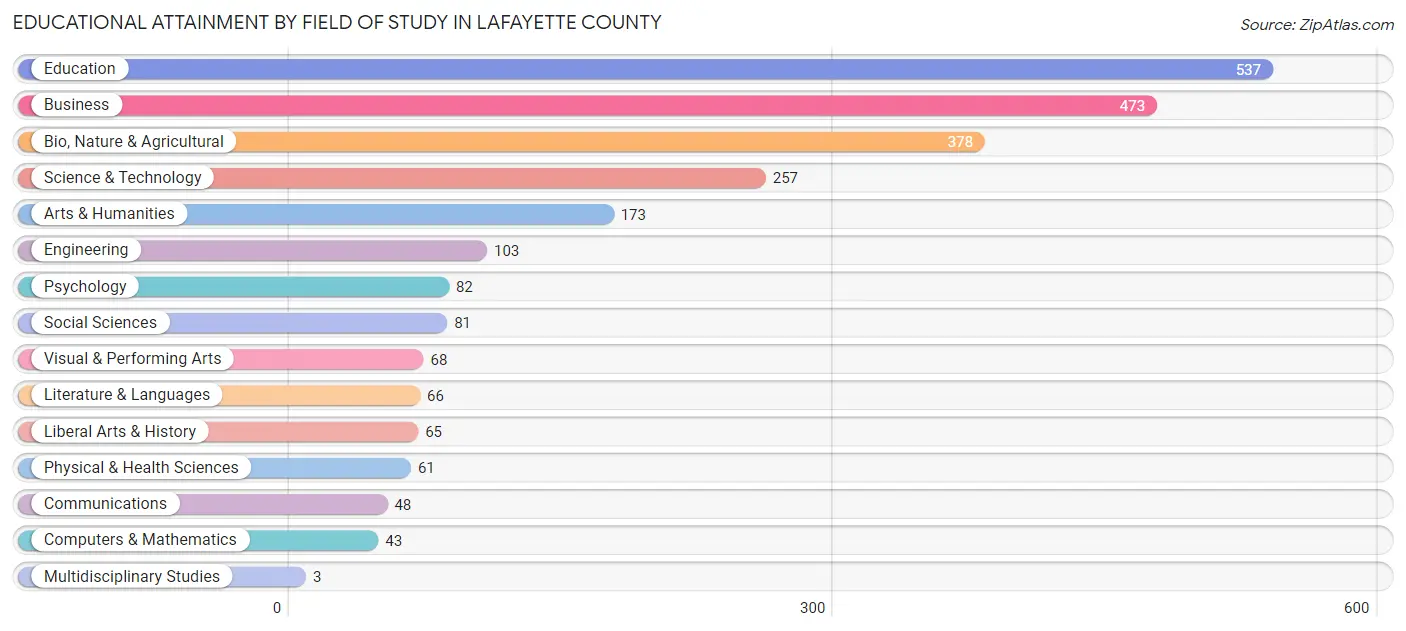
Educational Attainment by Field of Study in Lafayette County
Education (537 | 22.0%), business (473 | 19.4%), bio, nature & agricultural (378 | 15.5%), science & technology (257 | 10.5%), and arts & humanities (173 | 7.1%) are the most common fields of study among 2,438 individuals in Lafayette County who have obtained a bachelor's degree or higher.
| Field of Study | # Graduates | % Graduates |
| Computers & Mathematics | 43 | 1.8% |
| Bio, Nature & Agricultural | 378 | 15.5% |
| Physical & Health Sciences | 61 | 2.5% |
| Psychology | 82 | 3.4% |
| Social Sciences | 81 | 3.3% |
| Engineering | 103 | 4.2% |
| Multidisciplinary Studies | 3 | 0.1% |
| Science & Technology | 257 | 10.5% |
| Business | 473 | 19.4% |
| Education | 537 | 22.0% |
| Literature & Languages | 66 | 2.7% |
| Liberal Arts & History | 65 | 2.7% |
| Visual & Performing Arts | 68 | 2.8% |
| Communications | 48 | 2.0% |
| Arts & Humanities | 173 | 7.1% |
| Total | 2,438 | 100.0% |
Transportation & Commute in Lafayette County
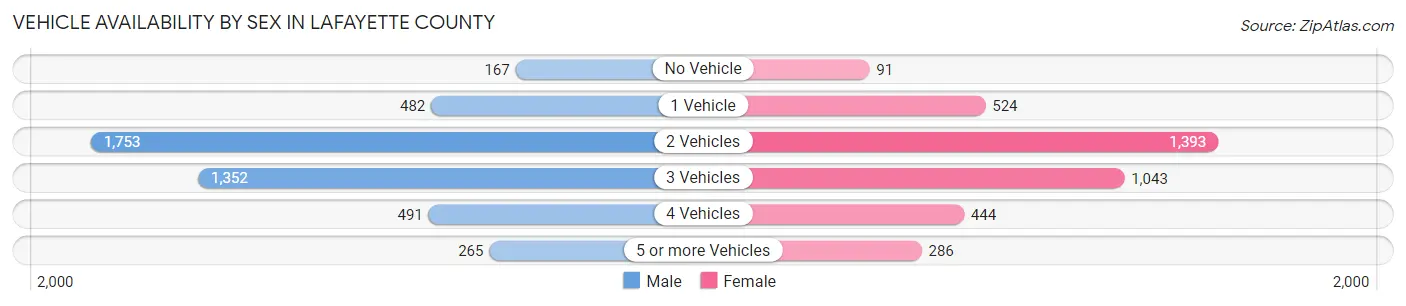
Vehicle Availability by Sex in Lafayette County
The most prevalent vehicle ownership categories in Lafayette County are males with 2 vehicles (1,753, accounting for 38.9%) and females with 2 vehicles (1,393, making up 46.4%).
| Vehicles Available | Male | Female |
| No Vehicle | 167 (3.7%) | 91 (2.4%) |
| 1 Vehicle | 482 (10.7%) | 524 (13.9%) |
| 2 Vehicles | 1,753 (38.9%) | 1,393 (36.8%) |
| 3 Vehicles | 1,352 (30.0%) | 1,043 (27.6%) |
| 4 Vehicles | 491 (10.9%) | 444 (11.7%) |
| 5 or more Vehicles | 265 (5.9%) | 286 (7.6%) |
| Total | 4,510 (100.0%) | 3,781 (100.0%) |
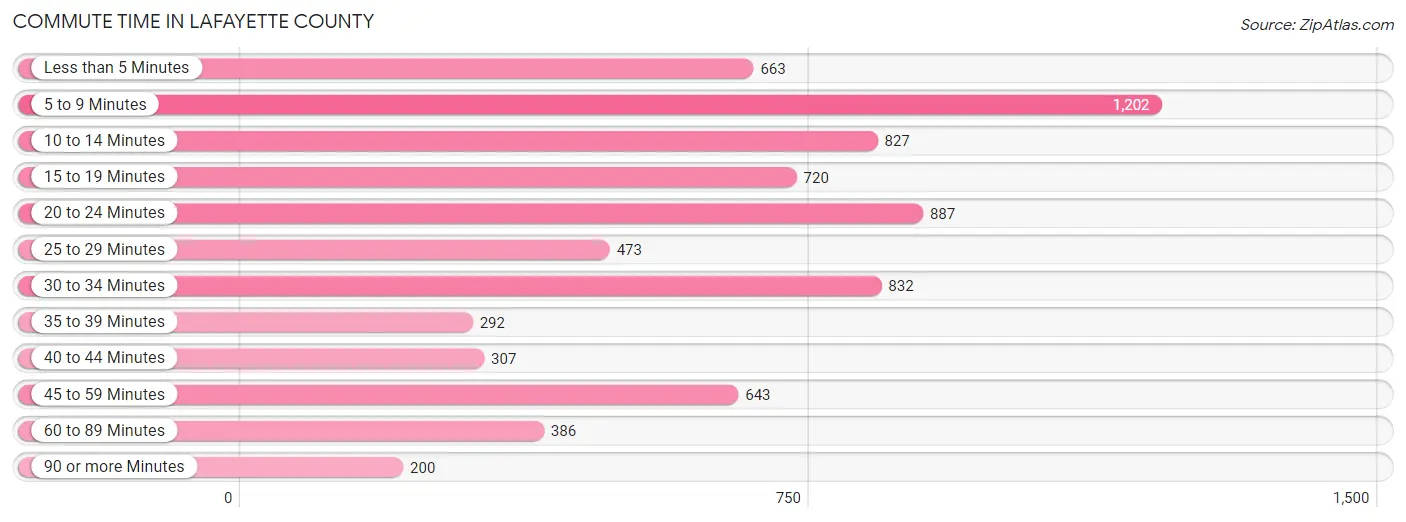
Commute Time in Lafayette County
The most frequently occuring commute durations in Lafayette County are 5 to 9 minutes (1,202 commuters, 16.2%), 20 to 24 minutes (887 commuters, 11.9%), and 30 to 34 minutes (832 commuters, 11.2%).
| Commute Time | # Commuters | % Commuters |
| Less than 5 Minutes | 663 | 8.9% |
| 5 to 9 Minutes | 1,202 | 16.2% |
| 10 to 14 Minutes | 827 | 11.1% |
| 15 to 19 Minutes | 720 | 9.7% |
| 20 to 24 Minutes | 887 | 11.9% |
| 25 to 29 Minutes | 473 | 6.4% |
| 30 to 34 Minutes | 832 | 11.2% |
| 35 to 39 Minutes | 292 | 3.9% |
| 40 to 44 Minutes | 307 | 4.1% |
| 45 to 59 Minutes | 643 | 8.6% |
| 60 to 89 Minutes | 386 | 5.2% |
| 90 or more Minutes | 200 | 2.7% |
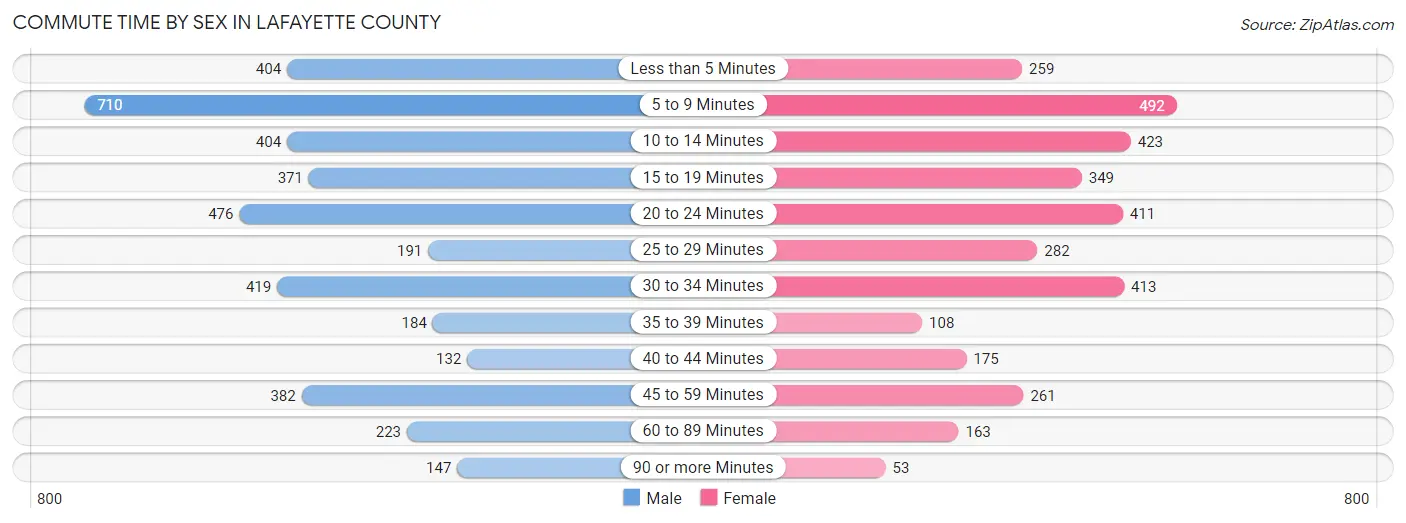
Commute Time by Sex in Lafayette County
The most common commute times in Lafayette County are 5 to 9 minutes (710 commuters, 17.6%) for males and 5 to 9 minutes (492 commuters, 14.5%) for females.
| Commute Time | Male | Female |
| Less than 5 Minutes | 404 (10.0%) | 259 (7.6%) |
| 5 to 9 Minutes | 710 (17.6%) | 492 (14.5%) |
| 10 to 14 Minutes | 404 (10.0%) | 423 (12.5%) |
| 15 to 19 Minutes | 371 (9.2%) | 349 (10.3%) |
| 20 to 24 Minutes | 476 (11.8%) | 411 (12.1%) |
| 25 to 29 Minutes | 191 (4.7%) | 282 (8.3%) |
| 30 to 34 Minutes | 419 (10.4%) | 413 (12.2%) |
| 35 to 39 Minutes | 184 (4.5%) | 108 (3.2%) |
| 40 to 44 Minutes | 132 (3.3%) | 175 (5.2%) |
| 45 to 59 Minutes | 382 (9.5%) | 261 (7.7%) |
| 60 to 89 Minutes | 223 (5.5%) | 163 (4.8%) |
| 90 or more Minutes | 147 (3.6%) | 53 (1.6%) |
Time of Departure to Work by Sex in Lafayette County
The most frequent times of departure to work in Lafayette County are 6:30 AM to 6:59 AM (577, 14.3%) for males and 7:00 AM to 7:29 AM (679, 20.0%) for females.
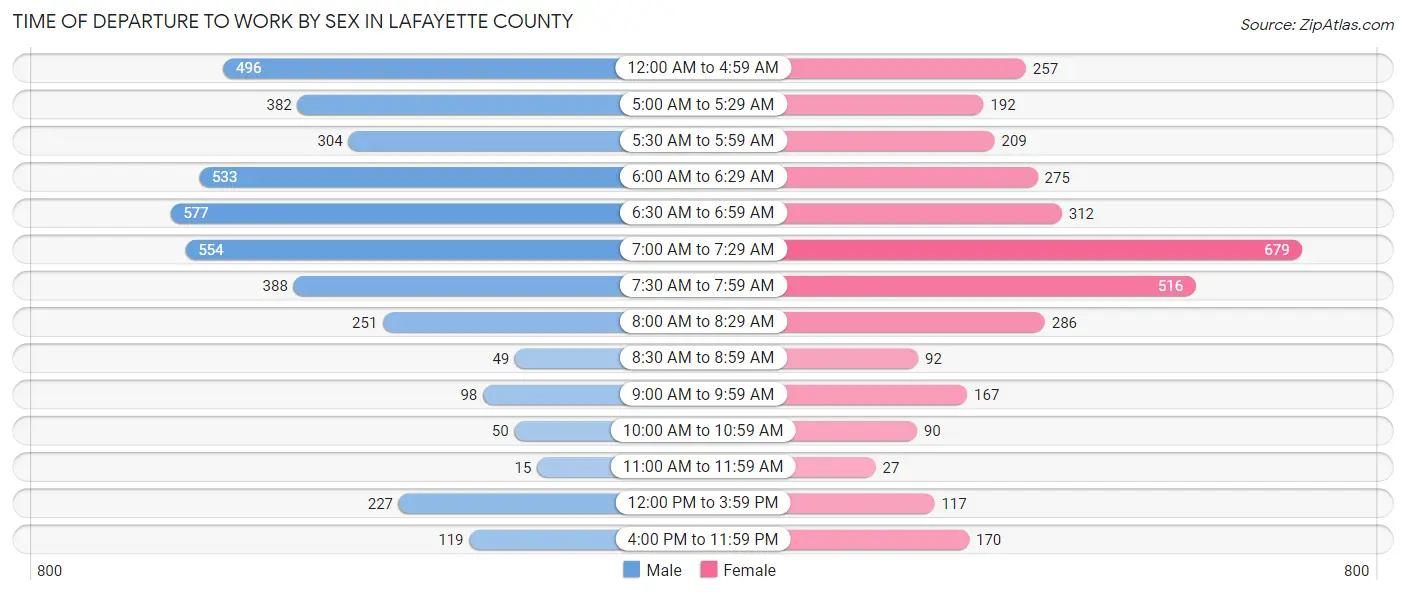
| Time of Departure | Male | Female |
| 12:00 AM to 4:59 AM | 496 (12.3%) | 257 (7.6%) |
| 5:00 AM to 5:29 AM | 382 (9.5%) | 192 (5.7%) |
| 5:30 AM to 5:59 AM | 304 (7.5%) | 209 (6.2%) |
| 6:00 AM to 6:29 AM | 533 (13.2%) | 275 (8.1%) |
| 6:30 AM to 6:59 AM | 577 (14.3%) | 312 (9.2%) |
| 7:00 AM to 7:29 AM | 554 (13.7%) | 679 (20.0%) |
| 7:30 AM to 7:59 AM | 388 (9.6%) | 516 (15.2%) |
| 8:00 AM to 8:29 AM | 251 (6.2%) | 286 (8.4%) |
| 8:30 AM to 8:59 AM | 49 (1.2%) | 92 (2.7%) |
| 9:00 AM to 9:59 AM | 98 (2.4%) | 167 (4.9%) |
| 10:00 AM to 10:59 AM | 50 (1.2%) | 90 (2.7%) |
| 11:00 AM to 11:59 AM | 15 (0.4%) | 27 (0.8%) |
| 12:00 PM to 3:59 PM | 227 (5.6%) | 117 (3.5%) |
| 4:00 PM to 11:59 PM | 119 (2.9%) | 170 (5.0%) |
| Total | 4,043 (100.0%) | 3,389 (100.0%) |
Housing Occupancy in Lafayette County
Occupancy by Ownership in Lafayette County
Of the total 6,652 dwellings in Lafayette County, owner-occupied units account for 5,271 (79.2%), while renter-occupied units make up 1,381 (20.8%).
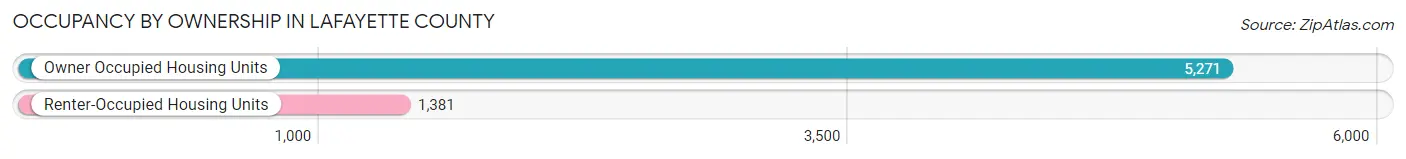
| Occupancy | # Housing Units | % Housing Units |
| Owner Occupied Housing Units | 5,271 | 79.2% |
| Renter-Occupied Housing Units | 1,381 | 20.8% |
| Total Occupied Housing Units | 6,652 | 100.0% |
Occupancy by Household Size in Lafayette County
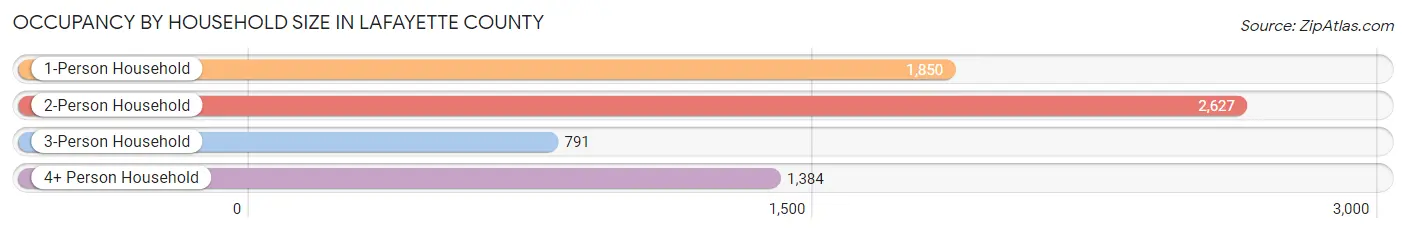
| Household Size | # Housing Units | % Housing Units |
| 1-Person Household | 1,850 | 27.8% |
| 2-Person Household | 2,627 | 39.5% |
| 3-Person Household | 791 | 11.9% |
| 4+ Person Household | 1,384 | 20.8% |
| Total Housing Units | 6,652 | 100.0% |
Occupancy by Ownership by Household Size in Lafayette County
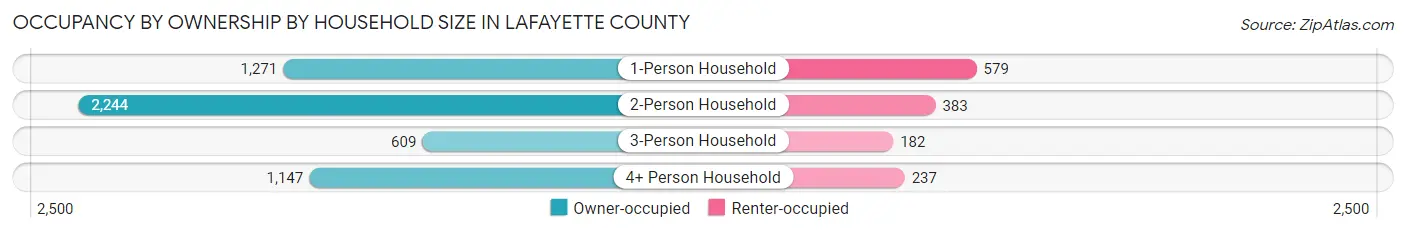
| Household Size | Owner-occupied | Renter-occupied |
| 1-Person Household | 1,271 (68.7%) | 579 (31.3%) |
| 2-Person Household | 2,244 (85.4%) | 383 (14.6%) |
| 3-Person Household | 609 (77.0%) | 182 (23.0%) |
| 4+ Person Household | 1,147 (82.9%) | 237 (17.1%) |
| Total Housing Units | 5,271 (79.2%) | 1,381 (20.8%) |
Occupancy by Educational Attainment in Lafayette County
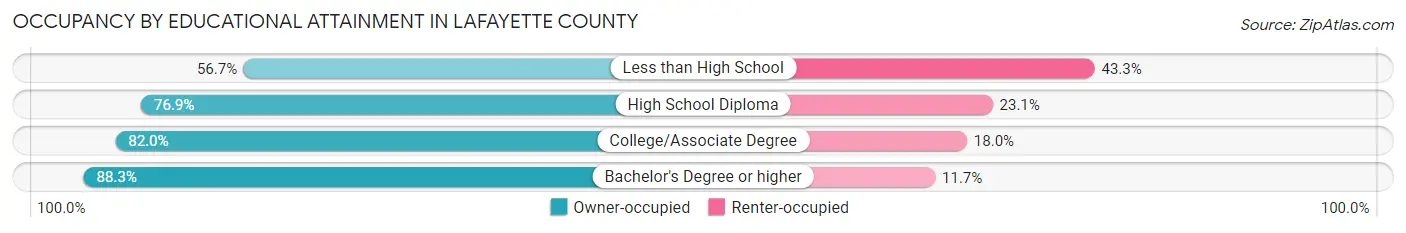
| Household Size | Owner-occupied | Renter-occupied |
| Less than High School | 326 (56.7%) | 249 (43.3%) |
| High School Diploma | 1,895 (76.9%) | 569 (23.1%) |
| College/Associate Degree | 1,833 (82.0%) | 402 (18.0%) |
| Bachelor's Degree or higher | 1,217 (88.3%) | 161 (11.7%) |
Occupancy by Age of Householder in Lafayette County
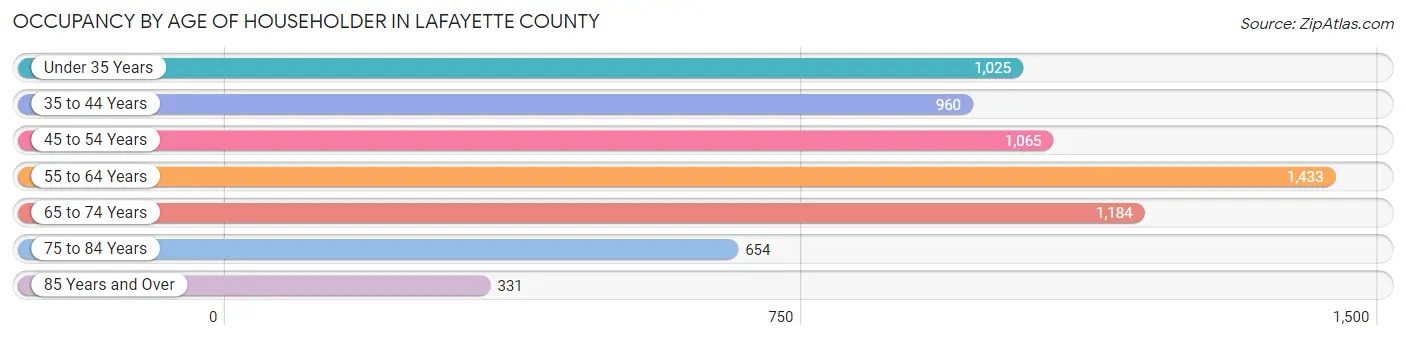
| Age Bracket | # Households | % Households |
| Under 35 Years | 1,025 | 15.4% |
| 35 to 44 Years | 960 | 14.4% |
| 45 to 54 Years | 1,065 | 16.0% |
| 55 to 64 Years | 1,433 | 21.5% |
| 65 to 74 Years | 1,184 | 17.8% |
| 75 to 84 Years | 654 | 9.8% |
| 85 Years and Over | 331 | 5.0% |
| Total | 6,652 | 100.0% |
Housing Finances in Lafayette County
Median Income by Occupancy in Lafayette County
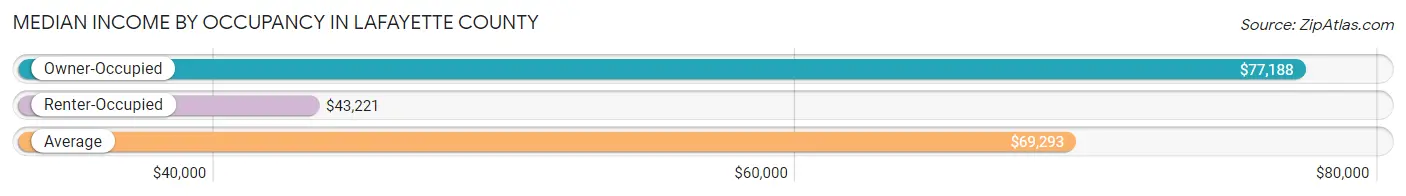
| Occupancy Type | # Households | Median Income |
| Owner-Occupied | 5,271 (79.2%) | $77,188 |
| Renter-Occupied | 1,381 (20.8%) | $43,221 |
| Average | 6,652 (100.0%) | $69,293 |
Occupancy by Householder Income Bracket in Lafayette County
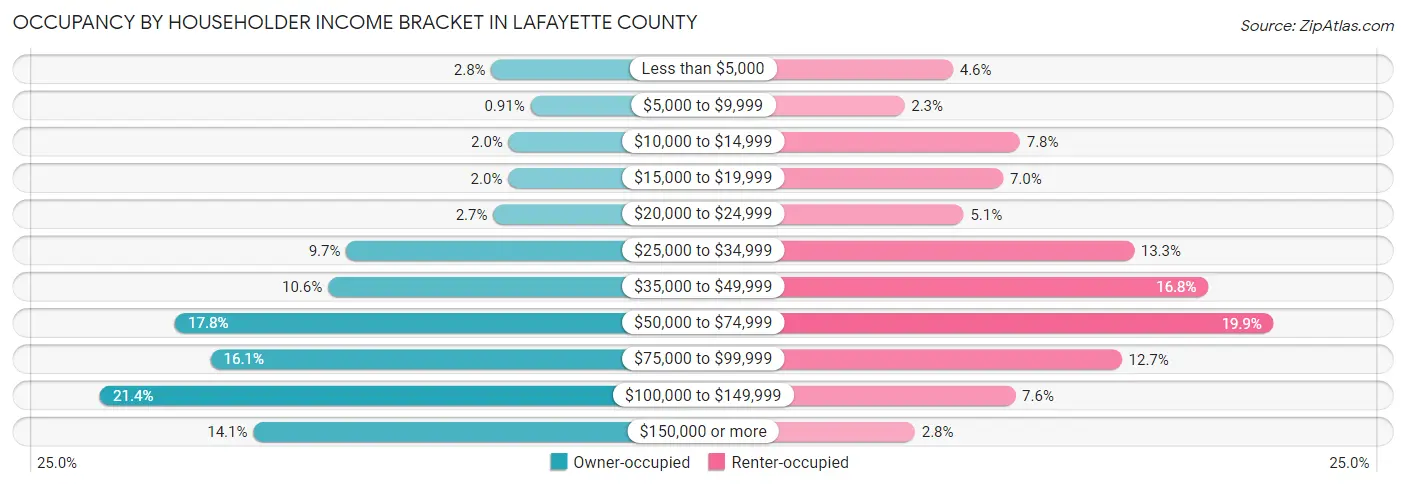
| Income Bracket | Owner-occupied | Renter-occupied |
| Less than $5,000 | 146 (2.8%) | 64 (4.6%) |
| $5,000 to $9,999 | 48 (0.9%) | 32 (2.3%) |
| $10,000 to $14,999 | 103 (1.9%) | 108 (7.8%) |
| $15,000 to $19,999 | 104 (2.0%) | 97 (7.0%) |
| $20,000 to $24,999 | 141 (2.7%) | 71 (5.1%) |
| $25,000 to $34,999 | 510 (9.7%) | 183 (13.3%) |
| $35,000 to $49,999 | 556 (10.5%) | 232 (16.8%) |
| $50,000 to $74,999 | 940 (17.8%) | 275 (19.9%) |
| $75,000 to $99,999 | 851 (16.1%) | 175 (12.7%) |
| $100,000 to $149,999 | 1,128 (21.4%) | 105 (7.6%) |
| $150,000 or more | 744 (14.1%) | 39 (2.8%) |
| Total | 5,271 (100.0%) | 1,381 (100.0%) |
Monthly Housing Cost Tiers in Lafayette County
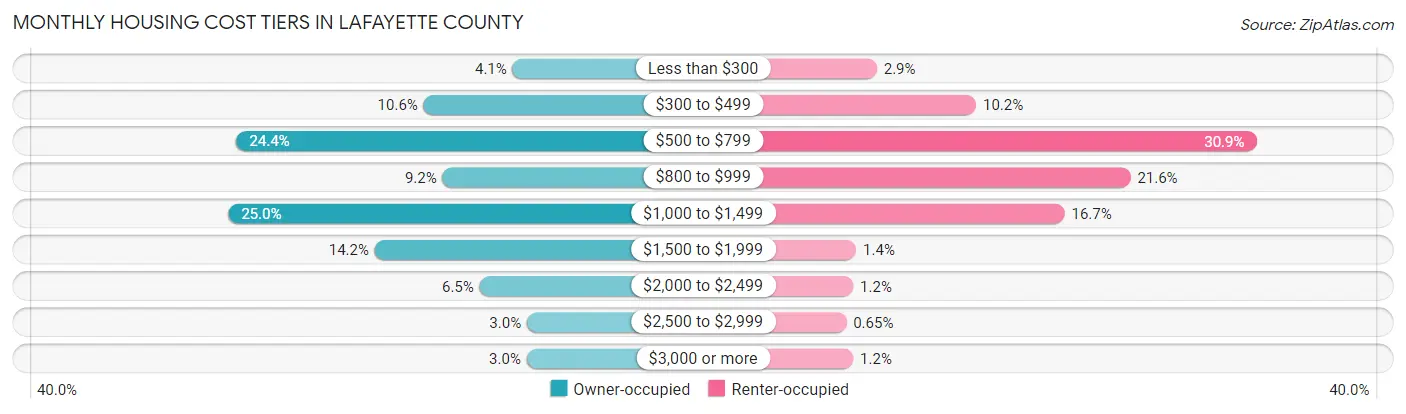
| Monthly Cost | Owner-occupied | Renter-occupied |
| Less than $300 | 214 (4.1%) | 40 (2.9%) |
| $300 to $499 | 559 (10.6%) | 141 (10.2%) |
| $500 to $799 | 1,286 (24.4%) | 426 (30.8%) |
| $800 to $999 | 486 (9.2%) | 298 (21.6%) |
| $1,000 to $1,499 | 1,318 (25.0%) | 231 (16.7%) |
| $1,500 to $1,999 | 749 (14.2%) | 19 (1.4%) |
| $2,000 to $2,499 | 342 (6.5%) | 16 (1.2%) |
| $2,500 to $2,999 | 158 (3.0%) | 9 (0.6%) |
| $3,000 or more | 159 (3.0%) | 16 (1.2%) |
| Total | 5,271 (100.0%) | 1,381 (100.0%) |
Physical Housing Characteristics in Lafayette County
Housing Structures in Lafayette County
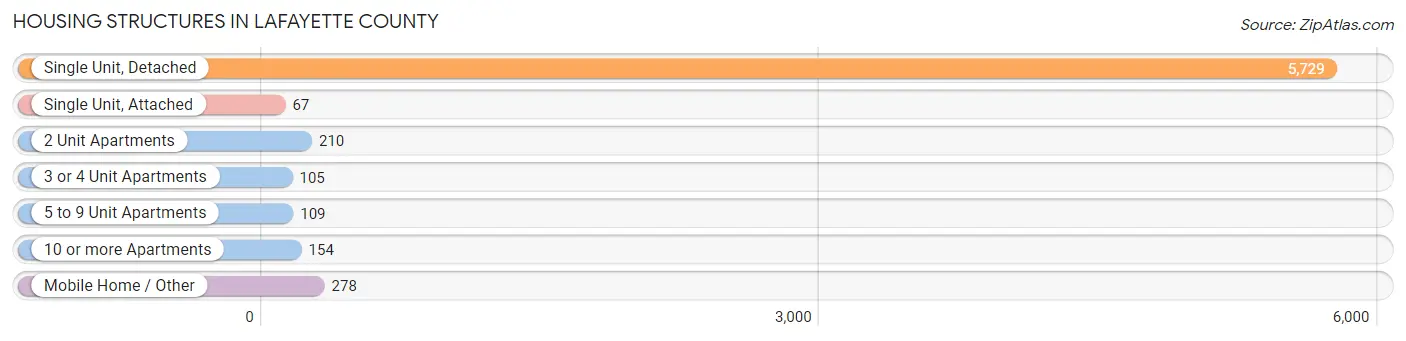
| Structure Type | # Housing Units | % Housing Units |
| Single Unit, Detached | 5,729 | 86.1% |
| Single Unit, Attached | 67 | 1.0% |
| 2 Unit Apartments | 210 | 3.2% |
| 3 or 4 Unit Apartments | 105 | 1.6% |
| 5 to 9 Unit Apartments | 109 | 1.6% |
| 10 or more Apartments | 154 | 2.3% |
| Mobile Home / Other | 278 | 4.2% |
| Total | 6,652 | 100.0% |
Housing Structures by Occupancy in Lafayette County
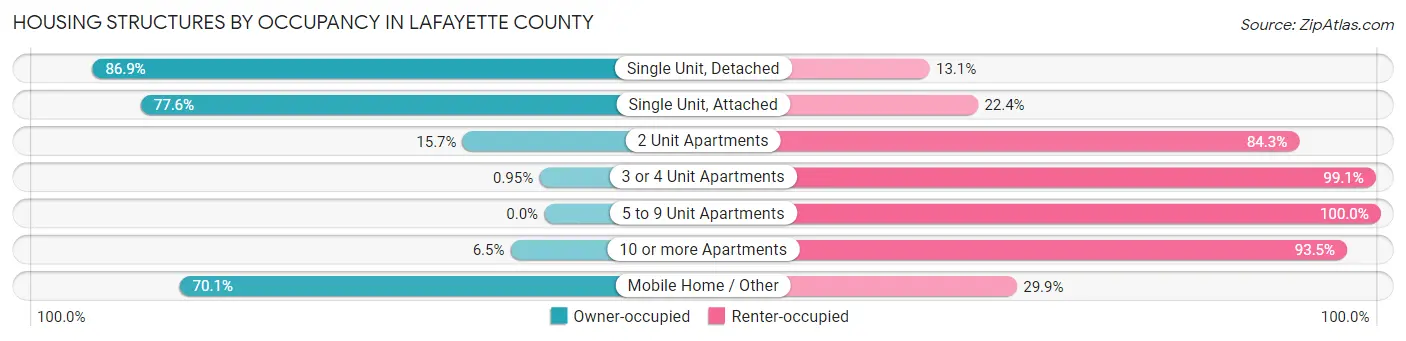
| Structure Type | Owner-occupied | Renter-occupied |
| Single Unit, Detached | 4,980 (86.9%) | 749 (13.1%) |
| Single Unit, Attached | 52 (77.6%) | 15 (22.4%) |
| 2 Unit Apartments | 33 (15.7%) | 177 (84.3%) |
| 3 or 4 Unit Apartments | 1 (0.9%) | 104 (99.1%) |
| 5 to 9 Unit Apartments | 0 (0.0%) | 109 (100.0%) |
| 10 or more Apartments | 10 (6.5%) | 144 (93.5%) |
| Mobile Home / Other | 195 (70.1%) | 83 (29.9%) |
| Total | 5,271 (79.2%) | 1,381 (20.8%) |
Housing Structures by Number of Rooms in Lafayette County
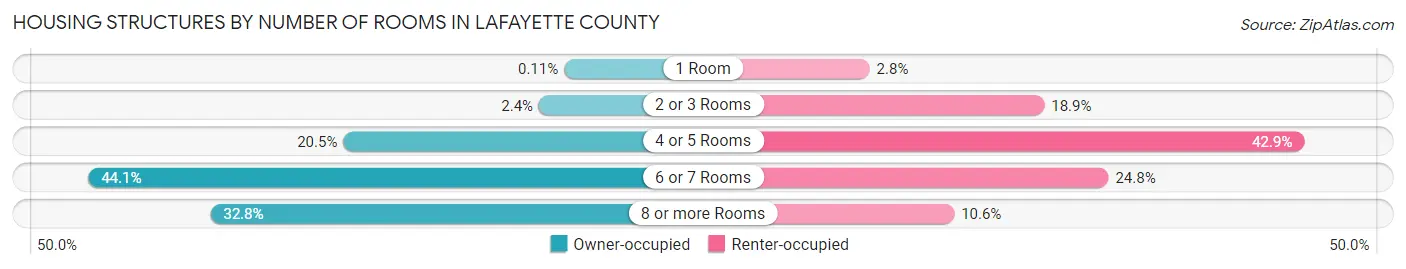
| Number of Rooms | Owner-occupied | Renter-occupied |
| 1 Room | 6 (0.1%) | 38 (2.8%) |
| 2 or 3 Rooms | 128 (2.4%) | 261 (18.9%) |
| 4 or 5 Rooms | 1,082 (20.5%) | 593 (42.9%) |
| 6 or 7 Rooms | 2,325 (44.1%) | 343 (24.8%) |
| 8 or more Rooms | 1,730 (32.8%) | 146 (10.6%) |
| Total | 5,271 (100.0%) | 1,381 (100.0%) |
Housing Structure by Heating Type in Lafayette County
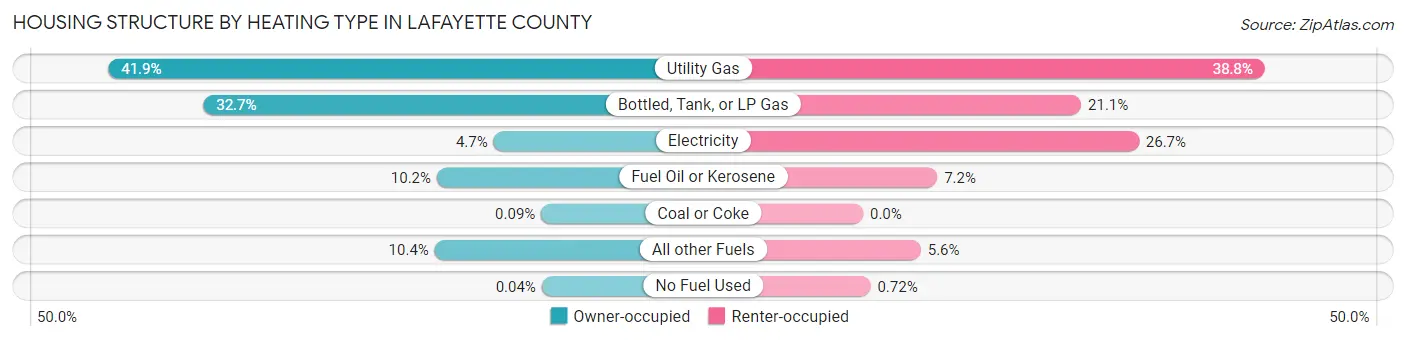
| Heating Type | Owner-occupied | Renter-occupied |
| Utility Gas | 2,209 (41.9%) | 536 (38.8%) |
| Bottled, Tank, or LP Gas | 1,725 (32.7%) | 291 (21.1%) |
| Electricity | 247 (4.7%) | 368 (26.7%) |
| Fuel Oil or Kerosene | 536 (10.2%) | 99 (7.2%) |
| Coal or Coke | 5 (0.1%) | 0 (0.0%) |
| All other Fuels | 547 (10.4%) | 77 (5.6%) |
| No Fuel Used | 2 (0.0%) | 10 (0.7%) |
| Total | 5,271 (100.0%) | 1,381 (100.0%) |
Household Vehicle Usage in Lafayette County
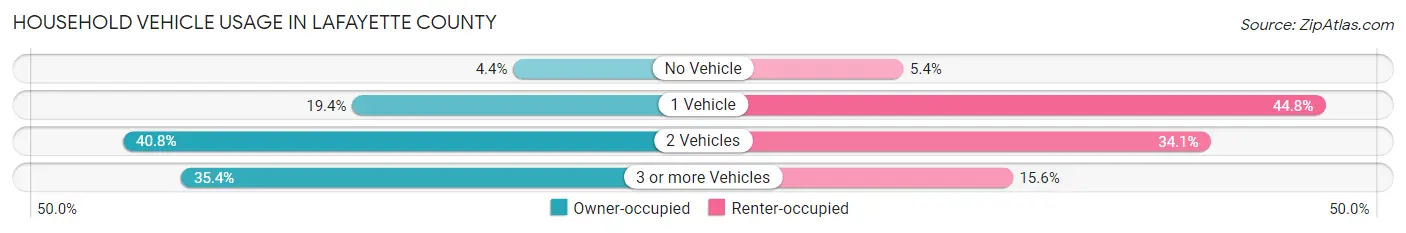
| Vehicles per Household | Owner-occupied | Renter-occupied |
| No Vehicle | 231 (4.4%) | 75 (5.4%) |
| 1 Vehicle | 1,023 (19.4%) | 619 (44.8%) |
| 2 Vehicles | 2,151 (40.8%) | 471 (34.1%) |
| 3 or more Vehicles | 1,866 (35.4%) | 216 (15.6%) |
| Total | 5,271 (100.0%) | 1,381 (100.0%) |
Real Estate & Mortgages in Lafayette County
Real Estate and Mortgage Overview in Lafayette County
| Characteristic | Without Mortgage | With Mortgage |
| Housing Units | 2,308 | 2,963 |
| Median Property Value | $155,400 | $179,900 |
| Median Household Income | $53,480 | $565 |
| Monthly Housing Costs | $577 | $156 |
| Real Estate Taxes | $2,891 | $35 |
Property Value by Mortgage Status in Lafayette County
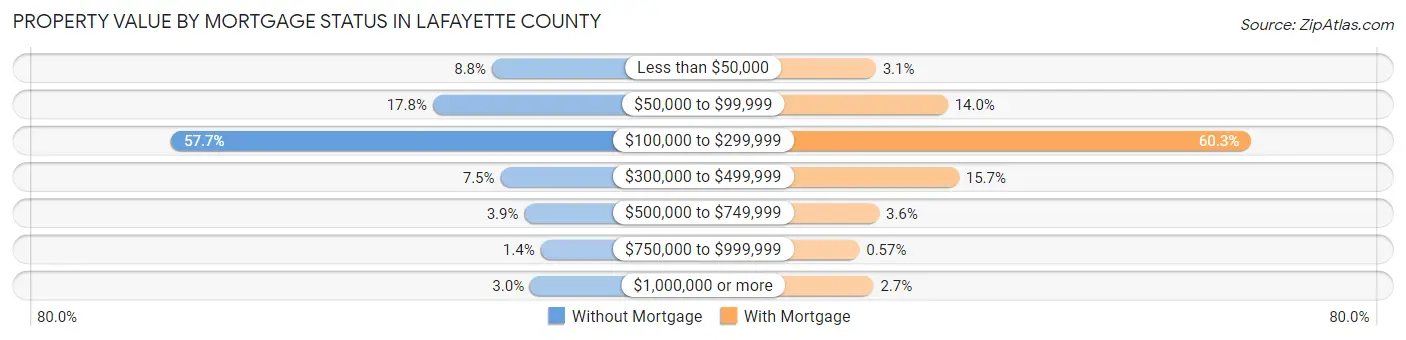
| Property Value | Without Mortgage | With Mortgage |
| Less than $50,000 | 203 (8.8%) | 91 (3.1%) |
| $50,000 to $99,999 | 411 (17.8%) | 416 (14.0%) |
| $100,000 to $299,999 | 1,331 (57.7%) | 1,786 (60.3%) |
| $300,000 to $499,999 | 173 (7.5%) | 466 (15.7%) |
| $500,000 to $749,999 | 89 (3.9%) | 106 (3.6%) |
| $750,000 to $999,999 | 32 (1.4%) | 17 (0.6%) |
| $1,000,000 or more | 69 (3.0%) | 81 (2.7%) |
| Total | 2,308 (100.0%) | 2,963 (100.0%) |
Household Income by Mortgage Status in Lafayette County
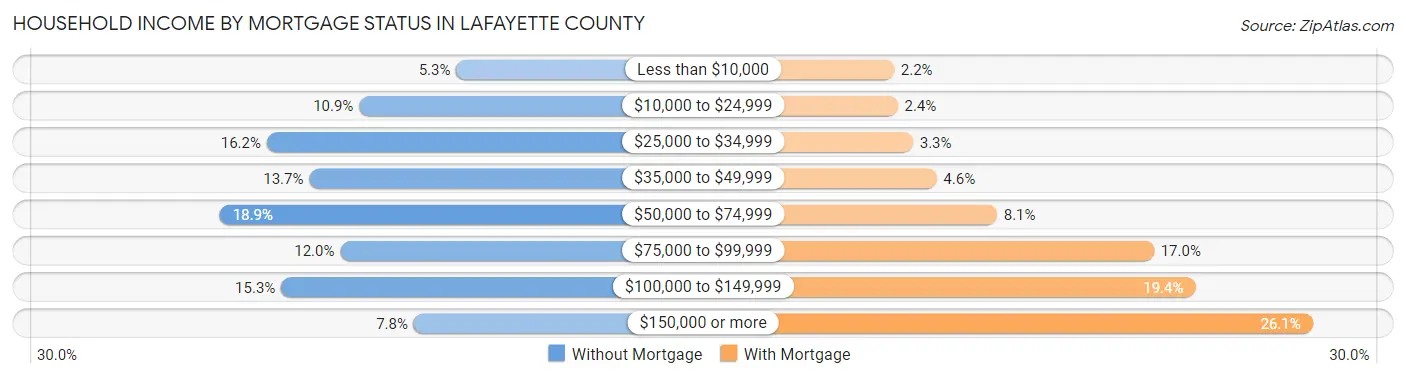
| Household Income | Without Mortgage | With Mortgage |
| Less than $10,000 | 123 (5.3%) | 65 (2.2%) |
| $10,000 to $24,999 | 251 (10.9%) | 71 (2.4%) |
| $25,000 to $34,999 | 373 (16.2%) | 97 (3.3%) |
| $35,000 to $49,999 | 317 (13.7%) | 137 (4.6%) |
| $50,000 to $74,999 | 435 (18.9%) | 239 (8.1%) |
| $75,000 to $99,999 | 276 (12.0%) | 505 (17.0%) |
| $100,000 to $149,999 | 354 (15.3%) | 575 (19.4%) |
| $150,000 or more | 179 (7.8%) | 774 (26.1%) |
| Total | 2,308 (100.0%) | 2,963 (100.0%) |
Property Value to Household Income Ratio in Lafayette County
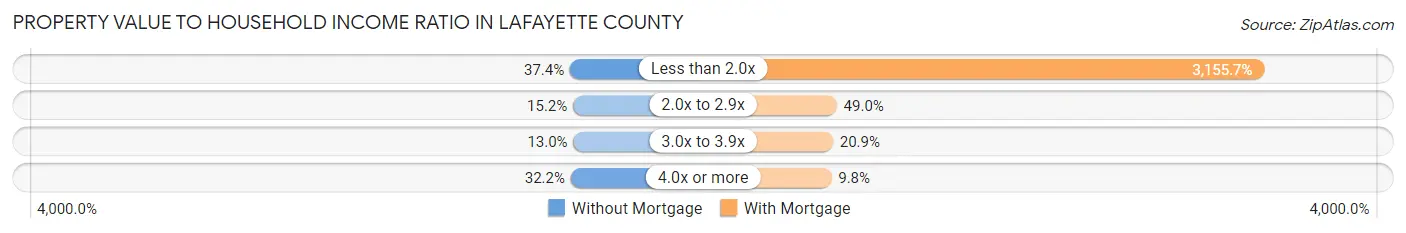
| Value-to-Income Ratio | Without Mortgage | With Mortgage |
| Less than 2.0x | 864 (37.4%) | 93,504 (3,155.7%) |
| 2.0x to 2.9x | 351 (15.2%) | 1,452 (49.0%) |
| 3.0x to 3.9x | 301 (13.0%) | 619 (20.9%) |
| 4.0x or more | 742 (32.2%) | 290 (9.8%) |
| Total | 2,308 (100.0%) | 2,963 (100.0%) |
Real Estate Taxes by Mortgage Status in Lafayette County
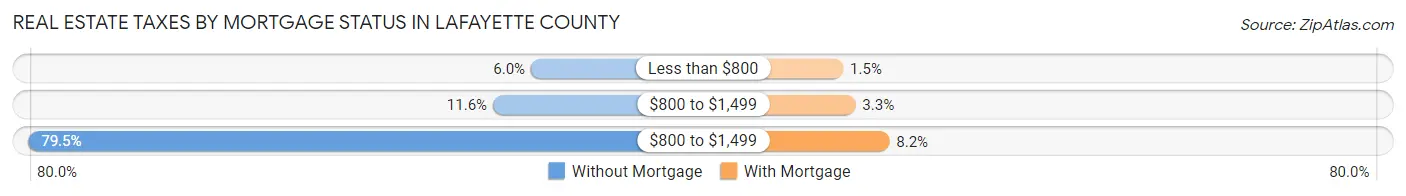
| Property Taxes | Without Mortgage | With Mortgage |
| Less than $800 | 139 (6.0%) | 44 (1.5%) |
| $800 to $1,499 | 267 (11.6%) | 97 (3.3%) |
| $800 to $1,499 | 1,834 (79.5%) | 244 (8.2%) |
| Total | 2,308 (100.0%) | 2,963 (100.0%) |
Health & Disability in Lafayette County
Health Insurance Coverage by Age in Lafayette County
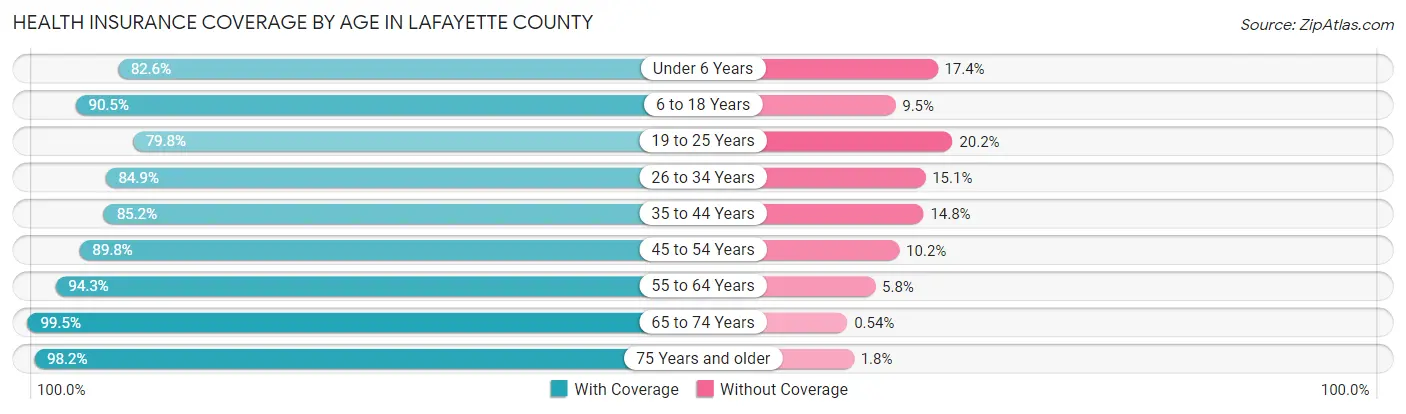
| Age Bracket | With Coverage | Without Coverage |
| Under 6 Years | 1,042 (82.6%) | 219 (17.4%) |
| 6 to 18 Years | 2,692 (90.5%) | 283 (9.5%) |
| 19 to 25 Years | 982 (79.8%) | 248 (20.2%) |
| 26 to 34 Years | 1,390 (84.9%) | 247 (15.1%) |
| 35 to 44 Years | 1,582 (85.2%) | 274 (14.8%) |
| 45 to 54 Years | 1,719 (89.8%) | 196 (10.2%) |
| 55 to 64 Years | 2,394 (94.3%) | 146 (5.8%) |
| 65 to 74 Years | 1,843 (99.5%) | 10 (0.5%) |
| 75 Years and older | 1,341 (98.2%) | 24 (1.8%) |
| Total | 14,985 (90.1%) | 1,647 (9.9%) |
Health Insurance Coverage by Citizenship Status in Lafayette County
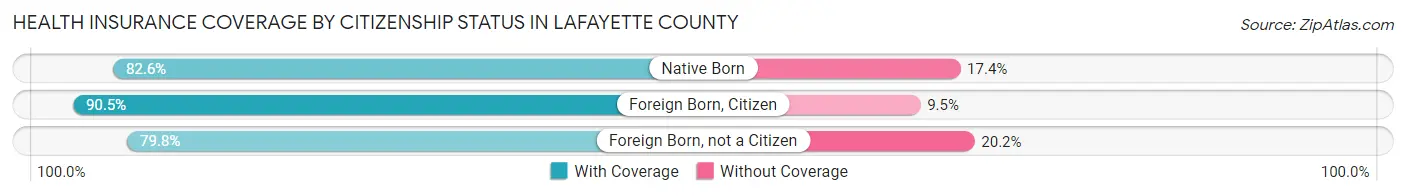
| Citizenship Status | With Coverage | Without Coverage |
| Native Born | 1,042 (82.6%) | 219 (17.4%) |
| Foreign Born, Citizen | 2,692 (90.5%) | 283 (9.5%) |
| Foreign Born, not a Citizen | 982 (79.8%) | 248 (20.2%) |
Health Insurance Coverage by Household Income in Lafayette County
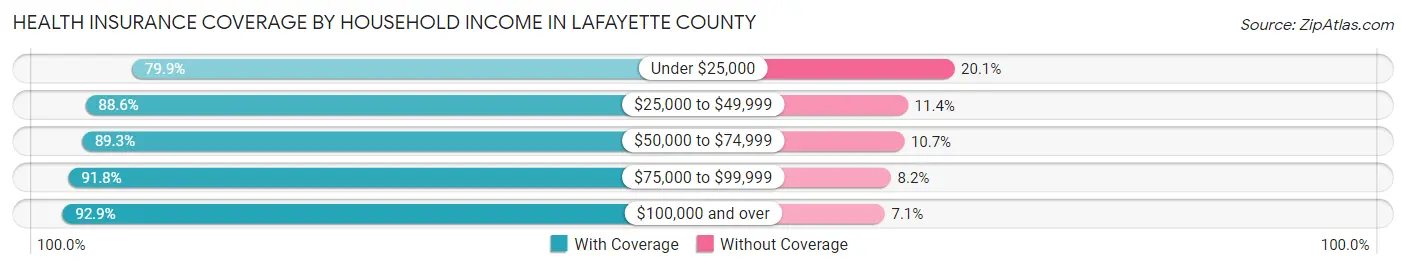
| Household Income | With Coverage | Without Coverage |
| Under $25,000 | 1,271 (79.9%) | 320 (20.1%) |
| $25,000 to $49,999 | 2,495 (88.6%) | 321 (11.4%) |
| $50,000 to $74,999 | 2,584 (89.3%) | 310 (10.7%) |
| $75,000 to $99,999 | 2,751 (91.8%) | 246 (8.2%) |
| $100,000 and over | 5,839 (92.9%) | 444 (7.1%) |
Public vs Private Health Insurance Coverage by Age in Lafayette County
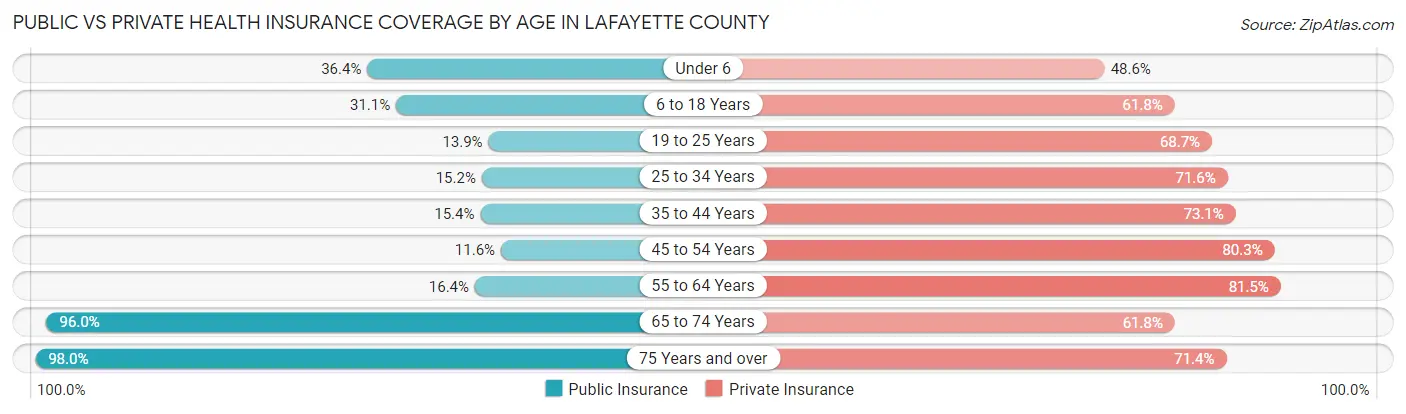
| Age Bracket | Public Insurance | Private Insurance |
| Under 6 | 459 (36.4%) | 613 (48.6%) |
| 6 to 18 Years | 924 (31.1%) | 1,838 (61.8%) |
| 19 to 25 Years | 171 (13.9%) | 845 (68.7%) |
| 25 to 34 Years | 248 (15.1%) | 1,172 (71.6%) |
| 35 to 44 Years | 286 (15.4%) | 1,357 (73.1%) |
| 45 to 54 Years | 222 (11.6%) | 1,538 (80.3%) |
| 55 to 64 Years | 417 (16.4%) | 2,069 (81.5%) |
| 65 to 74 Years | 1,778 (96.0%) | 1,145 (61.8%) |
| 75 Years and over | 1,338 (98.0%) | 974 (71.4%) |
| Total | 5,843 (35.1%) | 11,551 (69.5%) |
Disability Status by Sex by Age in Lafayette County
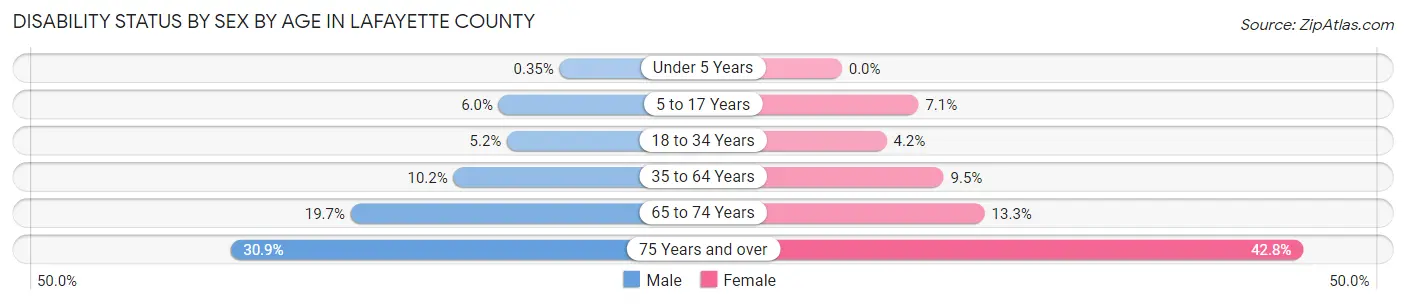
| Age Bracket | Male | Female |
| Under 5 Years | 2 (0.4%) | 0 (0.0%) |
| 5 to 17 Years | 92 (6.0%) | 101 (7.1%) |
| 18 to 34 Years | 84 (5.2%) | 61 (4.2%) |
| 35 to 64 Years | 327 (10.2%) | 293 (9.5%) |
| 65 to 74 Years | 190 (19.7%) | 118 (13.3%) |
| 75 Years and over | 183 (30.9%) | 331 (42.8%) |
Disability Class by Sex by Age in Lafayette County
Disability Class: Hearing Difficulty
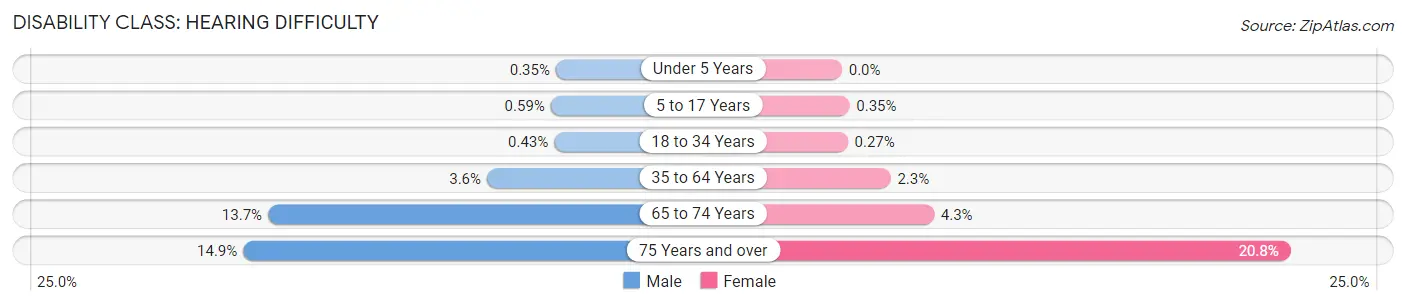
| Age Bracket | Male | Female |
| Under 5 Years | 2 (0.4%) | 0 (0.0%) |
| 5 to 17 Years | 9 (0.6%) | 5 (0.4%) |
| 18 to 34 Years | 7 (0.4%) | 4 (0.3%) |
| 35 to 64 Years | 114 (3.5%) | 70 (2.3%) |
| 65 to 74 Years | 132 (13.7%) | 38 (4.3%) |
| 75 Years and over | 88 (14.9%) | 161 (20.8%) |
Disability Class: Vision Difficulty
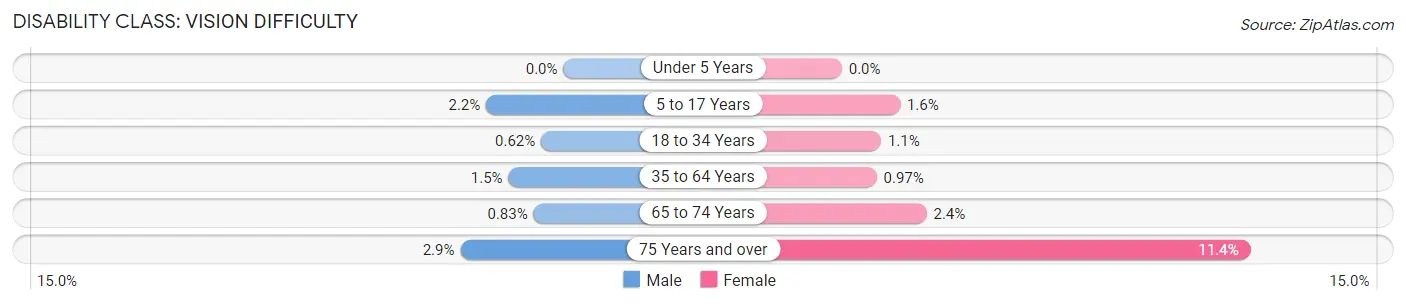
| Age Bracket | Male | Female |
| Under 5 Years | 0 (0.0%) | 0 (0.0%) |
| 5 to 17 Years | 33 (2.1%) | 23 (1.6%) |
| 18 to 34 Years | 10 (0.6%) | 16 (1.1%) |
| 35 to 64 Years | 49 (1.5%) | 30 (1.0%) |
| 65 to 74 Years | 8 (0.8%) | 21 (2.4%) |
| 75 Years and over | 17 (2.9%) | 88 (11.4%) |
Disability Class: Cognitive Difficulty
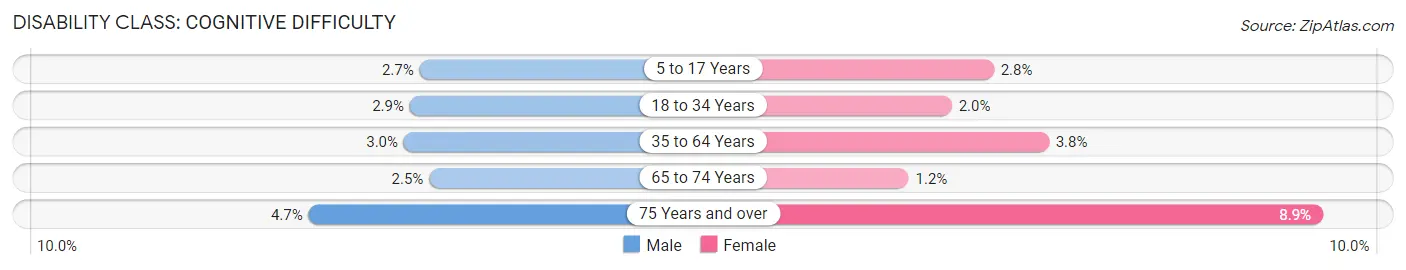
| Age Bracket | Male | Female |
| 5 to 17 Years | 41 (2.7%) | 40 (2.8%) |
| 18 to 34 Years | 46 (2.9%) | 30 (2.0%) |
| 35 to 64 Years | 95 (3.0%) | 119 (3.8%) |
| 65 to 74 Years | 24 (2.5%) | 11 (1.2%) |
| 75 Years and over | 28 (4.7%) | 69 (8.9%) |
Disability Class: Ambulatory Difficulty
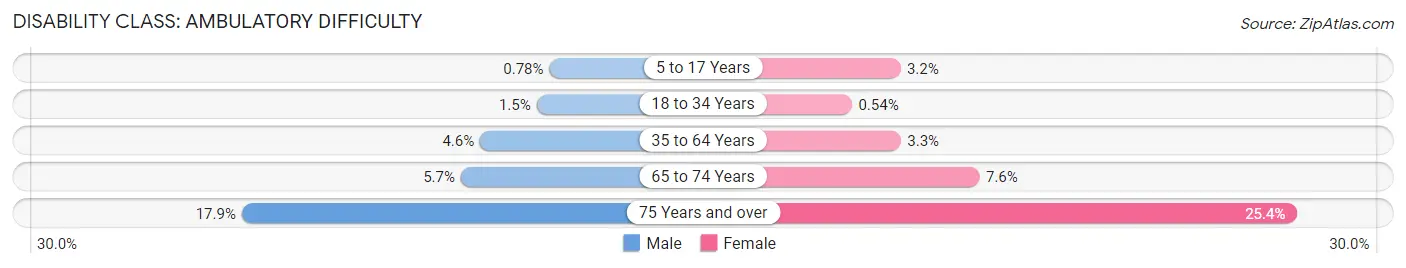
| Age Bracket | Male | Female |
| 5 to 17 Years | 12 (0.8%) | 46 (3.2%) |
| 18 to 34 Years | 24 (1.5%) | 8 (0.5%) |
| 35 to 64 Years | 149 (4.6%) | 101 (3.3%) |
| 65 to 74 Years | 55 (5.7%) | 68 (7.6%) |
| 75 Years and over | 106 (17.9%) | 196 (25.4%) |
Disability Class: Self-Care Difficulty
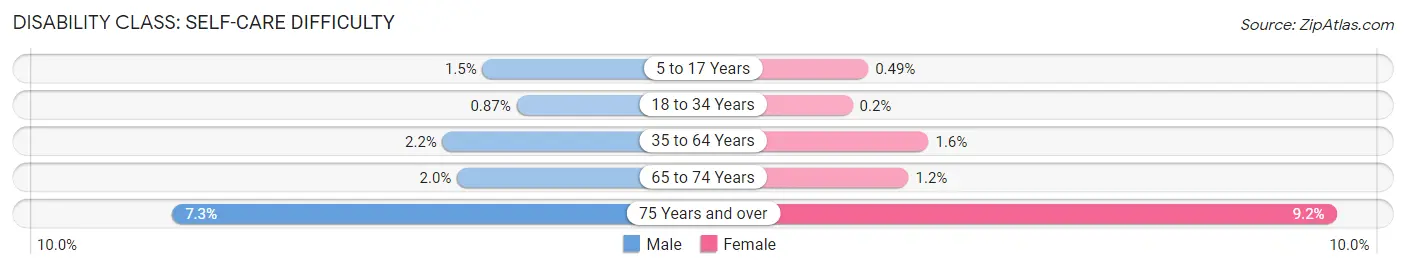
| Age Bracket | Male | Female |
| 5 to 17 Years | 23 (1.5%) | 7 (0.5%) |
| 18 to 34 Years | 14 (0.9%) | 3 (0.2%) |
| 35 to 64 Years | 72 (2.2%) | 50 (1.6%) |
| 65 to 74 Years | 19 (2.0%) | 11 (1.2%) |
| 75 Years and over | 43 (7.3%) | 71 (9.2%) |
Technology Access in Lafayette County
Computing Device Access in Lafayette County
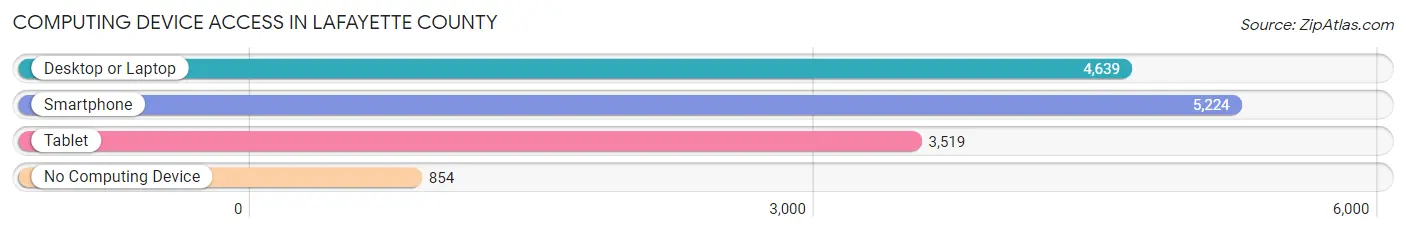
| Device Type | # Households | % Households |
| Desktop or Laptop | 4,639 | 69.7% |
| Smartphone | 5,224 | 78.5% |
| Tablet | 3,519 | 52.9% |
| No Computing Device | 854 | 12.8% |
| Total | 6,652 | 100.0% |
Internet Access in Lafayette County
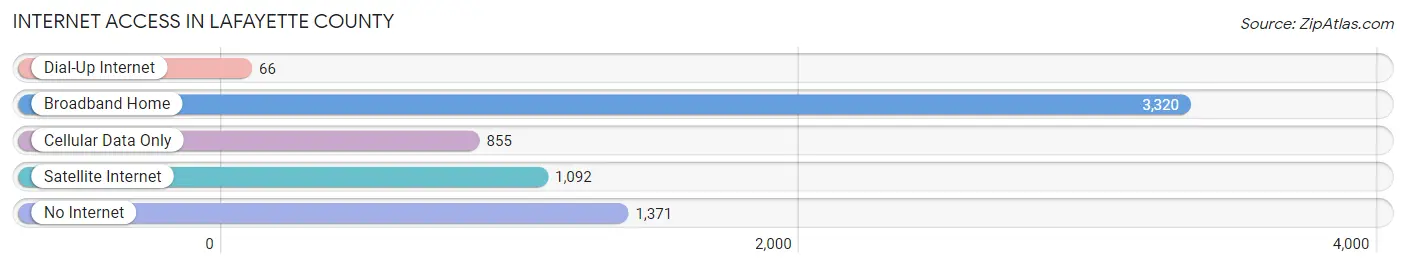
| Internet Type | # Households | % Households |
| Dial-Up Internet | 66 | 1.0% |
| Broadband Home | 3,320 | 49.9% |
| Cellular Data Only | 855 | 12.9% |
| Satellite Internet | 1,092 | 16.4% |
| No Internet | 1,371 | 20.6% |
| Total | 6,652 | 100.0% |
Lafayette County Summary
Lafayette County is located in the southwestern corner of Wisconsin, and is bordered by Iowa to the west and Illinois to the south. The county seat is Darlington, and the county is named after the Marquis de Lafayette, a French military leader who fought in the American Revolutionary War. The county has a total area of 576 square miles, and a population of 16,836 as of the 2010 census.
Geography
Lafayette County is located in the Driftless Area of Wisconsin, which is characterized by its rugged terrain and rolling hills. The county is drained by the Pecatonica River, which flows through the county from north to south. The highest point in the county is located in the town of Gratiot, at an elevation of 1,200 feet. The county is mostly rural, with the majority of the population living in small towns and villages.
Economy
The economy of Lafayette County is largely based on agriculture. The county is home to a number of dairy farms, as well as beef and poultry operations. The county is also home to a number of small businesses, including manufacturing, retail, and service industries. The county is also home to a number of tourist attractions, including the Pecatonica River State Park, the Lafayette County Historical Society Museum, and the Lafayette County Fairgrounds.
Demographics
As of the 2010 census, the population of Lafayette County was 16,836, with a population density of 29.4 people per square mile. The racial makeup of the county was 97.2% White, 0.4% African American, 0.3% Native American, 0.3% Asian, 0.2% from other races, and 1.6% from two or more races. Hispanic or Latino of any race were 1.2% of the population.
The median income for a household in the county was $45,945, and the median income for a family was $54,945. The per capita income for the county was $21,945. About 8.2% of families and 11.2% of the population were below the poverty line, including 14.2% of those under age 18 and 8.2% of those age 65 or over.
Education
Lafayette County is served by the Lafayette County School District, which consists of four elementary schools, one middle school, and one high school. The county is also home to a number of private schools, including the Darlington Catholic School and the Shullsburg Lutheran School. The University of Wisconsin-Platteville also has a campus in the county.
Conclusion
Lafayette County is a rural county located in the southwestern corner of Wisconsin. The county is characterized by its rugged terrain and rolling hills, and is home to a number of dairy farms, small businesses, and tourist attractions. The population of the county is largely white, with a median income of $45,945. The county is served by the Lafayette County School District, as well as a number of private schools and the University of Wisconsin-Platteville.
Common Questions
What is the Total Population of Lafayette County?
Total Population of Lafayette County is 16,716.
What is the Total Male Population of Lafayette County?
Total Male Population of Lafayette County is 8,538.
What is the Total Female Population of Lafayette County?
Total Female Population of Lafayette County is 8,178.
What is the Ratio of Males per 100 Females in Lafayette County?
There are 104.40 Males per 100 Females in Lafayette County.
What is the Ratio of Females per 100 Males in Lafayette County?
There are 95.78 Females per 100 Males in Lafayette County.
What is the Median Population Age in Lafayette County?
Median Population Age in Lafayette County is 41.7 Years.
What is the Average Family Size in Lafayette County
Average Family Size in Lafayette County is 3.0 People.
What is the Average Household Size in Lafayette County
Average Household Size in Lafayette County is 2.5 People.
What is Per Capita Income in Lafayette County?
Per Capita income in Lafayette County is $33,484.
What is the Median Family Income in Lafayette County?
Median Family Income in Lafayette County is $82,434.
What is the Median Household income in Lafayette County?
Median Household Income in Lafayette County is $69,293.
What is Income or Wage Gap in Lafayette County?
Income or Wage Gap in Lafayette County is 25.1%.
Women in Lafayette County earn 74.9 cents for every dollar earned by a man.
What is Family Income Deficit in Lafayette County?
Family Income Deficit in Lafayette County is $13,253.
Families that are below poverty line in Lafayette County earn $13,253 less on average than the poverty threshold level.
What is Inequality or Gini Index in Lafayette County?
Inequality or Gini Index in Lafayette County is 0.41.
How Large is the Labor Force in Lafayette County?
There are 8,603 People in the Labor Forcein in Lafayette County.
What is the Percentage of People in the Labor Force in Lafayette County?
65.3% of People are in the Labor Force in Lafayette County.
What is the Unemployment Rate in Lafayette County?
Unemployment Rate in Lafayette County is 2.4%.