La Crosse County, WI
La Crosse County Map

La Crosse County Overview
120,216
TOTAL POPULATION
59,025
MALE POPULATION
61,191
FEMALE POPULATION
96.46
MALES / 100 FEMALES
103.67
FEMALES / 100 MALES
36.6
MEDIAN AGE
3.0
AVG FAMILY SIZE
2.3
AVG HOUSEHOLD SIZE
$39,498
PER CAPITA INCOME
$94,779
AVG FAMILY INCOME
$68,731
AVG HOUSEHOLD INCOME
25.5%
WAGE / INCOME GAP [ % ]
74.5¢/ $1
WAGE / INCOME GAP [ $ ]
$8,046
FAMILY INCOME DEFICIT
0.46
INEQUALITY / GINI INDEX
65,848
LABOR FORCE [ PEOPLE ]
66.2%
PERCENT IN LABOR FORCE
3.1%
UNEMPLOYMENT RATE
La Crosse County Area Codes
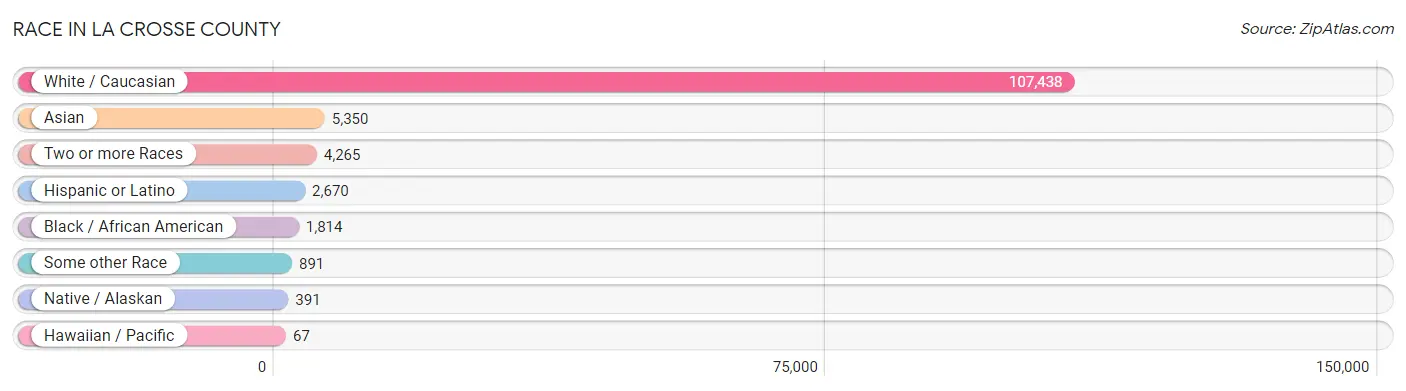
Race in La Crosse County
The most populous races in La Crosse County are White / Caucasian (107,438 | 89.4%), Asian (5,350 | 4.4%), and Two or more Races (4,265 | 3.5%).
| Race | # Population | % Population |
| Asian | 5,350 | 4.4% |
| Black / African American | 1,814 | 1.5% |
| Hawaiian / Pacific | 67 | 0.1% |
| Hispanic or Latino | 2,670 | 2.2% |
| Native / Alaskan | 391 | 0.3% |
| White / Caucasian | 107,438 | 89.4% |
| Two or more Races | 4,265 | 3.5% |
| Some other Race | 891 | 0.7% |
| Total | 120,216 | 100.0% |
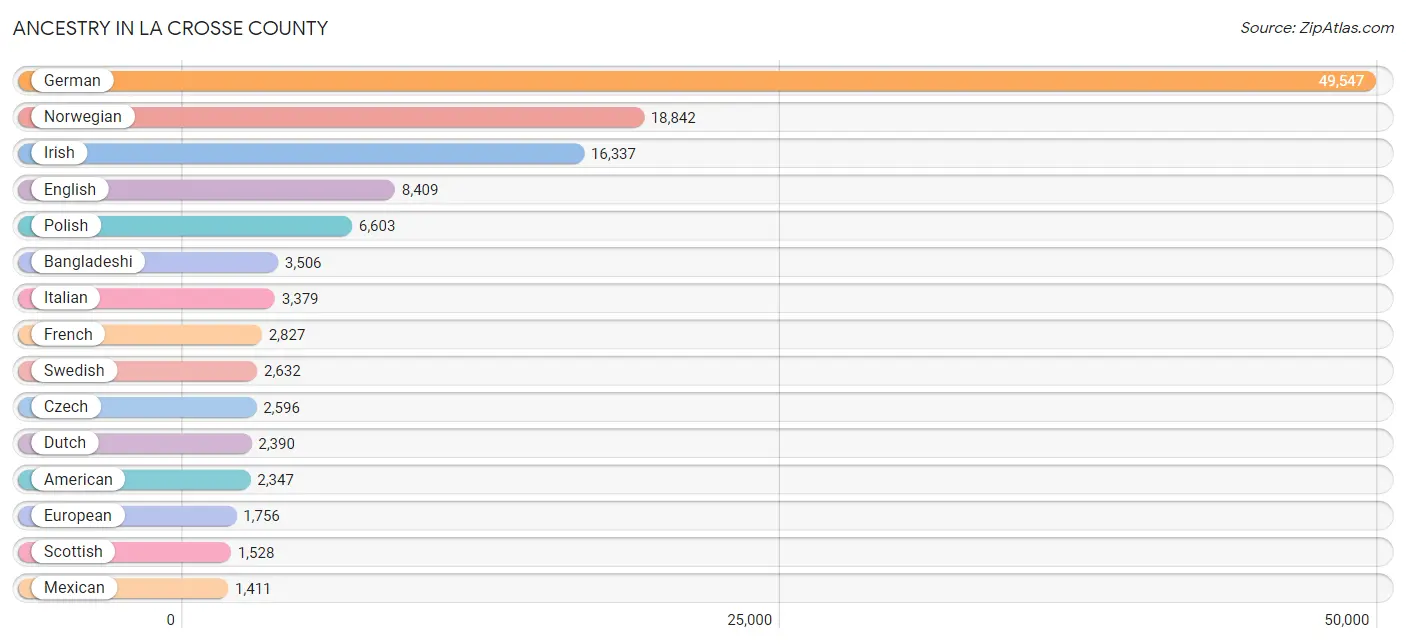
Ancestry in La Crosse County
The most populous ancestries reported in La Crosse County are German (49,547 | 41.2%), Norwegian (18,842 | 15.7%), Irish (16,337 | 13.6%), English (8,409 | 7.0%), and Polish (6,603 | 5.5%), together accounting for 82.9% of all La Crosse County residents.
| Ancestry | # Population | % Population |
| African | 116 | 0.1% |
| Alsatian | 13 | 0.0% |
| American | 2,347 | 1.9% |
| Apache | 94 | 0.1% |
| Arab | 468 | 0.4% |
| Australian | 6 | 0.0% |
| Austrian | 429 | 0.4% |
| Bangladeshi | 3,506 | 2.9% |
| Belgian | 179 | 0.2% |
| Belizean | 9 | 0.0% |
| Bhutanese | 283 | 0.2% |
| Blackfeet | 4 | 0.0% |
| Bolivian | 45 | 0.0% |
| Brazilian | 34 | 0.0% |
| British | 515 | 0.4% |
| Bulgarian | 15 | 0.0% |
| Burmese | 433 | 0.4% |
| Canadian | 127 | 0.1% |
| Celtic | 38 | 0.0% |
| Central American | 175 | 0.2% |
| Central American Indian | 28 | 0.0% |
| Cherokee | 140 | 0.1% |
| Chickasaw | 2 | 0.0% |
| Chippewa | 160 | 0.1% |
| Choctaw | 4 | 0.0% |
| Colombian | 166 | 0.1% |
| Costa Rican | 9 | 0.0% |
| Croatian | 106 | 0.1% |
| Cuban | 135 | 0.1% |
| Czech | 2,596 | 2.2% |
| Czechoslovakian | 272 | 0.2% |
| Danish | 846 | 0.7% |
| Dominican | 52 | 0.0% |
| Dutch | 2,390 | 2.0% |
| Eastern European | 254 | 0.2% |
| Ecuadorian | 34 | 0.0% |
| English | 8,409 | 7.0% |
| Ethiopian | 16 | 0.0% |
| European | 1,756 | 1.5% |
| Filipino | 40 | 0.0% |
| Finnish | 681 | 0.6% |
| French | 2,827 | 2.4% |
| French Canadian | 777 | 0.6% |
| German | 49,547 | 41.2% |
| Ghanaian | 7 | 0.0% |
| Greek | 140 | 0.1% |
| Guamanian / Chamorro | 97 | 0.1% |
| Guatemalan | 79 | 0.1% |
| Honduran | 28 | 0.0% |
| Hungarian | 319 | 0.3% |
| Icelander | 6 | 0.0% |
| Indian (Asian) | 677 | 0.6% |
| Iranian | 48 | 0.0% |
| Irish | 16,337 | 13.6% |
| Iroquois | 6 | 0.0% |
| Italian | 3,379 | 2.8% |
| Jamaican | 16 | 0.0% |
| Korean | 751 | 0.6% |
| Laotian | 21 | 0.0% |
| Latvian | 28 | 0.0% |
| Lebanese | 234 | 0.2% |
| Lithuanian | 122 | 0.1% |
| Luxembourger | 145 | 0.1% |
| Macedonian | 17 | 0.0% |
| Malaysian | 151 | 0.1% |
| Menominee | 31 | 0.0% |
| Mexican | 1,411 | 1.2% |
| Moroccan | 15 | 0.0% |
| Native Hawaiian | 31 | 0.0% |
| Navajo | 12 | 0.0% |
| New Zealander | 20 | 0.0% |
| Nicaraguan | 10 | 0.0% |
| Nigerian | 118 | 0.1% |
| Northern European | 144 | 0.1% |
| Norwegian | 18,842 | 15.7% |
| Pakistani | 76 | 0.1% |
| Panamanian | 49 | 0.0% |
| Pennsylvania German | 82 | 0.1% |
| Peruvian | 58 | 0.1% |
| Polish | 6,603 | 5.5% |
| Portuguese | 71 | 0.1% |
| Potawatomi | 6 | 0.0% |
| Puerto Rican | 371 | 0.3% |
| Romanian | 45 | 0.0% |
| Russian | 556 | 0.5% |
| Scandinavian | 1,080 | 0.9% |
| Scotch-Irish | 567 | 0.5% |
| Scottish | 1,528 | 1.3% |
| Serbian | 189 | 0.2% |
| Sioux | 71 | 0.1% |
| Slavic | 2 | 0.0% |
| Slovak | 103 | 0.1% |
| Slovene | 73 | 0.1% |
| South American | 321 | 0.3% |
| Spaniard | 65 | 0.1% |
| Spanish | 61 | 0.1% |
| Sri Lankan | 85 | 0.1% |
| Subsaharan African | 250 | 0.2% |
| Swedish | 2,632 | 2.2% |
| Swiss | 768 | 0.6% |
| Syrian | 94 | 0.1% |
| Thai | 360 | 0.3% |
| Turkish | 8 | 0.0% |
| Ukrainian | 212 | 0.2% |
| Venezuelan | 18 | 0.0% |
| Vietnamese | 61 | 0.1% |
| Welsh | 541 | 0.4% |
| West Indian | 24 | 0.0% |
| Yugoslavian | 123 | 0.1% |
| Yup'ik | 8 | 0.0% | View All 110 Rows |
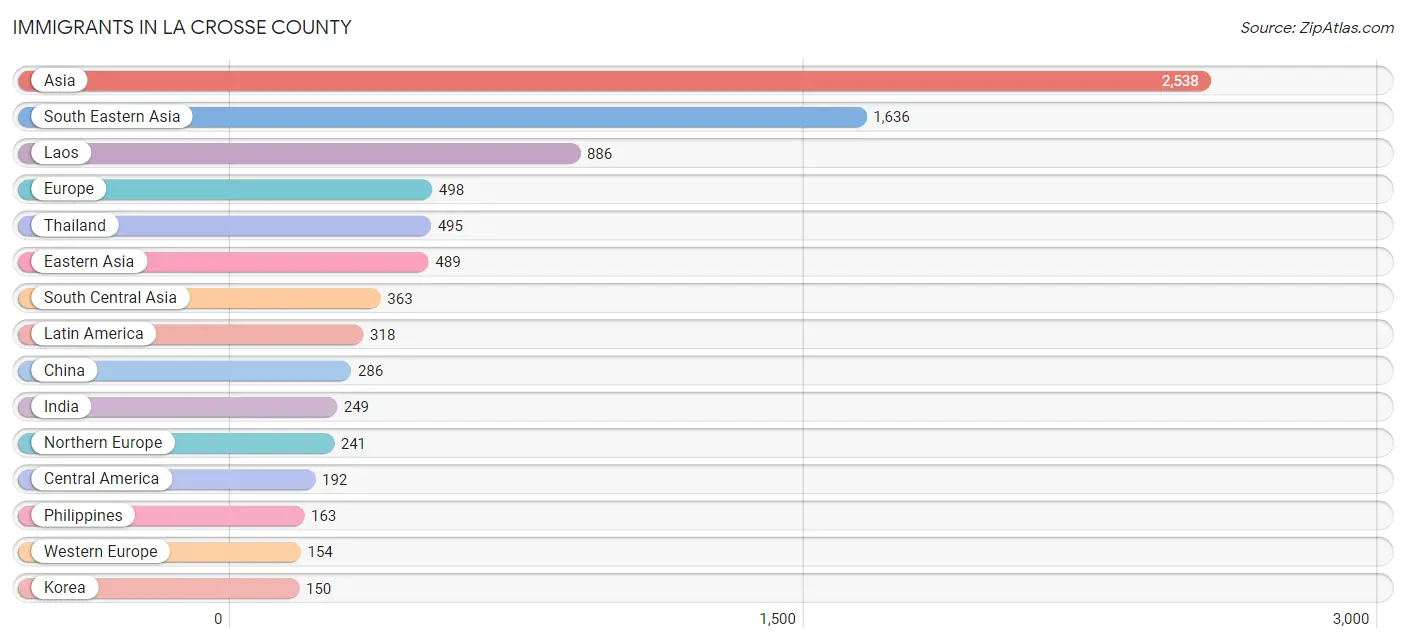
Immigrants in La Crosse County
The most numerous immigrant groups reported in La Crosse County came from Asia (2,538 | 2.1%), South Eastern Asia (1,636 | 1.4%), Laos (886 | 0.7%), Europe (498 | 0.4%), and Thailand (495 | 0.4%), together accounting for 5.0% of all La Crosse County residents.
| Immigration Origin | # Population | % Population |
| Africa | 102 | 0.1% |
| Asia | 2,538 | 2.1% |
| Austria | 14 | 0.0% |
| Bangladesh | 61 | 0.1% |
| Belize | 14 | 0.0% |
| Brazil | 28 | 0.0% |
| Bulgaria | 15 | 0.0% |
| Cambodia | 12 | 0.0% |
| Canada | 27 | 0.0% |
| Caribbean | 22 | 0.0% |
| Central America | 192 | 0.2% |
| China | 286 | 0.2% |
| Colombia | 34 | 0.0% |
| Congo | 19 | 0.0% |
| Costa Rica | 9 | 0.0% |
| Cuba | 4 | 0.0% |
| Eastern Africa | 60 | 0.1% |
| Eastern Asia | 489 | 0.4% |
| Eastern Europe | 103 | 0.1% |
| England | 34 | 0.0% |
| Ethiopia | 40 | 0.0% |
| Europe | 498 | 0.4% |
| France | 15 | 0.0% |
| Germany | 92 | 0.1% |
| Guatemala | 46 | 0.0% |
| Honduras | 28 | 0.0% |
| Hungary | 11 | 0.0% |
| India | 249 | 0.2% |
| Indonesia | 12 | 0.0% |
| Iran | 16 | 0.0% |
| Ireland | 7 | 0.0% |
| Jamaica | 18 | 0.0% |
| Japan | 53 | 0.0% |
| Jordan | 30 | 0.0% |
| Kazakhstan | 9 | 0.0% |
| Korea | 150 | 0.1% |
| Laos | 886 | 0.7% |
| Latin America | 318 | 0.3% |
| Lebanon | 10 | 0.0% |
| Mexico | 95 | 0.1% |
| Middle Africa | 19 | 0.0% |
| Netherlands | 19 | 0.0% |
| Nigeria | 15 | 0.0% |
| Northern Europe | 241 | 0.2% |
| Norway | 19 | 0.0% |
| Pakistan | 28 | 0.0% |
| Peru | 24 | 0.0% |
| Philippines | 163 | 0.1% |
| Romania | 10 | 0.0% |
| Russia | 6 | 0.0% |
| Scotland | 27 | 0.0% |
| South Africa | 8 | 0.0% |
| South America | 104 | 0.1% |
| South Central Asia | 363 | 0.3% |
| South Eastern Asia | 1,636 | 1.4% |
| Switzerland | 14 | 0.0% |
| Taiwan | 70 | 0.1% |
| Thailand | 495 | 0.4% |
| Ukraine | 51 | 0.0% |
| Venezuela | 18 | 0.0% |
| Vietnam | 68 | 0.1% |
| Western Africa | 15 | 0.0% |
| Western Asia | 40 | 0.0% |
| Western Europe | 154 | 0.1% | View All 64 Rows |
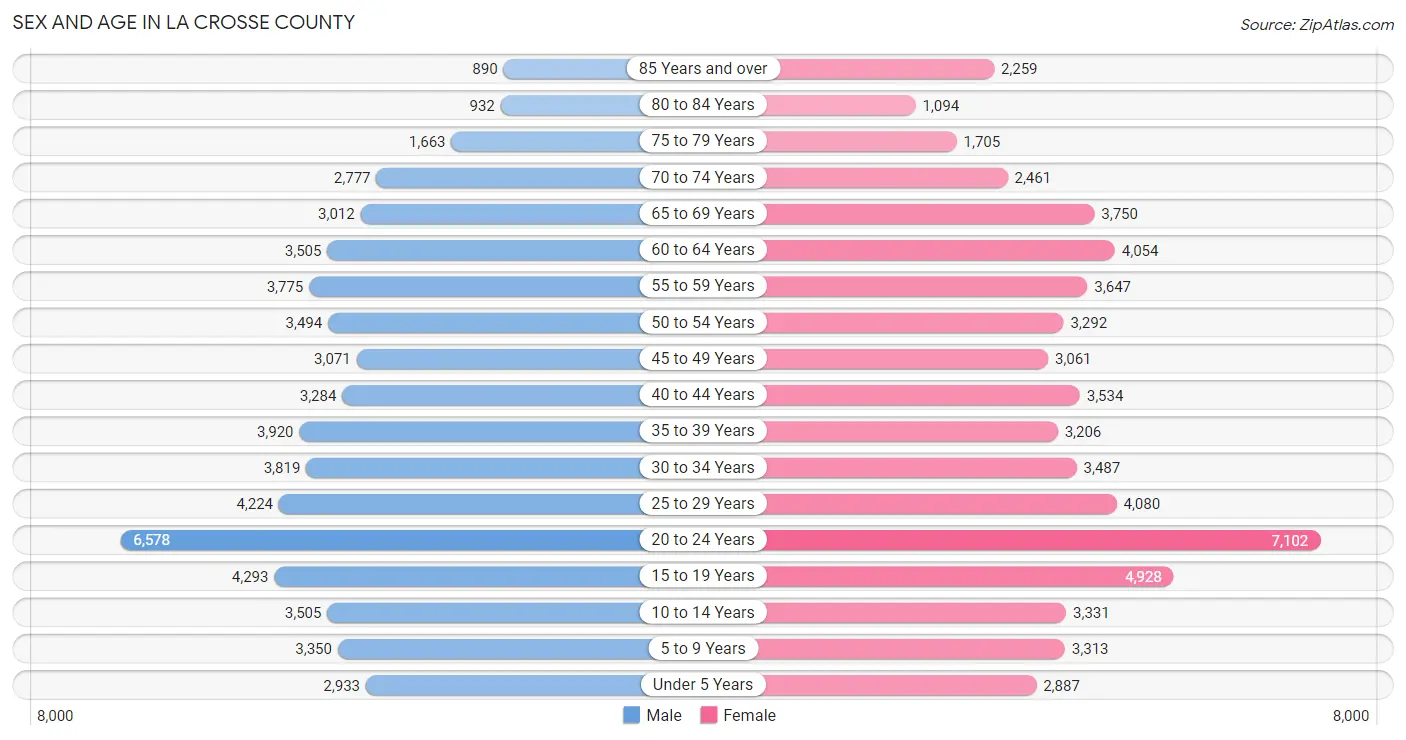
Sex and Age in La Crosse County
Sex and Age in La Crosse County
The most populous age groups in La Crosse County are 20 to 24 Years (6,578 | 11.1%) for men and 20 to 24 Years (7,102 | 11.6%) for women.
| Age Bracket | Male | Female |
| Under 5 Years | 2,933 (5.0%) | 2,887 (4.7%) |
| 5 to 9 Years | 3,350 (5.7%) | 3,313 (5.4%) |
| 10 to 14 Years | 3,505 (5.9%) | 3,331 (5.4%) |
| 15 to 19 Years | 4,293 (7.3%) | 4,928 (8.1%) |
| 20 to 24 Years | 6,578 (11.1%) | 7,102 (11.6%) |
| 25 to 29 Years | 4,224 (7.2%) | 4,080 (6.7%) |
| 30 to 34 Years | 3,819 (6.5%) | 3,487 (5.7%) |
| 35 to 39 Years | 3,920 (6.6%) | 3,206 (5.2%) |
| 40 to 44 Years | 3,284 (5.6%) | 3,534 (5.8%) |
| 45 to 49 Years | 3,071 (5.2%) | 3,061 (5.0%) |
| 50 to 54 Years | 3,494 (5.9%) | 3,292 (5.4%) |
| 55 to 59 Years | 3,775 (6.4%) | 3,647 (6.0%) |
| 60 to 64 Years | 3,505 (5.9%) | 4,054 (6.6%) |
| 65 to 69 Years | 3,012 (5.1%) | 3,750 (6.1%) |
| 70 to 74 Years | 2,777 (4.7%) | 2,461 (4.0%) |
| 75 to 79 Years | 1,663 (2.8%) | 1,705 (2.8%) |
| 80 to 84 Years | 932 (1.6%) | 1,094 (1.8%) |
| 85 Years and over | 890 (1.5%) | 2,259 (3.7%) |
| Total | 59,025 (100.0%) | 61,191 (100.0%) |
Families and Households in La Crosse County
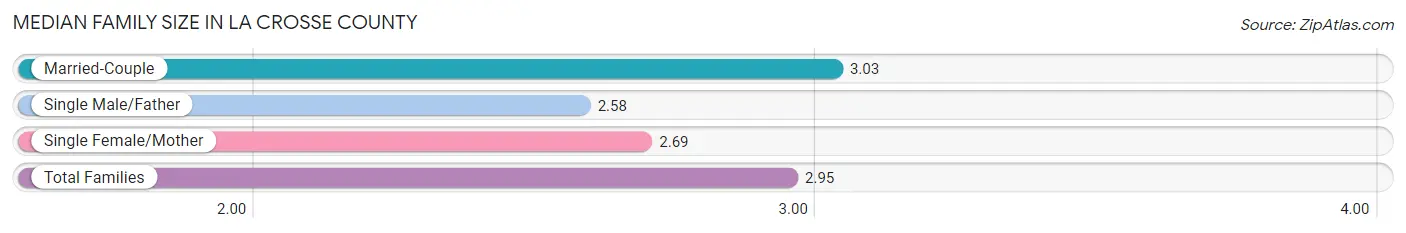
Median Family Size in La Crosse County
The median family size in La Crosse County is 2.95 persons per family, with married-couple families (21,728 | 78.8%) accounting for the largest median family size of 3.03 persons per family. On the other hand, single male/father families (2,060 | 7.5%) represent the smallest median family size with 2.58 persons per family.
| Family Type | # Families | Family Size |
| Married-Couple | 21,728 (78.8%) | 3.03 |
| Single Male/Father | 2,060 (7.5%) | 2.58 |
| Single Female/Mother | 3,777 (13.7%) | 2.69 |
| Total Families | 27,565 (100.0%) | 2.95 |
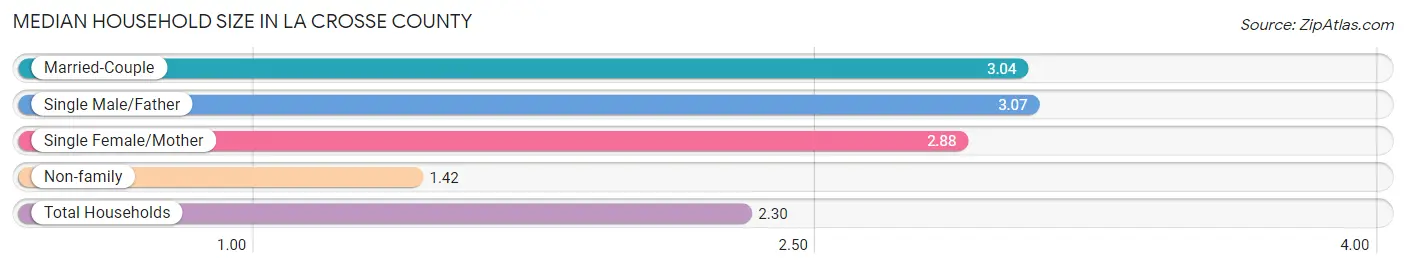
Median Household Size in La Crosse County
The median household size in La Crosse County is 2.30 persons per household, with single male/father households (2,060 | 4.1%) accounting for the largest median household size of 3.07 persons per household. non-family households (22,614 | 45.1%) represent the smallest median household size with 1.42 persons per household.
| Household Type | # Households | Household Size |
| Married-Couple | 21,728 (43.3%) | 3.04 |
| Single Male/Father | 2,060 (4.1%) | 3.07 |
| Single Female/Mother | 3,777 (7.5%) | 2.88 |
| Non-family | 22,614 (45.1%) | 1.42 |
| Total Households | 50,179 (100.0%) | 2.30 |
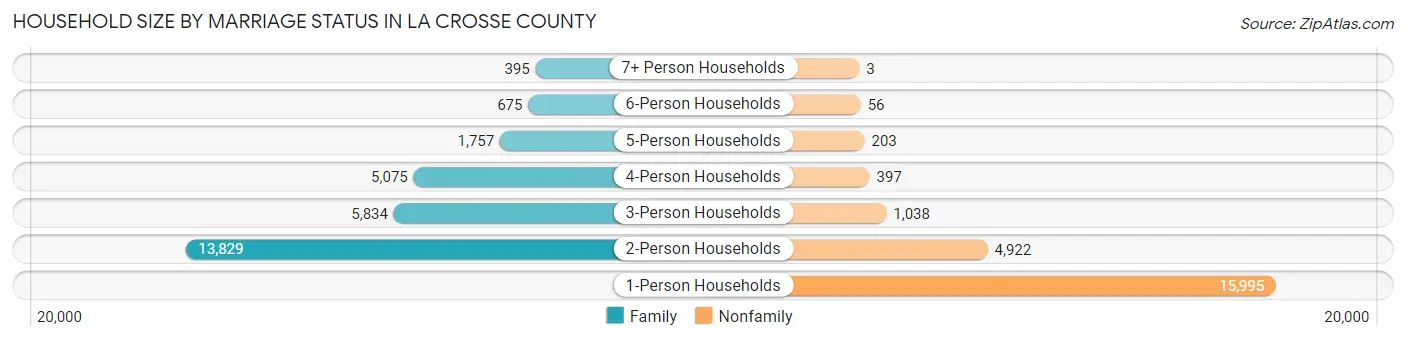
Household Size by Marriage Status in La Crosse County
Out of a total of 50,179 households in La Crosse County, 27,565 (54.9%) are family households, while 22,614 (45.1%) are nonfamily households. The most numerous type of family households are 2-person households, comprising 13,829, and the most common type of nonfamily households are 1-person households, comprising 15,995.
| Household Size | Family Households | Nonfamily Households |
| 1-Person Households | - | 15,995 (31.9%) |
| 2-Person Households | 13,829 (27.6%) | 4,922 (9.8%) |
| 3-Person Households | 5,834 (11.6%) | 1,038 (2.1%) |
| 4-Person Households | 5,075 (10.1%) | 397 (0.8%) |
| 5-Person Households | 1,757 (3.5%) | 203 (0.4%) |
| 6-Person Households | 675 (1.3%) | 56 (0.1%) |
| 7+ Person Households | 395 (0.8%) | 3 (0.0%) |
| Total | 27,565 (54.9%) | 22,614 (45.1%) |
Female Fertility in La Crosse County
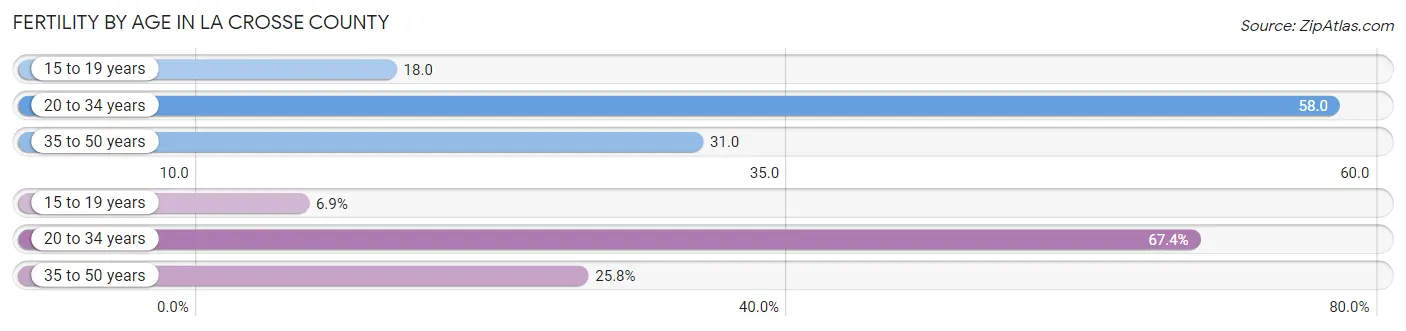
Fertility by Age in La Crosse County
Average fertility rate in La Crosse County is 42.0 births per 1,000 women. Women in the age bracket of 20 to 34 years have the highest fertility rate with 58.0 births per 1,000 women. Women in the age bracket of 20 to 34 years acount for 67.3% of all women with births.
| Age Bracket | Women with Births | Births / 1,000 Women |
| 15 to 19 years | 87 (6.9%) | 18.0 |
| 20 to 34 years | 856 (67.3%) | 58.0 |
| 35 to 50 years | 328 (25.8%) | 31.0 |
| Total | 1,271 (100.0%) | 42.0 |
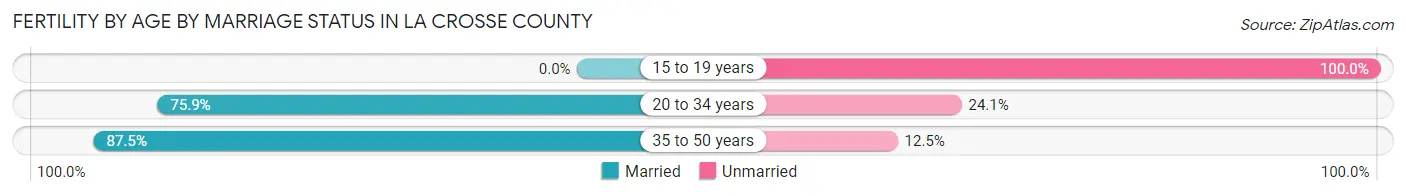
Fertility by Age by Marriage Status in La Crosse County
73.7% of women with births (1,271) in La Crosse County are married. The highest percentage of unmarried women with births falls into 15 to 19 years age bracket with 100.0% of them unmarried at the time of birth, while the lowest percentage of unmarried women with births belong to 35 to 50 years age bracket with 12.5% of them unmarried.
| Age Bracket | Married | Unmarried |
| 15 to 19 years | 0 (0.0%) | 87 (100.0%) |
| 20 to 34 years | 650 (75.9%) | 206 (24.1%) |
| 35 to 50 years | 287 (87.5%) | 41 (12.5%) |
| Total | 937 (73.7%) | 334 (26.3%) |
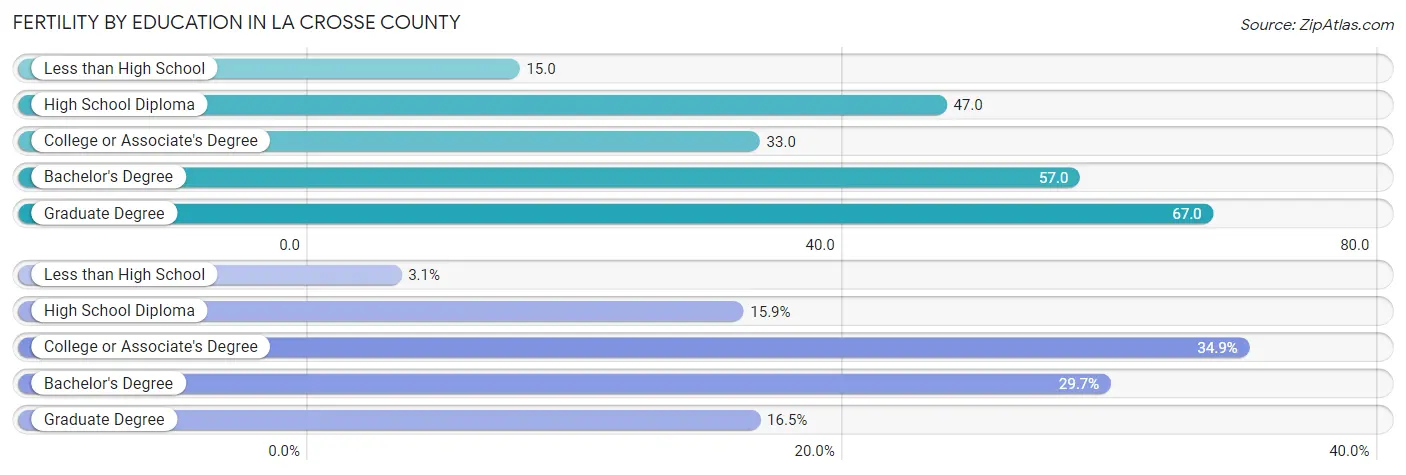
Fertility by Education in La Crosse County
Average fertility rate in La Crosse County is 42.0 births per 1,000 women. Women with the education attainment of graduate degree have the highest fertility rate of 67.0 births per 1,000 women, while women with the education attainment of less than high school have the lowest fertility at 15.0 births per 1,000 women. Women with the education attainment of college or associate's degree represent 34.8% of all women with births.
| Educational Attainment | Women with Births | Births / 1,000 Women |
| Less than High School | 39 (3.1%) | 15.0 |
| High School Diploma | 202 (15.9%) | 47.0 |
| College or Associate's Degree | 443 (34.8%) | 33.0 |
| Bachelor's Degree | 377 (29.7%) | 57.0 |
| Graduate Degree | 210 (16.5%) | 67.0 |
| Total | 1,271 (100.0%) | 42.0 |
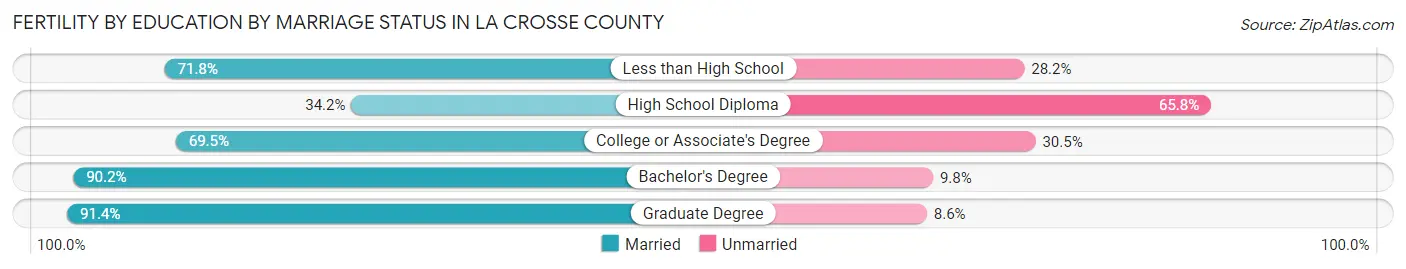
Fertility by Education by Marriage Status in La Crosse County
26.3% of women with births in La Crosse County are unmarried. Women with the educational attainment of graduate degree are most likely to be married with 91.4% of them married at childbirth, while women with the educational attainment of high school diploma are least likely to be married with 65.8% of them unmarried at childbirth.
| Educational Attainment | Married | Unmarried |
| Less than High School | 28 (71.8%) | 11 (28.2%) |
| High School Diploma | 69 (34.2%) | 133 (65.8%) |
| College or Associate's Degree | 308 (69.5%) | 135 (30.5%) |
| Bachelor's Degree | 340 (90.2%) | 37 (9.8%) |
| Graduate Degree | 192 (91.4%) | 18 (8.6%) |
| Total | 937 (73.7%) | 334 (26.3%) |
Income in La Crosse County
Income Overview in La Crosse County
Per Capita Income in La Crosse County is $39,498, while median incomes of families and households are $94,779 and $68,731 respectively.
| Characteristic | Number | Measure |
| Per Capita Income | 120,216 | $39,498 |
| Median Family Income | 27,565 | $94,779 |
| Mean Family Income | 27,565 | $120,976 |
| Median Household Income | 50,179 | $68,731 |
| Mean Household Income | 50,179 | $92,644 |
| Income Deficit | 27,565 | $8,046 |
| Wage / Income Gap (%) | 120,216 | 25.48% |
| Wage / Income Gap ($) | 120,216 | 74.52¢ per $1 |
| Gini / Inequality Index | 120,216 | 0.46 |
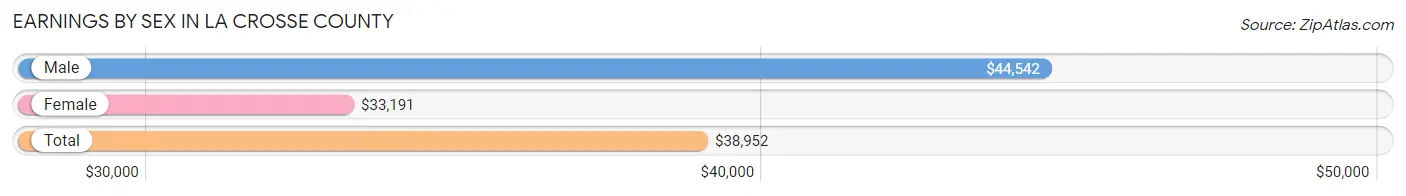
Earnings by Sex in La Crosse County
Average Earnings in La Crosse County are $38,952, $44,542 for men and $33,191 for women, a difference of 25.5%.
| Sex | Number | Average Earnings |
| Male | 36,405 (51.0%) | $44,542 |
| Female | 35,038 (49.0%) | $33,191 |
| Total | 71,443 (100.0%) | $38,952 |
Earnings by Sex by Income Bracket in La Crosse County
The most common earnings brackets in La Crosse County are $100,000+ for men (4,752 | 13.1%) and $55,000 to $64,999 for women (2,632 | 7.5%).
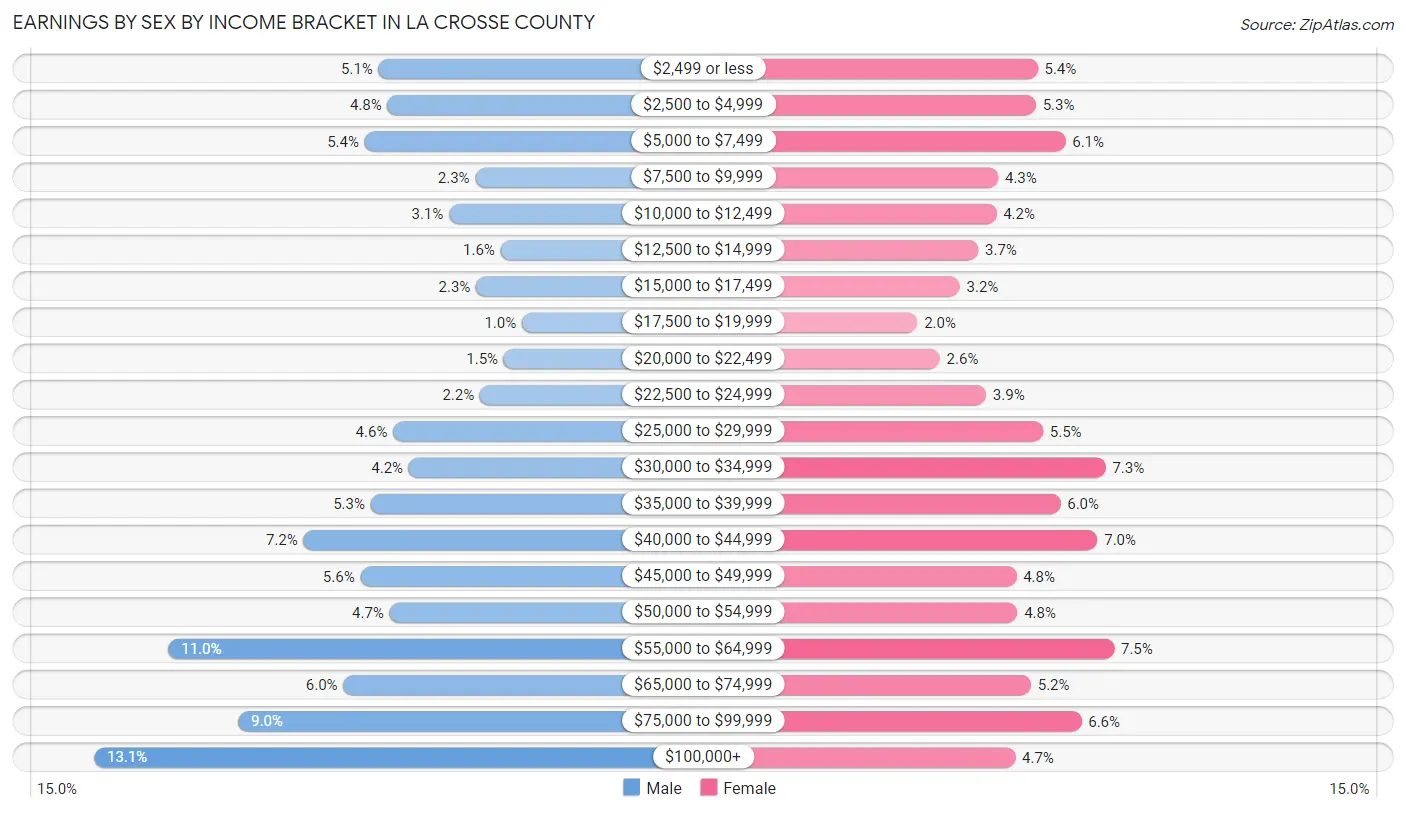
| Income | Male | Female |
| $2,499 or less | 1,838 (5.1%) | 1,877 (5.4%) |
| $2,500 to $4,999 | 1,747 (4.8%) | 1,859 (5.3%) |
| $5,000 to $7,499 | 1,981 (5.4%) | 2,151 (6.1%) |
| $7,500 to $9,999 | 849 (2.3%) | 1,490 (4.3%) |
| $10,000 to $12,499 | 1,117 (3.1%) | 1,470 (4.2%) |
| $12,500 to $14,999 | 589 (1.6%) | 1,293 (3.7%) |
| $15,000 to $17,499 | 842 (2.3%) | 1,110 (3.2%) |
| $17,500 to $19,999 | 372 (1.0%) | 693 (2.0%) |
| $20,000 to $22,499 | 558 (1.5%) | 916 (2.6%) |
| $22,500 to $24,999 | 802 (2.2%) | 1,371 (3.9%) |
| $25,000 to $29,999 | 1,691 (4.6%) | 1,931 (5.5%) |
| $30,000 to $34,999 | 1,528 (4.2%) | 2,549 (7.3%) |
| $35,000 to $39,999 | 1,918 (5.3%) | 2,101 (6.0%) |
| $40,000 to $44,999 | 2,606 (7.2%) | 2,466 (7.0%) |
| $45,000 to $49,999 | 2,025 (5.6%) | 1,668 (4.8%) |
| $50,000 to $54,999 | 1,725 (4.7%) | 1,680 (4.8%) |
| $55,000 to $64,999 | 3,990 (11.0%) | 2,632 (7.5%) |
| $65,000 to $74,999 | 2,200 (6.0%) | 1,812 (5.2%) |
| $75,000 to $99,999 | 3,275 (9.0%) | 2,310 (6.6%) |
| $100,000+ | 4,752 (13.1%) | 1,659 (4.7%) |
| Total | 36,405 (100.0%) | 35,038 (100.0%) |
Earnings by Sex by Educational Attainment in La Crosse County
Average earnings in La Crosse County are $54,150 for men and $41,935 for women, a difference of 22.6%. Men with an educational attainment of graduate degree enjoy the highest average annual earnings of $89,773, while those with less than high school education earn the least with $34,671. Women with an educational attainment of graduate degree earn the most with the average annual earnings of $66,711, while those with less than high school education have the smallest earnings of $17,388.
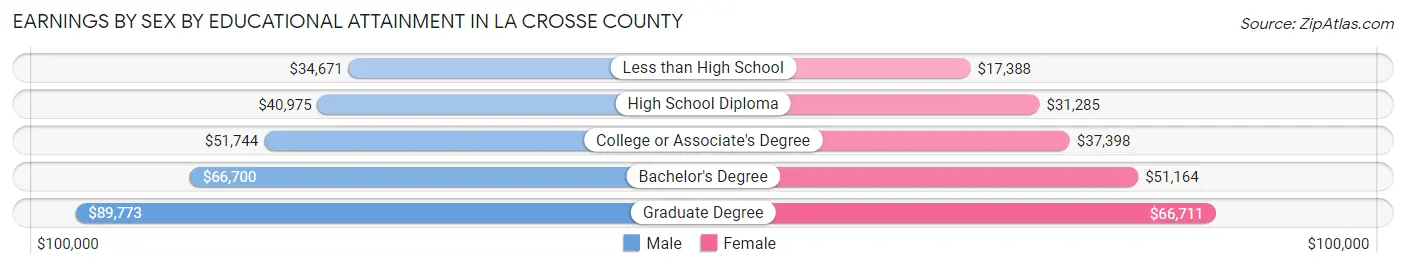
| Educational Attainment | Male Income | Female Income |
| Less than High School | $34,671 | $17,388 |
| High School Diploma | $40,975 | $31,285 |
| College or Associate's Degree | $51,744 | $37,398 |
| Bachelor's Degree | $66,700 | $51,164 |
| Graduate Degree | $89,773 | $66,711 |
| Total | $54,150 | $41,935 |
Family Income in La Crosse County
Family Income Brackets in La Crosse County
According to the La Crosse County family income data, there are 6,478 families falling into the $100,000 to $149,999 income range, which is the most common income bracket and makes up 23.5% of all families. Conversely, the less than $10,000 income bracket is the least frequent group with only 276 families (1.0%) belonging to this category.
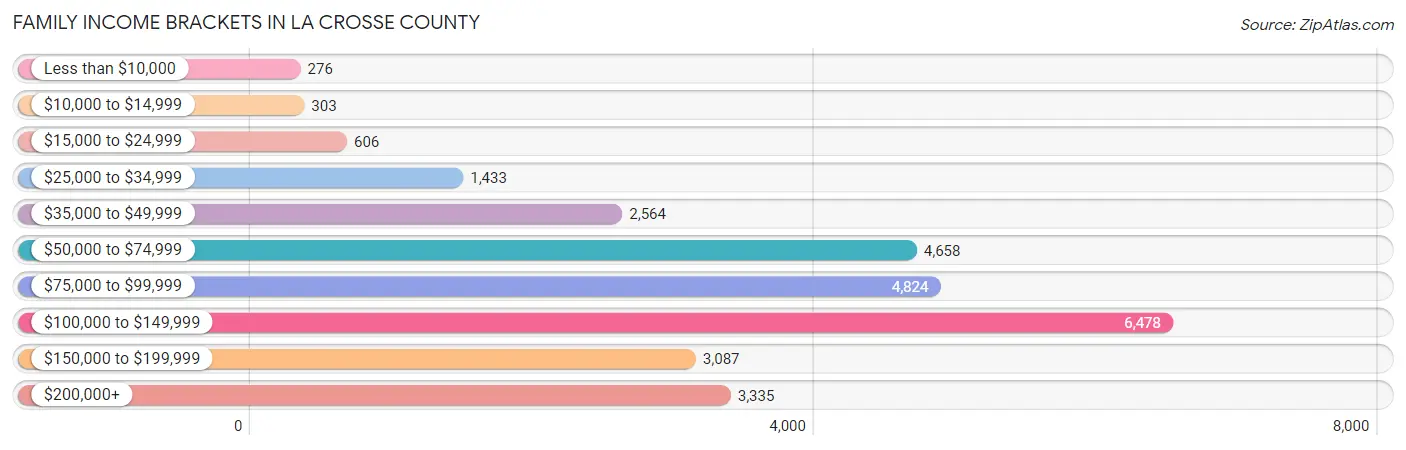
| Income Bracket | # Families | % Families |
| Less than $10,000 | 276 | 1.0% |
| $10,000 to $14,999 | 303 | 1.1% |
| $15,000 to $24,999 | 606 | 2.2% |
| $25,000 to $34,999 | 1,433 | 5.2% |
| $35,000 to $49,999 | 2,564 | 9.3% |
| $50,000 to $74,999 | 4,658 | 16.9% |
| $75,000 to $99,999 | 4,824 | 17.5% |
| $100,000 to $149,999 | 6,478 | 23.5% |
| $150,000 to $199,999 | 3,087 | 11.2% |
| $200,000+ | 3,335 | 12.1% |
Family Income by Famaliy Size in La Crosse County
4-person families (4,684 | 17.0%) account for the highest median family income in La Crosse County with $122,941 per family, while 2-person families (14,711 | 53.4%) have the highest median income of $41,184 per family member.
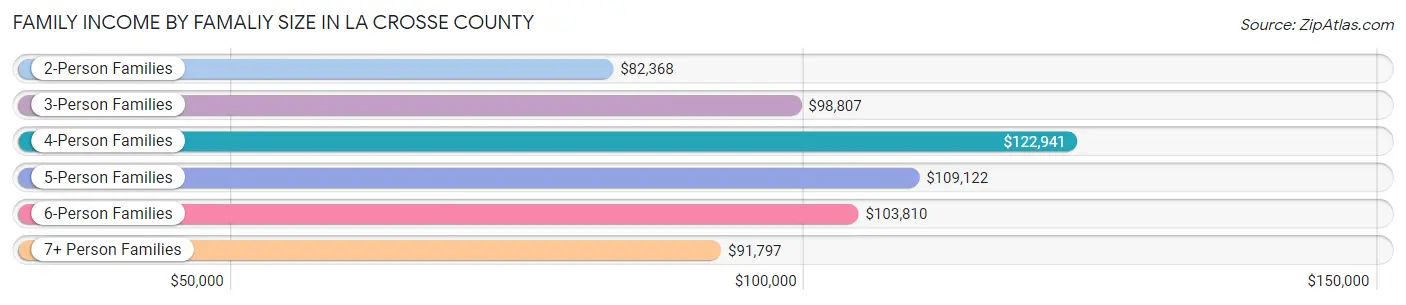
| Income Bracket | # Families | Median Income |
| 2-Person Families | 14,711 (53.4%) | $82,368 |
| 3-Person Families | 5,462 (19.8%) | $98,807 |
| 4-Person Families | 4,684 (17.0%) | $122,941 |
| 5-Person Families | 1,725 (6.3%) | $109,122 |
| 6-Person Families | 636 (2.3%) | $103,810 |
| 7+ Person Families | 347 (1.3%) | $91,797 |
| Total | 27,565 (100.0%) | $94,779 |
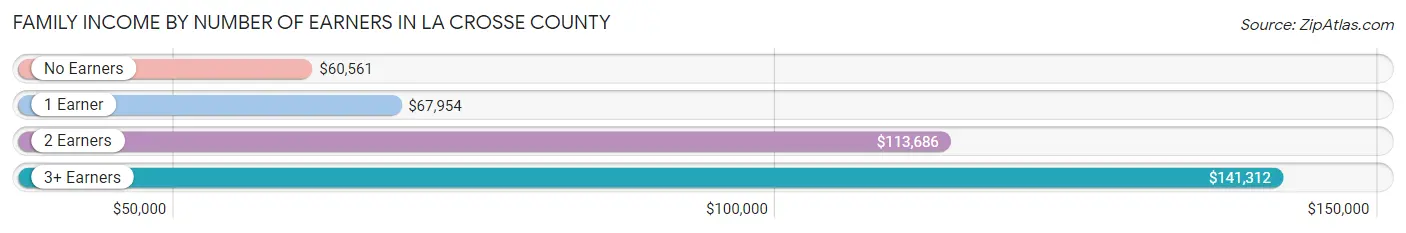
Family Income by Number of Earners in La Crosse County
The median family income in La Crosse County is $94,779, with families comprising 3+ earners (2,953) having the highest median family income of $141,312, while families with no earners (4,187) have the lowest median family income of $60,561, accounting for 10.7% and 15.2% of families, respectively.
| Number of Earners | # Families | Median Income |
| No Earners | 4,187 (15.2%) | $60,561 |
| 1 Earner | 7,300 (26.5%) | $67,954 |
| 2 Earners | 13,125 (47.6%) | $113,686 |
| 3+ Earners | 2,953 (10.7%) | $141,312 |
| Total | 27,565 (100.0%) | $94,779 |
Household Income in La Crosse County
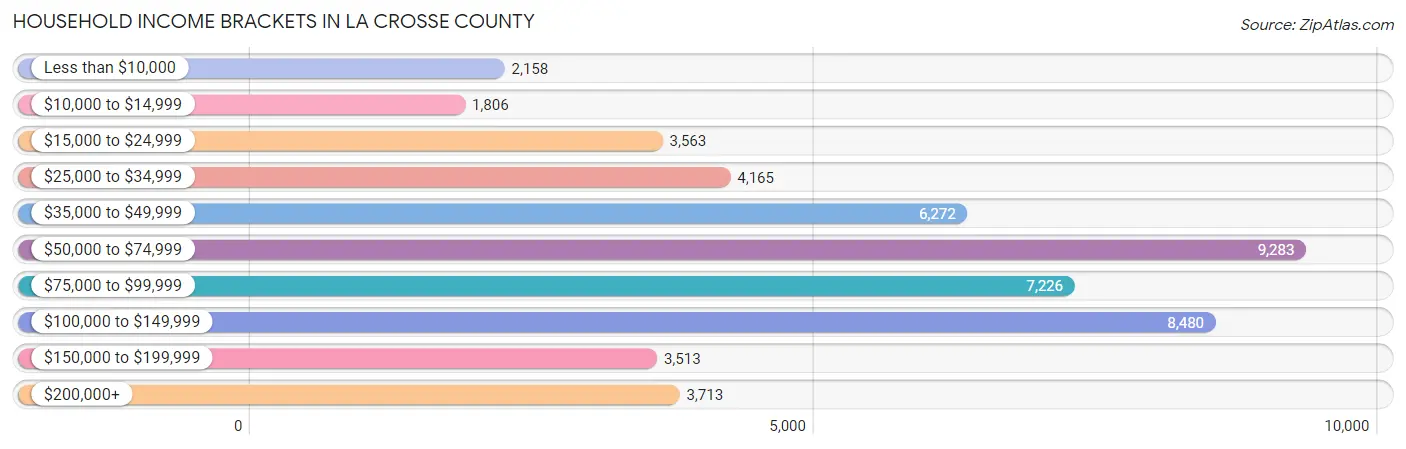
Household Income Brackets in La Crosse County
With 9,283 households falling in the category, the $50,000 to $74,999 income range is the most frequent in La Crosse County, accounting for 18.5% of all households. In contrast, only 1,806 households (3.6%) fall into the $10,000 to $14,999 income bracket, making it the least populous group.
| Income Bracket | # Households | % Households |
| Less than $10,000 | 2,158 | 4.3% |
| $10,000 to $14,999 | 1,806 | 3.6% |
| $15,000 to $24,999 | 3,563 | 7.1% |
| $25,000 to $34,999 | 4,165 | 8.3% |
| $35,000 to $49,999 | 6,272 | 12.5% |
| $50,000 to $74,999 | 9,283 | 18.5% |
| $75,000 to $99,999 | 7,226 | 14.4% |
| $100,000 to $149,999 | 8,480 | 16.9% |
| $150,000 to $199,999 | 3,513 | 7.0% |
| $200,000+ | 3,713 | 7.4% |
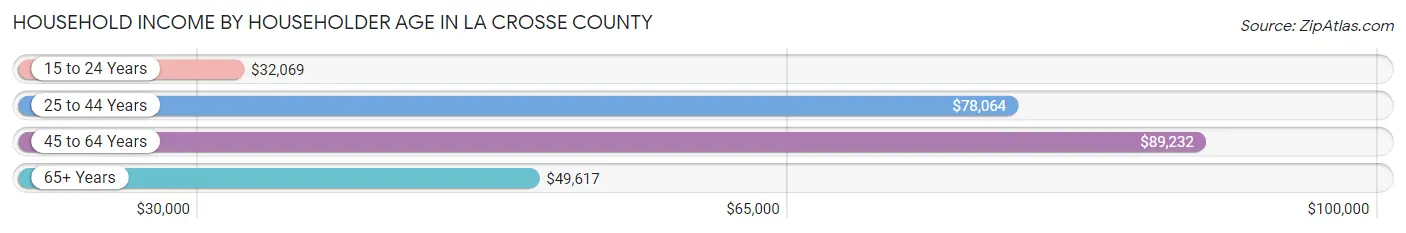
Household Income by Householder Age in La Crosse County
The median household income in La Crosse County is $68,731, with the highest median household income of $89,232 found in the 45 to 64 years age bracket for the primary householder. A total of 16,227 households (32.3%) fall into this category. Meanwhile, the 15 to 24 years age bracket for the primary householder has the lowest median household income of $32,069, with 4,951 households (9.9%) in this group.
| Income Bracket | # Households | Median Income |
| 15 to 24 Years | 4,951 (9.9%) | $32,069 |
| 25 to 44 Years | 15,903 (31.7%) | $78,064 |
| 45 to 64 Years | 16,227 (32.3%) | $89,232 |
| 65+ Years | 13,098 (26.1%) | $49,617 |
| Total | 50,179 (100.0%) | $68,731 |
Poverty in La Crosse County
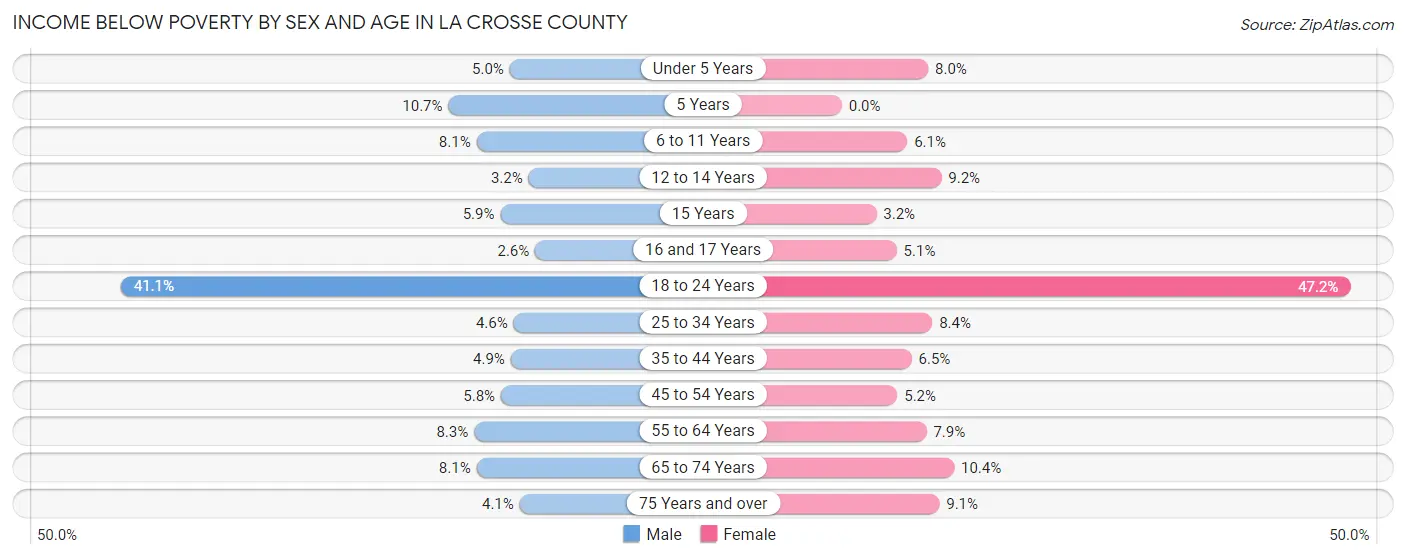
Income Below Poverty by Sex and Age in La Crosse County
With 10.4% poverty level for males and 13.1% for females among the residents of La Crosse County, 18 to 24 year old males and 18 to 24 year old females are the most vulnerable to poverty, with 2,914 males (41.1%) and 3,905 females (47.2%) in their respective age groups living below the poverty level.
| Age Bracket | Male | Female |
| Under 5 Years | 144 (5.0%) | 230 (8.0%) |
| 5 Years | 76 (10.7%) | 0 (0.0%) |
| 6 to 11 Years | 340 (8.1%) | 210 (6.1%) |
| 12 to 14 Years | 59 (3.2%) | 213 (9.2%) |
| 15 Years | 47 (5.9%) | 20 (3.2%) |
| 16 and 17 Years | 37 (2.6%) | 66 (5.1%) |
| 18 to 24 Years | 2,914 (41.1%) | 3,905 (47.2%) |
| 25 to 34 Years | 367 (4.6%) | 633 (8.4%) |
| 35 to 44 Years | 347 (4.9%) | 436 (6.5%) |
| 45 to 54 Years | 378 (5.8%) | 327 (5.1%) |
| 55 to 64 Years | 601 (8.3%) | 605 (7.9%) |
| 65 to 74 Years | 462 (8.1%) | 639 (10.4%) |
| 75 Years and over | 131 (4.1%) | 432 (9.0%) |
| Total | 5,903 (10.4%) | 7,716 (13.1%) |
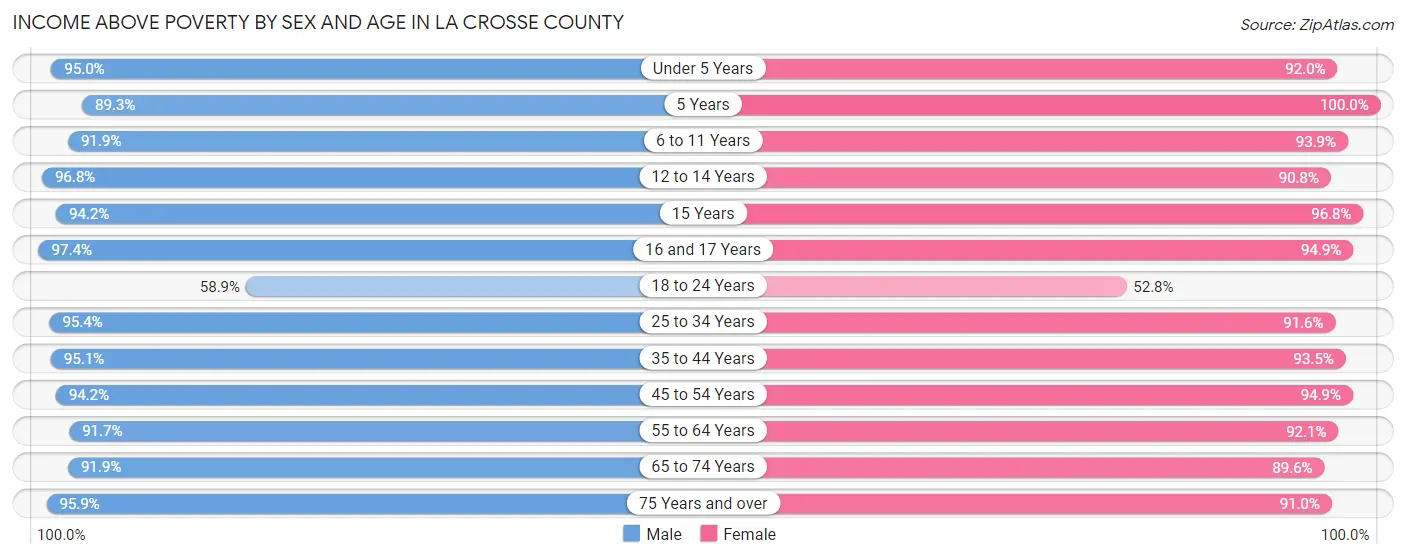
Income Above Poverty by Sex and Age in La Crosse County
According to the poverty statistics in La Crosse County, males aged 16 and 17 years and females aged 5 years are the age groups that are most secure financially, with 97.4% of males and 100.0% of females in these age groups living above the poverty line.
| Age Bracket | Male | Female |
| Under 5 Years | 2,746 (95.0%) | 2,643 (92.0%) |
| 5 Years | 636 (89.3%) | 815 (100.0%) |
| 6 to 11 Years | 3,876 (91.9%) | 3,249 (93.9%) |
| 12 to 14 Years | 1,767 (96.8%) | 2,092 (90.8%) |
| 15 Years | 757 (94.2%) | 603 (96.8%) |
| 16 and 17 Years | 1,376 (97.4%) | 1,231 (94.9%) |
| 18 to 24 Years | 4,182 (58.9%) | 4,372 (52.8%) |
| 25 to 34 Years | 7,582 (95.4%) | 6,910 (91.6%) |
| 35 to 44 Years | 6,752 (95.1%) | 6,297 (93.5%) |
| 45 to 54 Years | 6,153 (94.2%) | 6,018 (94.9%) |
| 55 to 64 Years | 6,650 (91.7%) | 7,090 (92.1%) |
| 65 to 74 Years | 5,267 (91.9%) | 5,492 (89.6%) |
| 75 Years and over | 3,096 (95.9%) | 4,344 (90.9%) |
| Total | 50,840 (89.6%) | 51,156 (86.9%) |
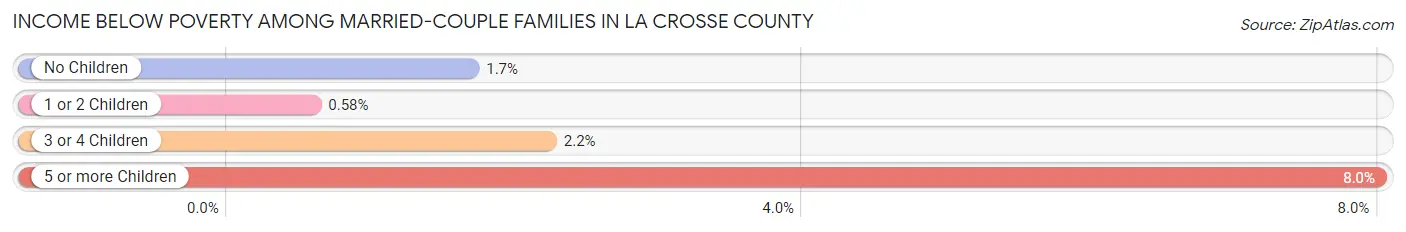
Income Below Poverty Among Married-Couple Families in La Crosse County
The poverty statistics for married-couple families in La Crosse County show that 1.5% or 316 of the total 21,728 families live below the poverty line. Families with 5 or more children have the highest poverty rate of 8.0%, comprising of 12 families. On the other hand, families with 1 or 2 children have the lowest poverty rate of 0.6%, which includes 36 families.
| Children | Above Poverty | Below Poverty |
| No Children | 13,087 (98.3%) | 223 (1.7%) |
| 1 or 2 Children | 6,208 (99.4%) | 36 (0.6%) |
| 3 or 4 Children | 1,979 (97.8%) | 45 (2.2%) |
| 5 or more Children | 138 (92.0%) | 12 (8.0%) |
| Total | 21,412 (98.6%) | 316 (1.5%) |
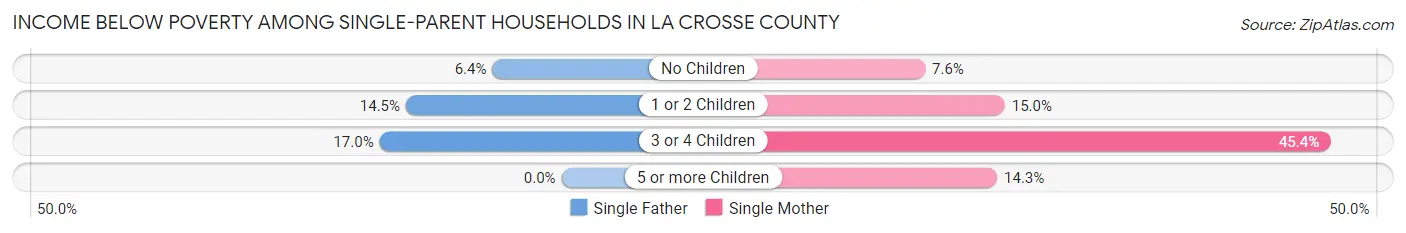
Income Below Poverty Among Single-Parent Households in La Crosse County
According to the poverty data in La Crosse County, 10.9% or 225 single-father households and 14.1% or 533 single-mother households are living below the poverty line. Among single-father households, those with 3 or 4 children have the highest poverty rate, with 20 households (17.0%) experiencing poverty. Likewise, among single-mother households, those with 3 or 4 children have the highest poverty rate, with 118 households (45.4%) falling below the poverty line.
| Children | Single Father | Single Mother |
| No Children | 60 (6.4%) | 115 (7.6%) |
| 1 or 2 Children | 145 (14.5%) | 297 (15.0%) |
| 3 or 4 Children | 20 (17.0%) | 118 (45.4%) |
| 5 or more Children | 0 (0.0%) | 3 (14.3%) |
| Total | 225 (10.9%) | 533 (14.1%) |
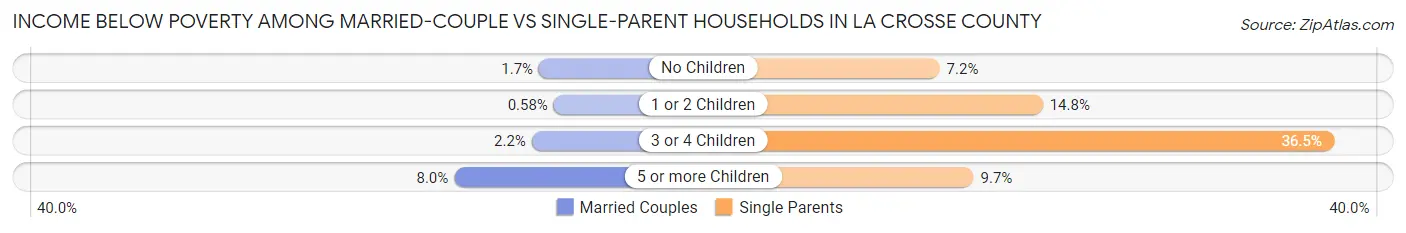
Income Below Poverty Among Married-Couple vs Single-Parent Households in La Crosse County
The poverty data for La Crosse County shows that 316 of the married-couple family households (1.5%) and 758 of the single-parent households (13.0%) are living below the poverty level. Within the married-couple family households, those with 5 or more children have the highest poverty rate, with 12 households (8.0%) falling below the poverty line. Among the single-parent households, those with 3 or 4 children have the highest poverty rate, with 138 household (36.5%) living below poverty.
| Children | Married-Couple Families | Single-Parent Households |
| No Children | 223 (1.7%) | 175 (7.1%) |
| 1 or 2 Children | 36 (0.6%) | 442 (14.8%) |
| 3 or 4 Children | 45 (2.2%) | 138 (36.5%) |
| 5 or more Children | 12 (8.0%) | 3 (9.7%) |
| Total | 316 (1.5%) | 758 (13.0%) |
Employment Characteristics in La Crosse County
Employment by Class of Employer in La Crosse County
Among the 62,724 employed individuals in La Crosse County, private company employees (42,078 | 67.1%), not-for-profit organizations (8,498 | 13.6%), and local government employees (3,949 | 6.3%) make up the most common classes of employment.
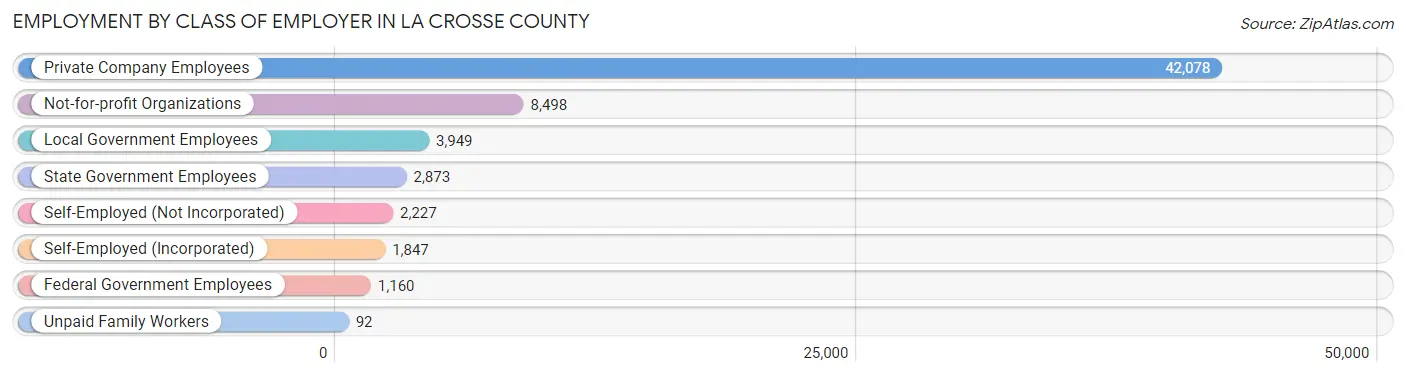
| Employer Class | # Employees | % Employees |
| Private Company Employees | 42,078 | 67.1% |
| Self-Employed (Incorporated) | 1,847 | 2.9% |
| Self-Employed (Not Incorporated) | 2,227 | 3.5% |
| Not-for-profit Organizations | 8,498 | 13.6% |
| Local Government Employees | 3,949 | 6.3% |
| State Government Employees | 2,873 | 4.6% |
| Federal Government Employees | 1,160 | 1.8% |
| Unpaid Family Workers | 92 | 0.2% |
| Total | 62,724 | 100.0% |
Employment Status by Age in La Crosse County
According to the labor force statistics for La Crosse County, out of the total population over 16 years of age (99,468), 66.2% or 65,848 individuals are in the labor force, with 3.1% or 2,041 of them unemployed. The age group with the highest labor force participation rate is 35 to 44 years, with 90.0% or 12,550 individuals in the labor force. Within the labor force, the 16 to 19 years age range has the highest percentage of unemployed individuals, with 8.2% or 314 of them being unemployed.
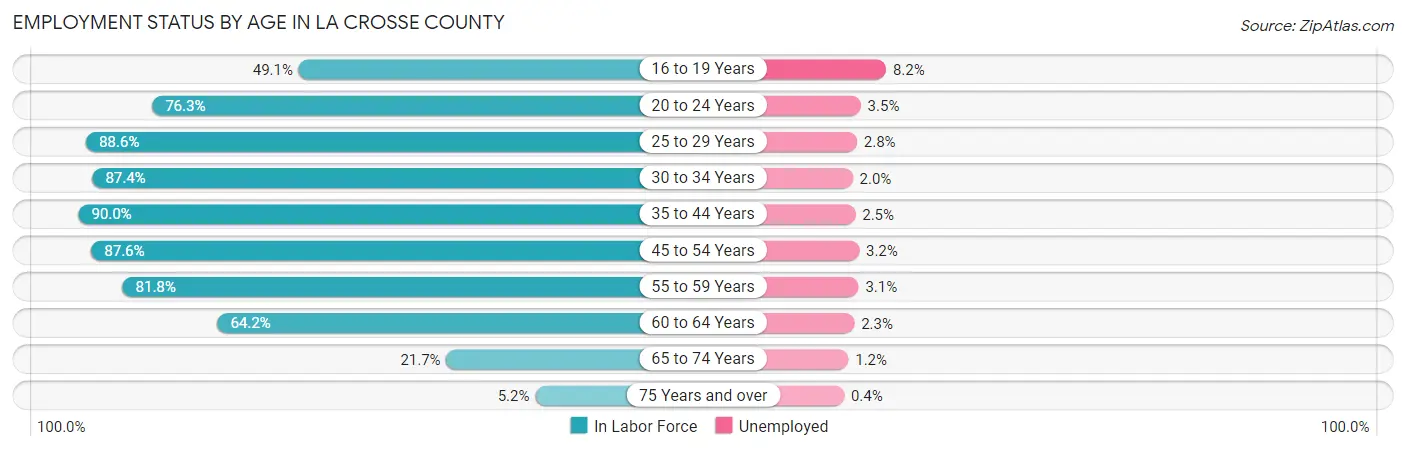
| Age Bracket | In Labor Force | Unemployed |
| 16 to 19 Years | 3,826 (49.1%) | 314 (8.2%) |
| 20 to 24 Years | 10,438 (76.3%) | 365 (3.5%) |
| 25 to 29 Years | 7,357 (88.6%) | 206 (2.8%) |
| 30 to 34 Years | 6,385 (87.4%) | 128 (2.0%) |
| 35 to 44 Years | 12,550 (90.0%) | 314 (2.5%) |
| 45 to 54 Years | 11,316 (87.6%) | 362 (3.2%) |
| 55 to 59 Years | 6,071 (81.8%) | 188 (3.1%) |
| 60 to 64 Years | 4,853 (64.2%) | 112 (2.3%) |
| 65 to 74 Years | 2,604 (21.7%) | 31 (1.2%) |
| 75 Years and over | 444 (5.2%) | 2 (0.4%) |
| Total | 65,848 (66.2%) | 2,041 (3.1%) |
Employment Status by Educational Attainment in La Crosse County
According to labor force statistics for La Crosse County, 84.5% of individuals (48,548) out of the total population between 25 and 64 years of age (57,453) are in the labor force, with 2.7% or 1,311 of them being unemployed. The group with the highest labor force participation rate are those with the educational attainment of bachelor's degree or higher, with 90.2% or 19,554 individuals in the labor force. Within the labor force, individuals with less than high school education have the highest percentage of unemployment, with 10.2% or 86 of them being unemployed.
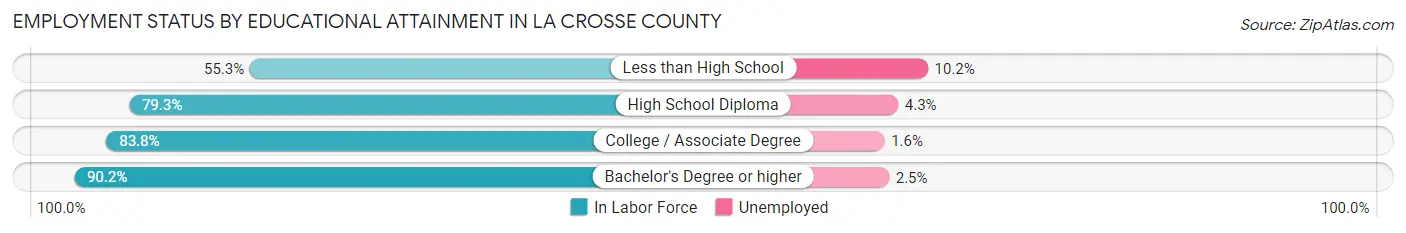
| Educational Attainment | In Labor Force | Unemployed |
| Less than High School | 839 (55.3%) | 155 (10.2%) |
| High School Diploma | 10,077 (79.3%) | 546 (4.3%) |
| College / Associate Degree | 18,059 (83.8%) | 345 (1.6%) |
| Bachelor's Degree or higher | 19,554 (90.2%) | 542 (2.5%) |
| Total | 48,548 (84.5%) | 1,551 (2.7%) |
Employment Occupations by Sex in La Crosse County
Management, Business, Science and Arts Occupations
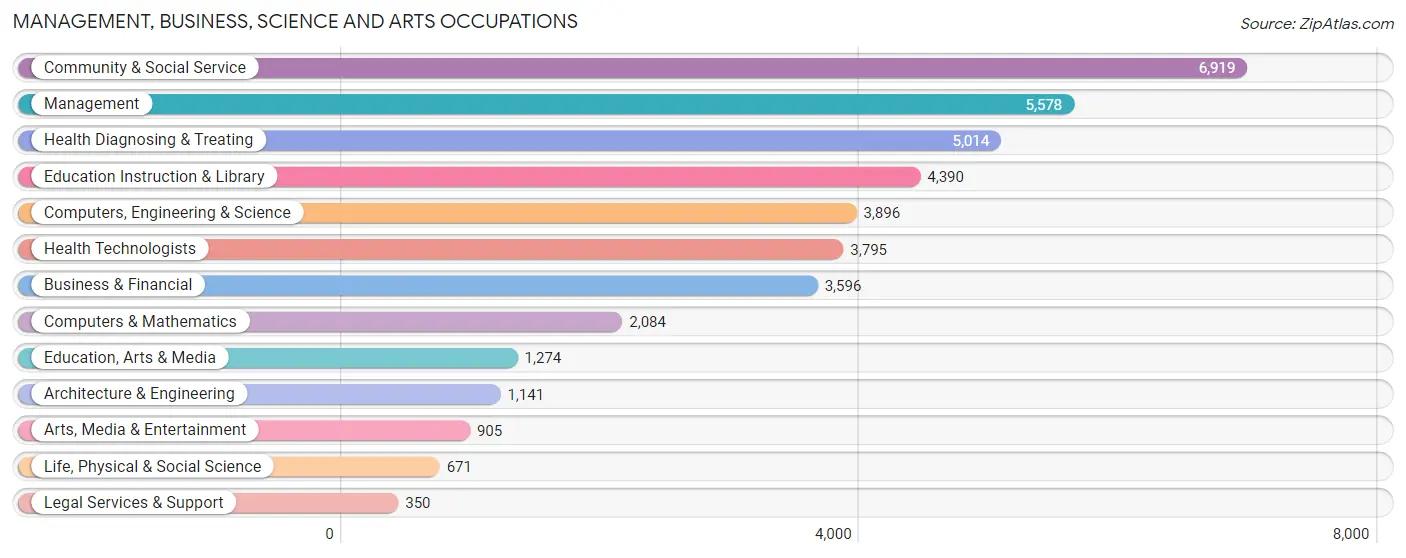
The most common Management, Business, Science and Arts occupations in La Crosse County are Community & Social Service (6,919 | 10.9%), Management (5,578 | 8.8%), Health Diagnosing & Treating (5,014 | 7.9%), Education Instruction & Library (4,390 | 6.9%), and Computers, Engineering & Science (3,896 | 6.1%).
Management, Business, Science and Arts Occupations by Sex
Within the Management, Business, Science and Arts occupations in La Crosse County, the most male-oriented occupations are Architecture & Engineering (84.4%), Computers & Mathematics (81.9%), and Computers, Engineering & Science (78.2%), while the most female-oriented occupations are Education, Arts & Media (78.8%), Health Diagnosing & Treating (74.8%), and Health Technologists (74.6%).
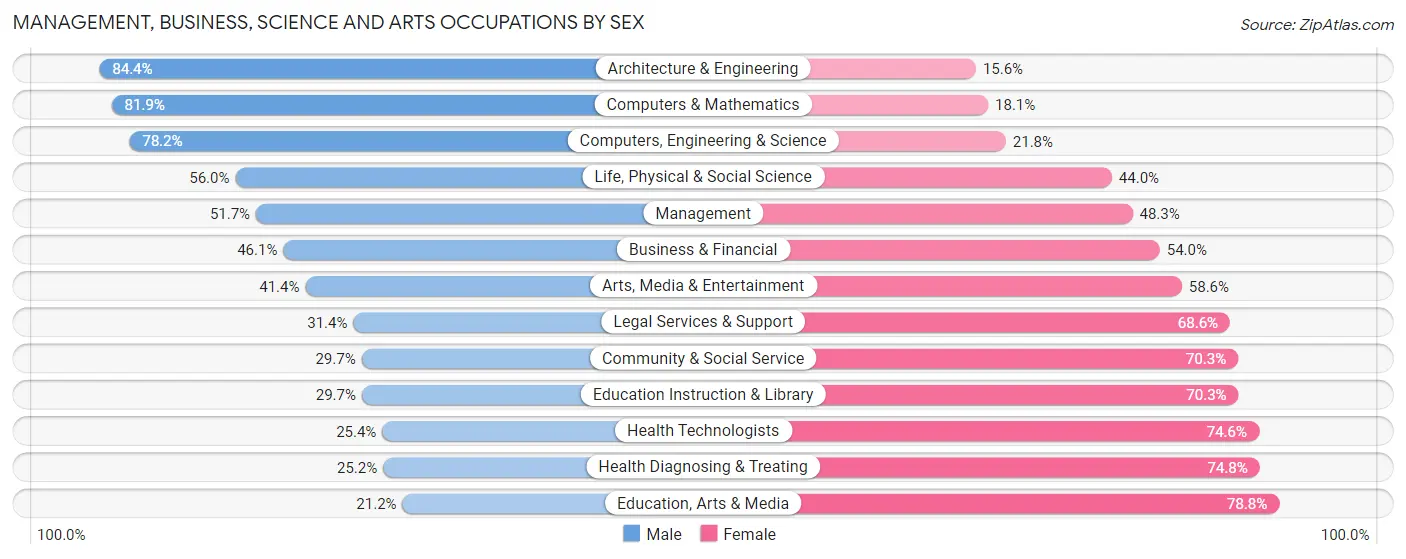
| Occupation | Male | Female |
| Management | 2,886 (51.7%) | 2,692 (48.3%) |
| Business & Financial | 1,656 (46.1%) | 1,940 (53.9%) |
| Computers, Engineering & Science | 3,045 (78.2%) | 851 (21.8%) |
| Computers & Mathematics | 1,706 (81.9%) | 378 (18.1%) |
| Architecture & Engineering | 963 (84.4%) | 178 (15.6%) |
| Life, Physical & Social Science | 376 (56.0%) | 295 (44.0%) |
| Community & Social Service | 2,057 (29.7%) | 4,862 (70.3%) |
| Education, Arts & Media | 270 (21.2%) | 1,004 (78.8%) |
| Legal Services & Support | 110 (31.4%) | 240 (68.6%) |
| Education Instruction & Library | 1,302 (29.7%) | 3,088 (70.3%) |
| Arts, Media & Entertainment | 375 (41.4%) | 530 (58.6%) |
| Health Diagnosing & Treating | 1,265 (25.2%) | 3,749 (74.8%) |
| Health Technologists | 964 (25.4%) | 2,831 (74.6%) |
| Total (Category) | 10,909 (43.6%) | 14,094 (56.4%) |
| Total (Overall) | 31,921 (50.1%) | 31,761 (49.9%) |
Services Occupations
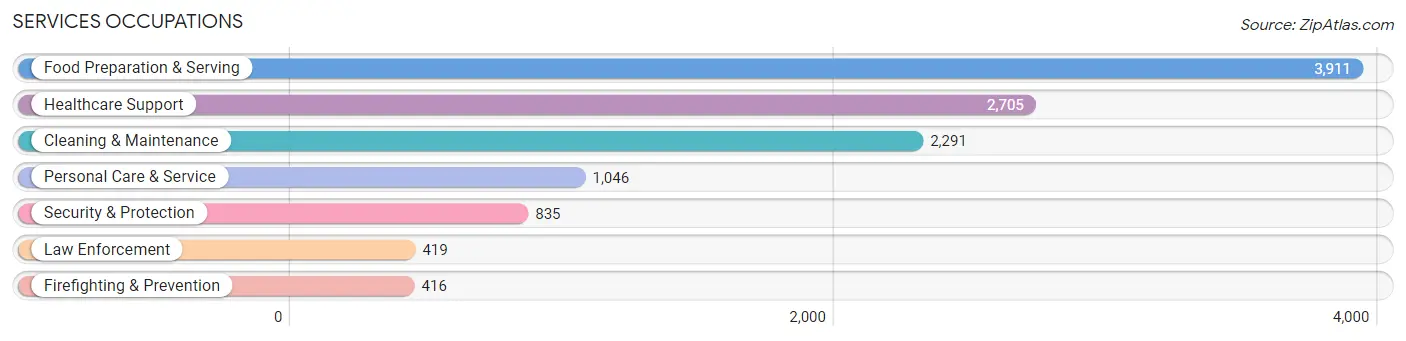
The most common Services occupations in La Crosse County are Food Preparation & Serving (3,911 | 6.1%), Healthcare Support (2,705 | 4.3%), Cleaning & Maintenance (2,291 | 3.6%), Personal Care & Service (1,046 | 1.6%), and Security & Protection (835 | 1.3%).
Services Occupations by Sex
Within the Services occupations in La Crosse County, the most male-oriented occupations are Law Enforcement (87.1%), Cleaning & Maintenance (68.0%), and Security & Protection (66.3%), while the most female-oriented occupations are Healthcare Support (91.2%), Personal Care & Service (75.6%), and Food Preparation & Serving (56.0%).
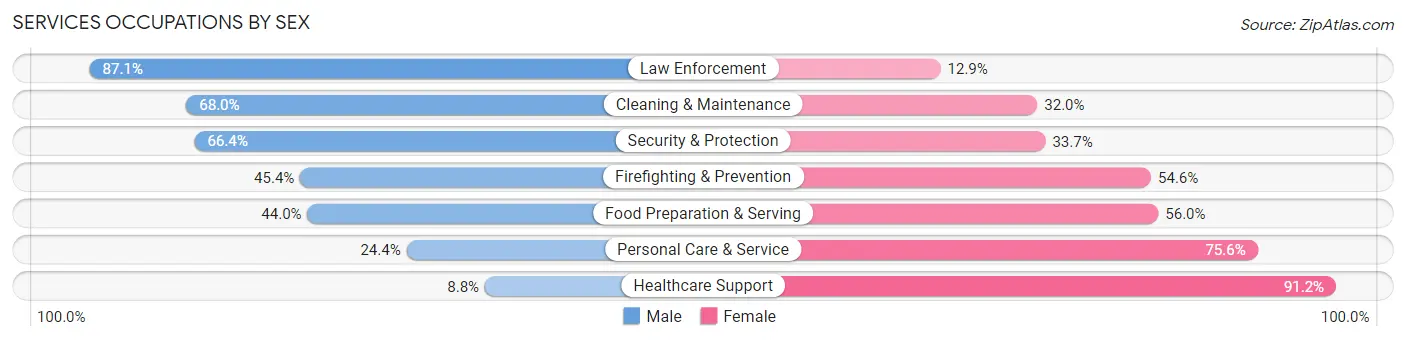
| Occupation | Male | Female |
| Healthcare Support | 239 (8.8%) | 2,466 (91.2%) |
| Security & Protection | 554 (66.3%) | 281 (33.7%) |
| Firefighting & Prevention | 189 (45.4%) | 227 (54.6%) |
| Law Enforcement | 365 (87.1%) | 54 (12.9%) |
| Food Preparation & Serving | 1,721 (44.0%) | 2,190 (56.0%) |
| Cleaning & Maintenance | 1,557 (68.0%) | 734 (32.0%) |
| Personal Care & Service | 255 (24.4%) | 791 (75.6%) |
| Total (Category) | 4,326 (40.1%) | 6,462 (59.9%) |
| Total (Overall) | 31,921 (50.1%) | 31,761 (49.9%) |
Sales and Office Occupations
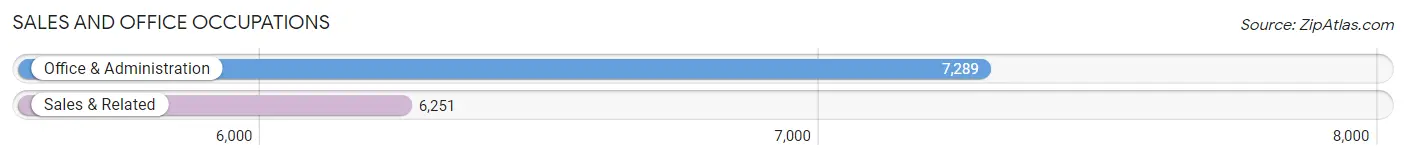
The most common Sales and Office occupations in La Crosse County are Office & Administration (7,289 | 11.5%), and Sales & Related (6,251 | 9.8%).
Sales and Office Occupations by Sex
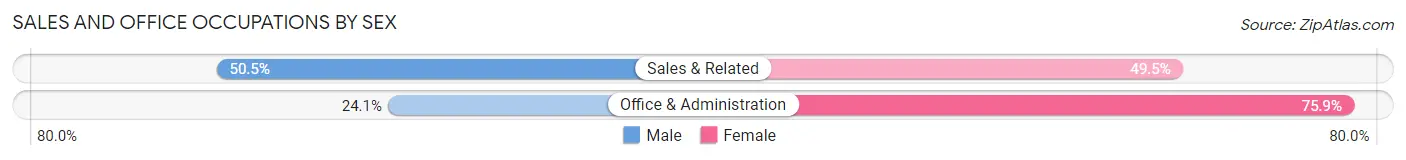
| Occupation | Male | Female |
| Sales & Related | 3,155 (50.5%) | 3,096 (49.5%) |
| Office & Administration | 1,758 (24.1%) | 5,531 (75.9%) |
| Total (Category) | 4,913 (36.3%) | 8,627 (63.7%) |
| Total (Overall) | 31,921 (50.1%) | 31,761 (49.9%) |
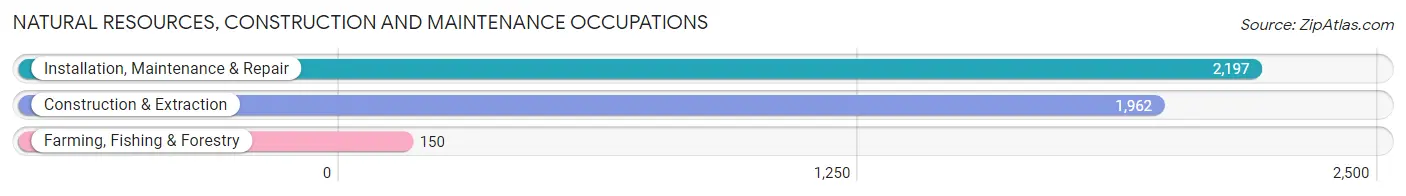
Natural Resources, Construction and Maintenance Occupations
The most common Natural Resources, Construction and Maintenance occupations in La Crosse County are Installation, Maintenance & Repair (2,197 | 3.5%), Construction & Extraction (1,962 | 3.1%), and Farming, Fishing & Forestry (150 | 0.2%).
Natural Resources, Construction and Maintenance Occupations by Sex
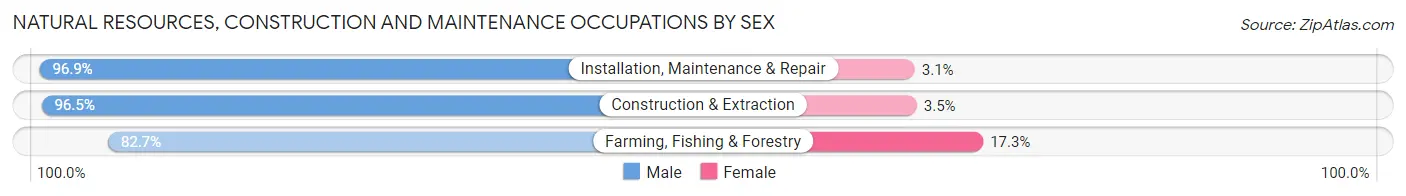
| Occupation | Male | Female |
| Farming, Fishing & Forestry | 124 (82.7%) | 26 (17.3%) |
| Construction & Extraction | 1,893 (96.5%) | 69 (3.5%) |
| Installation, Maintenance & Repair | 2,129 (96.9%) | 68 (3.1%) |
| Total (Category) | 4,146 (96.2%) | 163 (3.8%) |
| Total (Overall) | 31,921 (50.1%) | 31,761 (49.9%) |
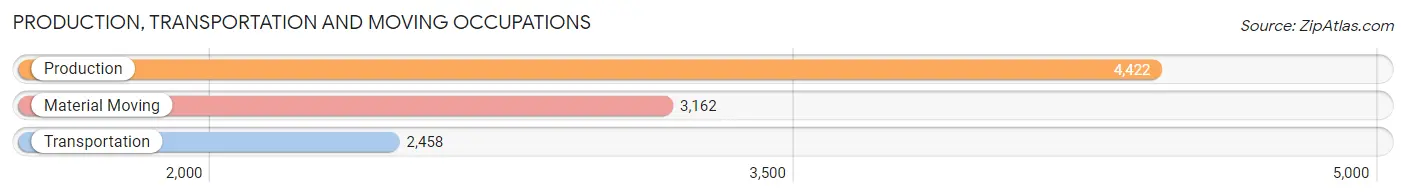
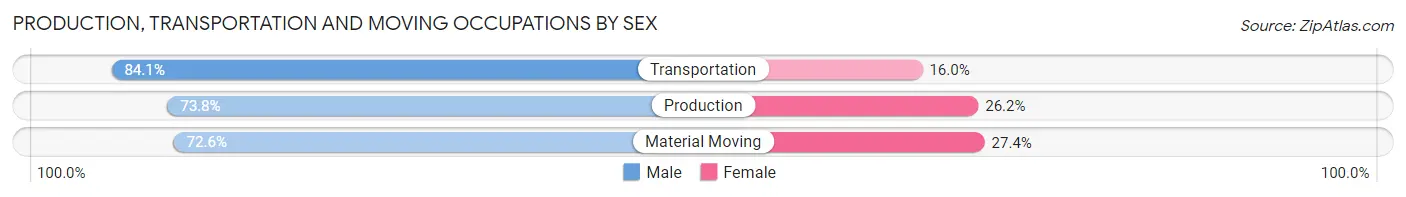
Production, Transportation and Moving Occupations
The most common Production, Transportation and Moving occupations in La Crosse County are Production (4,422 | 6.9%), Material Moving (3,162 | 5.0%), and Transportation (2,458 | 3.9%).
Production, Transportation and Moving Occupations by Sex
| Occupation | Male | Female |
| Production | 3,264 (73.8%) | 1,158 (26.2%) |
| Transportation | 2,066 (84.1%) | 392 (16.0%) |
| Material Moving | 2,297 (72.6%) | 865 (27.4%) |
| Total (Category) | 7,627 (75.9%) | 2,415 (24.0%) |
| Total (Overall) | 31,921 (50.1%) | 31,761 (49.9%) |
Employment Industries by Sex in La Crosse County
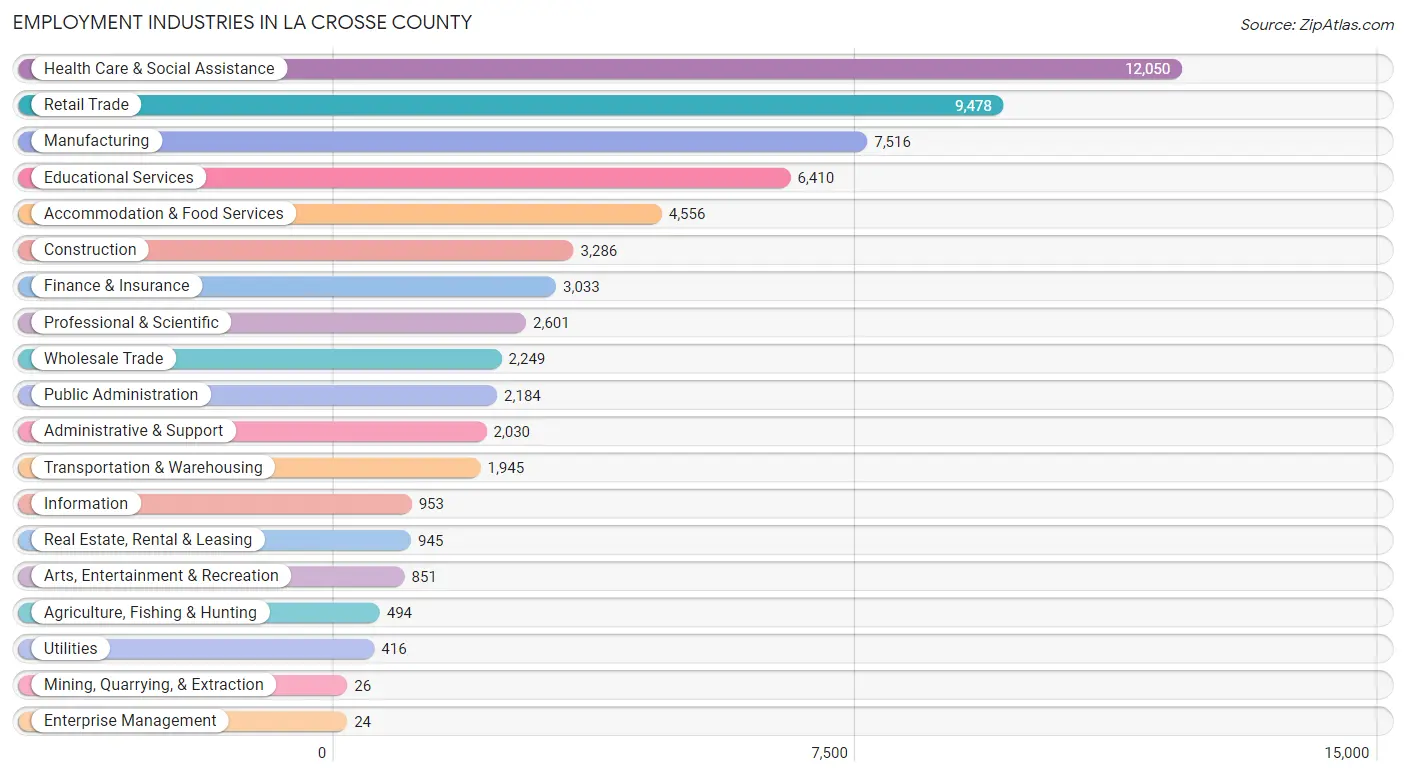
Employment Industries in La Crosse County
The major employment industries in La Crosse County include Health Care & Social Assistance (12,050 | 18.9%), Retail Trade (9,478 | 14.9%), Manufacturing (7,516 | 11.8%), Educational Services (6,410 | 10.1%), and Accommodation & Food Services (4,556 | 7.1%).
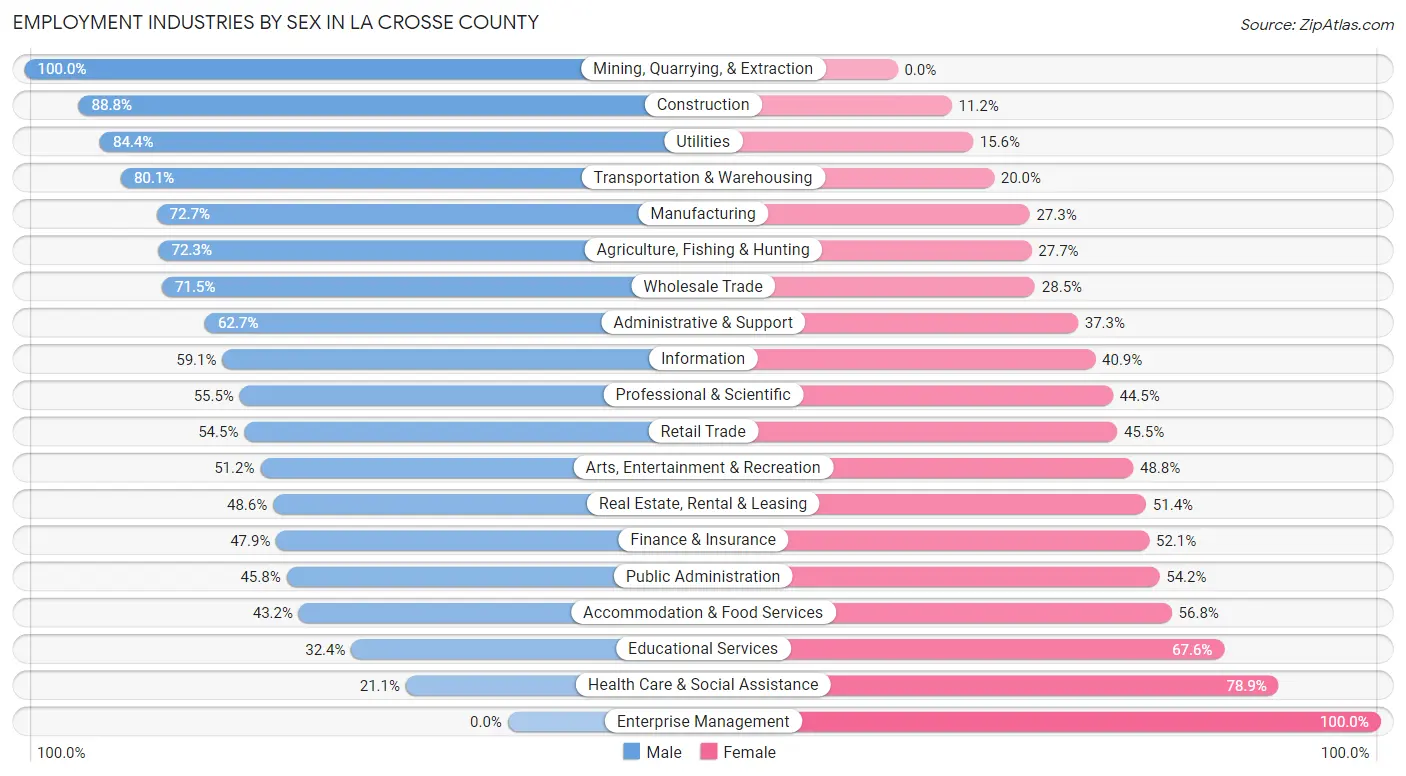
Employment Industries by Sex in La Crosse County
The La Crosse County industries that see more men than women are Mining, Quarrying, & Extraction (100.0%), Construction (88.8%), and Utilities (84.4%), whereas the industries that tend to have a higher number of women are Enterprise Management (100.0%), Health Care & Social Assistance (78.9%), and Educational Services (67.6%).
| Industry | Male | Female |
| Agriculture, Fishing & Hunting | 357 (72.3%) | 137 (27.7%) |
| Mining, Quarrying, & Extraction | 26 (100.0%) | 0 (0.0%) |
| Construction | 2,918 (88.8%) | 368 (11.2%) |
| Manufacturing | 5,461 (72.7%) | 2,055 (27.3%) |
| Wholesale Trade | 1,609 (71.5%) | 640 (28.5%) |
| Retail Trade | 5,169 (54.5%) | 4,309 (45.5%) |
| Transportation & Warehousing | 1,557 (80.0%) | 388 (20.0%) |
| Utilities | 351 (84.4%) | 65 (15.6%) |
| Information | 563 (59.1%) | 390 (40.9%) |
| Finance & Insurance | 1,453 (47.9%) | 1,580 (52.1%) |
| Real Estate, Rental & Leasing | 459 (48.6%) | 486 (51.4%) |
| Professional & Scientific | 1,443 (55.5%) | 1,158 (44.5%) |
| Enterprise Management | 0 (0.0%) | 24 (100.0%) |
| Administrative & Support | 1,272 (62.7%) | 758 (37.3%) |
| Educational Services | 2,075 (32.4%) | 4,335 (67.6%) |
| Health Care & Social Assistance | 2,542 (21.1%) | 9,508 (78.9%) |
| Arts, Entertainment & Recreation | 436 (51.2%) | 415 (48.8%) |
| Accommodation & Food Services | 1,970 (43.2%) | 2,586 (56.8%) |
| Public Administration | 1,000 (45.8%) | 1,184 (54.2%) |
| Total | 31,921 (50.1%) | 31,761 (49.9%) |
Education in La Crosse County
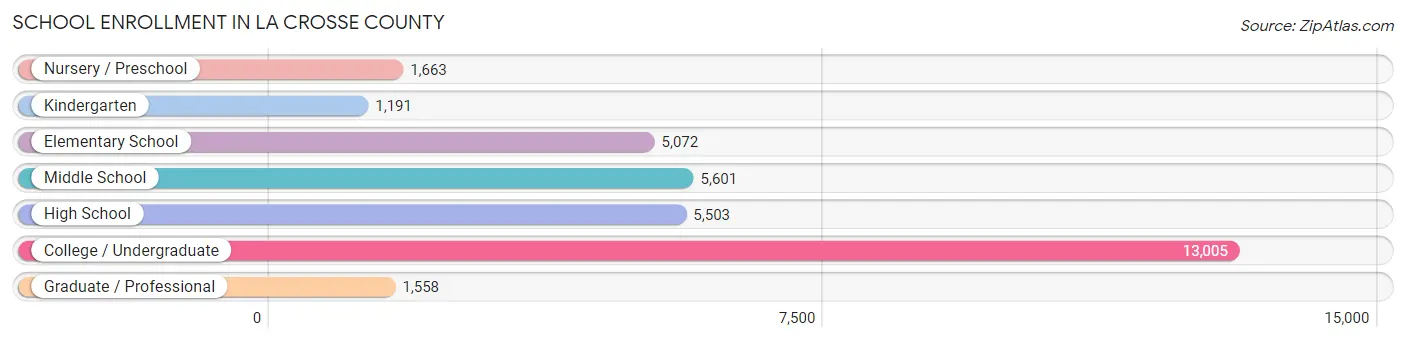
School Enrollment in La Crosse County
The most common levels of schooling among the 33,593 students in La Crosse County are college / undergraduate (13,005 | 38.7%), middle school (5,601 | 16.7%), and high school (5,503 | 16.4%).
| School Level | # Students | % Students |
| Nursery / Preschool | 1,663 | 5.0% |
| Kindergarten | 1,191 | 3.5% |
| Elementary School | 5,072 | 15.1% |
| Middle School | 5,601 | 16.7% |
| High School | 5,503 | 16.4% |
| College / Undergraduate | 13,005 | 38.7% |
| Graduate / Professional | 1,558 | 4.6% |
| Total | 33,593 | 100.0% |
School Enrollment by Age by Funding Source in La Crosse County
Out of a total of 33,593 students who are enrolled in schools in La Crosse County, 4,233 (12.6%) attend a private institution, while the remaining 29,360 (87.4%) are enrolled in public schools. The age group of 3 to 4 year olds has the highest likelihood of being enrolled in private schools, with 243 (24.5% in the age bracket) enrolled. Conversely, the age group of 18 to 19 year olds has the lowest likelihood of being enrolled in a private school, with 4,165 (92.1% in the age bracket) attending a public institution.
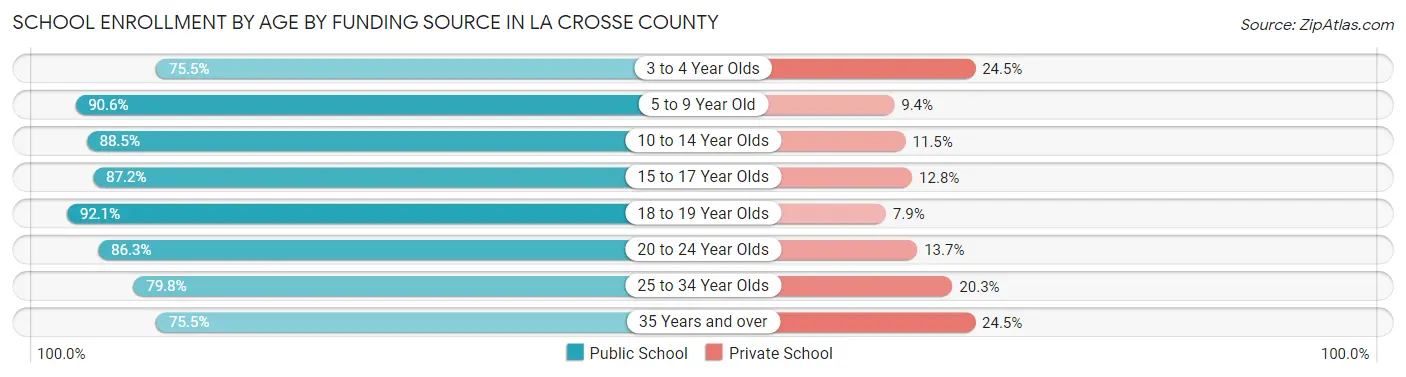
| Age Bracket | Public School | Private School |
| 3 to 4 Year Olds | 749 (75.5%) | 243 (24.5%) |
| 5 to 9 Year Old | 5,744 (90.6%) | 598 (9.4%) |
| 10 to 14 Year Olds | 6,005 (88.5%) | 783 (11.5%) |
| 15 to 17 Year Olds | 3,520 (87.2%) | 515 (12.8%) |
| 18 to 19 Year Olds | 4,165 (92.1%) | 356 (7.9%) |
| 20 to 24 Year Olds | 6,963 (86.3%) | 1,105 (13.7%) |
| 25 to 34 Year Olds | 1,355 (79.7%) | 344 (20.3%) |
| 35 Years and over | 867 (75.5%) | 281 (24.5%) |
| Total | 29,360 (87.4%) | 4,233 (12.6%) |
Educational Attainment by Field of Study in La Crosse County
Business (5,206 | 16.9%), education (4,843 | 15.7%), science & technology (3,745 | 12.2%), bio, nature & agricultural (2,815 | 9.1%), and social sciences (2,000 | 6.5%) are the most common fields of study among 30,771 individuals in La Crosse County who have obtained a bachelor's degree or higher.

| Field of Study | # Graduates | % Graduates |
| Computers & Mathematics | 1,471 | 4.8% |
| Bio, Nature & Agricultural | 2,815 | 9.1% |
| Physical & Health Sciences | 1,430 | 4.6% |
| Psychology | 1,490 | 4.8% |
| Social Sciences | 2,000 | 6.5% |
| Engineering | 1,450 | 4.7% |
| Multidisciplinary Studies | 228 | 0.7% |
| Science & Technology | 3,745 | 12.2% |
| Business | 5,206 | 16.9% |
| Education | 4,843 | 15.7% |
| Literature & Languages | 1,286 | 4.2% |
| Liberal Arts & History | 911 | 3.0% |
| Visual & Performing Arts | 914 | 3.0% |
| Communications | 1,077 | 3.5% |
| Arts & Humanities | 1,905 | 6.2% |
| Total | 30,771 | 100.0% |
Transportation & Commute in La Crosse County
Vehicle Availability by Sex in La Crosse County
The most prevalent vehicle ownership categories in La Crosse County are males with 2 vehicles (14,668, accounting for 47.3%) and females with 2 vehicles (14,040, making up 48.5%).
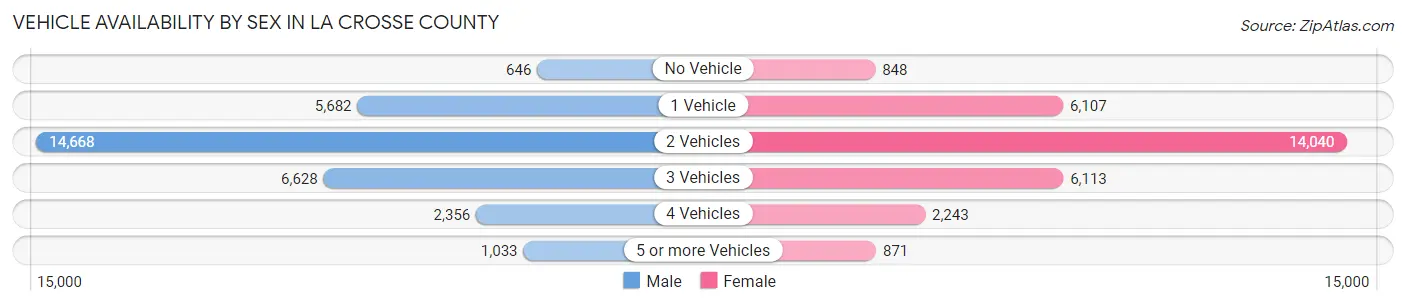
| Vehicles Available | Male | Female |
| No Vehicle | 646 (2.1%) | 848 (2.8%) |
| 1 Vehicle | 5,682 (18.3%) | 6,107 (20.2%) |
| 2 Vehicles | 14,668 (47.3%) | 14,040 (46.5%) |
| 3 Vehicles | 6,628 (21.4%) | 6,113 (20.2%) |
| 4 Vehicles | 2,356 (7.6%) | 2,243 (7.4%) |
| 5 or more Vehicles | 1,033 (3.3%) | 871 (2.9%) |
| Total | 31,013 (100.0%) | 30,222 (100.0%) |
Commute Time in La Crosse County
The most frequently occuring commute durations in La Crosse County are 15 to 19 minutes (11,347 commuters, 19.8%), 10 to 14 minutes (11,273 commuters, 19.7%), and 5 to 9 minutes (10,330 commuters, 18.0%).
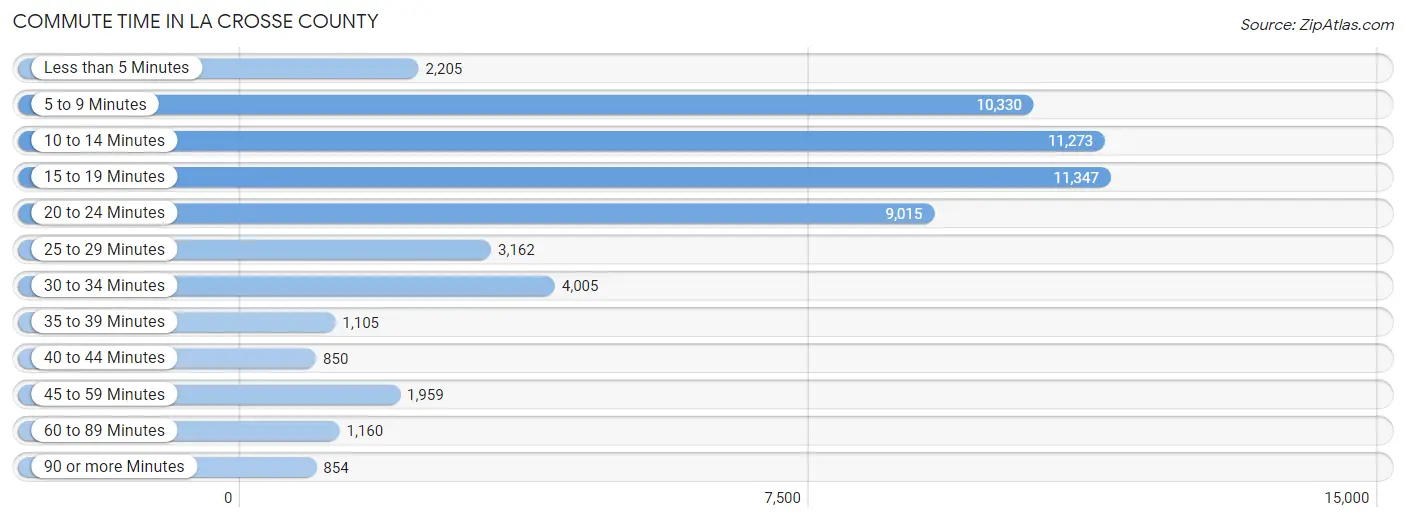
| Commute Time | # Commuters | % Commuters |
| Less than 5 Minutes | 2,205 | 3.8% |
| 5 to 9 Minutes | 10,330 | 18.0% |
| 10 to 14 Minutes | 11,273 | 19.7% |
| 15 to 19 Minutes | 11,347 | 19.8% |
| 20 to 24 Minutes | 9,015 | 15.7% |
| 25 to 29 Minutes | 3,162 | 5.5% |
| 30 to 34 Minutes | 4,005 | 7.0% |
| 35 to 39 Minutes | 1,105 | 1.9% |
| 40 to 44 Minutes | 850 | 1.5% |
| 45 to 59 Minutes | 1,959 | 3.4% |
| 60 to 89 Minutes | 1,160 | 2.0% |
| 90 or more Minutes | 854 | 1.5% |
Commute Time by Sex in La Crosse County
The most common commute times in La Crosse County are 10 to 14 minutes (5,743 commuters, 19.5%) for males and 15 to 19 minutes (5,787 commuters, 20.8%) for females.

| Commute Time | Male | Female |
| Less than 5 Minutes | 1,324 (4.5%) | 881 (3.2%) |
| 5 to 9 Minutes | 4,934 (16.8%) | 5,396 (19.4%) |
| 10 to 14 Minutes | 5,743 (19.5%) | 5,530 (19.8%) |
| 15 to 19 Minutes | 5,560 (18.9%) | 5,787 (20.8%) |
| 20 to 24 Minutes | 4,731 (16.1%) | 4,284 (15.4%) |
| 25 to 29 Minutes | 1,618 (5.5%) | 1,544 (5.5%) |
| 30 to 34 Minutes | 2,039 (6.9%) | 1,966 (7.0%) |
| 35 to 39 Minutes | 530 (1.8%) | 575 (2.1%) |
| 40 to 44 Minutes | 439 (1.5%) | 411 (1.5%) |
| 45 to 59 Minutes | 1,229 (4.2%) | 730 (2.6%) |
| 60 to 89 Minutes | 658 (2.2%) | 502 (1.8%) |
| 90 or more Minutes | 579 (2.0%) | 275 (1.0%) |
Time of Departure to Work by Sex in La Crosse County
The most frequent times of departure to work in La Crosse County are 7:00 AM to 7:29 AM (4,209, 14.3%) for males and 7:30 AM to 7:59 AM (5,021, 18.0%) for females.

| Time of Departure | Male | Female |
| 12:00 AM to 4:59 AM | 1,970 (6.7%) | 1,078 (3.9%) |
| 5:00 AM to 5:29 AM | 1,228 (4.2%) | 687 (2.5%) |
| 5:30 AM to 5:59 AM | 2,071 (7.0%) | 1,404 (5.0%) |
| 6:00 AM to 6:29 AM | 2,334 (7.9%) | 1,767 (6.3%) |
| 6:30 AM to 6:59 AM | 3,784 (12.9%) | 2,628 (9.4%) |
| 7:00 AM to 7:29 AM | 4,209 (14.3%) | 4,925 (17.7%) |
| 7:30 AM to 7:59 AM | 3,691 (12.6%) | 5,021 (18.0%) |
| 8:00 AM to 8:29 AM | 1,801 (6.1%) | 2,380 (8.5%) |
| 8:30 AM to 8:59 AM | 881 (3.0%) | 855 (3.1%) |
| 9:00 AM to 9:59 AM | 1,288 (4.4%) | 1,011 (3.6%) |
| 10:00 AM to 10:59 AM | 625 (2.1%) | 919 (3.3%) |
| 11:00 AM to 11:59 AM | 259 (0.9%) | 563 (2.0%) |
| 12:00 PM to 3:59 PM | 3,082 (10.5%) | 2,768 (9.9%) |
| 4:00 PM to 11:59 PM | 2,161 (7.3%) | 1,875 (6.7%) |
| Total | 29,384 (100.0%) | 27,881 (100.0%) |
Housing Occupancy in La Crosse County
Occupancy by Ownership in La Crosse County
Of the total 50,179 dwellings in La Crosse County, owner-occupied units account for 31,198 (62.2%), while renter-occupied units make up 18,981 (37.8%).
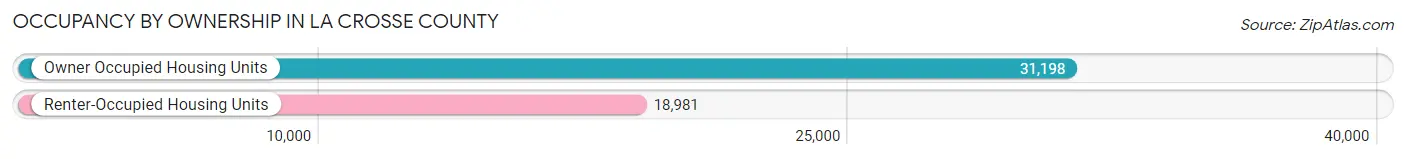
| Occupancy | # Housing Units | % Housing Units |
| Owner Occupied Housing Units | 31,198 | 62.2% |
| Renter-Occupied Housing Units | 18,981 | 37.8% |
| Total Occupied Housing Units | 50,179 | 100.0% |
Occupancy by Household Size in La Crosse County
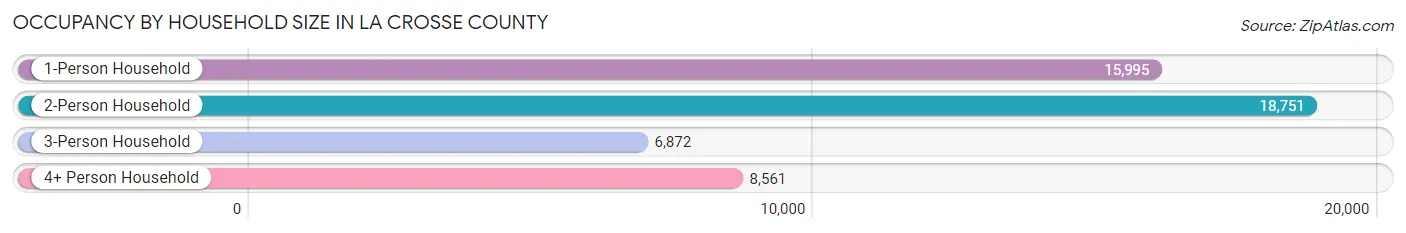
| Household Size | # Housing Units | % Housing Units |
| 1-Person Household | 15,995 | 31.9% |
| 2-Person Household | 18,751 | 37.4% |
| 3-Person Household | 6,872 | 13.7% |
| 4+ Person Household | 8,561 | 17.1% |
| Total Housing Units | 50,179 | 100.0% |
Occupancy by Ownership by Household Size in La Crosse County
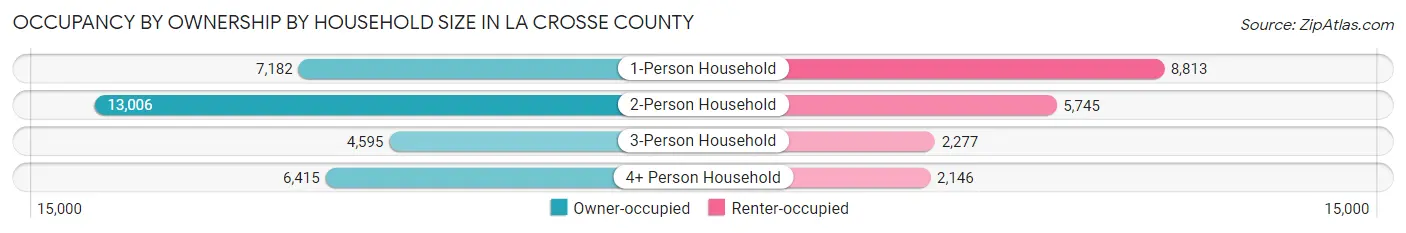
| Household Size | Owner-occupied | Renter-occupied |
| 1-Person Household | 7,182 (44.9%) | 8,813 (55.1%) |
| 2-Person Household | 13,006 (69.4%) | 5,745 (30.6%) |
| 3-Person Household | 4,595 (66.9%) | 2,277 (33.1%) |
| 4+ Person Household | 6,415 (74.9%) | 2,146 (25.1%) |
| Total Housing Units | 31,198 (62.2%) | 18,981 (37.8%) |
Occupancy by Educational Attainment in La Crosse County
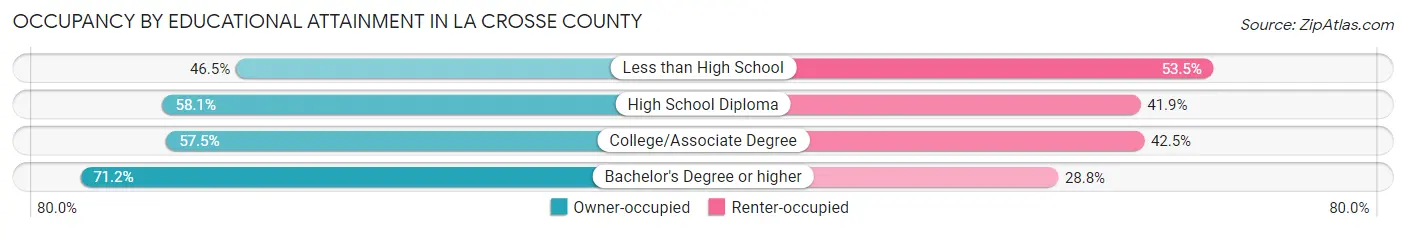
| Household Size | Owner-occupied | Renter-occupied |
| Less than High School | 738 (46.5%) | 850 (53.5%) |
| High School Diploma | 6,434 (58.1%) | 4,638 (41.9%) |
| College/Associate Degree | 11,284 (57.5%) | 8,331 (42.5%) |
| Bachelor's Degree or higher | 12,742 (71.2%) | 5,162 (28.8%) |
Occupancy by Age of Householder in La Crosse County

| Age Bracket | # Households | % Households |
| Under 35 Years | 12,766 | 25.4% |
| 35 to 44 Years | 8,088 | 16.1% |
| 45 to 54 Years | 7,271 | 14.5% |
| 55 to 64 Years | 8,956 | 17.8% |
| 65 to 74 Years | 7,443 | 14.8% |
| 75 to 84 Years | 3,273 | 6.5% |
| 85 Years and Over | 2,382 | 4.8% |
| Total | 50,179 | 100.0% |
Housing Finances in La Crosse County
Median Income by Occupancy in La Crosse County
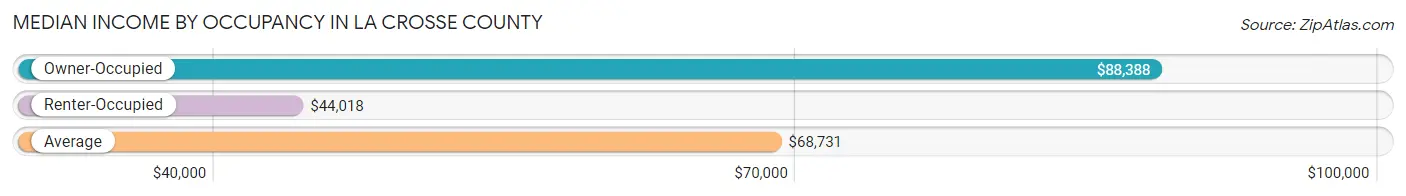
| Occupancy Type | # Households | Median Income |
| Owner-Occupied | 31,198 (62.2%) | $88,388 |
| Renter-Occupied | 18,981 (37.8%) | $44,018 |
| Average | 50,179 (100.0%) | $68,731 |
Occupancy by Householder Income Bracket in La Crosse County
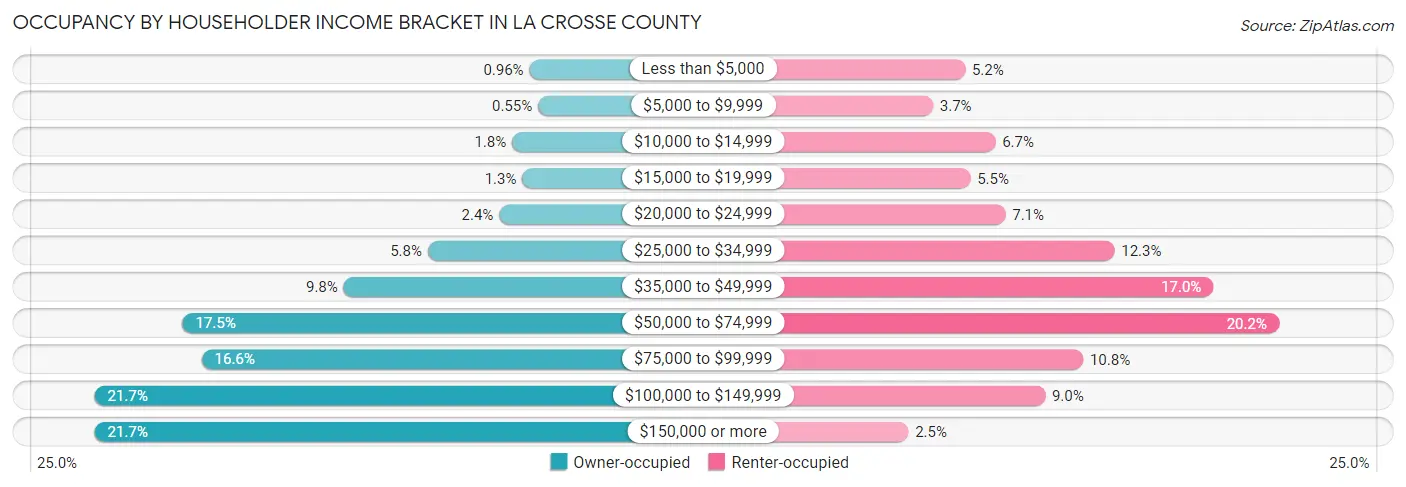
| Income Bracket | Owner-occupied | Renter-occupied |
| Less than $5,000 | 300 (1.0%) | 989 (5.2%) |
| $5,000 to $9,999 | 172 (0.5%) | 698 (3.7%) |
| $10,000 to $14,999 | 558 (1.8%) | 1,262 (6.7%) |
| $15,000 to $19,999 | 405 (1.3%) | 1,037 (5.5%) |
| $20,000 to $24,999 | 749 (2.4%) | 1,354 (7.1%) |
| $25,000 to $34,999 | 1,809 (5.8%) | 2,338 (12.3%) |
| $35,000 to $49,999 | 3,062 (9.8%) | 3,233 (17.0%) |
| $50,000 to $74,999 | 5,453 (17.5%) | 3,825 (20.2%) |
| $75,000 to $99,999 | 5,168 (16.6%) | 2,055 (10.8%) |
| $100,000 to $149,999 | 6,760 (21.7%) | 1,713 (9.0%) |
| $150,000 or more | 6,762 (21.7%) | 477 (2.5%) |
| Total | 31,198 (100.0%) | 18,981 (100.0%) |
Monthly Housing Cost Tiers in La Crosse County
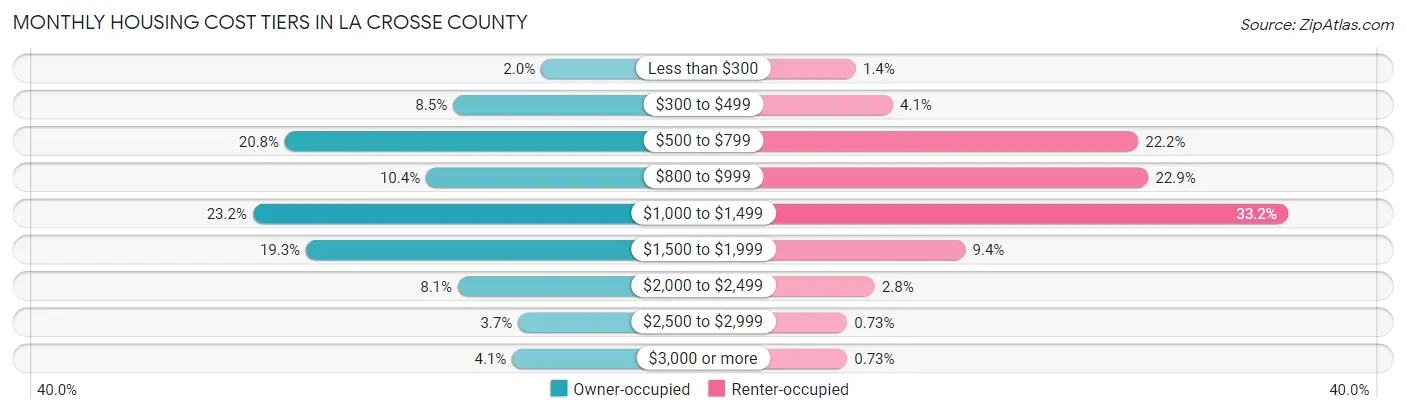
| Monthly Cost | Owner-occupied | Renter-occupied |
| Less than $300 | 616 (2.0%) | 260 (1.4%) |
| $300 to $499 | 2,635 (8.5%) | 779 (4.1%) |
| $500 to $799 | 6,497 (20.8%) | 4,206 (22.2%) |
| $800 to $999 | 3,256 (10.4%) | 4,349 (22.9%) |
| $1,000 to $1,499 | 7,238 (23.2%) | 6,305 (33.2%) |
| $1,500 to $1,999 | 6,015 (19.3%) | 1,792 (9.4%) |
| $2,000 to $2,499 | 2,524 (8.1%) | 523 (2.8%) |
| $2,500 to $2,999 | 1,141 (3.7%) | 138 (0.7%) |
| $3,000 or more | 1,276 (4.1%) | 139 (0.7%) |
| Total | 31,198 (100.0%) | 18,981 (100.0%) |
Physical Housing Characteristics in La Crosse County
Housing Structures in La Crosse County

| Structure Type | # Housing Units | % Housing Units |
| Single Unit, Detached | 30,666 | 61.1% |
| Single Unit, Attached | 3,069 | 6.1% |
| 2 Unit Apartments | 2,849 | 5.7% |
| 3 or 4 Unit Apartments | 2,108 | 4.2% |
| 5 to 9 Unit Apartments | 1,923 | 3.8% |
| 10 or more Apartments | 7,518 | 15.0% |
| Mobile Home / Other | 2,046 | 4.1% |
| Total | 50,179 | 100.0% |
Housing Structures by Occupancy in La Crosse County
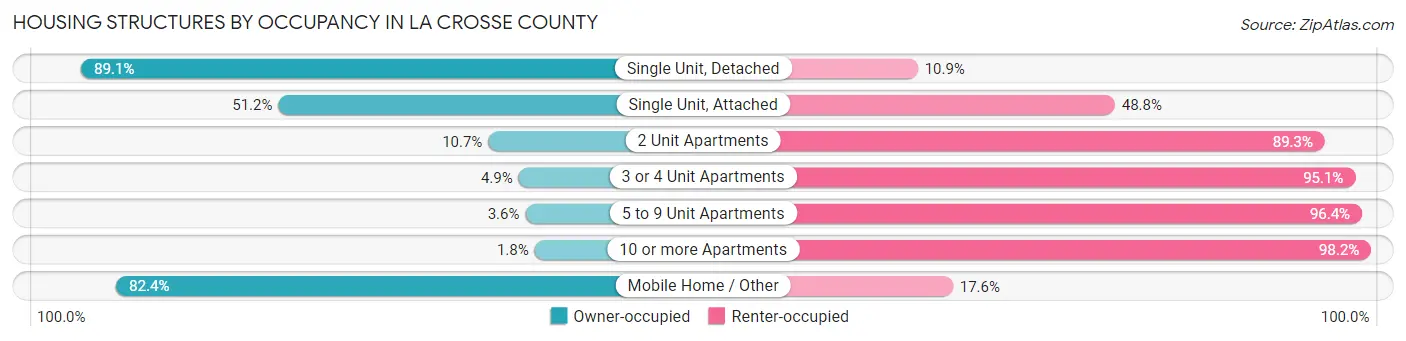
| Structure Type | Owner-occupied | Renter-occupied |
| Single Unit, Detached | 27,329 (89.1%) | 3,337 (10.9%) |
| Single Unit, Attached | 1,570 (51.2%) | 1,499 (48.8%) |
| 2 Unit Apartments | 306 (10.7%) | 2,543 (89.3%) |
| 3 or 4 Unit Apartments | 103 (4.9%) | 2,005 (95.1%) |
| 5 to 9 Unit Apartments | 69 (3.6%) | 1,854 (96.4%) |
| 10 or more Apartments | 136 (1.8%) | 7,382 (98.2%) |
| Mobile Home / Other | 1,685 (82.4%) | 361 (17.6%) |
| Total | 31,198 (62.2%) | 18,981 (37.8%) |
Housing Structures by Number of Rooms in La Crosse County
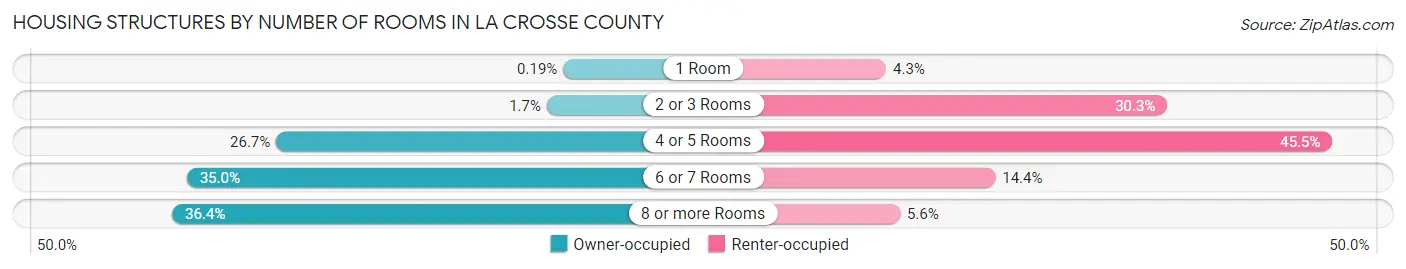
| Number of Rooms | Owner-occupied | Renter-occupied |
| 1 Room | 60 (0.2%) | 811 (4.3%) |
| 2 or 3 Rooms | 530 (1.7%) | 5,746 (30.3%) |
| 4 or 5 Rooms | 8,343 (26.7%) | 8,644 (45.5%) |
| 6 or 7 Rooms | 10,920 (35.0%) | 2,727 (14.4%) |
| 8 or more Rooms | 11,345 (36.4%) | 1,053 (5.6%) |
| Total | 31,198 (100.0%) | 18,981 (100.0%) |
Housing Structure by Heating Type in La Crosse County
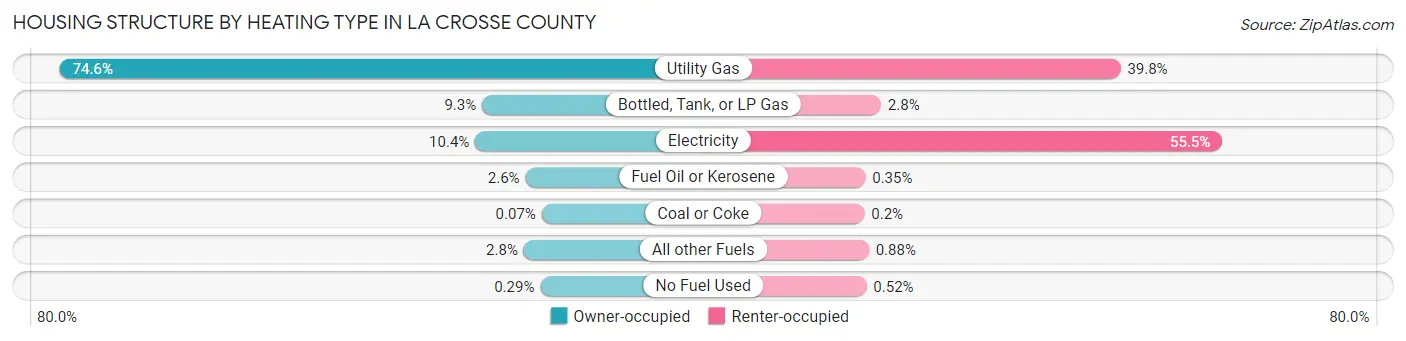
| Heating Type | Owner-occupied | Renter-occupied |
| Utility Gas | 23,269 (74.6%) | 7,553 (39.8%) |
| Bottled, Tank, or LP Gas | 2,898 (9.3%) | 524 (2.8%) |
| Electricity | 3,228 (10.3%) | 10,534 (55.5%) |
| Fuel Oil or Kerosene | 805 (2.6%) | 66 (0.4%) |
| Coal or Coke | 22 (0.1%) | 38 (0.2%) |
| All other Fuels | 887 (2.8%) | 167 (0.9%) |
| No Fuel Used | 89 (0.3%) | 99 (0.5%) |
| Total | 31,198 (100.0%) | 18,981 (100.0%) |
Household Vehicle Usage in La Crosse County
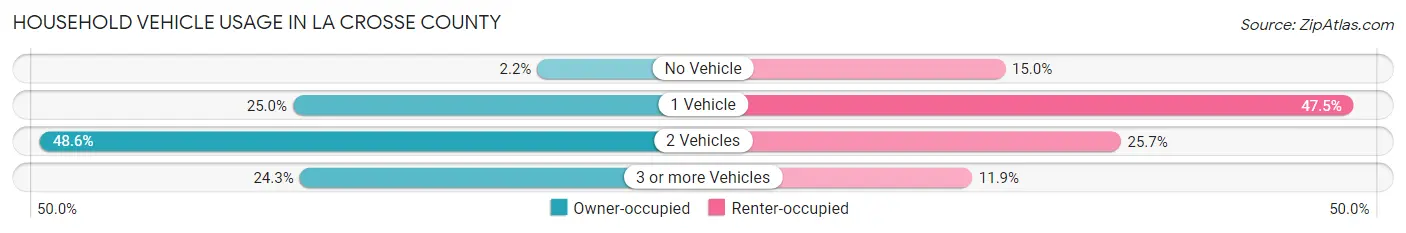
| Vehicles per Household | Owner-occupied | Renter-occupied |
| No Vehicle | 670 (2.1%) | 2,838 (14.9%) |
| 1 Vehicle | 7,786 (25.0%) | 9,011 (47.5%) |
| 2 Vehicles | 15,149 (48.6%) | 4,883 (25.7%) |
| 3 or more Vehicles | 7,593 (24.3%) | 2,249 (11.8%) |
| Total | 31,198 (100.0%) | 18,981 (100.0%) |
Real Estate & Mortgages in La Crosse County
Real Estate and Mortgage Overview in La Crosse County
| Characteristic | Without Mortgage | With Mortgage |
| Housing Units | 12,215 | 18,983 |
| Median Property Value | $215,500 | $233,100 |
| Median Household Income | $69,535 | $4,853 |
| Monthly Housing Costs | $612 | $1,258 |
| Real Estate Taxes | $3,852 | $151 |
Property Value by Mortgage Status in La Crosse County

| Property Value | Without Mortgage | With Mortgage |
| Less than $50,000 | 1,441 (11.8%) | 366 (1.9%) |
| $50,000 to $99,999 | 550 (4.5%) | 455 (2.4%) |
| $100,000 to $299,999 | 7,210 (59.0%) | 12,459 (65.6%) |
| $300,000 to $499,999 | 2,234 (18.3%) | 4,566 (24.0%) |
| $500,000 to $749,999 | 503 (4.1%) | 755 (4.0%) |
| $750,000 to $999,999 | 154 (1.3%) | 271 (1.4%) |
| $1,000,000 or more | 123 (1.0%) | 111 (0.6%) |
| Total | 12,215 (100.0%) | 18,983 (100.0%) |
Household Income by Mortgage Status in La Crosse County
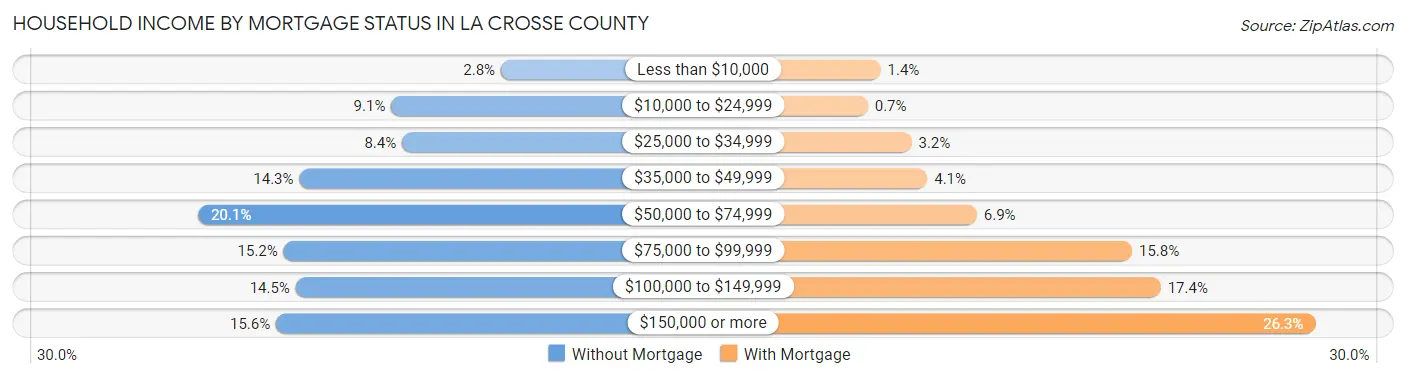
| Household Income | Without Mortgage | With Mortgage |
| Less than $10,000 | 340 (2.8%) | 272 (1.4%) |
| $10,000 to $24,999 | 1,105 (9.0%) | 132 (0.7%) |
| $25,000 to $34,999 | 1,030 (8.4%) | 607 (3.2%) |
| $35,000 to $49,999 | 1,747 (14.3%) | 779 (4.1%) |
| $50,000 to $74,999 | 2,454 (20.1%) | 1,315 (6.9%) |
| $75,000 to $99,999 | 1,857 (15.2%) | 2,999 (15.8%) |
| $100,000 to $149,999 | 1,773 (14.5%) | 3,311 (17.4%) |
| $150,000 or more | 1,909 (15.6%) | 4,987 (26.3%) |
| Total | 12,215 (100.0%) | 18,983 (100.0%) |
Property Value to Household Income Ratio in La Crosse County

| Value-to-Income Ratio | Without Mortgage | With Mortgage |
| Less than 2.0x | 4,297 (35.2%) | 103,922 (547.4%) |
| 2.0x to 2.9x | 2,126 (17.4%) | 7,303 (38.5%) |
| 3.0x to 3.9x | 1,480 (12.1%) | 5,794 (30.5%) |
| 4.0x or more | 4,237 (34.7%) | 2,460 (13.0%) |
| Total | 12,215 (100.0%) | 18,983 (100.0%) |
Real Estate Taxes by Mortgage Status in La Crosse County
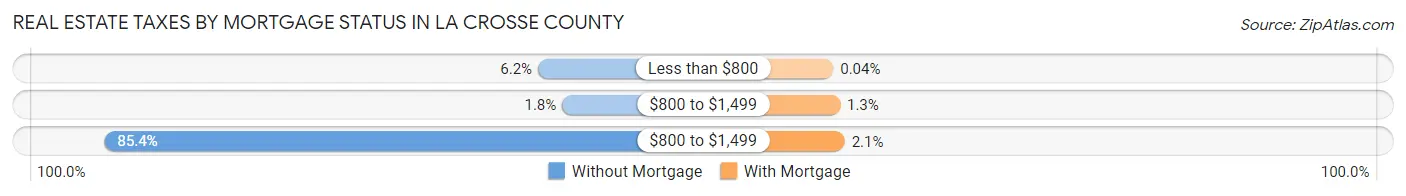
| Property Taxes | Without Mortgage | With Mortgage |
| Less than $800 | 762 (6.2%) | 8 (0.0%) |
| $800 to $1,499 | 224 (1.8%) | 242 (1.3%) |
| $800 to $1,499 | 10,434 (85.4%) | 406 (2.1%) |
| Total | 12,215 (100.0%) | 18,983 (100.0%) |
Health & Disability in La Crosse County
Health Insurance Coverage by Age in La Crosse County
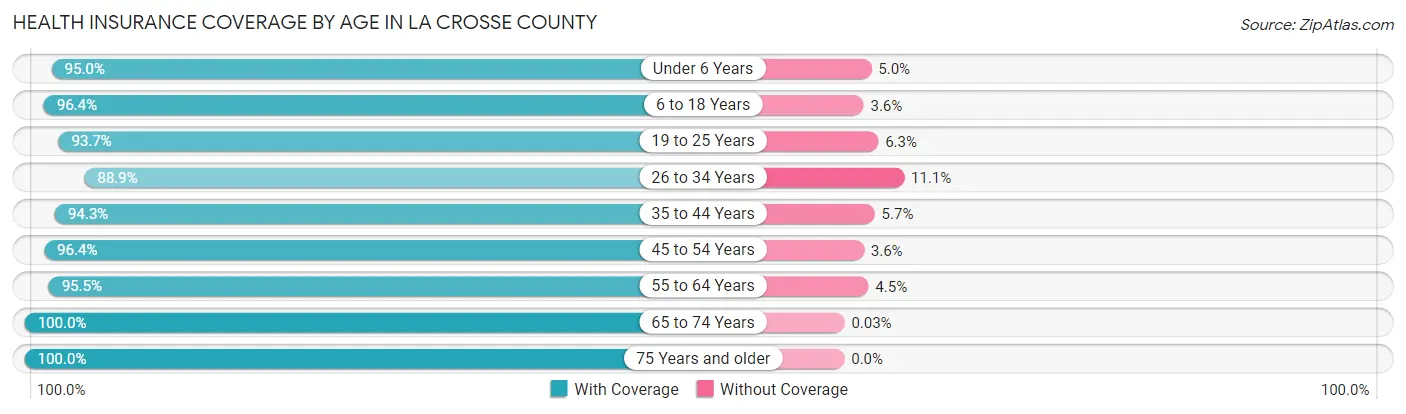
| Age Bracket | With Coverage | Without Coverage |
| Under 6 Years | 6,985 (95.0%) | 371 (5.0%) |
| 6 to 18 Years | 17,703 (96.4%) | 659 (3.6%) |
| 19 to 25 Years | 16,867 (93.7%) | 1,137 (6.3%) |
| 26 to 34 Years | 12,281 (88.9%) | 1,540 (11.1%) |
| 35 to 44 Years | 13,026 (94.3%) | 781 (5.7%) |
| 45 to 54 Years | 12,382 (96.4%) | 468 (3.6%) |
| 55 to 64 Years | 14,274 (95.5%) | 672 (4.5%) |
| 65 to 74 Years | 11,857 (100.0%) | 3 (0.0%) |
| 75 Years and older | 8,003 (100.0%) | 0 (0.0%) |
| Total | 113,378 (95.3%) | 5,631 (4.7%) |
Health Insurance Coverage by Citizenship Status in La Crosse County
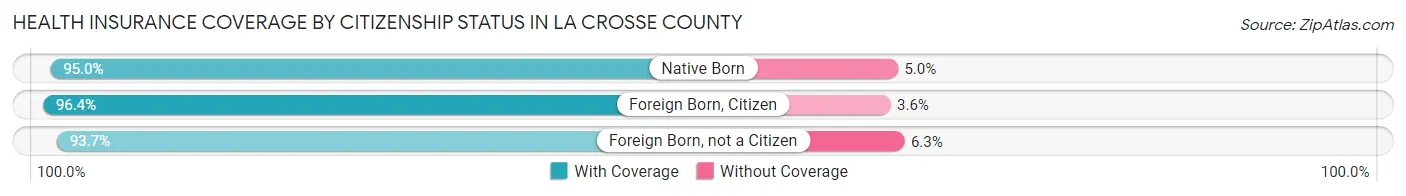
| Citizenship Status | With Coverage | Without Coverage |
| Native Born | 6,985 (95.0%) | 371 (5.0%) |
| Foreign Born, Citizen | 17,703 (96.4%) | 659 (3.6%) |
| Foreign Born, not a Citizen | 16,867 (93.7%) | 1,137 (6.3%) |
Health Insurance Coverage by Household Income in La Crosse County
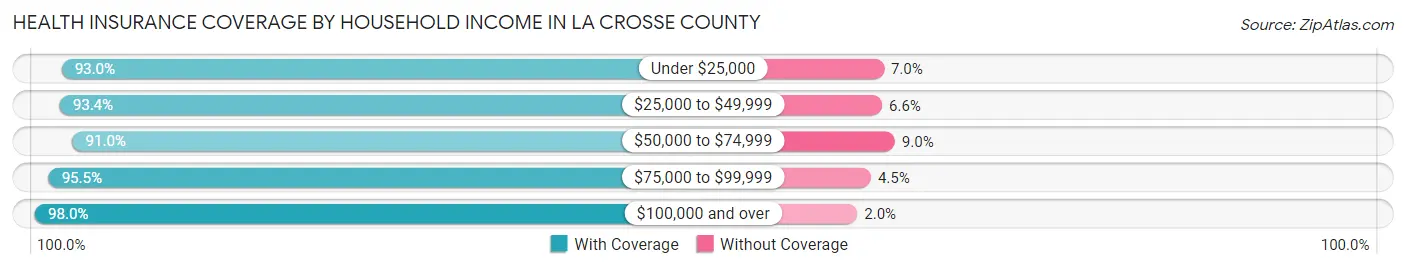
| Household Income | With Coverage | Without Coverage |
| Under $25,000 | 10,599 (93.0%) | 793 (7.0%) |
| $25,000 to $49,999 | 16,582 (93.4%) | 1,173 (6.6%) |
| $50,000 to $74,999 | 18,389 (91.0%) | 1,820 (9.0%) |
| $75,000 to $99,999 | 17,764 (95.5%) | 842 (4.5%) |
| $100,000 and over | 46,140 (98.0%) | 930 (2.0%) |
Public vs Private Health Insurance Coverage by Age in La Crosse County
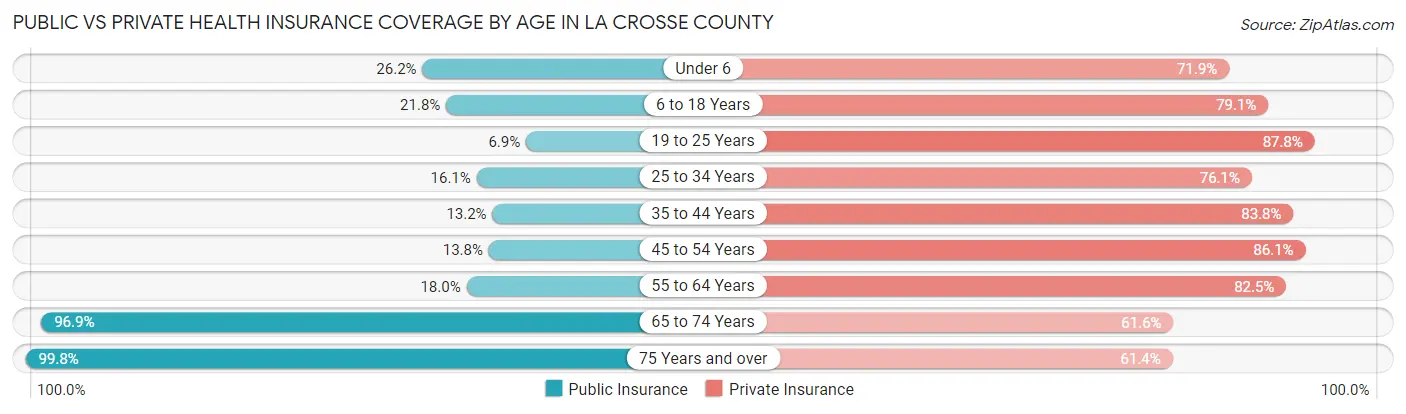
| Age Bracket | Public Insurance | Private Insurance |
| Under 6 | 1,924 (26.2%) | 5,288 (71.9%) |
| 6 to 18 Years | 3,994 (21.7%) | 14,532 (79.1%) |
| 19 to 25 Years | 1,248 (6.9%) | 15,802 (87.8%) |
| 25 to 34 Years | 2,225 (16.1%) | 10,516 (76.1%) |
| 35 to 44 Years | 1,817 (13.2%) | 11,572 (83.8%) |
| 45 to 54 Years | 1,779 (13.8%) | 11,058 (86.1%) |
| 55 to 64 Years | 2,688 (18.0%) | 12,328 (82.5%) |
| 65 to 74 Years | 11,494 (96.9%) | 7,300 (61.6%) |
| 75 Years and over | 7,990 (99.8%) | 4,914 (61.4%) |
| Total | 35,159 (29.5%) | 93,310 (78.4%) |
Disability Status by Sex by Age in La Crosse County
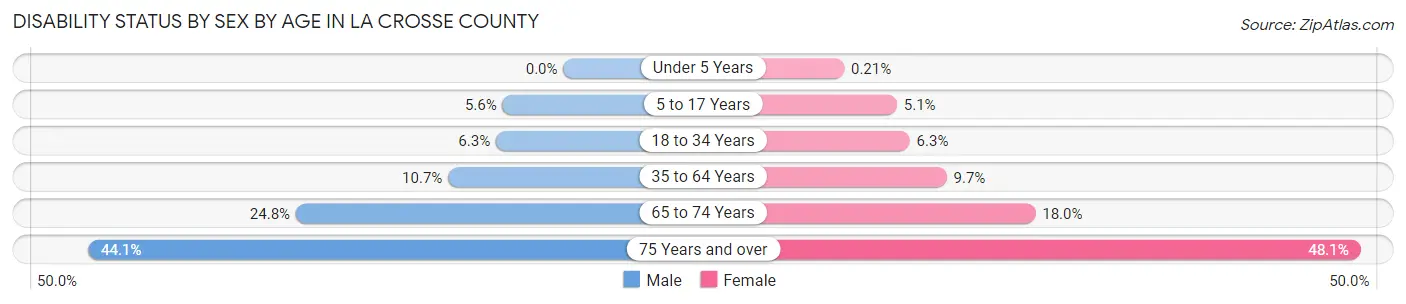
| Age Bracket | Male | Female |
| Under 5 Years | 0 (0.0%) | 6 (0.2%) |
| 5 to 17 Years | 511 (5.6%) | 437 (5.1%) |
| 18 to 34 Years | 1,029 (6.2%) | 1,111 (6.3%) |
| 35 to 64 Years | 2,227 (10.7%) | 2,021 (9.7%) |
| 65 to 74 Years | 1,422 (24.8%) | 1,101 (18.0%) |
| 75 Years and over | 1,423 (44.1%) | 2,299 (48.1%) |
Disability Class by Sex by Age in La Crosse County
Disability Class: Hearing Difficulty
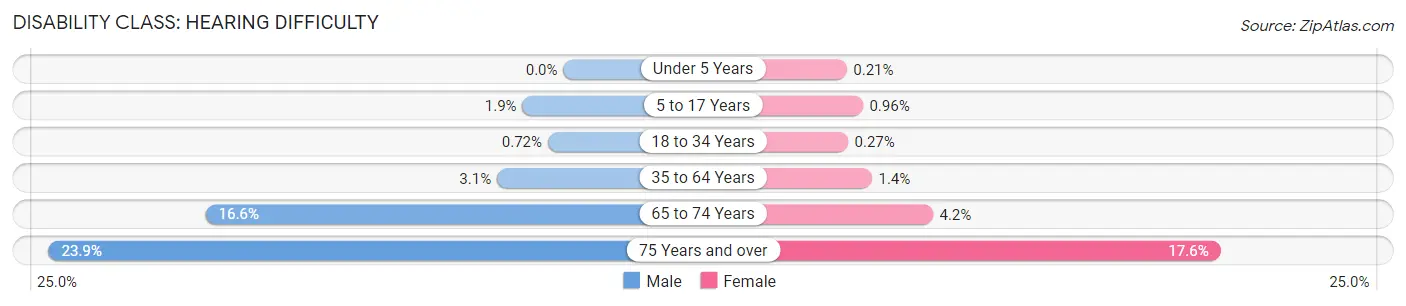
| Age Bracket | Male | Female |
| Under 5 Years | 0 (0.0%) | 6 (0.2%) |
| 5 to 17 Years | 172 (1.9%) | 82 (1.0%) |
| 18 to 34 Years | 119 (0.7%) | 48 (0.3%) |
| 35 to 64 Years | 642 (3.1%) | 287 (1.4%) |
| 65 to 74 Years | 951 (16.6%) | 258 (4.2%) |
| 75 Years and over | 771 (23.9%) | 839 (17.6%) |
Disability Class: Vision Difficulty
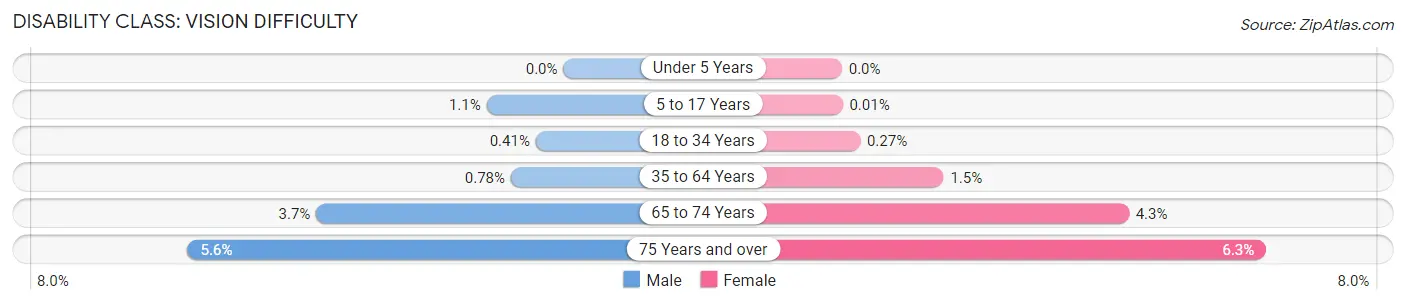
| Age Bracket | Male | Female |
| Under 5 Years | 0 (0.0%) | 0 (0.0%) |
| 5 to 17 Years | 103 (1.1%) | 1 (0.0%) |
| 18 to 34 Years | 67 (0.4%) | 47 (0.3%) |
| 35 to 64 Years | 162 (0.8%) | 314 (1.5%) |
| 65 to 74 Years | 210 (3.7%) | 261 (4.3%) |
| 75 Years and over | 180 (5.6%) | 301 (6.3%) |
Disability Class: Cognitive Difficulty
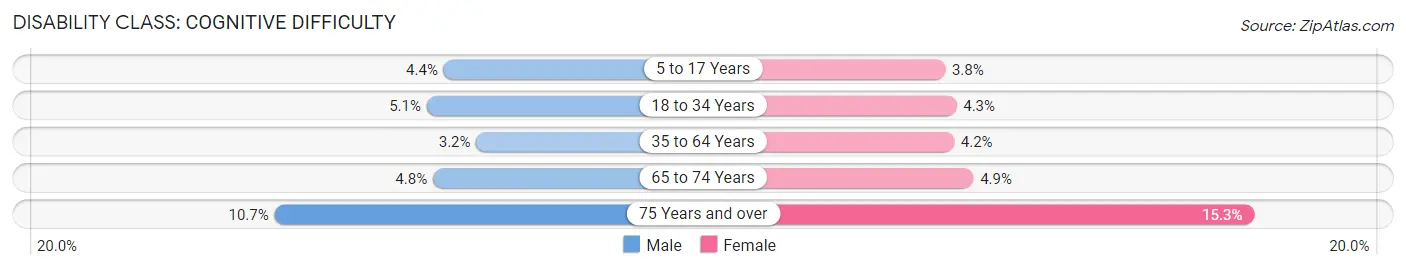
| Age Bracket | Male | Female |
| 5 to 17 Years | 402 (4.4%) | 328 (3.8%) |
| 18 to 34 Years | 835 (5.1%) | 750 (4.3%) |
| 35 to 64 Years | 674 (3.2%) | 864 (4.2%) |
| 65 to 74 Years | 277 (4.8%) | 299 (4.9%) |
| 75 Years and over | 346 (10.7%) | 731 (15.3%) |
Disability Class: Ambulatory Difficulty
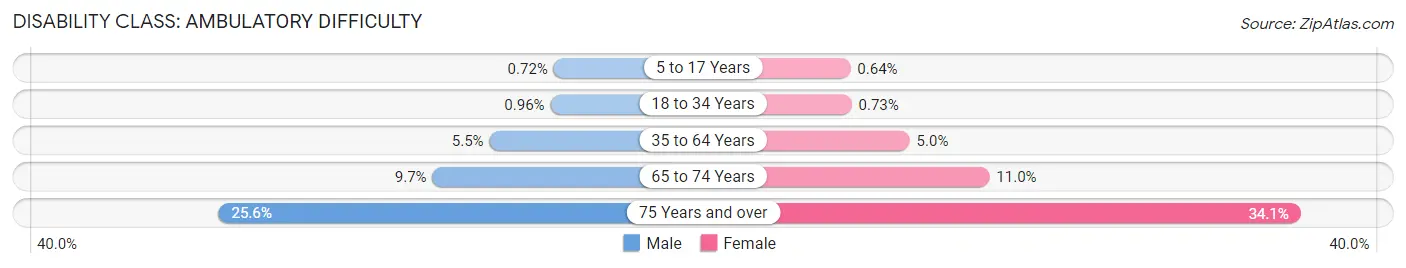
| Age Bracket | Male | Female |
| 5 to 17 Years | 65 (0.7%) | 55 (0.6%) |
| 18 to 34 Years | 158 (1.0%) | 128 (0.7%) |
| 35 to 64 Years | 1,144 (5.5%) | 1,047 (5.0%) |
| 65 to 74 Years | 557 (9.7%) | 672 (11.0%) |
| 75 Years and over | 826 (25.6%) | 1,627 (34.1%) |
Disability Class: Self-Care Difficulty
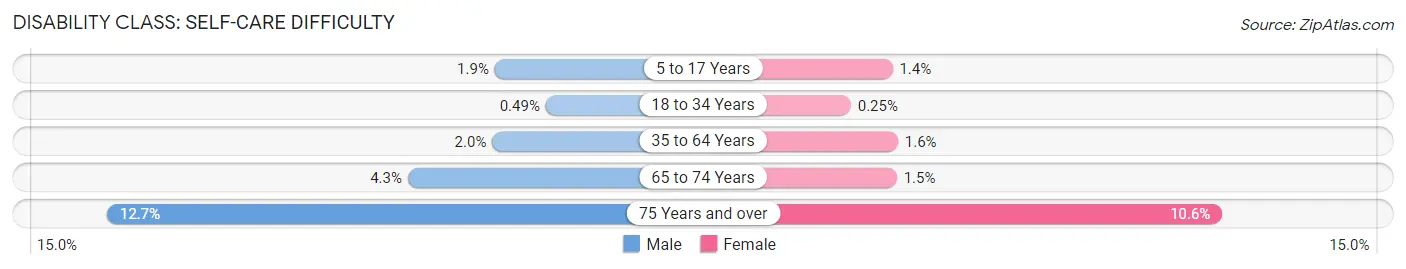
| Age Bracket | Male | Female |
| 5 to 17 Years | 173 (1.9%) | 121 (1.4%) |
| 18 to 34 Years | 81 (0.5%) | 44 (0.3%) |
| 35 to 64 Years | 412 (2.0%) | 323 (1.6%) |
| 65 to 74 Years | 248 (4.3%) | 94 (1.5%) |
| 75 Years and over | 410 (12.7%) | 506 (10.6%) |
Technology Access in La Crosse County
Computing Device Access in La Crosse County
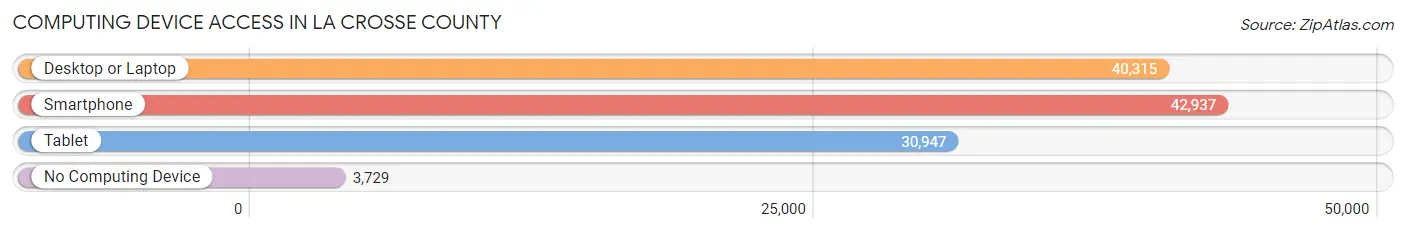
| Device Type | # Households | % Households |
| Desktop or Laptop | 40,315 | 80.3% |
| Smartphone | 42,937 | 85.6% |
| Tablet | 30,947 | 61.7% |
| No Computing Device | 3,729 | 7.4% |
| Total | 50,179 | 100.0% |
Internet Access in La Crosse County
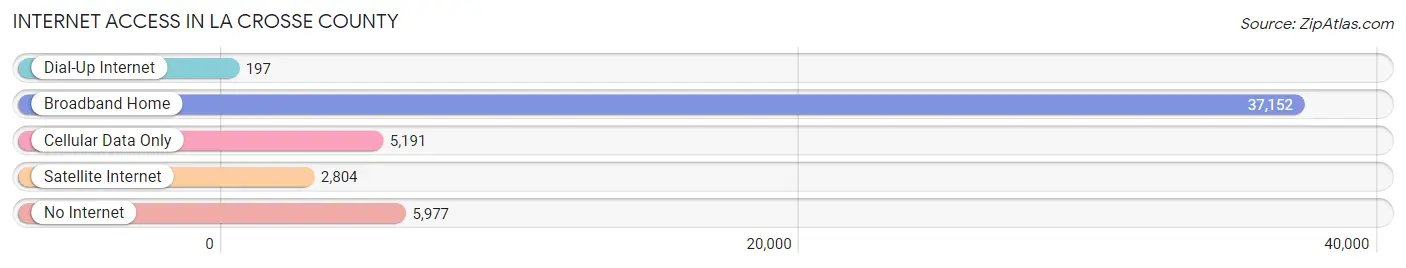
| Internet Type | # Households | % Households |
| Dial-Up Internet | 197 | 0.4% |
| Broadband Home | 37,152 | 74.0% |
| Cellular Data Only | 5,191 | 10.3% |
| Satellite Internet | 2,804 | 5.6% |
| No Internet | 5,977 | 11.9% |
| Total | 50,179 | 100.0% |
La Crosse County Summary
La Crosse County is located in the western part of Wisconsin, along the Mississippi River. It is bordered by Minnesota to the west, Iowa to the south, and the Wisconsin counties of Trempealeau to the north, Monroe to the northeast, and Vernon to the east. The county seat is La Crosse, and the county has a population of approximately 116,000 people.
History
The area that is now La Crosse County was originally inhabited by the Ho-Chunk (Winnebago) people. The first European settlers arrived in the area in the early 1800s, and the county was officially established in 1851. The county was named after the city of La Crosse, which was founded in 1841.
The county was an important transportation hub in the 19th century, as it was located at the intersection of the Mississippi and Black Rivers. The county was also home to several industries, including lumber, paper, and food processing.
Geography
La Crosse County covers an area of 1,072 square miles, making it the largest county in Wisconsin. The county is located in the Driftless Area, which is characterized by its rugged terrain and rolling hills. The county is home to several rivers, including the Mississippi, Black, La Crosse, and Root.
The county is also home to several parks and recreational areas, including the La Crosse River State Trail, the Great River State Trail, and the Perrot State Park.
Economy
The economy of La Crosse County is largely based on agriculture, manufacturing, and tourism. The county is home to several large employers, including the University of Wisconsin-La Crosse, Gundersen Health System, and the La Crosse County government.
Agriculture is an important part of the county’s economy, with dairy, beef, and corn being the main crops. Manufacturing is also an important part of the economy, with companies such as Trane, La Crosse Technology, and La Crosse Footwear producing a variety of products.
Tourism is also an important part of the economy, with the county being home to several popular attractions, including the La Crosse River State Trail, the Great River State Trail, and the Perrot State Park.
Demographics
As of the 2010 census, La Crosse County had a population of 116,638 people. The racial makeup of the county was 90.2% White, 4.2% Black or African American, 0.5% Native American, 2.2% Asian, 0.1% Pacific Islander, 1.3% from other races, and 1.6% from two or more races. Hispanic or Latino of any race were 3.3% of the population.
The median income for a household in the county was $48,945, and the median income for a family was $60,945. The per capita income for the county was $25,945. About 8.2% of families and 11.2% of the population were below the poverty line, including 15.2% of those under age 18 and 6.2% of those age 65 or over.
La Crosse County is a diverse and vibrant community, with a rich history and a strong economy. The county is home to several large employers, and is a popular destination for tourists. The county is also home to several parks and recreational areas, making it a great place to live and work.
Common Questions
What is the Total Population of La Crosse County?
Total Population of La Crosse County is 120,216.
What is the Total Male Population of La Crosse County?
Total Male Population of La Crosse County is 59,025.
What is the Total Female Population of La Crosse County?
Total Female Population of La Crosse County is 61,191.
What is the Ratio of Males per 100 Females in La Crosse County?
There are 96.46 Males per 100 Females in La Crosse County.
What is the Ratio of Females per 100 Males in La Crosse County?
There are 103.67 Females per 100 Males in La Crosse County.
What is the Median Population Age in La Crosse County?
Median Population Age in La Crosse County is 36.6 Years.
What is the Average Family Size in La Crosse County
Average Family Size in La Crosse County is 3.0 People.
What is the Average Household Size in La Crosse County
Average Household Size in La Crosse County is 2.3 People.
What is Per Capita Income in La Crosse County?
Per Capita income in La Crosse County is $39,498.
What is the Median Family Income in La Crosse County?
Median Family Income in La Crosse County is $94,779.
What is the Median Household income in La Crosse County?
Median Household Income in La Crosse County is $68,731.
What is Income or Wage Gap in La Crosse County?
Income or Wage Gap in La Crosse County is 25.5%.
Women in La Crosse County earn 74.5 cents for every dollar earned by a man.
What is Family Income Deficit in La Crosse County?
Family Income Deficit in La Crosse County is $8,046.
Families that are below poverty line in La Crosse County earn $8,046 less on average than the poverty threshold level.
What is Inequality or Gini Index in La Crosse County?
Inequality or Gini Index in La Crosse County is 0.46.
How Large is the Labor Force in La Crosse County?
There are 65,848 People in the Labor Forcein in La Crosse County.
What is the Percentage of People in the Labor Force in La Crosse County?
66.2% of People are in the Labor Force in La Crosse County.
What is the Unemployment Rate in La Crosse County?
Unemployment Rate in La Crosse County is 3.1%.