Kewaunee County, WI
Kewaunee County Map
Kewaunee County Overview
20,570
TOTAL POPULATION
10,527
MALE POPULATION
10,043
FEMALE POPULATION
104.82
MALES / 100 FEMALES
95.40
FEMALES / 100 MALES
44.4
MEDIAN AGE
2.9
AVG FAMILY SIZE
2.5
AVG HOUSEHOLD SIZE
$38,012
PER CAPITA INCOME
$92,088
AVG FAMILY INCOME
$77,610
AVG HOUSEHOLD INCOME
33.9%
WAGE / INCOME GAP [ % ]
66.1¢/ $1
WAGE / INCOME GAP [ $ ]
$10,309
FAMILY INCOME DEFICIT
0.39
INEQUALITY / GINI INDEX
11,054
LABOR FORCE [ PEOPLE ]
66.0%
PERCENT IN LABOR FORCE
2.0%
UNEMPLOYMENT RATE
Kewaunee County Area Codes
Race in Kewaunee County
The most populous races in Kewaunee County are White / Caucasian (19,494 | 94.8%), Hispanic or Latino (695 | 3.4%), and Two or more Races (591 | 2.9%).
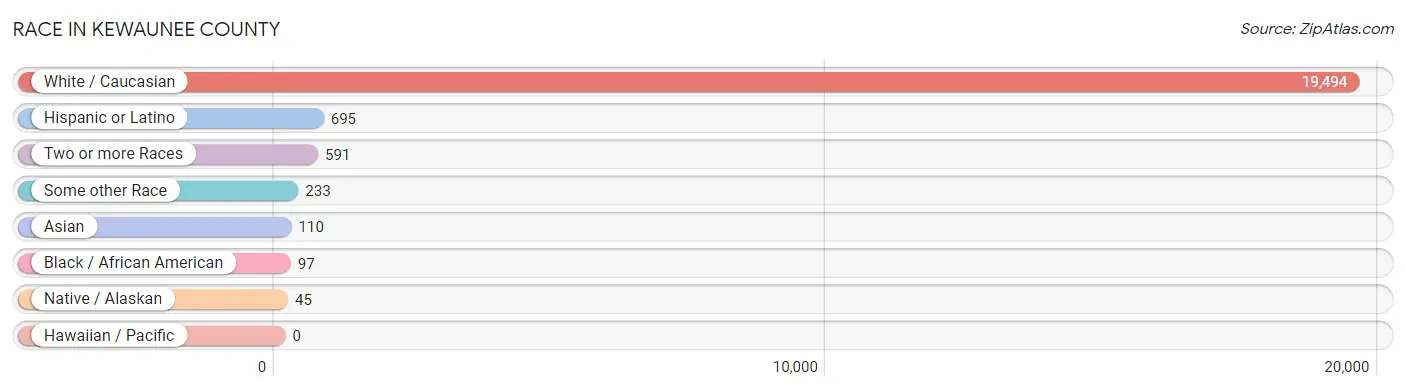
| Race | # Population | % Population |
| Asian | 110 | 0.5% |
| Black / African American | 97 | 0.5% |
| Hawaiian / Pacific | 0 | 0.0% |
| Hispanic or Latino | 695 | 3.4% |
| Native / Alaskan | 45 | 0.2% |
| White / Caucasian | 19,494 | 94.8% |
| Two or more Races | 591 | 2.9% |
| Some other Race | 233 | 1.1% |
| Total | 20,570 | 100.0% |
Ancestry in Kewaunee County
The most populous ancestries reported in Kewaunee County are German (8,206 | 39.9%), Belgian (3,998 | 19.4%), Polish (1,890 | 9.2%), Czech (1,845 | 9.0%), and Irish (1,418 | 6.9%), together accounting for 84.4% of all Kewaunee County residents.
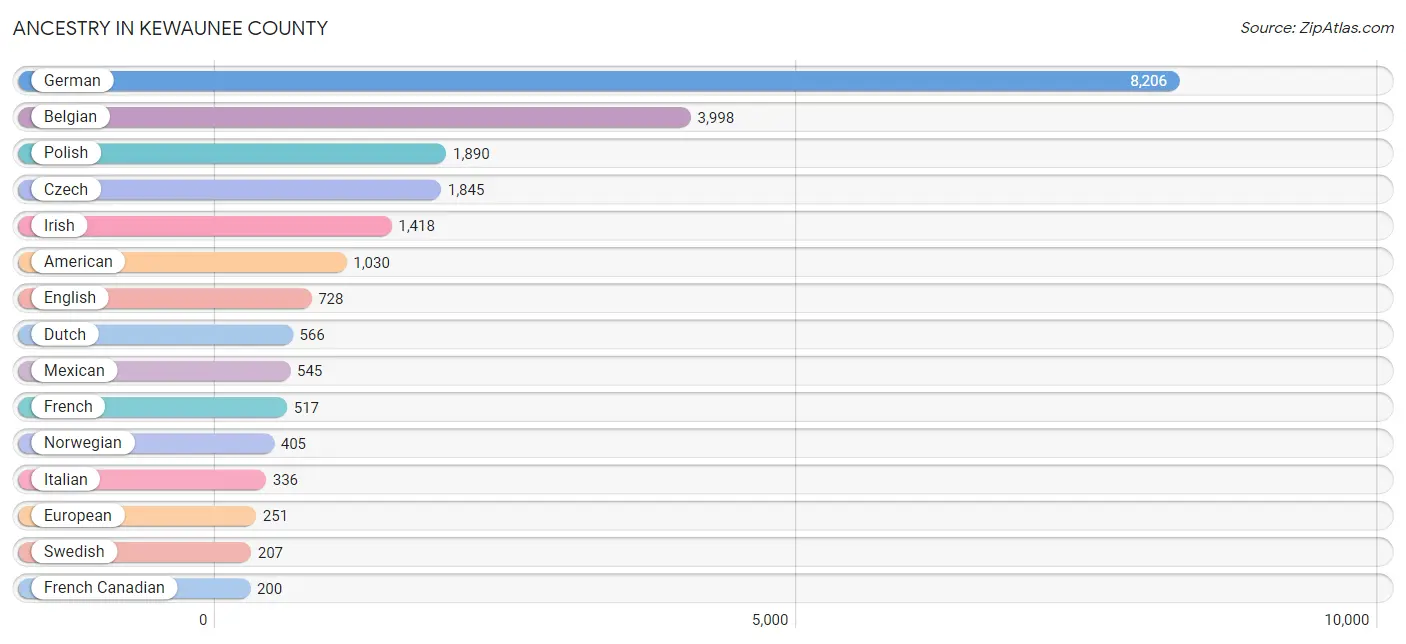
| Ancestry | # Population | % Population |
| American | 1,030 | 5.0% |
| Apache | 8 | 0.0% |
| Arab | 2 | 0.0% |
| Armenian | 2 | 0.0% |
| Austrian | 178 | 0.9% |
| Bangladeshi | 3 | 0.0% |
| Belgian | 3,998 | 19.4% |
| Bhutanese | 6 | 0.0% |
| Blackfeet | 19 | 0.1% |
| British | 36 | 0.2% |
| Canadian | 7 | 0.0% |
| Central American | 71 | 0.4% |
| Cherokee | 23 | 0.1% |
| Chippewa | 19 | 0.1% |
| Colombian | 7 | 0.0% |
| Cree | 7 | 0.0% |
| Croatian | 23 | 0.1% |
| Cuban | 2 | 0.0% |
| Czech | 1,845 | 9.0% |
| Czechoslovakian | 50 | 0.2% |
| Danish | 96 | 0.5% |
| Dutch | 566 | 2.8% |
| Eastern European | 35 | 0.2% |
| English | 728 | 3.5% |
| European | 251 | 1.2% |
| Finnish | 75 | 0.4% |
| French | 517 | 2.5% |
| French American Indian | 9 | 0.0% |
| French Canadian | 200 | 1.0% |
| German | 8,206 | 39.9% |
| Greek | 15 | 0.1% |
| Guatemalan | 3 | 0.0% |
| Hungarian | 29 | 0.1% |
| Icelander | 5 | 0.0% |
| Indian (Asian) | 36 | 0.2% |
| Iranian | 2 | 0.0% |
| Irish | 1,418 | 6.9% |
| Iroquois | 75 | 0.4% |
| Italian | 336 | 1.6% |
| Korean | 117 | 0.6% |
| Latvian | 31 | 0.2% |
| Lebanese | 2 | 0.0% |
| Lithuanian | 35 | 0.2% |
| Luxembourger | 11 | 0.1% |
| Mexican | 545 | 2.6% |
| Mexican American Indian | 2 | 0.0% |
| Native Hawaiian | 1 | 0.0% |
| Nicaraguan | 43 | 0.2% |
| Northern European | 23 | 0.1% |
| Norwegian | 405 | 2.0% |
| Panamanian | 1 | 0.0% |
| Polish | 1,890 | 9.2% |
| Puerto Rican | 62 | 0.3% |
| Romanian | 5 | 0.0% |
| Russian | 29 | 0.1% |
| Salvadoran | 24 | 0.1% |
| Samoan | 1 | 0.0% |
| Scandinavian | 51 | 0.3% |
| Scotch-Irish | 79 | 0.4% |
| Scottish | 101 | 0.5% |
| Serbian | 4 | 0.0% |
| Sioux | 35 | 0.2% |
| Slovak | 2 | 0.0% |
| Slovene | 7 | 0.0% |
| South American | 7 | 0.0% |
| Spaniard | 8 | 0.0% |
| Sri Lankan | 23 | 0.1% |
| Subsaharan African | 4 | 0.0% |
| Swedish | 207 | 1.0% |
| Swiss | 32 | 0.2% |
| Ukrainian | 29 | 0.1% |
| Welsh | 30 | 0.2% |
| Yugoslavian | 3 | 0.0% | View All 73 Rows |
Immigrants in Kewaunee County
The most numerous immigrant groups reported in Kewaunee County came from Latin America (266 | 1.3%), Central America (263 | 1.3%), Mexico (200 | 1.0%), Europe (107 | 0.5%), and Eastern Europe (82 | 0.4%), together accounting for 4.5% of all Kewaunee County residents.
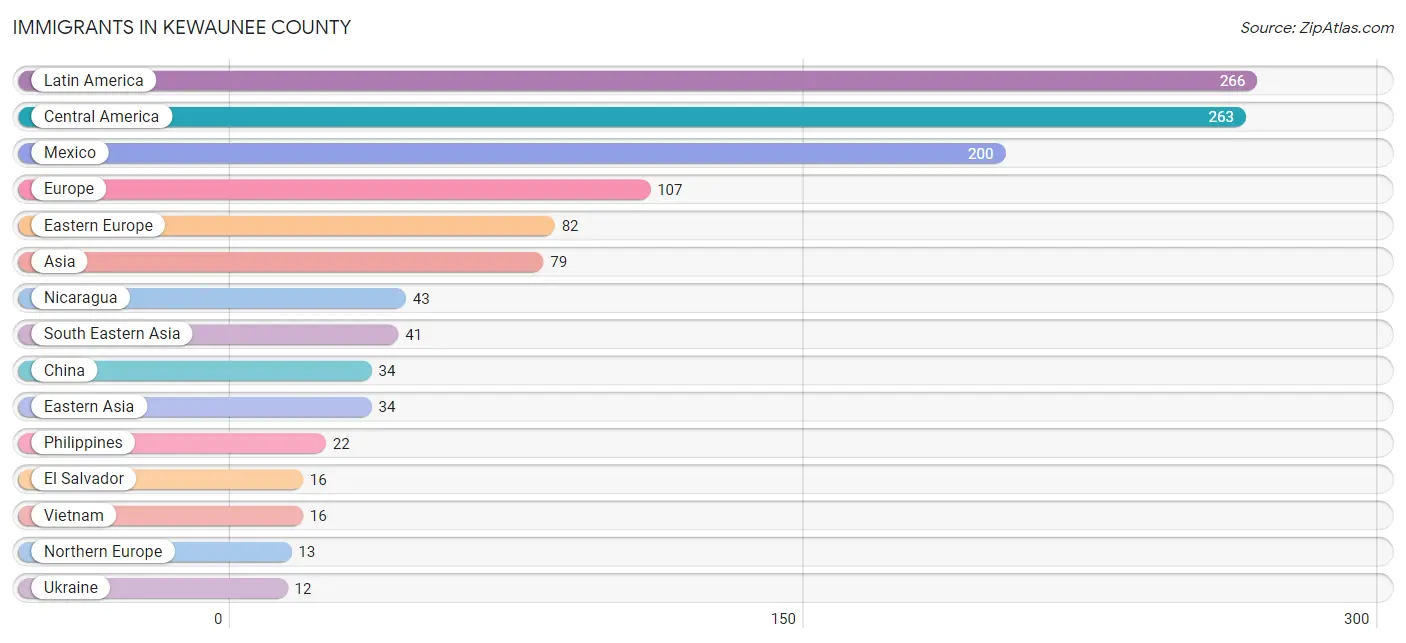
| Immigration Origin | # Population | % Population |
| Asia | 79 | 0.4% |
| Canada | 7 | 0.0% |
| Central America | 263 | 1.3% |
| China | 34 | 0.2% |
| Eastern Asia | 34 | 0.2% |
| Eastern Europe | 82 | 0.4% |
| El Salvador | 16 | 0.1% |
| England | 11 | 0.1% |
| Europe | 107 | 0.5% |
| Germany | 7 | 0.0% |
| Guatemala | 3 | 0.0% |
| Hungary | 3 | 0.0% |
| India | 2 | 0.0% |
| Iran | 2 | 0.0% |
| Laos | 3 | 0.0% |
| Latin America | 266 | 1.3% |
| Mexico | 200 | 1.0% |
| Netherlands | 2 | 0.0% |
| Nicaragua | 43 | 0.2% |
| Northern Europe | 13 | 0.1% |
| Oceania | 3 | 0.0% |
| Panama | 1 | 0.0% |
| Peru | 3 | 0.0% |
| Philippines | 22 | 0.1% |
| Romania | 5 | 0.0% |
| Russia | 5 | 0.0% |
| South America | 3 | 0.0% |
| South Central Asia | 4 | 0.0% |
| South Eastern Asia | 41 | 0.2% |
| Southern Europe | 3 | 0.0% |
| Spain | 3 | 0.0% |
| Ukraine | 12 | 0.1% |
| Vietnam | 16 | 0.1% |
| Western Europe | 9 | 0.0% | View All 34 Rows |
Sex and Age in Kewaunee County
Sex and Age in Kewaunee County
The most populous age groups in Kewaunee County are 60 to 64 Years (855 | 8.1%) for men and 55 to 59 Years (808 | 8.1%) for women.
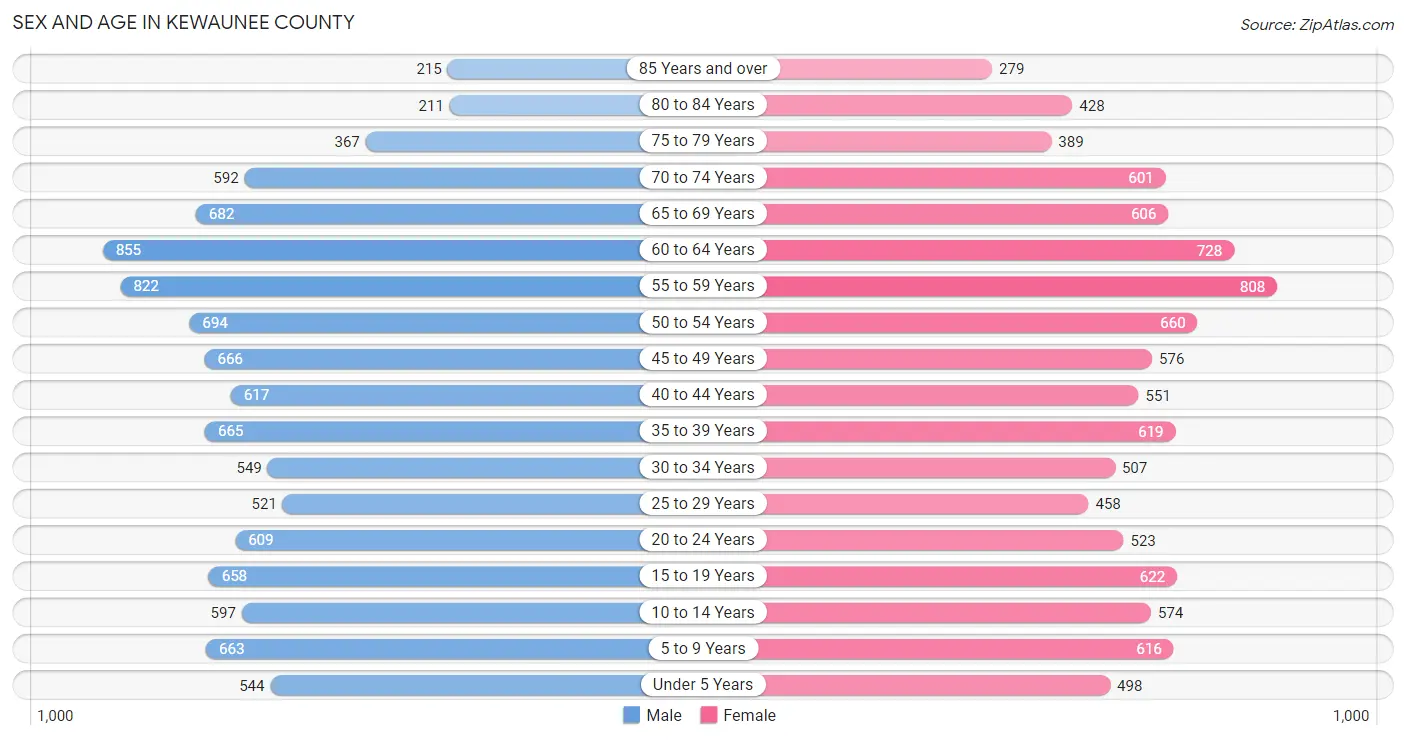
| Age Bracket | Male | Female |
| Under 5 Years | 544 (5.2%) | 498 (5.0%) |
| 5 to 9 Years | 663 (6.3%) | 616 (6.1%) |
| 10 to 14 Years | 597 (5.7%) | 574 (5.7%) |
| 15 to 19 Years | 658 (6.2%) | 622 (6.2%) |
| 20 to 24 Years | 609 (5.8%) | 523 (5.2%) |
| 25 to 29 Years | 521 (5.0%) | 458 (4.6%) |
| 30 to 34 Years | 549 (5.2%) | 507 (5.1%) |
| 35 to 39 Years | 665 (6.3%) | 619 (6.2%) |
| 40 to 44 Years | 617 (5.9%) | 551 (5.5%) |
| 45 to 49 Years | 666 (6.3%) | 576 (5.7%) |
| 50 to 54 Years | 694 (6.6%) | 660 (6.6%) |
| 55 to 59 Years | 822 (7.8%) | 808 (8.1%) |
| 60 to 64 Years | 855 (8.1%) | 728 (7.2%) |
| 65 to 69 Years | 682 (6.5%) | 606 (6.0%) |
| 70 to 74 Years | 592 (5.6%) | 601 (6.0%) |
| 75 to 79 Years | 367 (3.5%) | 389 (3.9%) |
| 80 to 84 Years | 211 (2.0%) | 428 (4.3%) |
| 85 Years and over | 215 (2.0%) | 279 (2.8%) |
| Total | 10,527 (100.0%) | 10,043 (100.0%) |
Families and Households in Kewaunee County
Median Family Size in Kewaunee County
The median family size in Kewaunee County is 2.94 persons per family, with married-couple families (4,990 | 86.9%) accounting for the largest median family size of 2.96 persons per family. On the other hand, single male/father families (276 | 4.8%) represent the smallest median family size with 2.71 persons per family.
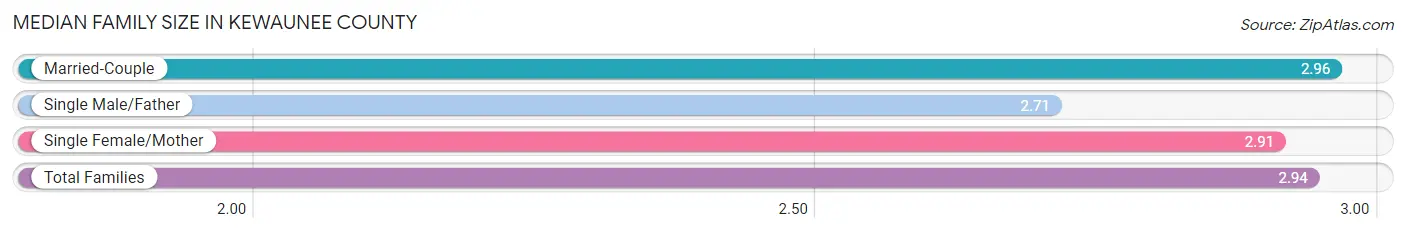
| Family Type | # Families | Family Size |
| Married-Couple | 4,990 (86.9%) | 2.96 |
| Single Male/Father | 276 (4.8%) | 2.71 |
| Single Female/Mother | 474 (8.3%) | 2.91 |
| Total Families | 5,740 (100.0%) | 2.94 |
Median Household Size in Kewaunee County
The median household size in Kewaunee County is 2.47 persons per household, with single female/mother households (474 | 5.8%) accounting for the largest median household size of 3.17 persons per household. non-family households (2,507 | 30.4%) represent the smallest median household size with 1.23 persons per household.
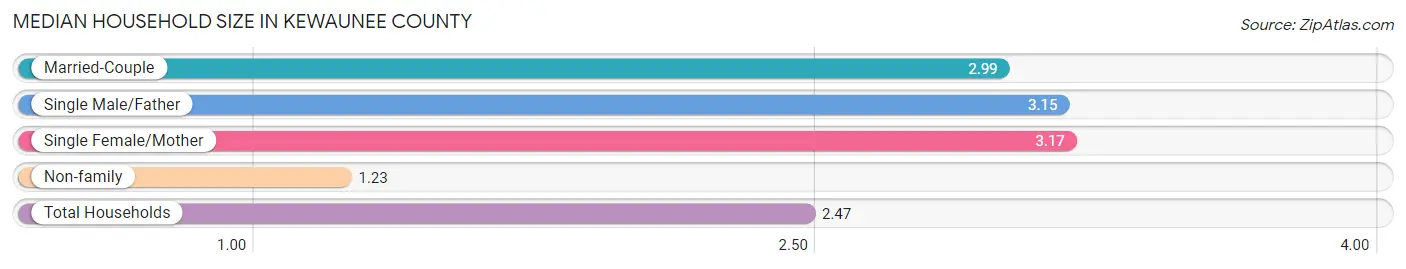
| Household Type | # Households | Household Size |
| Married-Couple | 4,990 (60.5%) | 2.99 |
| Single Male/Father | 276 (3.4%) | 3.15 |
| Single Female/Mother | 474 (5.8%) | 3.17 |
| Non-family | 2,507 (30.4%) | 1.23 |
| Total Households | 8,247 (100.0%) | 2.47 |
Household Size by Marriage Status in Kewaunee County
Out of a total of 8,247 households in Kewaunee County, 5,740 (69.6%) are family households, while 2,507 (30.4%) are nonfamily households. The most numerous type of family households are 2-person households, comprising 2,881, and the most common type of nonfamily households are 1-person households, comprising 2,139.
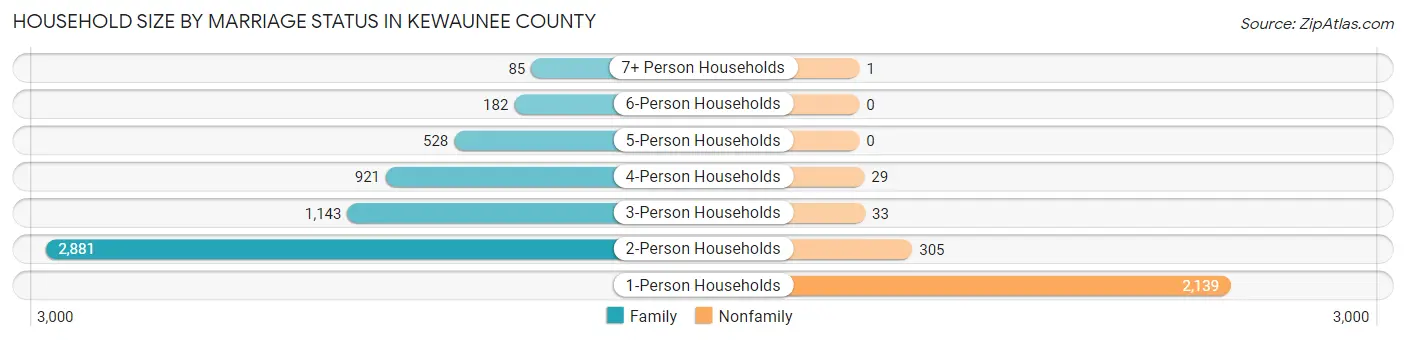
| Household Size | Family Households | Nonfamily Households |
| 1-Person Households | - | 2,139 (25.9%) |
| 2-Person Households | 2,881 (34.9%) | 305 (3.7%) |
| 3-Person Households | 1,143 (13.9%) | 33 (0.4%) |
| 4-Person Households | 921 (11.2%) | 29 (0.4%) |
| 5-Person Households | 528 (6.4%) | 0 (0.0%) |
| 6-Person Households | 182 (2.2%) | 0 (0.0%) |
| 7+ Person Households | 85 (1.0%) | 1 (0.0%) |
| Total | 5,740 (69.6%) | 2,507 (30.4%) |
Female Fertility in Kewaunee County
Fertility by Age in Kewaunee County
Average fertility rate in Kewaunee County is 62.0 births per 1,000 women. Women in the age bracket of 20 to 34 years have the highest fertility rate with 140.0 births per 1,000 women. Women in the age bracket of 20 to 34 years acount for 85.6% of all women with births.
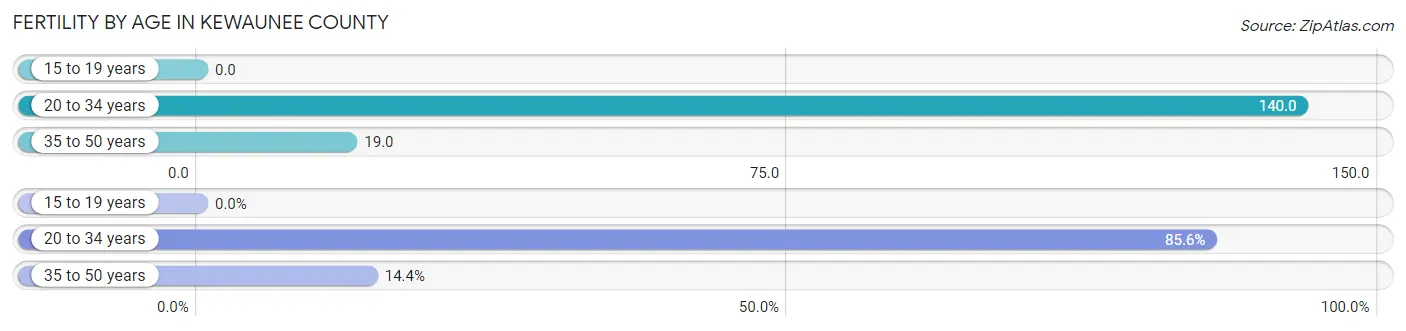
| Age Bracket | Women with Births | Births / 1,000 Women |
| 15 to 19 years | 0 (0.0%) | 0.0 |
| 20 to 34 years | 208 (85.6%) | 140.0 |
| 35 to 50 years | 35 (14.4%) | 19.0 |
| Total | 243 (100.0%) | 62.0 |
Fertility by Age by Marriage Status in Kewaunee County
83.5% of women with births (243) in Kewaunee County are married. The highest percentage of unmarried women with births falls into 20 to 34 years age bracket with 19.2% of them unmarried at the time of birth, while the lowest percentage of unmarried women with births belong to 35 to 50 years age bracket with 0.0% of them unmarried.
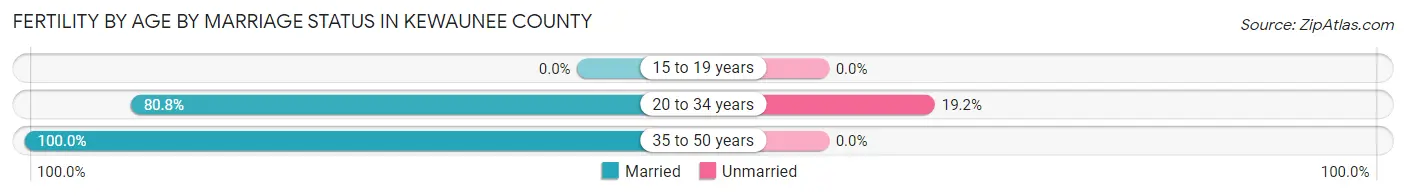
| Age Bracket | Married | Unmarried |
| 15 to 19 years | 0 (0.0%) | 0 (0.0%) |
| 20 to 34 years | 168 (80.8%) | 40 (19.2%) |
| 35 to 50 years | 35 (100.0%) | 0 (0.0%) |
| Total | 203 (83.5%) | 40 (16.5%) |
Fertility by Education in Kewaunee County
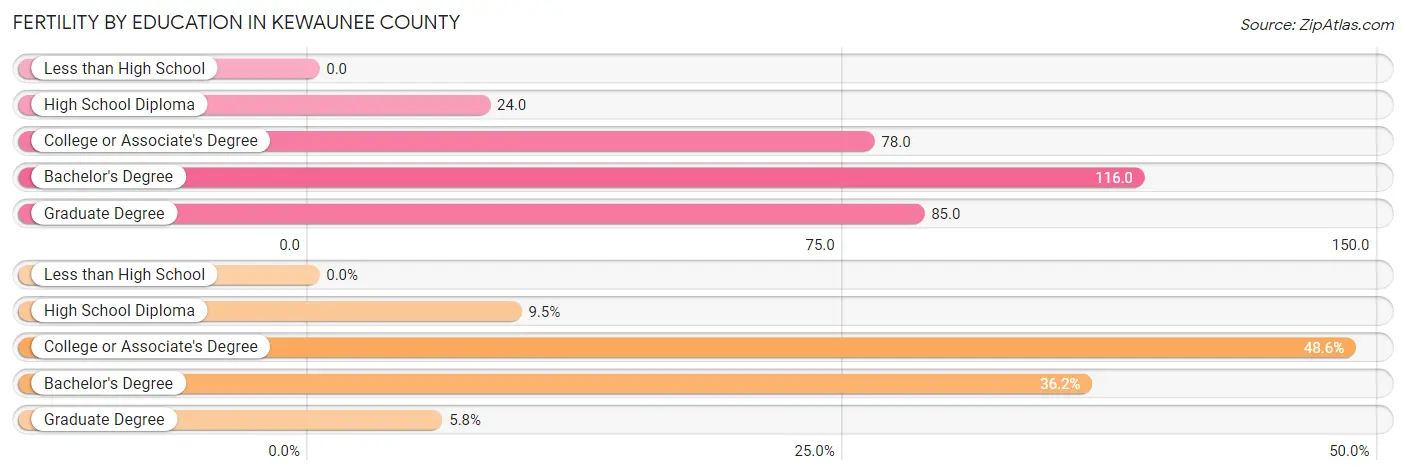
| Educational Attainment | Women with Births | Births / 1,000 Women |
| Less than High School | 0 (0.0%) | 0.0 |
| High School Diploma | 23 (9.5%) | 24.0 |
| College or Associate's Degree | 118 (48.6%) | 78.0 |
| Bachelor's Degree | 88 (36.2%) | 116.0 |
| Graduate Degree | 14 (5.8%) | 85.0 |
| Total | 243 (100.0%) | 62.0 |
Fertility by Education by Marriage Status in Kewaunee County
16.5% of women with births in Kewaunee County are unmarried. Women with the educational attainment of bachelor's degree are most likely to be married with 100.0% of them married at childbirth, while women with the educational attainment of high school diploma are least likely to be married with 39.1% of them unmarried at childbirth.
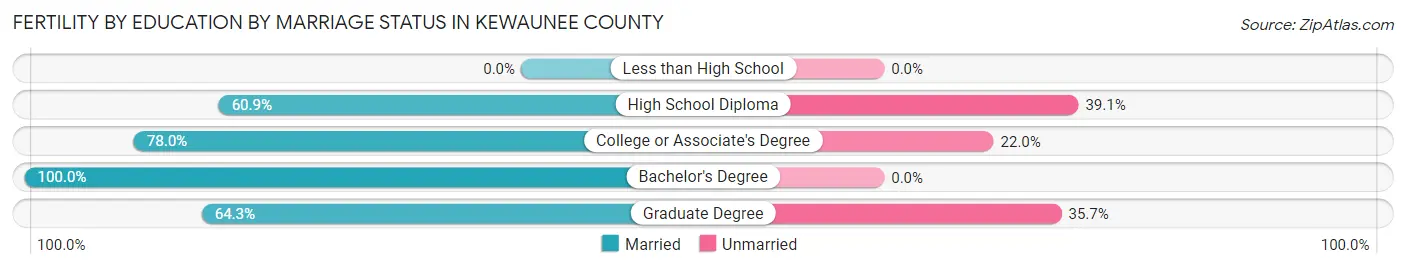
| Educational Attainment | Married | Unmarried |
| Less than High School | 0 (0.0%) | 0 (0.0%) |
| High School Diploma | 14 (60.9%) | 9 (39.1%) |
| College or Associate's Degree | 92 (78.0%) | 26 (22.0%) |
| Bachelor's Degree | 88 (100.0%) | 0 (0.0%) |
| Graduate Degree | 9 (64.3%) | 5 (35.7%) |
| Total | 203 (83.5%) | 40 (16.5%) |
Income in Kewaunee County
Income Overview in Kewaunee County
Per Capita Income in Kewaunee County is $38,012, while median incomes of families and households are $92,088 and $77,610 respectively.
| Characteristic | Number | Measure |
| Per Capita Income | 20,570 | $38,012 |
| Median Family Income | 5,740 | $92,088 |
| Mean Family Income | 5,740 | $106,313 |
| Median Household Income | 8,247 | $77,610 |
| Mean Household Income | 8,247 | $91,551 |
| Income Deficit | 5,740 | $10,309 |
| Wage / Income Gap (%) | 20,570 | 33.89% |
| Wage / Income Gap ($) | 20,570 | 66.11¢ per $1 |
| Gini / Inequality Index | 20,570 | 0.39 |
Earnings by Sex in Kewaunee County
Average Earnings in Kewaunee County are $42,281, $50,788 for men and $33,575 for women, a difference of 33.9%.
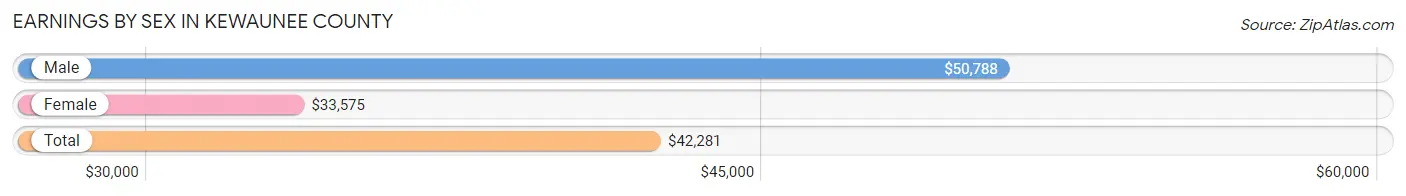
| Sex | Number | Average Earnings |
| Male | 6,175 (52.7%) | $50,788 |
| Female | 5,536 (47.3%) | $33,575 |
| Total | 11,711 (100.0%) | $42,281 |
Earnings by Sex by Income Bracket in Kewaunee County
The most common earnings brackets in Kewaunee County are $75,000 to $99,999 for men (762 | 12.3%) and $55,000 to $64,999 for women (451 | 8.2%).
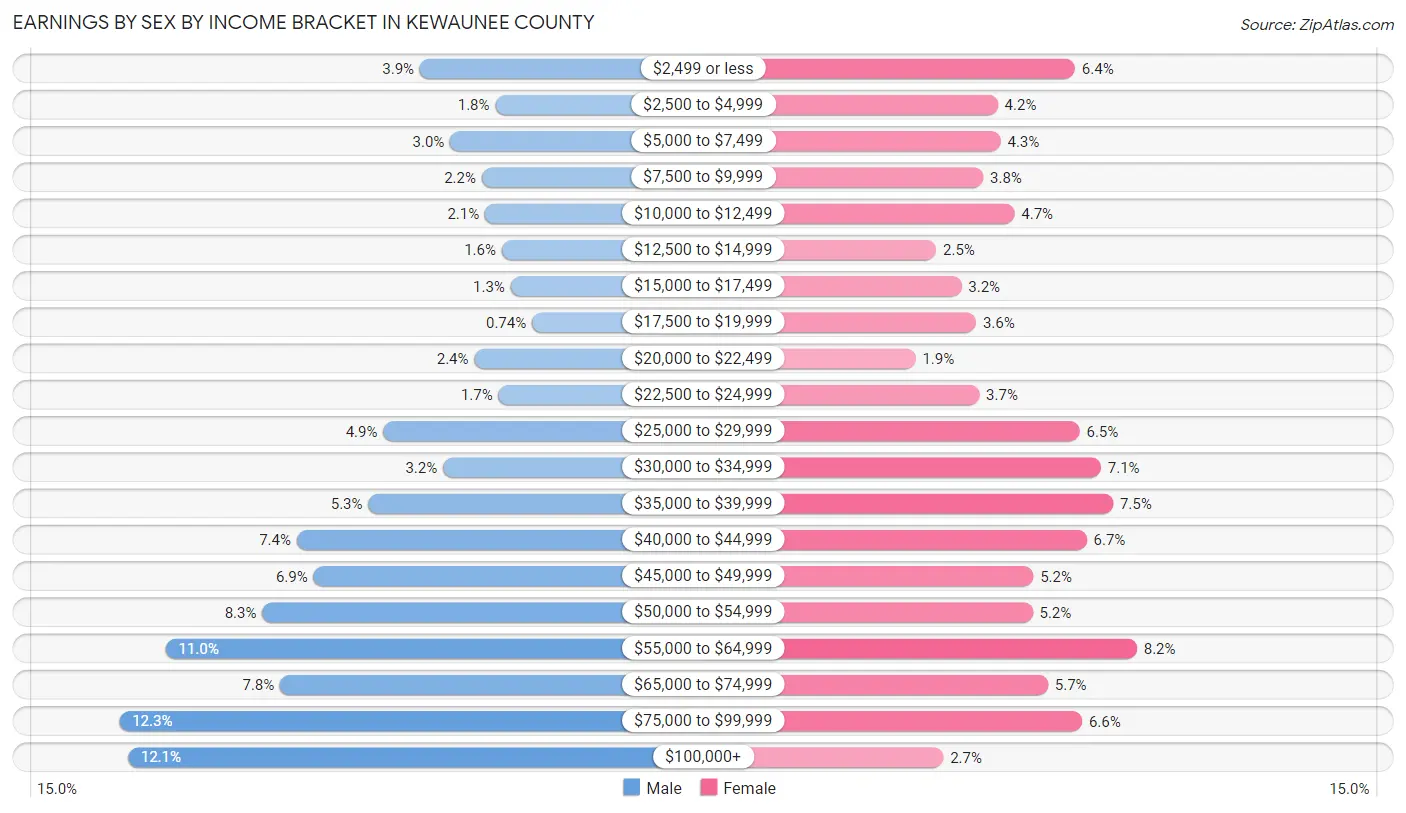
| Income | Male | Female |
| $2,499 or less | 240 (3.9%) | 355 (6.4%) |
| $2,500 to $4,999 | 109 (1.8%) | 235 (4.2%) |
| $5,000 to $7,499 | 188 (3.0%) | 239 (4.3%) |
| $7,500 to $9,999 | 133 (2.1%) | 212 (3.8%) |
| $10,000 to $12,499 | 127 (2.1%) | 261 (4.7%) |
| $12,500 to $14,999 | 98 (1.6%) | 139 (2.5%) |
| $15,000 to $17,499 | 83 (1.3%) | 178 (3.2%) |
| $17,500 to $19,999 | 46 (0.7%) | 201 (3.6%) |
| $20,000 to $22,499 | 146 (2.4%) | 107 (1.9%) |
| $22,500 to $24,999 | 104 (1.7%) | 206 (3.7%) |
| $25,000 to $29,999 | 304 (4.9%) | 362 (6.5%) |
| $30,000 to $34,999 | 200 (3.2%) | 395 (7.1%) |
| $35,000 to $39,999 | 330 (5.3%) | 414 (7.5%) |
| $40,000 to $44,999 | 454 (7.3%) | 373 (6.7%) |
| $45,000 to $49,999 | 425 (6.9%) | 290 (5.2%) |
| $50,000 to $54,999 | 514 (8.3%) | 289 (5.2%) |
| $55,000 to $64,999 | 682 (11.0%) | 451 (8.2%) |
| $65,000 to $74,999 | 483 (7.8%) | 313 (5.7%) |
| $75,000 to $99,999 | 762 (12.3%) | 366 (6.6%) |
| $100,000+ | 747 (12.1%) | 150 (2.7%) |
| Total | 6,175 (100.0%) | 5,536 (100.0%) |
Earnings by Sex by Educational Attainment in Kewaunee County
Average earnings in Kewaunee County are $54,574 for men and $37,337 for women, a difference of 31.6%. Men with an educational attainment of bachelor's degree enjoy the highest average annual earnings of $76,677, while those with less than high school education earn the least with $41,125. Women with an educational attainment of graduate degree earn the most with the average annual earnings of $65,208, while those with high school diploma education have the smallest earnings of $32,062.
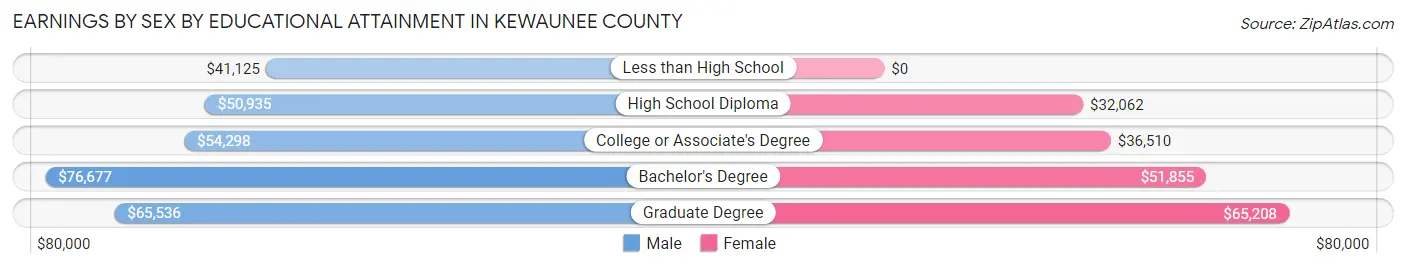
| Educational Attainment | Male Income | Female Income |
| Less than High School | $41,125 | $0 |
| High School Diploma | $50,935 | $32,062 |
| College or Associate's Degree | $54,298 | $36,510 |
| Bachelor's Degree | $76,677 | $51,855 |
| Graduate Degree | $65,536 | $65,208 |
| Total | $54,574 | $37,337 |
Family Income in Kewaunee County
Family Income Brackets in Kewaunee County
According to the Kewaunee County family income data, there are 1,533 families falling into the $100,000 to $149,999 income range, which is the most common income bracket and makes up 26.7% of all families. Conversely, the $10,000 to $14,999 income bracket is the least frequent group with only 69 families (1.2%) belonging to this category.
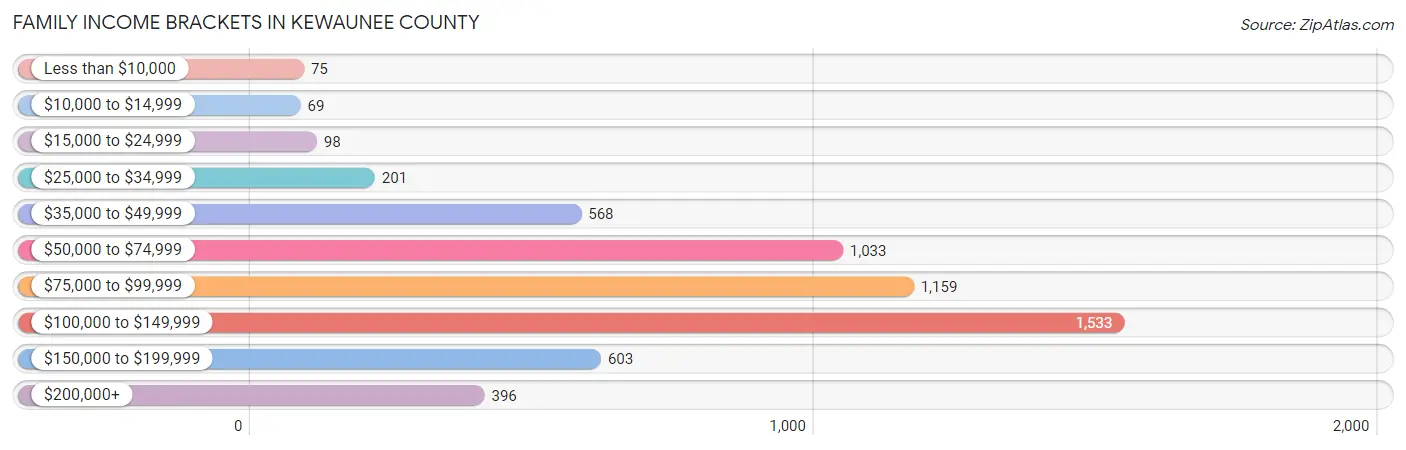
| Income Bracket | # Families | % Families |
| Less than $10,000 | 75 | 1.3% |
| $10,000 to $14,999 | 69 | 1.2% |
| $15,000 to $24,999 | 98 | 1.7% |
| $25,000 to $34,999 | 201 | 3.5% |
| $35,000 to $49,999 | 568 | 9.9% |
| $50,000 to $74,999 | 1,033 | 18.0% |
| $75,000 to $99,999 | 1,159 | 20.2% |
| $100,000 to $149,999 | 1,533 | 26.7% |
| $150,000 to $199,999 | 603 | 10.5% |
| $200,000+ | 396 | 6.9% |
Family Income by Famaliy Size in Kewaunee County
5-person families (475 | 8.3%) account for the highest median family income in Kewaunee County with $127,202 per family, while 2-person families (3,033 | 52.8%) have the highest median income of $40,203 per family member.
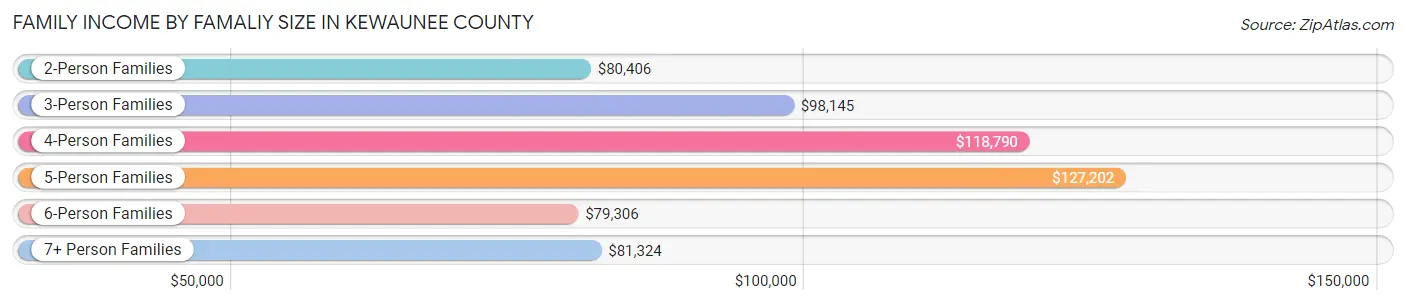
| Income Bracket | # Families | Median Income |
| 2-Person Families | 3,033 (52.8%) | $80,406 |
| 3-Person Families | 1,114 (19.4%) | $98,145 |
| 4-Person Families | 924 (16.1%) | $118,790 |
| 5-Person Families | 475 (8.3%) | $127,202 |
| 6-Person Families | 110 (1.9%) | $79,306 |
| 7+ Person Families | 84 (1.5%) | $81,324 |
| Total | 5,740 (100.0%) | $92,088 |
Family Income by Number of Earners in Kewaunee County
The median family income in Kewaunee County is $92,088, with families comprising 3+ earners (786) having the highest median family income of $139,000, while families with no earners (800) have the lowest median family income of $53,667, accounting for 13.7% and 13.9% of families, respectively.
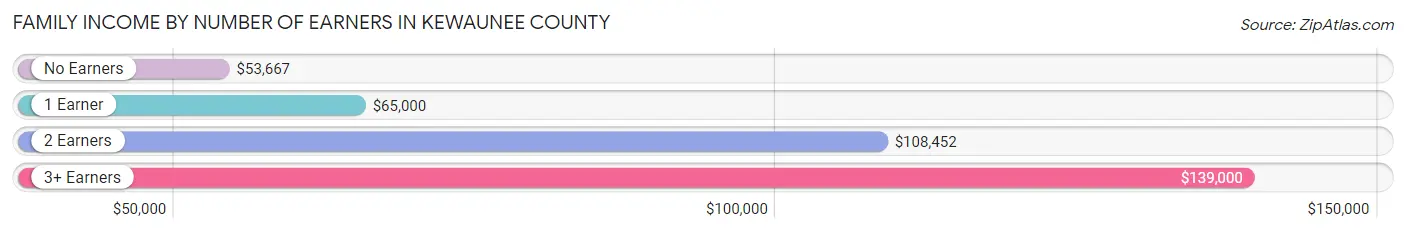
| Number of Earners | # Families | Median Income |
| No Earners | 800 (13.9%) | $53,667 |
| 1 Earner | 1,514 (26.4%) | $65,000 |
| 2 Earners | 2,640 (46.0%) | $108,452 |
| 3+ Earners | 786 (13.7%) | $139,000 |
| Total | 5,740 (100.0%) | $92,088 |
Household Income in Kewaunee County
Household Income Brackets in Kewaunee County
With 1,748 households falling in the category, the $100,000 to $149,999 income range is the most frequent in Kewaunee County, accounting for 21.2% of all households. In contrast, only 231 households (2.8%) fall into the $10,000 to $14,999 income bracket, making it the least populous group.
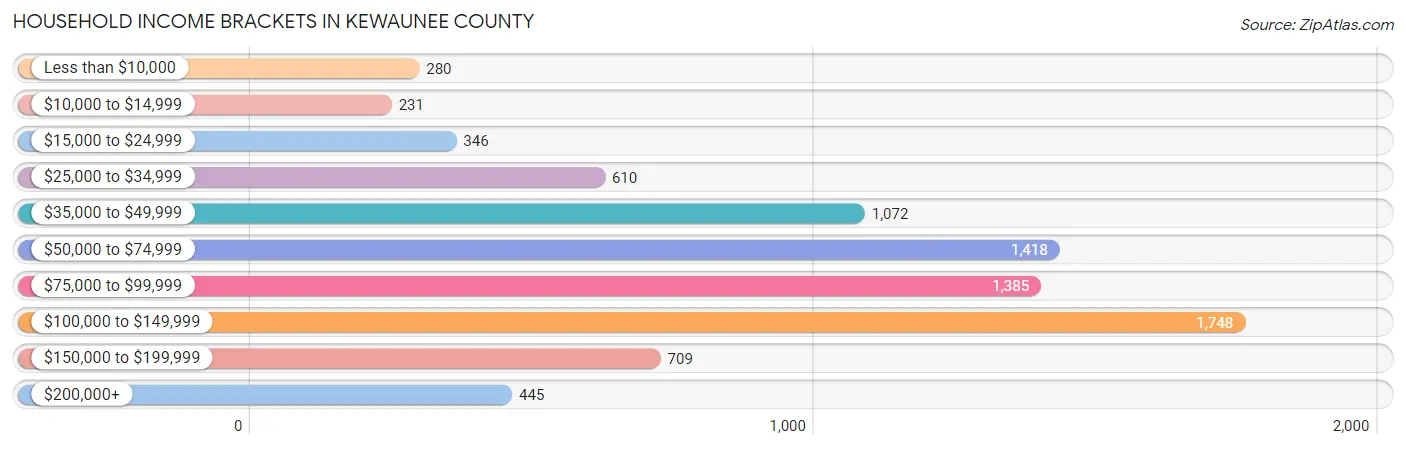
| Income Bracket | # Households | % Households |
| Less than $10,000 | 280 | 3.4% |
| $10,000 to $14,999 | 231 | 2.8% |
| $15,000 to $24,999 | 346 | 4.2% |
| $25,000 to $34,999 | 610 | 7.4% |
| $35,000 to $49,999 | 1,072 | 13.0% |
| $50,000 to $74,999 | 1,418 | 17.2% |
| $75,000 to $99,999 | 1,385 | 16.8% |
| $100,000 to $149,999 | 1,748 | 21.2% |
| $150,000 to $199,999 | 709 | 8.6% |
| $200,000+ | 445 | 5.4% |
Household Income by Householder Age in Kewaunee County
The median household income in Kewaunee County is $77,610, with the highest median household income of $96,603 found in the 25 to 44 years age bracket for the primary householder. A total of 2,134 households (25.9%) fall into this category. Meanwhile, the 15 to 24 years age bracket for the primary householder has the lowest median household income of $47,292, with 179 households (2.2%) in this group.
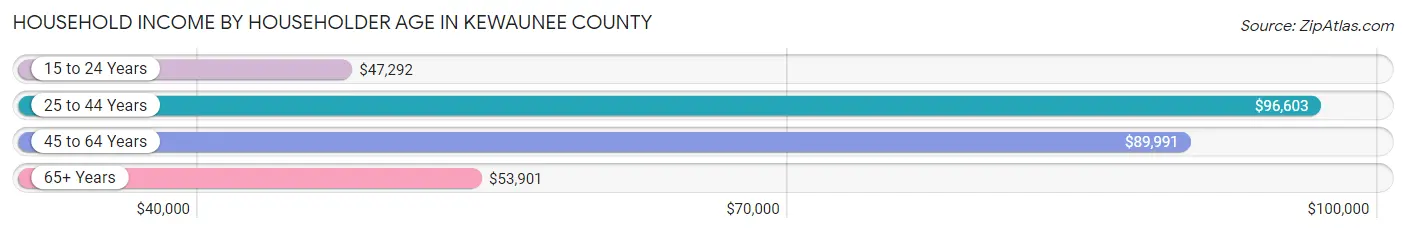
| Income Bracket | # Households | Median Income |
| 15 to 24 Years | 179 (2.2%) | $47,292 |
| 25 to 44 Years | 2,134 (25.9%) | $96,603 |
| 45 to 64 Years | 3,115 (37.8%) | $89,991 |
| 65+ Years | 2,819 (34.2%) | $53,901 |
| Total | 8,247 (100.0%) | $77,610 |
Poverty in Kewaunee County
Income Below Poverty by Sex and Age in Kewaunee County
With 6.1% poverty level for males and 7.4% for females among the residents of Kewaunee County, 15 year old males and 75 year old and over females are the most vulnerable to poverty, with 73 males (48.7%) and 173 females (16.3%) in their respective age groups living below the poverty level.
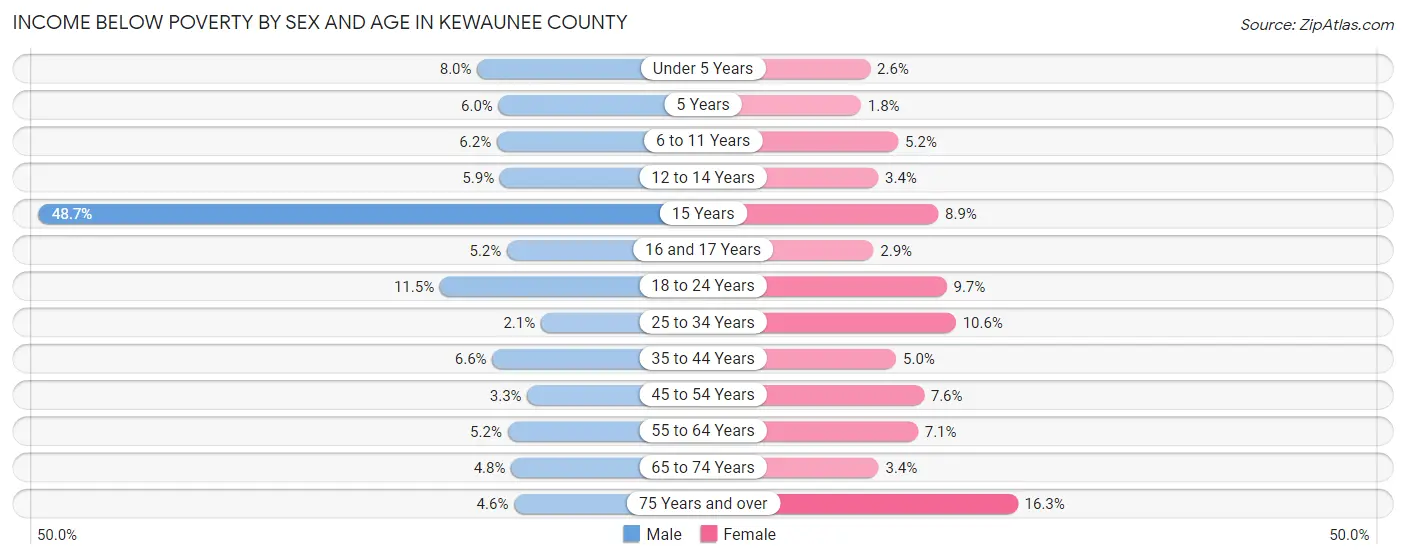
| Age Bracket | Male | Female |
| Under 5 Years | 43 (8.0%) | 13 (2.6%) |
| 5 Years | 6 (6.0%) | 2 (1.8%) |
| 6 to 11 Years | 49 (6.2%) | 38 (5.2%) |
| 12 to 14 Years | 20 (5.9%) | 11 (3.4%) |
| 15 Years | 73 (48.7%) | 16 (8.9%) |
| 16 and 17 Years | 14 (5.2%) | 6 (2.9%) |
| 18 to 24 Years | 97 (11.5%) | 74 (9.7%) |
| 25 to 34 Years | 22 (2.1%) | 102 (10.6%) |
| 35 to 44 Years | 84 (6.6%) | 59 (5.0%) |
| 45 to 54 Years | 45 (3.3%) | 94 (7.6%) |
| 55 to 64 Years | 86 (5.2%) | 108 (7.0%) |
| 65 to 74 Years | 61 (4.8%) | 41 (3.4%) |
| 75 Years and over | 35 (4.6%) | 173 (16.3%) |
| Total | 635 (6.1%) | 737 (7.4%) |
Income Above Poverty by Sex and Age in Kewaunee County
According to the poverty statistics in Kewaunee County, males aged 25 to 34 years and females aged 5 years are the age groups that are most secure financially, with 97.9% of males and 98.2% of females in these age groups living above the poverty line.
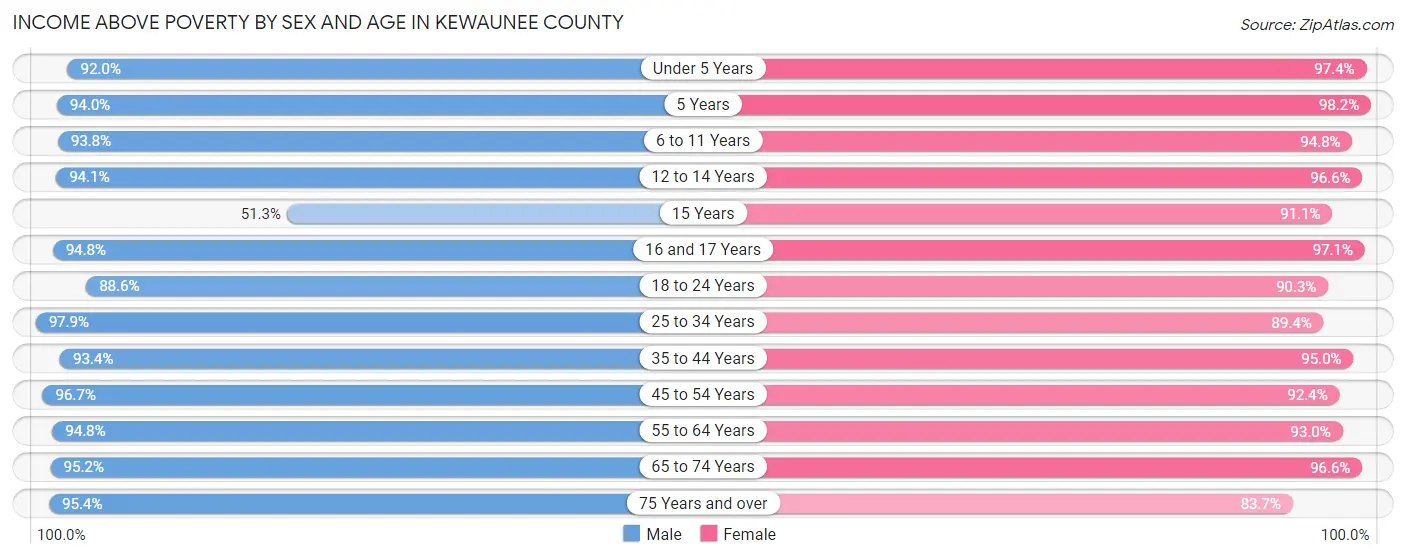
| Age Bracket | Male | Female |
| Under 5 Years | 496 (92.0%) | 482 (97.4%) |
| 5 Years | 94 (94.0%) | 111 (98.2%) |
| 6 to 11 Years | 747 (93.8%) | 688 (94.8%) |
| 12 to 14 Years | 320 (94.1%) | 315 (96.6%) |
| 15 Years | 77 (51.3%) | 163 (91.1%) |
| 16 and 17 Years | 254 (94.8%) | 199 (97.1%) |
| 18 to 24 Years | 750 (88.5%) | 687 (90.3%) |
| 25 to 34 Years | 1,041 (97.9%) | 863 (89.4%) |
| 35 to 44 Years | 1,192 (93.4%) | 1,111 (95.0%) |
| 45 to 54 Years | 1,308 (96.7%) | 1,142 (92.4%) |
| 55 to 64 Years | 1,581 (94.8%) | 1,425 (92.9%) |
| 65 to 74 Years | 1,203 (95.2%) | 1,160 (96.6%) |
| 75 Years and over | 733 (95.4%) | 888 (83.7%) |
| Total | 9,796 (93.9%) | 9,234 (92.6%) |
Income Below Poverty Among Married-Couple Families in Kewaunee County
The poverty statistics for married-couple families in Kewaunee County show that 1.3% or 66 of the total 4,990 families live below the poverty line. Families with 1 or 2 children have the highest poverty rate of 1.6%, comprising of 19 families. On the other hand, families with 5 or more children have the lowest poverty rate of 0.0%, which includes 0 families.
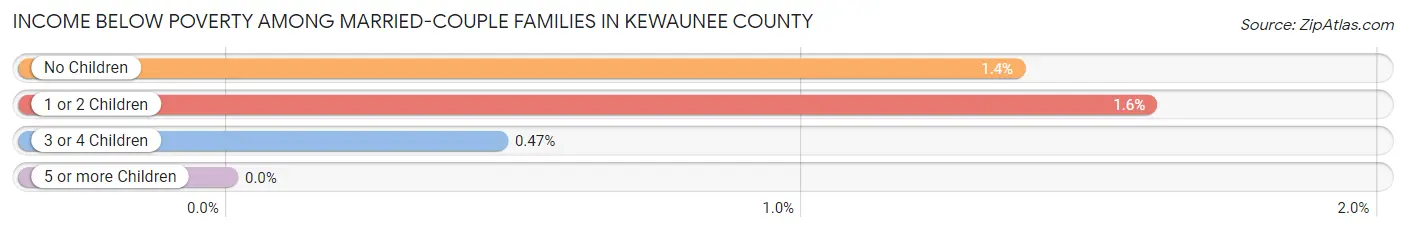
| Children | Above Poverty | Below Poverty |
| No Children | 3,246 (98.6%) | 45 (1.4%) |
| 1 or 2 Children | 1,169 (98.4%) | 19 (1.6%) |
| 3 or 4 Children | 427 (99.5%) | 2 (0.5%) |
| 5 or more Children | 82 (100.0%) | 0 (0.0%) |
| Total | 4,924 (98.7%) | 66 (1.3%) |
Income Below Poverty Among Single-Parent Households in Kewaunee County
According to the poverty data in Kewaunee County, 5.8% or 16 single-father households and 26.8% or 127 single-mother households are living below the poverty line. Among single-father households, those with no children have the highest poverty rate, with 7 households (6.7%) experiencing poverty. Likewise, among single-mother households, those with 3 or 4 children have the highest poverty rate, with 18 households (56.2%) falling below the poverty line.
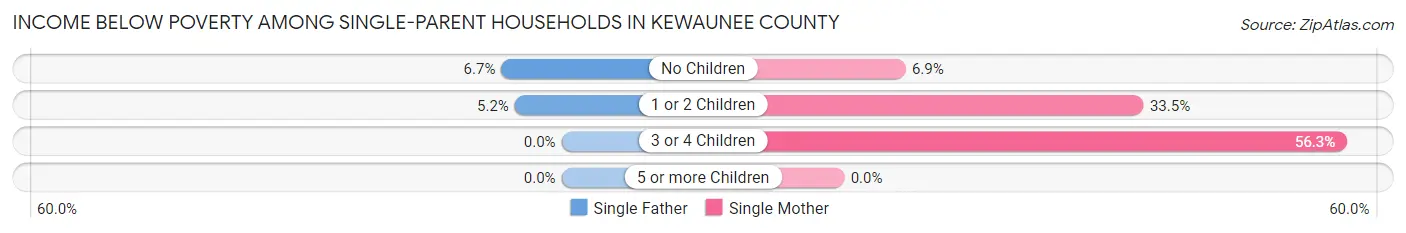
| Children | Single Father | Single Mother |
| No Children | 7 (6.7%) | 10 (6.9%) |
| 1 or 2 Children | 9 (5.2%) | 99 (33.5%) |
| 3 or 4 Children | 0 (0.0%) | 18 (56.2%) |
| 5 or more Children | 0 (0.0%) | 0 (0.0%) |
| Total | 16 (5.8%) | 127 (26.8%) |
Income Below Poverty Among Married-Couple vs Single-Parent Households in Kewaunee County
The poverty data for Kewaunee County shows that 66 of the married-couple family households (1.3%) and 143 of the single-parent households (19.1%) are living below the poverty level. Within the married-couple family households, those with 1 or 2 children have the highest poverty rate, with 19 households (1.6%) falling below the poverty line. Among the single-parent households, those with 3 or 4 children have the highest poverty rate, with 18 household (56.2%) living below poverty.
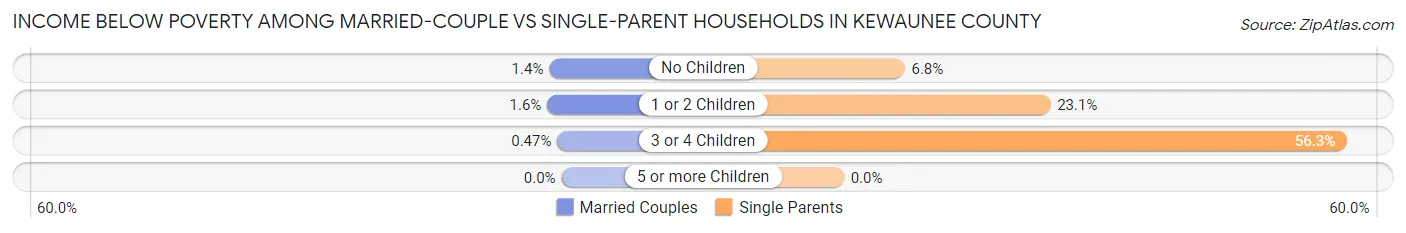
| Children | Married-Couple Families | Single-Parent Households |
| No Children | 45 (1.4%) | 17 (6.8%) |
| 1 or 2 Children | 19 (1.6%) | 108 (23.1%) |
| 3 or 4 Children | 2 (0.5%) | 18 (56.2%) |
| 5 or more Children | 0 (0.0%) | 0 (0.0%) |
| Total | 66 (1.3%) | 143 (19.1%) |
Employment Characteristics in Kewaunee County
Employment by Class of Employer in Kewaunee County
Among the 10,700 employed individuals in Kewaunee County, private company employees (7,460 | 69.7%), self-employed (not incorporated) (815 | 7.6%), and local government employees (786 | 7.3%) make up the most common classes of employment.

| Employer Class | # Employees | % Employees |
| Private Company Employees | 7,460 | 69.7% |
| Self-Employed (Incorporated) | 478 | 4.5% |
| Self-Employed (Not Incorporated) | 815 | 7.6% |
| Not-for-profit Organizations | 784 | 7.3% |
| Local Government Employees | 786 | 7.3% |
| State Government Employees | 249 | 2.3% |
| Federal Government Employees | 98 | 0.9% |
| Unpaid Family Workers | 30 | 0.3% |
| Total | 10,700 | 100.0% |
Employment Status by Age in Kewaunee County
According to the labor force statistics for Kewaunee County, out of the total population over 16 years of age (16,749), 66.0% or 11,054 individuals are in the labor force, with 2.0% or 221 of them unemployed. The age group with the highest labor force participation rate is 45 to 54 years, with 91.0% or 2,362 individuals in the labor force. Within the labor force, the 75 years and over age range has the highest percentage of unemployed individuals, with 8.6% or 14 of them being unemployed.
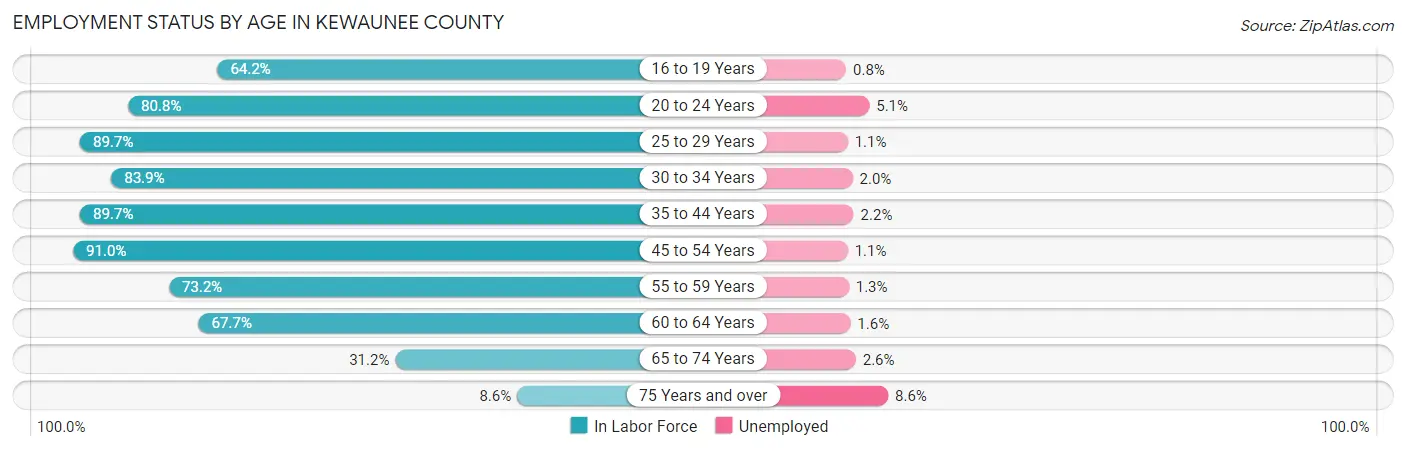
| Age Bracket | In Labor Force | Unemployed |
| 16 to 19 Years | 611 (64.2%) | 5 (0.8%) |
| 20 to 24 Years | 915 (80.8%) | 47 (5.1%) |
| 25 to 29 Years | 878 (89.7%) | 10 (1.1%) |
| 30 to 34 Years | 886 (83.9%) | 18 (2.0%) |
| 35 to 44 Years | 2,199 (89.7%) | 48 (2.2%) |
| 45 to 54 Years | 2,362 (91.0%) | 26 (1.1%) |
| 55 to 59 Years | 1,193 (73.2%) | 16 (1.3%) |
| 60 to 64 Years | 1,072 (67.7%) | 17 (1.6%) |
| 65 to 74 Years | 774 (31.2%) | 20 (2.6%) |
| 75 Years and over | 162 (8.6%) | 14 (8.6%) |
| Total | 11,054 (66.0%) | 221 (2.0%) |
Employment Status by Educational Attainment in Kewaunee County
According to labor force statistics for Kewaunee County, 83.4% of individuals (8,587) out of the total population between 25 and 64 years of age (10,296) are in the labor force, with 1.6% or 137 of them being unemployed. The group with the highest labor force participation rate are those with the educational attainment of bachelor's degree or higher, with 89.4% or 1,989 individuals in the labor force. Within the labor force, individuals with less than high school education have the highest percentage of unemployment, with 5.4% or 14 of them being unemployed.
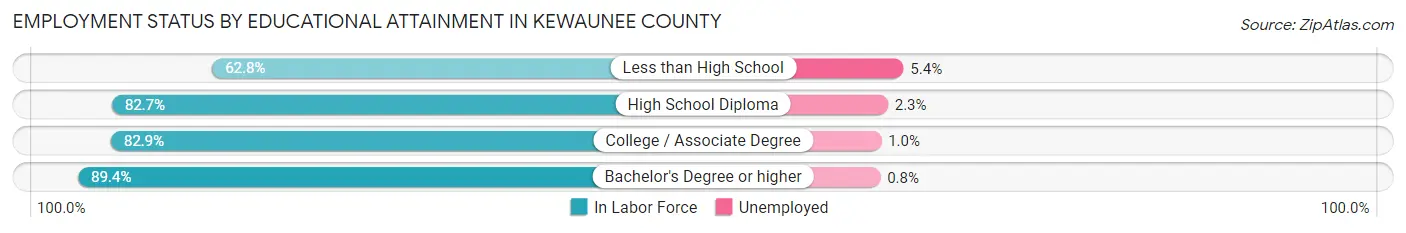
| Educational Attainment | In Labor Force | Unemployed |
| Less than High School | 257 (62.8%) | 22 (5.4%) |
| High School Diploma | 3,033 (82.7%) | 84 (2.3%) |
| College / Associate Degree | 3,311 (82.9%) | 40 (1.0%) |
| Bachelor's Degree or higher | 1,989 (89.4%) | 18 (0.8%) |
| Total | 8,587 (83.4%) | 165 (1.6%) |
Employment Occupations by Sex in Kewaunee County
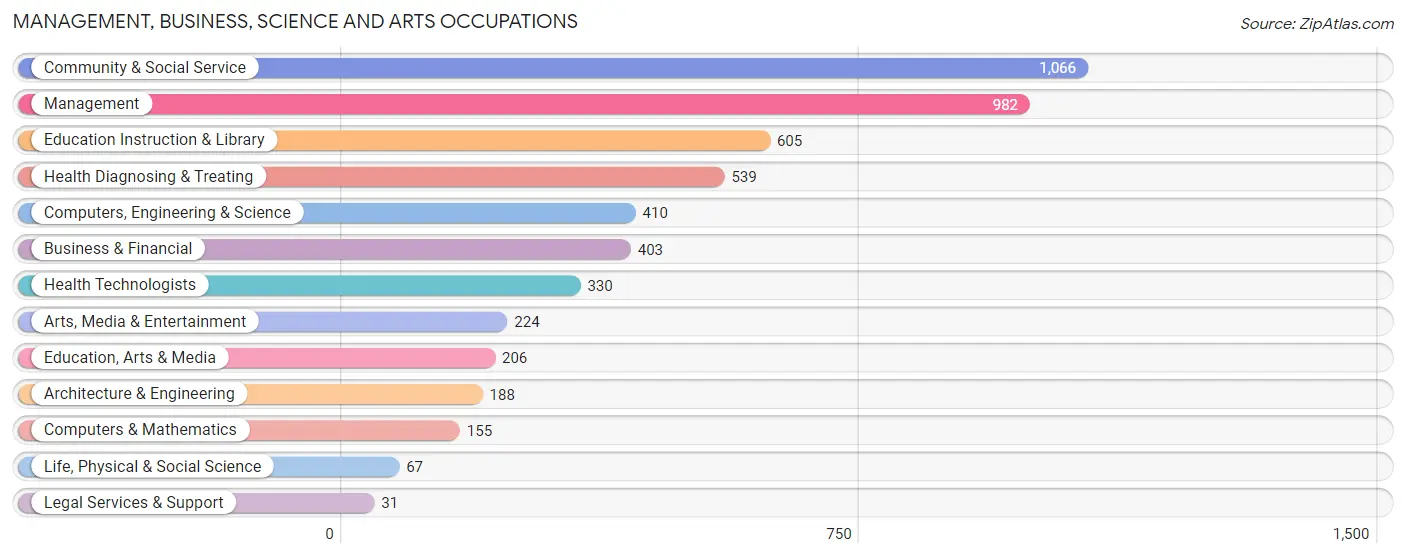
Management, Business, Science and Arts Occupations
The most common Management, Business, Science and Arts occupations in Kewaunee County are Community & Social Service (1,066 | 9.8%), Management (982 | 9.1%), Education Instruction & Library (605 | 5.6%), Health Diagnosing & Treating (539 | 5.0%), and Computers, Engineering & Science (410 | 3.8%).
Management, Business, Science and Arts Occupations by Sex
Within the Management, Business, Science and Arts occupations in Kewaunee County, the most male-oriented occupations are Architecture & Engineering (92.0%), Computers, Engineering & Science (64.1%), and Management (60.8%), while the most female-oriented occupations are Health Diagnosing & Treating (85.7%), Education Instruction & Library (82.6%), and Health Technologists (82.4%).
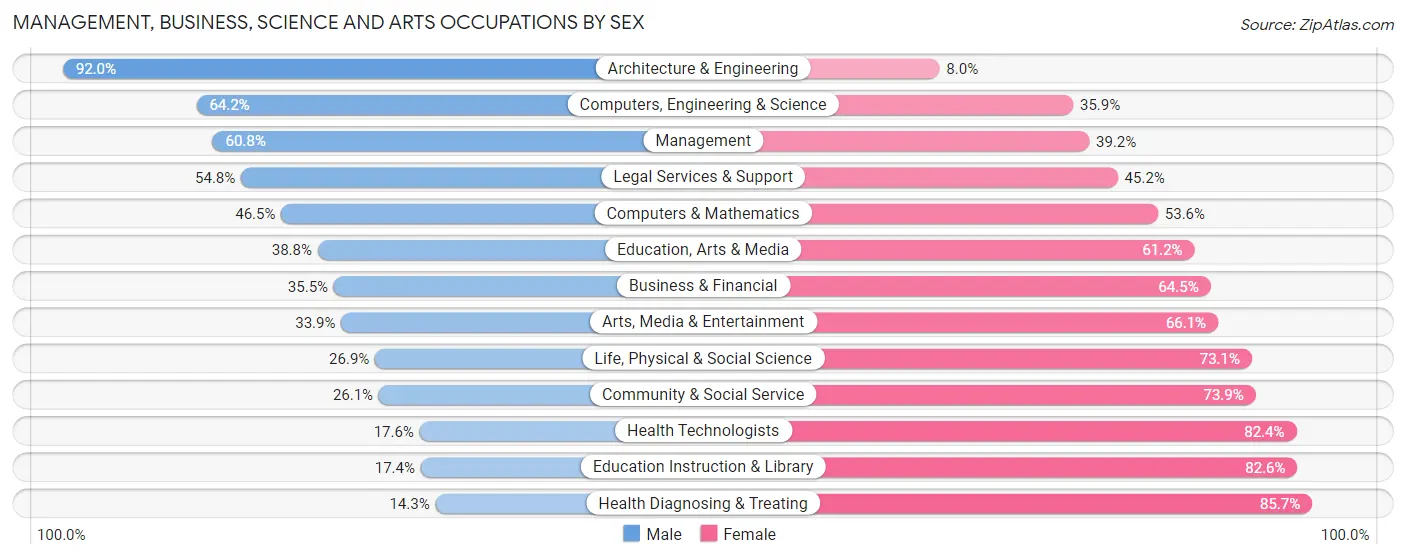
| Occupation | Male | Female |
| Management | 597 (60.8%) | 385 (39.2%) |
| Business & Financial | 143 (35.5%) | 260 (64.5%) |
| Computers, Engineering & Science | 263 (64.1%) | 147 (35.8%) |
| Computers & Mathematics | 72 (46.5%) | 83 (53.5%) |
| Architecture & Engineering | 173 (92.0%) | 15 (8.0%) |
| Life, Physical & Social Science | 18 (26.9%) | 49 (73.1%) |
| Community & Social Service | 278 (26.1%) | 788 (73.9%) |
| Education, Arts & Media | 80 (38.8%) | 126 (61.2%) |
| Legal Services & Support | 17 (54.8%) | 14 (45.2%) |
| Education Instruction & Library | 105 (17.4%) | 500 (82.6%) |
| Arts, Media & Entertainment | 76 (33.9%) | 148 (66.1%) |
| Health Diagnosing & Treating | 77 (14.3%) | 462 (85.7%) |
| Health Technologists | 58 (17.6%) | 272 (82.4%) |
| Total (Category) | 1,358 (39.9%) | 2,042 (60.1%) |
| Total (Overall) | 5,785 (53.4%) | 5,050 (46.6%) |
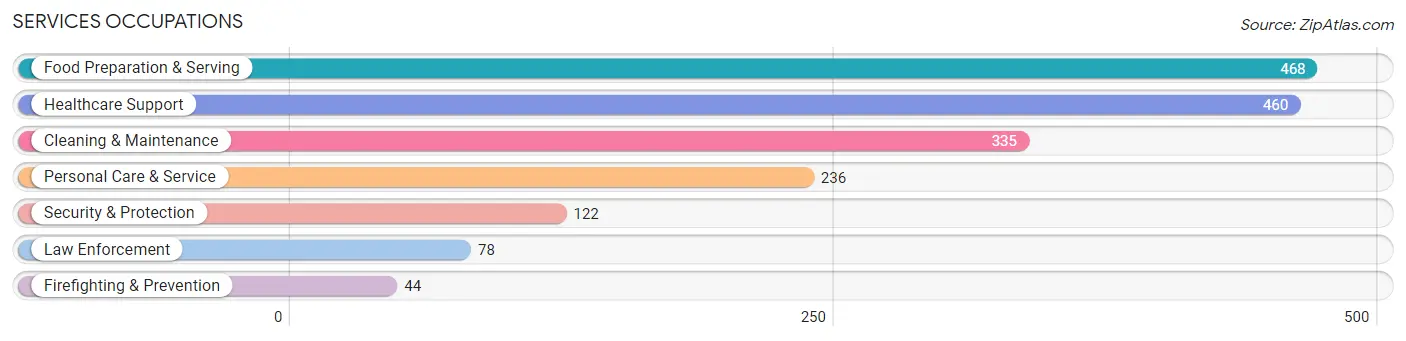
Services Occupations
The most common Services occupations in Kewaunee County are Food Preparation & Serving (468 | 4.3%), Healthcare Support (460 | 4.3%), Cleaning & Maintenance (335 | 3.1%), Personal Care & Service (236 | 2.2%), and Security & Protection (122 | 1.1%).
Services Occupations by Sex
Within the Services occupations in Kewaunee County, the most male-oriented occupations are Law Enforcement (89.7%), Security & Protection (77.0%), and Cleaning & Maintenance (58.8%), while the most female-oriented occupations are Healthcare Support (89.8%), Personal Care & Service (83.9%), and Food Preparation & Serving (68.6%).
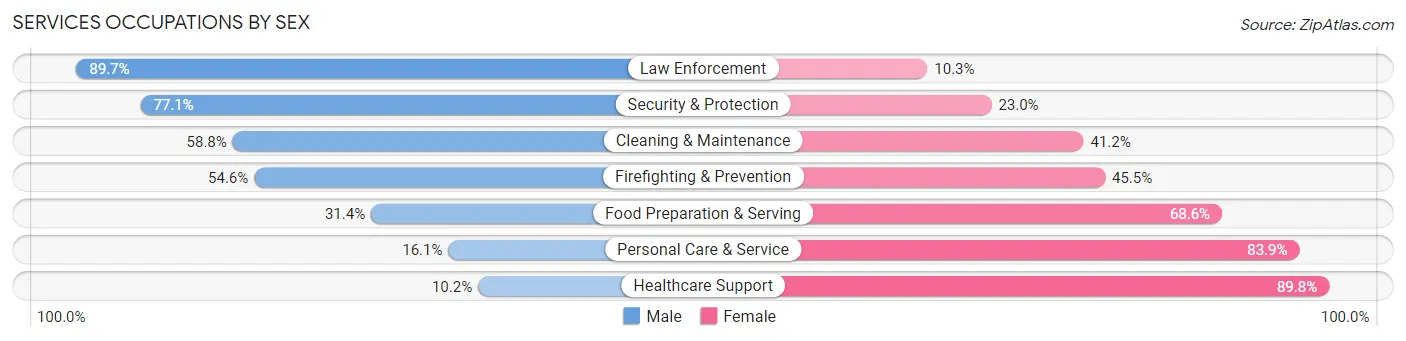
| Occupation | Male | Female |
| Healthcare Support | 47 (10.2%) | 413 (89.8%) |
| Security & Protection | 94 (77.0%) | 28 (23.0%) |
| Firefighting & Prevention | 24 (54.5%) | 20 (45.5%) |
| Law Enforcement | 70 (89.7%) | 8 (10.3%) |
| Food Preparation & Serving | 147 (31.4%) | 321 (68.6%) |
| Cleaning & Maintenance | 197 (58.8%) | 138 (41.2%) |
| Personal Care & Service | 38 (16.1%) | 198 (83.9%) |
| Total (Category) | 523 (32.3%) | 1,098 (67.7%) |
| Total (Overall) | 5,785 (53.4%) | 5,050 (46.6%) |
Sales and Office Occupations
The most common Sales and Office occupations in Kewaunee County are Office & Administration (1,102 | 10.2%), and Sales & Related (687 | 6.3%).

Sales and Office Occupations by Sex
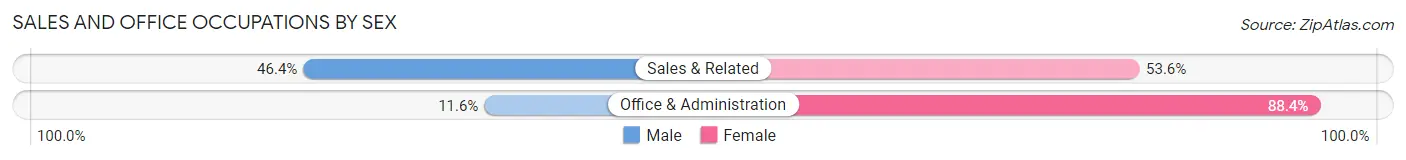
| Occupation | Male | Female |
| Sales & Related | 319 (46.4%) | 368 (53.6%) |
| Office & Administration | 128 (11.6%) | 974 (88.4%) |
| Total (Category) | 447 (25.0%) | 1,342 (75.0%) |
| Total (Overall) | 5,785 (53.4%) | 5,050 (46.6%) |
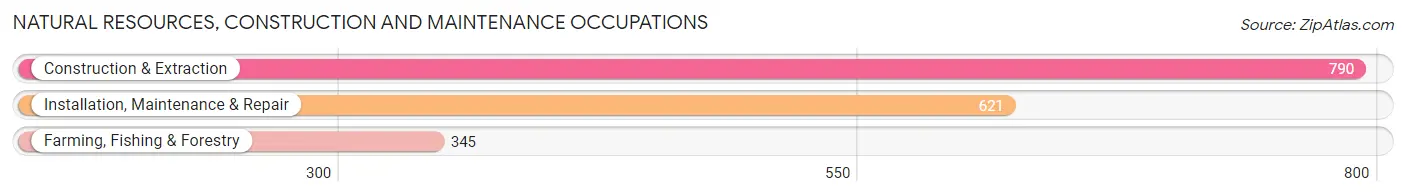
Natural Resources, Construction and Maintenance Occupations
The most common Natural Resources, Construction and Maintenance occupations in Kewaunee County are Construction & Extraction (790 | 7.3%), Installation, Maintenance & Repair (621 | 5.7%), and Farming, Fishing & Forestry (345 | 3.2%).
Natural Resources, Construction and Maintenance Occupations by Sex
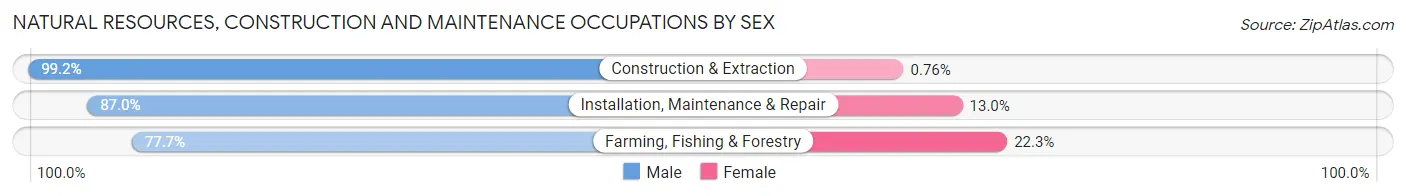
| Occupation | Male | Female |
| Farming, Fishing & Forestry | 268 (77.7%) | 77 (22.3%) |
| Construction & Extraction | 784 (99.2%) | 6 (0.8%) |
| Installation, Maintenance & Repair | 540 (87.0%) | 81 (13.0%) |
| Total (Category) | 1,592 (90.7%) | 164 (9.3%) |
| Total (Overall) | 5,785 (53.4%) | 5,050 (46.6%) |
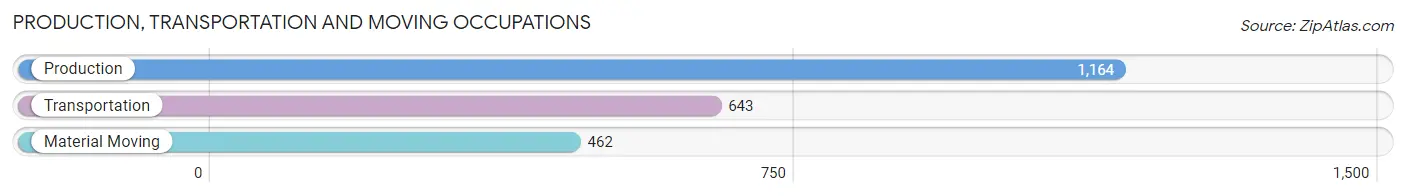
Production, Transportation and Moving Occupations
The most common Production, Transportation and Moving occupations in Kewaunee County are Production (1,164 | 10.7%), Transportation (643 | 5.9%), and Material Moving (462 | 4.3%).
Production, Transportation and Moving Occupations by Sex
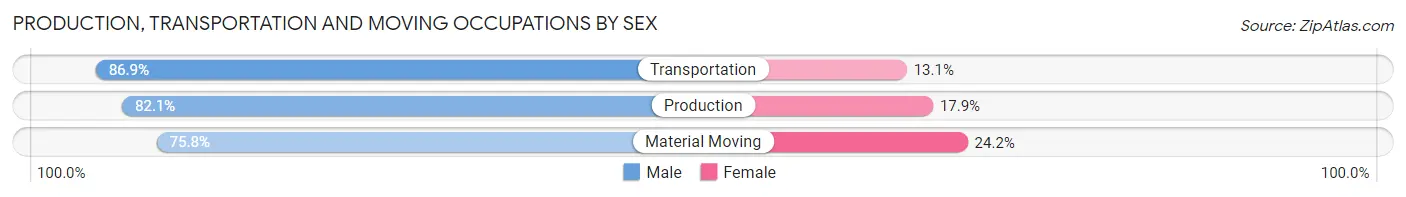
| Occupation | Male | Female |
| Production | 956 (82.1%) | 208 (17.9%) |
| Transportation | 559 (86.9%) | 84 (13.1%) |
| Material Moving | 350 (75.8%) | 112 (24.2%) |
| Total (Category) | 1,865 (82.2%) | 404 (17.8%) |
| Total (Overall) | 5,785 (53.4%) | 5,050 (46.6%) |
Employment Industries by Sex in Kewaunee County
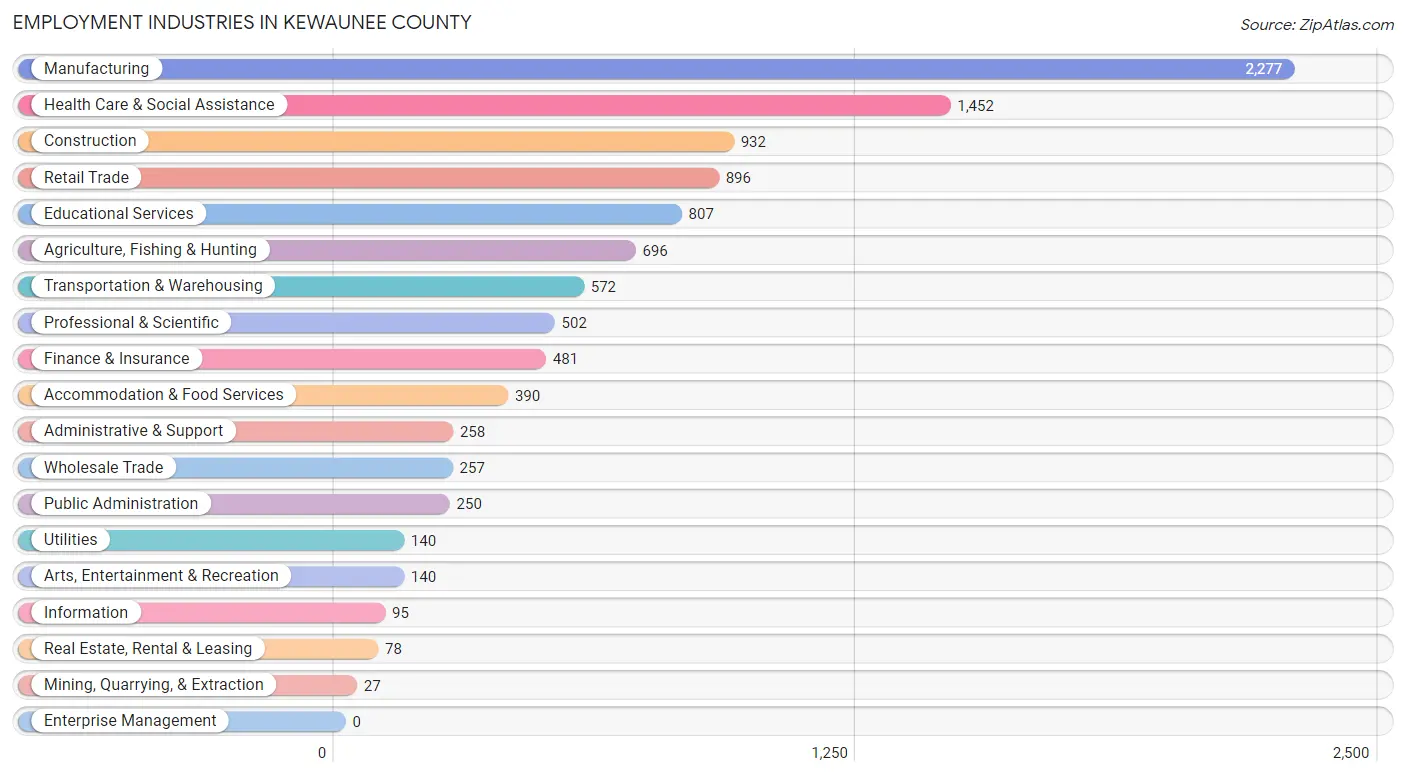
Employment Industries in Kewaunee County
The major employment industries in Kewaunee County include Manufacturing (2,277 | 21.0%), Health Care & Social Assistance (1,452 | 13.4%), Construction (932 | 8.6%), Retail Trade (896 | 8.3%), and Educational Services (807 | 7.4%).
Employment Industries by Sex in Kewaunee County
The Kewaunee County industries that see more men than women are Mining, Quarrying, & Extraction (100.0%), Construction (91.3%), and Agriculture, Fishing & Hunting (79.6%), whereas the industries that tend to have a higher number of women are Health Care & Social Assistance (81.3%), Educational Services (79.2%), and Finance & Insurance (78.2%).
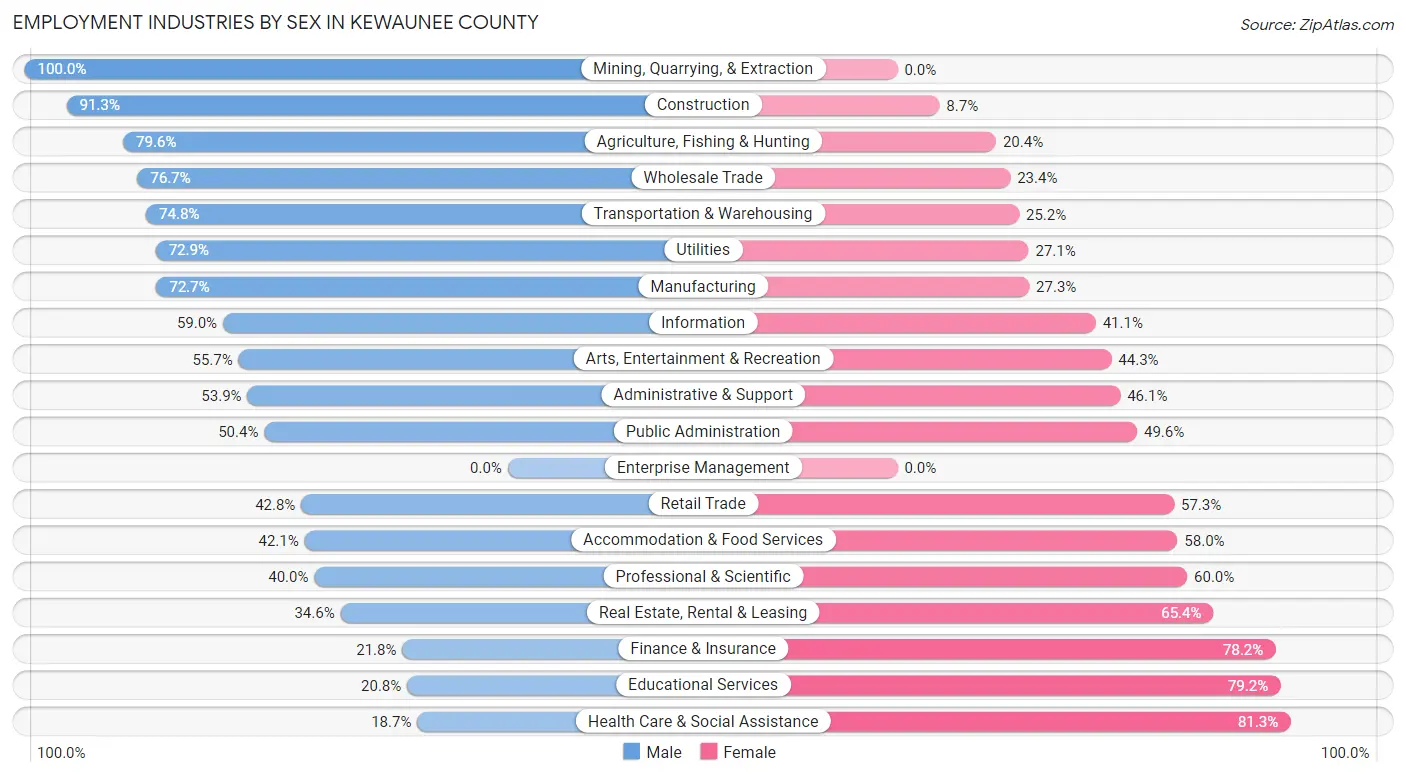
| Industry | Male | Female |
| Agriculture, Fishing & Hunting | 554 (79.6%) | 142 (20.4%) |
| Mining, Quarrying, & Extraction | 27 (100.0%) | 0 (0.0%) |
| Construction | 851 (91.3%) | 81 (8.7%) |
| Manufacturing | 1,656 (72.7%) | 621 (27.3%) |
| Wholesale Trade | 197 (76.6%) | 60 (23.4%) |
| Retail Trade | 383 (42.7%) | 513 (57.3%) |
| Transportation & Warehousing | 428 (74.8%) | 144 (25.2%) |
| Utilities | 102 (72.9%) | 38 (27.1%) |
| Information | 56 (59.0%) | 39 (41.0%) |
| Finance & Insurance | 105 (21.8%) | 376 (78.2%) |
| Real Estate, Rental & Leasing | 27 (34.6%) | 51 (65.4%) |
| Professional & Scientific | 201 (40.0%) | 301 (60.0%) |
| Enterprise Management | 0 (0.0%) | 0 (0.0%) |
| Administrative & Support | 139 (53.9%) | 119 (46.1%) |
| Educational Services | 168 (20.8%) | 639 (79.2%) |
| Health Care & Social Assistance | 272 (18.7%) | 1,180 (81.3%) |
| Arts, Entertainment & Recreation | 78 (55.7%) | 62 (44.3%) |
| Accommodation & Food Services | 164 (42.0%) | 226 (58.0%) |
| Public Administration | 126 (50.4%) | 124 (49.6%) |
| Total | 5,785 (53.4%) | 5,050 (46.6%) |
Education in Kewaunee County
School Enrollment in Kewaunee County
The most common levels of schooling among the 4,391 students in Kewaunee County are high school (1,163 | 26.5%), elementary school (1,016 | 23.1%), and middle school (934 | 21.3%).
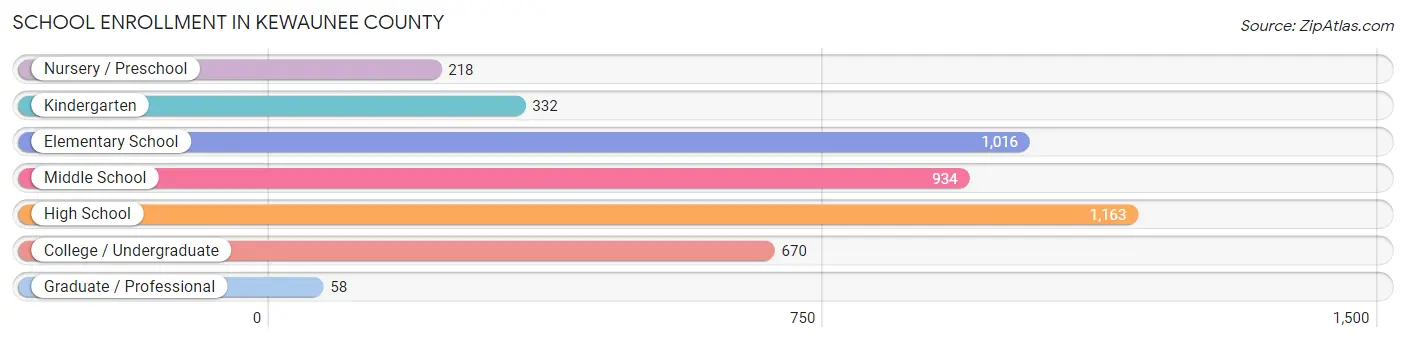
| School Level | # Students | % Students |
| Nursery / Preschool | 218 | 5.0% |
| Kindergarten | 332 | 7.6% |
| Elementary School | 1,016 | 23.1% |
| Middle School | 934 | 21.3% |
| High School | 1,163 | 26.5% |
| College / Undergraduate | 670 | 15.3% |
| Graduate / Professional | 58 | 1.3% |
| Total | 4,391 | 100.0% |
School Enrollment by Age by Funding Source in Kewaunee County
Out of a total of 4,391 students who are enrolled in schools in Kewaunee County, 1,001 (22.8%) attend a private institution, while the remaining 3,390 (77.2%) are enrolled in public schools. The age group of 3 to 4 year olds has the highest likelihood of being enrolled in private schools, with 111 (54.7% in the age bracket) enrolled. Conversely, the age group of 15 to 17 year olds has the lowest likelihood of being enrolled in a private school, with 778 (97.6% in the age bracket) attending a public institution.
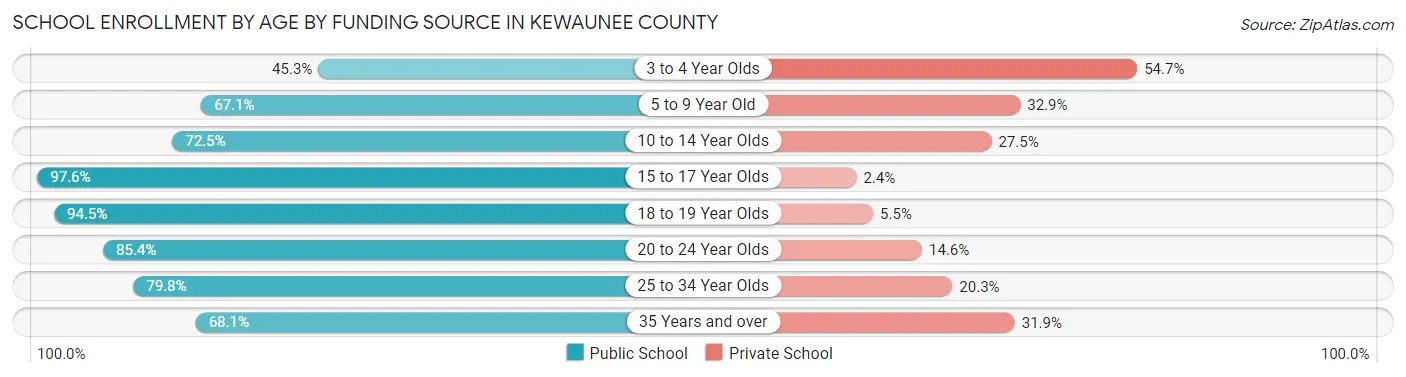
| Age Bracket | Public School | Private School |
| 3 to 4 Year Olds | 92 (45.3%) | 111 (54.7%) |
| 5 to 9 Year Old | 828 (67.1%) | 406 (32.9%) |
| 10 to 14 Year Olds | 832 (72.5%) | 316 (27.5%) |
| 15 to 17 Year Olds | 778 (97.6%) | 19 (2.4%) |
| 18 to 19 Year Olds | 344 (94.5%) | 20 (5.5%) |
| 20 to 24 Year Olds | 298 (85.4%) | 51 (14.6%) |
| 25 to 34 Year Olds | 126 (79.7%) | 32 (20.3%) |
| 35 Years and over | 94 (68.1%) | 44 (31.9%) |
| Total | 3,390 (77.2%) | 1,001 (22.8%) |
Educational Attainment by Field of Study in Kewaunee County
Education (747 | 23.3%), business (537 | 16.7%), science & technology (365 | 11.4%), bio, nature & agricultural (283 | 8.8%), and arts & humanities (275 | 8.6%) are the most common fields of study among 3,208 individuals in Kewaunee County who have obtained a bachelor's degree or higher.
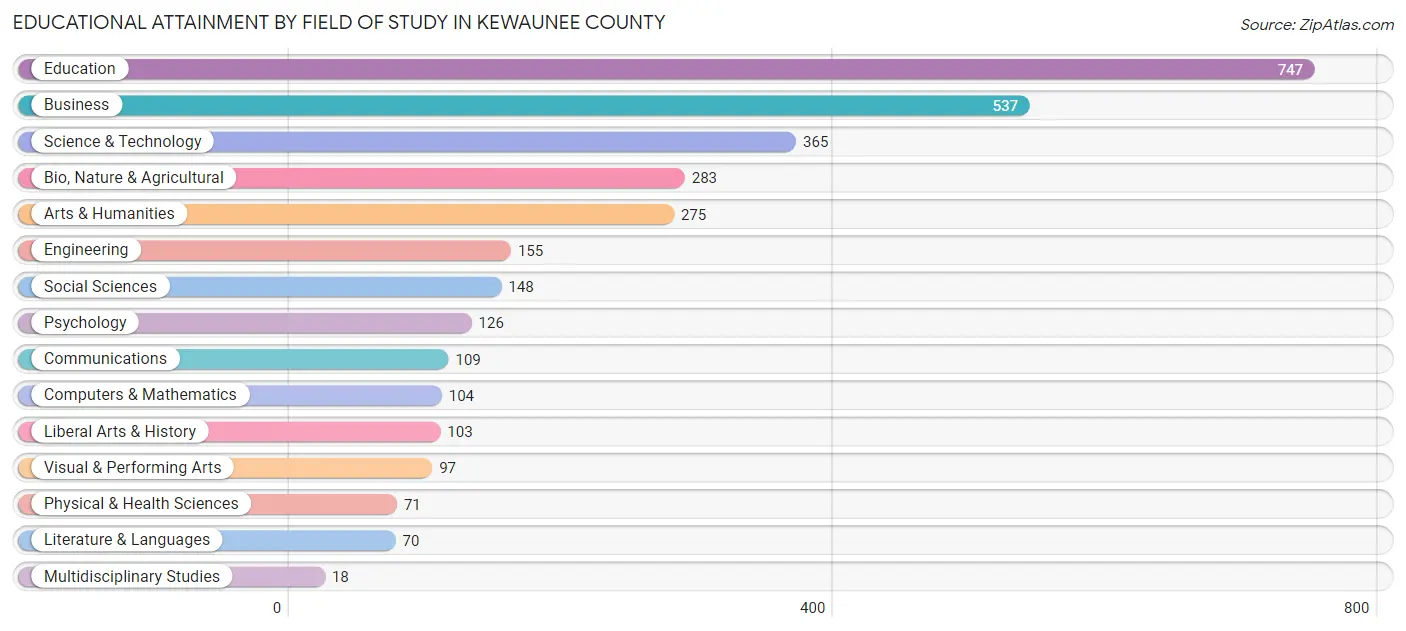
| Field of Study | # Graduates | % Graduates |
| Computers & Mathematics | 104 | 3.2% |
| Bio, Nature & Agricultural | 283 | 8.8% |
| Physical & Health Sciences | 71 | 2.2% |
| Psychology | 126 | 3.9% |
| Social Sciences | 148 | 4.6% |
| Engineering | 155 | 4.8% |
| Multidisciplinary Studies | 18 | 0.6% |
| Science & Technology | 365 | 11.4% |
| Business | 537 | 16.7% |
| Education | 747 | 23.3% |
| Literature & Languages | 70 | 2.2% |
| Liberal Arts & History | 103 | 3.2% |
| Visual & Performing Arts | 97 | 3.0% |
| Communications | 109 | 3.4% |
| Arts & Humanities | 275 | 8.6% |
| Total | 3,208 | 100.0% |
Transportation & Commute in Kewaunee County
Vehicle Availability by Sex in Kewaunee County
The most prevalent vehicle ownership categories in Kewaunee County are males with 2 vehicles (2,265, accounting for 39.7%) and females with 2 vehicles (2,049, making up 45.5%).
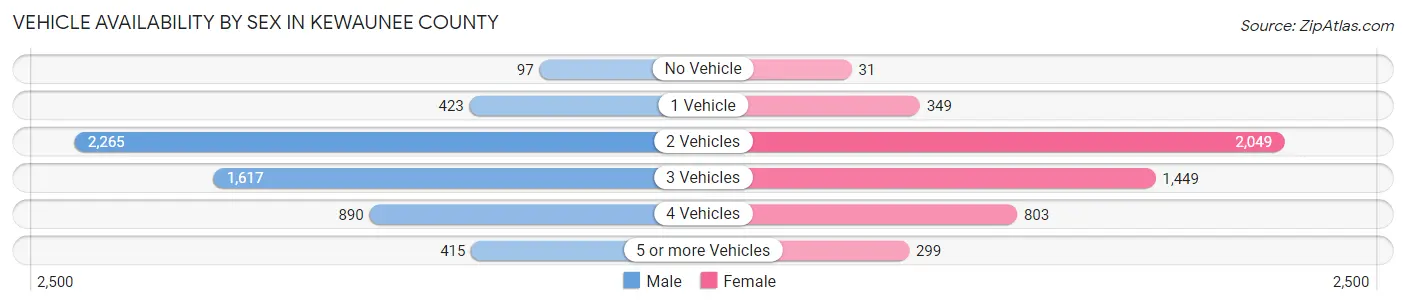
| Vehicles Available | Male | Female |
| No Vehicle | 97 (1.7%) | 31 (0.6%) |
| 1 Vehicle | 423 (7.4%) | 349 (7.0%) |
| 2 Vehicles | 2,265 (39.7%) | 2,049 (41.1%) |
| 3 Vehicles | 1,617 (28.3%) | 1,449 (29.1%) |
| 4 Vehicles | 890 (15.6%) | 803 (16.1%) |
| 5 or more Vehicles | 415 (7.3%) | 299 (6.0%) |
| Total | 5,707 (100.0%) | 4,980 (100.0%) |
Commute Time in Kewaunee County
The most frequently occuring commute durations in Kewaunee County are 5 to 9 minutes (1,551 commuters, 16.1%), 30 to 34 minutes (1,366 commuters, 14.1%), and 20 to 24 minutes (961 commuters, 10.0%).
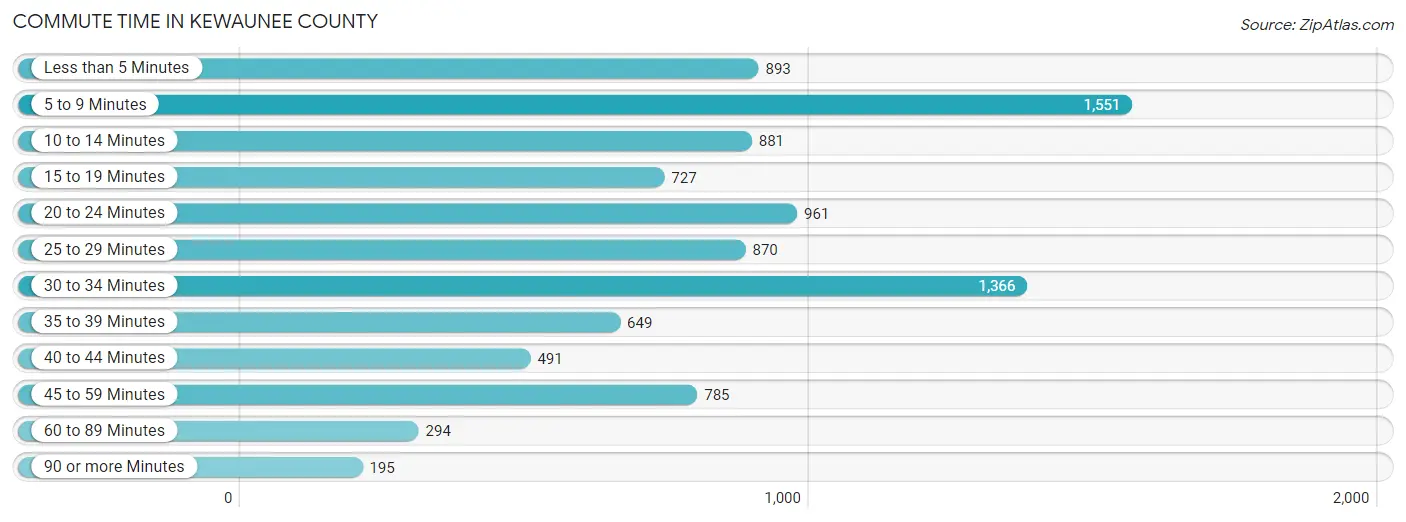
| Commute Time | # Commuters | % Commuters |
| Less than 5 Minutes | 893 | 9.2% |
| 5 to 9 Minutes | 1,551 | 16.1% |
| 10 to 14 Minutes | 881 | 9.1% |
| 15 to 19 Minutes | 727 | 7.5% |
| 20 to 24 Minutes | 961 | 10.0% |
| 25 to 29 Minutes | 870 | 9.0% |
| 30 to 34 Minutes | 1,366 | 14.1% |
| 35 to 39 Minutes | 649 | 6.7% |
| 40 to 44 Minutes | 491 | 5.1% |
| 45 to 59 Minutes | 785 | 8.1% |
| 60 to 89 Minutes | 294 | 3.0% |
| 90 or more Minutes | 195 | 2.0% |
Commute Time by Sex in Kewaunee County
The most common commute times in Kewaunee County are 30 to 34 minutes (750 commuters, 14.5%) for males and 5 to 9 minutes (840 commuters, 18.8%) for females.
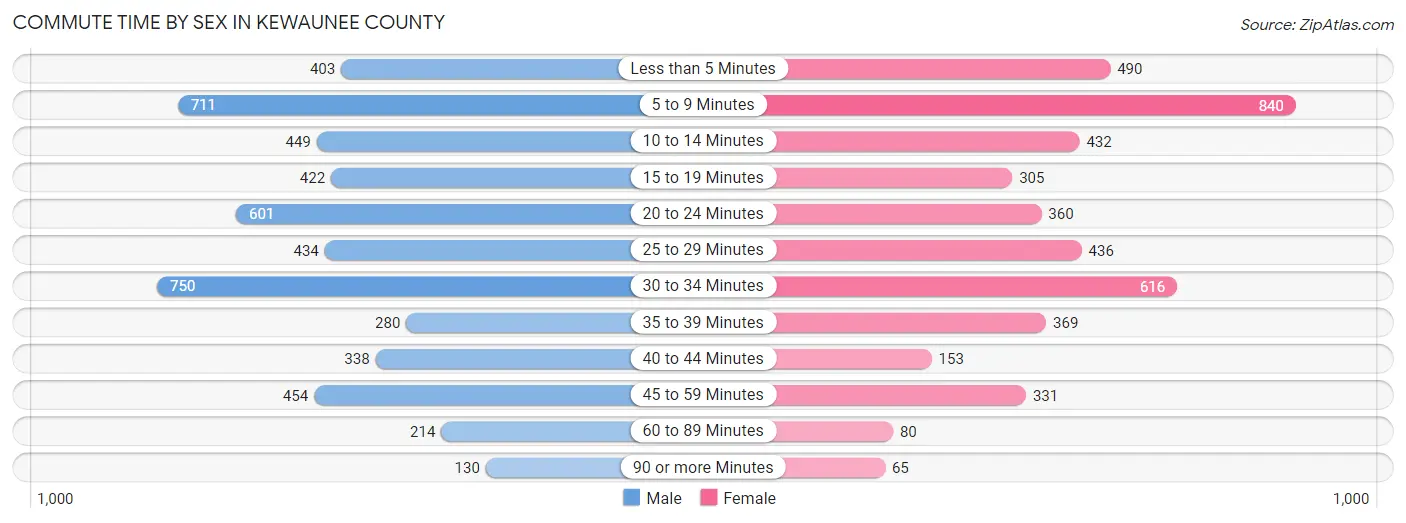
| Commute Time | Male | Female |
| Less than 5 Minutes | 403 (7.8%) | 490 (10.9%) |
| 5 to 9 Minutes | 711 (13.7%) | 840 (18.8%) |
| 10 to 14 Minutes | 449 (8.7%) | 432 (9.7%) |
| 15 to 19 Minutes | 422 (8.1%) | 305 (6.8%) |
| 20 to 24 Minutes | 601 (11.6%) | 360 (8.0%) |
| 25 to 29 Minutes | 434 (8.4%) | 436 (9.7%) |
| 30 to 34 Minutes | 750 (14.5%) | 616 (13.8%) |
| 35 to 39 Minutes | 280 (5.4%) | 369 (8.2%) |
| 40 to 44 Minutes | 338 (6.5%) | 153 (3.4%) |
| 45 to 59 Minutes | 454 (8.7%) | 331 (7.4%) |
| 60 to 89 Minutes | 214 (4.1%) | 80 (1.8%) |
| 90 or more Minutes | 130 (2.5%) | 65 (1.5%) |
Time of Departure to Work by Sex in Kewaunee County
The most frequent times of departure to work in Kewaunee County are 12:00 AM to 4:59 AM (747, 14.4%) for males and 7:00 AM to 7:29 AM (1,052, 23.5%) for females.
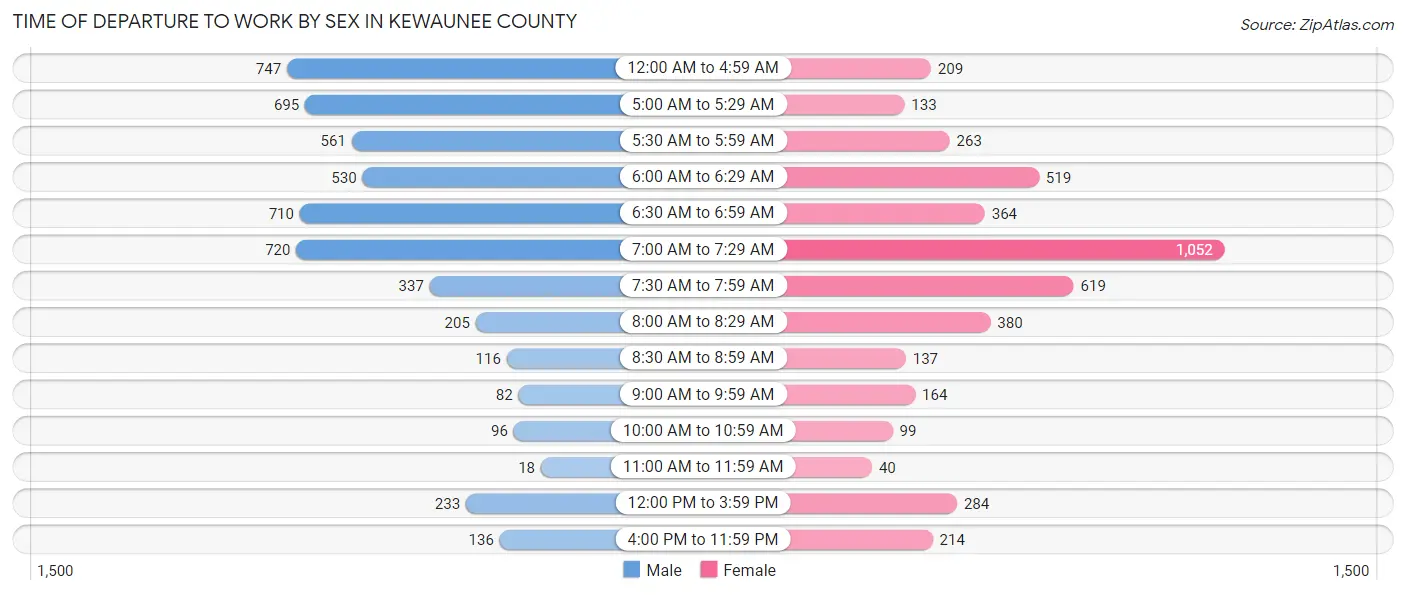
| Time of Departure | Male | Female |
| 12:00 AM to 4:59 AM | 747 (14.4%) | 209 (4.7%) |
| 5:00 AM to 5:29 AM | 695 (13.4%) | 133 (3.0%) |
| 5:30 AM to 5:59 AM | 561 (10.8%) | 263 (5.9%) |
| 6:00 AM to 6:29 AM | 530 (10.2%) | 519 (11.6%) |
| 6:30 AM to 6:59 AM | 710 (13.7%) | 364 (8.1%) |
| 7:00 AM to 7:29 AM | 720 (13.9%) | 1,052 (23.5%) |
| 7:30 AM to 7:59 AM | 337 (6.5%) | 619 (13.8%) |
| 8:00 AM to 8:29 AM | 205 (4.0%) | 380 (8.5%) |
| 8:30 AM to 8:59 AM | 116 (2.2%) | 137 (3.1%) |
| 9:00 AM to 9:59 AM | 82 (1.6%) | 164 (3.7%) |
| 10:00 AM to 10:59 AM | 96 (1.8%) | 99 (2.2%) |
| 11:00 AM to 11:59 AM | 18 (0.4%) | 40 (0.9%) |
| 12:00 PM to 3:59 PM | 233 (4.5%) | 284 (6.3%) |
| 4:00 PM to 11:59 PM | 136 (2.6%) | 214 (4.8%) |
| Total | 5,186 (100.0%) | 4,477 (100.0%) |
Housing Occupancy in Kewaunee County
Occupancy by Ownership in Kewaunee County
Of the total 8,247 dwellings in Kewaunee County, owner-occupied units account for 7,115 (86.3%), while renter-occupied units make up 1,132 (13.7%).
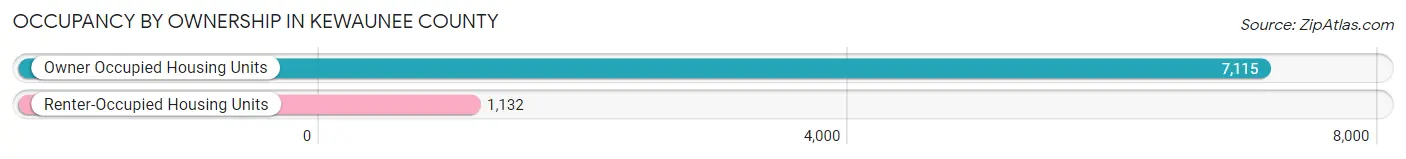
| Occupancy | # Housing Units | % Housing Units |
| Owner Occupied Housing Units | 7,115 | 86.3% |
| Renter-Occupied Housing Units | 1,132 | 13.7% |
| Total Occupied Housing Units | 8,247 | 100.0% |
Occupancy by Household Size in Kewaunee County

| Household Size | # Housing Units | % Housing Units |
| 1-Person Household | 2,139 | 25.9% |
| 2-Person Household | 3,186 | 38.6% |
| 3-Person Household | 1,176 | 14.3% |
| 4+ Person Household | 1,746 | 21.2% |
| Total Housing Units | 8,247 | 100.0% |
Occupancy by Ownership by Household Size in Kewaunee County
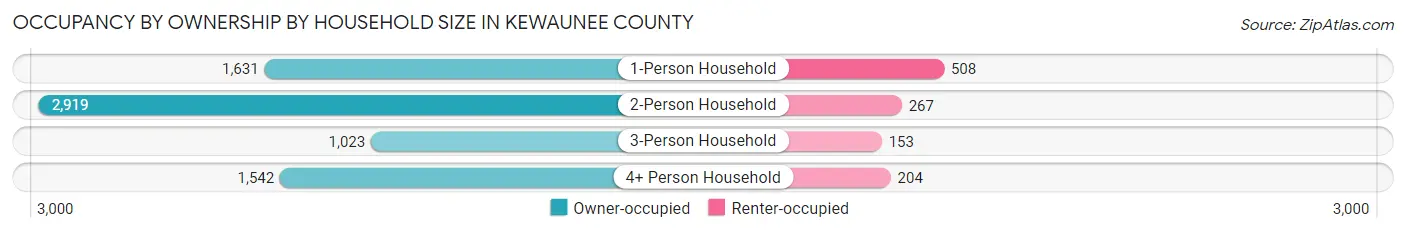
| Household Size | Owner-occupied | Renter-occupied |
| 1-Person Household | 1,631 (76.2%) | 508 (23.7%) |
| 2-Person Household | 2,919 (91.6%) | 267 (8.4%) |
| 3-Person Household | 1,023 (87.0%) | 153 (13.0%) |
| 4+ Person Household | 1,542 (88.3%) | 204 (11.7%) |
| Total Housing Units | 7,115 (86.3%) | 1,132 (13.7%) |
Occupancy by Educational Attainment in Kewaunee County
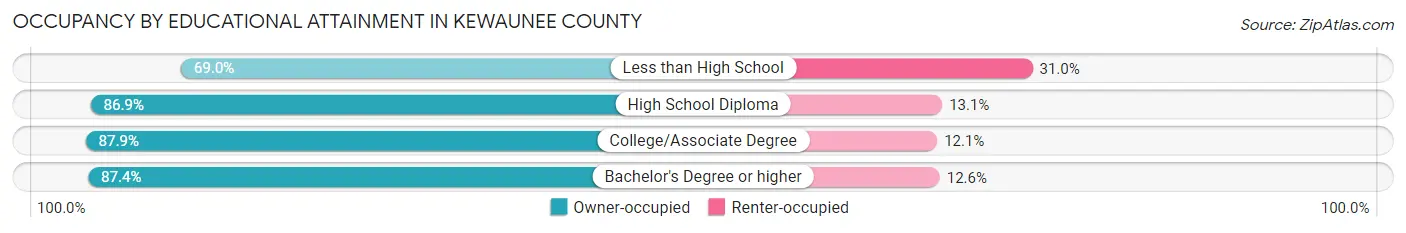
| Household Size | Owner-occupied | Renter-occupied |
| Less than High School | 345 (69.0%) | 155 (31.0%) |
| High School Diploma | 2,650 (86.9%) | 399 (13.1%) |
| College/Associate Degree | 2,456 (87.9%) | 338 (12.1%) |
| Bachelor's Degree or higher | 1,664 (87.4%) | 240 (12.6%) |
Occupancy by Age of Householder in Kewaunee County
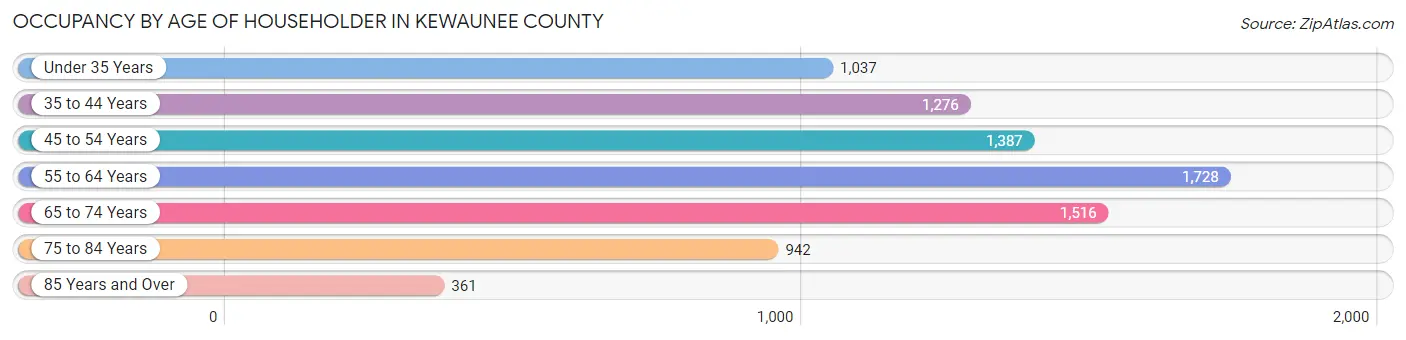
| Age Bracket | # Households | % Households |
| Under 35 Years | 1,037 | 12.6% |
| 35 to 44 Years | 1,276 | 15.5% |
| 45 to 54 Years | 1,387 | 16.8% |
| 55 to 64 Years | 1,728 | 20.9% |
| 65 to 74 Years | 1,516 | 18.4% |
| 75 to 84 Years | 942 | 11.4% |
| 85 Years and Over | 361 | 4.4% |
| Total | 8,247 | 100.0% |
Housing Finances in Kewaunee County
Median Income by Occupancy in Kewaunee County
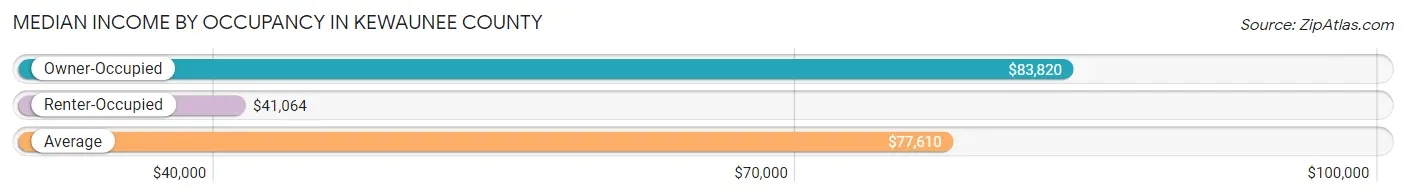
| Occupancy Type | # Households | Median Income |
| Owner-Occupied | 7,115 (86.3%) | $83,820 |
| Renter-Occupied | 1,132 (13.7%) | $41,064 |
| Average | 8,247 (100.0%) | $77,610 |
Occupancy by Householder Income Bracket in Kewaunee County
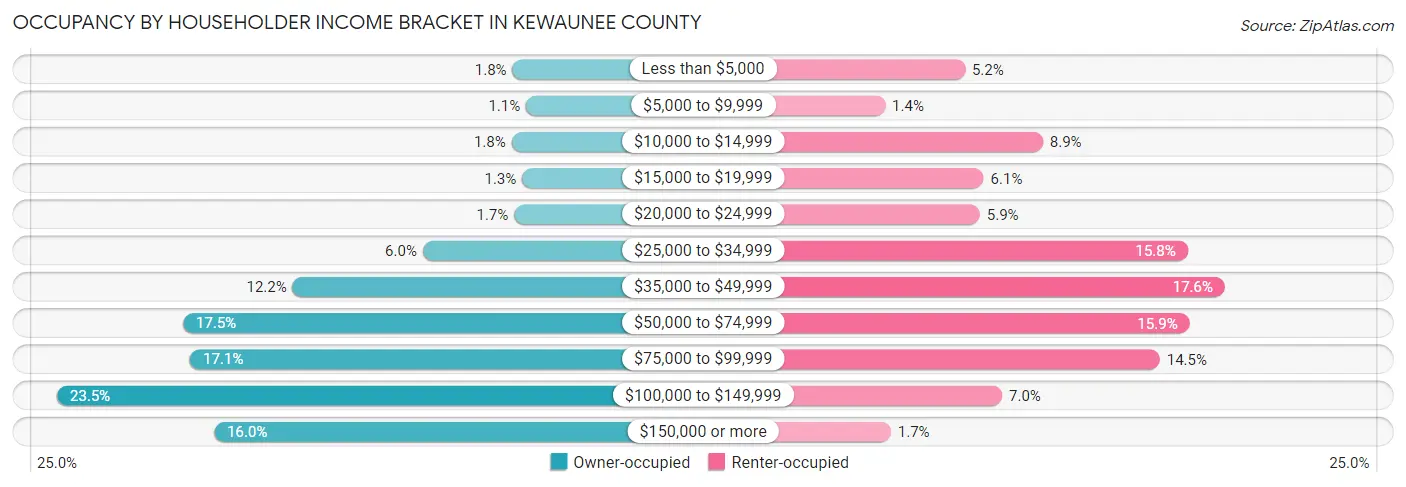
| Income Bracket | Owner-occupied | Renter-occupied |
| Less than $5,000 | 126 (1.8%) | 59 (5.2%) |
| $5,000 to $9,999 | 80 (1.1%) | 16 (1.4%) |
| $10,000 to $14,999 | 129 (1.8%) | 101 (8.9%) |
| $15,000 to $19,999 | 93 (1.3%) | 69 (6.1%) |
| $20,000 to $24,999 | 120 (1.7%) | 67 (5.9%) |
| $25,000 to $34,999 | 430 (6.0%) | 179 (15.8%) |
| $35,000 to $49,999 | 871 (12.2%) | 199 (17.6%) |
| $50,000 to $74,999 | 1,242 (17.5%) | 180 (15.9%) |
| $75,000 to $99,999 | 1,218 (17.1%) | 164 (14.5%) |
| $100,000 to $149,999 | 1,669 (23.5%) | 79 (7.0%) |
| $150,000 or more | 1,137 (16.0%) | 19 (1.7%) |
| Total | 7,115 (100.0%) | 1,132 (100.0%) |
Monthly Housing Cost Tiers in Kewaunee County
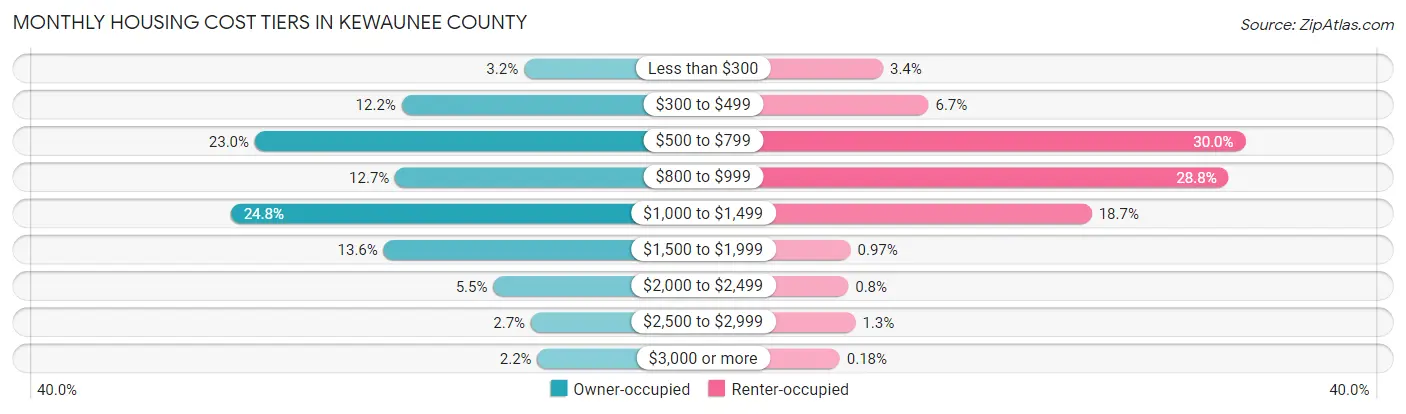
| Monthly Cost | Owner-occupied | Renter-occupied |
| Less than $300 | 229 (3.2%) | 38 (3.4%) |
| $300 to $499 | 870 (12.2%) | 76 (6.7%) |
| $500 to $799 | 1,639 (23.0%) | 340 (30.0%) |
| $800 to $999 | 904 (12.7%) | 326 (28.8%) |
| $1,000 to $1,499 | 1,766 (24.8%) | 212 (18.7%) |
| $1,500 to $1,999 | 965 (13.6%) | 11 (1.0%) |
| $2,000 to $2,499 | 390 (5.5%) | 9 (0.8%) |
| $2,500 to $2,999 | 193 (2.7%) | 15 (1.3%) |
| $3,000 or more | 159 (2.2%) | 2 (0.2%) |
| Total | 7,115 (100.0%) | 1,132 (100.0%) |
Physical Housing Characteristics in Kewaunee County
Housing Structures in Kewaunee County
| Structure Type | # Housing Units | % Housing Units |
| Single Unit, Detached | 7,006 | 85.0% |
| Single Unit, Attached | 99 | 1.2% |
| 2 Unit Apartments | 357 | 4.3% |
| 3 or 4 Unit Apartments | 148 | 1.8% |
| 5 to 9 Unit Apartments | 159 | 1.9% |
| 10 or more Apartments | 198 | 2.4% |
| Mobile Home / Other | 280 | 3.4% |
| Total | 8,247 | 100.0% |
Housing Structures by Occupancy in Kewaunee County
| Structure Type | Owner-occupied | Renter-occupied |
| Single Unit, Detached | 6,585 (94.0%) | 421 (6.0%) |
| Single Unit, Attached | 59 (59.6%) | 40 (40.4%) |
| 2 Unit Apartments | 202 (56.6%) | 155 (43.4%) |
| 3 or 4 Unit Apartments | 12 (8.1%) | 136 (91.9%) |
| 5 to 9 Unit Apartments | 26 (16.4%) | 133 (83.7%) |
| 10 or more Apartments | 4 (2.0%) | 194 (98.0%) |
| Mobile Home / Other | 227 (81.1%) | 53 (18.9%) |
| Total | 7,115 (86.3%) | 1,132 (13.7%) |
Housing Structures by Number of Rooms in Kewaunee County
| Number of Rooms | Owner-occupied | Renter-occupied |
| 1 Room | 7 (0.1%) | 95 (8.4%) |
| 2 or 3 Rooms | 62 (0.9%) | 124 (11.0%) |
| 4 or 5 Rooms | 1,743 (24.5%) | 500 (44.2%) |
| 6 or 7 Rooms | 2,874 (40.4%) | 314 (27.7%) |
| 8 or more Rooms | 2,429 (34.1%) | 99 (8.7%) |
| Total | 7,115 (100.0%) | 1,132 (100.0%) |
Housing Structure by Heating Type in Kewaunee County
| Heating Type | Owner-occupied | Renter-occupied |
| Utility Gas | 4,085 (57.4%) | 693 (61.2%) |
| Bottled, Tank, or LP Gas | 1,759 (24.7%) | 121 (10.7%) |
| Electricity | 366 (5.1%) | 246 (21.7%) |
| Fuel Oil or Kerosene | 322 (4.5%) | 43 (3.8%) |
| Coal or Coke | 5 (0.1%) | 0 (0.0%) |
| All other Fuels | 549 (7.7%) | 15 (1.3%) |
| No Fuel Used | 29 (0.4%) | 14 (1.2%) |
| Total | 7,115 (100.0%) | 1,132 (100.0%) |
Household Vehicle Usage in Kewaunee County
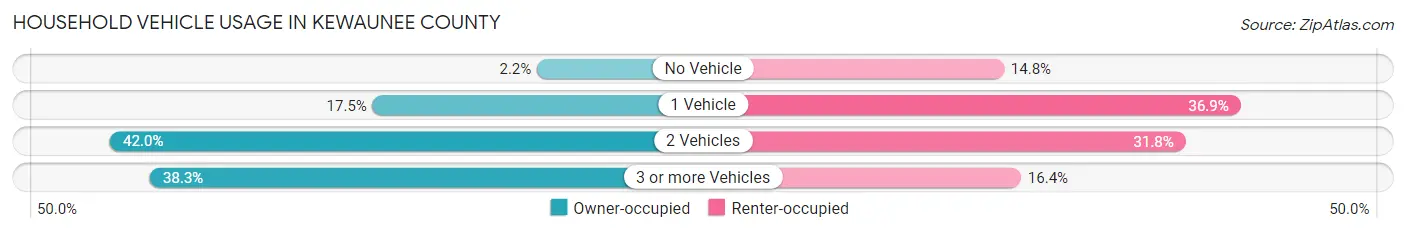
| Vehicles per Household | Owner-occupied | Renter-occupied |
| No Vehicle | 154 (2.2%) | 168 (14.8%) |
| 1 Vehicle | 1,246 (17.5%) | 418 (36.9%) |
| 2 Vehicles | 2,990 (42.0%) | 360 (31.8%) |
| 3 or more Vehicles | 2,725 (38.3%) | 186 (16.4%) |
| Total | 7,115 (100.0%) | 1,132 (100.0%) |
Real Estate & Mortgages in Kewaunee County
Real Estate and Mortgage Overview in Kewaunee County
| Characteristic | Without Mortgage | With Mortgage |
| Housing Units | 2,959 | 4,156 |
| Median Property Value | $196,200 | $189,900 |
| Median Household Income | $61,156 | $830 |
| Monthly Housing Costs | $567 | $155 |
| Real Estate Taxes | $2,869 | $31 |
Property Value by Mortgage Status in Kewaunee County
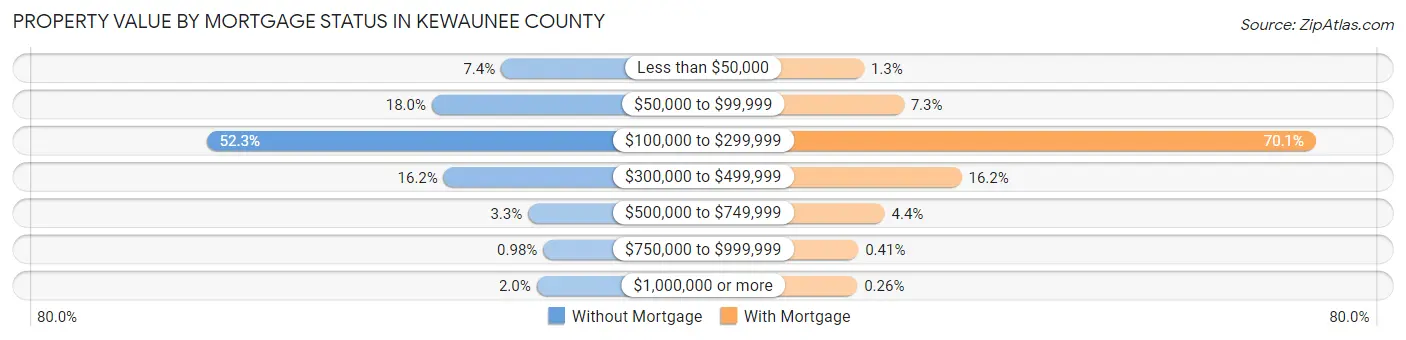
| Property Value | Without Mortgage | With Mortgage |
| Less than $50,000 | 219 (7.4%) | 53 (1.3%) |
| $50,000 to $99,999 | 531 (17.9%) | 305 (7.3%) |
| $100,000 to $299,999 | 1,546 (52.2%) | 2,915 (70.1%) |
| $300,000 to $499,999 | 478 (16.2%) | 671 (16.2%) |
| $500,000 to $749,999 | 97 (3.3%) | 184 (4.4%) |
| $750,000 to $999,999 | 29 (1.0%) | 17 (0.4%) |
| $1,000,000 or more | 59 (2.0%) | 11 (0.3%) |
| Total | 2,959 (100.0%) | 4,156 (100.0%) |
Household Income by Mortgage Status in Kewaunee County
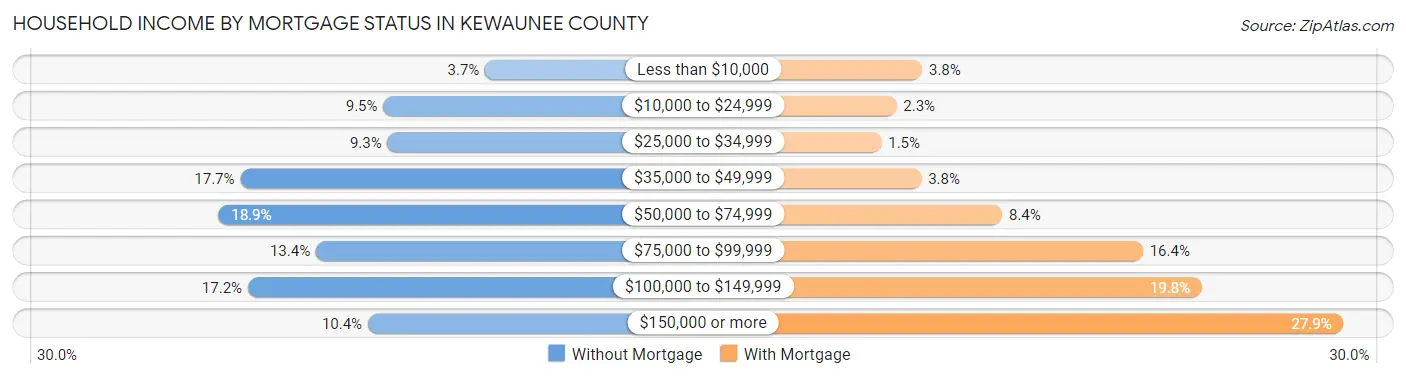
| Household Income | Without Mortgage | With Mortgage |
| Less than $10,000 | 109 (3.7%) | 158 (3.8%) |
| $10,000 to $24,999 | 281 (9.5%) | 97 (2.3%) |
| $25,000 to $34,999 | 274 (9.3%) | 61 (1.5%) |
| $35,000 to $49,999 | 523 (17.7%) | 156 (3.7%) |
| $50,000 to $74,999 | 560 (18.9%) | 348 (8.4%) |
| $75,000 to $99,999 | 395 (13.4%) | 682 (16.4%) |
| $100,000 to $149,999 | 510 (17.2%) | 823 (19.8%) |
| $150,000 or more | 307 (10.4%) | 1,159 (27.9%) |
| Total | 2,959 (100.0%) | 4,156 (100.0%) |
Property Value to Household Income Ratio in Kewaunee County

| Value-to-Income Ratio | Without Mortgage | With Mortgage |
| Less than 2.0x | 1,066 (36.0%) | 97,819 (2,353.7%) |
| 2.0x to 2.9x | 505 (17.1%) | 2,032 (48.9%) |
| 3.0x to 3.9x | 369 (12.5%) | 1,027 (24.7%) |
| 4.0x or more | 994 (33.6%) | 435 (10.5%) |
| Total | 2,959 (100.0%) | 4,156 (100.0%) |
Real Estate Taxes by Mortgage Status in Kewaunee County
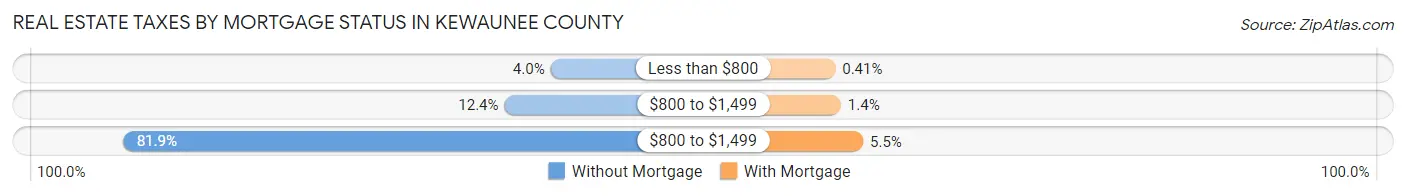
| Property Taxes | Without Mortgage | With Mortgage |
| Less than $800 | 117 (4.0%) | 17 (0.4%) |
| $800 to $1,499 | 366 (12.4%) | 60 (1.4%) |
| $800 to $1,499 | 2,423 (81.9%) | 228 (5.5%) |
| Total | 2,959 (100.0%) | 4,156 (100.0%) |
Health & Disability in Kewaunee County
Health Insurance Coverage by Age in Kewaunee County
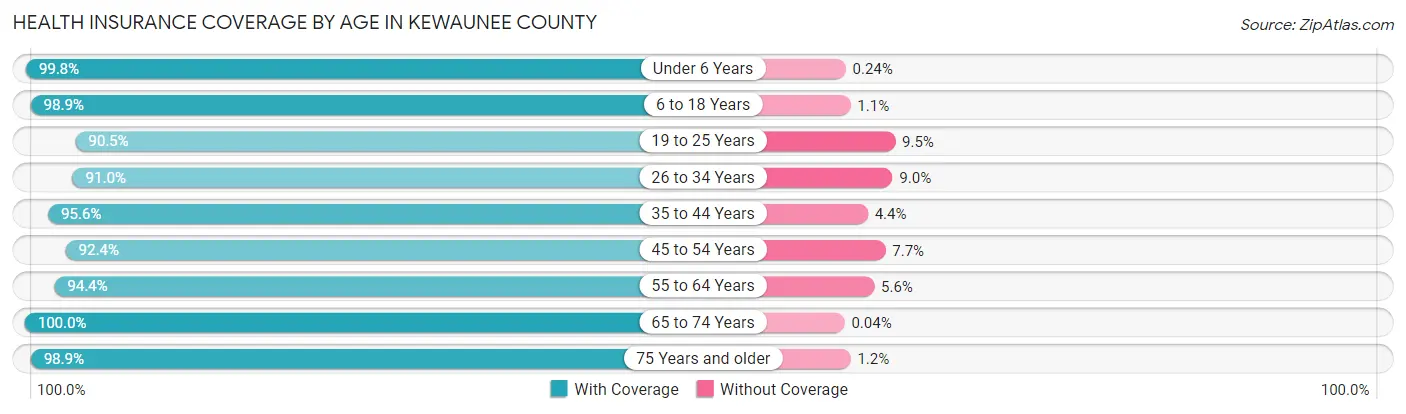
| Age Bracket | With Coverage | Without Coverage |
| Under 6 Years | 1,259 (99.8%) | 3 (0.2%) |
| 6 to 18 Years | 3,299 (98.9%) | 38 (1.1%) |
| 19 to 25 Years | 1,320 (90.5%) | 138 (9.5%) |
| 26 to 34 Years | 1,705 (91.0%) | 168 (9.0%) |
| 35 to 44 Years | 2,339 (95.6%) | 107 (4.4%) |
| 45 to 54 Years | 2,391 (92.3%) | 198 (7.6%) |
| 55 to 64 Years | 3,022 (94.4%) | 178 (5.6%) |
| 65 to 74 Years | 2,464 (100.0%) | 1 (0.0%) |
| 75 Years and older | 1,808 (98.9%) | 21 (1.1%) |
| Total | 19,607 (95.8%) | 852 (4.2%) |
Health Insurance Coverage by Citizenship Status in Kewaunee County
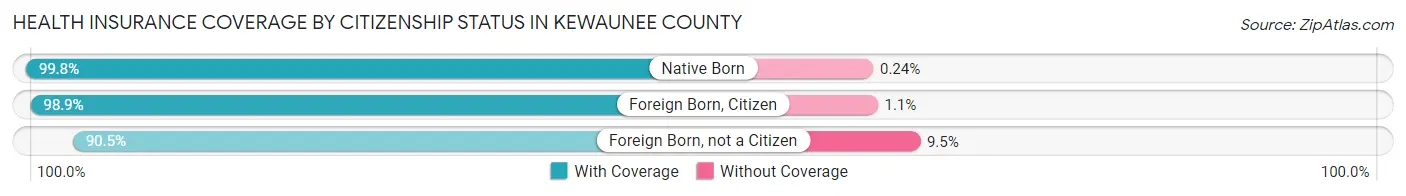
| Citizenship Status | With Coverage | Without Coverage |
| Native Born | 1,259 (99.8%) | 3 (0.2%) |
| Foreign Born, Citizen | 3,299 (98.9%) | 38 (1.1%) |
| Foreign Born, not a Citizen | 1,320 (90.5%) | 138 (9.5%) |
Health Insurance Coverage by Household Income in Kewaunee County
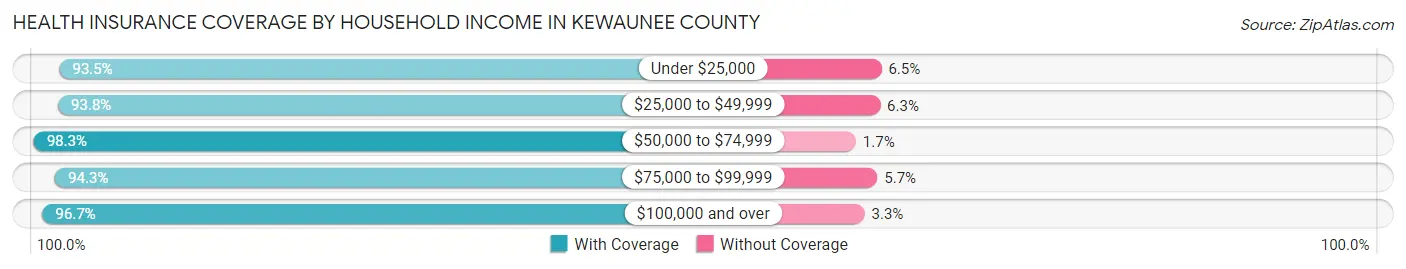
| Household Income | With Coverage | Without Coverage |
| Under $25,000 | 1,222 (93.5%) | 85 (6.5%) |
| $25,000 to $49,999 | 2,687 (93.8%) | 179 (6.2%) |
| $50,000 to $74,999 | 3,104 (98.3%) | 54 (1.7%) |
| $75,000 to $99,999 | 3,724 (94.3%) | 226 (5.7%) |
| $100,000 and over | 8,801 (96.7%) | 304 (3.3%) |
Public vs Private Health Insurance Coverage by Age in Kewaunee County
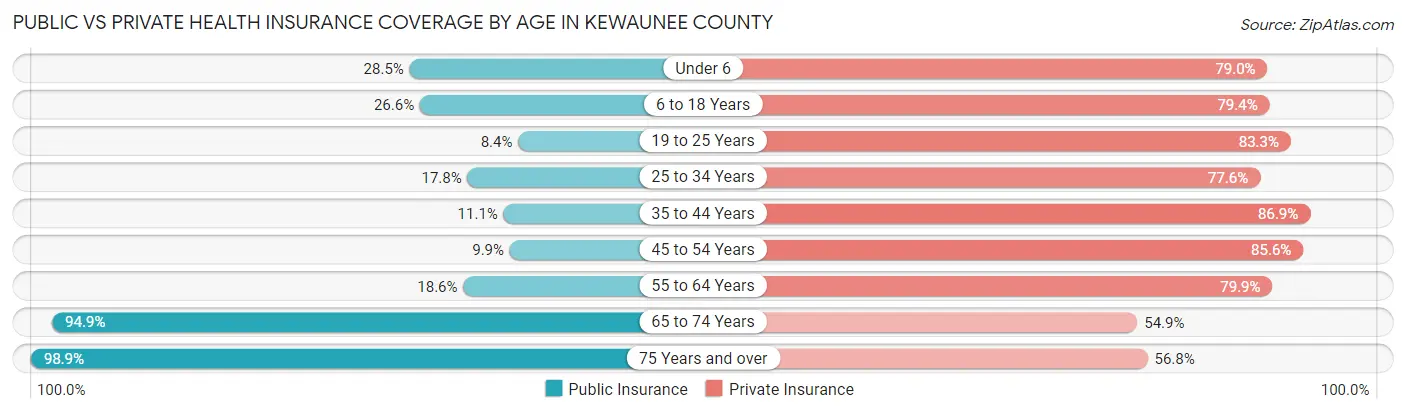
| Age Bracket | Public Insurance | Private Insurance |
| Under 6 | 360 (28.5%) | 997 (79.0%) |
| 6 to 18 Years | 888 (26.6%) | 2,649 (79.4%) |
| 19 to 25 Years | 122 (8.4%) | 1,215 (83.3%) |
| 25 to 34 Years | 333 (17.8%) | 1,454 (77.6%) |
| 35 to 44 Years | 271 (11.1%) | 2,126 (86.9%) |
| 45 to 54 Years | 257 (9.9%) | 2,217 (85.6%) |
| 55 to 64 Years | 594 (18.6%) | 2,557 (79.9%) |
| 65 to 74 Years | 2,339 (94.9%) | 1,352 (54.8%) |
| 75 Years and over | 1,808 (98.9%) | 1,038 (56.8%) |
| Total | 6,972 (34.1%) | 15,605 (76.3%) |
Disability Status by Sex by Age in Kewaunee County
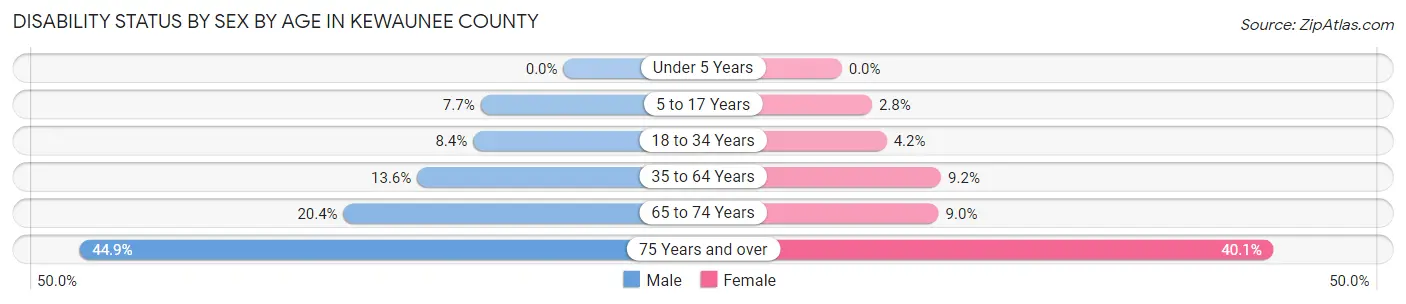
| Age Bracket | Male | Female |
| Under 5 Years | 0 (0.0%) | 0 (0.0%) |
| 5 to 17 Years | 129 (7.7%) | 44 (2.8%) |
| 18 to 34 Years | 160 (8.4%) | 72 (4.2%) |
| 35 to 64 Years | 583 (13.6%) | 363 (9.2%) |
| 65 to 74 Years | 258 (20.4%) | 108 (9.0%) |
| 75 Years and over | 345 (44.9%) | 425 (40.1%) |
Disability Class by Sex by Age in Kewaunee County
Disability Class: Hearing Difficulty
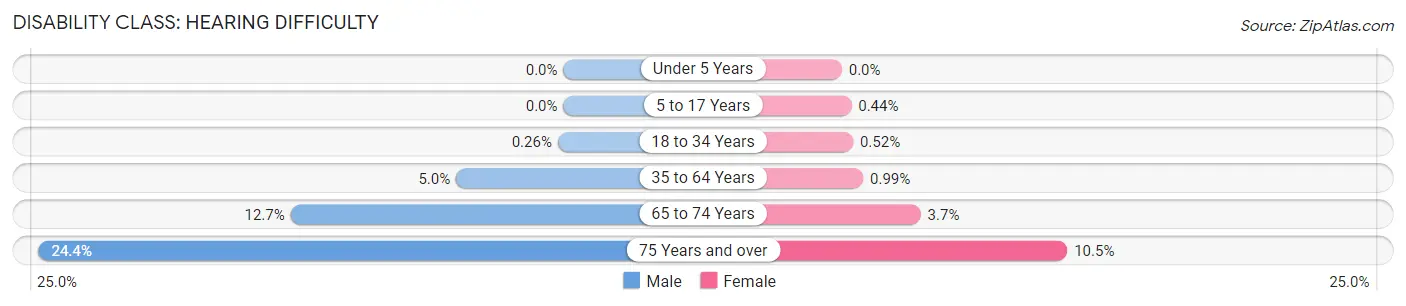
| Age Bracket | Male | Female |
| Under 5 Years | 0 (0.0%) | 0 (0.0%) |
| 5 to 17 Years | 0 (0.0%) | 7 (0.4%) |
| 18 to 34 Years | 5 (0.3%) | 9 (0.5%) |
| 35 to 64 Years | 214 (5.0%) | 39 (1.0%) |
| 65 to 74 Years | 160 (12.7%) | 44 (3.7%) |
| 75 Years and over | 187 (24.3%) | 111 (10.5%) |
Disability Class: Vision Difficulty
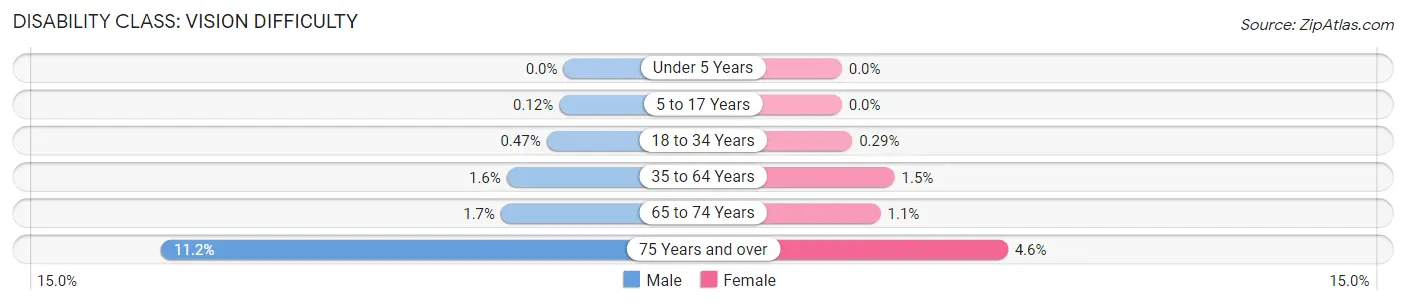
| Age Bracket | Male | Female |
| Under 5 Years | 0 (0.0%) | 0 (0.0%) |
| 5 to 17 Years | 2 (0.1%) | 0 (0.0%) |
| 18 to 34 Years | 9 (0.5%) | 5 (0.3%) |
| 35 to 64 Years | 68 (1.6%) | 58 (1.5%) |
| 65 to 74 Years | 22 (1.7%) | 13 (1.1%) |
| 75 Years and over | 86 (11.2%) | 49 (4.6%) |
Disability Class: Cognitive Difficulty

| Age Bracket | Male | Female |
| 5 to 17 Years | 127 (7.6%) | 32 (2.0%) |
| 18 to 34 Years | 82 (4.3%) | 55 (3.2%) |
| 35 to 64 Years | 280 (6.5%) | 182 (4.6%) |
| 65 to 74 Years | 24 (1.9%) | 12 (1.0%) |
| 75 Years and over | 116 (15.1%) | 62 (5.8%) |
Disability Class: Ambulatory Difficulty
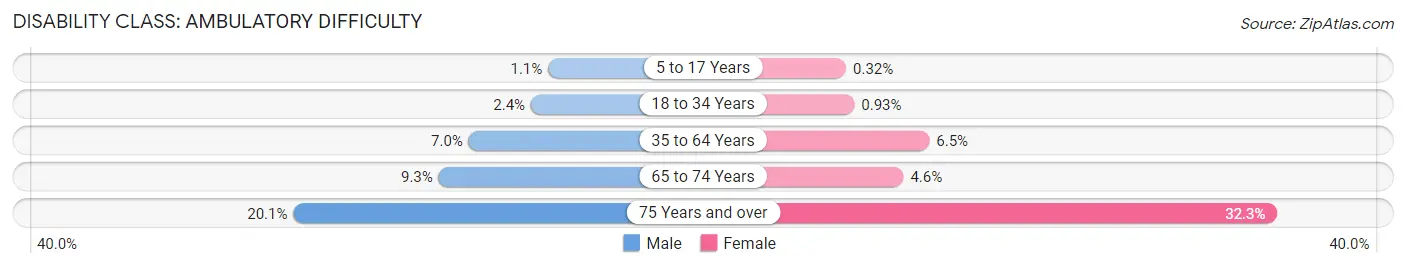
| Age Bracket | Male | Female |
| 5 to 17 Years | 19 (1.1%) | 5 (0.3%) |
| 18 to 34 Years | 46 (2.4%) | 16 (0.9%) |
| 35 to 64 Years | 302 (7.0%) | 256 (6.5%) |
| 65 to 74 Years | 117 (9.3%) | 55 (4.6%) |
| 75 Years and over | 154 (20.1%) | 343 (32.3%) |
Disability Class: Self-Care Difficulty
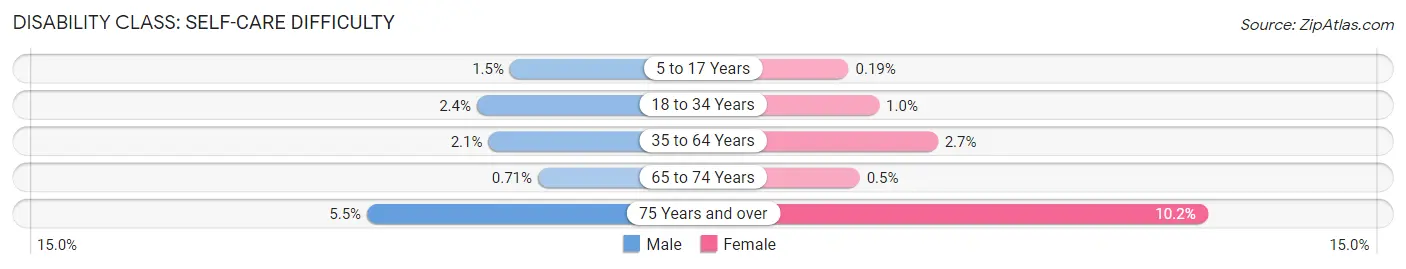
| Age Bracket | Male | Female |
| 5 to 17 Years | 25 (1.5%) | 3 (0.2%) |
| 18 to 34 Years | 46 (2.4%) | 18 (1.0%) |
| 35 to 64 Years | 90 (2.1%) | 105 (2.7%) |
| 65 to 74 Years | 9 (0.7%) | 6 (0.5%) |
| 75 Years and over | 42 (5.5%) | 108 (10.2%) |
Technology Access in Kewaunee County
Computing Device Access in Kewaunee County
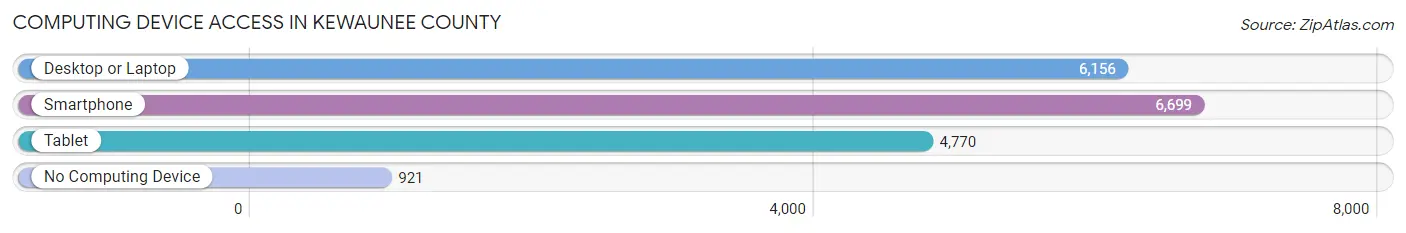
| Device Type | # Households | % Households |
| Desktop or Laptop | 6,156 | 74.7% |
| Smartphone | 6,699 | 81.2% |
| Tablet | 4,770 | 57.8% |
| No Computing Device | 921 | 11.2% |
| Total | 8,247 | 100.0% |
Internet Access in Kewaunee County

| Internet Type | # Households | % Households |
| Dial-Up Internet | 17 | 0.2% |
| Broadband Home | 4,406 | 53.4% |
| Cellular Data Only | 1,408 | 17.1% |
| Satellite Internet | 1,244 | 15.1% |
| No Internet | 1,318 | 16.0% |
| Total | 8,247 | 100.0% |
Kewaunee County Summary
Kewaunee County is located in the northeastern corner of Wisconsin, along the shores of Lake Michigan. It is bordered by Door County to the north, Brown County to the west, Manitowoc County to the south, and Lake Michigan to the east. The county seat is Kewaunee, and the largest city is Algoma. The county has a total area of 576 square miles, of which 545 square miles is land and 31 square miles is water.
Kewaunee County was established in 1852 and named after the Potawatomi chief Kewaunee. The county was originally part of Brown County, and was later split off to form its own county. The county was originally populated by Native Americans, primarily the Potawatomi, and later by European settlers.
The economy of Kewaunee County is largely based on agriculture and tourism. The county is home to a number of dairy farms, as well as a number of fruit and vegetable farms. The county is also home to a number of wineries and breweries, as well as a number of tourist attractions, such as the Kewaunee County Historical Society Museum and the Kewaunee County Fair.
The population of Kewaunee County was 20,527 in 2000, according to the U.S. Census. The population is largely white (96.3%), with a small percentage of African Americans (1.2%), Native Americans (0.7%), and Asians (0.6%). The median household income in the county was $41,845 in 2000, and the median family income was $50,945. The per capita income was $20,845.
Kewaunee County is served by two school districts, the Kewaunee School District and the Algoma School District. The county is also home to a number of private schools, including St. Mary's Catholic School and the Kewaunee Christian Academy.
Kewaunee County is served by a number of local media outlets, including the Kewaunee County Star-News, the Kewaunee County Times, and the Kewaunee County Herald. The county is also served by a number of radio and television stations, including WKEW-FM, WKEW-AM, and WKEW-TV.
Kewaunee County is home to a number of parks and recreational areas, including the Kewaunee County Park, the Kewaunee County Forest, and the Kewaunee County Wildlife Area. The county is also home to a number of lakes, including Lake Michigan, Lake Kewaunee, and Lake Winnebago.
Kewaunee County is a beautiful and diverse area of Wisconsin, with a rich history and a vibrant economy. The county is home to a number of dairy farms, wineries, breweries, and tourist attractions, as well as a number of parks and recreational areas. The county is served by two school districts, and is home to a number of local media outlets. The population of the county is largely white, with a small percentage of African Americans, Native Americans, and Asians. The median household income in the county is slightly above the national average, and the per capita income is slightly below the national average. Kewaunee County is a great place to live, work, and play.
Common Questions
What is the Total Population of Kewaunee County?
Total Population of Kewaunee County is 20,570.
What is the Total Male Population of Kewaunee County?
Total Male Population of Kewaunee County is 10,527.
What is the Total Female Population of Kewaunee County?
Total Female Population of Kewaunee County is 10,043.
What is the Ratio of Males per 100 Females in Kewaunee County?
There are 104.82 Males per 100 Females in Kewaunee County.
What is the Ratio of Females per 100 Males in Kewaunee County?
There are 95.40 Females per 100 Males in Kewaunee County.
What is the Median Population Age in Kewaunee County?
Median Population Age in Kewaunee County is 44.4 Years.
What is the Average Family Size in Kewaunee County
Average Family Size in Kewaunee County is 2.9 People.
What is the Average Household Size in Kewaunee County
Average Household Size in Kewaunee County is 2.5 People.
What is Per Capita Income in Kewaunee County?
Per Capita income in Kewaunee County is $38,012.
What is the Median Family Income in Kewaunee County?
Median Family Income in Kewaunee County is $92,088.
What is the Median Household income in Kewaunee County?
Median Household Income in Kewaunee County is $77,610.
What is Income or Wage Gap in Kewaunee County?
Income or Wage Gap in Kewaunee County is 33.9%.
Women in Kewaunee County earn 66.1 cents for every dollar earned by a man.
What is Family Income Deficit in Kewaunee County?
Family Income Deficit in Kewaunee County is $10,309.
Families that are below poverty line in Kewaunee County earn $10,309 less on average than the poverty threshold level.
What is Inequality or Gini Index in Kewaunee County?
Inequality or Gini Index in Kewaunee County is 0.39.
How Large is the Labor Force in Kewaunee County?
There are 11,054 People in the Labor Forcein in Kewaunee County.
What is the Percentage of People in the Labor Force in Kewaunee County?
66.0% of People are in the Labor Force in Kewaunee County.
What is the Unemployment Rate in Kewaunee County?
Unemployment Rate in Kewaunee County is 2.0%.