Kenosha County, WI
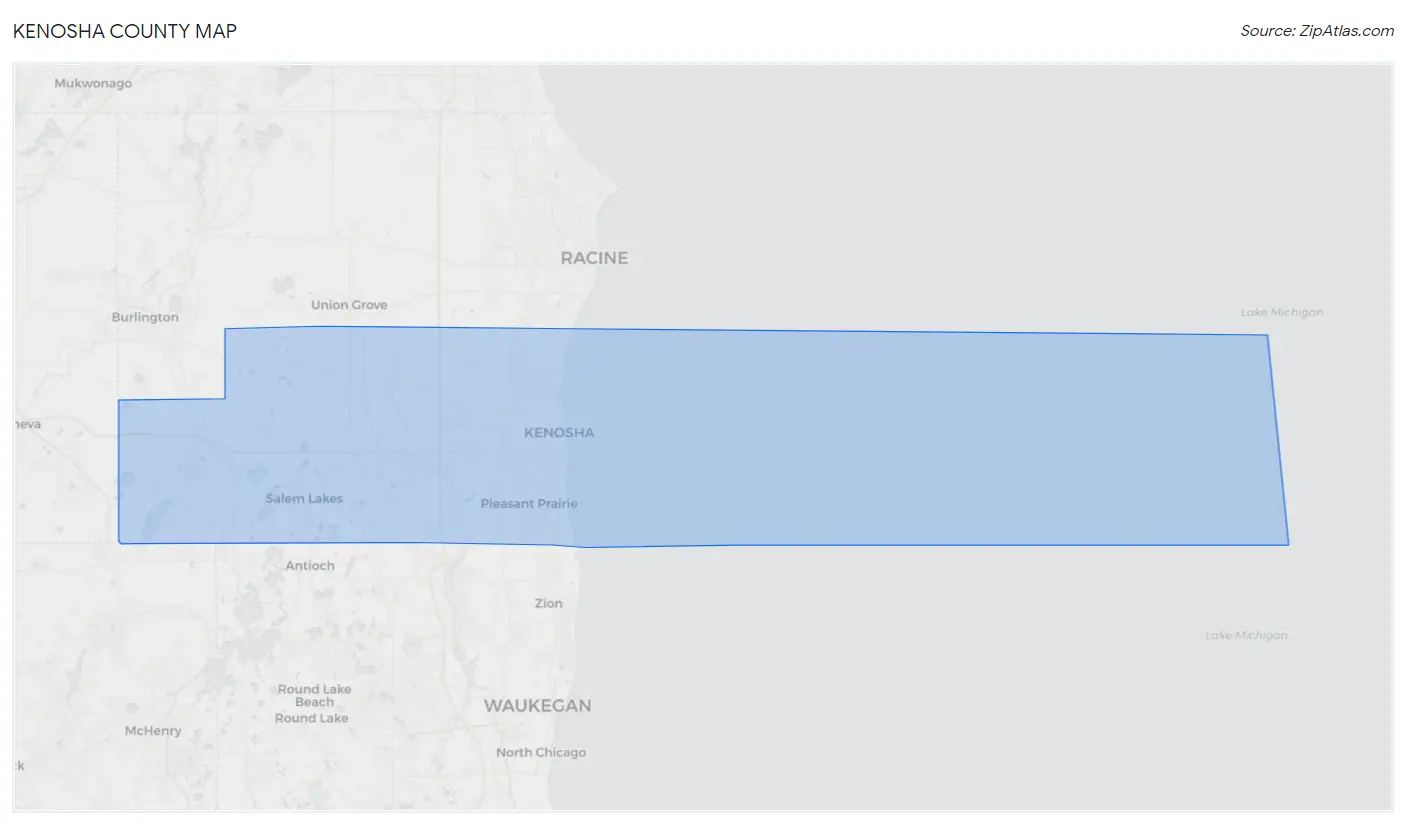
Kenosha County Map
Kenosha County Overview
168,693
TOTAL POPULATION
83,870
MALE POPULATION
84,823
FEMALE POPULATION
98.88
MALES / 100 FEMALES
101.14
FEMALES / 100 MALES
38.9
MEDIAN AGE
3.0
AVG FAMILY SIZE
2.5
AVG HOUSEHOLD SIZE
$38,720
PER CAPITA INCOME
$94,742
AVG FAMILY INCOME
$76,583
AVG HOUSEHOLD INCOME
27.8%
WAGE / INCOME GAP [ % ]
72.2¢/ $1
WAGE / INCOME GAP [ $ ]
$9,755
FAMILY INCOME DEFICIT
0.42
INEQUALITY / GINI INDEX
91,593
LABOR FORCE [ PEOPLE ]
67.4%
PERCENT IN LABOR FORCE
5.4%
UNEMPLOYMENT RATE
Kenosha County Area Codes
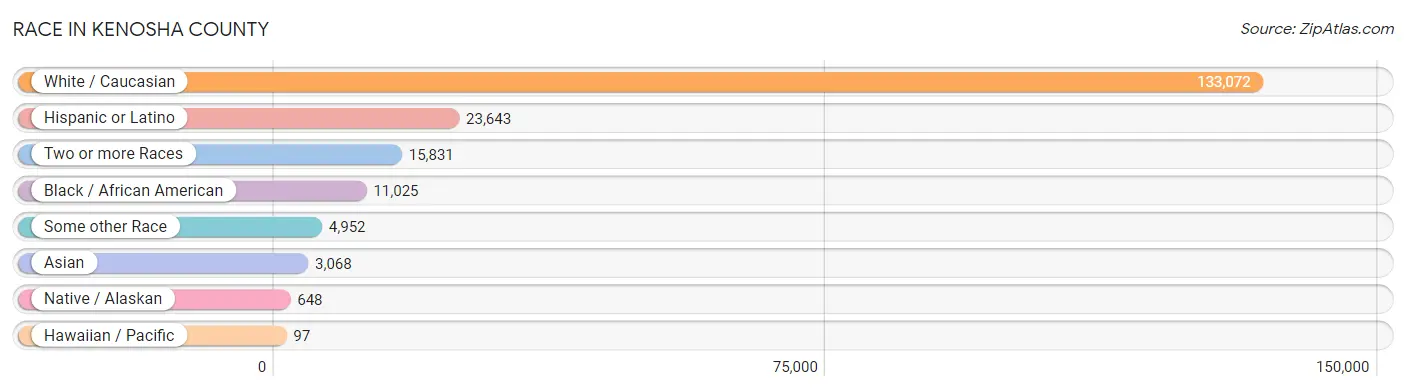
Race in Kenosha County
The most populous races in Kenosha County are White / Caucasian (133,072 | 78.9%), Hispanic or Latino (23,643 | 14.0%), and Two or more Races (15,831 | 9.4%).
| Race | # Population | % Population |
| Asian | 3,068 | 1.8% |
| Black / African American | 11,025 | 6.5% |
| Hawaiian / Pacific | 97 | 0.1% |
| Hispanic or Latino | 23,643 | 14.0% |
| Native / Alaskan | 648 | 0.4% |
| White / Caucasian | 133,072 | 78.9% |
| Two or more Races | 15,831 | 9.4% |
| Some other Race | 4,952 | 2.9% |
| Total | 168,693 | 100.0% |
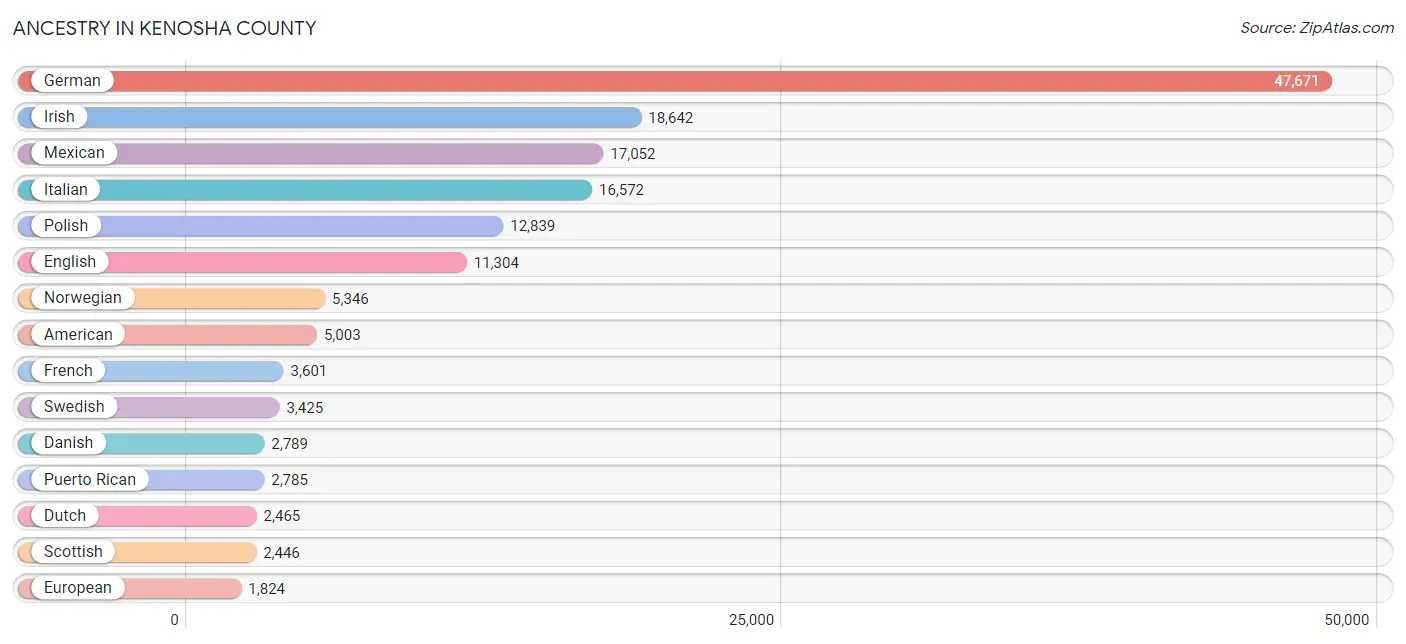
Ancestry in Kenosha County
The most populous ancestries reported in Kenosha County are German (47,671 | 28.3%), Irish (18,642 | 11.1%), Mexican (17,052 | 10.1%), Italian (16,572 | 9.8%), and Polish (12,839 | 7.6%), together accounting for 66.8% of all Kenosha County residents.
| Ancestry | # Population | % Population |
| African | 479 | 0.3% |
| Albanian | 674 | 0.4% |
| American | 5,003 | 3.0% |
| Apache | 33 | 0.0% |
| Arab | 545 | 0.3% |
| Argentinean | 140 | 0.1% |
| Armenian | 144 | 0.1% |
| Assyrian / Chaldean / Syriac | 24 | 0.0% |
| Australian | 62 | 0.0% |
| Austrian | 345 | 0.2% |
| Bahamian | 5 | 0.0% |
| Bangladeshi | 378 | 0.2% |
| Belgian | 284 | 0.2% |
| Belizean | 19 | 0.0% |
| Bermudan | 5 | 0.0% |
| Bhutanese | 344 | 0.2% |
| Blackfeet | 38 | 0.0% |
| Bolivian | 3 | 0.0% |
| Brazilian | 81 | 0.1% |
| British | 513 | 0.3% |
| Bulgarian | 41 | 0.0% |
| Burmese | 193 | 0.1% |
| Cajun | 54 | 0.0% |
| Cambodian | 30 | 0.0% |
| Canadian | 183 | 0.1% |
| Central American | 1,199 | 0.7% |
| Central American Indian | 97 | 0.1% |
| Cherokee | 584 | 0.4% |
| Chickasaw | 35 | 0.0% |
| Chilean | 28 | 0.0% |
| Chinese | 23 | 0.0% |
| Chippewa | 188 | 0.1% |
| Choctaw | 16 | 0.0% |
| Colombian | 447 | 0.3% |
| Comanche | 144 | 0.1% |
| Cree | 25 | 0.0% |
| Croatian | 347 | 0.2% |
| Crow | 2 | 0.0% |
| Cuban | 164 | 0.1% |
| Czech | 1,444 | 0.9% |
| Czechoslovakian | 349 | 0.2% |
| Danish | 2,789 | 1.7% |
| Dominican | 335 | 0.2% |
| Dutch | 2,465 | 1.5% |
| Eastern European | 282 | 0.2% |
| Ecuadorian | 177 | 0.1% |
| Egyptian | 48 | 0.0% |
| English | 11,304 | 6.7% |
| Ethiopian | 14 | 0.0% |
| European | 1,824 | 1.1% |
| Fijian | 17 | 0.0% |
| Filipino | 16 | 0.0% |
| Finnish | 1,646 | 1.0% |
| French | 3,601 | 2.1% |
| French Canadian | 984 | 0.6% |
| German | 47,671 | 28.3% |
| Greek | 923 | 0.5% |
| Guamanian / Chamorro | 10 | 0.0% |
| Guatemalan | 496 | 0.3% |
| Haitian | 80 | 0.1% |
| Honduran | 320 | 0.2% |
| Hungarian | 1,137 | 0.7% |
| Icelander | 63 | 0.0% |
| Indian (Asian) | 579 | 0.3% |
| Inupiat | 49 | 0.0% |
| Iranian | 127 | 0.1% |
| Irish | 18,642 | 11.1% |
| Iroquois | 35 | 0.0% |
| Italian | 16,572 | 9.8% |
| Jamaican | 144 | 0.1% |
| Japanese | 39 | 0.0% |
| Jordanian | 57 | 0.0% |
| Korean | 1,024 | 0.6% |
| Laotian | 4 | 0.0% |
| Latvian | 12 | 0.0% |
| Lebanese | 134 | 0.1% |
| Lithuanian | 1,288 | 0.8% |
| Luxembourger | 169 | 0.1% |
| Macedonian | 21 | 0.0% |
| Menominee | 137 | 0.1% |
| Mexican | 17,052 | 10.1% |
| Mexican American Indian | 494 | 0.3% |
| Mongolian | 4 | 0.0% |
| Native Hawaiian | 75 | 0.0% |
| Navajo | 33 | 0.0% |
| New Zealander | 12 | 0.0% |
| Nicaraguan | 143 | 0.1% |
| Nigerian | 370 | 0.2% |
| Northern European | 193 | 0.1% |
| Norwegian | 5,346 | 3.2% |
| Osage | 12 | 0.0% |
| Ottawa | 7 | 0.0% |
| Palestinian | 100 | 0.1% |
| Panamanian | 151 | 0.1% |
| Pennsylvania German | 43 | 0.0% |
| Peruvian | 53 | 0.0% |
| Polish | 12,839 | 7.6% |
| Portuguese | 24 | 0.0% |
| Potawatomi | 25 | 0.0% |
| Pueblo | 19 | 0.0% |
| Puerto Rican | 2,785 | 1.7% |
| Romanian | 170 | 0.1% |
| Russian | 1,255 | 0.7% |
| Salvadoran | 89 | 0.1% |
| Samoan | 18 | 0.0% |
| Scandinavian | 1,135 | 0.7% |
| Scotch-Irish | 889 | 0.5% |
| Scottish | 2,446 | 1.5% |
| Seminole | 12 | 0.0% |
| Serbian | 247 | 0.2% |
| Sioux | 94 | 0.1% |
| Slavic | 124 | 0.1% |
| Slovak | 546 | 0.3% |
| Slovene | 187 | 0.1% |
| South African | 8 | 0.0% |
| South American | 932 | 0.5% |
| Spaniard | 382 | 0.2% |
| Spanish | 219 | 0.1% |
| Spanish American | 21 | 0.0% |
| Sri Lankan | 447 | 0.3% |
| Subsaharan African | 1,093 | 0.6% |
| Sudanese | 12 | 0.0% |
| Swedish | 3,425 | 2.0% |
| Swiss | 417 | 0.3% |
| Thai | 836 | 0.5% |
| Turkish | 42 | 0.0% |
| Ugandan | 6 | 0.0% |
| Ukrainian | 490 | 0.3% |
| Uruguayan | 51 | 0.0% |
| Venezuelan | 33 | 0.0% |
| Welsh | 681 | 0.4% |
| West Indian | 22 | 0.0% |
| Yugoslavian | 109 | 0.1% |
| Yuman | 33 | 0.0% |
| Zimbabwean | 175 | 0.1% | View All 135 Rows |
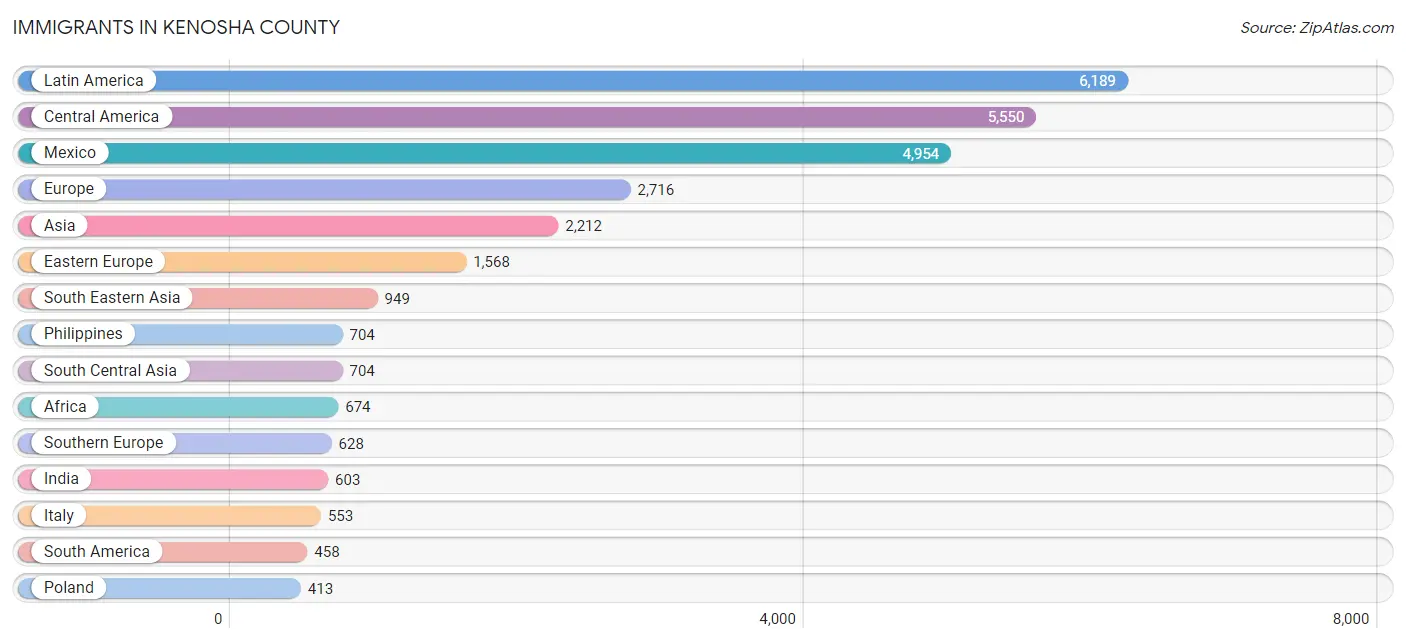
Immigrants in Kenosha County
The most numerous immigrant groups reported in Kenosha County came from Latin America (6,189 | 3.7%), Central America (5,550 | 3.3%), Mexico (4,954 | 2.9%), Europe (2,716 | 1.6%), and Asia (2,212 | 1.3%), together accounting for 12.8% of all Kenosha County residents.
| Immigration Origin | # Population | % Population |
| Africa | 674 | 0.4% |
| Argentina | 111 | 0.1% |
| Armenia | 50 | 0.0% |
| Asia | 2,212 | 1.3% |
| Australia | 12 | 0.0% |
| Austria | 11 | 0.0% |
| Belarus | 15 | 0.0% |
| Belgium | 6 | 0.0% |
| Belize | 19 | 0.0% |
| Brazil | 61 | 0.0% |
| Bulgaria | 44 | 0.0% |
| Cambodia | 39 | 0.0% |
| Canada | 151 | 0.1% |
| Caribbean | 181 | 0.1% |
| Central America | 5,550 | 3.3% |
| Chile | 28 | 0.0% |
| China | 209 | 0.1% |
| Colombia | 100 | 0.1% |
| Czechoslovakia | 13 | 0.0% |
| Dominican Republic | 53 | 0.0% |
| Eastern Africa | 152 | 0.1% |
| Eastern Asia | 380 | 0.2% |
| Eastern Europe | 1,568 | 0.9% |
| Egypt | 39 | 0.0% |
| El Salvador | 16 | 0.0% |
| England | 21 | 0.0% |
| Ethiopia | 14 | 0.0% |
| Europe | 2,716 | 1.6% |
| France | 33 | 0.0% |
| Germany | 298 | 0.2% |
| Greece | 51 | 0.0% |
| Guatemala | 190 | 0.1% |
| Haiti | 77 | 0.1% |
| Honduras | 198 | 0.1% |
| Hungary | 34 | 0.0% |
| India | 603 | 0.4% |
| Indonesia | 6 | 0.0% |
| Iran | 26 | 0.0% |
| Ireland | 23 | 0.0% |
| Israel | 6 | 0.0% |
| Italy | 553 | 0.3% |
| Jamaica | 51 | 0.0% |
| Japan | 54 | 0.0% |
| Jordan | 47 | 0.0% |
| Kazakhstan | 50 | 0.0% |
| Kenya | 23 | 0.0% |
| Korea | 117 | 0.1% |
| Kuwait | 31 | 0.0% |
| Laos | 93 | 0.1% |
| Latin America | 6,189 | 3.7% |
| Latvia | 10 | 0.0% |
| Liberia | 63 | 0.0% |
| Lithuania | 65 | 0.0% |
| Malaysia | 9 | 0.0% |
| Mexico | 4,954 | 2.9% |
| Middle Africa | 76 | 0.1% |
| Nepal | 25 | 0.0% |
| Netherlands | 20 | 0.0% |
| Nicaragua | 124 | 0.1% |
| Nigeria | 245 | 0.2% |
| Northern Africa | 64 | 0.0% |
| Northern Europe | 152 | 0.1% |
| Oceania | 37 | 0.0% |
| Panama | 49 | 0.0% |
| Peru | 74 | 0.0% |
| Philippines | 704 | 0.4% |
| Poland | 413 | 0.2% |
| Portugal | 1 | 0.0% |
| Romania | 215 | 0.1% |
| Russia | 116 | 0.1% |
| Scotland | 39 | 0.0% |
| Serbia | 21 | 0.0% |
| South Africa | 40 | 0.0% |
| South America | 458 | 0.3% |
| South Central Asia | 704 | 0.4% |
| South Eastern Asia | 949 | 0.6% |
| Southern Europe | 628 | 0.4% |
| Spain | 23 | 0.0% |
| Sudan | 12 | 0.0% |
| Sweden | 1 | 0.0% |
| Taiwan | 8 | 0.0% |
| Thailand | 38 | 0.0% |
| Turkey | 15 | 0.0% |
| Uganda | 6 | 0.0% |
| Ukraine | 113 | 0.1% |
| Uruguay | 51 | 0.0% |
| Venezuela | 33 | 0.0% |
| Vietnam | 52 | 0.0% |
| Western Africa | 342 | 0.2% |
| Western Asia | 163 | 0.1% |
| Western Europe | 368 | 0.2% |
| Yemen | 12 | 0.0% |
| Zaire | 9 | 0.0% |
| Zimbabwe | 98 | 0.1% | View All 94 Rows |
Sex and Age in Kenosha County
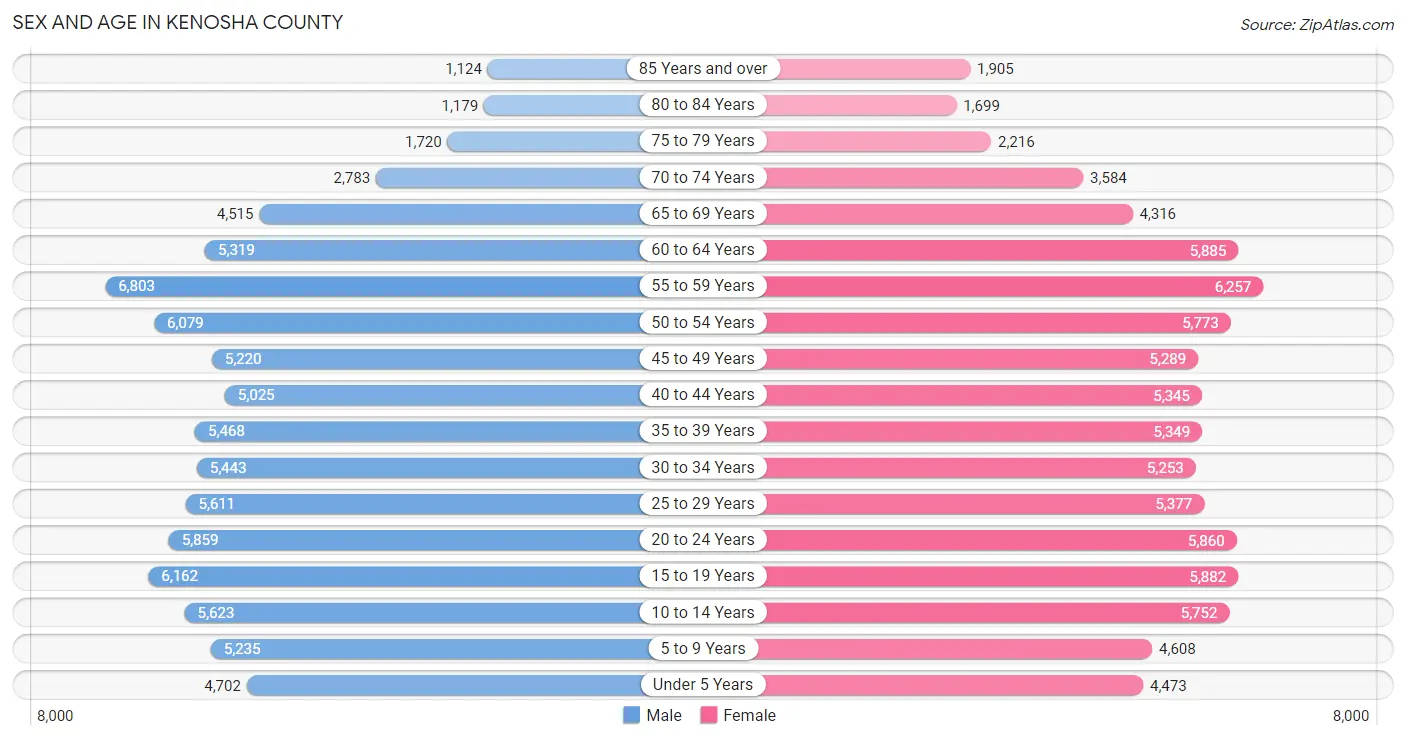
Sex and Age in Kenosha County
The most populous age groups in Kenosha County are 55 to 59 Years (6,803 | 8.1%) for men and 55 to 59 Years (6,257 | 7.4%) for women.
| Age Bracket | Male | Female |
| Under 5 Years | 4,702 (5.6%) | 4,473 (5.3%) |
| 5 to 9 Years | 5,235 (6.2%) | 4,608 (5.4%) |
| 10 to 14 Years | 5,623 (6.7%) | 5,752 (6.8%) |
| 15 to 19 Years | 6,162 (7.3%) | 5,882 (6.9%) |
| 20 to 24 Years | 5,859 (7.0%) | 5,860 (6.9%) |
| 25 to 29 Years | 5,611 (6.7%) | 5,377 (6.3%) |
| 30 to 34 Years | 5,443 (6.5%) | 5,253 (6.2%) |
| 35 to 39 Years | 5,468 (6.5%) | 5,349 (6.3%) |
| 40 to 44 Years | 5,025 (6.0%) | 5,345 (6.3%) |
| 45 to 49 Years | 5,220 (6.2%) | 5,289 (6.2%) |
| 50 to 54 Years | 6,079 (7.2%) | 5,773 (6.8%) |
| 55 to 59 Years | 6,803 (8.1%) | 6,257 (7.4%) |
| 60 to 64 Years | 5,319 (6.3%) | 5,885 (6.9%) |
| 65 to 69 Years | 4,515 (5.4%) | 4,316 (5.1%) |
| 70 to 74 Years | 2,783 (3.3%) | 3,584 (4.2%) |
| 75 to 79 Years | 1,720 (2.1%) | 2,216 (2.6%) |
| 80 to 84 Years | 1,179 (1.4%) | 1,699 (2.0%) |
| 85 Years and over | 1,124 (1.3%) | 1,905 (2.2%) |
| Total | 83,870 (100.0%) | 84,823 (100.0%) |
Families and Households in Kenosha County
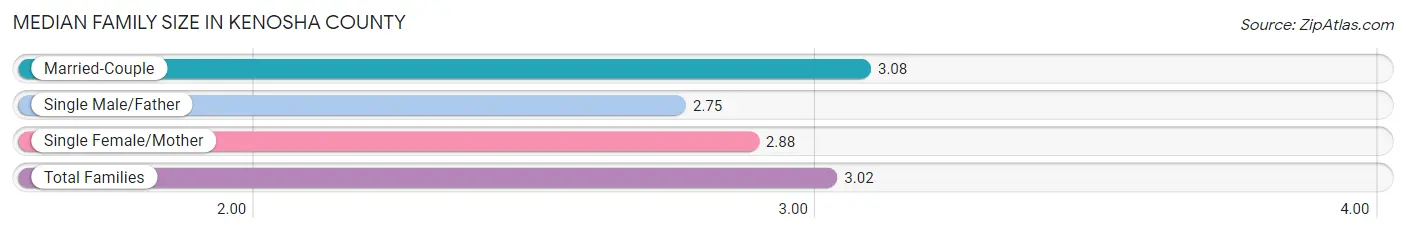
Median Family Size in Kenosha County
The median family size in Kenosha County is 3.02 persons per family, with married-couple families (32,296 | 74.3%) accounting for the largest median family size of 3.08 persons per family. On the other hand, single male/father families (3,641 | 8.4%) represent the smallest median family size with 2.75 persons per family.
| Family Type | # Families | Family Size |
| Married-Couple | 32,296 (74.3%) | 3.08 |
| Single Male/Father | 3,641 (8.4%) | 2.75 |
| Single Female/Mother | 7,519 (17.3%) | 2.88 |
| Total Families | 43,456 (100.0%) | 3.02 |
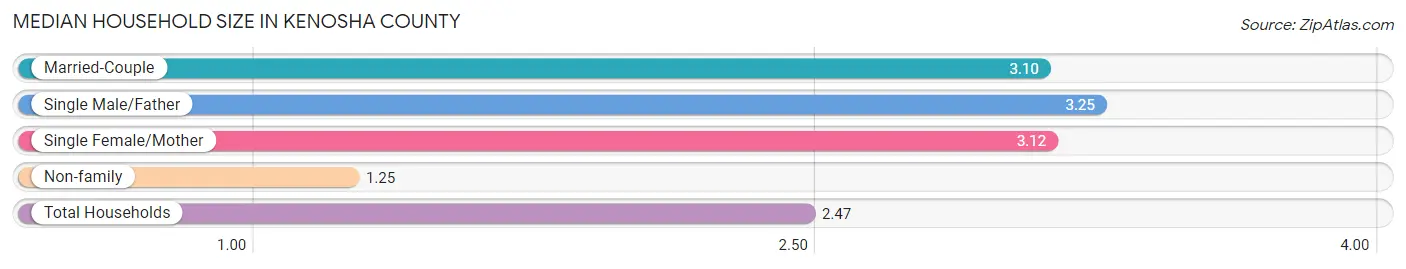
Median Household Size in Kenosha County
The median household size in Kenosha County is 2.47 persons per household, with single male/father households (3,641 | 5.5%) accounting for the largest median household size of 3.25 persons per household. non-family households (23,249 | 34.8%) represent the smallest median household size with 1.25 persons per household.
| Household Type | # Households | Household Size |
| Married-Couple | 32,296 (48.4%) | 3.10 |
| Single Male/Father | 3,641 (5.5%) | 3.25 |
| Single Female/Mother | 7,519 (11.3%) | 3.12 |
| Non-family | 23,249 (34.8%) | 1.25 |
| Total Households | 66,705 (100.0%) | 2.47 |
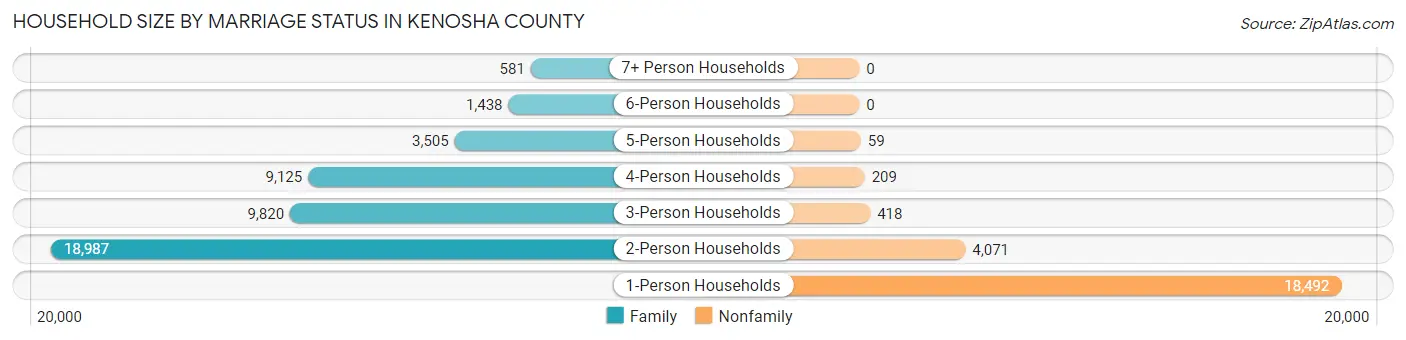
Household Size by Marriage Status in Kenosha County
Out of a total of 66,705 households in Kenosha County, 43,456 (65.1%) are family households, while 23,249 (34.8%) are nonfamily households. The most numerous type of family households are 2-person households, comprising 18,987, and the most common type of nonfamily households are 1-person households, comprising 18,492.
| Household Size | Family Households | Nonfamily Households |
| 1-Person Households | - | 18,492 (27.7%) |
| 2-Person Households | 18,987 (28.5%) | 4,071 (6.1%) |
| 3-Person Households | 9,820 (14.7%) | 418 (0.6%) |
| 4-Person Households | 9,125 (13.7%) | 209 (0.3%) |
| 5-Person Households | 3,505 (5.2%) | 59 (0.1%) |
| 6-Person Households | 1,438 (2.2%) | 0 (0.0%) |
| 7+ Person Households | 581 (0.9%) | 0 (0.0%) |
| Total | 43,456 (65.1%) | 23,249 (34.8%) |
Female Fertility in Kenosha County
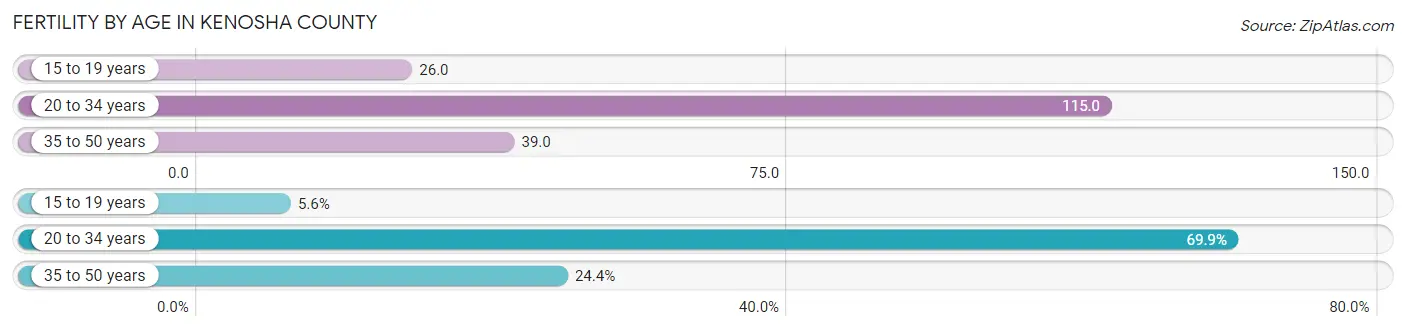
Fertility by Age in Kenosha County
Average fertility rate in Kenosha County is 69.0 births per 1,000 women. Women in the age bracket of 20 to 34 years have the highest fertility rate with 115.0 births per 1,000 women. Women in the age bracket of 20 to 34 years acount for 69.9% of all women with births.
| Age Bracket | Women with Births | Births / 1,000 Women |
| 15 to 19 years | 153 (5.6%) | 26.0 |
| 20 to 34 years | 1,901 (69.9%) | 115.0 |
| 35 to 50 years | 664 (24.4%) | 39.0 |
| Total | 2,718 (100.0%) | 69.0 |
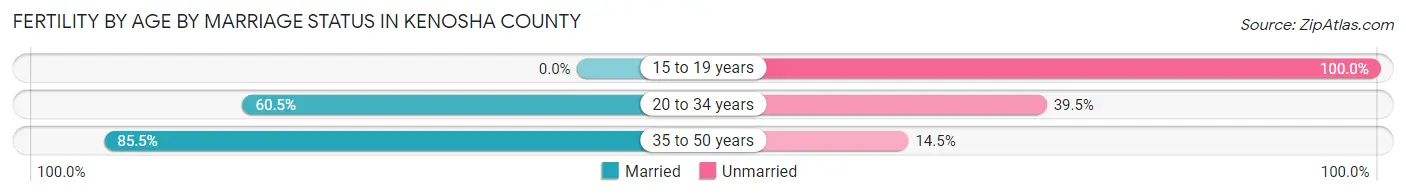
Fertility by Age by Marriage Status in Kenosha County
63.2% of women with births (2,718) in Kenosha County are married. The highest percentage of unmarried women with births falls into 15 to 19 years age bracket with 100.0% of them unmarried at the time of birth, while the lowest percentage of unmarried women with births belong to 35 to 50 years age bracket with 14.5% of them unmarried.
| Age Bracket | Married | Unmarried |
| 15 to 19 years | 0 (0.0%) | 153 (100.0%) |
| 20 to 34 years | 1,150 (60.5%) | 751 (39.5%) |
| 35 to 50 years | 568 (85.5%) | 96 (14.5%) |
| Total | 1,718 (63.2%) | 1,000 (36.8%) |
Fertility by Education in Kenosha County
Average fertility rate in Kenosha County is 69.0 births per 1,000 women. Women with the education attainment of high school diploma have the highest fertility rate of 94.0 births per 1,000 women, while women with the education attainment of less than high school have the lowest fertility at 32.0 births per 1,000 women. Women with the education attainment of college or associate's degree represent 33.7% of all women with births.

| Educational Attainment | Women with Births | Births / 1,000 Women |
| Less than High School | 183 (6.7%) | 32.0 |
| High School Diploma | 802 (29.5%) | 94.0 |
| College or Associate's Degree | 915 (33.7%) | 69.0 |
| Bachelor's Degree | 610 (22.4%) | 76.0 |
| Graduate Degree | 208 (7.6%) | 53.0 |
| Total | 2,718 (100.0%) | 69.0 |
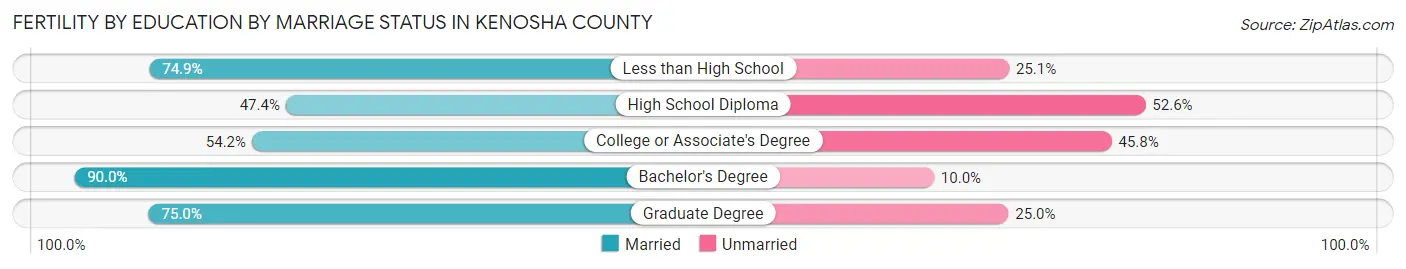
Fertility by Education by Marriage Status in Kenosha County
36.8% of women with births in Kenosha County are unmarried. Women with the educational attainment of bachelor's degree are most likely to be married with 90.0% of them married at childbirth, while women with the educational attainment of high school diploma are least likely to be married with 52.6% of them unmarried at childbirth.
| Educational Attainment | Married | Unmarried |
| Less than High School | 137 (74.9%) | 46 (25.1%) |
| High School Diploma | 380 (47.4%) | 422 (52.6%) |
| College or Associate's Degree | 496 (54.2%) | 419 (45.8%) |
| Bachelor's Degree | 549 (90.0%) | 61 (10.0%) |
| Graduate Degree | 156 (75.0%) | 52 (25.0%) |
| Total | 1,718 (63.2%) | 1,000 (36.8%) |
Income in Kenosha County
Income Overview in Kenosha County
Per Capita Income in Kenosha County is $38,720, while median incomes of families and households are $94,742 and $76,583 respectively.
| Characteristic | Number | Measure |
| Per Capita Income | 168,693 | $38,720 |
| Median Family Income | 43,456 | $94,742 |
| Mean Family Income | 43,456 | $113,490 |
| Median Household Income | 66,705 | $76,583 |
| Mean Household Income | 66,705 | $96,154 |
| Income Deficit | 43,456 | $9,755 |
| Wage / Income Gap (%) | 168,693 | 27.81% |
| Wage / Income Gap ($) | 168,693 | 72.19¢ per $1 |
| Gini / Inequality Index | 168,693 | 0.42 |
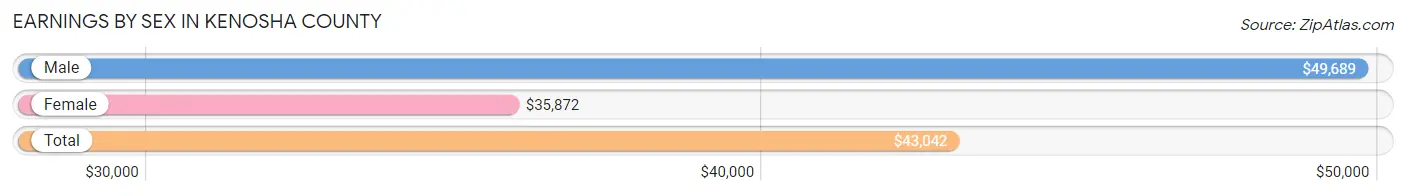
Earnings by Sex in Kenosha County
Average Earnings in Kenosha County are $43,042, $49,689 for men and $35,872 for women, a difference of 27.8%.
| Sex | Number | Average Earnings |
| Male | 49,524 (52.0%) | $49,689 |
| Female | 45,788 (48.0%) | $35,872 |
| Total | 95,312 (100.0%) | $43,042 |
Earnings by Sex by Income Bracket in Kenosha County
The most common earnings brackets in Kenosha County are $100,000+ for men (7,872 | 15.9%) and $75,000 to $99,999 for women (3,891 | 8.5%).
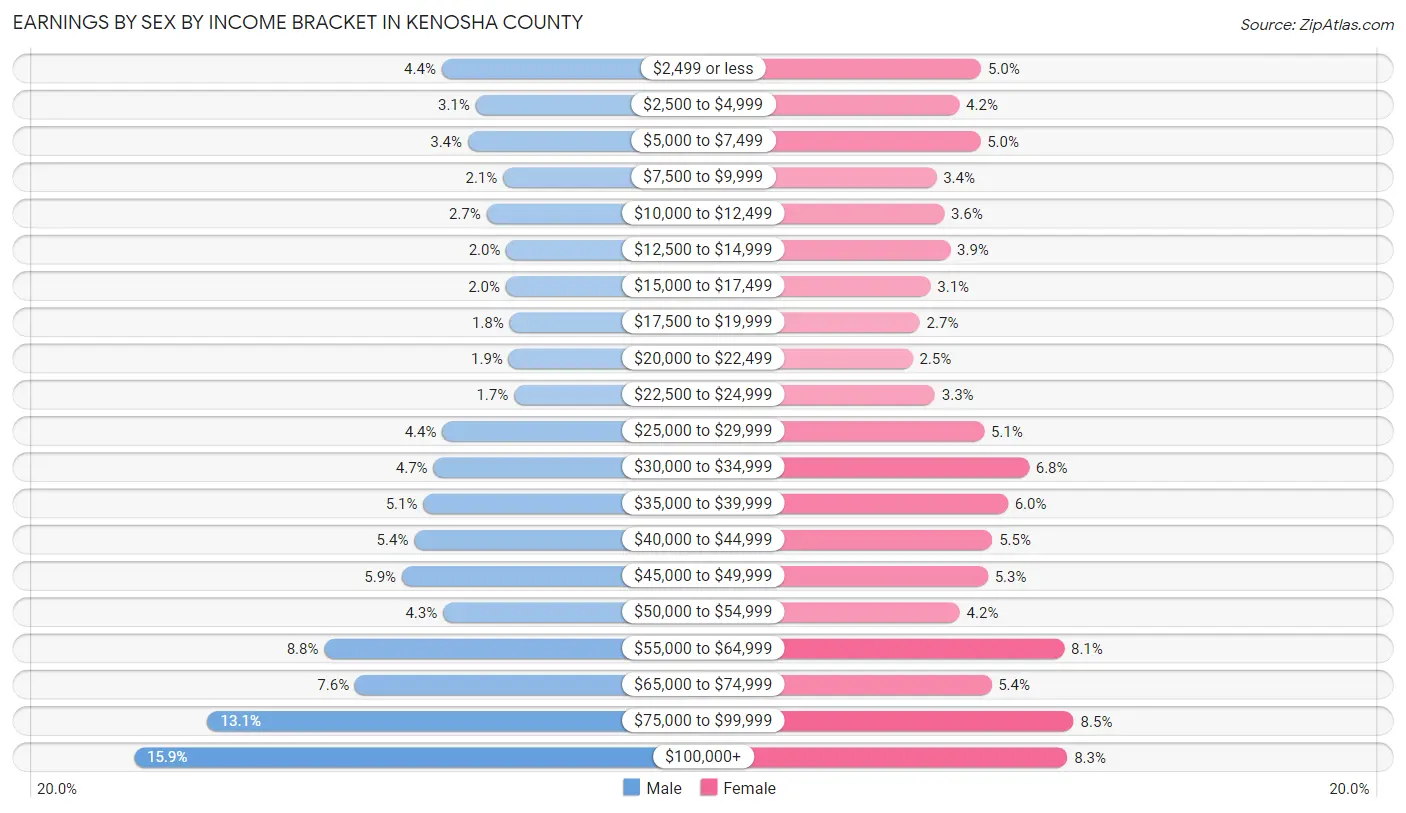
| Income | Male | Female |
| $2,499 or less | 2,163 (4.4%) | 2,303 (5.0%) |
| $2,500 to $4,999 | 1,534 (3.1%) | 1,929 (4.2%) |
| $5,000 to $7,499 | 1,680 (3.4%) | 2,291 (5.0%) |
| $7,500 to $9,999 | 1,024 (2.1%) | 1,534 (3.4%) |
| $10,000 to $12,499 | 1,333 (2.7%) | 1,668 (3.6%) |
| $12,500 to $14,999 | 967 (1.9%) | 1,774 (3.9%) |
| $15,000 to $17,499 | 978 (2.0%) | 1,432 (3.1%) |
| $17,500 to $19,999 | 908 (1.8%) | 1,251 (2.7%) |
| $20,000 to $22,499 | 921 (1.9%) | 1,128 (2.5%) |
| $22,500 to $24,999 | 823 (1.7%) | 1,510 (3.3%) |
| $25,000 to $29,999 | 2,156 (4.3%) | 2,354 (5.1%) |
| $30,000 to $34,999 | 2,316 (4.7%) | 3,125 (6.8%) |
| $35,000 to $39,999 | 2,504 (5.1%) | 2,761 (6.0%) |
| $40,000 to $44,999 | 2,674 (5.4%) | 2,497 (5.4%) |
| $45,000 to $49,999 | 2,901 (5.9%) | 2,417 (5.3%) |
| $50,000 to $54,999 | 2,141 (4.3%) | 1,935 (4.2%) |
| $55,000 to $64,999 | 4,345 (8.8%) | 3,728 (8.1%) |
| $65,000 to $74,999 | 3,775 (7.6%) | 2,477 (5.4%) |
| $75,000 to $99,999 | 6,509 (13.1%) | 3,891 (8.5%) |
| $100,000+ | 7,872 (15.9%) | 3,783 (8.3%) |
| Total | 49,524 (100.0%) | 45,788 (100.0%) |
Earnings by Sex by Educational Attainment in Kenosha County
Average earnings in Kenosha County are $57,951 for men and $42,885 for women, a difference of 26.0%. Men with an educational attainment of graduate degree enjoy the highest average annual earnings of $92,862, while those with less than high school education earn the least with $42,697. Women with an educational attainment of graduate degree earn the most with the average annual earnings of $71,329, while those with less than high school education have the smallest earnings of $30,293.
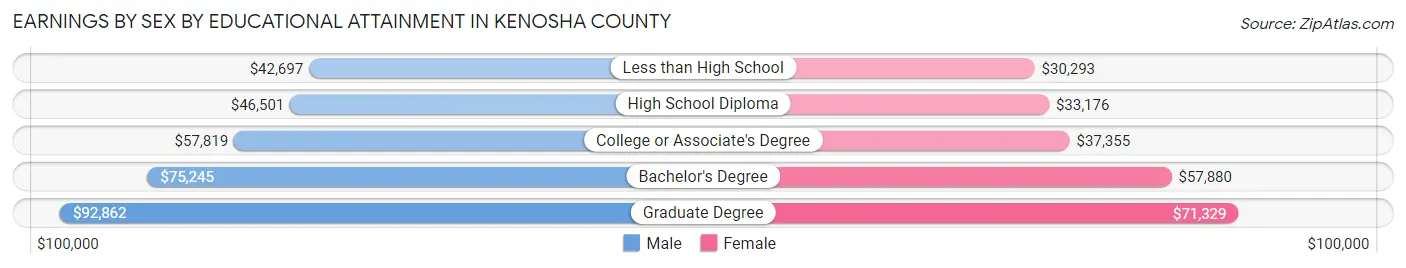
| Educational Attainment | Male Income | Female Income |
| Less than High School | $42,697 | $30,293 |
| High School Diploma | $46,501 | $33,176 |
| College or Associate's Degree | $57,819 | $37,355 |
| Bachelor's Degree | $75,245 | $57,880 |
| Graduate Degree | $92,862 | $71,329 |
| Total | $57,951 | $42,885 |
Family Income in Kenosha County
Family Income Brackets in Kenosha County
According to the Kenosha County family income data, there are 10,082 families falling into the $100,000 to $149,999 income range, which is the most common income bracket and makes up 23.2% of all families. Conversely, the $10,000 to $14,999 income bracket is the least frequent group with only 826 families (1.9%) belonging to this category.
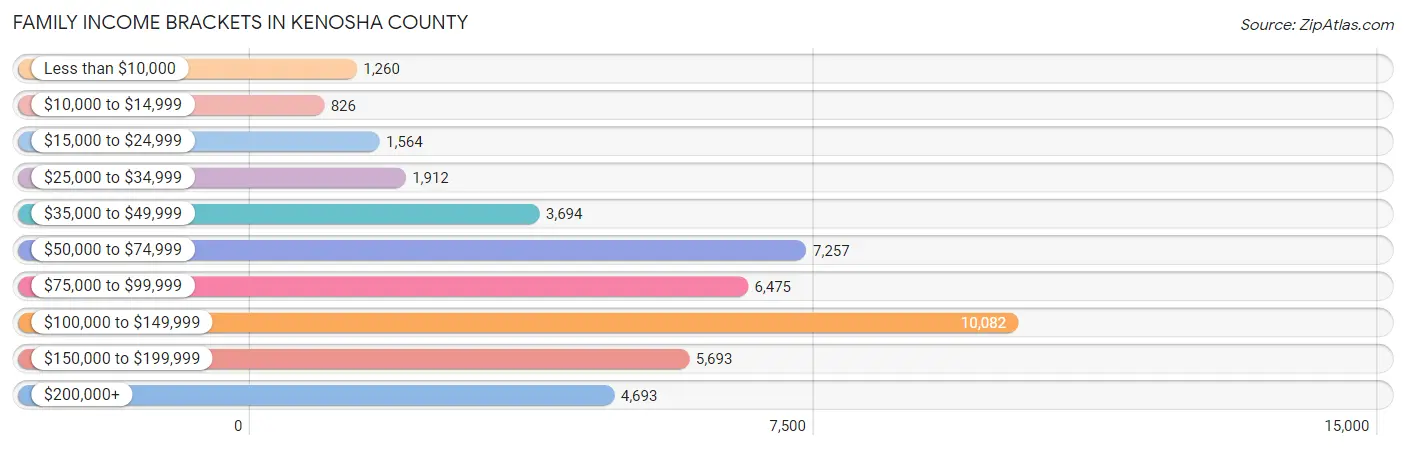
| Income Bracket | # Families | % Families |
| Less than $10,000 | 1,260 | 2.9% |
| $10,000 to $14,999 | 826 | 1.9% |
| $15,000 to $24,999 | 1,564 | 3.6% |
| $25,000 to $34,999 | 1,912 | 4.4% |
| $35,000 to $49,999 | 3,694 | 8.5% |
| $50,000 to $74,999 | 7,257 | 16.7% |
| $75,000 to $99,999 | 6,475 | 14.9% |
| $100,000 to $149,999 | 10,082 | 23.2% |
| $150,000 to $199,999 | 5,693 | 13.1% |
| $200,000+ | 4,693 | 10.8% |
Family Income by Famaliy Size in Kenosha County
6-person families (1,131 | 2.6%) account for the highest median family income in Kenosha County with $142,083 per family, while 2-person families (20,764 | 47.8%) have the highest median income of $42,136 per family member.
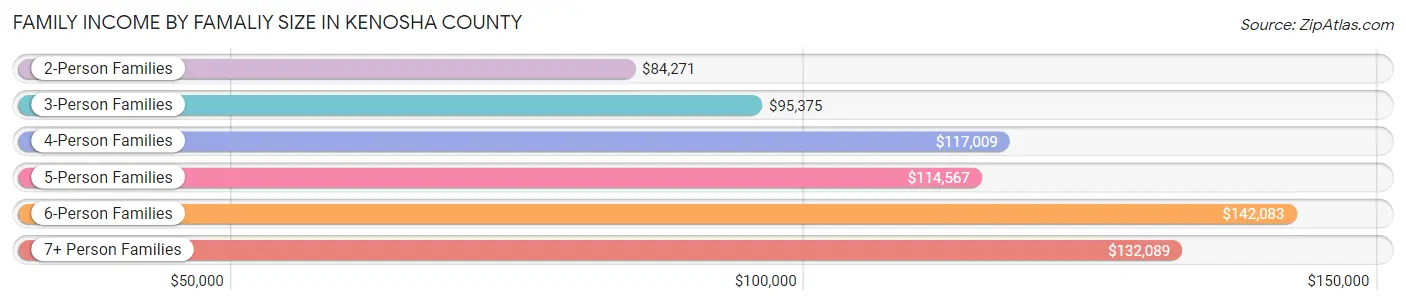
| Income Bracket | # Families | Median Income |
| 2-Person Families | 20,764 (47.8%) | $84,271 |
| 3-Person Families | 9,469 (21.8%) | $95,375 |
| 4-Person Families | 8,133 (18.7%) | $117,009 |
| 5-Person Families | 3,488 (8.0%) | $114,567 |
| 6-Person Families | 1,131 (2.6%) | $142,083 |
| 7+ Person Families | 471 (1.1%) | $132,089 |
| Total | 43,456 (100.0%) | $94,742 |
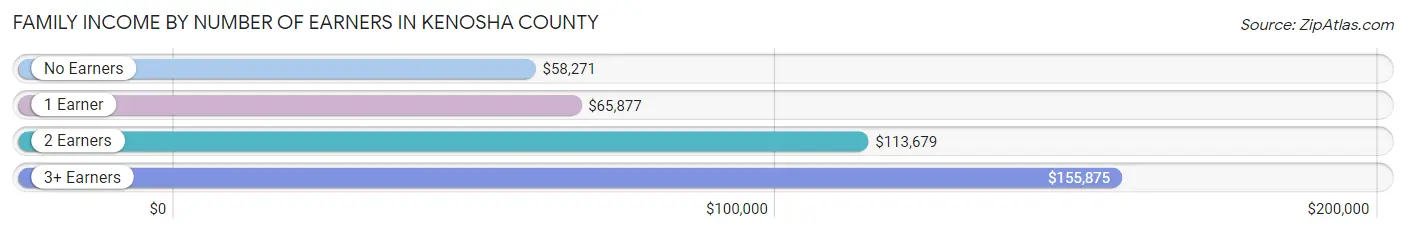
Family Income by Number of Earners in Kenosha County
The median family income in Kenosha County is $94,742, with families comprising 3+ earners (6,005) having the highest median family income of $155,875, while families with no earners (6,072) have the lowest median family income of $58,271, accounting for 13.8% and 14.0% of families, respectively.
| Number of Earners | # Families | Median Income |
| No Earners | 6,072 (14.0%) | $58,271 |
| 1 Earner | 13,678 (31.5%) | $65,877 |
| 2 Earners | 17,701 (40.7%) | $113,679 |
| 3+ Earners | 6,005 (13.8%) | $155,875 |
| Total | 43,456 (100.0%) | $94,742 |
Household Income in Kenosha County
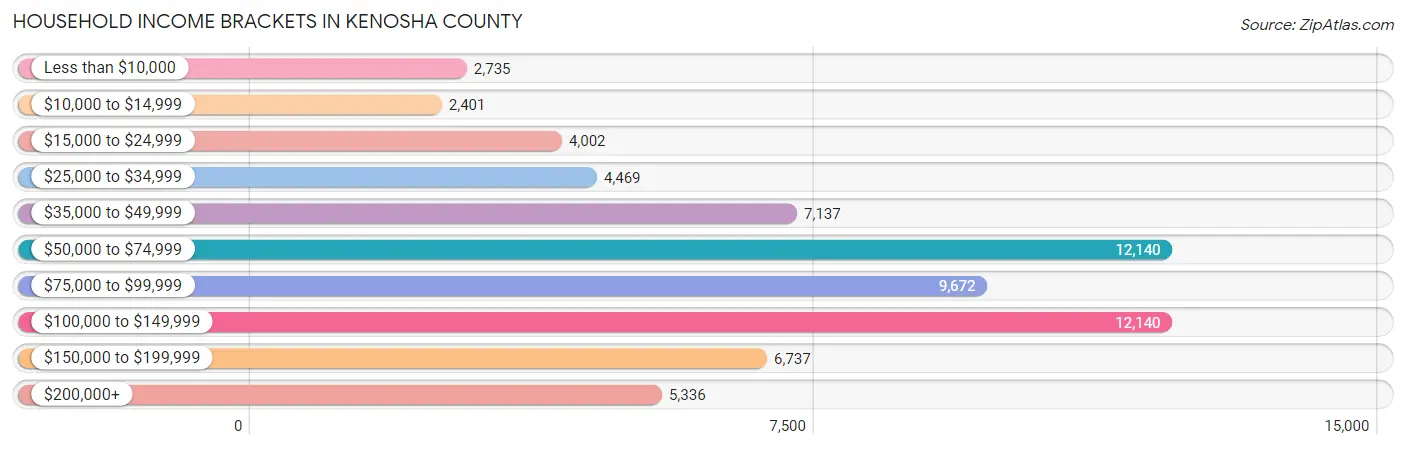
Household Income Brackets in Kenosha County
With 12,140 households falling in the category, the $50,000 to $74,999 income range is the most frequent in Kenosha County, accounting for 18.2% of all households. In contrast, only 2,401 households (3.6%) fall into the $10,000 to $14,999 income bracket, making it the least populous group.
| Income Bracket | # Households | % Households |
| Less than $10,000 | 2,735 | 4.1% |
| $10,000 to $14,999 | 2,401 | 3.6% |
| $15,000 to $24,999 | 4,002 | 6.0% |
| $25,000 to $34,999 | 4,469 | 6.7% |
| $35,000 to $49,999 | 7,137 | 10.7% |
| $50,000 to $74,999 | 12,140 | 18.2% |
| $75,000 to $99,999 | 9,672 | 14.5% |
| $100,000 to $149,999 | 12,140 | 18.2% |
| $150,000 to $199,999 | 6,737 | 10.1% |
| $200,000+ | 5,336 | 8.0% |
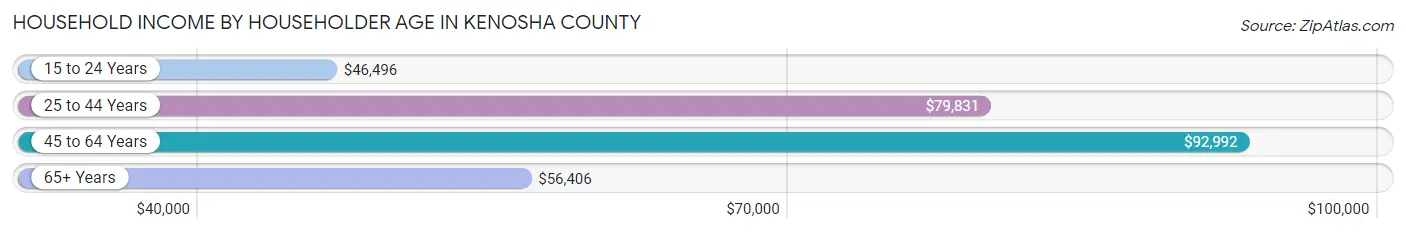
Household Income by Householder Age in Kenosha County
The median household income in Kenosha County is $76,583, with the highest median household income of $92,992 found in the 45 to 64 years age bracket for the primary householder. A total of 27,399 households (41.1%) fall into this category. Meanwhile, the 15 to 24 years age bracket for the primary householder has the lowest median household income of $46,496, with 2,547 households (3.8%) in this group.
| Income Bracket | # Households | Median Income |
| 15 to 24 Years | 2,547 (3.8%) | $46,496 |
| 25 to 44 Years | 20,584 (30.9%) | $79,831 |
| 45 to 64 Years | 27,399 (41.1%) | $92,992 |
| 65+ Years | 16,175 (24.2%) | $56,406 |
| Total | 66,705 (100.0%) | $76,583 |
Poverty in Kenosha County
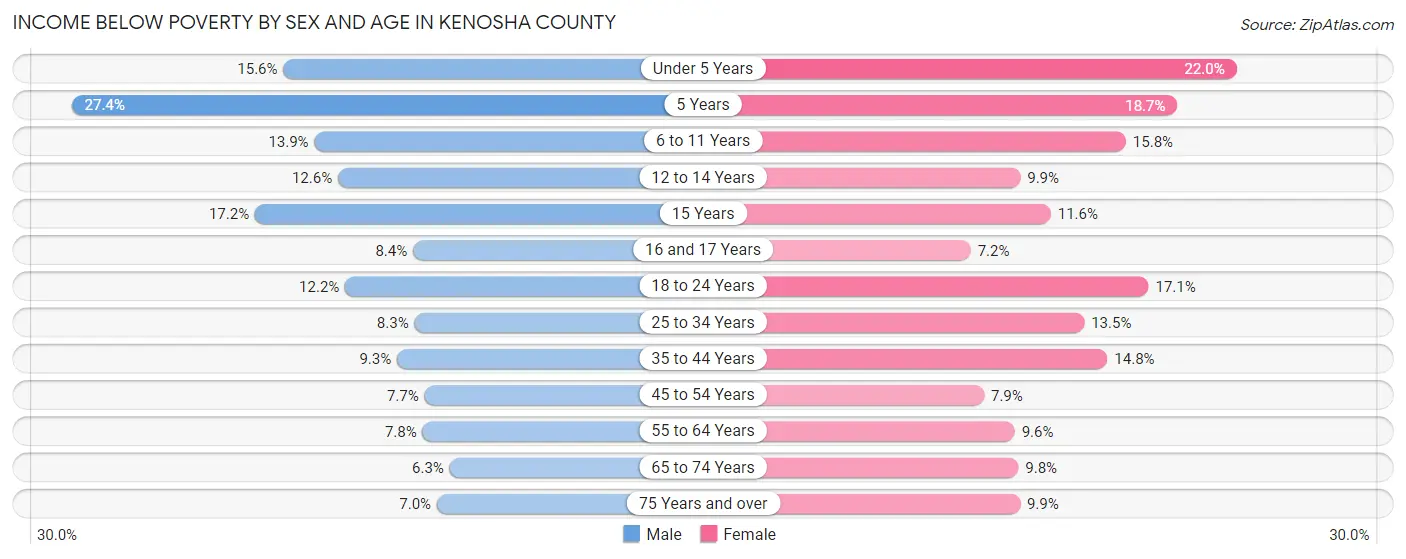
Income Below Poverty by Sex and Age in Kenosha County
With 9.8% poverty level for males and 12.4% for females among the residents of Kenosha County, 5 year old males and under 5 year old females are the most vulnerable to poverty, with 265 males (27.4%) and 963 females (22.0%) in their respective age groups living below the poverty level.
| Age Bracket | Male | Female |
| Under 5 Years | 717 (15.6%) | 963 (22.0%) |
| 5 Years | 265 (27.4%) | 170 (18.7%) |
| 6 to 11 Years | 877 (13.9%) | 958 (15.8%) |
| 12 to 14 Years | 422 (12.6%) | 328 (9.9%) |
| 15 Years | 199 (17.2%) | 145 (11.6%) |
| 16 and 17 Years | 195 (8.4%) | 158 (7.2%) |
| 18 to 24 Years | 909 (12.1%) | 1,216 (17.1%) |
| 25 to 34 Years | 900 (8.3%) | 1,434 (13.5%) |
| 35 to 44 Years | 960 (9.3%) | 1,579 (14.8%) |
| 45 to 54 Years | 868 (7.7%) | 874 (7.9%) |
| 55 to 64 Years | 946 (7.8%) | 1,165 (9.6%) |
| 65 to 74 Years | 458 (6.3%) | 771 (9.8%) |
| 75 Years and over | 273 (7.0%) | 534 (9.9%) |
| Total | 7,989 (9.8%) | 10,295 (12.4%) |
Income Above Poverty by Sex and Age in Kenosha County
According to the poverty statistics in Kenosha County, males aged 65 to 74 years and females aged 16 and 17 years are the age groups that are most secure financially, with 93.7% of males and 92.8% of females in these age groups living above the poverty line.
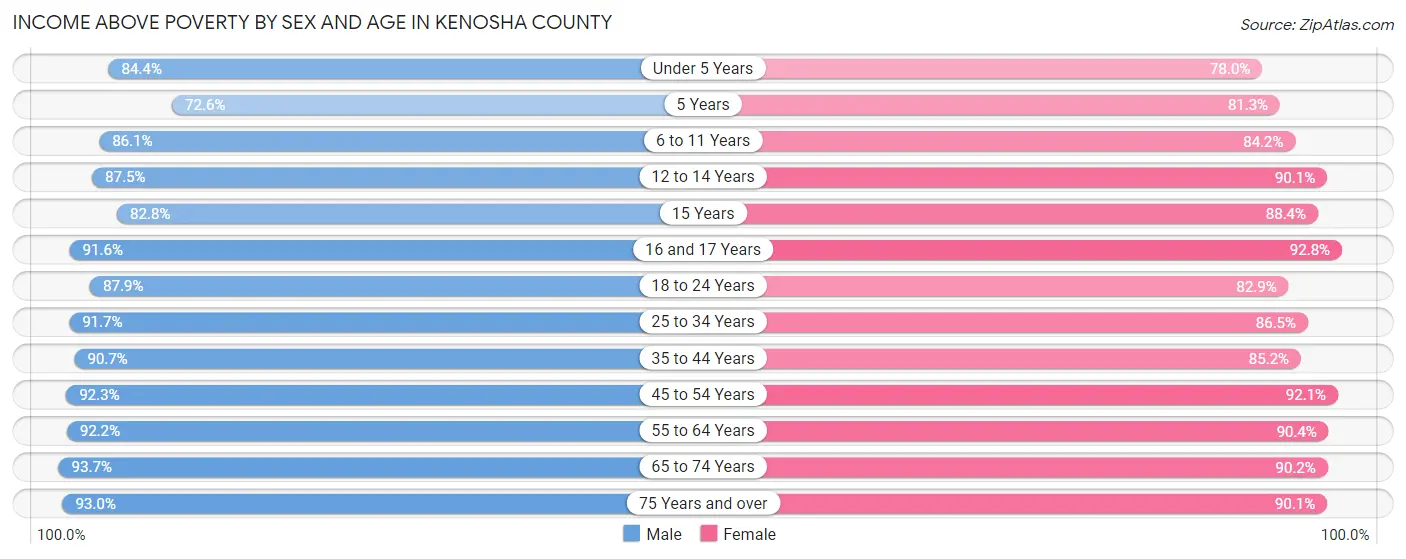
| Age Bracket | Male | Female |
| Under 5 Years | 3,881 (84.4%) | 3,419 (78.0%) |
| 5 Years | 703 (72.6%) | 740 (81.3%) |
| 6 to 11 Years | 5,450 (86.1%) | 5,099 (84.2%) |
| 12 to 14 Years | 2,941 (87.5%) | 2,971 (90.1%) |
| 15 Years | 960 (82.8%) | 1,101 (88.4%) |
| 16 and 17 Years | 2,135 (91.6%) | 2,044 (92.8%) |
| 18 to 24 Years | 6,570 (87.8%) | 5,902 (82.9%) |
| 25 to 34 Years | 9,962 (91.7%) | 9,188 (86.5%) |
| 35 to 44 Years | 9,404 (90.7%) | 9,095 (85.2%) |
| 45 to 54 Years | 10,363 (92.3%) | 10,166 (92.1%) |
| 55 to 64 Years | 11,115 (92.2%) | 10,931 (90.4%) |
| 65 to 74 Years | 6,778 (93.7%) | 7,074 (90.2%) |
| 75 Years and over | 3,606 (93.0%) | 4,851 (90.1%) |
| Total | 73,868 (90.2%) | 72,581 (87.6%) |
Income Below Poverty Among Married-Couple Families in Kenosha County
The poverty statistics for married-couple families in Kenosha County show that 4.3% or 1,406 of the total 32,296 families live below the poverty line. Families with 5 or more children have the highest poverty rate of 36.7%, comprising of 54 families. On the other hand, families with no children have the lowest poverty rate of 3.7%, which includes 730 families.
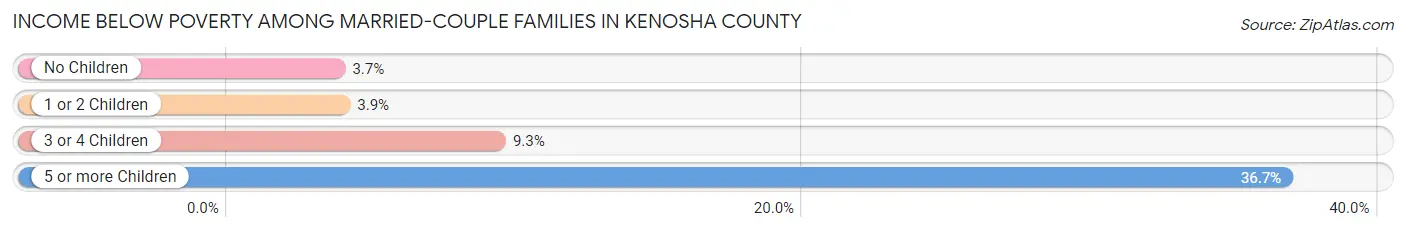
| Children | Above Poverty | Below Poverty |
| No Children | 18,803 (96.3%) | 730 (3.7%) |
| 1 or 2 Children | 9,847 (96.1%) | 401 (3.9%) |
| 3 or 4 Children | 2,147 (90.7%) | 221 (9.3%) |
| 5 or more Children | 93 (63.3%) | 54 (36.7%) |
| Total | 30,890 (95.7%) | 1,406 (4.3%) |
Income Below Poverty Among Single-Parent Households in Kenosha County
According to the poverty data in Kenosha County, 11.7% or 427 single-father households and 23.2% or 1,746 single-mother households are living below the poverty line. Among single-father households, those with 3 or 4 children have the highest poverty rate, with 59 households (21.1%) experiencing poverty. Likewise, among single-mother households, those with 5 or more children have the highest poverty rate, with 37 households (50.0%) falling below the poverty line.
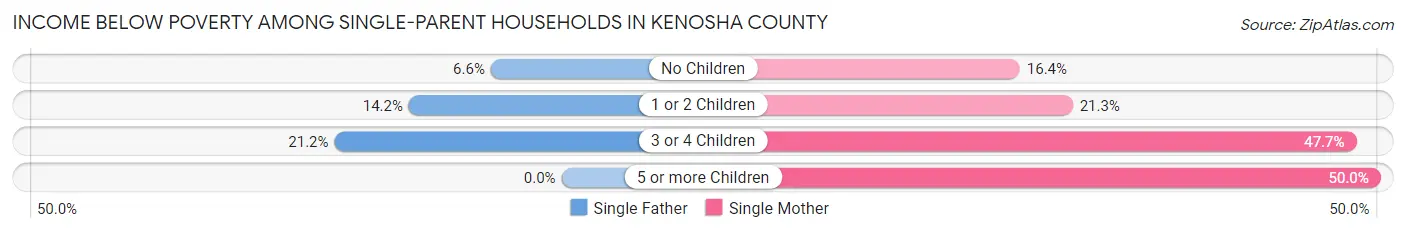
| Children | Single Father | Single Mother |
| No Children | 90 (6.6%) | 396 (16.4%) |
| 1 or 2 Children | 278 (14.2%) | 880 (21.3%) |
| 3 or 4 Children | 59 (21.1%) | 433 (47.7%) |
| 5 or more Children | 0 (0.0%) | 37 (50.0%) |
| Total | 427 (11.7%) | 1,746 (23.2%) |
Income Below Poverty Among Married-Couple vs Single-Parent Households in Kenosha County
The poverty data for Kenosha County shows that 1,406 of the married-couple family households (4.3%) and 2,173 of the single-parent households (19.5%) are living below the poverty level. Within the married-couple family households, those with 5 or more children have the highest poverty rate, with 54 households (36.7%) falling below the poverty line. Among the single-parent households, those with 3 or 4 children have the highest poverty rate, with 492 household (41.5%) living below poverty.
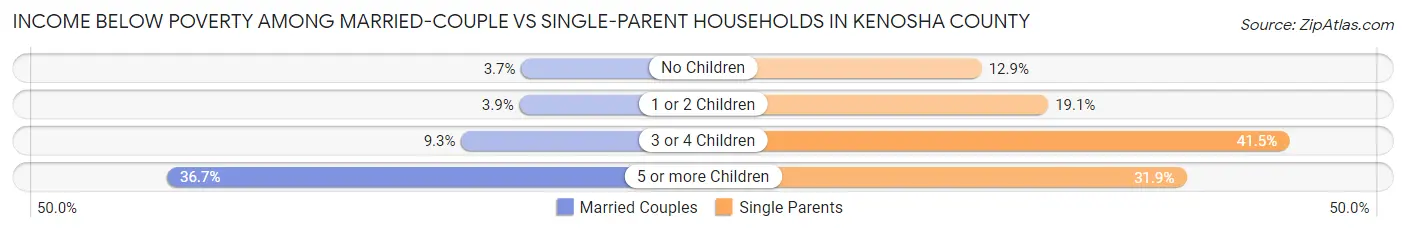
| Children | Married-Couple Families | Single-Parent Households |
| No Children | 730 (3.7%) | 486 (12.9%) |
| 1 or 2 Children | 401 (3.9%) | 1,158 (19.1%) |
| 3 or 4 Children | 221 (9.3%) | 492 (41.5%) |
| 5 or more Children | 54 (36.7%) | 37 (31.9%) |
| Total | 1,406 (4.3%) | 2,173 (19.5%) |
Employment Characteristics in Kenosha County
Employment by Class of Employer in Kenosha County
Among the 85,204 employed individuals in Kenosha County, private company employees (61,371 | 72.0%), local government employees (7,162 | 8.4%), and not-for-profit organizations (6,725 | 7.9%) make up the most common classes of employment.
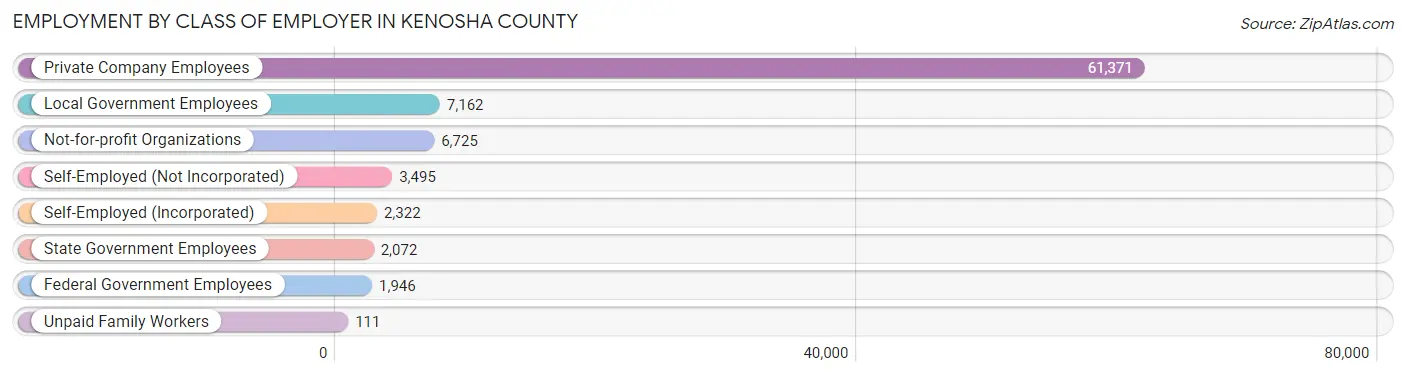
| Employer Class | # Employees | % Employees |
| Private Company Employees | 61,371 | 72.0% |
| Self-Employed (Incorporated) | 2,322 | 2.7% |
| Self-Employed (Not Incorporated) | 3,495 | 4.1% |
| Not-for-profit Organizations | 6,725 | 7.9% |
| Local Government Employees | 7,162 | 8.4% |
| State Government Employees | 2,072 | 2.4% |
| Federal Government Employees | 1,946 | 2.3% |
| Unpaid Family Workers | 111 | 0.1% |
| Total | 85,204 | 100.0% |
Employment Status by Age in Kenosha County
According to the labor force statistics for Kenosha County, out of the total population over 16 years of age (135,895), 67.4% or 91,593 individuals are in the labor force, with 5.4% or 4,946 of them unemployed. The age group with the highest labor force participation rate is 25 to 29 years, with 87.3% or 9,593 individuals in the labor force. Within the labor force, the 16 to 19 years age range has the highest percentage of unemployed individuals, with 13.8% or 710 of them being unemployed.
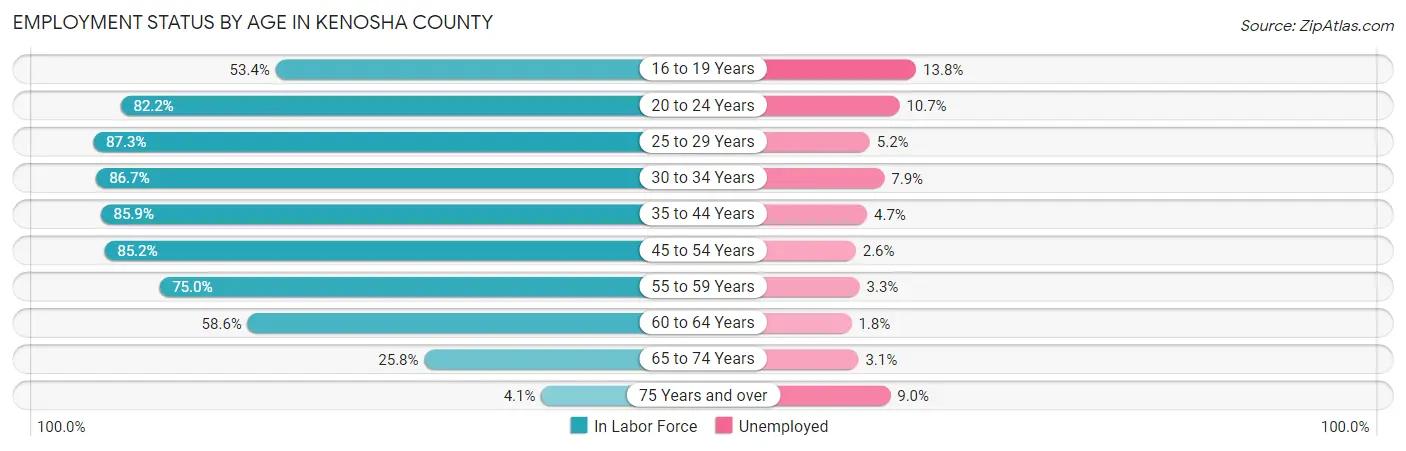
| Age Bracket | In Labor Force | Unemployed |
| 16 to 19 Years | 5,147 (53.4%) | 710 (13.8%) |
| 20 to 24 Years | 9,633 (82.2%) | 1,031 (10.7%) |
| 25 to 29 Years | 9,593 (87.3%) | 499 (5.2%) |
| 30 to 34 Years | 9,273 (86.7%) | 733 (7.9%) |
| 35 to 44 Years | 18,200 (85.9%) | 855 (4.7%) |
| 45 to 54 Years | 19,052 (85.2%) | 495 (2.6%) |
| 55 to 59 Years | 9,795 (75.0%) | 323 (3.3%) |
| 60 to 64 Years | 6,566 (58.6%) | 118 (1.8%) |
| 65 to 74 Years | 3,921 (25.8%) | 122 (3.1%) |
| 75 Years and over | 404 (4.1%) | 36 (9.0%) |
| Total | 91,593 (67.4%) | 4,946 (5.4%) |
Employment Status by Educational Attainment in Kenosha County
According to labor force statistics for Kenosha County, 81.0% of individuals (72,492) out of the total population between 25 and 64 years of age (89,496) are in the labor force, with 4.2% or 3,045 of them being unemployed. The group with the highest labor force participation rate are those with the educational attainment of bachelor's degree or higher, with 88.4% or 24,948 individuals in the labor force. Within the labor force, individuals with less than high school education have the highest percentage of unemployment, with 10.5% or 501 of them being unemployed.
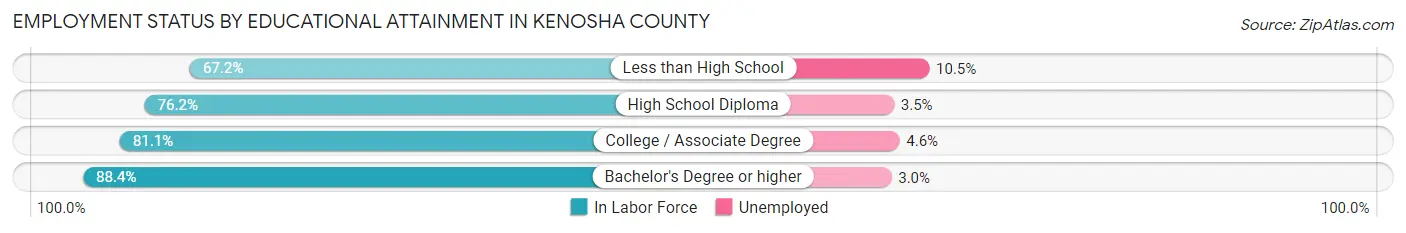
| Educational Attainment | In Labor Force | Unemployed |
| Less than High School | 4,769 (67.2%) | 745 (10.5%) |
| High School Diploma | 18,067 (76.2%) | 830 (3.5%) |
| College / Associate Degree | 24,710 (81.1%) | 1,402 (4.6%) |
| Bachelor's Degree or higher | 24,948 (88.4%) | 847 (3.0%) |
| Total | 72,492 (81.0%) | 3,759 (4.2%) |
Employment Occupations by Sex in Kenosha County
Management, Business, Science and Arts Occupations
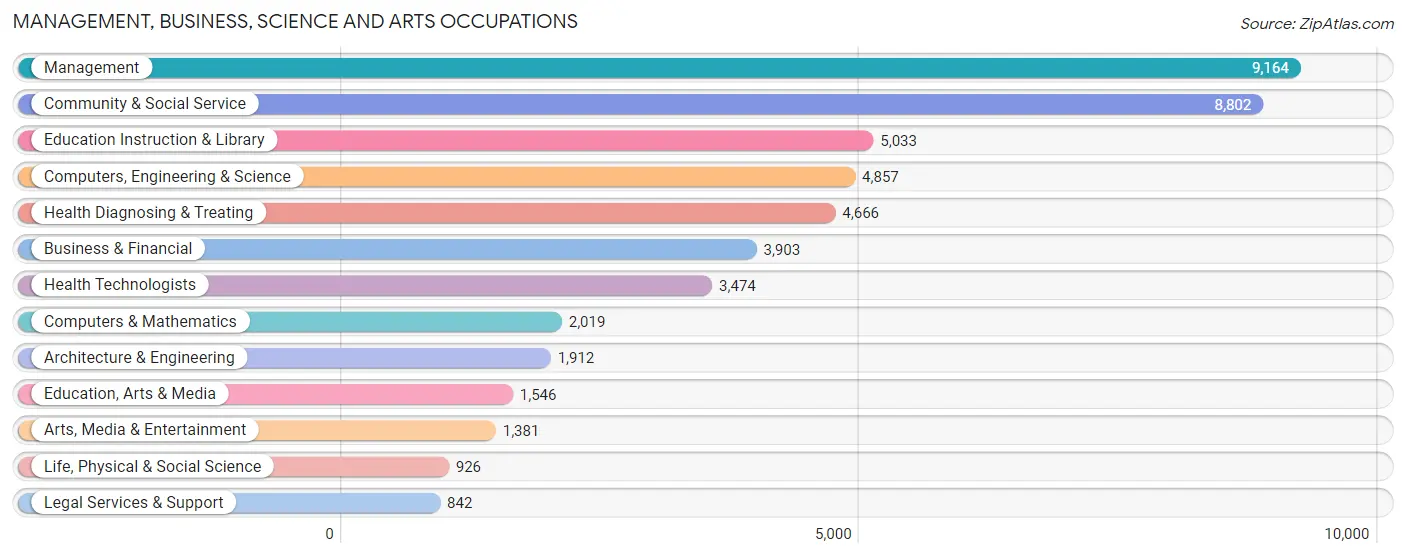
The most common Management, Business, Science and Arts occupations in Kenosha County are Management (9,164 | 10.6%), Community & Social Service (8,802 | 10.2%), Education Instruction & Library (5,033 | 5.8%), Computers, Engineering & Science (4,857 | 5.6%), and Health Diagnosing & Treating (4,666 | 5.4%).
Management, Business, Science and Arts Occupations by Sex
Within the Management, Business, Science and Arts occupations in Kenosha County, the most male-oriented occupations are Architecture & Engineering (79.9%), Computers & Mathematics (70.6%), and Computers, Engineering & Science (70.3%), while the most female-oriented occupations are Health Technologists (84.0%), Health Diagnosing & Treating (82.5%), and Education Instruction & Library (79.6%).
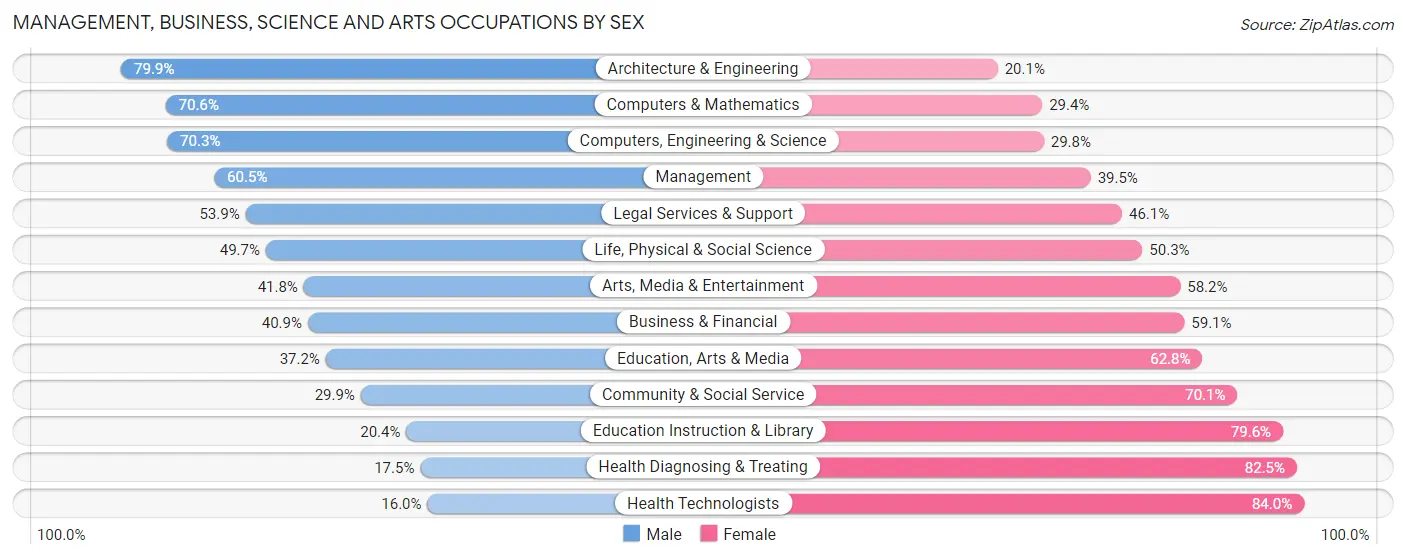
| Occupation | Male | Female |
| Management | 5,541 (60.5%) | 3,623 (39.5%) |
| Business & Financial | 1,597 (40.9%) | 2,306 (59.1%) |
| Computers, Engineering & Science | 3,412 (70.3%) | 1,445 (29.7%) |
| Computers & Mathematics | 1,425 (70.6%) | 594 (29.4%) |
| Architecture & Engineering | 1,527 (79.9%) | 385 (20.1%) |
| Life, Physical & Social Science | 460 (49.7%) | 466 (50.3%) |
| Community & Social Service | 2,631 (29.9%) | 6,171 (70.1%) |
| Education, Arts & Media | 575 (37.2%) | 971 (62.8%) |
| Legal Services & Support | 454 (53.9%) | 388 (46.1%) |
| Education Instruction & Library | 1,025 (20.4%) | 4,008 (79.6%) |
| Arts, Media & Entertainment | 577 (41.8%) | 804 (58.2%) |
| Health Diagnosing & Treating | 815 (17.5%) | 3,851 (82.5%) |
| Health Technologists | 555 (16.0%) | 2,919 (84.0%) |
| Total (Category) | 13,996 (44.6%) | 17,396 (55.4%) |
| Total (Overall) | 44,778 (51.8%) | 41,604 (48.2%) |
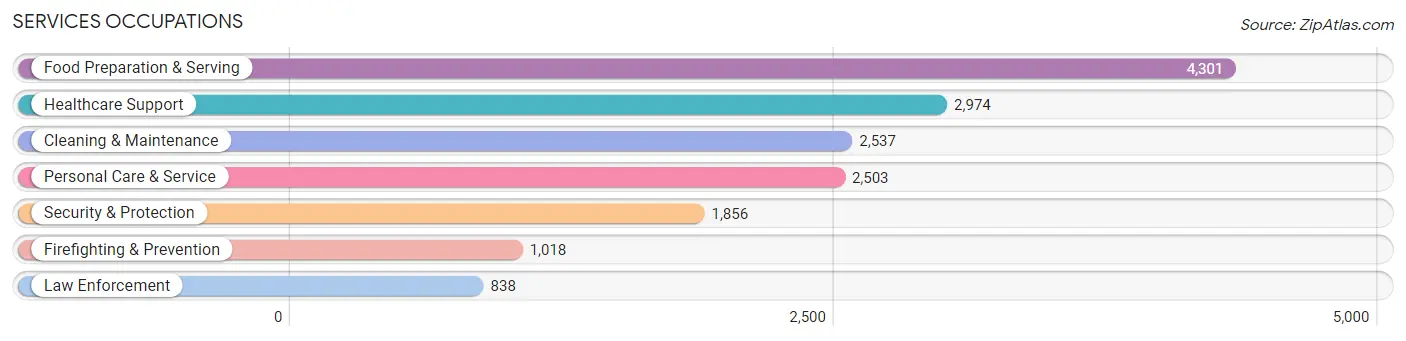
Services Occupations
The most common Services occupations in Kenosha County are Food Preparation & Serving (4,301 | 5.0%), Healthcare Support (2,974 | 3.4%), Cleaning & Maintenance (2,537 | 2.9%), Personal Care & Service (2,503 | 2.9%), and Security & Protection (1,856 | 2.1%).
Services Occupations by Sex
Within the Services occupations in Kenosha County, the most male-oriented occupations are Firefighting & Prevention (87.0%), Security & Protection (85.4%), and Law Enforcement (83.4%), while the most female-oriented occupations are Personal Care & Service (88.5%), Healthcare Support (87.7%), and Food Preparation & Serving (60.8%).
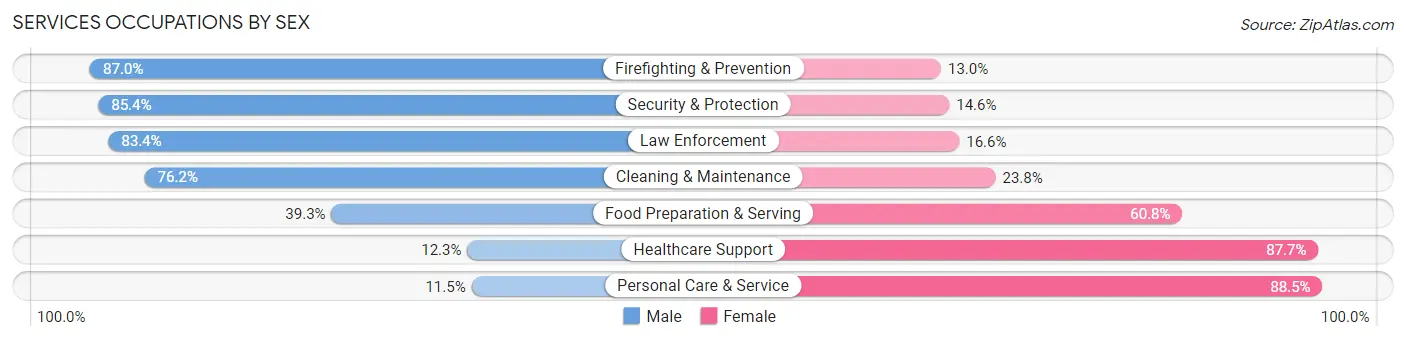
| Occupation | Male | Female |
| Healthcare Support | 367 (12.3%) | 2,607 (87.7%) |
| Security & Protection | 1,585 (85.4%) | 271 (14.6%) |
| Firefighting & Prevention | 886 (87.0%) | 132 (13.0%) |
| Law Enforcement | 699 (83.4%) | 139 (16.6%) |
| Food Preparation & Serving | 1,688 (39.3%) | 2,613 (60.8%) |
| Cleaning & Maintenance | 1,934 (76.2%) | 603 (23.8%) |
| Personal Care & Service | 288 (11.5%) | 2,215 (88.5%) |
| Total (Category) | 5,862 (41.4%) | 8,309 (58.6%) |
| Total (Overall) | 44,778 (51.8%) | 41,604 (48.2%) |
Sales and Office Occupations
The most common Sales and Office occupations in Kenosha County are Office & Administration (9,770 | 11.3%), and Sales & Related (8,041 | 9.3%).

Sales and Office Occupations by Sex

| Occupation | Male | Female |
| Sales & Related | 3,998 (49.7%) | 4,043 (50.3%) |
| Office & Administration | 2,216 (22.7%) | 7,554 (77.3%) |
| Total (Category) | 6,214 (34.9%) | 11,597 (65.1%) |
| Total (Overall) | 44,778 (51.8%) | 41,604 (48.2%) |
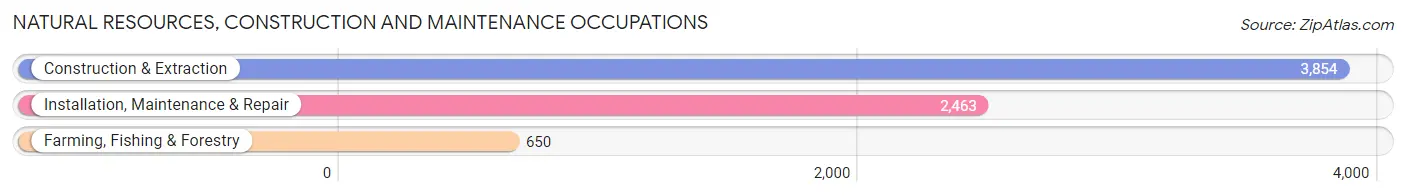
Natural Resources, Construction and Maintenance Occupations
The most common Natural Resources, Construction and Maintenance occupations in Kenosha County are Construction & Extraction (3,854 | 4.5%), Installation, Maintenance & Repair (2,463 | 2.9%), and Farming, Fishing & Forestry (650 | 0.7%).
Natural Resources, Construction and Maintenance Occupations by Sex
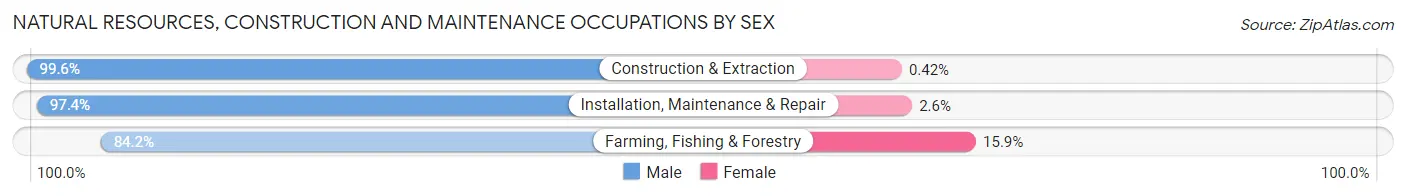
| Occupation | Male | Female |
| Farming, Fishing & Forestry | 547 (84.2%) | 103 (15.9%) |
| Construction & Extraction | 3,838 (99.6%) | 16 (0.4%) |
| Installation, Maintenance & Repair | 2,400 (97.4%) | 63 (2.6%) |
| Total (Category) | 6,785 (97.4%) | 182 (2.6%) |
| Total (Overall) | 44,778 (51.8%) | 41,604 (48.2%) |
Production, Transportation and Moving Occupations
The most common Production, Transportation and Moving occupations in Kenosha County are Production (7,248 | 8.4%), Material Moving (5,365 | 6.2%), and Transportation (3,428 | 4.0%).

Production, Transportation and Moving Occupations by Sex
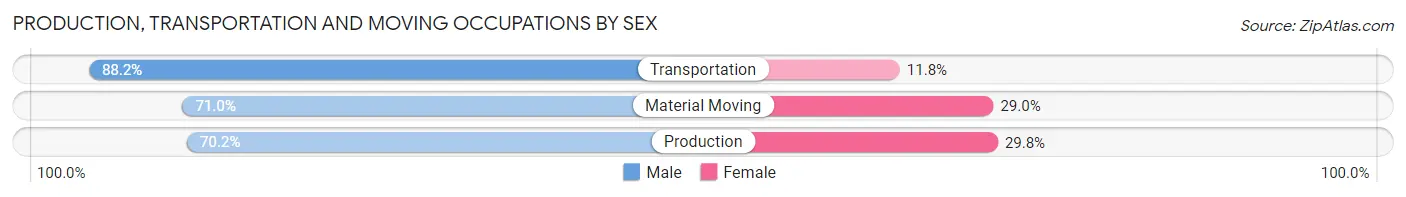
| Occupation | Male | Female |
| Production | 5,088 (70.2%) | 2,160 (29.8%) |
| Transportation | 3,023 (88.2%) | 405 (11.8%) |
| Material Moving | 3,810 (71.0%) | 1,555 (29.0%) |
| Total (Category) | 11,921 (74.3%) | 4,120 (25.7%) |
| Total (Overall) | 44,778 (51.8%) | 41,604 (48.2%) |
Employment Industries by Sex in Kenosha County
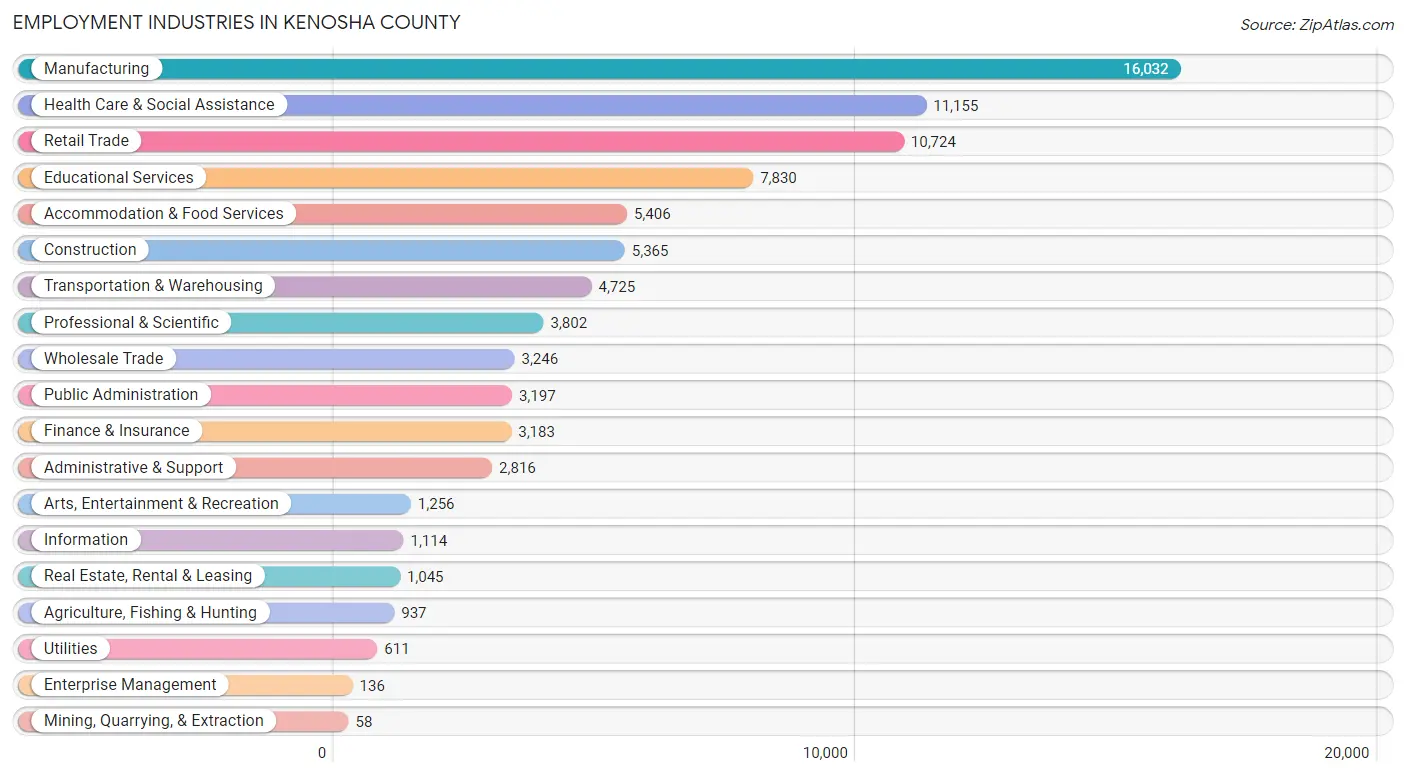
Employment Industries in Kenosha County
The major employment industries in Kenosha County include Manufacturing (16,032 | 18.6%), Health Care & Social Assistance (11,155 | 12.9%), Retail Trade (10,724 | 12.4%), Educational Services (7,830 | 9.1%), and Accommodation & Food Services (5,406 | 6.3%).
Employment Industries by Sex in Kenosha County
The Kenosha County industries that see more men than women are Mining, Quarrying, & Extraction (100.0%), Construction (91.0%), and Agriculture, Fishing & Hunting (86.0%), whereas the industries that tend to have a higher number of women are Health Care & Social Assistance (83.8%), Educational Services (71.5%), and Finance & Insurance (63.0%).
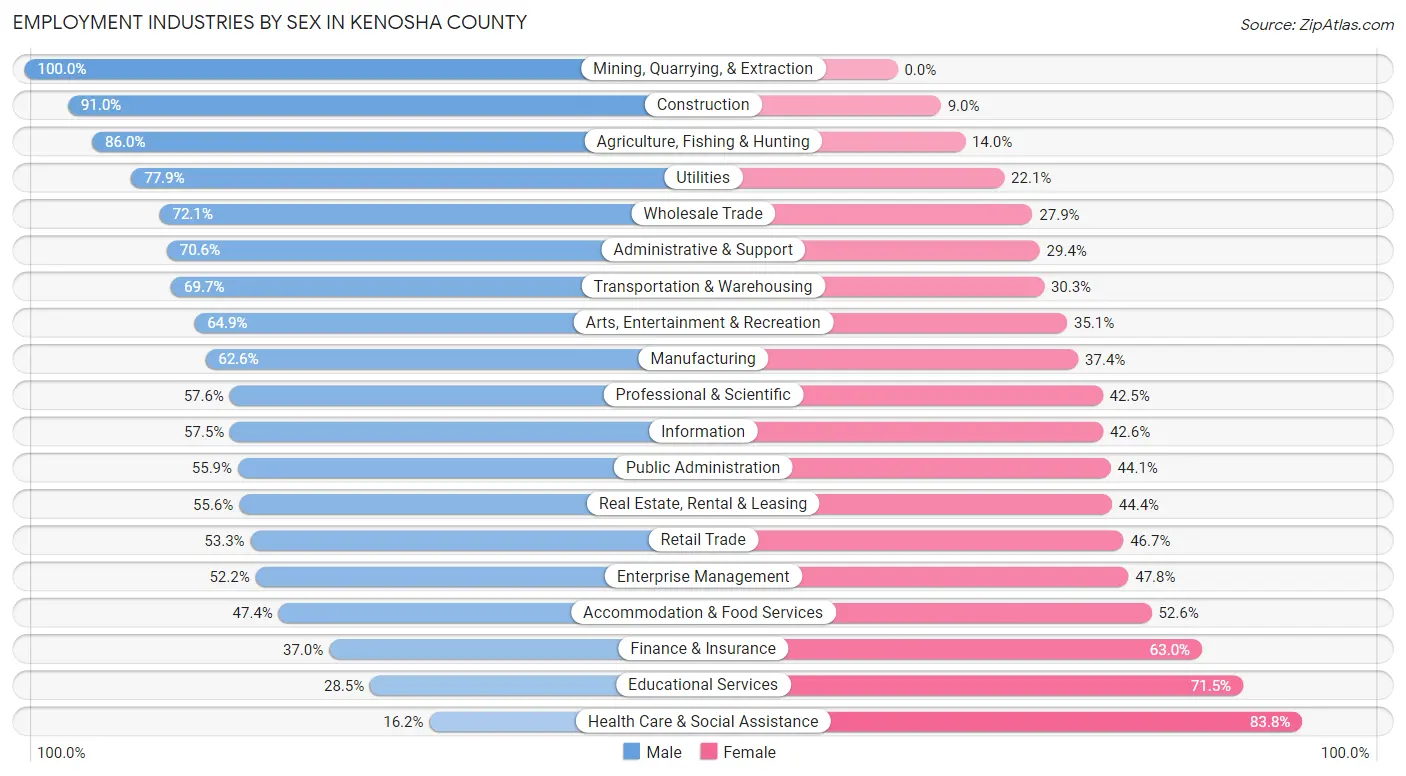
| Industry | Male | Female |
| Agriculture, Fishing & Hunting | 806 (86.0%) | 131 (14.0%) |
| Mining, Quarrying, & Extraction | 58 (100.0%) | 0 (0.0%) |
| Construction | 4,884 (91.0%) | 481 (9.0%) |
| Manufacturing | 10,034 (62.6%) | 5,998 (37.4%) |
| Wholesale Trade | 2,339 (72.1%) | 907 (27.9%) |
| Retail Trade | 5,712 (53.3%) | 5,012 (46.7%) |
| Transportation & Warehousing | 3,292 (69.7%) | 1,433 (30.3%) |
| Utilities | 476 (77.9%) | 135 (22.1%) |
| Information | 640 (57.5%) | 474 (42.5%) |
| Finance & Insurance | 1,177 (37.0%) | 2,006 (63.0%) |
| Real Estate, Rental & Leasing | 581 (55.6%) | 464 (44.4%) |
| Professional & Scientific | 2,188 (57.6%) | 1,614 (42.4%) |
| Enterprise Management | 71 (52.2%) | 65 (47.8%) |
| Administrative & Support | 1,987 (70.6%) | 829 (29.4%) |
| Educational Services | 2,231 (28.5%) | 5,599 (71.5%) |
| Health Care & Social Assistance | 1,811 (16.2%) | 9,344 (83.8%) |
| Arts, Entertainment & Recreation | 815 (64.9%) | 441 (35.1%) |
| Accommodation & Food Services | 2,563 (47.4%) | 2,843 (52.6%) |
| Public Administration | 1,786 (55.9%) | 1,411 (44.1%) |
| Total | 44,778 (51.8%) | 41,604 (48.2%) |
Education in Kenosha County
School Enrollment in Kenosha County
The most common levels of schooling among the 41,201 students in Kenosha County are college / undergraduate (9,174 | 22.3%), high school (9,090 | 22.1%), and middle school (8,787 | 21.3%).
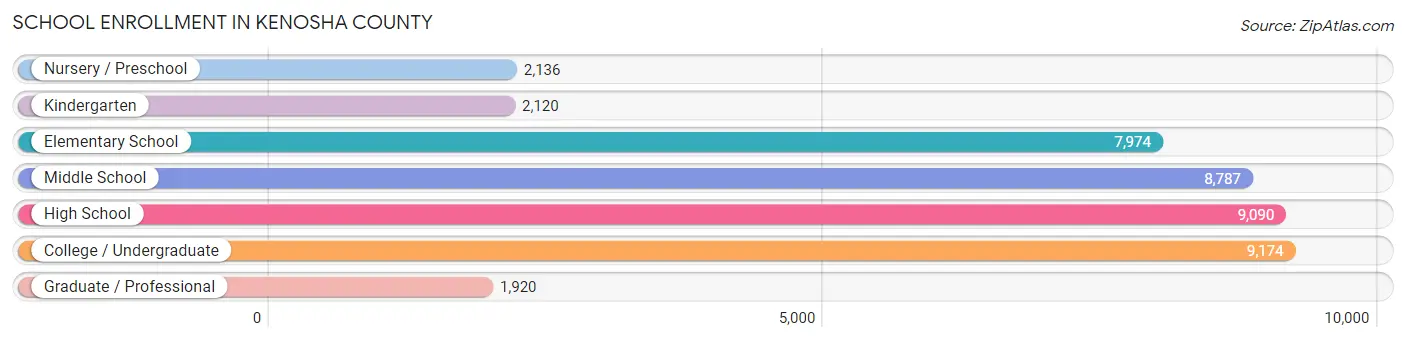
| School Level | # Students | % Students |
| Nursery / Preschool | 2,136 | 5.2% |
| Kindergarten | 2,120 | 5.1% |
| Elementary School | 7,974 | 19.4% |
| Middle School | 8,787 | 21.3% |
| High School | 9,090 | 22.1% |
| College / Undergraduate | 9,174 | 22.3% |
| Graduate / Professional | 1,920 | 4.7% |
| Total | 41,201 | 100.0% |
School Enrollment by Age by Funding Source in Kenosha County
Out of a total of 41,201 students who are enrolled in schools in Kenosha County, 6,757 (16.4%) attend a private institution, while the remaining 34,444 (83.6%) are enrolled in public schools. The age group of 20 to 24 year olds has the highest likelihood of being enrolled in private schools, with 1,443 (31.2% in the age bracket) enrolled. Conversely, the age group of 5 to 9 year old has the lowest likelihood of being enrolled in a private school, with 8,481 (90.2% in the age bracket) attending a public institution.

| Age Bracket | Public School | Private School |
| 3 to 4 Year Olds | 1,087 (69.0%) | 488 (31.0%) |
| 5 to 9 Year Old | 8,481 (90.2%) | 922 (9.8%) |
| 10 to 14 Year Olds | 9,846 (89.5%) | 1,149 (10.4%) |
| 15 to 17 Year Olds | 6,080 (90.0%) | 672 (10.0%) |
| 18 to 19 Year Olds | 2,567 (74.6%) | 874 (25.4%) |
| 20 to 24 Year Olds | 3,175 (68.8%) | 1,443 (31.2%) |
| 25 to 34 Year Olds | 1,830 (73.9%) | 646 (26.1%) |
| 35 Years and over | 1,390 (71.6%) | 551 (28.4%) |
| Total | 34,444 (83.6%) | 6,757 (16.4%) |
Educational Attainment by Field of Study in Kenosha County
Business (7,528 | 20.6%), education (4,827 | 13.2%), science & technology (4,385 | 12.0%), arts & humanities (2,565 | 7.0%), and social sciences (2,453 | 6.7%) are the most common fields of study among 36,519 individuals in Kenosha County who have obtained a bachelor's degree or higher.
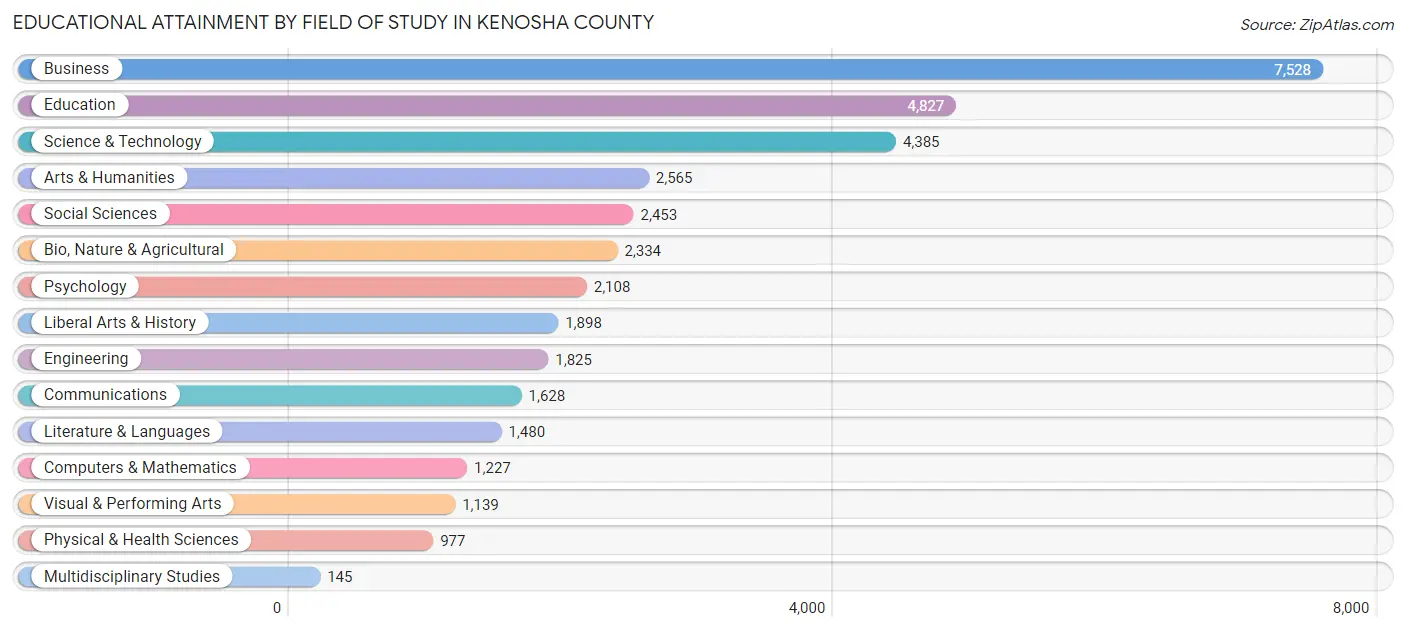
| Field of Study | # Graduates | % Graduates |
| Computers & Mathematics | 1,227 | 3.4% |
| Bio, Nature & Agricultural | 2,334 | 6.4% |
| Physical & Health Sciences | 977 | 2.7% |
| Psychology | 2,108 | 5.8% |
| Social Sciences | 2,453 | 6.7% |
| Engineering | 1,825 | 5.0% |
| Multidisciplinary Studies | 145 | 0.4% |
| Science & Technology | 4,385 | 12.0% |
| Business | 7,528 | 20.6% |
| Education | 4,827 | 13.2% |
| Literature & Languages | 1,480 | 4.1% |
| Liberal Arts & History | 1,898 | 5.2% |
| Visual & Performing Arts | 1,139 | 3.1% |
| Communications | 1,628 | 4.5% |
| Arts & Humanities | 2,565 | 7.0% |
| Total | 36,519 | 100.0% |
Transportation & Commute in Kenosha County
Vehicle Availability by Sex in Kenosha County
The most prevalent vehicle ownership categories in Kenosha County are males with 2 vehicles (20,300, accounting for 46.1%) and females with 2 vehicles (17,290, making up 50.5%).
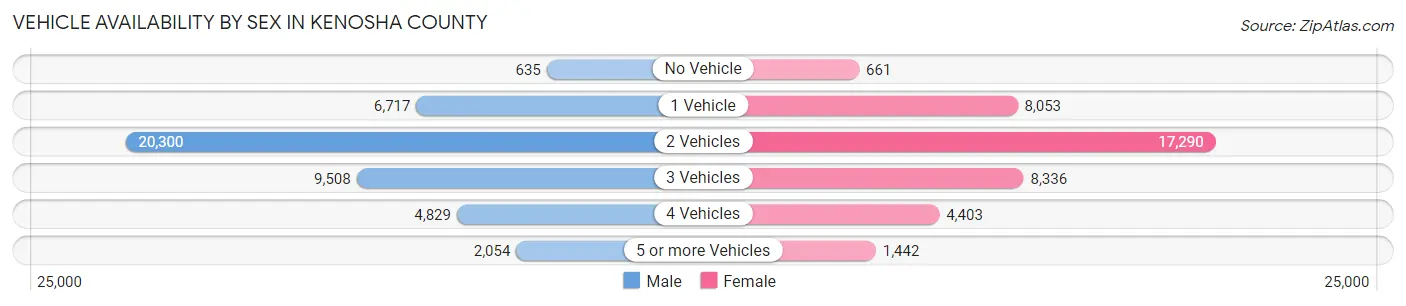
| Vehicles Available | Male | Female |
| No Vehicle | 635 (1.4%) | 661 (1.6%) |
| 1 Vehicle | 6,717 (15.2%) | 8,053 (20.0%) |
| 2 Vehicles | 20,300 (46.1%) | 17,290 (43.0%) |
| 3 Vehicles | 9,508 (21.6%) | 8,336 (20.7%) |
| 4 Vehicles | 4,829 (11.0%) | 4,403 (11.0%) |
| 5 or more Vehicles | 2,054 (4.7%) | 1,442 (3.6%) |
| Total | 44,043 (100.0%) | 40,185 (100.0%) |
Commute Time in Kenosha County
The most frequently occuring commute durations in Kenosha County are 15 to 19 minutes (11,839 commuters, 15.0%), 10 to 14 minutes (11,560 commuters, 14.7%), and 20 to 24 minutes (9,686 commuters, 12.3%).
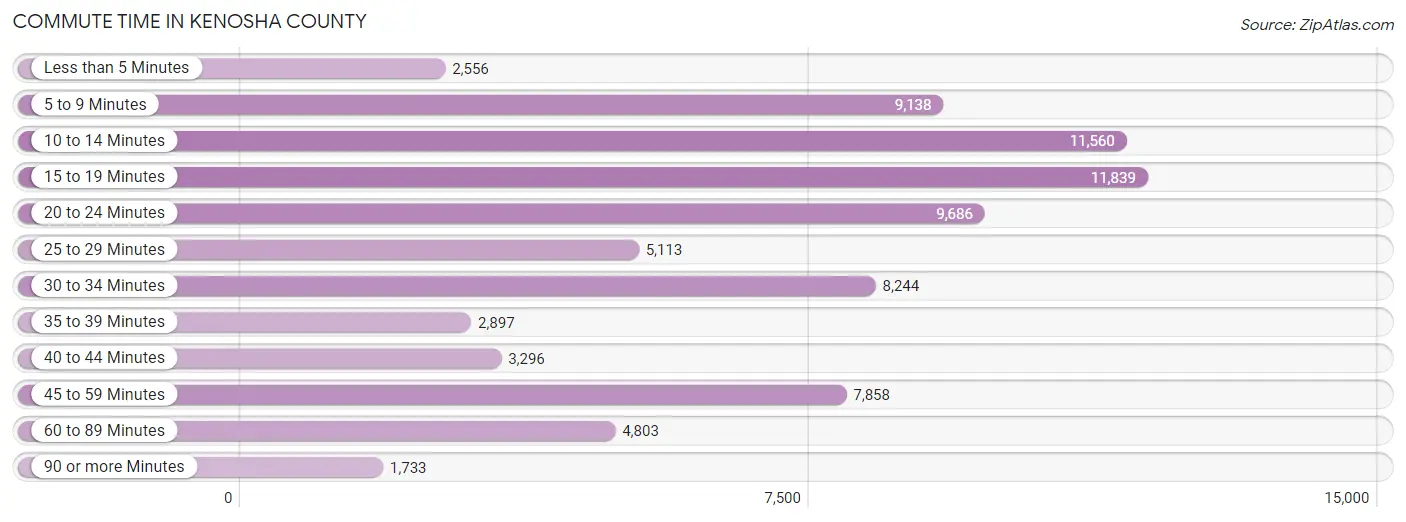
| Commute Time | # Commuters | % Commuters |
| Less than 5 Minutes | 2,556 | 3.3% |
| 5 to 9 Minutes | 9,138 | 11.6% |
| 10 to 14 Minutes | 11,560 | 14.7% |
| 15 to 19 Minutes | 11,839 | 15.0% |
| 20 to 24 Minutes | 9,686 | 12.3% |
| 25 to 29 Minutes | 5,113 | 6.5% |
| 30 to 34 Minutes | 8,244 | 10.5% |
| 35 to 39 Minutes | 2,897 | 3.7% |
| 40 to 44 Minutes | 3,296 | 4.2% |
| 45 to 59 Minutes | 7,858 | 10.0% |
| 60 to 89 Minutes | 4,803 | 6.1% |
| 90 or more Minutes | 1,733 | 2.2% |
Commute Time by Sex in Kenosha County
The most common commute times in Kenosha County are 10 to 14 minutes (5,905 commuters, 14.1%) for males and 15 to 19 minutes (6,193 commuters, 16.8%) for females.
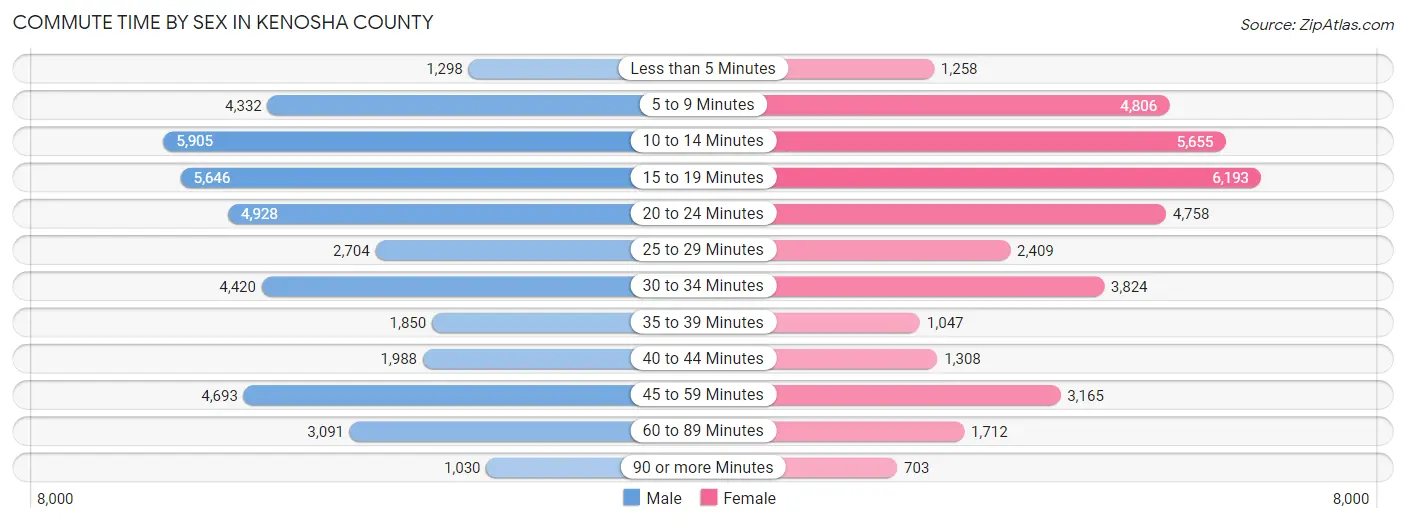
| Commute Time | Male | Female |
| Less than 5 Minutes | 1,298 (3.1%) | 1,258 (3.4%) |
| 5 to 9 Minutes | 4,332 (10.3%) | 4,806 (13.1%) |
| 10 to 14 Minutes | 5,905 (14.1%) | 5,655 (15.3%) |
| 15 to 19 Minutes | 5,646 (13.5%) | 6,193 (16.8%) |
| 20 to 24 Minutes | 4,928 (11.8%) | 4,758 (12.9%) |
| 25 to 29 Minutes | 2,704 (6.5%) | 2,409 (6.5%) |
| 30 to 34 Minutes | 4,420 (10.5%) | 3,824 (10.4%) |
| 35 to 39 Minutes | 1,850 (4.4%) | 1,047 (2.8%) |
| 40 to 44 Minutes | 1,988 (4.8%) | 1,308 (3.5%) |
| 45 to 59 Minutes | 4,693 (11.2%) | 3,165 (8.6%) |
| 60 to 89 Minutes | 3,091 (7.4%) | 1,712 (4.6%) |
| 90 or more Minutes | 1,030 (2.5%) | 703 (1.9%) |
Time of Departure to Work by Sex in Kenosha County
The most frequent times of departure to work in Kenosha County are 7:00 AM to 7:29 AM (4,551, 10.9%) for males and 7:00 AM to 7:29 AM (5,733, 15.6%) for females.
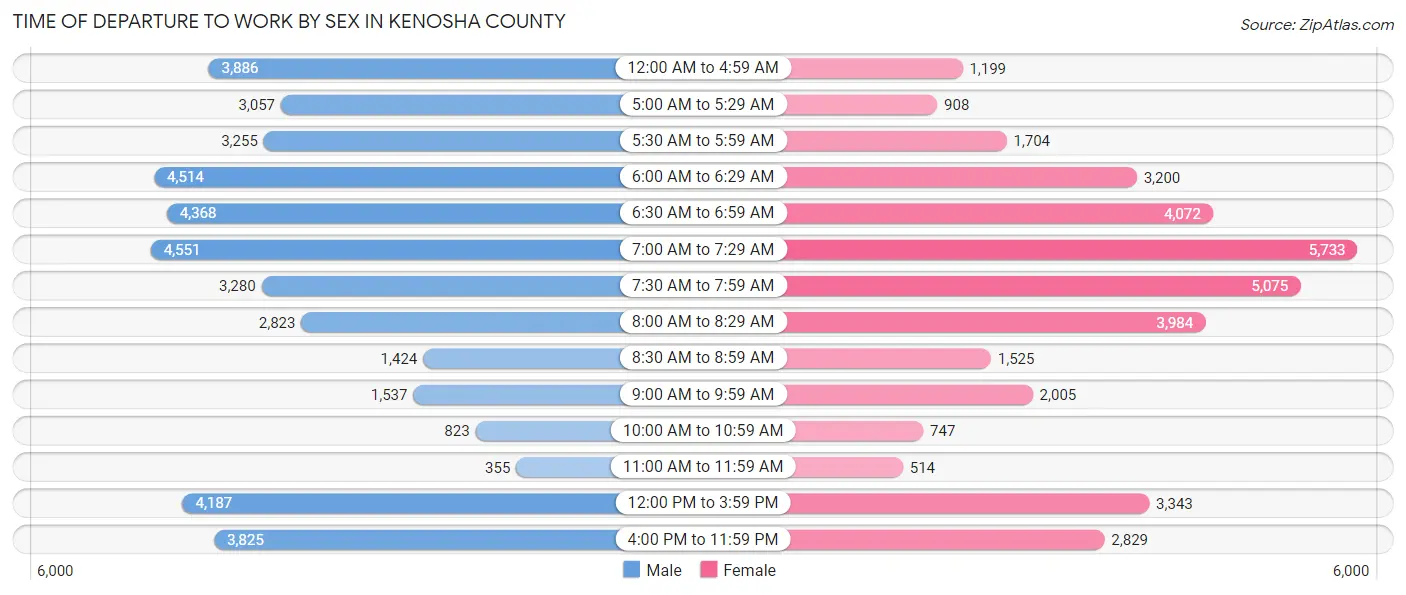
| Time of Departure | Male | Female |
| 12:00 AM to 4:59 AM | 3,886 (9.3%) | 1,199 (3.3%) |
| 5:00 AM to 5:29 AM | 3,057 (7.3%) | 908 (2.5%) |
| 5:30 AM to 5:59 AM | 3,255 (7.8%) | 1,704 (4.6%) |
| 6:00 AM to 6:29 AM | 4,514 (10.8%) | 3,200 (8.7%) |
| 6:30 AM to 6:59 AM | 4,368 (10.4%) | 4,072 (11.1%) |
| 7:00 AM to 7:29 AM | 4,551 (10.9%) | 5,733 (15.6%) |
| 7:30 AM to 7:59 AM | 3,280 (7.8%) | 5,075 (13.8%) |
| 8:00 AM to 8:29 AM | 2,823 (6.7%) | 3,984 (10.8%) |
| 8:30 AM to 8:59 AM | 1,424 (3.4%) | 1,525 (4.1%) |
| 9:00 AM to 9:59 AM | 1,537 (3.7%) | 2,005 (5.4%) |
| 10:00 AM to 10:59 AM | 823 (2.0%) | 747 (2.0%) |
| 11:00 AM to 11:59 AM | 355 (0.9%) | 514 (1.4%) |
| 12:00 PM to 3:59 PM | 4,187 (10.0%) | 3,343 (9.1%) |
| 4:00 PM to 11:59 PM | 3,825 (9.1%) | 2,829 (7.7%) |
| Total | 41,885 (100.0%) | 36,838 (100.0%) |
Housing Occupancy in Kenosha County
Occupancy by Ownership in Kenosha County
Of the total 66,705 dwellings in Kenosha County, owner-occupied units account for 44,940 (67.4%), while renter-occupied units make up 21,765 (32.6%).
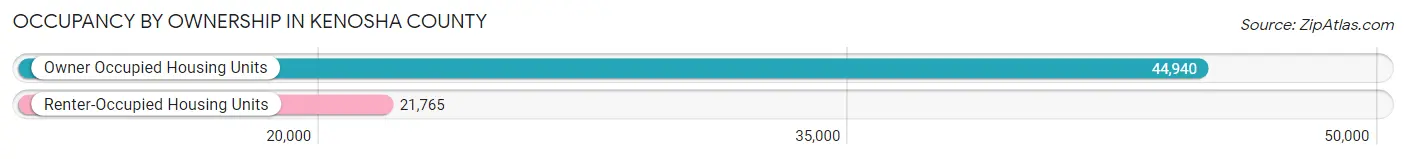
| Occupancy | # Housing Units | % Housing Units |
| Owner Occupied Housing Units | 44,940 | 67.4% |
| Renter-Occupied Housing Units | 21,765 | 32.6% |
| Total Occupied Housing Units | 66,705 | 100.0% |
Occupancy by Household Size in Kenosha County
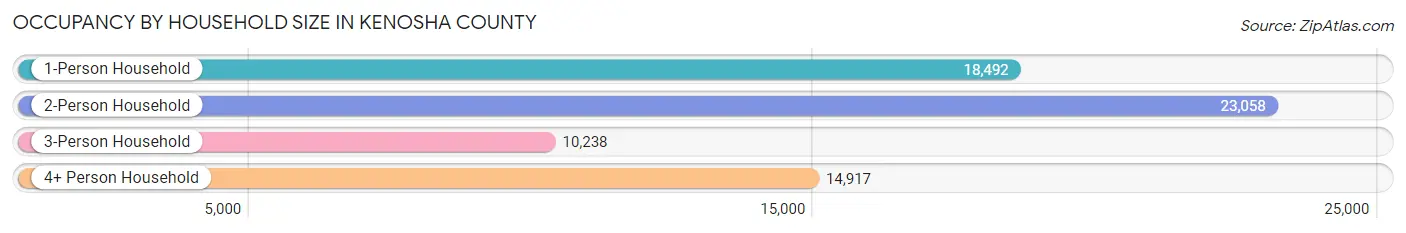
| Household Size | # Housing Units | % Housing Units |
| 1-Person Household | 18,492 | 27.7% |
| 2-Person Household | 23,058 | 34.6% |
| 3-Person Household | 10,238 | 15.3% |
| 4+ Person Household | 14,917 | 22.4% |
| Total Housing Units | 66,705 | 100.0% |
Occupancy by Ownership by Household Size in Kenosha County

| Household Size | Owner-occupied | Renter-occupied |
| 1-Person Household | 9,838 (53.2%) | 8,654 (46.8%) |
| 2-Person Household | 16,960 (73.6%) | 6,098 (26.5%) |
| 3-Person Household | 6,820 (66.6%) | 3,418 (33.4%) |
| 4+ Person Household | 11,322 (75.9%) | 3,595 (24.1%) |
| Total Housing Units | 44,940 (67.4%) | 21,765 (32.6%) |
Occupancy by Educational Attainment in Kenosha County
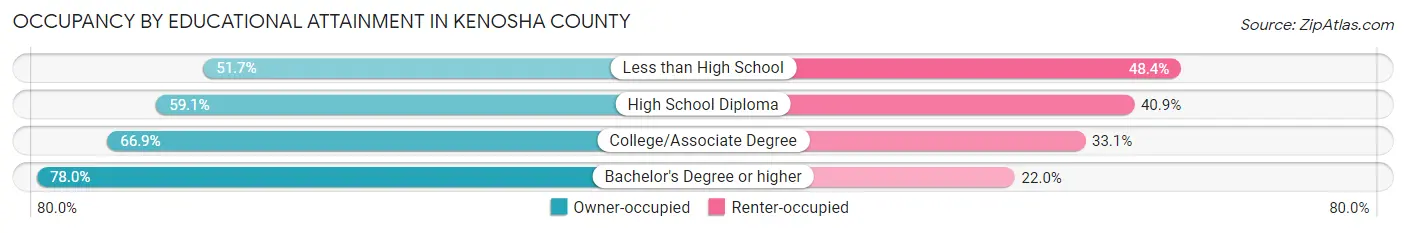
| Household Size | Owner-occupied | Renter-occupied |
| Less than High School | 2,429 (51.6%) | 2,274 (48.3%) |
| High School Diploma | 9,688 (59.1%) | 6,701 (40.9%) |
| College/Associate Degree | 16,591 (66.9%) | 8,221 (33.1%) |
| Bachelor's Degree or higher | 16,232 (78.0%) | 4,569 (22.0%) |
Occupancy by Age of Householder in Kenosha County
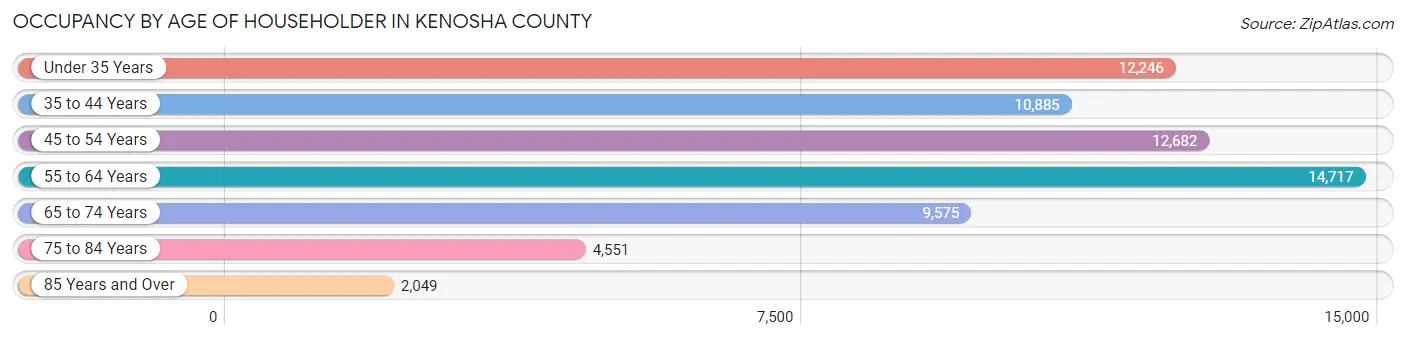
| Age Bracket | # Households | % Households |
| Under 35 Years | 12,246 | 18.4% |
| 35 to 44 Years | 10,885 | 16.3% |
| 45 to 54 Years | 12,682 | 19.0% |
| 55 to 64 Years | 14,717 | 22.1% |
| 65 to 74 Years | 9,575 | 14.3% |
| 75 to 84 Years | 4,551 | 6.8% |
| 85 Years and Over | 2,049 | 3.1% |
| Total | 66,705 | 100.0% |
Housing Finances in Kenosha County
Median Income by Occupancy in Kenosha County
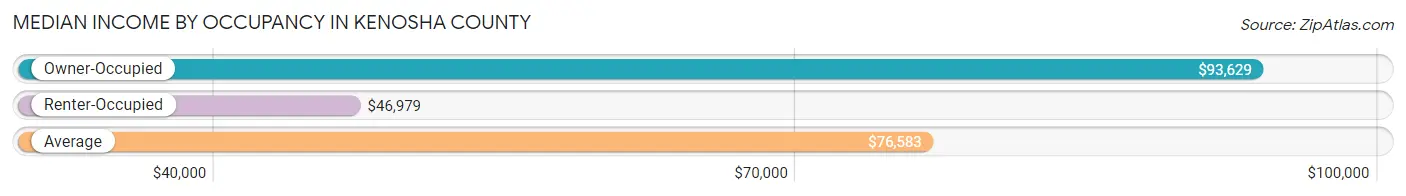
| Occupancy Type | # Households | Median Income |
| Owner-Occupied | 44,940 (67.4%) | $93,629 |
| Renter-Occupied | 21,765 (32.6%) | $46,979 |
| Average | 66,705 (100.0%) | $76,583 |
Occupancy by Householder Income Bracket in Kenosha County
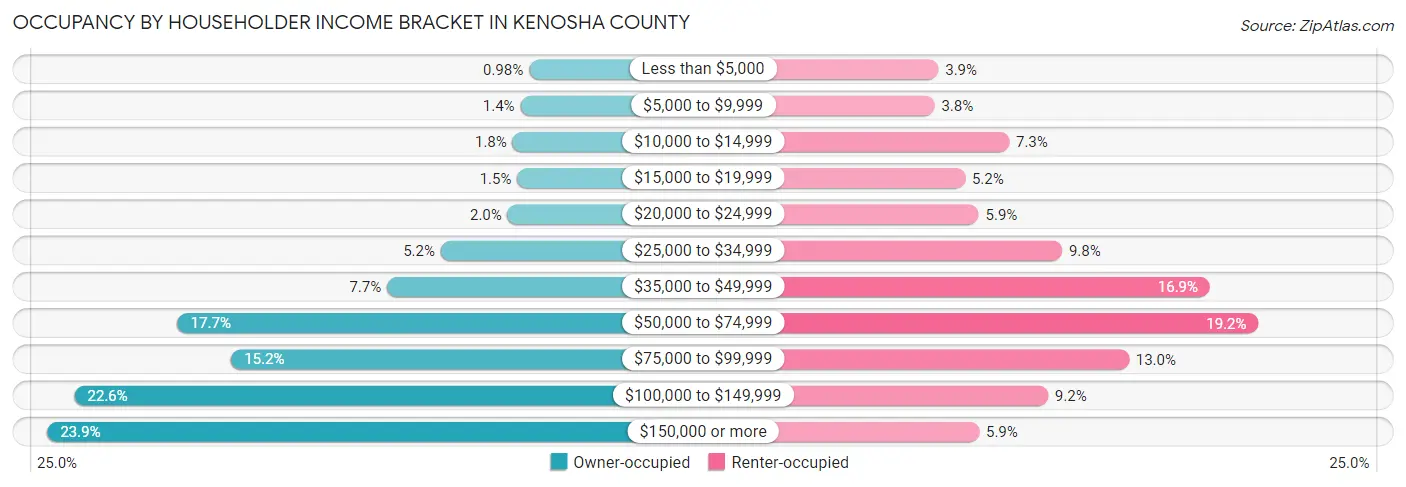
| Income Bracket | Owner-occupied | Renter-occupied |
| Less than $5,000 | 439 (1.0%) | 858 (3.9%) |
| $5,000 to $9,999 | 626 (1.4%) | 818 (3.8%) |
| $10,000 to $14,999 | 789 (1.8%) | 1,590 (7.3%) |
| $15,000 to $19,999 | 693 (1.5%) | 1,134 (5.2%) |
| $20,000 to $24,999 | 900 (2.0%) | 1,276 (5.9%) |
| $25,000 to $34,999 | 2,326 (5.2%) | 2,140 (9.8%) |
| $35,000 to $49,999 | 3,478 (7.7%) | 3,671 (16.9%) |
| $50,000 to $74,999 | 7,957 (17.7%) | 4,175 (19.2%) |
| $75,000 to $99,999 | 6,812 (15.2%) | 2,831 (13.0%) |
| $100,000 to $149,999 | 10,171 (22.6%) | 1,993 (9.2%) |
| $150,000 or more | 10,749 (23.9%) | 1,279 (5.9%) |
| Total | 44,940 (100.0%) | 21,765 (100.0%) |
Monthly Housing Cost Tiers in Kenosha County
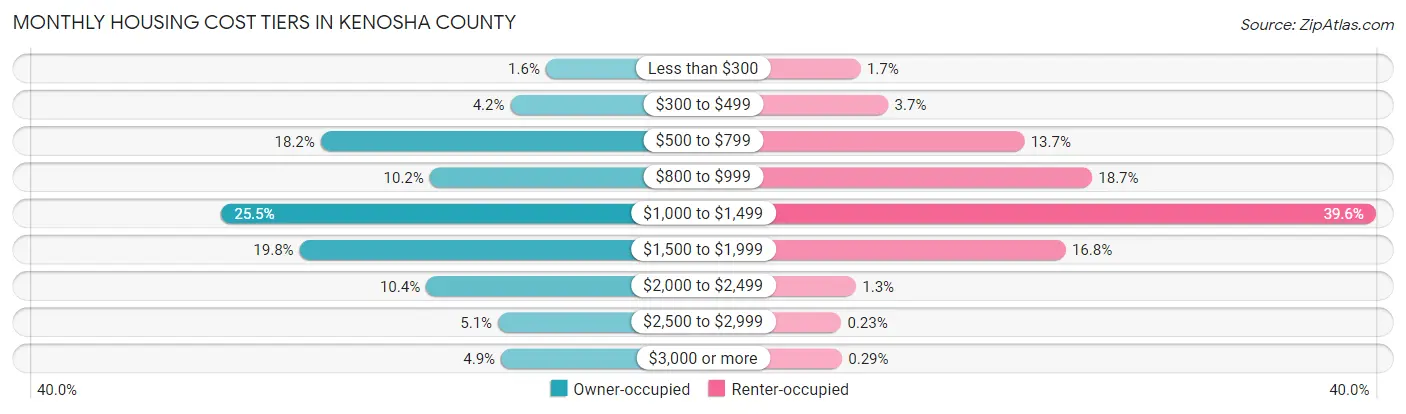
| Monthly Cost | Owner-occupied | Renter-occupied |
| Less than $300 | 730 (1.6%) | 361 (1.7%) |
| $300 to $499 | 1,900 (4.2%) | 806 (3.7%) |
| $500 to $799 | 8,180 (18.2%) | 2,986 (13.7%) |
| $800 to $999 | 4,572 (10.2%) | 4,070 (18.7%) |
| $1,000 to $1,499 | 11,465 (25.5%) | 8,627 (39.6%) |
| $1,500 to $1,999 | 8,882 (19.8%) | 3,647 (16.8%) |
| $2,000 to $2,499 | 4,690 (10.4%) | 287 (1.3%) |
| $2,500 to $2,999 | 2,309 (5.1%) | 51 (0.2%) |
| $3,000 or more | 2,212 (4.9%) | 63 (0.3%) |
| Total | 44,940 (100.0%) | 21,765 (100.0%) |
Physical Housing Characteristics in Kenosha County
Housing Structures in Kenosha County
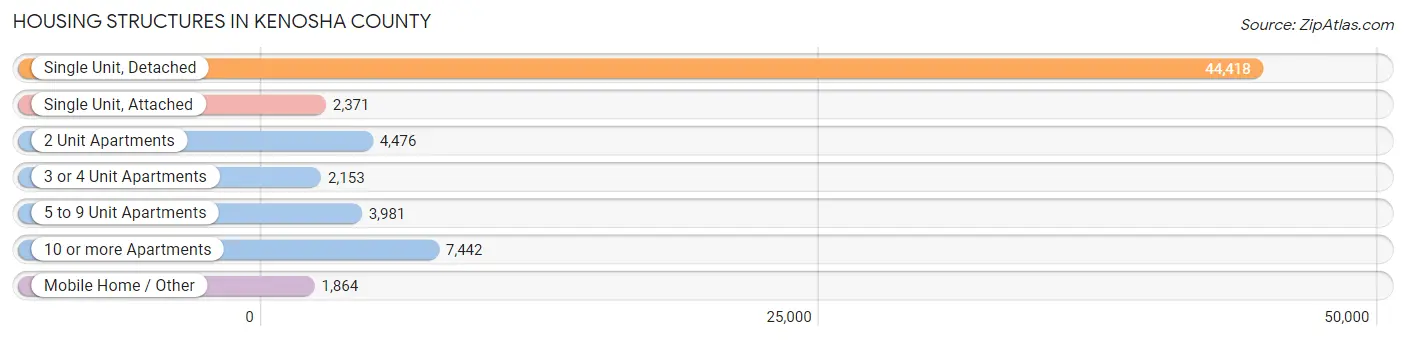
| Structure Type | # Housing Units | % Housing Units |
| Single Unit, Detached | 44,418 | 66.6% |
| Single Unit, Attached | 2,371 | 3.5% |
| 2 Unit Apartments | 4,476 | 6.7% |
| 3 or 4 Unit Apartments | 2,153 | 3.2% |
| 5 to 9 Unit Apartments | 3,981 | 6.0% |
| 10 or more Apartments | 7,442 | 11.2% |
| Mobile Home / Other | 1,864 | 2.8% |
| Total | 66,705 | 100.0% |
Housing Structures by Occupancy in Kenosha County
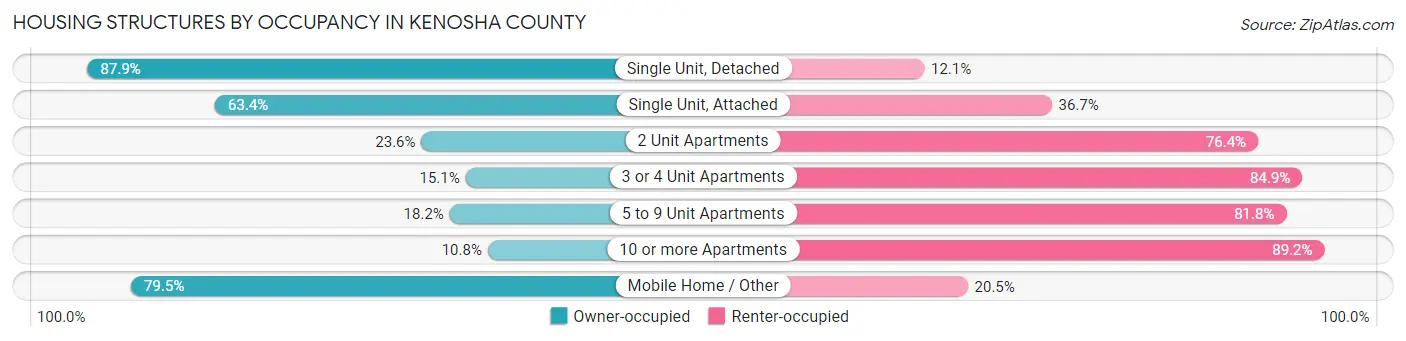
| Structure Type | Owner-occupied | Renter-occupied |
| Single Unit, Detached | 39,045 (87.9%) | 5,373 (12.1%) |
| Single Unit, Attached | 1,502 (63.3%) | 869 (36.6%) |
| 2 Unit Apartments | 1,057 (23.6%) | 3,419 (76.4%) |
| 3 or 4 Unit Apartments | 325 (15.1%) | 1,828 (84.9%) |
| 5 to 9 Unit Apartments | 723 (18.2%) | 3,258 (81.8%) |
| 10 or more Apartments | 806 (10.8%) | 6,636 (89.2%) |
| Mobile Home / Other | 1,482 (79.5%) | 382 (20.5%) |
| Total | 44,940 (67.4%) | 21,765 (32.6%) |
Housing Structures by Number of Rooms in Kenosha County
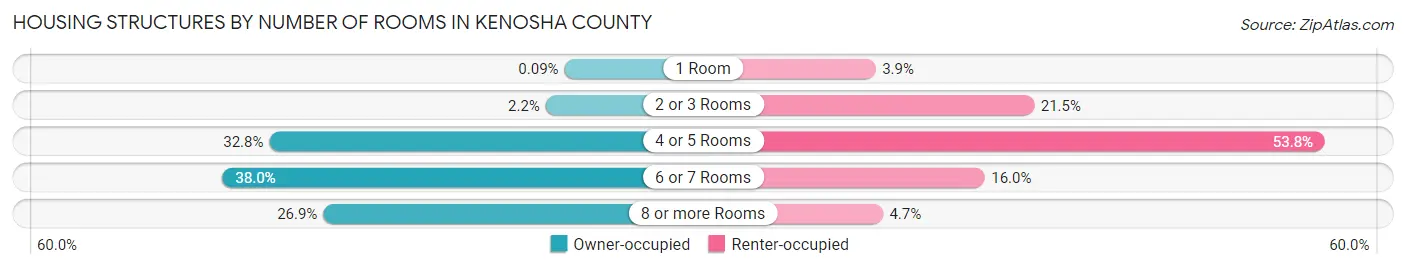
| Number of Rooms | Owner-occupied | Renter-occupied |
| 1 Room | 41 (0.1%) | 854 (3.9%) |
| 2 or 3 Rooms | 975 (2.2%) | 4,683 (21.5%) |
| 4 or 5 Rooms | 14,757 (32.8%) | 11,713 (53.8%) |
| 6 or 7 Rooms | 17,096 (38.0%) | 3,487 (16.0%) |
| 8 or more Rooms | 12,071 (26.9%) | 1,028 (4.7%) |
| Total | 44,940 (100.0%) | 21,765 (100.0%) |
Housing Structure by Heating Type in Kenosha County
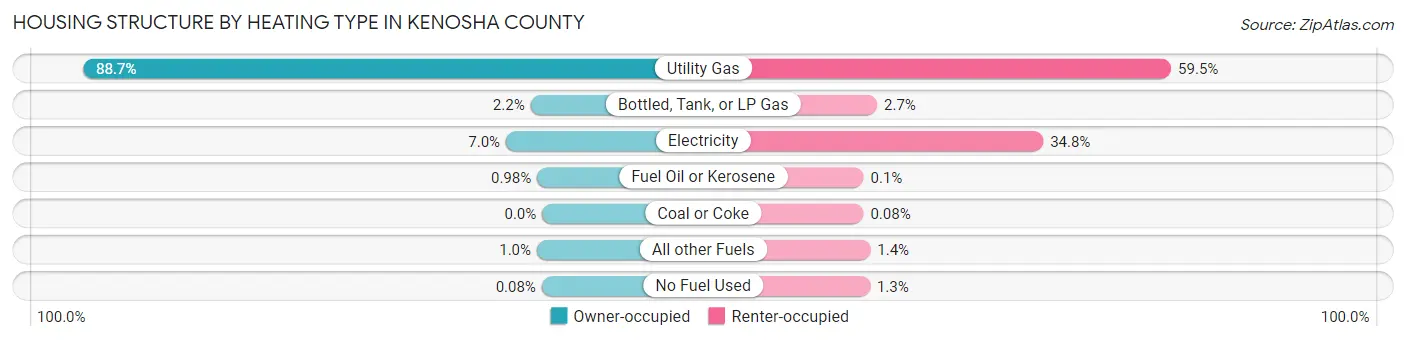
| Heating Type | Owner-occupied | Renter-occupied |
| Utility Gas | 39,862 (88.7%) | 12,959 (59.5%) |
| Bottled, Tank, or LP Gas | 1,008 (2.2%) | 593 (2.7%) |
| Electricity | 3,141 (7.0%) | 7,577 (34.8%) |
| Fuel Oil or Kerosene | 442 (1.0%) | 21 (0.1%) |
| Coal or Coke | 0 (0.0%) | 17 (0.1%) |
| All other Fuels | 453 (1.0%) | 306 (1.4%) |
| No Fuel Used | 34 (0.1%) | 292 (1.3%) |
| Total | 44,940 (100.0%) | 21,765 (100.0%) |
Household Vehicle Usage in Kenosha County
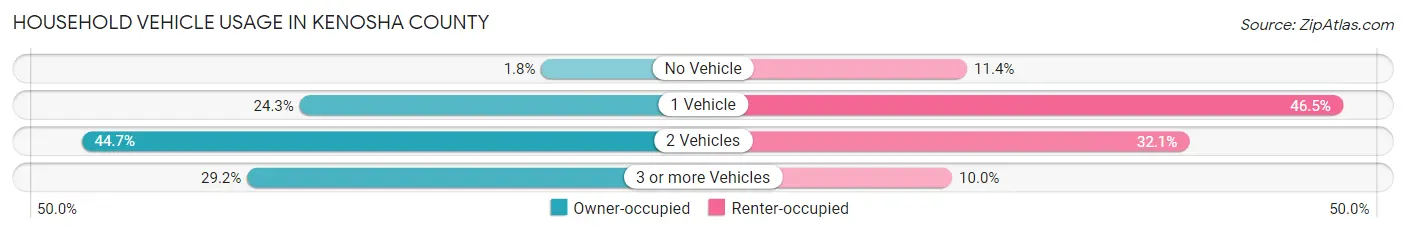
| Vehicles per Household | Owner-occupied | Renter-occupied |
| No Vehicle | 794 (1.8%) | 2,484 (11.4%) |
| 1 Vehicle | 10,934 (24.3%) | 10,112 (46.5%) |
| 2 Vehicles | 20,077 (44.7%) | 6,991 (32.1%) |
| 3 or more Vehicles | 13,135 (29.2%) | 2,178 (10.0%) |
| Total | 44,940 (100.0%) | 21,765 (100.0%) |
Real Estate & Mortgages in Kenosha County
Real Estate and Mortgage Overview in Kenosha County
| Characteristic | Without Mortgage | With Mortgage |
| Housing Units | 15,294 | 29,646 |
| Median Property Value | $222,400 | $239,900 |
| Median Household Income | $73,378 | $8,045 |
| Monthly Housing Costs | $694 | $2,212 |
| Real Estate Taxes | $4,049 | $192 |
Property Value by Mortgage Status in Kenosha County
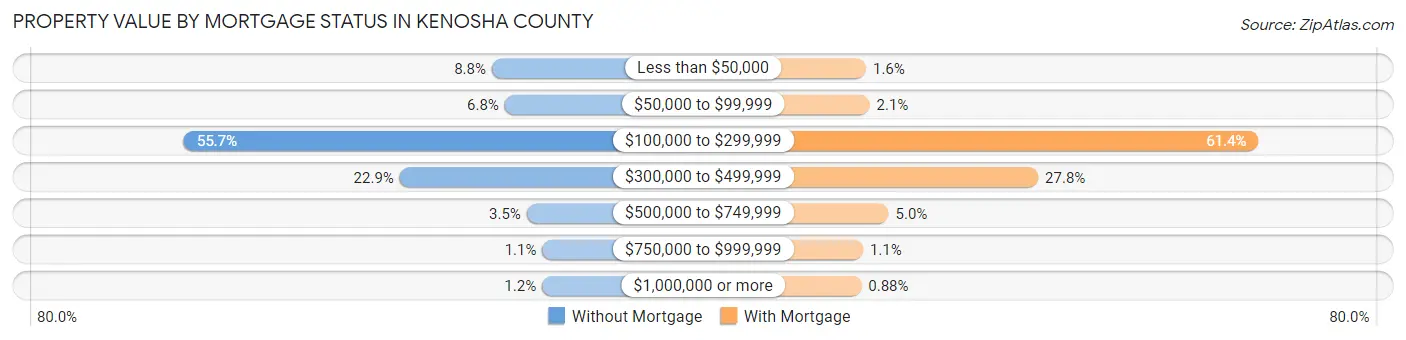
| Property Value | Without Mortgage | With Mortgage |
| Less than $50,000 | 1,348 (8.8%) | 475 (1.6%) |
| $50,000 to $99,999 | 1,046 (6.8%) | 635 (2.1%) |
| $100,000 to $299,999 | 8,525 (55.7%) | 18,200 (61.4%) |
| $300,000 to $499,999 | 3,495 (22.9%) | 8,249 (27.8%) |
| $500,000 to $749,999 | 534 (3.5%) | 1,491 (5.0%) |
| $750,000 to $999,999 | 169 (1.1%) | 336 (1.1%) |
| $1,000,000 or more | 177 (1.2%) | 260 (0.9%) |
| Total | 15,294 (100.0%) | 29,646 (100.0%) |
Household Income by Mortgage Status in Kenosha County

| Household Income | Without Mortgage | With Mortgage |
| Less than $10,000 | 585 (3.8%) | 667 (2.2%) |
| $10,000 to $24,999 | 1,388 (9.1%) | 480 (1.6%) |
| $25,000 to $34,999 | 1,116 (7.3%) | 994 (3.4%) |
| $35,000 to $49,999 | 1,419 (9.3%) | 1,210 (4.1%) |
| $50,000 to $74,999 | 3,285 (21.5%) | 2,059 (7.0%) |
| $75,000 to $99,999 | 2,377 (15.5%) | 4,672 (15.8%) |
| $100,000 to $149,999 | 2,420 (15.8%) | 4,435 (15.0%) |
| $150,000 or more | 2,704 (17.7%) | 7,751 (26.2%) |
| Total | 15,294 (100.0%) | 29,646 (100.0%) |
Property Value to Household Income Ratio in Kenosha County
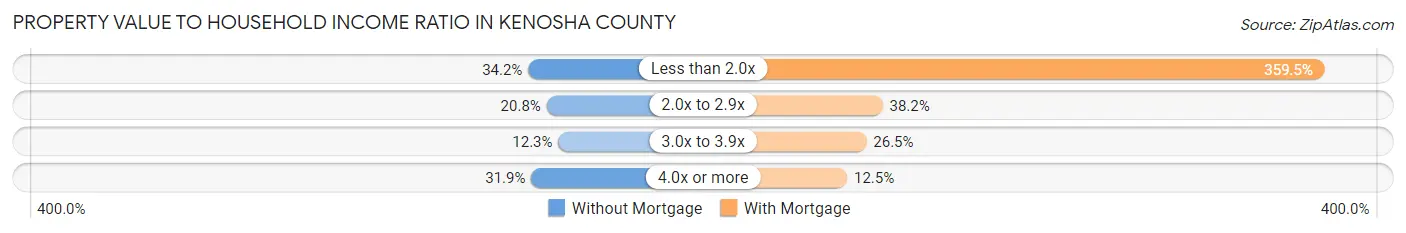
| Value-to-Income Ratio | Without Mortgage | With Mortgage |
| Less than 2.0x | 5,226 (34.2%) | 106,574 (359.5%) |
| 2.0x to 2.9x | 3,176 (20.8%) | 11,328 (38.2%) |
| 3.0x to 3.9x | 1,875 (12.3%) | 7,850 (26.5%) |
| 4.0x or more | 4,880 (31.9%) | 3,697 (12.5%) |
| Total | 15,294 (100.0%) | 29,646 (100.0%) |
Real Estate Taxes by Mortgage Status in Kenosha County

| Property Taxes | Without Mortgage | With Mortgage |
| Less than $800 | 973 (6.4%) | 58 (0.2%) |
| $800 to $1,499 | 226 (1.5%) | 442 (1.5%) |
| $800 to $1,499 | 13,285 (86.9%) | 687 (2.3%) |
| Total | 15,294 (100.0%) | 29,646 (100.0%) |
Health & Disability in Kenosha County
Health Insurance Coverage by Age in Kenosha County
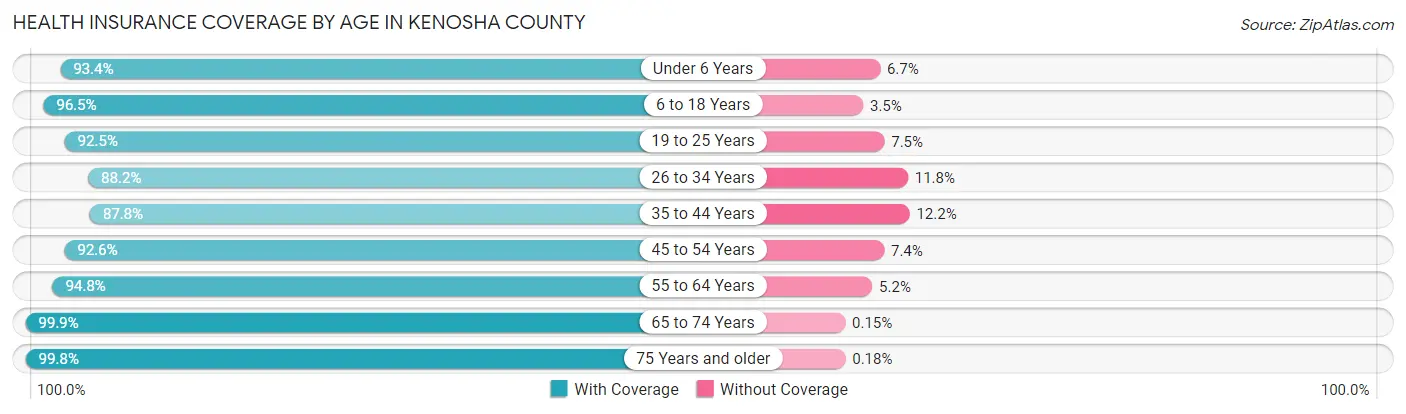
| Age Bracket | With Coverage | Without Coverage |
| Under 6 Years | 10,327 (93.3%) | 736 (6.7%) |
| 6 to 18 Years | 27,762 (96.5%) | 1,004 (3.5%) |
| 19 to 25 Years | 15,316 (92.5%) | 1,235 (7.5%) |
| 26 to 34 Years | 16,681 (88.2%) | 2,241 (11.8%) |
| 35 to 44 Years | 18,424 (87.8%) | 2,550 (12.2%) |
| 45 to 54 Years | 20,620 (92.6%) | 1,651 (7.4%) |
| 55 to 64 Years | 22,900 (94.8%) | 1,257 (5.2%) |
| 65 to 74 Years | 15,058 (99.9%) | 23 (0.2%) |
| 75 Years and older | 9,247 (99.8%) | 17 (0.2%) |
| Total | 156,335 (93.6%) | 10,714 (6.4%) |
Health Insurance Coverage by Citizenship Status in Kenosha County

| Citizenship Status | With Coverage | Without Coverage |
| Native Born | 10,327 (93.3%) | 736 (6.7%) |
| Foreign Born, Citizen | 27,762 (96.5%) | 1,004 (3.5%) |
| Foreign Born, not a Citizen | 15,316 (92.5%) | 1,235 (7.5%) |
Health Insurance Coverage by Household Income in Kenosha County
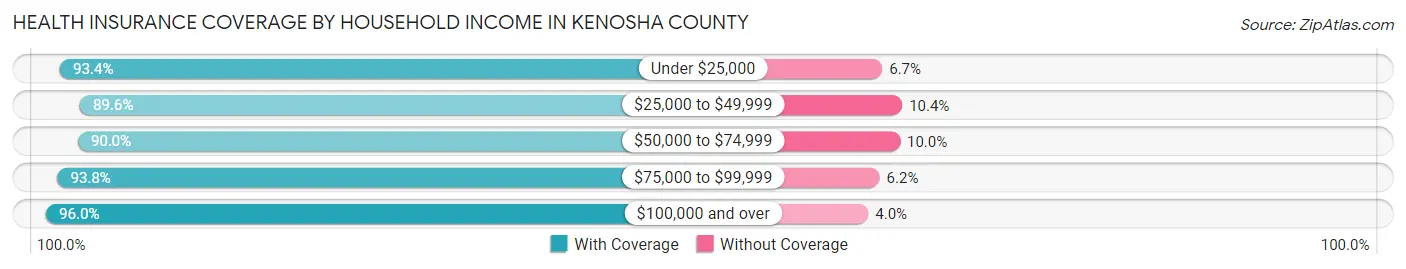
| Household Income | With Coverage | Without Coverage |
| Under $25,000 | 14,612 (93.3%) | 1,041 (6.7%) |
| $25,000 to $49,999 | 19,948 (89.6%) | 2,311 (10.4%) |
| $50,000 to $74,999 | 23,725 (90.0%) | 2,631 (10.0%) |
| $75,000 to $99,999 | 23,318 (93.8%) | 1,530 (6.2%) |
| $100,000 and over | 72,100 (96.0%) | 3,034 (4.0%) |
Public vs Private Health Insurance Coverage by Age in Kenosha County
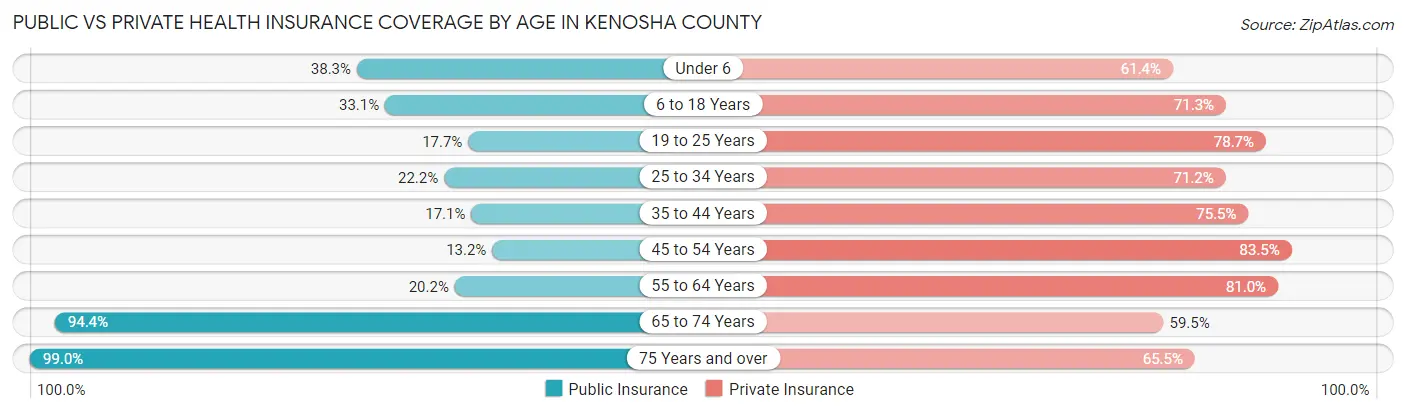
| Age Bracket | Public Insurance | Private Insurance |
| Under 6 | 4,240 (38.3%) | 6,797 (61.4%) |
| 6 to 18 Years | 9,521 (33.1%) | 20,509 (71.3%) |
| 19 to 25 Years | 2,923 (17.7%) | 13,027 (78.7%) |
| 25 to 34 Years | 4,192 (22.2%) | 13,479 (71.2%) |
| 35 to 44 Years | 3,584 (17.1%) | 15,826 (75.5%) |
| 45 to 54 Years | 2,943 (13.2%) | 18,593 (83.5%) |
| 55 to 64 Years | 4,870 (20.2%) | 19,556 (80.9%) |
| 65 to 74 Years | 14,234 (94.4%) | 8,978 (59.5%) |
| 75 Years and over | 9,172 (99.0%) | 6,070 (65.5%) |
| Total | 55,679 (33.3%) | 122,835 (73.5%) |
Disability Status by Sex by Age in Kenosha County
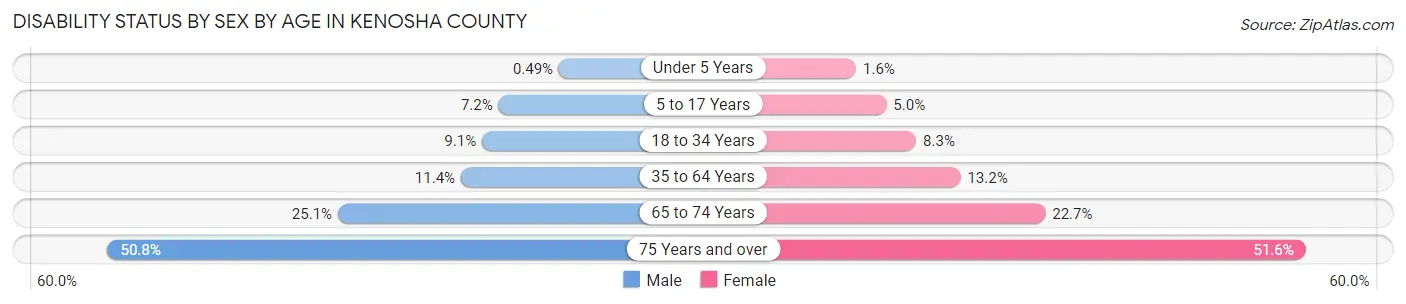
| Age Bracket | Male | Female |
| Under 5 Years | 23 (0.5%) | 71 (1.6%) |
| 5 to 17 Years | 1,037 (7.2%) | 686 (5.0%) |
| 18 to 34 Years | 1,730 (9.1%) | 1,563 (8.3%) |
| 35 to 64 Years | 3,834 (11.4%) | 4,471 (13.2%) |
| 65 to 74 Years | 1,817 (25.1%) | 1,778 (22.7%) |
| 75 Years and over | 1,969 (50.8%) | 2,781 (51.6%) |
Disability Class by Sex by Age in Kenosha County
Disability Class: Hearing Difficulty
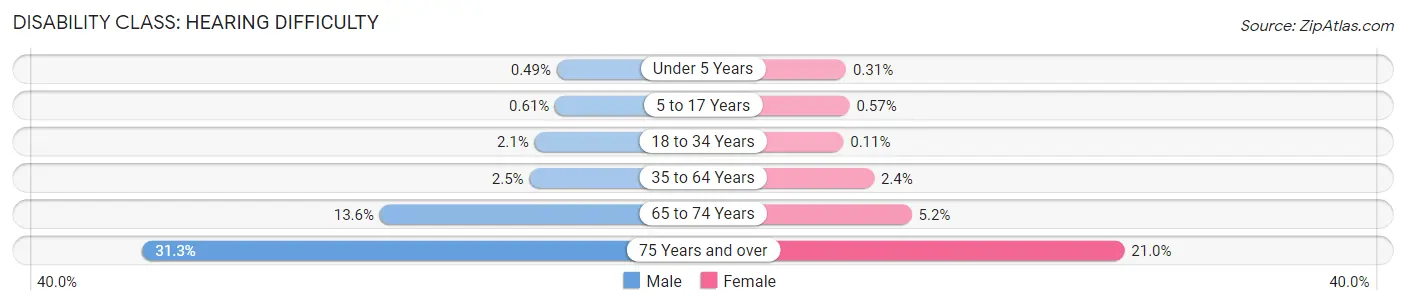
| Age Bracket | Male | Female |
| Under 5 Years | 23 (0.5%) | 14 (0.3%) |
| 5 to 17 Years | 87 (0.6%) | 79 (0.6%) |
| 18 to 34 Years | 408 (2.1%) | 21 (0.1%) |
| 35 to 64 Years | 848 (2.5%) | 809 (2.4%) |
| 65 to 74 Years | 986 (13.6%) | 406 (5.2%) |
| 75 Years and over | 1,212 (31.2%) | 1,130 (21.0%) |
Disability Class: Vision Difficulty
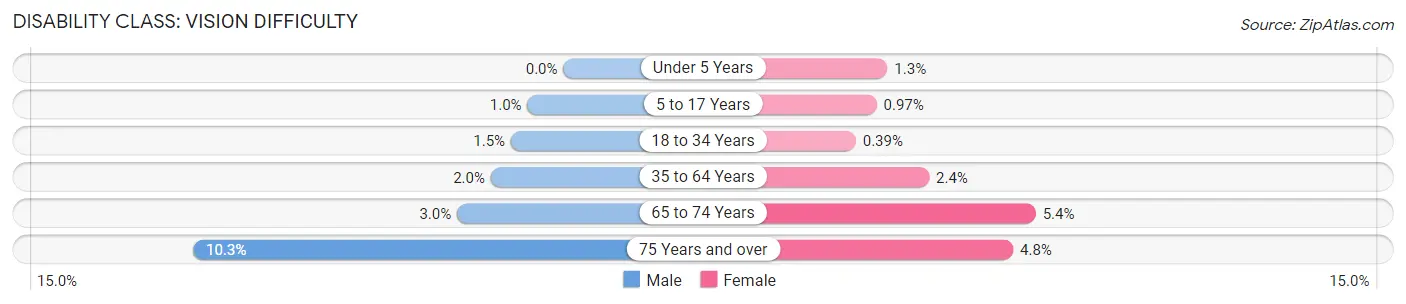
| Age Bracket | Male | Female |
| Under 5 Years | 0 (0.0%) | 57 (1.3%) |
| 5 to 17 Years | 144 (1.0%) | 134 (1.0%) |
| 18 to 34 Years | 279 (1.5%) | 74 (0.4%) |
| 35 to 64 Years | 679 (2.0%) | 821 (2.4%) |
| 65 to 74 Years | 214 (3.0%) | 424 (5.4%) |
| 75 Years and over | 400 (10.3%) | 257 (4.8%) |
Disability Class: Cognitive Difficulty
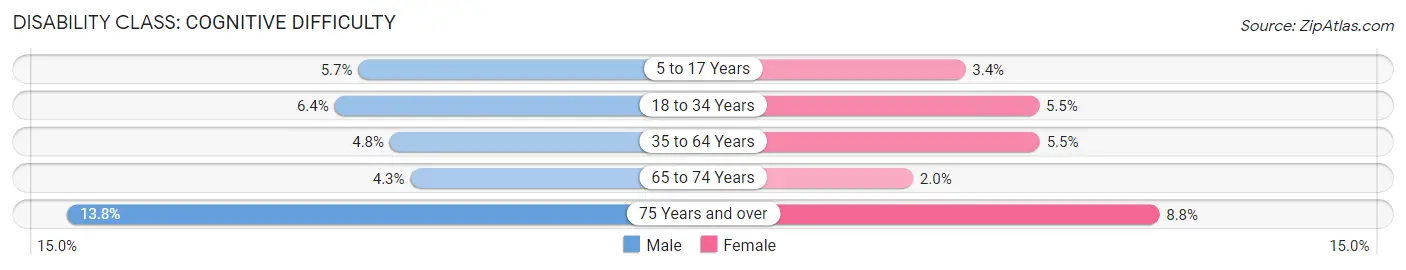
| Age Bracket | Male | Female |
| 5 to 17 Years | 820 (5.7%) | 475 (3.4%) |
| 18 to 34 Years | 1,217 (6.4%) | 1,037 (5.5%) |
| 35 to 64 Years | 1,622 (4.8%) | 1,864 (5.5%) |
| 65 to 74 Years | 308 (4.3%) | 155 (2.0%) |
| 75 Years and over | 536 (13.8%) | 476 (8.8%) |
Disability Class: Ambulatory Difficulty
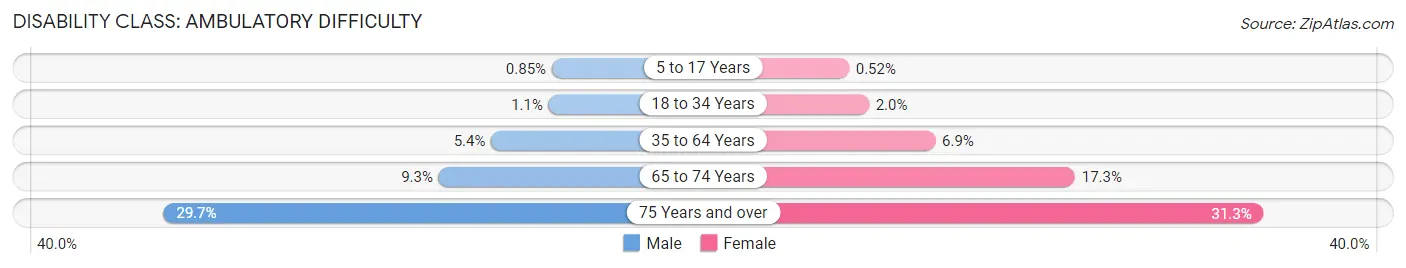
| Age Bracket | Male | Female |
| 5 to 17 Years | 122 (0.9%) | 72 (0.5%) |
| 18 to 34 Years | 206 (1.1%) | 378 (2.0%) |
| 35 to 64 Years | 1,798 (5.3%) | 2,344 (6.9%) |
| 65 to 74 Years | 669 (9.2%) | 1,357 (17.3%) |
| 75 Years and over | 1,152 (29.7%) | 1,686 (31.3%) |
Disability Class: Self-Care Difficulty

| Age Bracket | Male | Female |
| 5 to 17 Years | 211 (1.5%) | 121 (0.9%) |
| 18 to 34 Years | 171 (0.9%) | 195 (1.0%) |
| 35 to 64 Years | 846 (2.5%) | 797 (2.4%) |
| 65 to 74 Years | 203 (2.8%) | 570 (7.3%) |
| 75 Years and over | 650 (16.8%) | 540 (10.0%) |
Technology Access in Kenosha County
Computing Device Access in Kenosha County
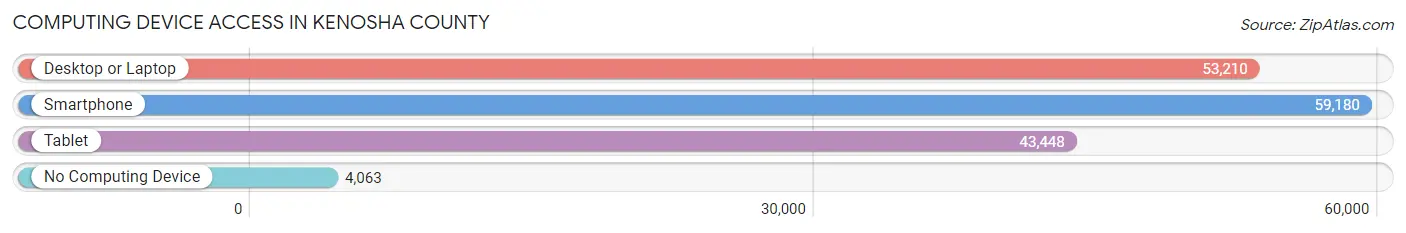
| Device Type | # Households | % Households |
| Desktop or Laptop | 53,210 | 79.8% |
| Smartphone | 59,180 | 88.7% |
| Tablet | 43,448 | 65.1% |
| No Computing Device | 4,063 | 6.1% |
| Total | 66,705 | 100.0% |
Internet Access in Kenosha County
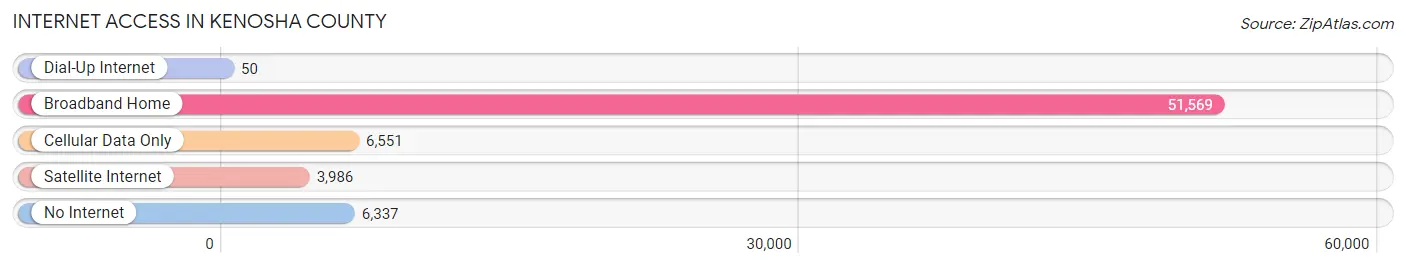
| Internet Type | # Households | % Households |
| Dial-Up Internet | 50 | 0.1% |
| Broadband Home | 51,569 | 77.3% |
| Cellular Data Only | 6,551 | 9.8% |
| Satellite Internet | 3,986 | 6.0% |
| No Internet | 6,337 | 9.5% |
| Total | 66,705 | 100.0% |
Kenosha County Summary
Kenosha County, Wisconsin is located in the southeastern corner of the state, along the shores of Lake Michigan. It is bordered by Racine County to the north, Walworth County to the west, and Illinois to the south. The county seat is Kenosha, and the largest city is also Kenosha. The county has a population of 166,426, according to the 2010 census.
History
Kenosha County was first settled in the early 19th century by French-Canadian fur traders. The area was part of the Northwest Territory until 1836, when it became part of the Wisconsin Territory. In 1839, the county was officially organized and named after the Potawatomi word for “pike”, which was the name of a local fish.
The county was largely agricultural until the late 19th century, when the city of Kenosha began to develop as an industrial center. The city was home to several large factories, including the American Motors Corporation, which was founded in Kenosha in 1902. The city also became a popular tourist destination, with several amusement parks and resorts.
In the late 20th century, the county experienced a period of economic decline as the manufacturing industry declined. However, the county has since seen a resurgence in its economy, with the development of new industries such as healthcare, education, and technology.
Geography
Kenosha County covers an area of 837 square miles, making it the second-largest county in Wisconsin. The county is located in the southeastern corner of the state, along the shores of Lake Michigan. The county is mostly flat, with some rolling hills in the northern and western parts. The highest point in the county is the summit of the Kenosha Hills, which is located in the northwest corner of the county and has an elevation of 845 feet.
The county is home to several rivers and streams, including the Pike River, the Fox River, and the Root River. The county also contains several lakes, including Lake Andrea, Lake Mary, and Lake Elizabeth.
Economy
Kenosha County has a diverse economy, with a mix of manufacturing, healthcare, education, and technology industries. The county is home to several large employers, including Amazon, Uline, and Snap-on Tools. The county is also home to several universities and colleges, including the University of Wisconsin-Parkside and Carthage College.
The county’s largest industry is manufacturing, which accounts for about 25% of the county’s total employment. The county is home to several large factories, including the American Motors Corporation, which was founded in Kenosha in 1902. The county is also home to several automotive parts suppliers, including Johnson Controls and Federal-Mogul.
The county’s second-largest industry is healthcare, which accounts for about 15% of the county’s total employment. The county is home to several hospitals and medical centers, including the Kenosha Medical Center and the Aurora Medical Center.
Demographics
According to the 2010 census, Kenosha County has a population of 166,426. The population is fairly evenly split between men and women, with 50.3% of the population being male and 49.7% being female. The median age of the population is 38.7 years.
The racial makeup of the county is 87.2% White, 6.2% African American, 1.7% Asian, 0.7% Native American, and 3.2% from other races. The largest ancestry groups in the county are German (25.2%), Irish (17.2%), Polish (14.2%), and Italian (10.2%).
The county has a median household income of $54,845, and a poverty rate of 11.2%. The largest industries in the county are manufacturing (25%), healthcare (15%), education (14%), and retail trade (13%). The largest employers in the county are Amazon, Uline, and Snap-on Tools.
Common Questions
What is the Total Population of Kenosha County?
Total Population of Kenosha County is 168,693.
What is the Total Male Population of Kenosha County?
Total Male Population of Kenosha County is 83,870.
What is the Total Female Population of Kenosha County?
Total Female Population of Kenosha County is 84,823.
What is the Ratio of Males per 100 Females in Kenosha County?
There are 98.88 Males per 100 Females in Kenosha County.
What is the Ratio of Females per 100 Males in Kenosha County?
There are 101.14 Females per 100 Males in Kenosha County.
What is the Median Population Age in Kenosha County?
Median Population Age in Kenosha County is 38.9 Years.
What is the Average Family Size in Kenosha County
Average Family Size in Kenosha County is 3.0 People.
What is the Average Household Size in Kenosha County
Average Household Size in Kenosha County is 2.5 People.
What is Per Capita Income in Kenosha County?
Per Capita income in Kenosha County is $38,720.
What is the Median Family Income in Kenosha County?
Median Family Income in Kenosha County is $94,742.
What is the Median Household income in Kenosha County?
Median Household Income in Kenosha County is $76,583.
What is Income or Wage Gap in Kenosha County?
Income or Wage Gap in Kenosha County is 27.8%.
Women in Kenosha County earn 72.2 cents for every dollar earned by a man.
What is Family Income Deficit in Kenosha County?
Family Income Deficit in Kenosha County is $9,755.
Families that are below poverty line in Kenosha County earn $9,755 less on average than the poverty threshold level.
What is Inequality or Gini Index in Kenosha County?
Inequality or Gini Index in Kenosha County is 0.42.
How Large is the Labor Force in Kenosha County?
There are 91,593 People in the Labor Forcein in Kenosha County.
What is the Percentage of People in the Labor Force in Kenosha County?
67.4% of People are in the Labor Force in Kenosha County.
What is the Unemployment Rate in Kenosha County?
Unemployment Rate in Kenosha County is 5.4%.