Juneau County, WI
Juneau County Overview
26,695
TOTAL POPULATION
14,477
MALE POPULATION
12,218
FEMALE POPULATION
118.49
MALES / 100 FEMALES
84.40
FEMALES / 100 MALES
45.7
MEDIAN AGE
2.9
AVG FAMILY SIZE
2.3
AVG HOUSEHOLD SIZE
$31,211
PER CAPITA INCOME
$76,281
AVG FAMILY INCOME
$63,455
AVG HOUSEHOLD INCOME
24.3%
WAGE / INCOME GAP [ % ]
75.7¢/ $1
WAGE / INCOME GAP [ $ ]
$9,840
FAMILY INCOME DEFICIT
0.41
INEQUALITY / GINI INDEX
12,855
LABOR FORCE [ PEOPLE ]
58.3%
PERCENT IN LABOR FORCE
4.2%
UNEMPLOYMENT RATE
Juneau County Area Codes
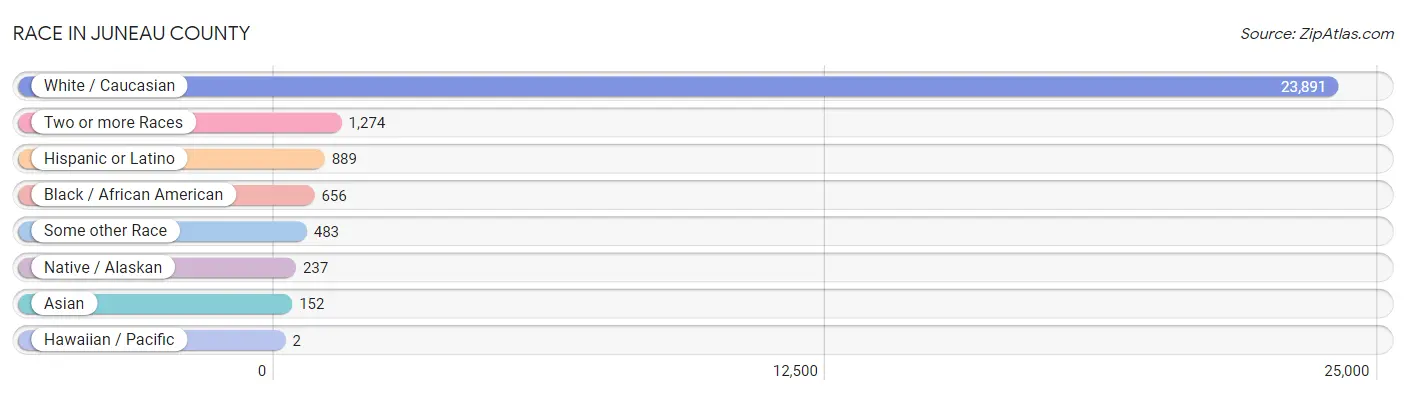
Race in Juneau County
The most populous races in Juneau County are White / Caucasian (23,891 | 89.5%), Two or more Races (1,274 | 4.8%), and Hispanic or Latino (889 | 3.3%).
| Race | # Population | % Population |
| Asian | 152 | 0.6% |
| Black / African American | 656 | 2.5% |
| Hawaiian / Pacific | 2 | 0.0% |
| Hispanic or Latino | 889 | 3.3% |
| Native / Alaskan | 237 | 0.9% |
| White / Caucasian | 23,891 | 89.5% |
| Two or more Races | 1,274 | 4.8% |
| Some other Race | 483 | 1.8% |
| Total | 26,695 | 100.0% |
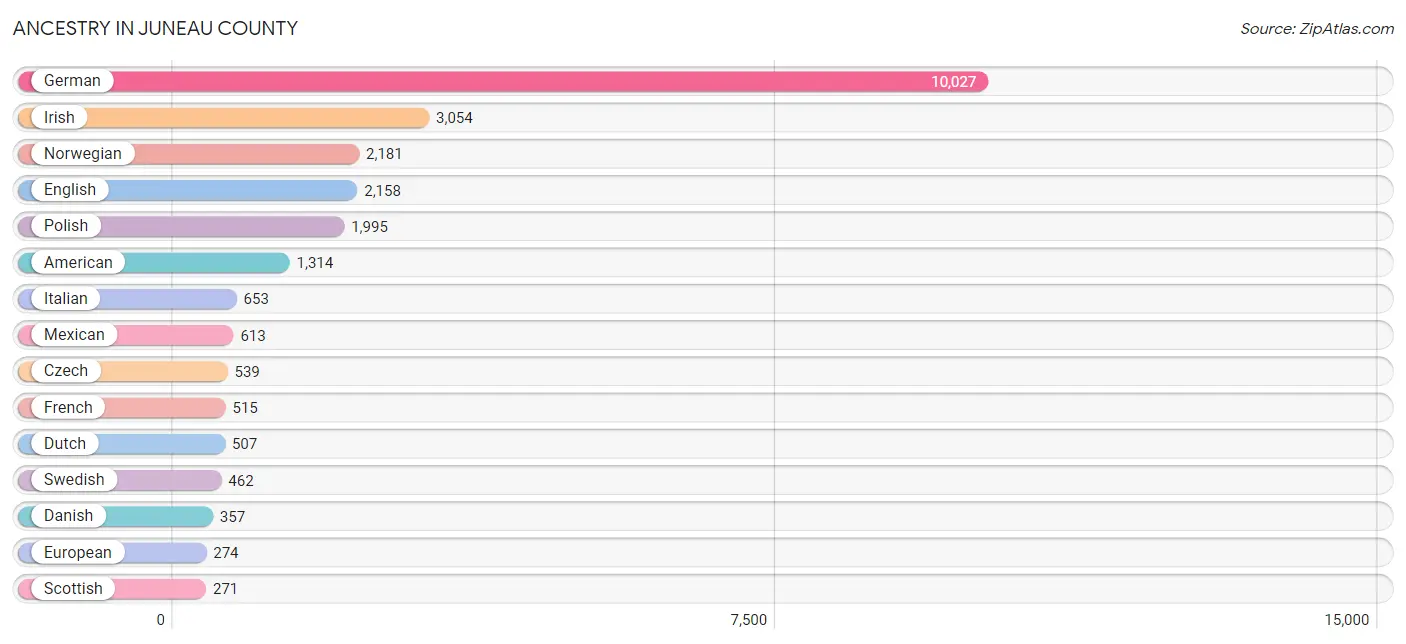
Ancestry in Juneau County
The most populous ancestries reported in Juneau County are German (10,027 | 37.6%), Irish (3,054 | 11.4%), Norwegian (2,181 | 8.2%), English (2,158 | 8.1%), and Polish (1,995 | 7.5%), together accounting for 72.7% of all Juneau County residents.
| Ancestry | # Population | % Population |
| African | 146 | 0.5% |
| American | 1,314 | 4.9% |
| Apache | 15 | 0.1% |
| Arab | 5 | 0.0% |
| Armenian | 2 | 0.0% |
| Australian | 2 | 0.0% |
| Austrian | 66 | 0.3% |
| Bangladeshi | 22 | 0.1% |
| Belgian | 121 | 0.4% |
| Bhutanese | 2 | 0.0% |
| Brazilian | 2 | 0.0% |
| British | 38 | 0.1% |
| Burmese | 22 | 0.1% |
| Cambodian | 13 | 0.1% |
| Canadian | 84 | 0.3% |
| Celtic | 1 | 0.0% |
| Central American | 29 | 0.1% |
| Central American Indian | 10 | 0.0% |
| Cherokee | 77 | 0.3% |
| Chippewa | 35 | 0.1% |
| Colombian | 23 | 0.1% |
| Comanche | 4 | 0.0% |
| Creek | 1 | 0.0% |
| Croatian | 60 | 0.2% |
| Crow | 12 | 0.0% |
| Cuban | 30 | 0.1% |
| Czech | 539 | 2.0% |
| Czechoslovakian | 47 | 0.2% |
| Danish | 357 | 1.3% |
| Dutch | 507 | 1.9% |
| Dutch West Indian | 2 | 0.0% |
| Eastern European | 30 | 0.1% |
| Ecuadorian | 2 | 0.0% |
| English | 2,158 | 8.1% |
| European | 274 | 1.0% |
| Finnish | 78 | 0.3% |
| French | 515 | 1.9% |
| French American Indian | 3 | 0.0% |
| French Canadian | 268 | 1.0% |
| German | 10,027 | 37.6% |
| Greek | 38 | 0.1% |
| Guamanian / Chamorro | 4 | 0.0% |
| Guatemalan | 27 | 0.1% |
| Haitian | 19 | 0.1% |
| Hungarian | 79 | 0.3% |
| Indian (Asian) | 4 | 0.0% |
| Inupiat | 2 | 0.0% |
| Irish | 3,054 | 11.4% |
| Iroquois | 23 | 0.1% |
| Italian | 653 | 2.5% |
| Korean | 51 | 0.2% |
| Laotian | 3 | 0.0% |
| Latvian | 10 | 0.0% |
| Lebanese | 2 | 0.0% |
| Lithuanian | 35 | 0.1% |
| Luxembourger | 64 | 0.2% |
| Menominee | 26 | 0.1% |
| Mexican | 613 | 2.3% |
| Mexican American Indian | 36 | 0.1% |
| Native Hawaiian | 2 | 0.0% |
| Navajo | 1 | 0.0% |
| Nigerian | 10 | 0.0% |
| Northern European | 6 | 0.0% |
| Norwegian | 2,181 | 8.2% |
| Pakistani | 6 | 0.0% |
| Panamanian | 2 | 0.0% |
| Pennsylvania German | 3 | 0.0% |
| Polish | 1,995 | 7.5% |
| Portuguese | 24 | 0.1% |
| Puerto Rican | 93 | 0.4% |
| Romanian | 15 | 0.1% |
| Russian | 107 | 0.4% |
| Scandinavian | 86 | 0.3% |
| Scotch-Irish | 123 | 0.5% |
| Scottish | 271 | 1.0% |
| Serbian | 4 | 0.0% |
| Shoshone | 1 | 0.0% |
| Sioux | 25 | 0.1% |
| Slavic | 4 | 0.0% |
| Slovak | 4 | 0.0% |
| Slovene | 6 | 0.0% |
| South African | 4 | 0.0% |
| South American | 32 | 0.1% |
| Spaniard | 1 | 0.0% |
| Spanish | 19 | 0.1% |
| Spanish American | 8 | 0.0% |
| Sri Lankan | 9 | 0.0% |
| Subsaharan African | 179 | 0.7% |
| Swedish | 462 | 1.7% |
| Swiss | 143 | 0.5% |
| Taiwanese | 5 | 0.0% |
| Thai | 71 | 0.3% |
| Ukrainian | 24 | 0.1% |
| Welsh | 82 | 0.3% |
| Yugoslavian | 18 | 0.1% | View All 95 Rows |
Immigrants in Juneau County
The most numerous immigrant groups reported in Juneau County came from Europe (363 | 1.4%), Eastern Europe (290 | 1.1%), Poland (263 | 1.0%), Asia (126 | 0.5%), and Latin America (112 | 0.4%), together accounting for 4.3% of all Juneau County residents.

| Immigration Origin | # Population | % Population |
| Africa | 21 | 0.1% |
| Asia | 126 | 0.5% |
| Bosnia and Herzegovina | 5 | 0.0% |
| Canada | 26 | 0.1% |
| Caribbean | 17 | 0.1% |
| Central America | 93 | 0.4% |
| China | 4 | 0.0% |
| Colombia | 2 | 0.0% |
| Croatia | 8 | 0.0% |
| Cuba | 14 | 0.1% |
| Denmark | 14 | 0.1% |
| Eastern Africa | 19 | 0.1% |
| Eastern Asia | 22 | 0.1% |
| Eastern Europe | 290 | 1.1% |
| England | 6 | 0.0% |
| Europe | 363 | 1.4% |
| France | 5 | 0.0% |
| Germany | 39 | 0.2% |
| Guatemala | 16 | 0.1% |
| Haiti | 3 | 0.0% |
| India | 45 | 0.2% |
| Korea | 5 | 0.0% |
| Laos | 12 | 0.0% |
| Latin America | 112 | 0.4% |
| Latvia | 4 | 0.0% |
| Mexico | 77 | 0.3% |
| Northern Europe | 26 | 0.1% |
| Oceania | 2 | 0.0% |
| Philippines | 41 | 0.2% |
| Poland | 263 | 1.0% |
| Russia | 7 | 0.0% |
| South America | 2 | 0.0% |
| South Central Asia | 45 | 0.2% |
| South Eastern Asia | 59 | 0.2% |
| Thailand | 6 | 0.0% |
| Ukraine | 3 | 0.0% |
| Western Africa | 2 | 0.0% |
| Western Europe | 44 | 0.2% | View All 38 Rows |
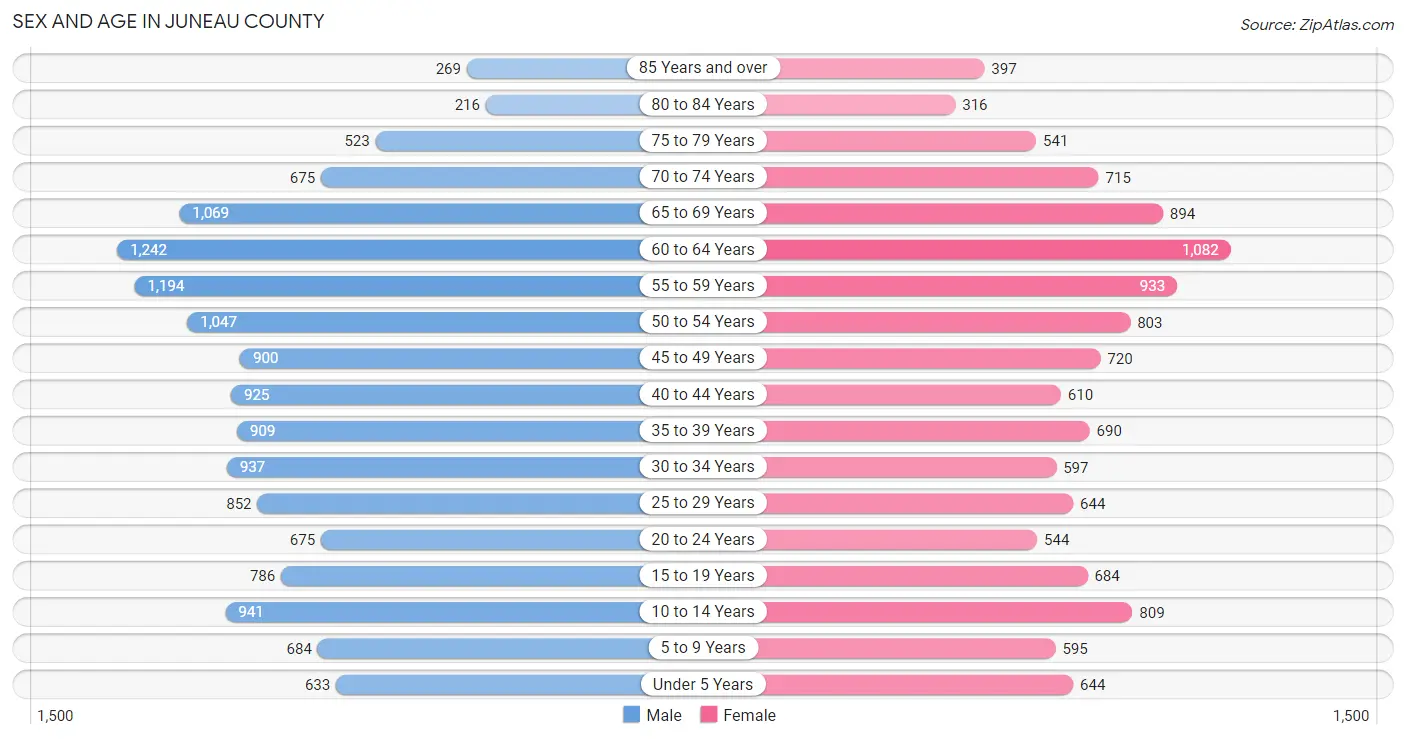
Sex and Age in Juneau County
Sex and Age in Juneau County
The most populous age groups in Juneau County are 60 to 64 Years (1,242 | 8.6%) for men and 60 to 64 Years (1,082 | 8.9%) for women.
| Age Bracket | Male | Female |
| Under 5 Years | 633 (4.4%) | 644 (5.3%) |
| 5 to 9 Years | 684 (4.7%) | 595 (4.9%) |
| 10 to 14 Years | 941 (6.5%) | 809 (6.6%) |
| 15 to 19 Years | 786 (5.4%) | 684 (5.6%) |
| 20 to 24 Years | 675 (4.7%) | 544 (4.4%) |
| 25 to 29 Years | 852 (5.9%) | 644 (5.3%) |
| 30 to 34 Years | 937 (6.5%) | 597 (4.9%) |
| 35 to 39 Years | 909 (6.3%) | 690 (5.7%) |
| 40 to 44 Years | 925 (6.4%) | 610 (5.0%) |
| 45 to 49 Years | 900 (6.2%) | 720 (5.9%) |
| 50 to 54 Years | 1,047 (7.2%) | 803 (6.6%) |
| 55 to 59 Years | 1,194 (8.3%) | 933 (7.6%) |
| 60 to 64 Years | 1,242 (8.6%) | 1,082 (8.9%) |
| 65 to 69 Years | 1,069 (7.4%) | 894 (7.3%) |
| 70 to 74 Years | 675 (4.7%) | 715 (5.9%) |
| 75 to 79 Years | 523 (3.6%) | 541 (4.4%) |
| 80 to 84 Years | 216 (1.5%) | 316 (2.6%) |
| 85 Years and over | 269 (1.9%) | 397 (3.3%) |
| Total | 14,477 (100.0%) | 12,218 (100.0%) |
Families and Households in Juneau County
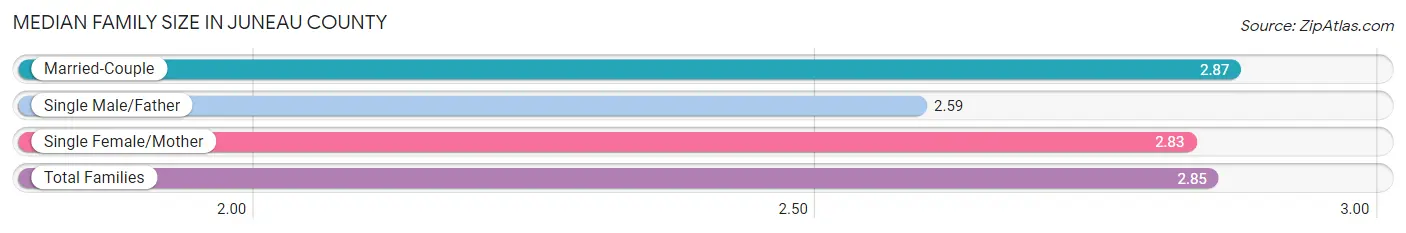
Median Family Size in Juneau County
The median family size in Juneau County is 2.85 persons per family, with married-couple families (5,336 | 79.9%) accounting for the largest median family size of 2.87 persons per family. On the other hand, single male/father families (466 | 7.0%) represent the smallest median family size with 2.59 persons per family.
| Family Type | # Families | Family Size |
| Married-Couple | 5,336 (79.9%) | 2.87 |
| Single Male/Father | 466 (7.0%) | 2.59 |
| Single Female/Mother | 875 (13.1%) | 2.83 |
| Total Families | 6,677 (100.0%) | 2.85 |
Median Household Size in Juneau County
The median household size in Juneau County is 2.33 persons per household, with single female/mother households (875 | 8.3%) accounting for the largest median household size of 3.29 persons per household. non-family households (3,921 | 37.0%) represent the smallest median household size with 1.23 persons per household.
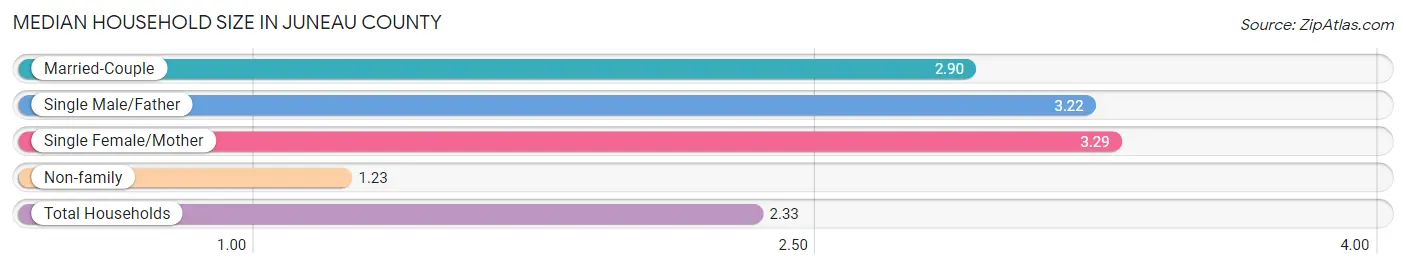
| Household Type | # Households | Household Size |
| Married-Couple | 5,336 (50.3%) | 2.90 |
| Single Male/Father | 466 (4.4%) | 3.22 |
| Single Female/Mother | 875 (8.3%) | 3.29 |
| Non-family | 3,921 (37.0%) | 1.23 |
| Total Households | 10,598 (100.0%) | 2.33 |
Household Size by Marriage Status in Juneau County
Out of a total of 10,598 households in Juneau County, 6,677 (63.0%) are family households, while 3,921 (37.0%) are nonfamily households. The most numerous type of family households are 2-person households, comprising 3,667, and the most common type of nonfamily households are 1-person households, comprising 3,163.
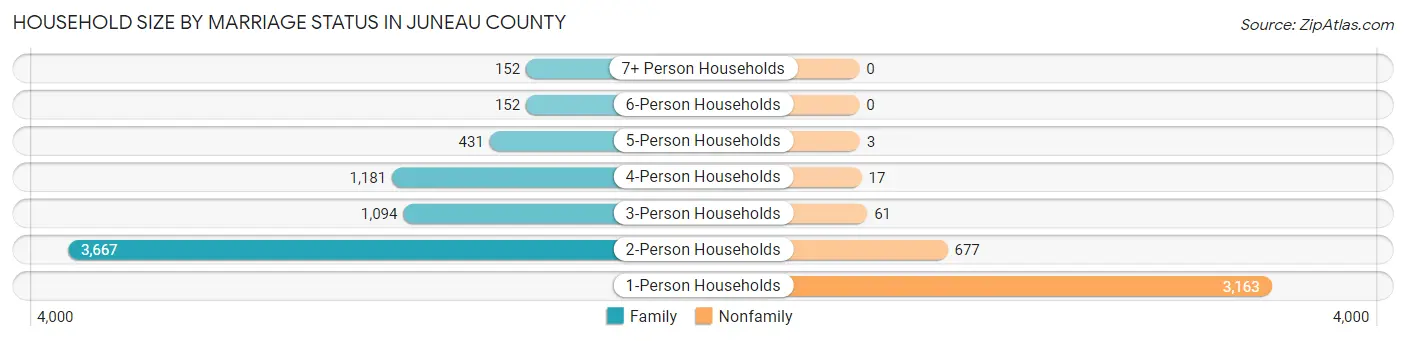
| Household Size | Family Households | Nonfamily Households |
| 1-Person Households | - | 3,163 (29.8%) |
| 2-Person Households | 3,667 (34.6%) | 677 (6.4%) |
| 3-Person Households | 1,094 (10.3%) | 61 (0.6%) |
| 4-Person Households | 1,181 (11.1%) | 17 (0.2%) |
| 5-Person Households | 431 (4.1%) | 3 (0.0%) |
| 6-Person Households | 152 (1.4%) | 0 (0.0%) |
| 7+ Person Households | 152 (1.4%) | 0 (0.0%) |
| Total | 6,677 (63.0%) | 3,921 (37.0%) |
Female Fertility in Juneau County
Fertility by Age in Juneau County
Average fertility rate in Juneau County is 77.0 births per 1,000 women. Women in the age bracket of 20 to 34 years have the highest fertility rate with 143.0 births per 1,000 women. Women in the age bracket of 20 to 34 years acount for 71.0% of all women with births.
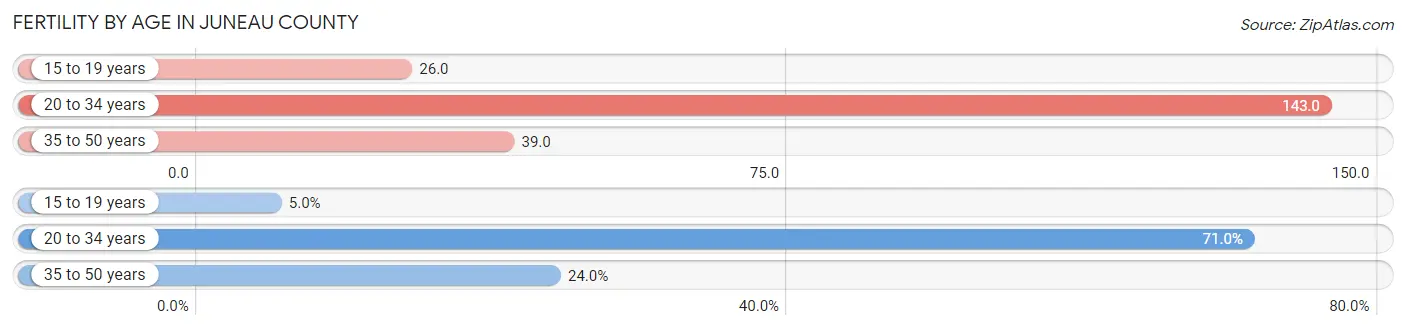
| Age Bracket | Women with Births | Births / 1,000 Women |
| 15 to 19 years | 18 (5.0%) | 26.0 |
| 20 to 34 years | 255 (71.0%) | 143.0 |
| 35 to 50 years | 86 (24.0%) | 39.0 |
| Total | 359 (100.0%) | 77.0 |
Fertility by Age by Marriage Status in Juneau County
47.6% of women with births (359) in Juneau County are married. The highest percentage of unmarried women with births falls into 15 to 19 years age bracket with 100.0% of them unmarried at the time of birth, while the lowest percentage of unmarried women with births belong to 35 to 50 years age bracket with 25.6% of them unmarried.
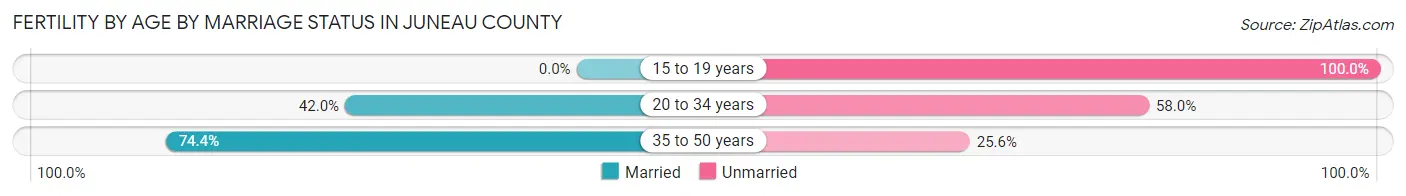
| Age Bracket | Married | Unmarried |
| 15 to 19 years | 0 (0.0%) | 18 (100.0%) |
| 20 to 34 years | 107 (42.0%) | 148 (58.0%) |
| 35 to 50 years | 64 (74.4%) | 22 (25.6%) |
| Total | 171 (47.6%) | 188 (52.4%) |
Fertility by Education in Juneau County
Average fertility rate in Juneau County is 77.0 births per 1,000 women. Women with the education attainment of bachelor's degree have the highest fertility rate of 90.0 births per 1,000 women, while women with the education attainment of college or associate's degree have the lowest fertility at 63.0 births per 1,000 women. Women with the education attainment of high school diploma represent 32.6% of all women with births.

| Educational Attainment | Women with Births | Births / 1,000 Women |
| Less than High School | 61 (17.0%) | 79.0 |
| High School Diploma | 117 (32.6%) | 88.0 |
| College or Associate's Degree | 107 (29.8%) | 63.0 |
| Bachelor's Degree | 53 (14.8%) | 90.0 |
| Graduate Degree | 21 (5.9%) | 76.0 |
| Total | 359 (100.0%) | 77.0 |
Fertility by Education by Marriage Status in Juneau County
52.4% of women with births in Juneau County are unmarried. Women with the educational attainment of graduate degree are most likely to be married with 100.0% of them married at childbirth, while women with the educational attainment of less than high school are least likely to be married with 83.6% of them unmarried at childbirth.
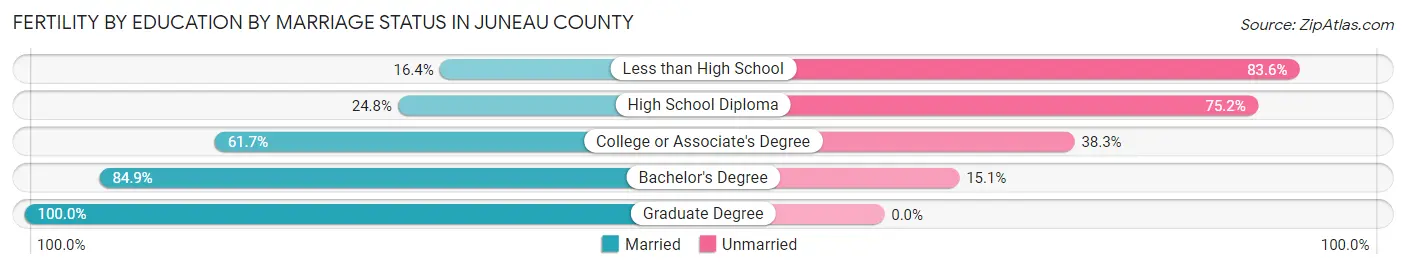
| Educational Attainment | Married | Unmarried |
| Less than High School | 10 (16.4%) | 51 (83.6%) |
| High School Diploma | 29 (24.8%) | 88 (75.2%) |
| College or Associate's Degree | 66 (61.7%) | 41 (38.3%) |
| Bachelor's Degree | 45 (84.9%) | 8 (15.1%) |
| Graduate Degree | 21 (100.0%) | 0 (0.0%) |
| Total | 171 (47.6%) | 188 (52.4%) |
Income in Juneau County
Income Overview in Juneau County
Per Capita Income in Juneau County is $31,211, while median incomes of families and households are $76,281 and $63,455 respectively.
| Characteristic | Number | Measure |
| Per Capita Income | 26,695 | $31,211 |
| Median Family Income | 6,677 | $76,281 |
| Mean Family Income | 6,677 | $88,691 |
| Median Household Income | 10,598 | $63,455 |
| Mean Household Income | 10,598 | $76,575 |
| Income Deficit | 6,677 | $9,840 |
| Wage / Income Gap (%) | 26,695 | 24.29% |
| Wage / Income Gap ($) | 26,695 | 75.71¢ per $1 |
| Gini / Inequality Index | 26,695 | 0.41 |
Earnings by Sex in Juneau County
Average Earnings in Juneau County are $38,481, $43,480 for men and $32,920 for women, a difference of 24.3%.
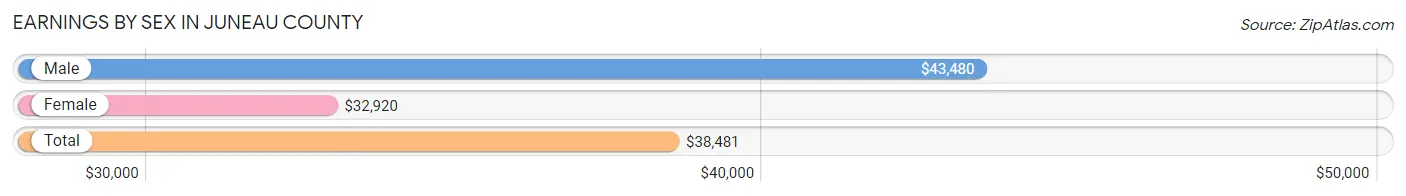
| Sex | Number | Average Earnings |
| Male | 7,442 (54.7%) | $43,480 |
| Female | 6,160 (45.3%) | $32,920 |
| Total | 13,602 (100.0%) | $38,481 |
Earnings by Sex by Income Bracket in Juneau County
The most common earnings brackets in Juneau County are $55,000 to $64,999 for men (855 | 11.5%) and $25,000 to $29,999 for women (561 | 9.1%).

| Income | Male | Female |
| $2,499 or less | 584 (7.9%) | 386 (6.3%) |
| $2,500 to $4,999 | 196 (2.6%) | 243 (3.9%) |
| $5,000 to $7,499 | 274 (3.7%) | 226 (3.7%) |
| $7,500 to $9,999 | 274 (3.7%) | 212 (3.4%) |
| $10,000 to $12,499 | 230 (3.1%) | 215 (3.5%) |
| $12,500 to $14,999 | 178 (2.4%) | 173 (2.8%) |
| $15,000 to $17,499 | 87 (1.2%) | 208 (3.4%) |
| $17,500 to $19,999 | 103 (1.4%) | 165 (2.7%) |
| $20,000 to $22,499 | 153 (2.1%) | 201 (3.3%) |
| $22,500 to $24,999 | 150 (2.0%) | 270 (4.4%) |
| $25,000 to $29,999 | 322 (4.3%) | 561 (9.1%) |
| $30,000 to $34,999 | 391 (5.2%) | 408 (6.6%) |
| $35,000 to $39,999 | 436 (5.9%) | 466 (7.6%) |
| $40,000 to $44,999 | 481 (6.5%) | 473 (7.7%) |
| $45,000 to $49,999 | 409 (5.5%) | 362 (5.9%) |
| $50,000 to $54,999 | 432 (5.8%) | 214 (3.5%) |
| $55,000 to $64,999 | 855 (11.5%) | 528 (8.6%) |
| $65,000 to $74,999 | 691 (9.3%) | 247 (4.0%) |
| $75,000 to $99,999 | 715 (9.6%) | 445 (7.2%) |
| $100,000+ | 481 (6.5%) | 157 (2.5%) |
| Total | 7,442 (100.0%) | 6,160 (100.0%) |
Earnings by Sex by Educational Attainment in Juneau County
Average earnings in Juneau County are $47,883 for men and $36,044 for women, a difference of 24.7%. Men with an educational attainment of graduate degree enjoy the highest average annual earnings of $70,156, while those with less than high school education earn the least with $34,537. Women with an educational attainment of graduate degree earn the most with the average annual earnings of $67,237, while those with less than high school education have the smallest earnings of $22,917.
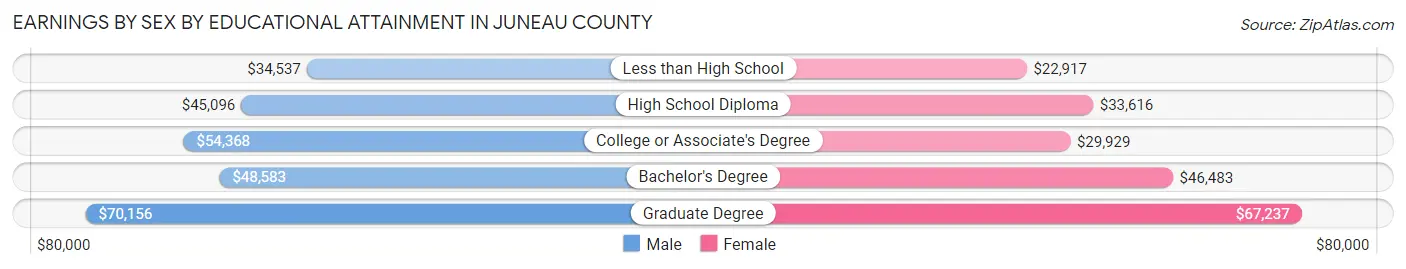
| Educational Attainment | Male Income | Female Income |
| Less than High School | $34,537 | $22,917 |
| High School Diploma | $45,096 | $33,616 |
| College or Associate's Degree | $54,368 | $29,929 |
| Bachelor's Degree | $48,583 | $46,483 |
| Graduate Degree | $70,156 | $67,237 |
| Total | $47,883 | $36,044 |
Family Income in Juneau County
Family Income Brackets in Juneau County
According to the Juneau County family income data, there are 1,496 families falling into the $100,000 to $149,999 income range, which is the most common income bracket and makes up 22.4% of all families. Conversely, the $10,000 to $14,999 income bracket is the least frequent group with only 107 families (1.6%) belonging to this category.
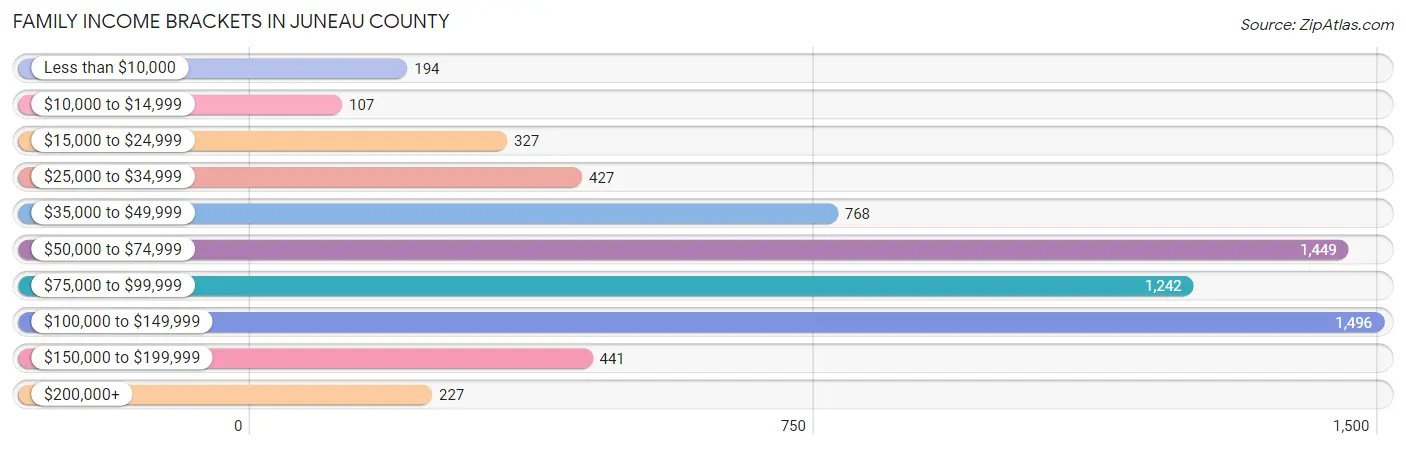
| Income Bracket | # Families | % Families |
| Less than $10,000 | 194 | 2.9% |
| $10,000 to $14,999 | 107 | 1.6% |
| $15,000 to $24,999 | 327 | 4.9% |
| $25,000 to $34,999 | 427 | 6.4% |
| $35,000 to $49,999 | 768 | 11.5% |
| $50,000 to $74,999 | 1,449 | 21.7% |
| $75,000 to $99,999 | 1,242 | 18.6% |
| $100,000 to $149,999 | 1,496 | 22.4% |
| $150,000 to $199,999 | 441 | 6.6% |
| $200,000+ | 227 | 3.4% |
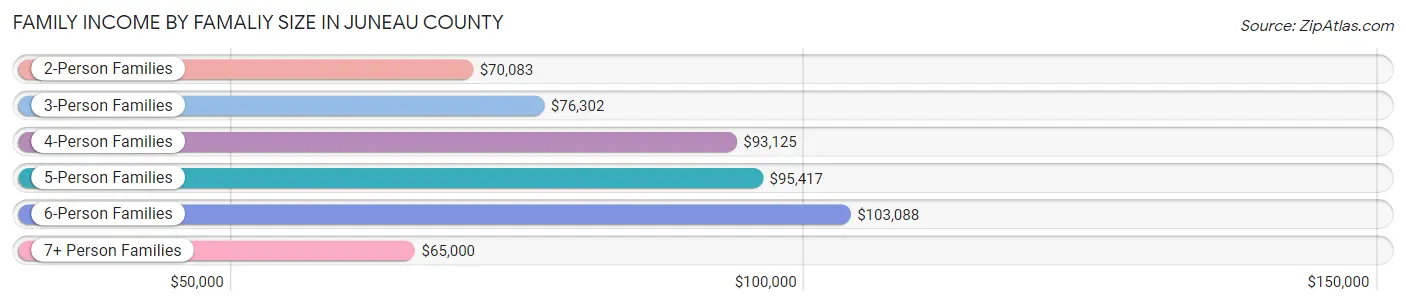
Family Income by Famaliy Size in Juneau County
6-person families (156 | 2.3%) account for the highest median family income in Juneau County with $103,088 per family, while 2-person families (3,950 | 59.2%) have the highest median income of $35,042 per family member.
| Income Bracket | # Families | Median Income |
| 2-Person Families | 3,950 (59.2%) | $70,083 |
| 3-Person Families | 1,097 (16.4%) | $76,302 |
| 4-Person Families | 1,017 (15.2%) | $93,125 |
| 5-Person Families | 381 (5.7%) | $95,417 |
| 6-Person Families | 156 (2.3%) | $103,088 |
| 7+ Person Families | 76 (1.1%) | $65,000 |
| Total | 6,677 (100.0%) | $76,281 |
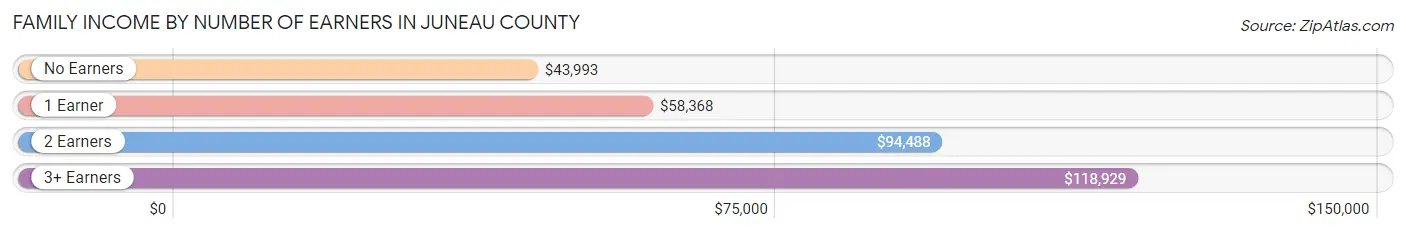
Family Income by Number of Earners in Juneau County
The median family income in Juneau County is $76,281, with families comprising 3+ earners (668) having the highest median family income of $118,929, while families with no earners (1,151) have the lowest median family income of $43,993, accounting for 10.0% and 17.2% of families, respectively.
| Number of Earners | # Families | Median Income |
| No Earners | 1,151 (17.2%) | $43,993 |
| 1 Earner | 2,068 (31.0%) | $58,368 |
| 2 Earners | 2,790 (41.8%) | $94,488 |
| 3+ Earners | 668 (10.0%) | $118,929 |
| Total | 6,677 (100.0%) | $76,281 |
Household Income in Juneau County
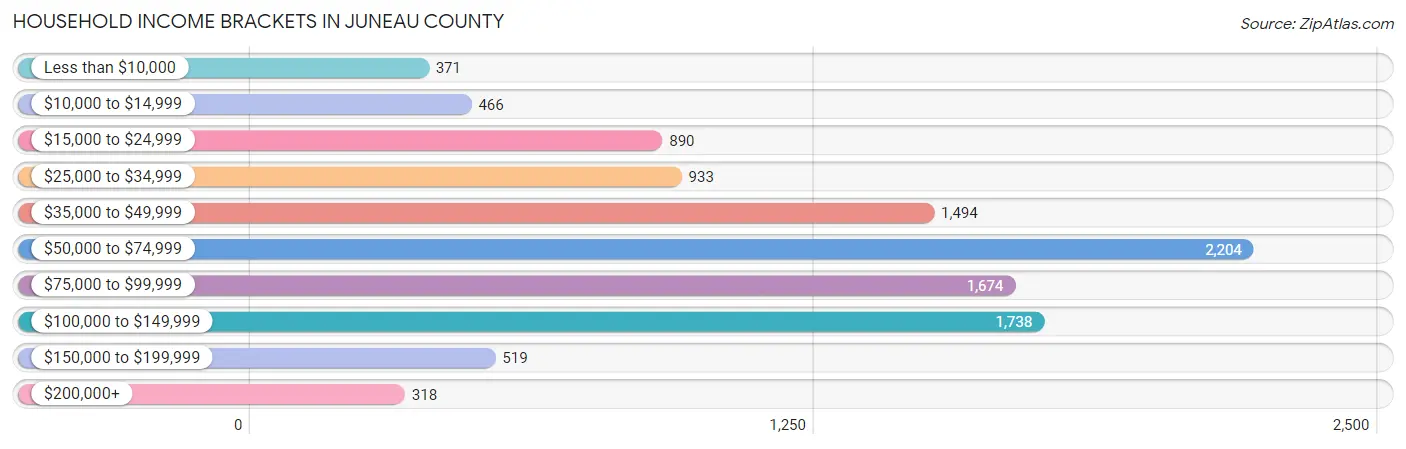
Household Income Brackets in Juneau County
With 2,204 households falling in the category, the $50,000 to $74,999 income range is the most frequent in Juneau County, accounting for 20.8% of all households. In contrast, only 318 households (3.0%) fall into the $200,000+ income bracket, making it the least populous group.
| Income Bracket | # Households | % Households |
| Less than $10,000 | 371 | 3.5% |
| $10,000 to $14,999 | 466 | 4.4% |
| $15,000 to $24,999 | 890 | 8.4% |
| $25,000 to $34,999 | 933 | 8.8% |
| $35,000 to $49,999 | 1,494 | 14.1% |
| $50,000 to $74,999 | 2,204 | 20.8% |
| $75,000 to $99,999 | 1,674 | 15.8% |
| $100,000 to $149,999 | 1,738 | 16.4% |
| $150,000 to $199,999 | 519 | 4.9% |
| $200,000+ | 318 | 3.0% |
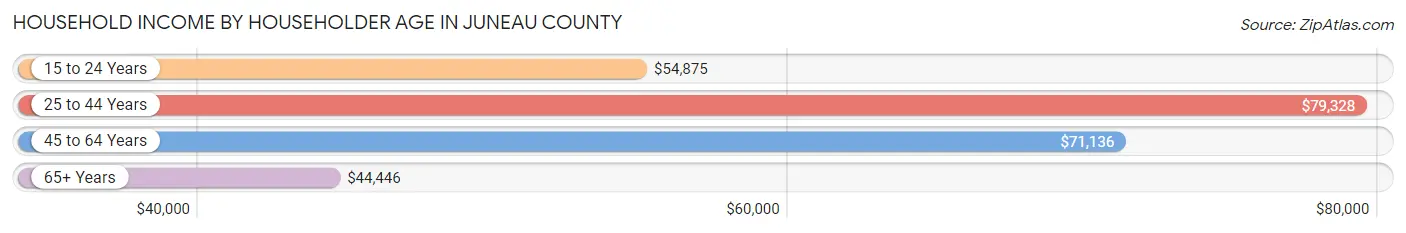
Household Income by Householder Age in Juneau County
The median household income in Juneau County is $63,455, with the highest median household income of $79,328 found in the 25 to 44 years age bracket for the primary householder. A total of 2,663 households (25.1%) fall into this category. Meanwhile, the 65+ years age bracket for the primary householder has the lowest median household income of $44,446, with 3,587 households (33.9%) in this group.
| Income Bracket | # Households | Median Income |
| 15 to 24 Years | 510 (4.8%) | $54,875 |
| 25 to 44 Years | 2,663 (25.1%) | $79,328 |
| 45 to 64 Years | 3,838 (36.2%) | $71,136 |
| 65+ Years | 3,587 (33.9%) | $44,446 |
| Total | 10,598 (100.0%) | $63,455 |
Poverty in Juneau County
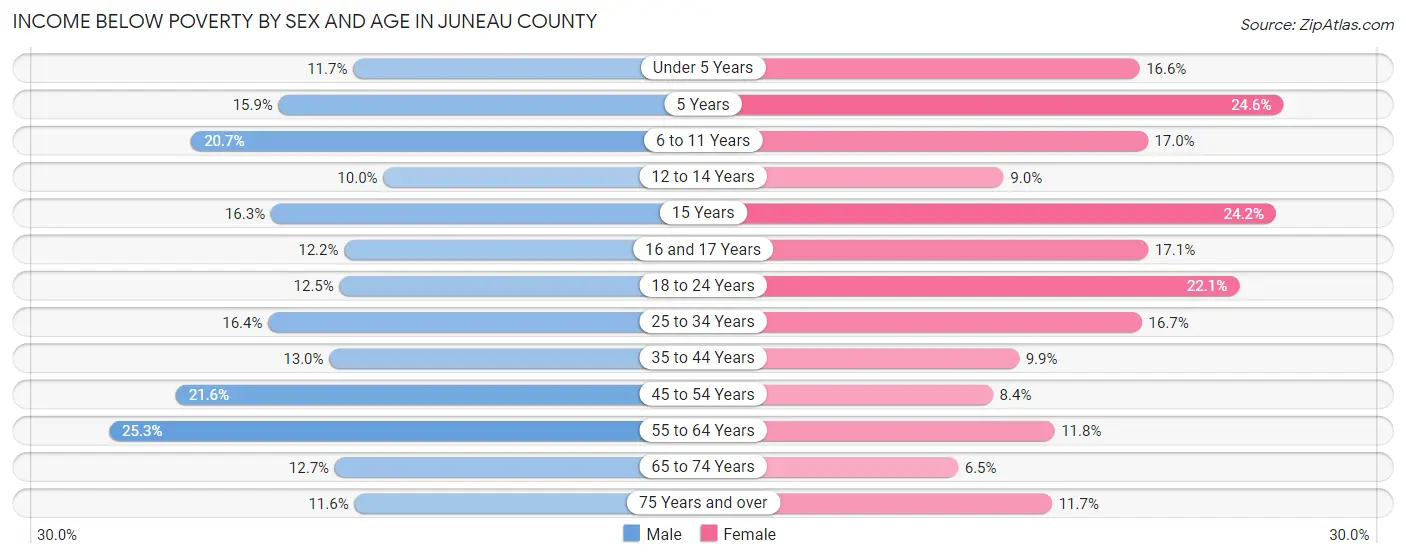
Income Below Poverty by Sex and Age in Juneau County
With 16.7% poverty level for males and 12.5% for females among the residents of Juneau County, 55 to 64 year old males and 5 year old females are the most vulnerable to poverty, with 545 males (25.3%) and 29 females (24.6%) in their respective age groups living below the poverty level.
| Age Bracket | Male | Female |
| Under 5 Years | 73 (11.7%) | 103 (16.6%) |
| 5 Years | 29 (15.9%) | 29 (24.6%) |
| 6 to 11 Years | 167 (20.7%) | 127 (17.0%) |
| 12 to 14 Years | 58 (10.0%) | 45 (9.0%) |
| 15 Years | 21 (16.3%) | 51 (24.2%) |
| 16 and 17 Years | 46 (12.2%) | 44 (17.1%) |
| 18 to 24 Years | 110 (12.5%) | 163 (22.1%) |
| 25 to 34 Years | 243 (16.4%) | 207 (16.7%) |
| 35 to 44 Years | 219 (13.0%) | 128 (9.9%) |
| 45 to 54 Years | 391 (21.6%) | 128 (8.4%) |
| 55 to 64 Years | 545 (25.3%) | 237 (11.8%) |
| 65 to 74 Years | 221 (12.7%) | 104 (6.5%) |
| 75 Years and over | 114 (11.6%) | 134 (11.7%) |
| Total | 2,237 (16.7%) | 1,500 (12.5%) |
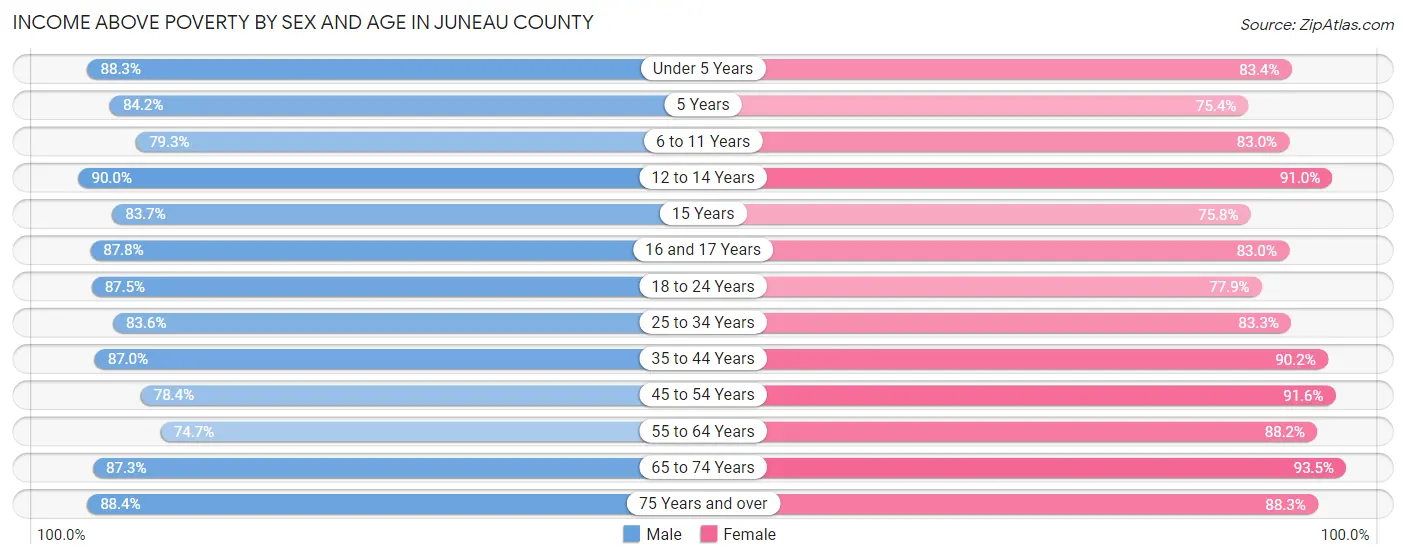
Income Above Poverty by Sex and Age in Juneau County
According to the poverty statistics in Juneau County, males aged 12 to 14 years and females aged 65 to 74 years are the age groups that are most secure financially, with 90.0% of males and 93.5% of females in these age groups living above the poverty line.
| Age Bracket | Male | Female |
| Under 5 Years | 551 (88.3%) | 519 (83.4%) |
| 5 Years | 154 (84.2%) | 89 (75.4%) |
| 6 to 11 Years | 639 (79.3%) | 619 (83.0%) |
| 12 to 14 Years | 521 (90.0%) | 455 (91.0%) |
| 15 Years | 108 (83.7%) | 160 (75.8%) |
| 16 and 17 Years | 331 (87.8%) | 214 (83.0%) |
| 18 to 24 Years | 773 (87.5%) | 574 (77.9%) |
| 25 to 34 Years | 1,236 (83.6%) | 1,033 (83.3%) |
| 35 to 44 Years | 1,462 (87.0%) | 1,172 (90.1%) |
| 45 to 54 Years | 1,421 (78.4%) | 1,395 (91.6%) |
| 55 to 64 Years | 1,609 (74.7%) | 1,767 (88.2%) |
| 65 to 74 Years | 1,516 (87.3%) | 1,505 (93.5%) |
| 75 Years and over | 866 (88.4%) | 1,012 (88.3%) |
| Total | 11,187 (83.3%) | 10,514 (87.5%) |
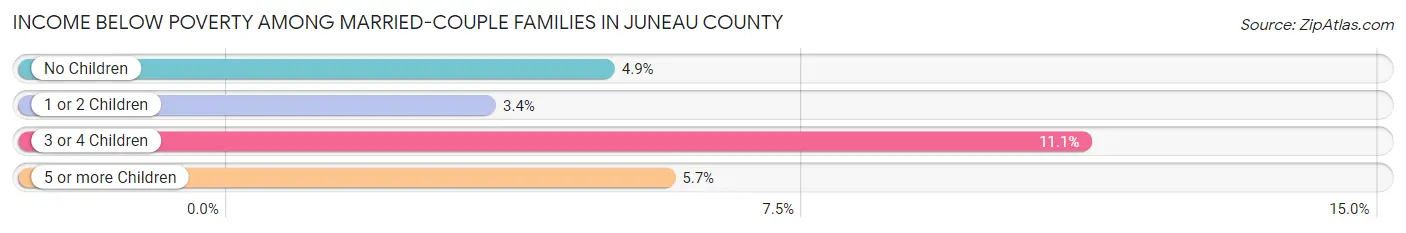
Income Below Poverty Among Married-Couple Families in Juneau County
The poverty statistics for married-couple families in Juneau County show that 5.0% or 266 of the total 5,336 families live below the poverty line. Families with 3 or 4 children have the highest poverty rate of 11.1%, comprising of 43 families. On the other hand, families with 1 or 2 children have the lowest poverty rate of 3.4%, which includes 45 families.
| Children | Above Poverty | Below Poverty |
| No Children | 3,402 (95.1%) | 176 (4.9%) |
| 1 or 2 Children | 1,292 (96.6%) | 45 (3.4%) |
| 3 or 4 Children | 343 (88.9%) | 43 (11.1%) |
| 5 or more Children | 33 (94.3%) | 2 (5.7%) |
| Total | 5,070 (95.0%) | 266 (5.0%) |
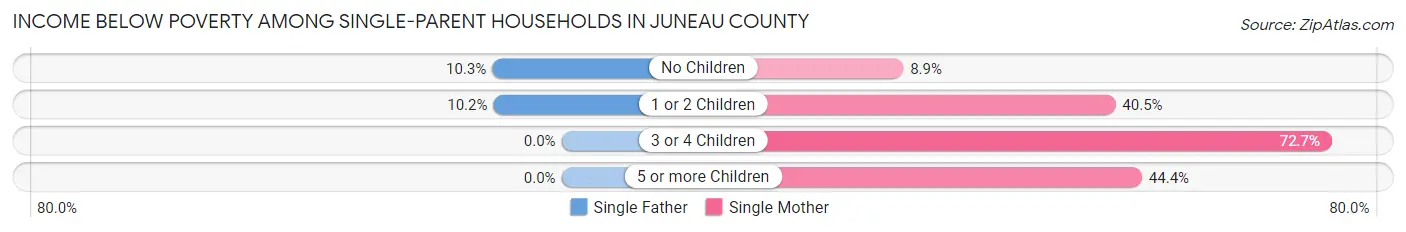
Income Below Poverty Among Single-Parent Households in Juneau County
According to the poverty data in Juneau County, 9.4% or 44 single-father households and 27.9% or 244 single-mother households are living below the poverty line. Among single-father households, those with no children have the highest poverty rate, with 18 households (10.3%) experiencing poverty. Likewise, among single-mother households, those with 3 or 4 children have the highest poverty rate, with 40 households (72.7%) falling below the poverty line.
| Children | Single Father | Single Mother |
| No Children | 18 (10.3%) | 36 (8.9%) |
| 1 or 2 Children | 26 (10.2%) | 164 (40.5%) |
| 3 or 4 Children | 0 (0.0%) | 40 (72.7%) |
| 5 or more Children | 0 (0.0%) | 4 (44.4%) |
| Total | 44 (9.4%) | 244 (27.9%) |
Income Below Poverty Among Married-Couple vs Single-Parent Households in Juneau County
The poverty data for Juneau County shows that 266 of the married-couple family households (5.0%) and 288 of the single-parent households (21.5%) are living below the poverty level. Within the married-couple family households, those with 3 or 4 children have the highest poverty rate, with 43 households (11.1%) falling below the poverty line. Among the single-parent households, those with 5 or more children have the highest poverty rate, with 4 household (44.4%) living below poverty.
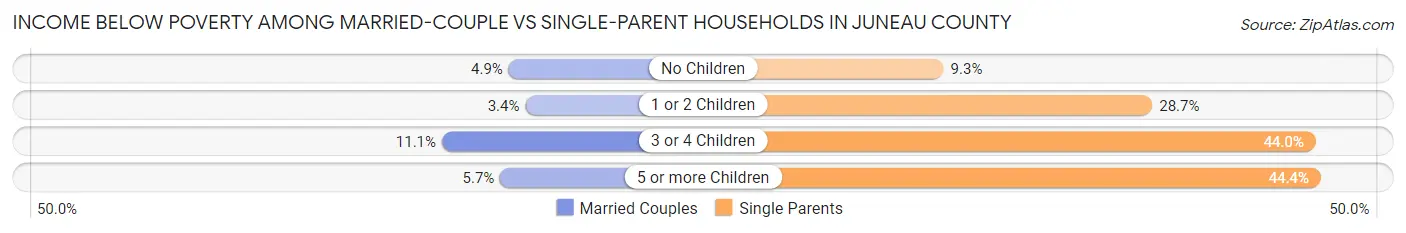
| Children | Married-Couple Families | Single-Parent Households |
| No Children | 176 (4.9%) | 54 (9.3%) |
| 1 or 2 Children | 45 (3.4%) | 190 (28.7%) |
| 3 or 4 Children | 43 (11.1%) | 40 (44.0%) |
| 5 or more Children | 2 (5.7%) | 4 (44.4%) |
| Total | 266 (5.0%) | 288 (21.5%) |
Employment Characteristics in Juneau County
Employment by Class of Employer in Juneau County
Among the 12,034 employed individuals in Juneau County, private company employees (7,374 | 61.3%), local government employees (1,139 | 9.5%), and not-for-profit organizations (915 | 7.6%) make up the most common classes of employment.
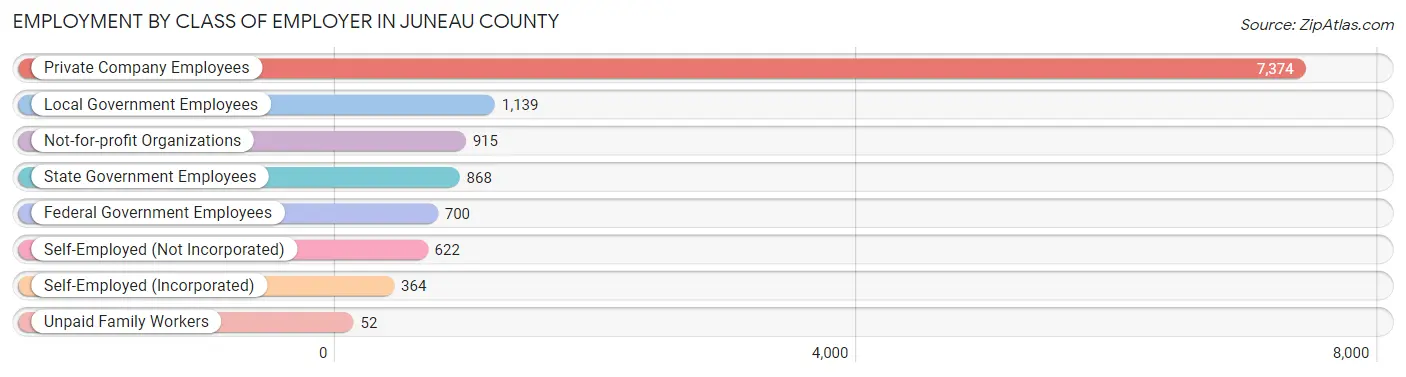
| Employer Class | # Employees | % Employees |
| Private Company Employees | 7,374 | 61.3% |
| Self-Employed (Incorporated) | 364 | 3.0% |
| Self-Employed (Not Incorporated) | 622 | 5.2% |
| Not-for-profit Organizations | 915 | 7.6% |
| Local Government Employees | 1,139 | 9.5% |
| State Government Employees | 868 | 7.2% |
| Federal Government Employees | 700 | 5.8% |
| Unpaid Family Workers | 52 | 0.4% |
| Total | 12,034 | 100.0% |
Employment Status by Age in Juneau County
According to the labor force statistics for Juneau County, out of the total population over 16 years of age (22,049), 58.3% or 12,855 individuals are in the labor force, with 4.2% or 540 of them unemployed. The age group with the highest labor force participation rate is 20 to 24 years, with 89.3% or 1,089 individuals in the labor force. Within the labor force, the 16 to 19 years age range has the highest percentage of unemployed individuals, with 11.9% or 82 of them being unemployed.
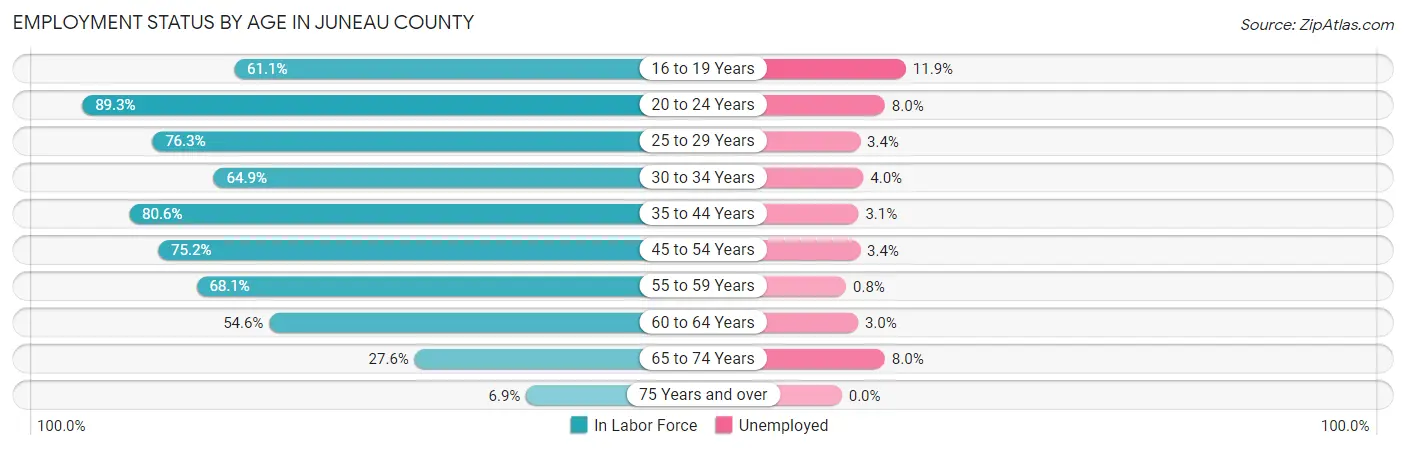
| Age Bracket | In Labor Force | Unemployed |
| 16 to 19 Years | 690 (61.1%) | 82 (11.9%) |
| 20 to 24 Years | 1,089 (89.3%) | 87 (8.0%) |
| 25 to 29 Years | 1,141 (76.3%) | 39 (3.4%) |
| 30 to 34 Years | 996 (64.9%) | 40 (4.0%) |
| 35 to 44 Years | 2,526 (80.6%) | 78 (3.1%) |
| 45 to 54 Years | 2,609 (75.2%) | 89 (3.4%) |
| 55 to 59 Years | 1,448 (68.1%) | 12 (0.8%) |
| 60 to 64 Years | 1,269 (54.6%) | 38 (3.0%) |
| 65 to 74 Years | 925 (27.6%) | 74 (8.0%) |
| 75 Years and over | 156 (6.9%) | 0 (0.0%) |
| Total | 12,855 (58.3%) | 540 (4.2%) |
Employment Status by Educational Attainment in Juneau County
According to labor force statistics for Juneau County, 70.9% of individuals (9,986) out of the total population between 25 and 64 years of age (14,085) are in the labor force, with 3.0% or 300 of them being unemployed. The group with the highest labor force participation rate are those with the educational attainment of bachelor's degree or higher, with 81.8% or 1,892 individuals in the labor force. Within the labor force, individuals with less than high school education have the highest percentage of unemployment, with 5.6% or 35 of them being unemployed.
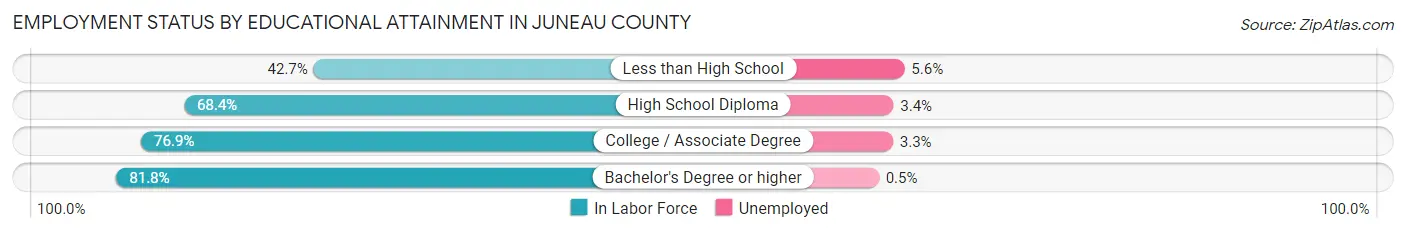
| Educational Attainment | In Labor Force | Unemployed |
| Less than High School | 620 (42.7%) | 81 (5.6%) |
| High School Diploma | 3,678 (68.4%) | 183 (3.4%) |
| College / Associate Degree | 3,800 (76.9%) | 163 (3.3%) |
| Bachelor's Degree or higher | 1,892 (81.8%) | 12 (0.5%) |
| Total | 9,986 (70.9%) | 423 (3.0%) |
Employment Occupations by Sex in Juneau County
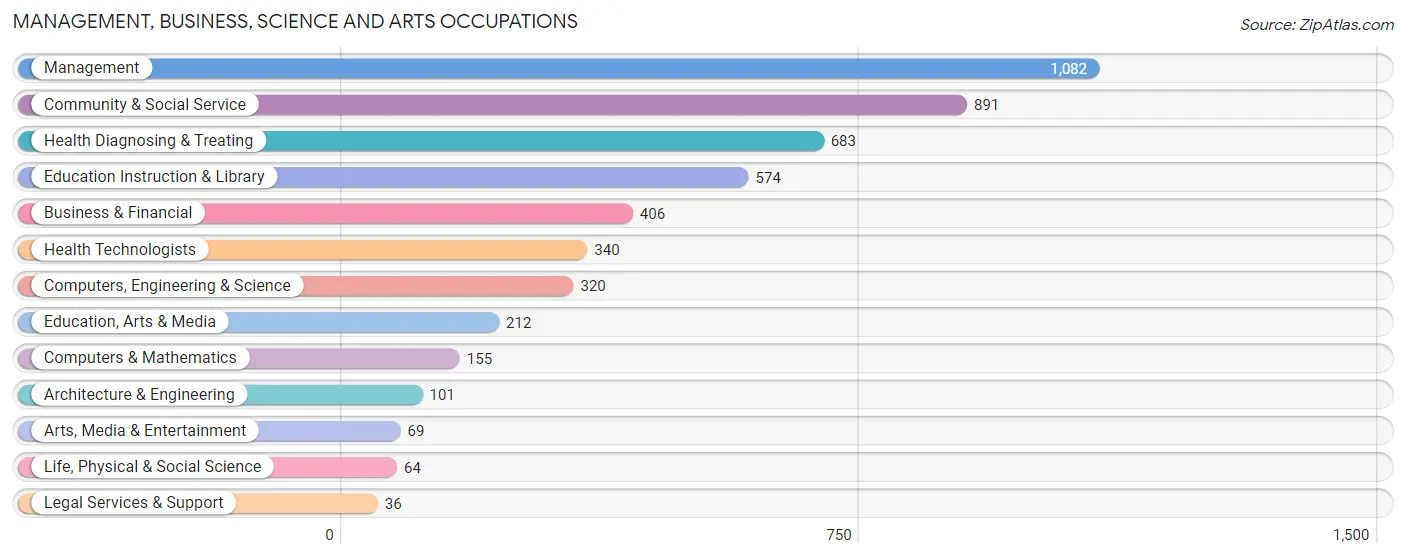
Management, Business, Science and Arts Occupations
The most common Management, Business, Science and Arts occupations in Juneau County are Management (1,082 | 8.9%), Community & Social Service (891 | 7.3%), Health Diagnosing & Treating (683 | 5.6%), Education Instruction & Library (574 | 4.7%), and Business & Financial (406 | 3.3%).
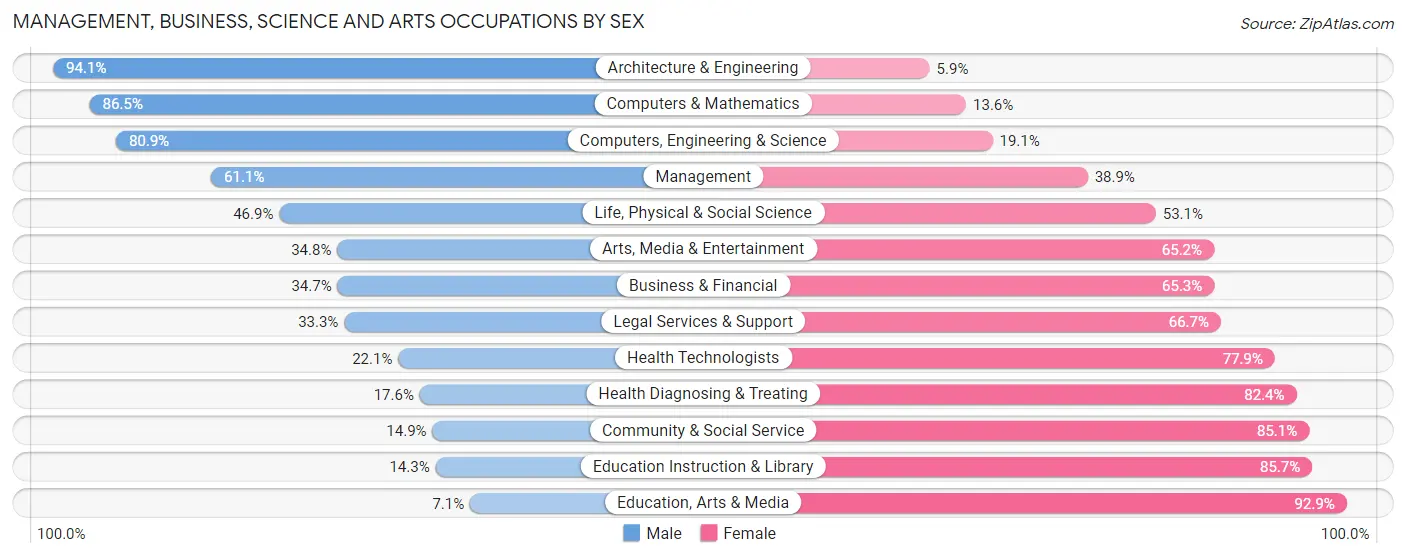
Management, Business, Science and Arts Occupations by Sex
Within the Management, Business, Science and Arts occupations in Juneau County, the most male-oriented occupations are Architecture & Engineering (94.1%), Computers & Mathematics (86.5%), and Computers, Engineering & Science (80.9%), while the most female-oriented occupations are Education, Arts & Media (92.9%), Education Instruction & Library (85.7%), and Community & Social Service (85.1%).
| Occupation | Male | Female |
| Management | 661 (61.1%) | 421 (38.9%) |
| Business & Financial | 141 (34.7%) | 265 (65.3%) |
| Computers, Engineering & Science | 259 (80.9%) | 61 (19.1%) |
| Computers & Mathematics | 134 (86.5%) | 21 (13.6%) |
| Architecture & Engineering | 95 (94.1%) | 6 (5.9%) |
| Life, Physical & Social Science | 30 (46.9%) | 34 (53.1%) |
| Community & Social Service | 133 (14.9%) | 758 (85.1%) |
| Education, Arts & Media | 15 (7.1%) | 197 (92.9%) |
| Legal Services & Support | 12 (33.3%) | 24 (66.7%) |
| Education Instruction & Library | 82 (14.3%) | 492 (85.7%) |
| Arts, Media & Entertainment | 24 (34.8%) | 45 (65.2%) |
| Health Diagnosing & Treating | 120 (17.6%) | 563 (82.4%) |
| Health Technologists | 75 (22.1%) | 265 (77.9%) |
| Total (Category) | 1,314 (38.9%) | 2,068 (61.2%) |
| Total (Overall) | 6,563 (53.9%) | 5,623 (46.1%) |
Services Occupations
The most common Services occupations in Juneau County are Food Preparation & Serving (736 | 6.0%), Cleaning & Maintenance (538 | 4.4%), Healthcare Support (453 | 3.7%), Security & Protection (450 | 3.7%), and Law Enforcement (370 | 3.0%).

Services Occupations by Sex
Within the Services occupations in Juneau County, the most male-oriented occupations are Law Enforcement (81.4%), Security & Protection (80.4%), and Firefighting & Prevention (76.2%), while the most female-oriented occupations are Personal Care & Service (92.3%), Healthcare Support (84.8%), and Food Preparation & Serving (47.7%).

| Occupation | Male | Female |
| Healthcare Support | 69 (15.2%) | 384 (84.8%) |
| Security & Protection | 362 (80.4%) | 88 (19.6%) |
| Firefighting & Prevention | 61 (76.2%) | 19 (23.7%) |
| Law Enforcement | 301 (81.4%) | 69 (18.6%) |
| Food Preparation & Serving | 385 (52.3%) | 351 (47.7%) |
| Cleaning & Maintenance | 393 (73.1%) | 145 (27.0%) |
| Personal Care & Service | 20 (7.7%) | 239 (92.3%) |
| Total (Category) | 1,229 (50.4%) | 1,207 (49.5%) |
| Total (Overall) | 6,563 (53.9%) | 5,623 (46.1%) |
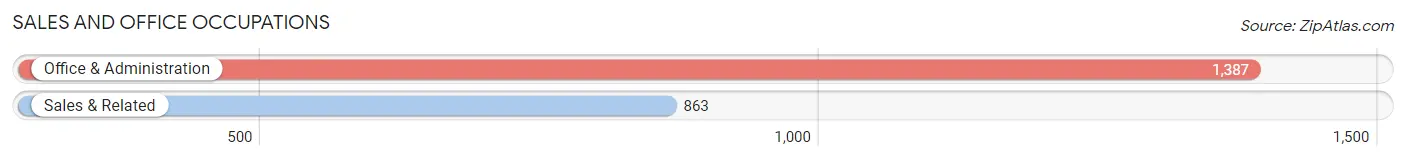
Sales and Office Occupations
The most common Sales and Office occupations in Juneau County are Office & Administration (1,387 | 11.4%), and Sales & Related (863 | 7.1%).
Sales and Office Occupations by Sex

| Occupation | Male | Female |
| Sales & Related | 425 (49.2%) | 438 (50.7%) |
| Office & Administration | 300 (21.6%) | 1,087 (78.4%) |
| Total (Category) | 725 (32.2%) | 1,525 (67.8%) |
| Total (Overall) | 6,563 (53.9%) | 5,623 (46.1%) |
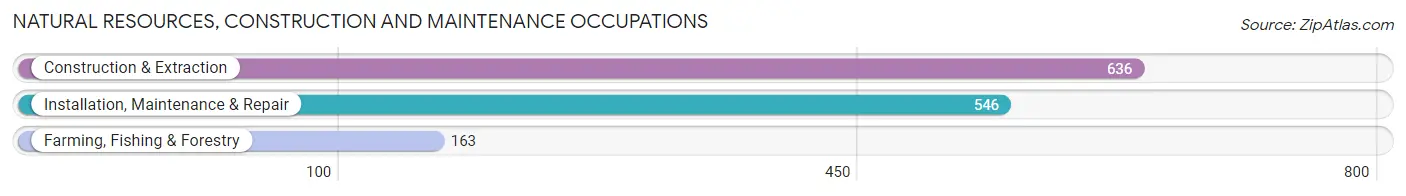
Natural Resources, Construction and Maintenance Occupations
The most common Natural Resources, Construction and Maintenance occupations in Juneau County are Construction & Extraction (636 | 5.2%), Installation, Maintenance & Repair (546 | 4.5%), and Farming, Fishing & Forestry (163 | 1.3%).
Natural Resources, Construction and Maintenance Occupations by Sex

| Occupation | Male | Female |
| Farming, Fishing & Forestry | 139 (85.3%) | 24 (14.7%) |
| Construction & Extraction | 607 (95.4%) | 29 (4.6%) |
| Installation, Maintenance & Repair | 510 (93.4%) | 36 (6.6%) |
| Total (Category) | 1,256 (93.4%) | 89 (6.6%) |
| Total (Overall) | 6,563 (53.9%) | 5,623 (46.1%) |
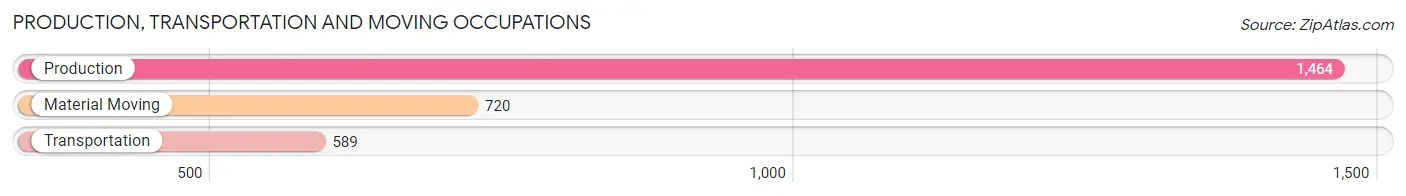
Production, Transportation and Moving Occupations
The most common Production, Transportation and Moving occupations in Juneau County are Production (1,464 | 12.0%), Material Moving (720 | 5.9%), and Transportation (589 | 4.8%).
Production, Transportation and Moving Occupations by Sex

| Occupation | Male | Female |
| Production | 1,045 (71.4%) | 419 (28.6%) |
| Transportation | 527 (89.5%) | 62 (10.5%) |
| Material Moving | 467 (64.9%) | 253 (35.1%) |
| Total (Category) | 2,039 (73.5%) | 734 (26.5%) |
| Total (Overall) | 6,563 (53.9%) | 5,623 (46.1%) |
Employment Industries by Sex in Juneau County
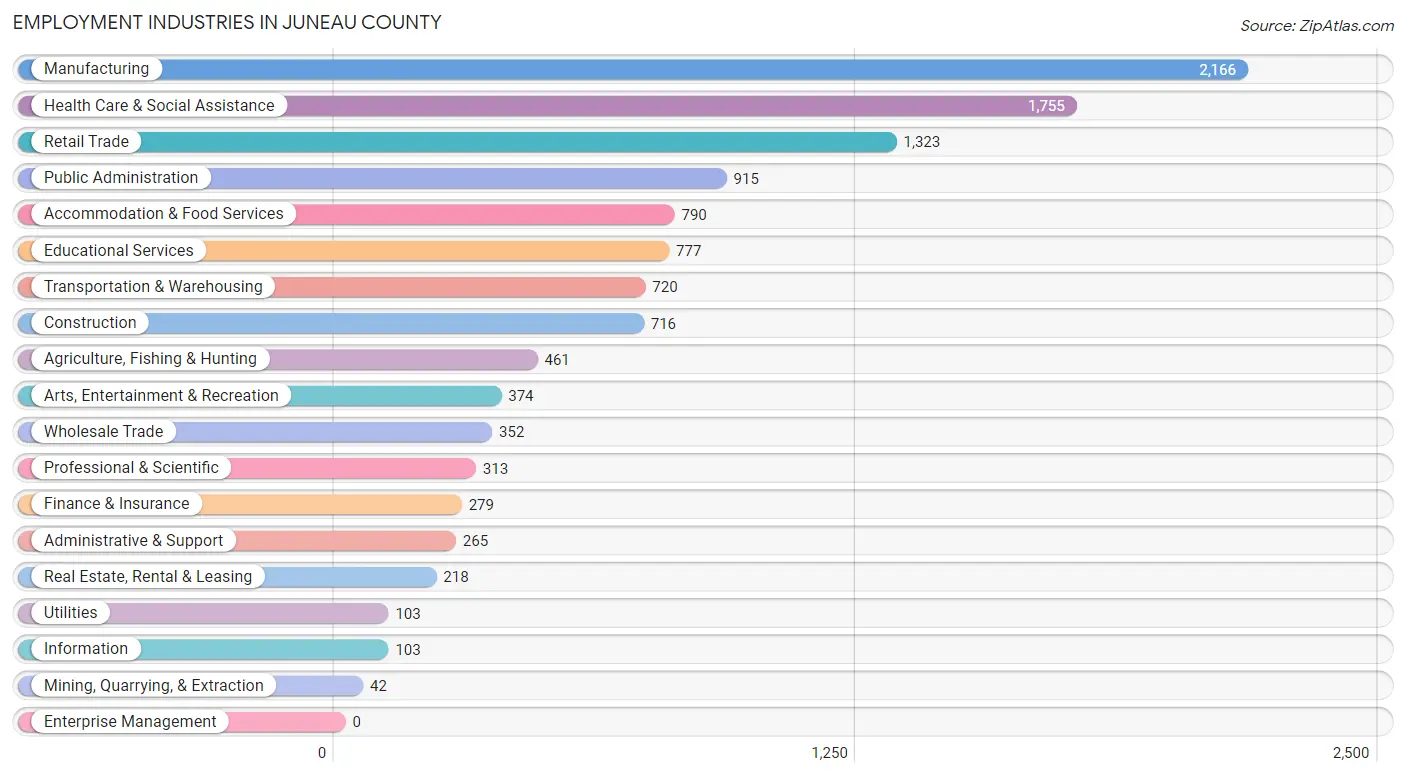
Employment Industries in Juneau County
The major employment industries in Juneau County include Manufacturing (2,166 | 17.8%), Health Care & Social Assistance (1,755 | 14.4%), Retail Trade (1,323 | 10.9%), Public Administration (915 | 7.5%), and Accommodation & Food Services (790 | 6.5%).
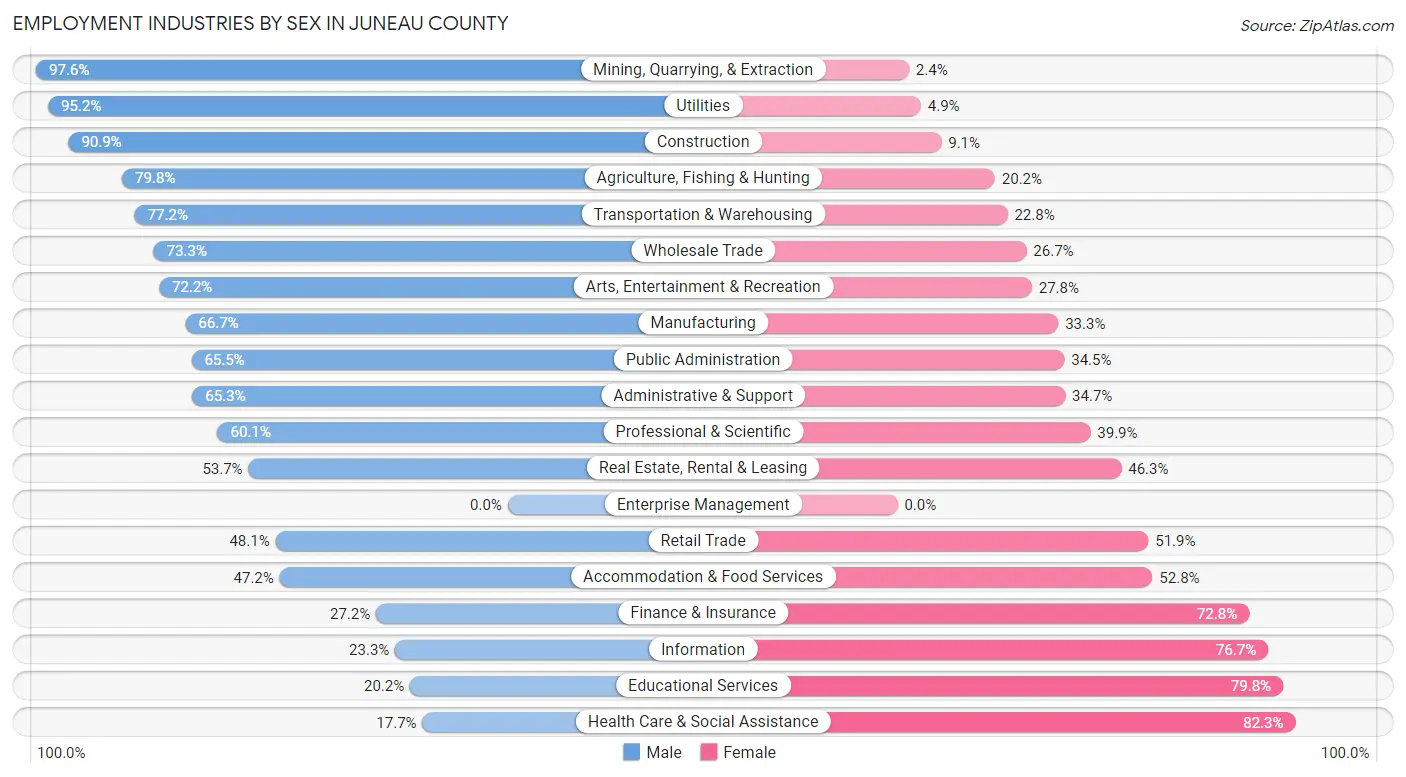
Employment Industries by Sex in Juneau County
The Juneau County industries that see more men than women are Mining, Quarrying, & Extraction (97.6%), Utilities (95.2%), and Construction (90.9%), whereas the industries that tend to have a higher number of women are Health Care & Social Assistance (82.3%), Educational Services (79.8%), and Information (76.7%).
| Industry | Male | Female |
| Agriculture, Fishing & Hunting | 368 (79.8%) | 93 (20.2%) |
| Mining, Quarrying, & Extraction | 41 (97.6%) | 1 (2.4%) |
| Construction | 651 (90.9%) | 65 (9.1%) |
| Manufacturing | 1,445 (66.7%) | 721 (33.3%) |
| Wholesale Trade | 258 (73.3%) | 94 (26.7%) |
| Retail Trade | 636 (48.1%) | 687 (51.9%) |
| Transportation & Warehousing | 556 (77.2%) | 164 (22.8%) |
| Utilities | 98 (95.2%) | 5 (4.9%) |
| Information | 24 (23.3%) | 79 (76.7%) |
| Finance & Insurance | 76 (27.2%) | 203 (72.8%) |
| Real Estate, Rental & Leasing | 117 (53.7%) | 101 (46.3%) |
| Professional & Scientific | 188 (60.1%) | 125 (39.9%) |
| Enterprise Management | 0 (0.0%) | 0 (0.0%) |
| Administrative & Support | 173 (65.3%) | 92 (34.7%) |
| Educational Services | 157 (20.2%) | 620 (79.8%) |
| Health Care & Social Assistance | 310 (17.7%) | 1,445 (82.3%) |
| Arts, Entertainment & Recreation | 270 (72.2%) | 104 (27.8%) |
| Accommodation & Food Services | 373 (47.2%) | 417 (52.8%) |
| Public Administration | 599 (65.5%) | 316 (34.5%) |
| Total | 6,563 (53.9%) | 5,623 (46.1%) |
Education in Juneau County
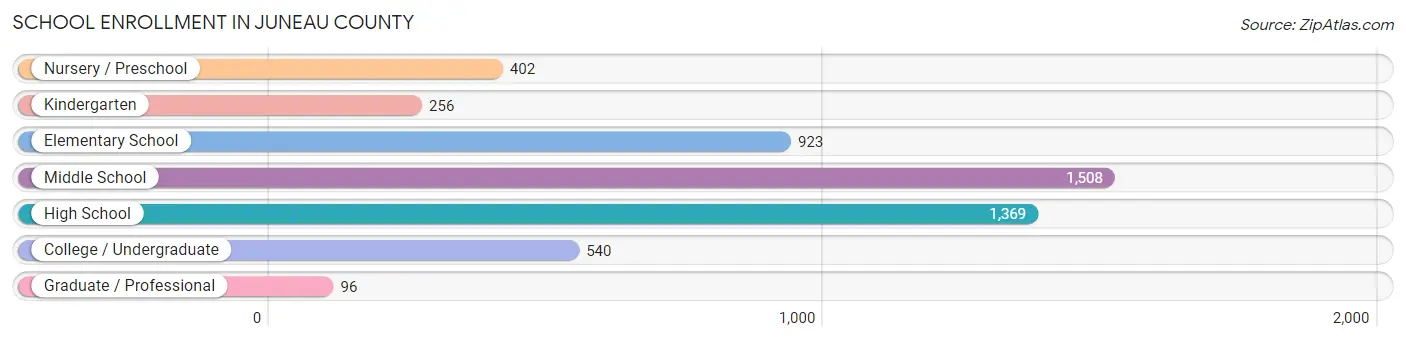
School Enrollment in Juneau County
The most common levels of schooling among the 5,094 students in Juneau County are middle school (1,508 | 29.6%), high school (1,369 | 26.9%), and elementary school (923 | 18.1%).
| School Level | # Students | % Students |
| Nursery / Preschool | 402 | 7.9% |
| Kindergarten | 256 | 5.0% |
| Elementary School | 923 | 18.1% |
| Middle School | 1,508 | 29.6% |
| High School | 1,369 | 26.9% |
| College / Undergraduate | 540 | 10.6% |
| Graduate / Professional | 96 | 1.9% |
| Total | 5,094 | 100.0% |
School Enrollment by Age by Funding Source in Juneau County
Out of a total of 5,094 students who are enrolled in schools in Juneau County, 565 (11.1%) attend a private institution, while the remaining 4,529 (88.9%) are enrolled in public schools. The age group of 3 to 4 year olds has the highest likelihood of being enrolled in private schools, with 67 (27.1% in the age bracket) enrolled. Conversely, the age group of 15 to 17 year olds has the lowest likelihood of being enrolled in a private school, with 918 (97.7% in the age bracket) attending a public institution.
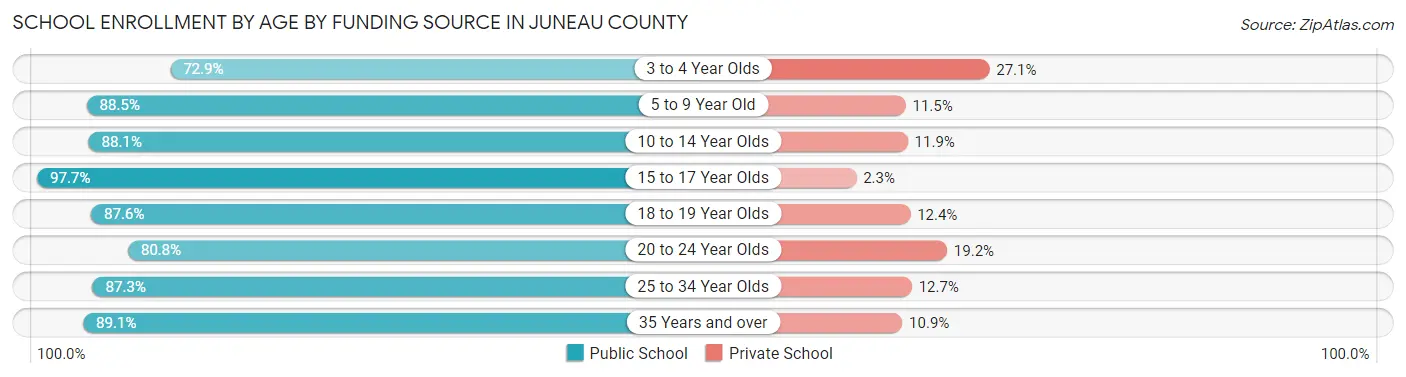
| Age Bracket | Public School | Private School |
| 3 to 4 Year Olds | 180 (72.9%) | 67 (27.1%) |
| 5 to 9 Year Old | 1,082 (88.5%) | 141 (11.5%) |
| 10 to 14 Year Olds | 1,529 (88.1%) | 207 (11.9%) |
| 15 to 17 Year Olds | 918 (97.7%) | 22 (2.3%) |
| 18 to 19 Year Olds | 191 (87.6%) | 27 (12.4%) |
| 20 to 24 Year Olds | 147 (80.8%) | 35 (19.2%) |
| 25 to 34 Year Olds | 262 (87.3%) | 38 (12.7%) |
| 35 Years and over | 221 (89.1%) | 27 (10.9%) |
| Total | 4,529 (88.9%) | 565 (11.1%) |
Educational Attainment by Field of Study in Juneau County
Education (752 | 22.2%), business (582 | 17.2%), science & technology (338 | 10.0%), arts & humanities (299 | 8.8%), and bio, nature & agricultural (291 | 8.6%) are the most common fields of study among 3,385 individuals in Juneau County who have obtained a bachelor's degree or higher.
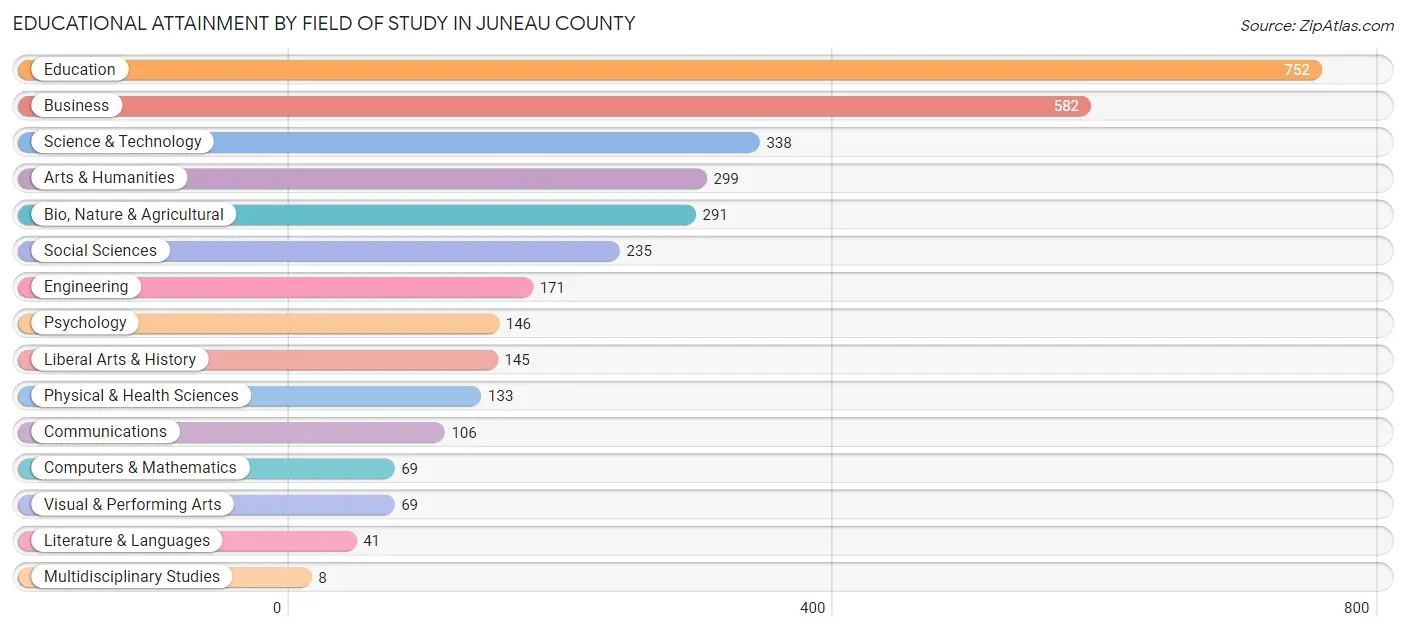
| Field of Study | # Graduates | % Graduates |
| Computers & Mathematics | 69 | 2.0% |
| Bio, Nature & Agricultural | 291 | 8.6% |
| Physical & Health Sciences | 133 | 3.9% |
| Psychology | 146 | 4.3% |
| Social Sciences | 235 | 6.9% |
| Engineering | 171 | 5.1% |
| Multidisciplinary Studies | 8 | 0.2% |
| Science & Technology | 338 | 10.0% |
| Business | 582 | 17.2% |
| Education | 752 | 22.2% |
| Literature & Languages | 41 | 1.2% |
| Liberal Arts & History | 145 | 4.3% |
| Visual & Performing Arts | 69 | 2.0% |
| Communications | 106 | 3.1% |
| Arts & Humanities | 299 | 8.8% |
| Total | 3,385 | 100.0% |
Transportation & Commute in Juneau County
Vehicle Availability by Sex in Juneau County
The most prevalent vehicle ownership categories in Juneau County are males with 2 vehicles (2,821, accounting for 46.4%) and females with 2 vehicles (2,374, making up 51.0%).

| Vehicles Available | Male | Female |
| No Vehicle | 62 (1.0%) | 84 (1.5%) |
| 1 Vehicle | 807 (13.3%) | 878 (15.9%) |
| 2 Vehicles | 2,821 (46.4%) | 2,374 (43.0%) |
| 3 Vehicles | 1,392 (22.9%) | 1,302 (23.6%) |
| 4 Vehicles | 682 (11.2%) | 634 (11.5%) |
| 5 or more Vehicles | 322 (5.3%) | 254 (4.6%) |
| Total | 6,086 (100.0%) | 5,526 (100.0%) |
Commute Time in Juneau County
The most frequently occuring commute durations in Juneau County are 5 to 9 minutes (1,633 commuters, 14.5%), 20 to 24 minutes (1,560 commuters, 13.8%), and 10 to 14 minutes (1,558 commuters, 13.8%).
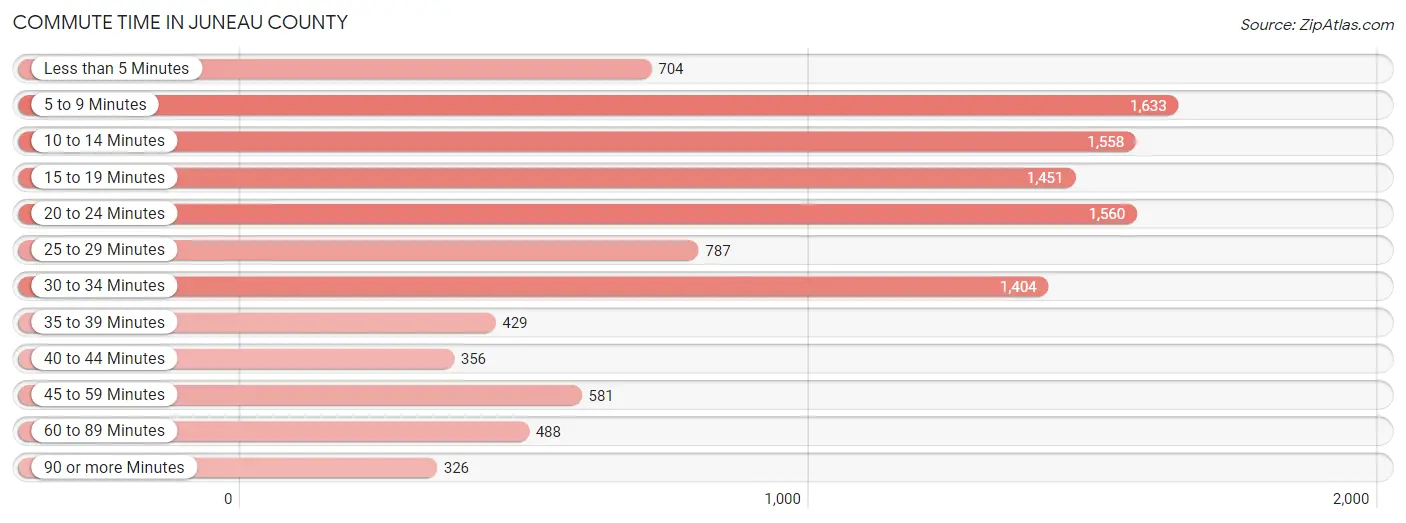
| Commute Time | # Commuters | % Commuters |
| Less than 5 Minutes | 704 | 6.2% |
| 5 to 9 Minutes | 1,633 | 14.5% |
| 10 to 14 Minutes | 1,558 | 13.8% |
| 15 to 19 Minutes | 1,451 | 12.9% |
| 20 to 24 Minutes | 1,560 | 13.8% |
| 25 to 29 Minutes | 787 | 7.0% |
| 30 to 34 Minutes | 1,404 | 12.4% |
| 35 to 39 Minutes | 429 | 3.8% |
| 40 to 44 Minutes | 356 | 3.2% |
| 45 to 59 Minutes | 581 | 5.1% |
| 60 to 89 Minutes | 488 | 4.3% |
| 90 or more Minutes | 326 | 2.9% |
Commute Time by Sex in Juneau County
The most common commute times in Juneau County are 10 to 14 minutes (904 commuters, 14.9%) for males and 5 to 9 minutes (780 commuters, 15.0%) for females.
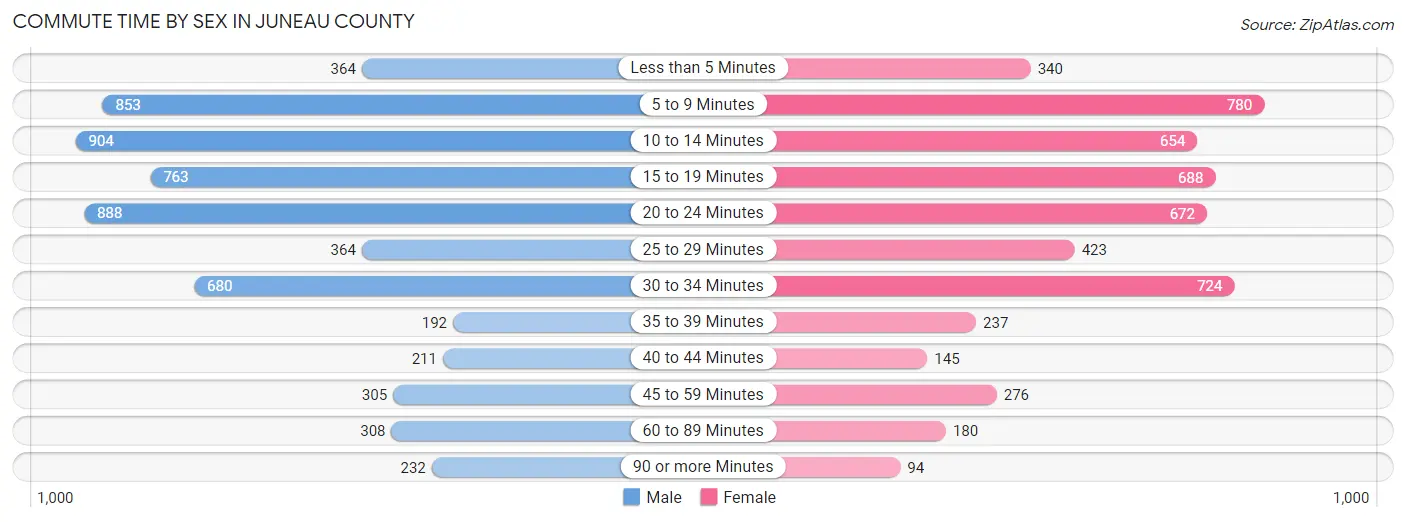
| Commute Time | Male | Female |
| Less than 5 Minutes | 364 (6.0%) | 340 (6.5%) |
| 5 to 9 Minutes | 853 (14.1%) | 780 (15.0%) |
| 10 to 14 Minutes | 904 (14.9%) | 654 (12.6%) |
| 15 to 19 Minutes | 763 (12.6%) | 688 (13.2%) |
| 20 to 24 Minutes | 888 (14.6%) | 672 (12.9%) |
| 25 to 29 Minutes | 364 (6.0%) | 423 (8.1%) |
| 30 to 34 Minutes | 680 (11.2%) | 724 (13.9%) |
| 35 to 39 Minutes | 192 (3.2%) | 237 (4.5%) |
| 40 to 44 Minutes | 211 (3.5%) | 145 (2.8%) |
| 45 to 59 Minutes | 305 (5.0%) | 276 (5.3%) |
| 60 to 89 Minutes | 308 (5.1%) | 180 (3.5%) |
| 90 or more Minutes | 232 (3.8%) | 94 (1.8%) |
Time of Departure to Work by Sex in Juneau County
The most frequent times of departure to work in Juneau County are 7:00 AM to 7:29 AM (837, 13.8%) for males and 7:00 AM to 7:29 AM (977, 18.7%) for females.
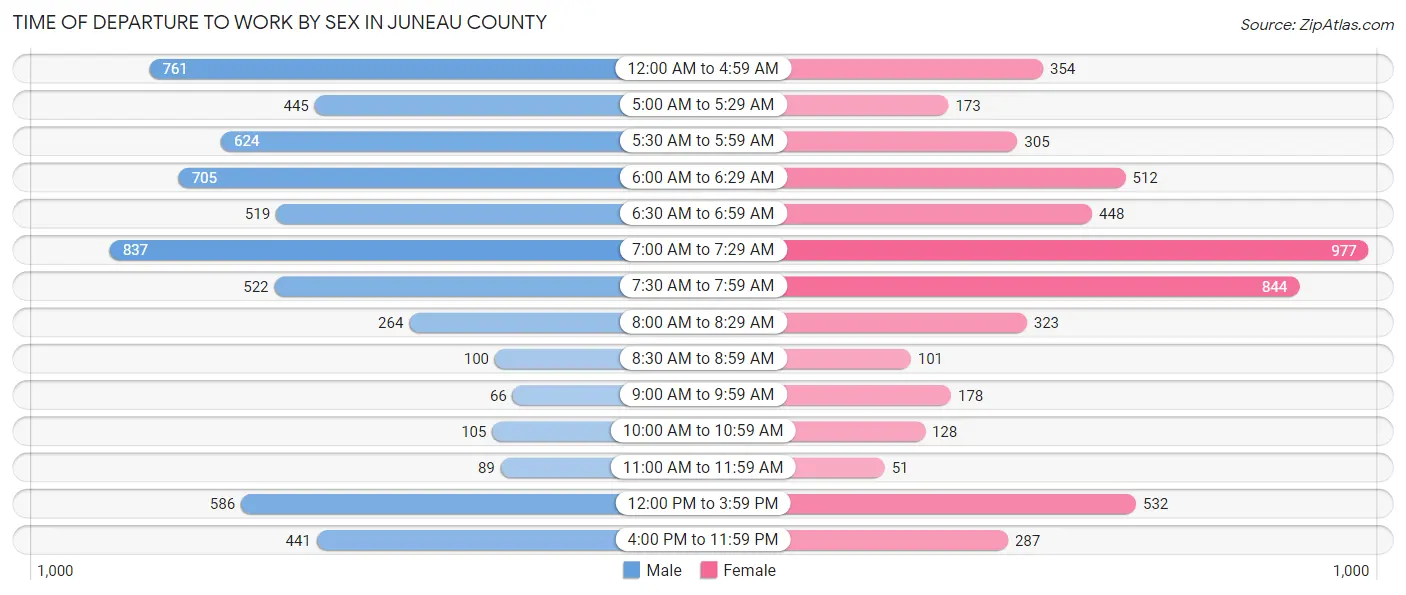
| Time of Departure | Male | Female |
| 12:00 AM to 4:59 AM | 761 (12.6%) | 354 (6.8%) |
| 5:00 AM to 5:29 AM | 445 (7.3%) | 173 (3.3%) |
| 5:30 AM to 5:59 AM | 624 (10.3%) | 305 (5.9%) |
| 6:00 AM to 6:29 AM | 705 (11.6%) | 512 (9.8%) |
| 6:30 AM to 6:59 AM | 519 (8.6%) | 448 (8.6%) |
| 7:00 AM to 7:29 AM | 837 (13.8%) | 977 (18.7%) |
| 7:30 AM to 7:59 AM | 522 (8.6%) | 844 (16.2%) |
| 8:00 AM to 8:29 AM | 264 (4.3%) | 323 (6.2%) |
| 8:30 AM to 8:59 AM | 100 (1.7%) | 101 (1.9%) |
| 9:00 AM to 9:59 AM | 66 (1.1%) | 178 (3.4%) |
| 10:00 AM to 10:59 AM | 105 (1.7%) | 128 (2.5%) |
| 11:00 AM to 11:59 AM | 89 (1.5%) | 51 (1.0%) |
| 12:00 PM to 3:59 PM | 586 (9.7%) | 532 (10.2%) |
| 4:00 PM to 11:59 PM | 441 (7.3%) | 287 (5.5%) |
| Total | 6,064 (100.0%) | 5,213 (100.0%) |
Housing Occupancy in Juneau County
Occupancy by Ownership in Juneau County
Of the total 10,598 dwellings in Juneau County, owner-occupied units account for 8,400 (79.3%), while renter-occupied units make up 2,198 (20.7%).

| Occupancy | # Housing Units | % Housing Units |
| Owner Occupied Housing Units | 8,400 | 79.3% |
| Renter-Occupied Housing Units | 2,198 | 20.7% |
| Total Occupied Housing Units | 10,598 | 100.0% |
Occupancy by Household Size in Juneau County
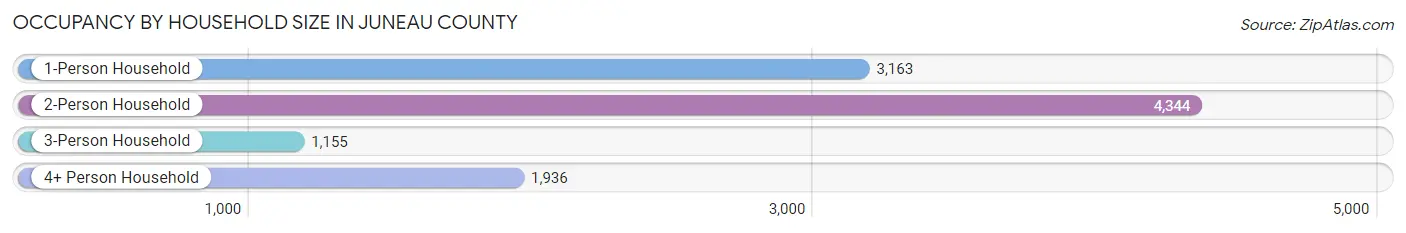
| Household Size | # Housing Units | % Housing Units |
| 1-Person Household | 3,163 | 29.8% |
| 2-Person Household | 4,344 | 41.0% |
| 3-Person Household | 1,155 | 10.9% |
| 4+ Person Household | 1,936 | 18.3% |
| Total Housing Units | 10,598 | 100.0% |
Occupancy by Ownership by Household Size in Juneau County
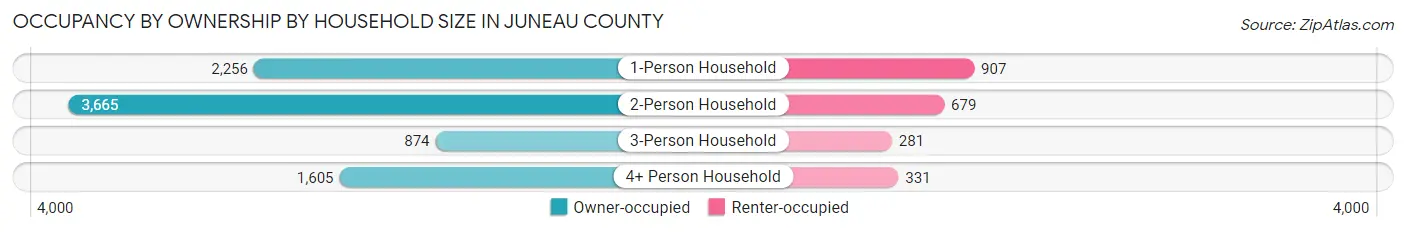
| Household Size | Owner-occupied | Renter-occupied |
| 1-Person Household | 2,256 (71.3%) | 907 (28.7%) |
| 2-Person Household | 3,665 (84.4%) | 679 (15.6%) |
| 3-Person Household | 874 (75.7%) | 281 (24.3%) |
| 4+ Person Household | 1,605 (82.9%) | 331 (17.1%) |
| Total Housing Units | 8,400 (79.3%) | 2,198 (20.7%) |
Occupancy by Educational Attainment in Juneau County
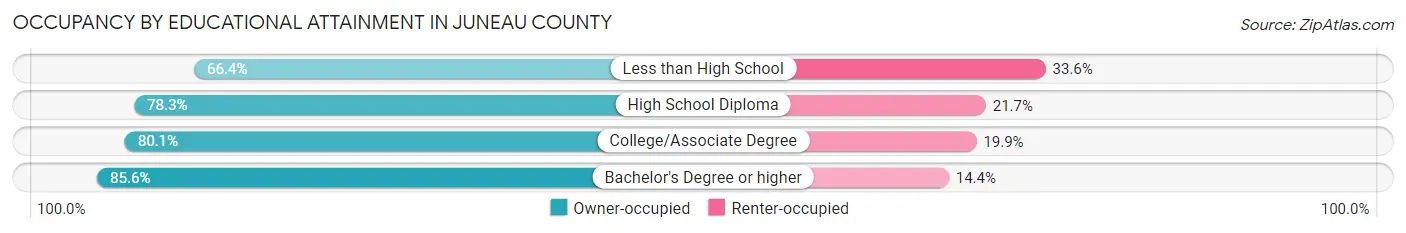
| Household Size | Owner-occupied | Renter-occupied |
| Less than High School | 579 (66.4%) | 293 (33.6%) |
| High School Diploma | 3,191 (78.3%) | 886 (21.7%) |
| College/Associate Degree | 3,006 (80.1%) | 746 (19.9%) |
| Bachelor's Degree or higher | 1,624 (85.6%) | 273 (14.4%) |
Occupancy by Age of Householder in Juneau County
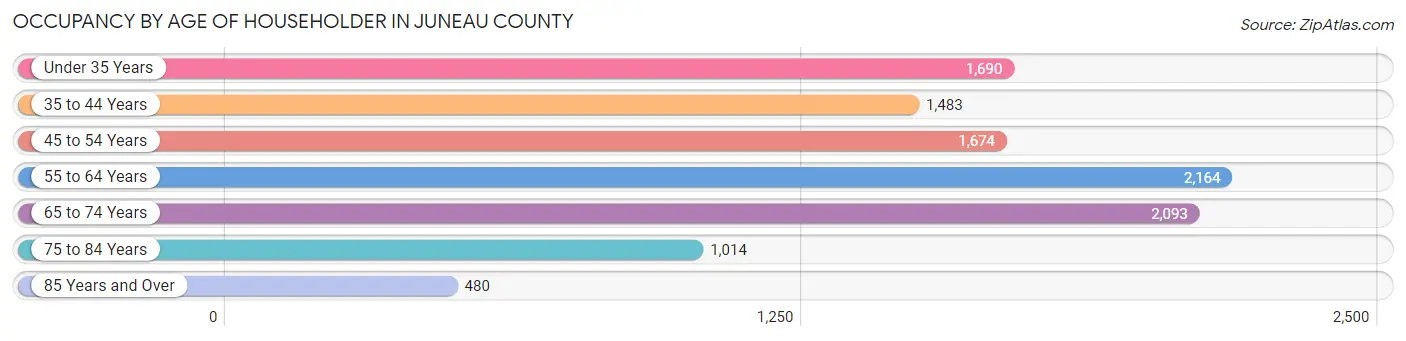
| Age Bracket | # Households | % Households |
| Under 35 Years | 1,690 | 16.0% |
| 35 to 44 Years | 1,483 | 14.0% |
| 45 to 54 Years | 1,674 | 15.8% |
| 55 to 64 Years | 2,164 | 20.4% |
| 65 to 74 Years | 2,093 | 19.8% |
| 75 to 84 Years | 1,014 | 9.6% |
| 85 Years and Over | 480 | 4.5% |
| Total | 10,598 | 100.0% |
Housing Finances in Juneau County
Median Income by Occupancy in Juneau County
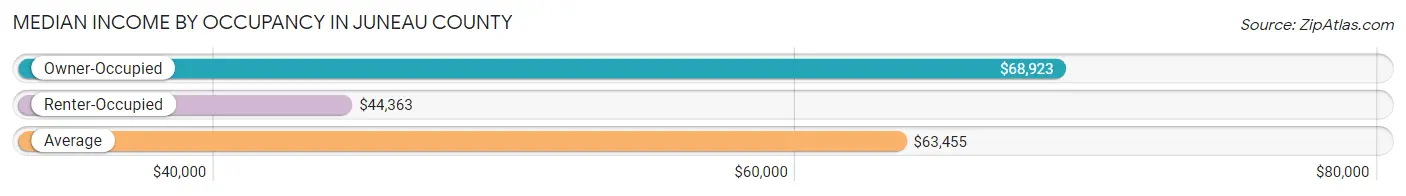
| Occupancy Type | # Households | Median Income |
| Owner-Occupied | 8,400 (79.3%) | $68,923 |
| Renter-Occupied | 2,198 (20.7%) | $44,363 |
| Average | 10,598 (100.0%) | $63,455 |
Occupancy by Householder Income Bracket in Juneau County
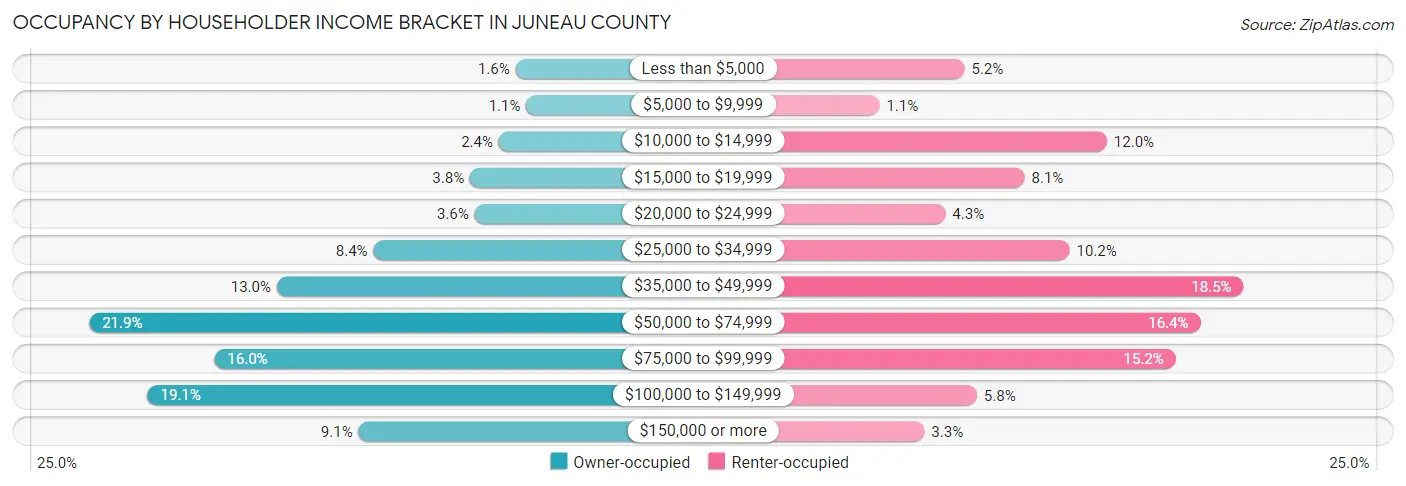
| Income Bracket | Owner-occupied | Renter-occupied |
| Less than $5,000 | 136 (1.6%) | 114 (5.2%) |
| $5,000 to $9,999 | 93 (1.1%) | 25 (1.1%) |
| $10,000 to $14,999 | 203 (2.4%) | 263 (12.0%) |
| $15,000 to $19,999 | 318 (3.8%) | 177 (8.1%) |
| $20,000 to $24,999 | 300 (3.6%) | 94 (4.3%) |
| $25,000 to $34,999 | 705 (8.4%) | 224 (10.2%) |
| $35,000 to $49,999 | 1,091 (13.0%) | 406 (18.5%) |
| $50,000 to $74,999 | 1,841 (21.9%) | 361 (16.4%) |
| $75,000 to $99,999 | 1,341 (16.0%) | 335 (15.2%) |
| $100,000 to $149,999 | 1,608 (19.1%) | 127 (5.8%) |
| $150,000 or more | 764 (9.1%) | 72 (3.3%) |
| Total | 8,400 (100.0%) | 2,198 (100.0%) |
Monthly Housing Cost Tiers in Juneau County
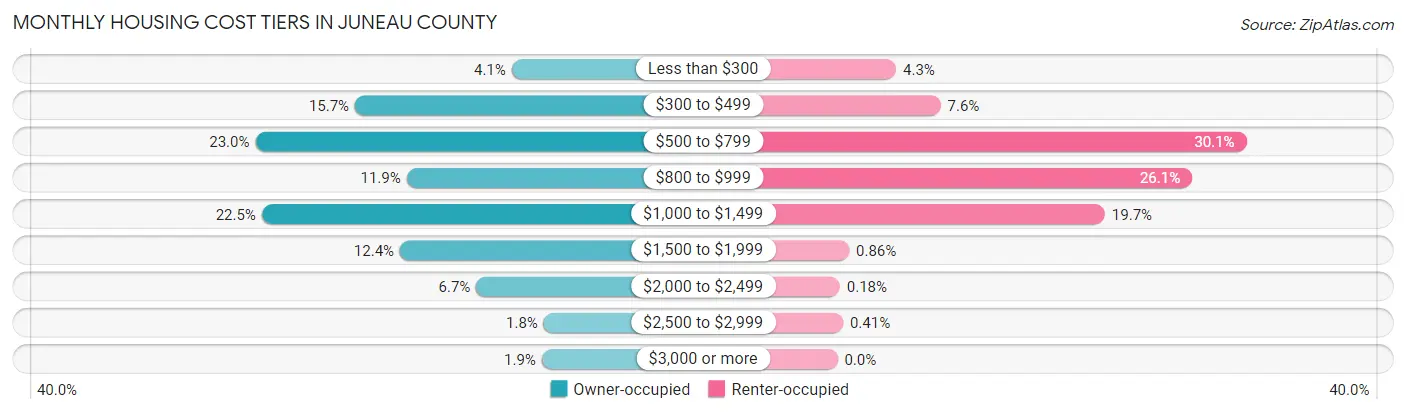
| Monthly Cost | Owner-occupied | Renter-occupied |
| Less than $300 | 347 (4.1%) | 95 (4.3%) |
| $300 to $499 | 1,316 (15.7%) | 167 (7.6%) |
| $500 to $799 | 1,933 (23.0%) | 662 (30.1%) |
| $800 to $999 | 997 (11.9%) | 574 (26.1%) |
| $1,000 to $1,499 | 1,893 (22.5%) | 433 (19.7%) |
| $1,500 to $1,999 | 1,038 (12.4%) | 19 (0.9%) |
| $2,000 to $2,499 | 566 (6.7%) | 4 (0.2%) |
| $2,500 to $2,999 | 149 (1.8%) | 9 (0.4%) |
| $3,000 or more | 161 (1.9%) | 0 (0.0%) |
| Total | 8,400 (100.0%) | 2,198 (100.0%) |
Physical Housing Characteristics in Juneau County
Housing Structures in Juneau County

| Structure Type | # Housing Units | % Housing Units |
| Single Unit, Detached | 7,729 | 72.9% |
| Single Unit, Attached | 90 | 0.9% |
| 2 Unit Apartments | 345 | 3.3% |
| 3 or 4 Unit Apartments | 180 | 1.7% |
| 5 to 9 Unit Apartments | 247 | 2.3% |
| 10 or more Apartments | 493 | 4.6% |
| Mobile Home / Other | 1,514 | 14.3% |
| Total | 10,598 | 100.0% |
Housing Structures by Occupancy in Juneau County
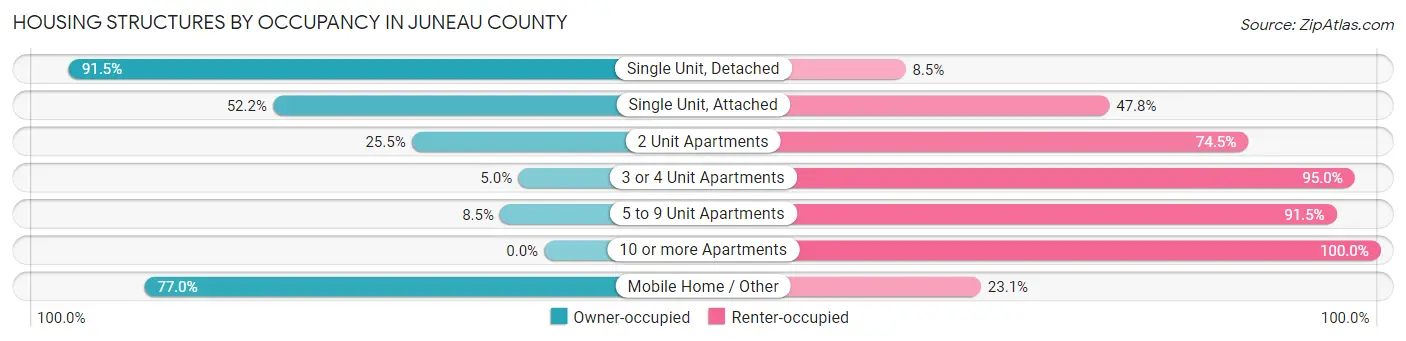
| Structure Type | Owner-occupied | Renter-occupied |
| Single Unit, Detached | 7,070 (91.5%) | 659 (8.5%) |
| Single Unit, Attached | 47 (52.2%) | 43 (47.8%) |
| 2 Unit Apartments | 88 (25.5%) | 257 (74.5%) |
| 3 or 4 Unit Apartments | 9 (5.0%) | 171 (95.0%) |
| 5 to 9 Unit Apartments | 21 (8.5%) | 226 (91.5%) |
| 10 or more Apartments | 0 (0.0%) | 493 (100.0%) |
| Mobile Home / Other | 1,165 (76.9%) | 349 (23.1%) |
| Total | 8,400 (79.3%) | 2,198 (20.7%) |
Housing Structures by Number of Rooms in Juneau County
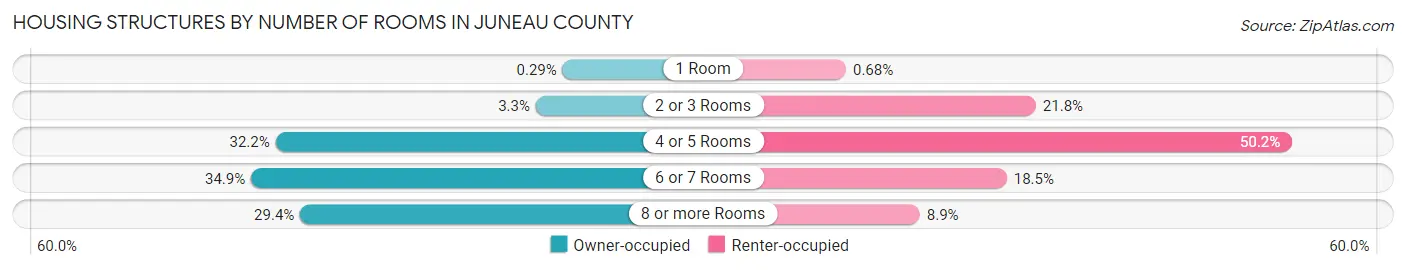
| Number of Rooms | Owner-occupied | Renter-occupied |
| 1 Room | 24 (0.3%) | 15 (0.7%) |
| 2 or 3 Rooms | 275 (3.3%) | 478 (21.7%) |
| 4 or 5 Rooms | 2,701 (32.2%) | 1,103 (50.2%) |
| 6 or 7 Rooms | 2,929 (34.9%) | 407 (18.5%) |
| 8 or more Rooms | 2,471 (29.4%) | 195 (8.9%) |
| Total | 8,400 (100.0%) | 2,198 (100.0%) |
Housing Structure by Heating Type in Juneau County
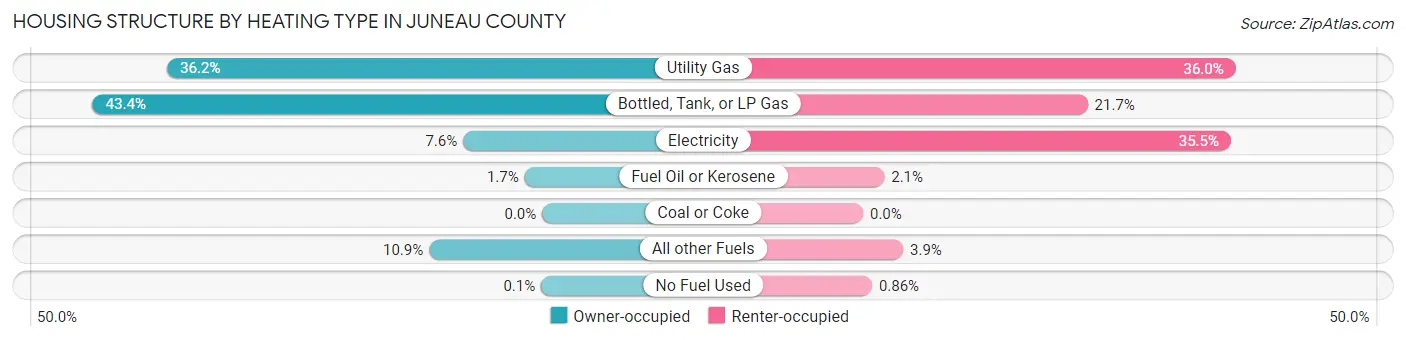
| Heating Type | Owner-occupied | Renter-occupied |
| Utility Gas | 3,043 (36.2%) | 791 (36.0%) |
| Bottled, Tank, or LP Gas | 3,647 (43.4%) | 477 (21.7%) |
| Electricity | 642 (7.6%) | 781 (35.5%) |
| Fuel Oil or Kerosene | 143 (1.7%) | 45 (2.1%) |
| Coal or Coke | 0 (0.0%) | 0 (0.0%) |
| All other Fuels | 917 (10.9%) | 85 (3.9%) |
| No Fuel Used | 8 (0.1%) | 19 (0.9%) |
| Total | 8,400 (100.0%) | 2,198 (100.0%) |
Household Vehicle Usage in Juneau County
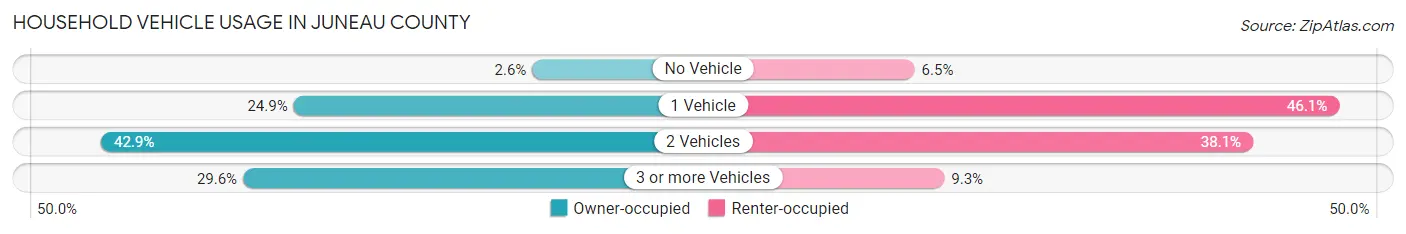
| Vehicles per Household | Owner-occupied | Renter-occupied |
| No Vehicle | 220 (2.6%) | 143 (6.5%) |
| 1 Vehicle | 2,092 (24.9%) | 1,014 (46.1%) |
| 2 Vehicles | 3,600 (42.9%) | 837 (38.1%) |
| 3 or more Vehicles | 2,488 (29.6%) | 204 (9.3%) |
| Total | 8,400 (100.0%) | 2,198 (100.0%) |
Real Estate & Mortgages in Juneau County
Real Estate and Mortgage Overview in Juneau County
| Characteristic | Without Mortgage | With Mortgage |
| Housing Units | 3,768 | 4,632 |
| Median Property Value | $139,500 | $163,400 |
| Median Household Income | $51,050 | $552 |
| Monthly Housing Costs | $542 | $158 |
| Real Estate Taxes | $2,426 | $39 |
Property Value by Mortgage Status in Juneau County
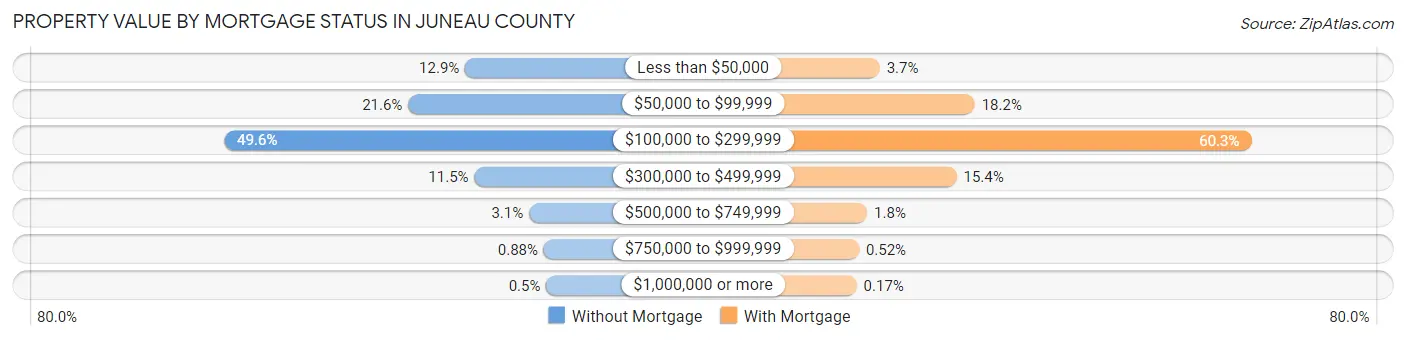
| Property Value | Without Mortgage | With Mortgage |
| Less than $50,000 | 485 (12.9%) | 171 (3.7%) |
| $50,000 to $99,999 | 812 (21.5%) | 841 (18.2%) |
| $100,000 to $299,999 | 1,869 (49.6%) | 2,793 (60.3%) |
| $300,000 to $499,999 | 432 (11.5%) | 713 (15.4%) |
| $500,000 to $749,999 | 118 (3.1%) | 82 (1.8%) |
| $750,000 to $999,999 | 33 (0.9%) | 24 (0.5%) |
| $1,000,000 or more | 19 (0.5%) | 8 (0.2%) |
| Total | 3,768 (100.0%) | 4,632 (100.0%) |
Household Income by Mortgage Status in Juneau County

| Household Income | Without Mortgage | With Mortgage |
| Less than $10,000 | 154 (4.1%) | 100 (2.2%) |
| $10,000 to $24,999 | 555 (14.7%) | 75 (1.6%) |
| $25,000 to $34,999 | 539 (14.3%) | 266 (5.7%) |
| $35,000 to $49,999 | 594 (15.8%) | 166 (3.6%) |
| $50,000 to $74,999 | 808 (21.4%) | 497 (10.7%) |
| $75,000 to $99,999 | 475 (12.6%) | 1,033 (22.3%) |
| $100,000 to $149,999 | 431 (11.4%) | 866 (18.7%) |
| $150,000 or more | 212 (5.6%) | 1,177 (25.4%) |
| Total | 3,768 (100.0%) | 4,632 (100.0%) |
Property Value to Household Income Ratio in Juneau County
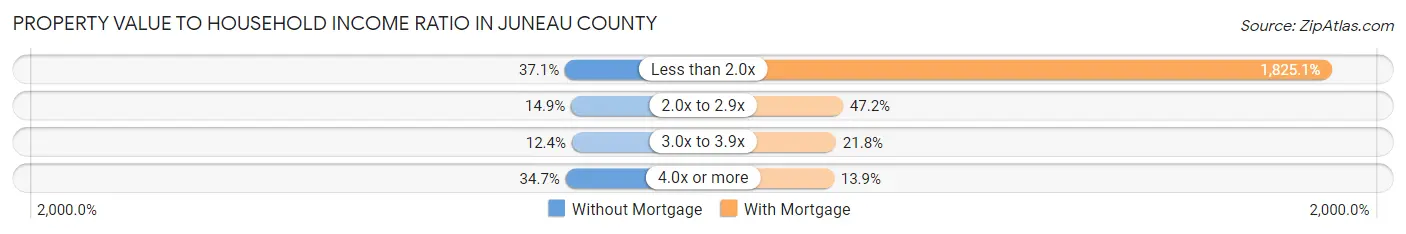
| Value-to-Income Ratio | Without Mortgage | With Mortgage |
| Less than 2.0x | 1,396 (37.0%) | 84,540 (1,825.1%) |
| 2.0x to 2.9x | 561 (14.9%) | 2,186 (47.2%) |
| 3.0x to 3.9x | 468 (12.4%) | 1,009 (21.8%) |
| 4.0x or more | 1,309 (34.7%) | 645 (13.9%) |
| Total | 3,768 (100.0%) | 4,632 (100.0%) |
Real Estate Taxes by Mortgage Status in Juneau County
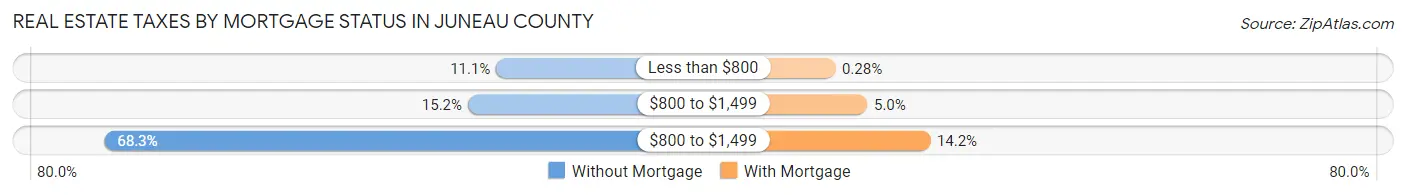
| Property Taxes | Without Mortgage | With Mortgage |
| Less than $800 | 418 (11.1%) | 13 (0.3%) |
| $800 to $1,499 | 574 (15.2%) | 230 (5.0%) |
| $800 to $1,499 | 2,575 (68.3%) | 656 (14.2%) |
| Total | 3,768 (100.0%) | 4,632 (100.0%) |
Health & Disability in Juneau County
Health Insurance Coverage by Age in Juneau County

| Age Bracket | With Coverage | Without Coverage |
| Under 6 Years | 1,572 (98.6%) | 23 (1.4%) |
| 6 to 18 Years | 3,792 (96.9%) | 120 (3.1%) |
| 19 to 25 Years | 1,469 (91.4%) | 138 (8.6%) |
| 26 to 34 Years | 2,222 (88.8%) | 279 (11.2%) |
| 35 to 44 Years | 2,662 (90.7%) | 274 (9.3%) |
| 45 to 54 Years | 3,011 (91.0%) | 296 (8.9%) |
| 55 to 64 Years | 3,632 (87.4%) | 526 (12.7%) |
| 65 to 74 Years | 3,281 (98.1%) | 65 (1.9%) |
| 75 Years and older | 2,126 (100.0%) | 0 (0.0%) |
| Total | 23,767 (93.2%) | 1,721 (6.8%) |
Health Insurance Coverage by Citizenship Status in Juneau County

| Citizenship Status | With Coverage | Without Coverage |
| Native Born | 1,572 (98.6%) | 23 (1.4%) |
| Foreign Born, Citizen | 3,792 (96.9%) | 120 (3.1%) |
| Foreign Born, not a Citizen | 1,469 (91.4%) | 138 (8.6%) |
Health Insurance Coverage by Household Income in Juneau County
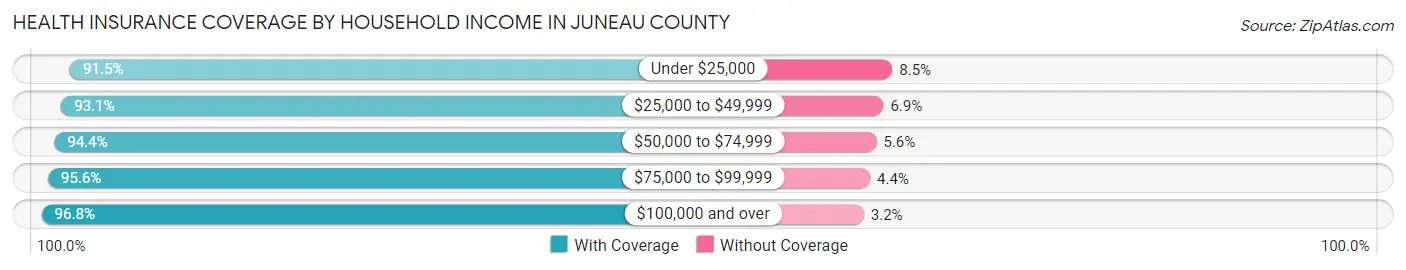
| Household Income | With Coverage | Without Coverage |
| Under $25,000 | 2,474 (91.5%) | 231 (8.5%) |
| $25,000 to $49,999 | 4,228 (93.1%) | 312 (6.9%) |
| $50,000 to $74,999 | 4,797 (94.4%) | 283 (5.6%) |
| $75,000 to $99,999 | 4,095 (95.6%) | 187 (4.4%) |
| $100,000 and over | 7,722 (96.8%) | 255 (3.2%) |
Public vs Private Health Insurance Coverage by Age in Juneau County
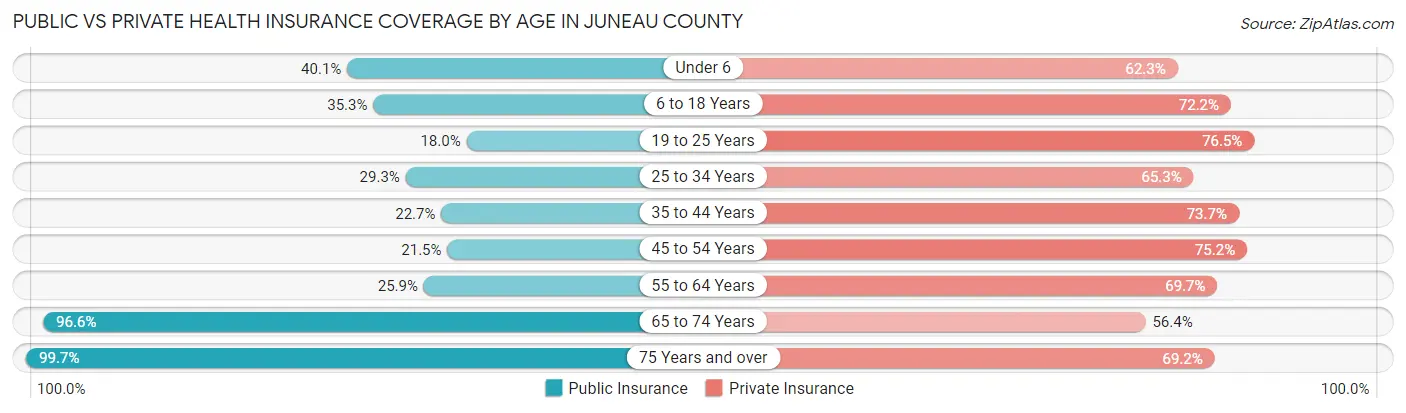
| Age Bracket | Public Insurance | Private Insurance |
| Under 6 | 640 (40.1%) | 994 (62.3%) |
| 6 to 18 Years | 1,380 (35.3%) | 2,825 (72.2%) |
| 19 to 25 Years | 289 (18.0%) | 1,230 (76.5%) |
| 25 to 34 Years | 732 (29.3%) | 1,633 (65.3%) |
| 35 to 44 Years | 665 (22.7%) | 2,163 (73.7%) |
| 45 to 54 Years | 712 (21.5%) | 2,487 (75.2%) |
| 55 to 64 Years | 1,077 (25.9%) | 2,898 (69.7%) |
| 65 to 74 Years | 3,231 (96.6%) | 1,886 (56.4%) |
| 75 Years and over | 2,120 (99.7%) | 1,471 (69.2%) |
| Total | 10,846 (42.5%) | 17,587 (69.0%) |
Disability Status by Sex by Age in Juneau County
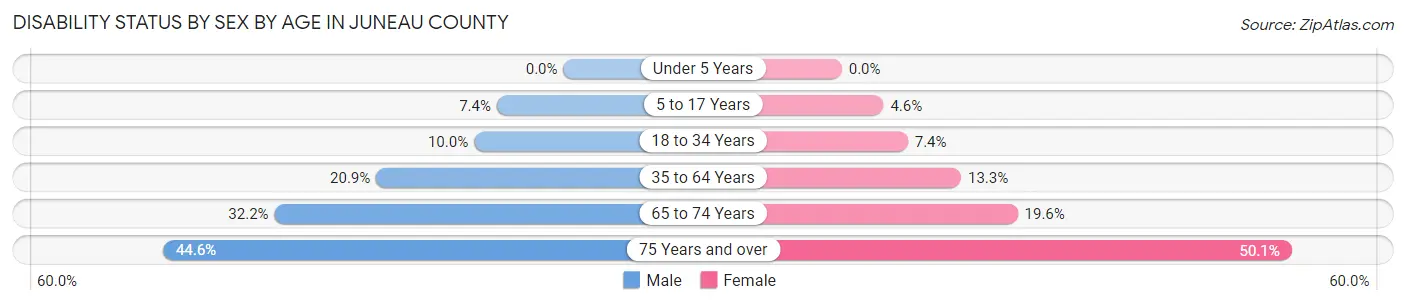
| Age Bracket | Male | Female |
| Under 5 Years | 0 (0.0%) | 0 (0.0%) |
| 5 to 17 Years | 158 (7.4%) | 87 (4.6%) |
| 18 to 34 Years | 235 (10.0%) | 145 (7.3%) |
| 35 to 64 Years | 1,162 (20.8%) | 641 (13.3%) |
| 65 to 74 Years | 559 (32.2%) | 315 (19.6%) |
| 75 Years and over | 437 (44.6%) | 574 (50.1%) |
Disability Class by Sex by Age in Juneau County
Disability Class: Hearing Difficulty
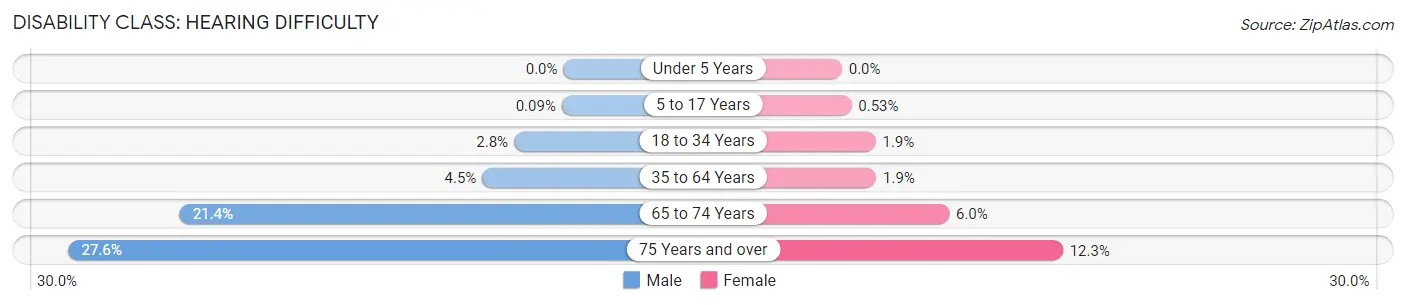
| Age Bracket | Male | Female |
| Under 5 Years | 0 (0.0%) | 0 (0.0%) |
| 5 to 17 Years | 2 (0.1%) | 10 (0.5%) |
| 18 to 34 Years | 65 (2.8%) | 37 (1.9%) |
| 35 to 64 Years | 252 (4.5%) | 92 (1.9%) |
| 65 to 74 Years | 371 (21.4%) | 96 (6.0%) |
| 75 Years and over | 270 (27.6%) | 141 (12.3%) |
Disability Class: Vision Difficulty
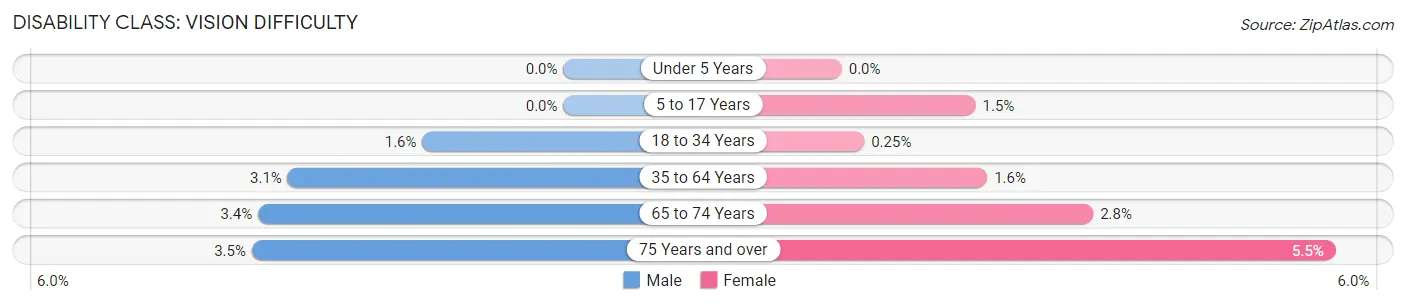
| Age Bracket | Male | Female |
| Under 5 Years | 0 (0.0%) | 0 (0.0%) |
| 5 to 17 Years | 0 (0.0%) | 28 (1.5%) |
| 18 to 34 Years | 37 (1.6%) | 5 (0.3%) |
| 35 to 64 Years | 171 (3.1%) | 78 (1.6%) |
| 65 to 74 Years | 59 (3.4%) | 45 (2.8%) |
| 75 Years and over | 34 (3.5%) | 63 (5.5%) |
Disability Class: Cognitive Difficulty
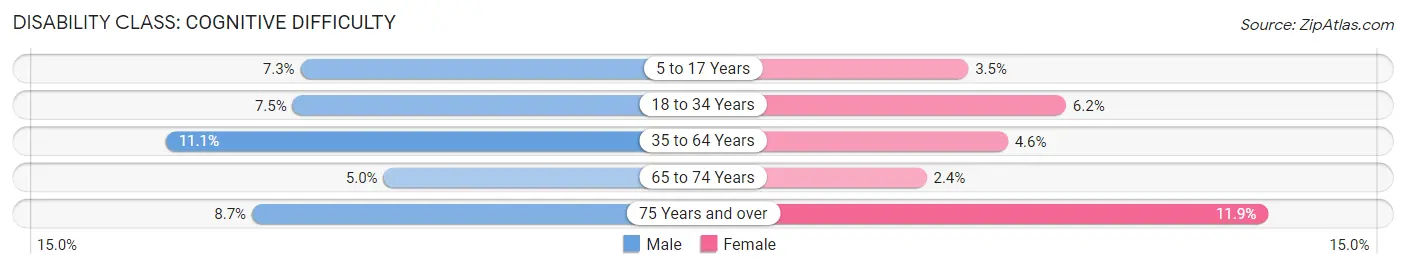
| Age Bracket | Male | Female |
| 5 to 17 Years | 156 (7.3%) | 66 (3.5%) |
| 18 to 34 Years | 178 (7.5%) | 123 (6.2%) |
| 35 to 64 Years | 617 (11.1%) | 223 (4.6%) |
| 65 to 74 Years | 87 (5.0%) | 38 (2.4%) |
| 75 Years and over | 85 (8.7%) | 136 (11.9%) |
Disability Class: Ambulatory Difficulty

| Age Bracket | Male | Female |
| 5 to 17 Years | 6 (0.3%) | 4 (0.2%) |
| 18 to 34 Years | 47 (2.0%) | 46 (2.3%) |
| 35 to 64 Years | 465 (8.3%) | 369 (7.6%) |
| 65 to 74 Years | 210 (12.1%) | 225 (14.0%) |
| 75 Years and over | 209 (21.3%) | 424 (37.0%) |
Disability Class: Self-Care Difficulty
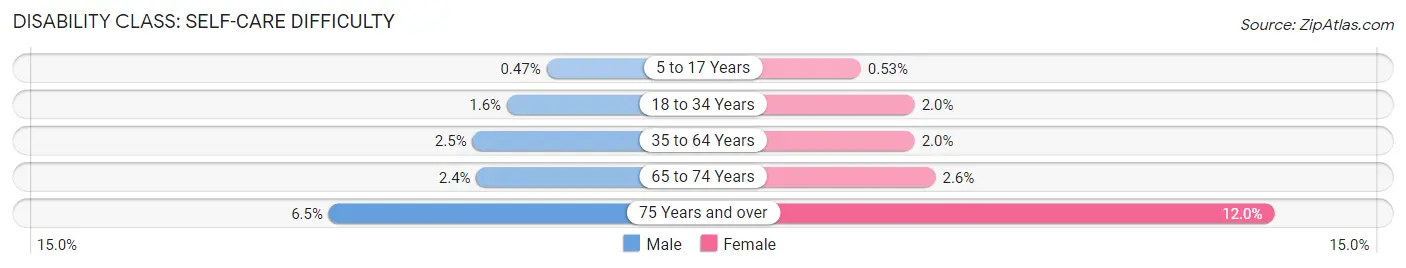
| Age Bracket | Male | Female |
| 5 to 17 Years | 10 (0.5%) | 10 (0.5%) |
| 18 to 34 Years | 37 (1.6%) | 40 (2.0%) |
| 35 to 64 Years | 141 (2.5%) | 98 (2.0%) |
| 65 to 74 Years | 42 (2.4%) | 42 (2.6%) |
| 75 Years and over | 64 (6.5%) | 138 (12.0%) |
Technology Access in Juneau County
Computing Device Access in Juneau County
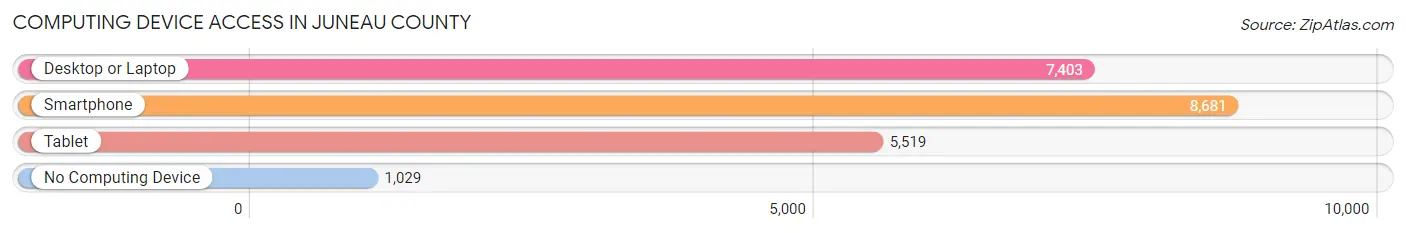
| Device Type | # Households | % Households |
| Desktop or Laptop | 7,403 | 69.9% |
| Smartphone | 8,681 | 81.9% |
| Tablet | 5,519 | 52.1% |
| No Computing Device | 1,029 | 9.7% |
| Total | 10,598 | 100.0% |
Internet Access in Juneau County

| Internet Type | # Households | % Households |
| Dial-Up Internet | 45 | 0.4% |
| Broadband Home | 5,997 | 56.6% |
| Cellular Data Only | 1,581 | 14.9% |
| Satellite Internet | 1,222 | 11.5% |
| No Internet | 1,933 | 18.2% |
| Total | 10,598 | 100.0% |
Juneau County Summary
Juneau County is located in the south-central region of Wisconsin, and is bordered by Adams, Sauk, Monroe, Jackson, Wood, and Adams counties. The county seat is located in Mauston, and the county is named after Solomon Juneau, a French-Canadian fur trader who founded the city of Milwaukee. As of the 2010 census, the population of Juneau County was 26,664.
Geography
Juneau County is located in the south-central region of Wisconsin, and is bordered by Adams, Sauk, Monroe, Jackson, Wood, and Adams counties. The county has a total area of 845 square miles, of which 837 square miles is land and 8 square miles is water. The county is mostly rural, with rolling hills and valleys, and is home to the Baraboo Range, a series of hills and ridges that run through the county. The Baraboo River runs through the county, and is a popular destination for fishing and canoeing.
Economy
Juneau County has a diverse economy, with a mix of agriculture, manufacturing, and tourism. Agriculture is the largest sector of the economy, with dairy farming and beef cattle being the main sources of income. Manufacturing is also a major part of the economy, with companies such as Badger Mining Corporation, Wisconsin Aluminum Foundry, and Wisconsin Plastics producing a variety of products. Tourism is also an important part of the economy, with the county being home to several state parks, including Mirror Lake State Park, Buckhorn State Park, and Necedah National Wildlife Refuge.
Demographics
As of the 2010 census, the population of Juneau County was 26,664. The population is predominantly white (96.3%), with small percentages of African American (1.2%), Native American (0.5%), Asian (0.3%), and other races (1.7%). The median household income is $45,845, and the median age is 43.7 years.
Conclusion
Juneau County is a rural county located in the south-central region of Wisconsin. It is home to a diverse economy, with agriculture, manufacturing, and tourism being the main sources of income. The population is predominantly white, with a median household income of $45,845 and a median age of 43.7 years. Juneau County is a great place to live, work, and play, and is a great place to call home.
Common Questions
What is the Total Population of Juneau County?
Total Population of Juneau County is 26,695.
What is the Total Male Population of Juneau County?
Total Male Population of Juneau County is 14,477.
What is the Total Female Population of Juneau County?
Total Female Population of Juneau County is 12,218.
What is the Ratio of Males per 100 Females in Juneau County?
There are 118.49 Males per 100 Females in Juneau County.
What is the Ratio of Females per 100 Males in Juneau County?
There are 84.40 Females per 100 Males in Juneau County.
What is the Median Population Age in Juneau County?
Median Population Age in Juneau County is 45.7 Years.
What is the Average Family Size in Juneau County
Average Family Size in Juneau County is 2.9 People.
What is the Average Household Size in Juneau County
Average Household Size in Juneau County is 2.3 People.
What is Per Capita Income in Juneau County?
Per Capita income in Juneau County is $31,211.
What is the Median Family Income in Juneau County?
Median Family Income in Juneau County is $76,281.
What is the Median Household income in Juneau County?
Median Household Income in Juneau County is $63,455.
What is Income or Wage Gap in Juneau County?
Income or Wage Gap in Juneau County is 24.3%.
Women in Juneau County earn 75.7 cents for every dollar earned by a man.
What is Family Income Deficit in Juneau County?
Family Income Deficit in Juneau County is $9,840.
Families that are below poverty line in Juneau County earn $9,840 less on average than the poverty threshold level.
What is Inequality or Gini Index in Juneau County?
Inequality or Gini Index in Juneau County is 0.41.
How Large is the Labor Force in Juneau County?
There are 12,855 People in the Labor Forcein in Juneau County.
What is the Percentage of People in the Labor Force in Juneau County?
58.3% of People are in the Labor Force in Juneau County.
What is the Unemployment Rate in Juneau County?
Unemployment Rate in Juneau County is 4.2%.