Jackson County, WI
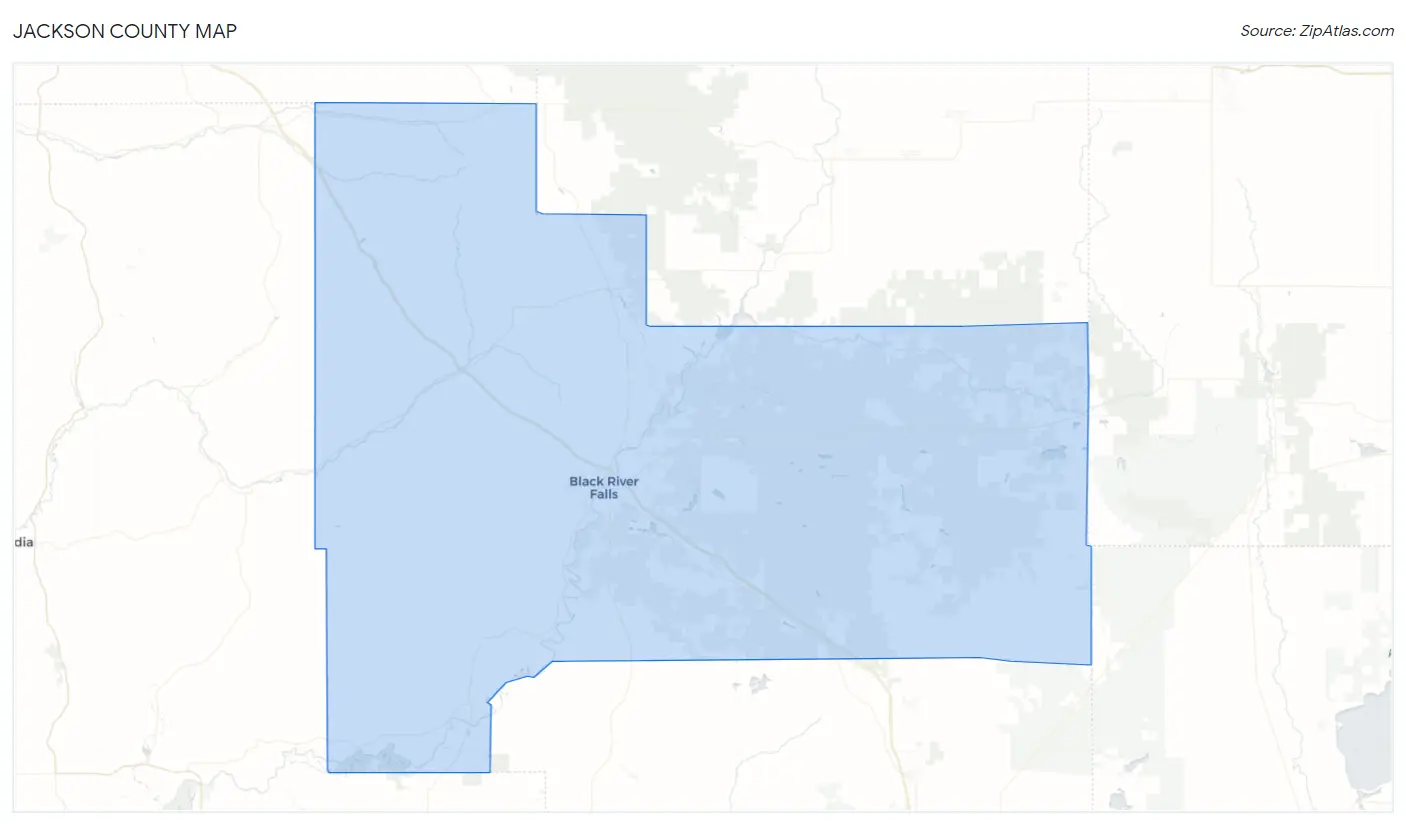
Jackson County Map
Jackson County Overview
20,958
TOTAL POPULATION
11,303
MALE POPULATION
9,655
FEMALE POPULATION
117.07
MALES / 100 FEMALES
85.42
FEMALES / 100 MALES
42.2
MEDIAN AGE
3.1
AVG FAMILY SIZE
2.5
AVG HOUSEHOLD SIZE
$32,659
PER CAPITA INCOME
$80,986
AVG FAMILY INCOME
$64,630
AVG HOUSEHOLD INCOME
22.3%
WAGE / INCOME GAP [ % ]
77.7¢/ $1
WAGE / INCOME GAP [ $ ]
$10,303
FAMILY INCOME DEFICIT
0.45
INEQUALITY / GINI INDEX
9,864
LABOR FORCE [ PEOPLE ]
58.1%
PERCENT IN LABOR FORCE
5.5%
UNEMPLOYMENT RATE
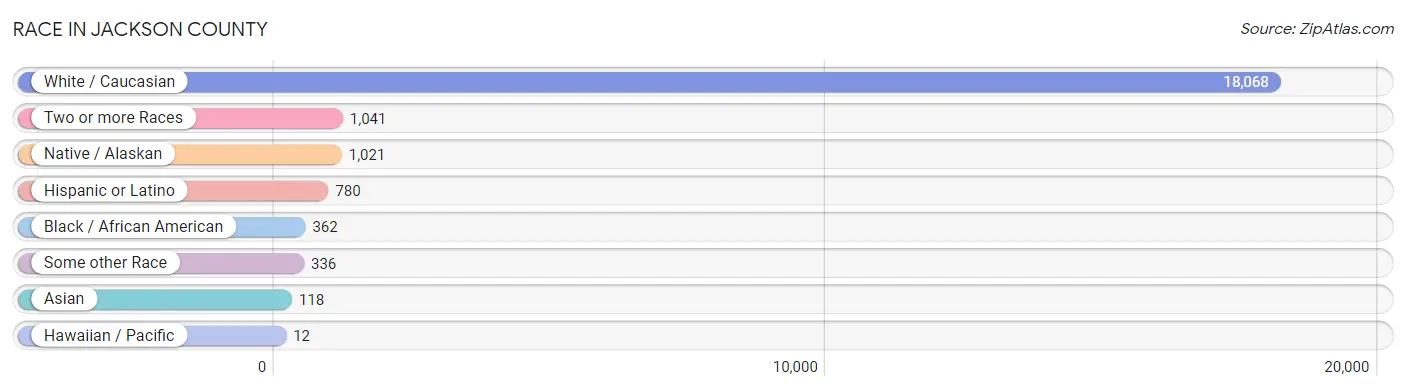
Race in Jackson County
The most populous races in Jackson County are White / Caucasian (18,068 | 86.2%), Two or more Races (1,041 | 5.0%), and Native / Alaskan (1,021 | 4.9%).
| Race | # Population | % Population |
| Asian | 118 | 0.6% |
| Black / African American | 362 | 1.7% |
| Hawaiian / Pacific | 12 | 0.1% |
| Hispanic or Latino | 780 | 3.7% |
| Native / Alaskan | 1,021 | 4.9% |
| White / Caucasian | 18,068 | 86.2% |
| Two or more Races | 1,041 | 5.0% |
| Some other Race | 336 | 1.6% |
| Total | 20,958 | 100.0% |
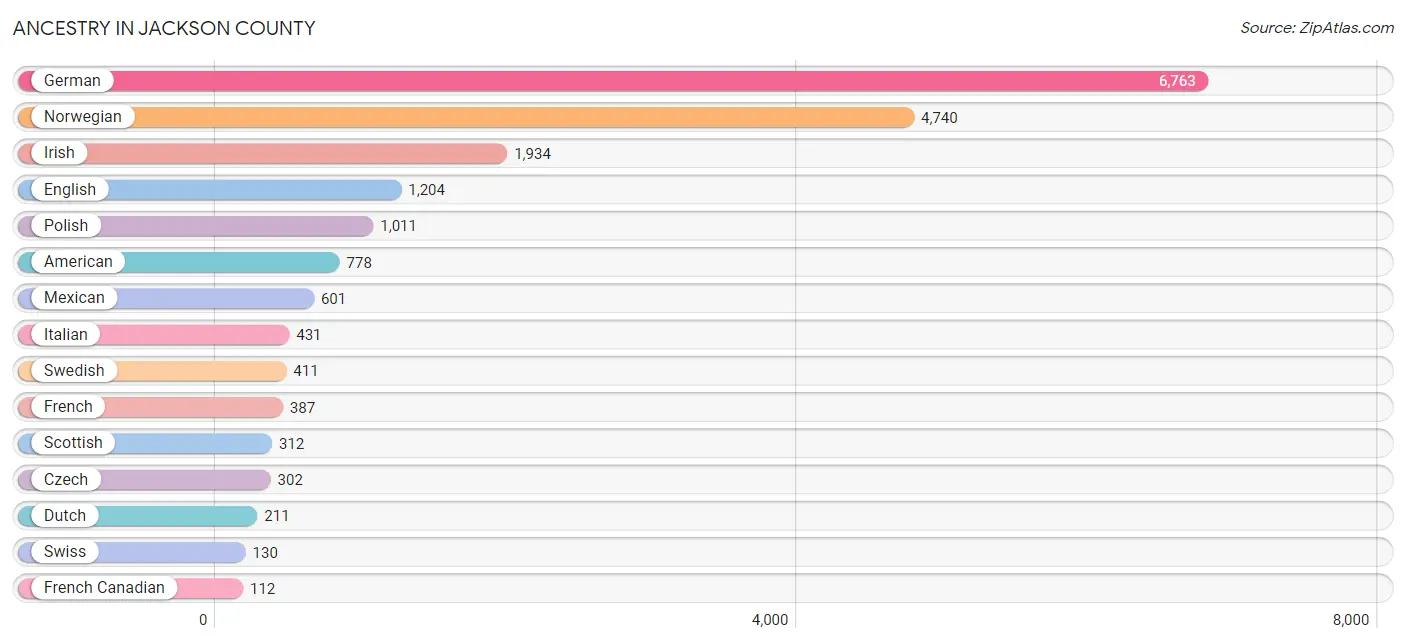
Ancestry in Jackson County
The most populous ancestries reported in Jackson County are German (6,763 | 32.3%), Norwegian (4,740 | 22.6%), Irish (1,934 | 9.2%), English (1,204 | 5.7%), and Polish (1,011 | 4.8%), together accounting for 74.7% of all Jackson County residents.
| Ancestry | # Population | % Population |
| African | 84 | 0.4% |
| Alaska Native | 10 | 0.1% |
| American | 778 | 3.7% |
| Apache | 9 | 0.0% |
| Arab | 3 | 0.0% |
| Austrian | 59 | 0.3% |
| Bangladeshi | 33 | 0.2% |
| Belgian | 35 | 0.2% |
| Bhutanese | 12 | 0.1% |
| Blackfeet | 4 | 0.0% |
| British | 48 | 0.2% |
| Burmese | 38 | 0.2% |
| Cajun | 1 | 0.0% |
| Canadian | 4 | 0.0% |
| Celtic | 2 | 0.0% |
| Central American | 9 | 0.0% |
| Cherokee | 47 | 0.2% |
| Cheyenne | 23 | 0.1% |
| Chippewa | 34 | 0.2% |
| Colombian | 15 | 0.1% |
| Comanche | 14 | 0.1% |
| Croatian | 11 | 0.1% |
| Cuban | 14 | 0.1% |
| Czech | 302 | 1.4% |
| Czechoslovakian | 13 | 0.1% |
| Danish | 80 | 0.4% |
| Dominican | 9 | 0.0% |
| Dutch | 211 | 1.0% |
| Eastern European | 11 | 0.1% |
| English | 1,204 | 5.7% |
| Estonian | 1 | 0.0% |
| European | 104 | 0.5% |
| Finnish | 56 | 0.3% |
| French | 387 | 1.8% |
| French American Indian | 11 | 0.1% |
| French Canadian | 112 | 0.5% |
| German | 6,763 | 32.3% |
| German Russian | 2 | 0.0% |
| Greek | 34 | 0.2% |
| Guatemalan | 1 | 0.0% |
| Honduran | 5 | 0.0% |
| Hungarian | 17 | 0.1% |
| Indian (Asian) | 9 | 0.0% |
| Irish | 1,934 | 9.2% |
| Iroquois | 38 | 0.2% |
| Italian | 431 | 2.1% |
| Japanese | 5 | 0.0% |
| Korean | 29 | 0.1% |
| Latvian | 9 | 0.0% |
| Lebanese | 3 | 0.0% |
| Lithuanian | 17 | 0.1% |
| Lumbee | 1 | 0.0% |
| Luxembourger | 6 | 0.0% |
| Menominee | 21 | 0.1% |
| Mexican | 601 | 2.9% |
| Mexican American Indian | 1 | 0.0% |
| Native Hawaiian | 4 | 0.0% |
| Navajo | 2 | 0.0% |
| Nigerian | 15 | 0.1% |
| Northern European | 7 | 0.0% |
| Norwegian | 4,740 | 22.6% |
| Pakistani | 9 | 0.0% |
| Pennsylvania German | 54 | 0.3% |
| Peruvian | 5 | 0.0% |
| Polish | 1,011 | 4.8% |
| Portuguese | 1 | 0.0% |
| Potawatomi | 9 | 0.0% |
| Puerto Rican | 43 | 0.2% |
| Puget Sound Salish | 5 | 0.0% |
| Romanian | 7 | 0.0% |
| Russian | 96 | 0.5% |
| Salvadoran | 3 | 0.0% |
| Samoan | 4 | 0.0% |
| Scandinavian | 56 | 0.3% |
| Scotch-Irish | 87 | 0.4% |
| Scottish | 312 | 1.5% |
| Serbian | 17 | 0.1% |
| Sioux | 21 | 0.1% |
| Slovak | 10 | 0.1% |
| Slovene | 4 | 0.0% |
| South American | 20 | 0.1% |
| Spaniard | 15 | 0.1% |
| Spanish | 12 | 0.1% |
| Subsaharan African | 99 | 0.5% |
| Swedish | 411 | 2.0% |
| Swiss | 130 | 0.6% |
| Thai | 28 | 0.1% |
| Trinidadian and Tobagonian | 6 | 0.0% |
| Ukrainian | 11 | 0.1% |
| Welsh | 61 | 0.3% | View All 90 Rows |
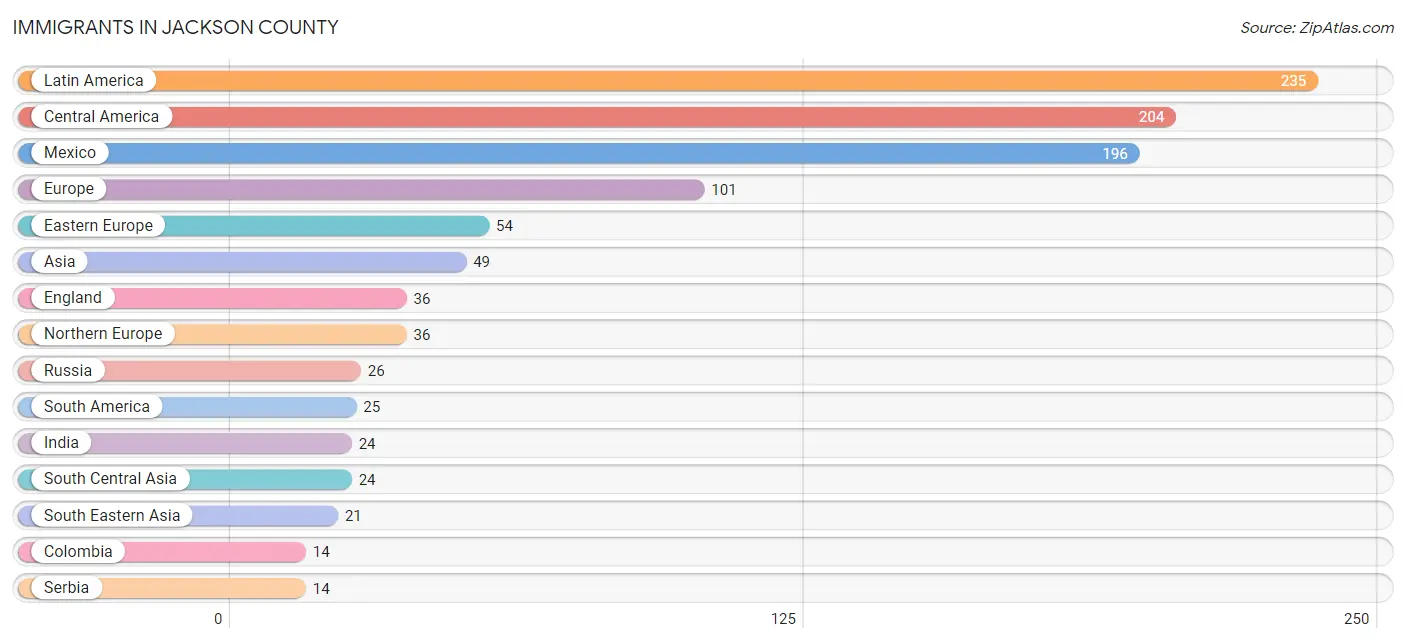
Immigrants in Jackson County
The most numerous immigrant groups reported in Jackson County came from Latin America (235 | 1.1%), Central America (204 | 1.0%), Mexico (196 | 0.9%), Europe (101 | 0.5%), and Eastern Europe (54 | 0.3%), together accounting for 3.8% of all Jackson County residents.
| Immigration Origin | # Population | % Population |
| Africa | 2 | 0.0% |
| Asia | 49 | 0.2% |
| Austria | 1 | 0.0% |
| Brazil | 6 | 0.0% |
| Canada | 3 | 0.0% |
| Caribbean | 6 | 0.0% |
| Central America | 204 | 1.0% |
| China | 4 | 0.0% |
| Colombia | 14 | 0.1% |
| Eastern Asia | 4 | 0.0% |
| Eastern Europe | 54 | 0.3% |
| El Salvador | 8 | 0.0% |
| England | 36 | 0.2% |
| Europe | 101 | 0.5% |
| Germany | 5 | 0.0% |
| Hong Kong | 1 | 0.0% |
| India | 24 | 0.1% |
| Laos | 8 | 0.0% |
| Latin America | 235 | 1.1% |
| Latvia | 8 | 0.0% |
| Mexico | 196 | 0.9% |
| Micronesia | 2 | 0.0% |
| Netherlands | 5 | 0.0% |
| Nigeria | 2 | 0.0% |
| Northern Europe | 36 | 0.2% |
| Oceania | 2 | 0.0% |
| Peru | 5 | 0.0% |
| Philippines | 4 | 0.0% |
| Poland | 2 | 0.0% |
| Romania | 2 | 0.0% |
| Russia | 26 | 0.1% |
| Serbia | 14 | 0.1% |
| South America | 25 | 0.1% |
| South Central Asia | 24 | 0.1% |
| South Eastern Asia | 21 | 0.1% |
| Thailand | 9 | 0.0% |
| Trinidad and Tobago | 6 | 0.0% |
| Ukraine | 2 | 0.0% |
| Western Africa | 2 | 0.0% |
| Western Europe | 11 | 0.1% | View All 40 Rows |
Sex and Age in Jackson County
Sex and Age in Jackson County
The most populous age groups in Jackson County are 60 to 64 Years (875 | 7.7%) for men and 60 to 64 Years (853 | 8.8%) for women.
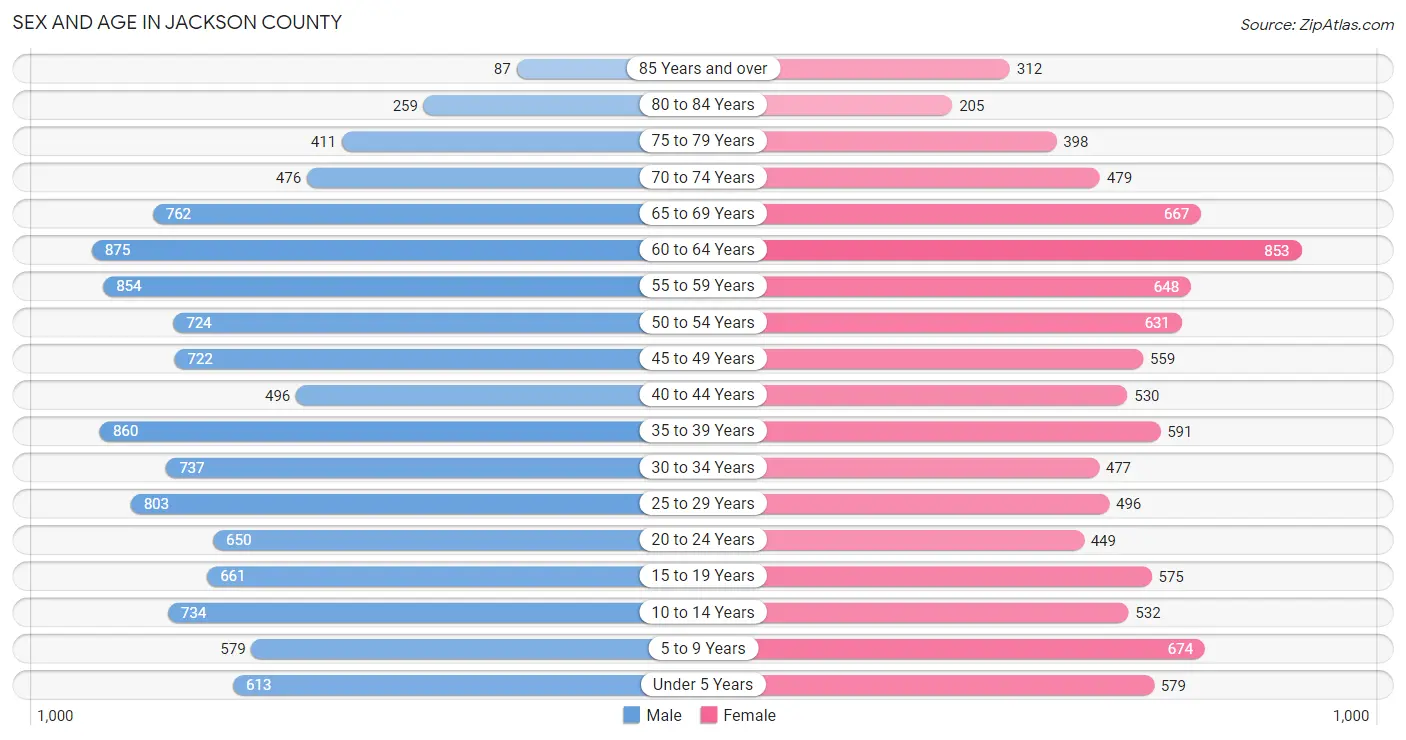
| Age Bracket | Male | Female |
| Under 5 Years | 613 (5.4%) | 579 (6.0%) |
| 5 to 9 Years | 579 (5.1%) | 674 (7.0%) |
| 10 to 14 Years | 734 (6.5%) | 532 (5.5%) |
| 15 to 19 Years | 661 (5.9%) | 575 (6.0%) |
| 20 to 24 Years | 650 (5.8%) | 449 (4.6%) |
| 25 to 29 Years | 803 (7.1%) | 496 (5.1%) |
| 30 to 34 Years | 737 (6.5%) | 477 (4.9%) |
| 35 to 39 Years | 860 (7.6%) | 591 (6.1%) |
| 40 to 44 Years | 496 (4.4%) | 530 (5.5%) |
| 45 to 49 Years | 722 (6.4%) | 559 (5.8%) |
| 50 to 54 Years | 724 (6.4%) | 631 (6.5%) |
| 55 to 59 Years | 854 (7.6%) | 648 (6.7%) |
| 60 to 64 Years | 875 (7.7%) | 853 (8.8%) |
| 65 to 69 Years | 762 (6.7%) | 667 (6.9%) |
| 70 to 74 Years | 476 (4.2%) | 479 (5.0%) |
| 75 to 79 Years | 411 (3.6%) | 398 (4.1%) |
| 80 to 84 Years | 259 (2.3%) | 205 (2.1%) |
| 85 Years and over | 87 (0.8%) | 312 (3.2%) |
| Total | 11,303 (100.0%) | 9,655 (100.0%) |
Families and Households in Jackson County
Median Family Size in Jackson County
The median family size in Jackson County is 3.10 persons per family, with single female/mother families (615 | 12.3%) accounting for the largest median family size of 3.38 persons per family. On the other hand, single male/father families (349 | 7.0%) represent the smallest median family size with 2.93 persons per family.

| Family Type | # Families | Family Size |
| Married-Couple | 4,031 (80.7%) | 3.07 |
| Single Male/Father | 349 (7.0%) | 2.93 |
| Single Female/Mother | 615 (12.3%) | 3.38 |
| Total Families | 4,995 (100.0%) | 3.10 |
Median Household Size in Jackson County
The median household size in Jackson County is 2.47 persons per household, with single female/mother households (615 | 7.7%) accounting for the largest median household size of 3.7 persons per household. non-family households (2,995 | 37.5%) represent the smallest median household size with 1.25 persons per household.
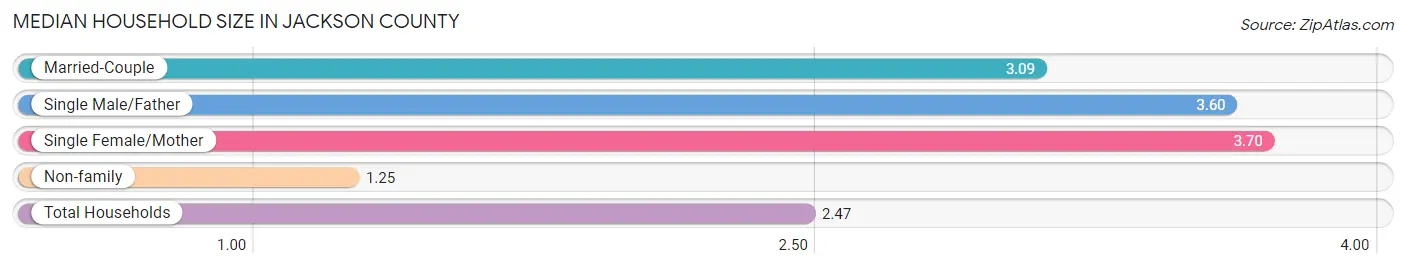
| Household Type | # Households | Household Size |
| Married-Couple | 4,031 (50.4%) | 3.09 |
| Single Male/Father | 349 (4.4%) | 3.60 |
| Single Female/Mother | 615 (7.7%) | 3.70 |
| Non-family | 2,995 (37.5%) | 1.25 |
| Total Households | 7,990 (100.0%) | 2.47 |
Household Size by Marriage Status in Jackson County
Out of a total of 7,990 households in Jackson County, 4,995 (62.5%) are family households, while 2,995 (37.5%) are nonfamily households. The most numerous type of family households are 2-person households, comprising 2,504, and the most common type of nonfamily households are 1-person households, comprising 2,529.

| Household Size | Family Households | Nonfamily Households |
| 1-Person Households | - | 2,529 (31.7%) |
| 2-Person Households | 2,504 (31.3%) | 420 (5.3%) |
| 3-Person Households | 940 (11.8%) | 33 (0.4%) |
| 4-Person Households | 785 (9.8%) | 5 (0.1%) |
| 5-Person Households | 431 (5.4%) | 2 (0.0%) |
| 6-Person Households | 219 (2.7%) | 0 (0.0%) |
| 7+ Person Households | 116 (1.5%) | 6 (0.1%) |
| Total | 4,995 (62.5%) | 2,995 (37.5%) |
Female Fertility in Jackson County
Fertility by Age in Jackson County
Average fertility rate in Jackson County is 78.0 births per 1,000 women. Women in the age bracket of 20 to 34 years have the highest fertility rate with 145.0 births per 1,000 women. Women in the age bracket of 20 to 34 years acount for 69.1% of all women with births.
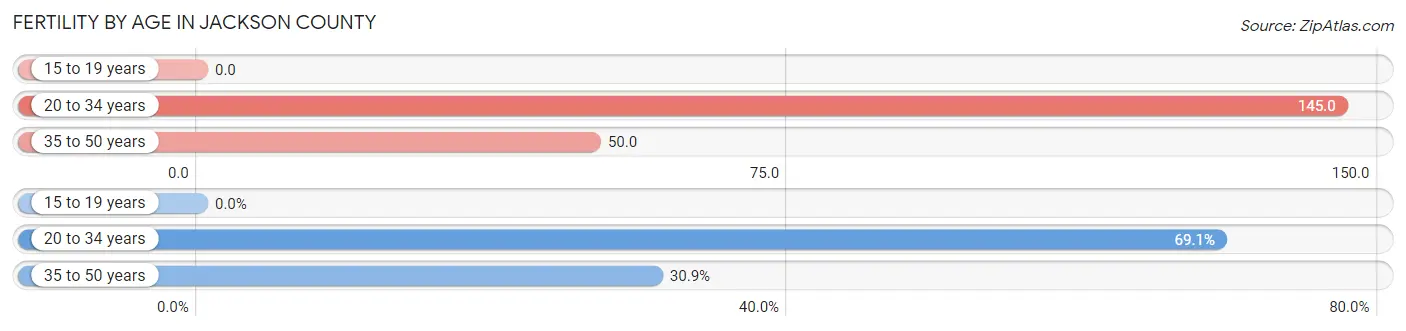
| Age Bracket | Women with Births | Births / 1,000 Women |
| 15 to 19 years | 0 (0.0%) | 0.0 |
| 20 to 34 years | 206 (69.1%) | 145.0 |
| 35 to 50 years | 92 (30.9%) | 50.0 |
| Total | 298 (100.0%) | 78.0 |
Fertility by Age by Marriage Status in Jackson County
69.1% of women with births (298) in Jackson County are married. The highest percentage of unmarried women with births falls into 20 to 34 years age bracket with 35.9% of them unmarried at the time of birth, while the lowest percentage of unmarried women with births belong to 35 to 50 years age bracket with 19.6% of them unmarried.
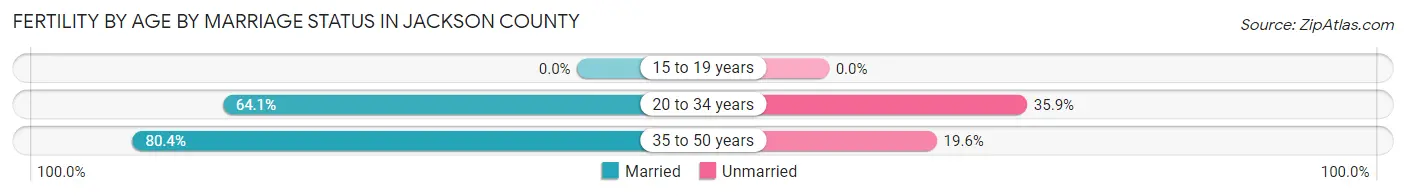
| Age Bracket | Married | Unmarried |
| 15 to 19 years | 0 (0.0%) | 0 (0.0%) |
| 20 to 34 years | 132 (64.1%) | 74 (35.9%) |
| 35 to 50 years | 74 (80.4%) | 18 (19.6%) |
| Total | 206 (69.1%) | 92 (30.9%) |
Fertility by Education in Jackson County
Average fertility rate in Jackson County is 78.0 births per 1,000 women. Women with the education attainment of less than high school have the highest fertility rate of 94.0 births per 1,000 women, while women with the education attainment of graduate degree have the lowest fertility at 59.0 births per 1,000 women. Women with the education attainment of college or associate's degree represent 33.9% of all women with births.
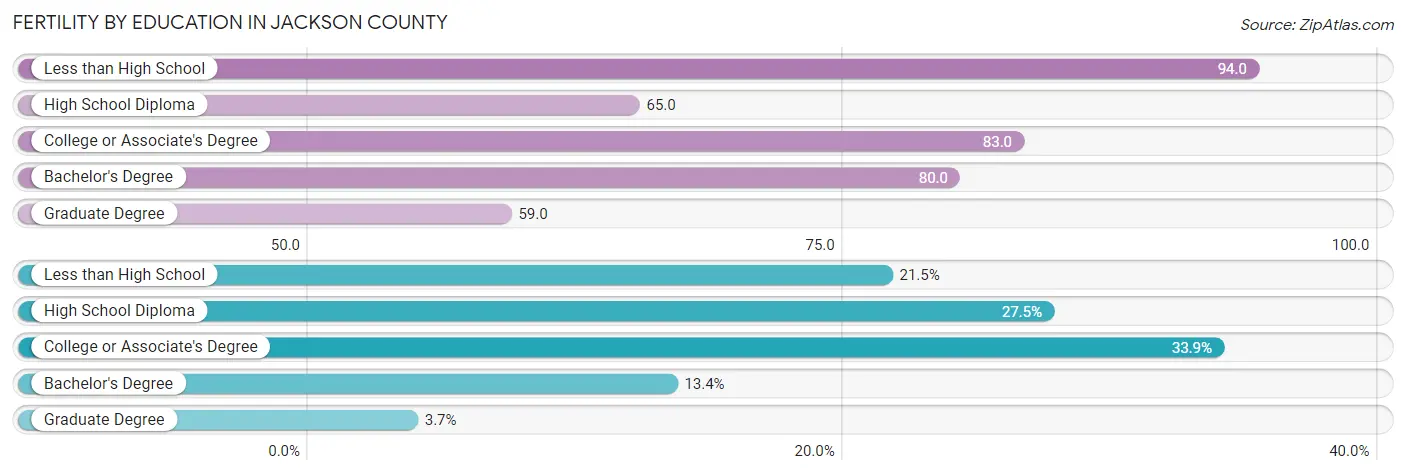
| Educational Attainment | Women with Births | Births / 1,000 Women |
| Less than High School | 64 (21.5%) | 94.0 |
| High School Diploma | 82 (27.5%) | 65.0 |
| College or Associate's Degree | 101 (33.9%) | 83.0 |
| Bachelor's Degree | 40 (13.4%) | 80.0 |
| Graduate Degree | 11 (3.7%) | 59.0 |
| Total | 298 (100.0%) | 78.0 |
Fertility by Education by Marriage Status in Jackson County
30.9% of women with births in Jackson County are unmarried. Women with the educational attainment of bachelor's degree are most likely to be married with 87.5% of them married at childbirth, while women with the educational attainment of graduate degree are least likely to be married with 72.7% of them unmarried at childbirth.
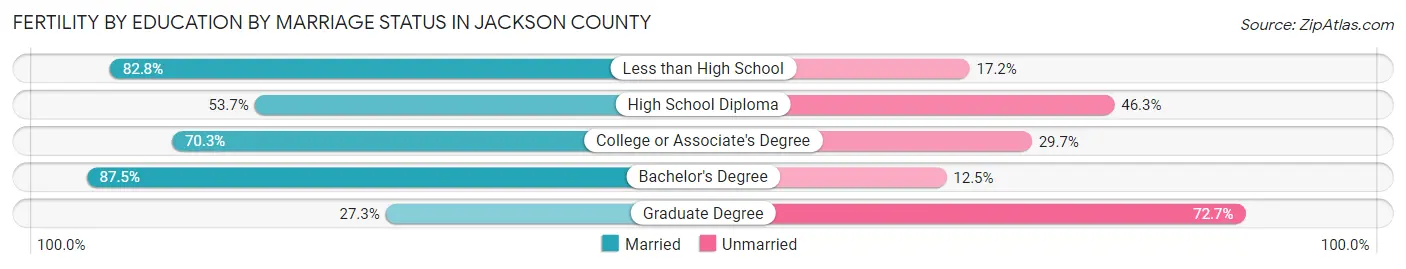
| Educational Attainment | Married | Unmarried |
| Less than High School | 53 (82.8%) | 11 (17.2%) |
| High School Diploma | 44 (53.7%) | 38 (46.3%) |
| College or Associate's Degree | 71 (70.3%) | 30 (29.7%) |
| Bachelor's Degree | 35 (87.5%) | 5 (12.5%) |
| Graduate Degree | 3 (27.3%) | 8 (72.7%) |
| Total | 206 (69.1%) | 92 (30.9%) |
Income in Jackson County
Income Overview in Jackson County
Per Capita Income in Jackson County is $32,659, while median incomes of families and households are $80,986 and $64,630 respectively.
| Characteristic | Number | Measure |
| Per Capita Income | 20,958 | $32,659 |
| Median Family Income | 4,995 | $80,986 |
| Mean Family Income | 4,995 | $101,710 |
| Median Household Income | 7,990 | $64,630 |
| Mean Household Income | 7,990 | $81,771 |
| Income Deficit | 4,995 | $10,303 |
| Wage / Income Gap (%) | 20,958 | 22.34% |
| Wage / Income Gap ($) | 20,958 | 77.66¢ per $1 |
| Gini / Inequality Index | 20,958 | 0.45 |
Earnings by Sex in Jackson County
Average Earnings in Jackson County are $35,037, $40,062 for men and $31,111 for women, a difference of 22.3%.
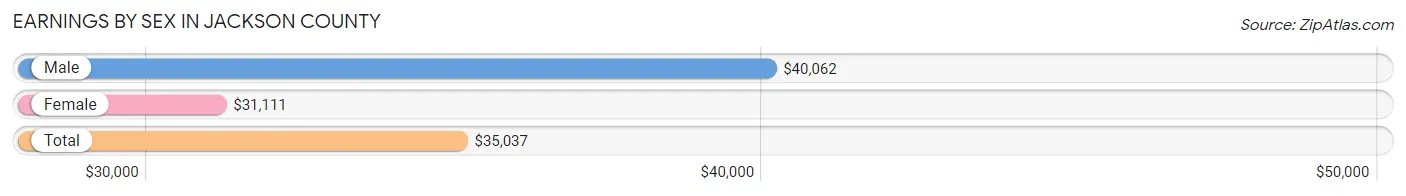
| Sex | Number | Average Earnings |
| Male | 6,094 (56.9%) | $40,062 |
| Female | 4,618 (43.1%) | $31,111 |
| Total | 10,712 (100.0%) | $35,037 |
Earnings by Sex by Income Bracket in Jackson County
The most common earnings brackets in Jackson County are $100,000+ for men (569 | 9.3%) and $30,000 to $34,999 for women (412 | 8.9%).
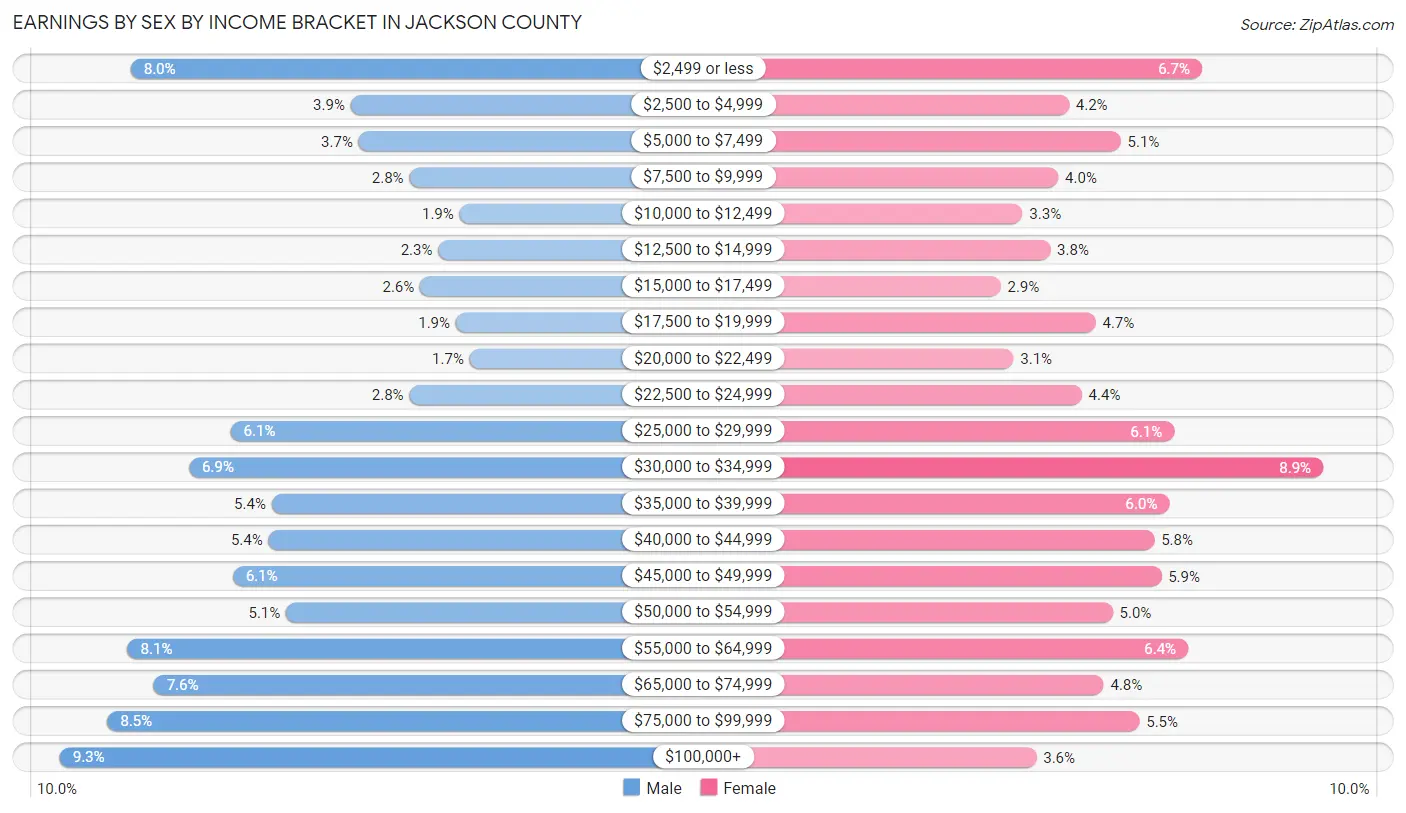
| Income | Male | Female |
| $2,499 or less | 488 (8.0%) | 307 (6.7%) |
| $2,500 to $4,999 | 237 (3.9%) | 192 (4.2%) |
| $5,000 to $7,499 | 228 (3.7%) | 237 (5.1%) |
| $7,500 to $9,999 | 170 (2.8%) | 183 (4.0%) |
| $10,000 to $12,499 | 113 (1.8%) | 152 (3.3%) |
| $12,500 to $14,999 | 137 (2.2%) | 176 (3.8%) |
| $15,000 to $17,499 | 158 (2.6%) | 133 (2.9%) |
| $17,500 to $19,999 | 117 (1.9%) | 215 (4.7%) |
| $20,000 to $22,499 | 101 (1.7%) | 144 (3.1%) |
| $22,500 to $24,999 | 170 (2.8%) | 203 (4.4%) |
| $25,000 to $29,999 | 374 (6.1%) | 283 (6.1%) |
| $30,000 to $34,999 | 422 (6.9%) | 412 (8.9%) |
| $35,000 to $39,999 | 327 (5.4%) | 279 (6.0%) |
| $40,000 to $44,999 | 331 (5.4%) | 266 (5.8%) |
| $45,000 to $49,999 | 372 (6.1%) | 272 (5.9%) |
| $50,000 to $54,999 | 311 (5.1%) | 230 (5.0%) |
| $55,000 to $64,999 | 492 (8.1%) | 295 (6.4%) |
| $65,000 to $74,999 | 462 (7.6%) | 222 (4.8%) |
| $75,000 to $99,999 | 515 (8.5%) | 253 (5.5%) |
| $100,000+ | 569 (9.3%) | 164 (3.5%) |
| Total | 6,094 (100.0%) | 4,618 (100.0%) |
Earnings by Sex by Educational Attainment in Jackson County
Average earnings in Jackson County are $44,452 for men and $33,808 for women, a difference of 23.9%. Men with an educational attainment of graduate degree enjoy the highest average annual earnings of $70,484, while those with less than high school education earn the least with $36,728. Women with an educational attainment of graduate degree earn the most with the average annual earnings of $67,875, while those with less than high school education have the smallest earnings of $26,094.

| Educational Attainment | Male Income | Female Income |
| Less than High School | $36,728 | $26,094 |
| High School Diploma | $40,242 | $27,556 |
| College or Associate's Degree | $51,442 | $35,242 |
| Bachelor's Degree | $57,750 | $46,618 |
| Graduate Degree | $70,484 | $67,875 |
| Total | $44,452 | $33,808 |
Family Income in Jackson County
Family Income Brackets in Jackson County
According to the Jackson County family income data, there are 1,099 families falling into the $50,000 to $74,999 income range, which is the most common income bracket and makes up 22.0% of all families. Conversely, the $10,000 to $14,999 income bracket is the least frequent group with only 65 families (1.3%) belonging to this category.
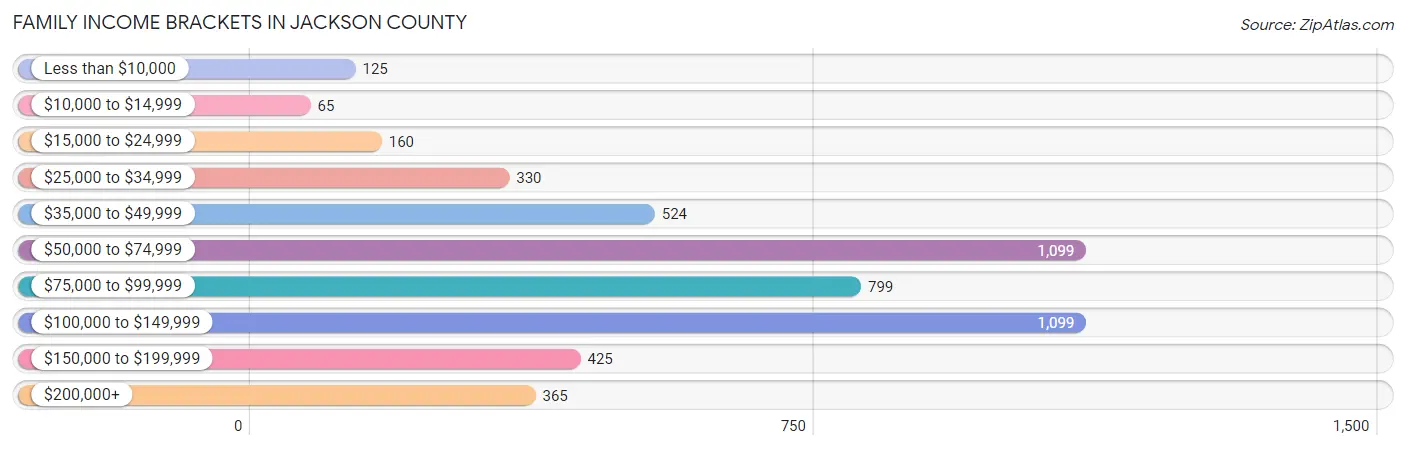
| Income Bracket | # Families | % Families |
| Less than $10,000 | 125 | 2.5% |
| $10,000 to $14,999 | 65 | 1.3% |
| $15,000 to $24,999 | 160 | 3.2% |
| $25,000 to $34,999 | 330 | 6.6% |
| $35,000 to $49,999 | 524 | 10.5% |
| $50,000 to $74,999 | 1,099 | 22.0% |
| $75,000 to $99,999 | 799 | 16.0% |
| $100,000 to $149,999 | 1,099 | 22.0% |
| $150,000 to $199,999 | 425 | 8.5% |
| $200,000+ | 365 | 7.3% |
Family Income by Famaliy Size in Jackson County
5-person families (381 | 7.6%) account for the highest median family income in Jackson County with $109,375 per family, while 2-person families (2,636 | 52.8%) have the highest median income of $36,194 per family member.
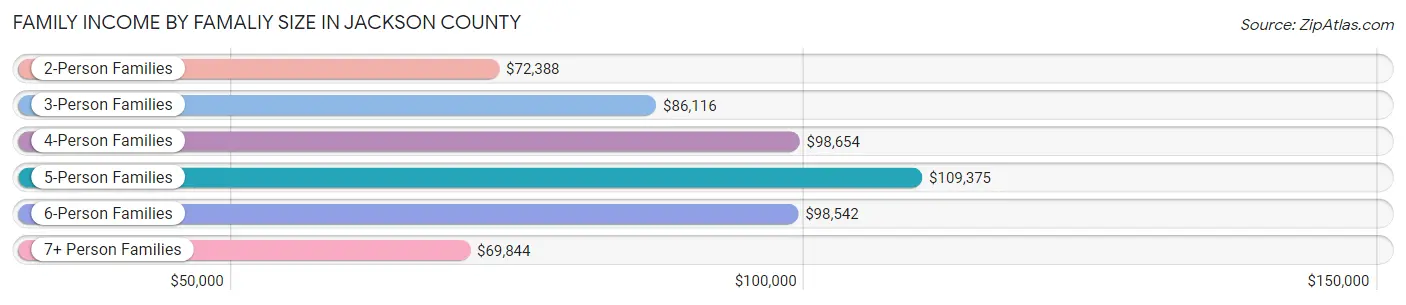
| Income Bracket | # Families | Median Income |
| 2-Person Families | 2,636 (52.8%) | $72,388 |
| 3-Person Families | 987 (19.8%) | $86,116 |
| 4-Person Families | 696 (13.9%) | $98,654 |
| 5-Person Families | 381 (7.6%) | $109,375 |
| 6-Person Families | 199 (4.0%) | $98,542 |
| 7+ Person Families | 96 (1.9%) | $69,844 |
| Total | 4,995 (100.0%) | $80,986 |
Family Income by Number of Earners in Jackson County
The median family income in Jackson County is $80,986, with families comprising 3+ earners (563) having the highest median family income of $125,208, while families with no earners (856) have the lowest median family income of $46,944, accounting for 11.3% and 17.1% of families, respectively.
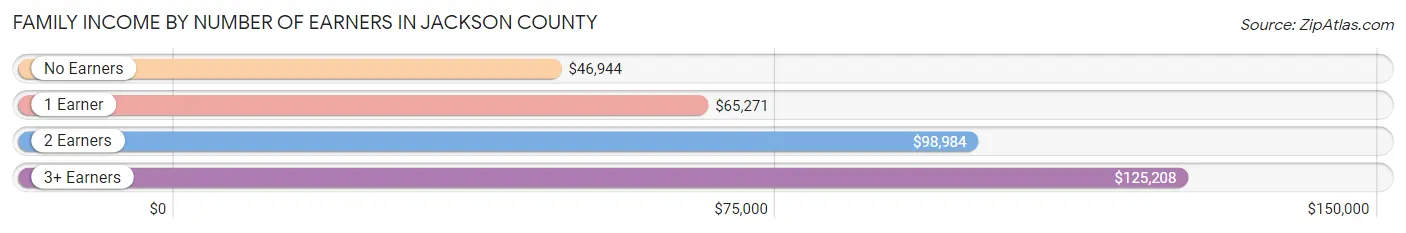
| Number of Earners | # Families | Median Income |
| No Earners | 856 (17.1%) | $46,944 |
| 1 Earner | 1,421 (28.4%) | $65,271 |
| 2 Earners | 2,155 (43.1%) | $98,984 |
| 3+ Earners | 563 (11.3%) | $125,208 |
| Total | 4,995 (100.0%) | $80,986 |
Household Income in Jackson County
Household Income Brackets in Jackson County
With 1,558 households falling in the category, the $50,000 to $74,999 income range is the most frequent in Jackson County, accounting for 19.5% of all households. In contrast, only 384 households (4.8%) fall into the less than $10,000 income bracket, making it the least populous group.
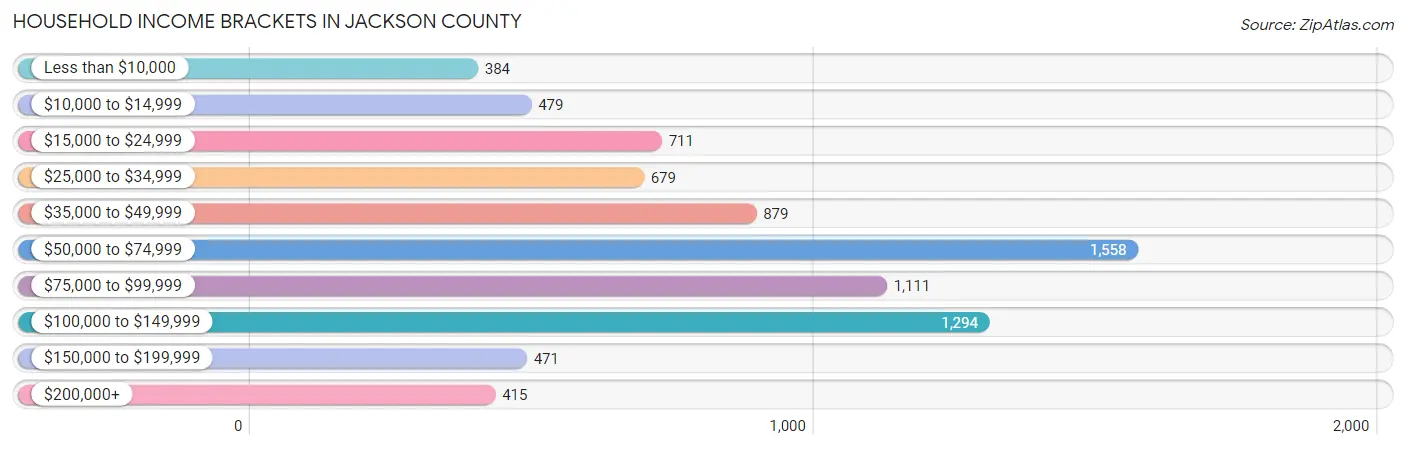
| Income Bracket | # Households | % Households |
| Less than $10,000 | 384 | 4.8% |
| $10,000 to $14,999 | 479 | 6.0% |
| $15,000 to $24,999 | 711 | 8.9% |
| $25,000 to $34,999 | 679 | 8.5% |
| $35,000 to $49,999 | 879 | 11.0% |
| $50,000 to $74,999 | 1,558 | 19.5% |
| $75,000 to $99,999 | 1,111 | 13.9% |
| $100,000 to $149,999 | 1,294 | 16.2% |
| $150,000 to $199,999 | 471 | 5.9% |
| $200,000+ | 415 | 5.2% |
Household Income by Householder Age in Jackson County
The median household income in Jackson County is $64,630, with the highest median household income of $72,500 found in the 25 to 44 years age bracket for the primary householder. A total of 2,050 households (25.7%) fall into this category. Meanwhile, the 15 to 24 years age bracket for the primary householder has the lowest median household income of $0, with 207 households (2.6%) in this group.

| Income Bracket | # Households | Median Income |
| 15 to 24 Years | 207 (2.6%) | $0 |
| 25 to 44 Years | 2,050 (25.7%) | $72,500 |
| 45 to 64 Years | 3,217 (40.3%) | $72,170 |
| 65+ Years | 2,516 (31.5%) | $47,596 |
| Total | 7,990 (100.0%) | $64,630 |
Poverty in Jackson County
Income Below Poverty by Sex and Age in Jackson County
With 10.4% poverty level for males and 15.2% for females among the residents of Jackson County, 5 year old males and 15 year old females are the most vulnerable to poverty, with 27 males (32.5%) and 38 females (27.1%) in their respective age groups living below the poverty level.
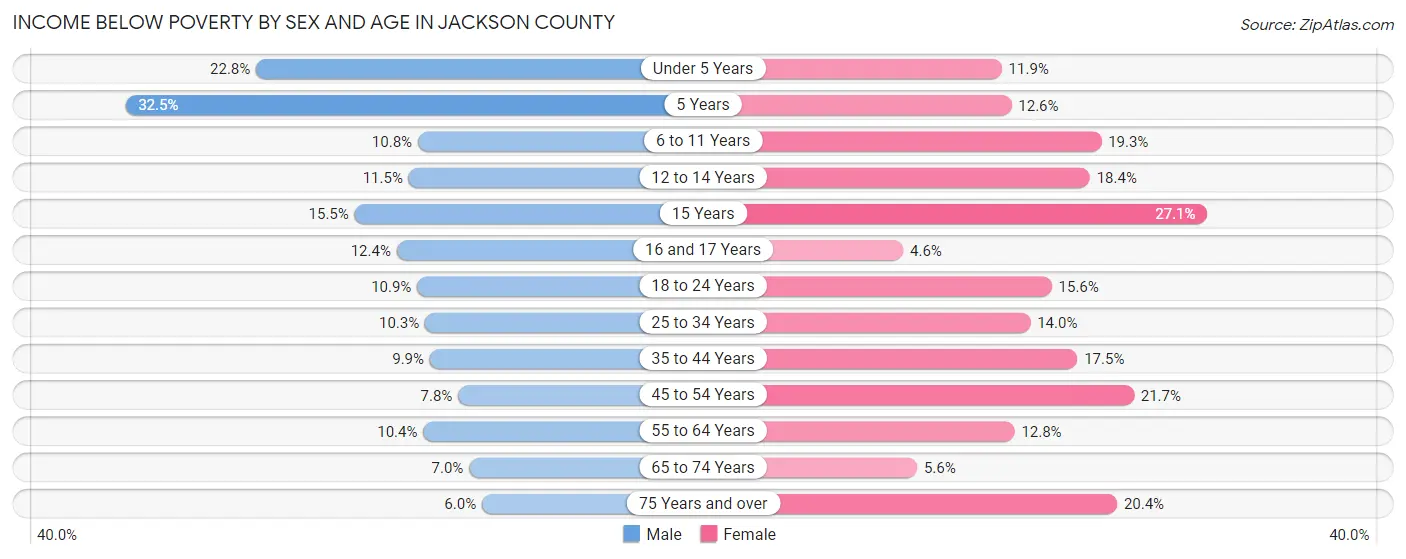
| Age Bracket | Male | Female |
| Under 5 Years | 138 (22.8%) | 68 (11.9%) |
| 5 Years | 27 (32.5%) | 18 (12.6%) |
| 6 to 11 Years | 80 (10.8%) | 125 (19.3%) |
| 12 to 14 Years | 52 (11.5%) | 67 (18.4%) |
| 15 Years | 20 (15.5%) | 38 (27.1%) |
| 16 and 17 Years | 37 (12.4%) | 11 (4.5%) |
| 18 to 24 Years | 88 (10.8%) | 100 (15.6%) |
| 25 to 34 Years | 130 (10.3%) | 136 (14.0%) |
| 35 to 44 Years | 114 (9.9%) | 187 (17.5%) |
| 45 to 54 Years | 99 (7.8%) | 258 (21.7%) |
| 55 to 64 Years | 165 (10.4%) | 191 (12.8%) |
| 65 to 74 Years | 82 (7.0%) | 64 (5.6%) |
| 75 Years and over | 45 (6.0%) | 173 (20.4%) |
| Total | 1,077 (10.4%) | 1,436 (15.2%) |
Income Above Poverty by Sex and Age in Jackson County
According to the poverty statistics in Jackson County, males aged 75 years and over and females aged 16 and 17 years are the age groups that are most secure financially, with 94.0% of males and 95.5% of females in these age groups living above the poverty line.
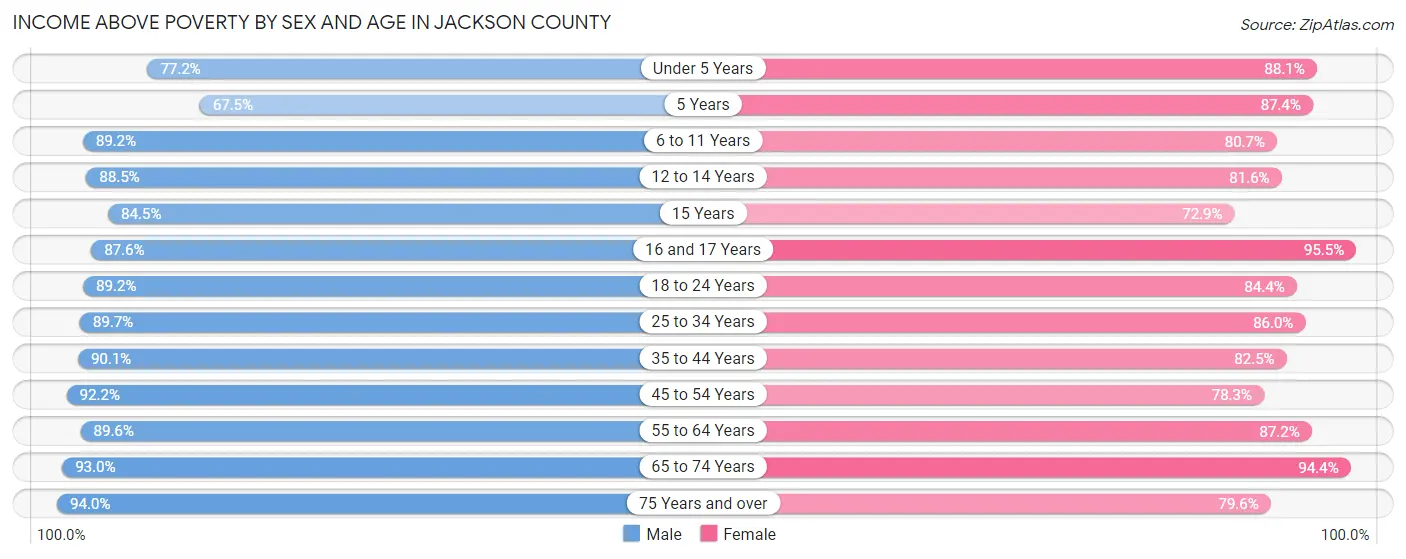
| Age Bracket | Male | Female |
| Under 5 Years | 467 (77.2%) | 505 (88.1%) |
| 5 Years | 56 (67.5%) | 125 (87.4%) |
| 6 to 11 Years | 661 (89.2%) | 524 (80.7%) |
| 12 to 14 Years | 401 (88.5%) | 297 (81.6%) |
| 15 Years | 109 (84.5%) | 102 (72.9%) |
| 16 and 17 Years | 262 (87.6%) | 231 (95.5%) |
| 18 to 24 Years | 723 (89.1%) | 542 (84.4%) |
| 25 to 34 Years | 1,136 (89.7%) | 836 (86.0%) |
| 35 to 44 Years | 1,036 (90.1%) | 883 (82.5%) |
| 45 to 54 Years | 1,169 (92.2%) | 932 (78.3%) |
| 55 to 64 Years | 1,422 (89.6%) | 1,299 (87.2%) |
| 65 to 74 Years | 1,091 (93.0%) | 1,082 (94.4%) |
| 75 Years and over | 700 (94.0%) | 674 (79.6%) |
| Total | 9,233 (89.5%) | 8,032 (84.8%) |
Income Below Poverty Among Married-Couple Families in Jackson County
The poverty statistics for married-couple families in Jackson County show that 3.6% or 147 of the total 4,031 families live below the poverty line. Families with 5 or more children have the highest poverty rate of 21.3%, comprising of 16 families. On the other hand, families with 1 or 2 children have the lowest poverty rate of 2.5%, which includes 25 families.
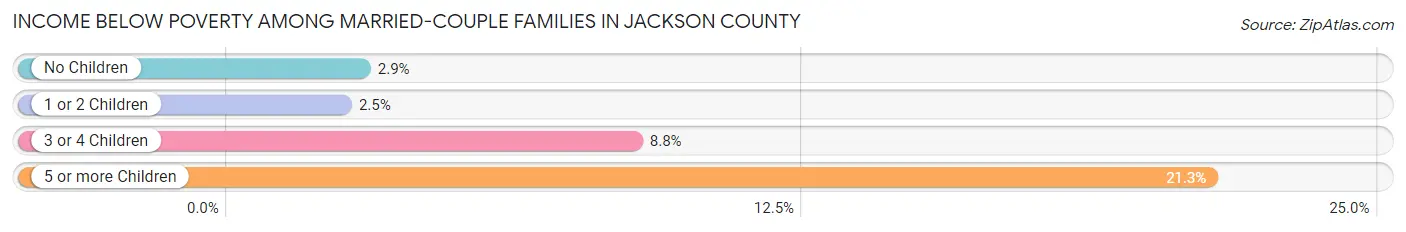
| Children | Above Poverty | Below Poverty |
| No Children | 2,521 (97.1%) | 75 (2.9%) |
| 1 or 2 Children | 983 (97.5%) | 25 (2.5%) |
| 3 or 4 Children | 321 (91.2%) | 31 (8.8%) |
| 5 or more Children | 59 (78.7%) | 16 (21.3%) |
| Total | 3,884 (96.4%) | 147 (3.6%) |
Income Below Poverty Among Single-Parent Households in Jackson County
According to the poverty data in Jackson County, 10.0% or 35 single-father households and 26.7% or 164 single-mother households are living below the poverty line. Among single-father households, those with 5 or more children have the highest poverty rate, with 2 households (50.0%) experiencing poverty. Likewise, among single-mother households, those with 3 or 4 children have the highest poverty rate, with 63 households (75.0%) falling below the poverty line.

| Children | Single Father | Single Mother |
| No Children | 1 (1.2%) | 33 (15.1%) |
| 1 or 2 Children | 29 (12.7%) | 68 (21.7%) |
| 3 or 4 Children | 3 (9.7%) | 63 (75.0%) |
| 5 or more Children | 2 (50.0%) | 0 (0.0%) |
| Total | 35 (10.0%) | 164 (26.7%) |
Income Below Poverty Among Married-Couple vs Single-Parent Households in Jackson County
The poverty data for Jackson County shows that 147 of the married-couple family households (3.6%) and 199 of the single-parent households (20.6%) are living below the poverty level. Within the married-couple family households, those with 5 or more children have the highest poverty rate, with 16 households (21.3%) falling below the poverty line. Among the single-parent households, those with 3 or 4 children have the highest poverty rate, with 66 household (57.4%) living below poverty.

| Children | Married-Couple Families | Single-Parent Households |
| No Children | 75 (2.9%) | 34 (11.2%) |
| 1 or 2 Children | 25 (2.5%) | 97 (17.9%) |
| 3 or 4 Children | 31 (8.8%) | 66 (57.4%) |
| 5 or more Children | 16 (21.3%) | 2 (50.0%) |
| Total | 147 (3.6%) | 199 (20.6%) |
Employment Characteristics in Jackson County
Employment by Class of Employer in Jackson County
Among the 9,119 employed individuals in Jackson County, private company employees (5,795 | 63.5%), local government employees (874 | 9.6%), and self-employed (not incorporated) (718 | 7.9%) make up the most common classes of employment.
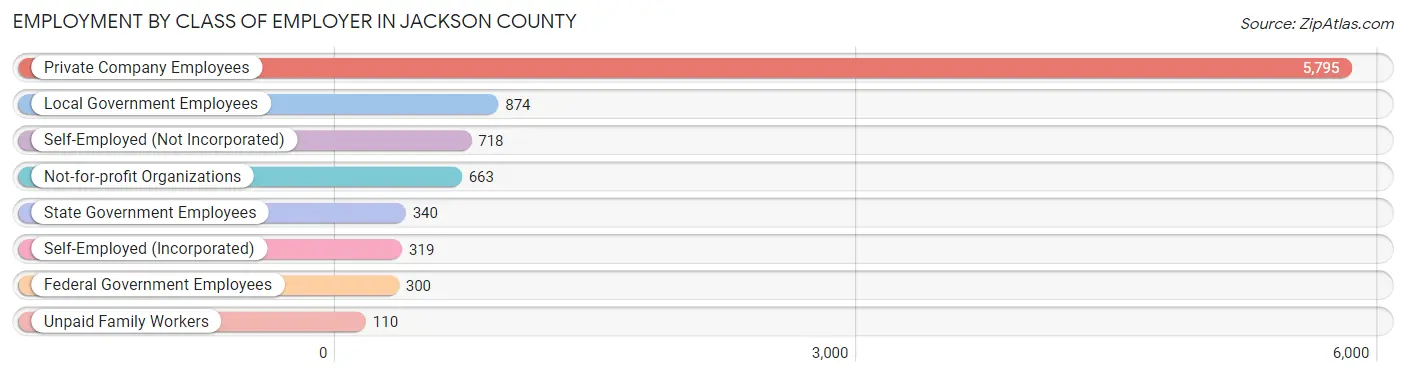
| Employer Class | # Employees | % Employees |
| Private Company Employees | 5,795 | 63.5% |
| Self-Employed (Incorporated) | 319 | 3.5% |
| Self-Employed (Not Incorporated) | 718 | 7.9% |
| Not-for-profit Organizations | 663 | 7.3% |
| Local Government Employees | 874 | 9.6% |
| State Government Employees | 340 | 3.7% |
| Federal Government Employees | 300 | 3.3% |
| Unpaid Family Workers | 110 | 1.2% |
| Total | 9,119 | 100.0% |
Employment Status by Age in Jackson County
According to the labor force statistics for Jackson County, out of the total population over 16 years of age (16,978), 58.1% or 9,864 individuals are in the labor force, with 5.5% or 543 of them unemployed. The age group with the highest labor force participation rate is 45 to 54 years, with 77.3% or 2,038 individuals in the labor force. Within the labor force, the 16 to 19 years age range has the highest percentage of unemployed individuals, with 14.1% or 78 of them being unemployed.

| Age Bracket | In Labor Force | Unemployed |
| 16 to 19 Years | 553 (57.2%) | 78 (14.1%) |
| 20 to 24 Years | 834 (75.9%) | 68 (8.1%) |
| 25 to 29 Years | 995 (76.6%) | 72 (7.2%) |
| 30 to 34 Years | 860 (70.8%) | 49 (5.7%) |
| 35 to 44 Years | 1,912 (77.2%) | 90 (4.7%) |
| 45 to 54 Years | 2,038 (77.3%) | 79 (3.9%) |
| 55 to 59 Years | 1,093 (72.8%) | 69 (6.3%) |
| 60 to 64 Years | 935 (54.1%) | 39 (4.2%) |
| 65 to 74 Years | 508 (21.3%) | 0 (0.0%) |
| 75 Years and over | 129 (7.7%) | 0 (0.0%) |
| Total | 9,864 (58.1%) | 543 (5.5%) |
Employment Status by Educational Attainment in Jackson County
According to labor force statistics for Jackson County, 72.2% of individuals (7,838) out of the total population between 25 and 64 years of age (10,856) are in the labor force, with 5.1% or 400 of them being unemployed. The group with the highest labor force participation rate are those with the educational attainment of bachelor's degree or higher, with 85.8% or 1,448 individuals in the labor force. Within the labor force, individuals with less than high school education have the highest percentage of unemployment, with 8.0% or 39 of them being unemployed.
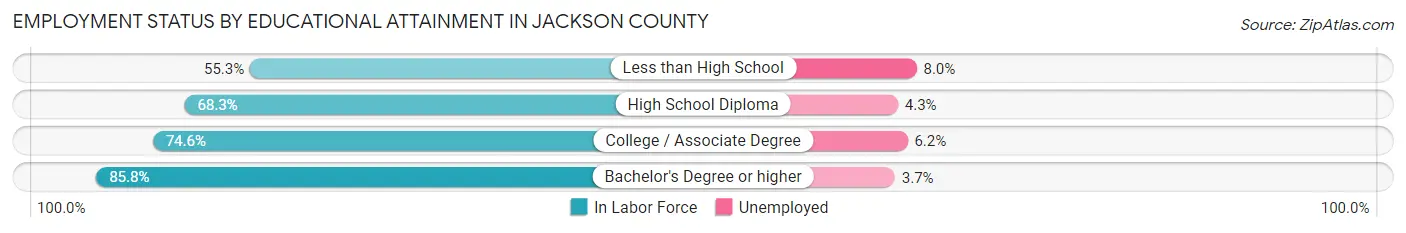
| Educational Attainment | In Labor Force | Unemployed |
| Less than High School | 487 (55.3%) | 70 (8.0%) |
| High School Diploma | 3,112 (68.3%) | 196 (4.3%) |
| College / Associate Degree | 2,784 (74.6%) | 231 (6.2%) |
| Bachelor's Degree or higher | 1,448 (85.8%) | 62 (3.7%) |
| Total | 7,838 (72.2%) | 554 (5.1%) |
Employment Occupations by Sex in Jackson County
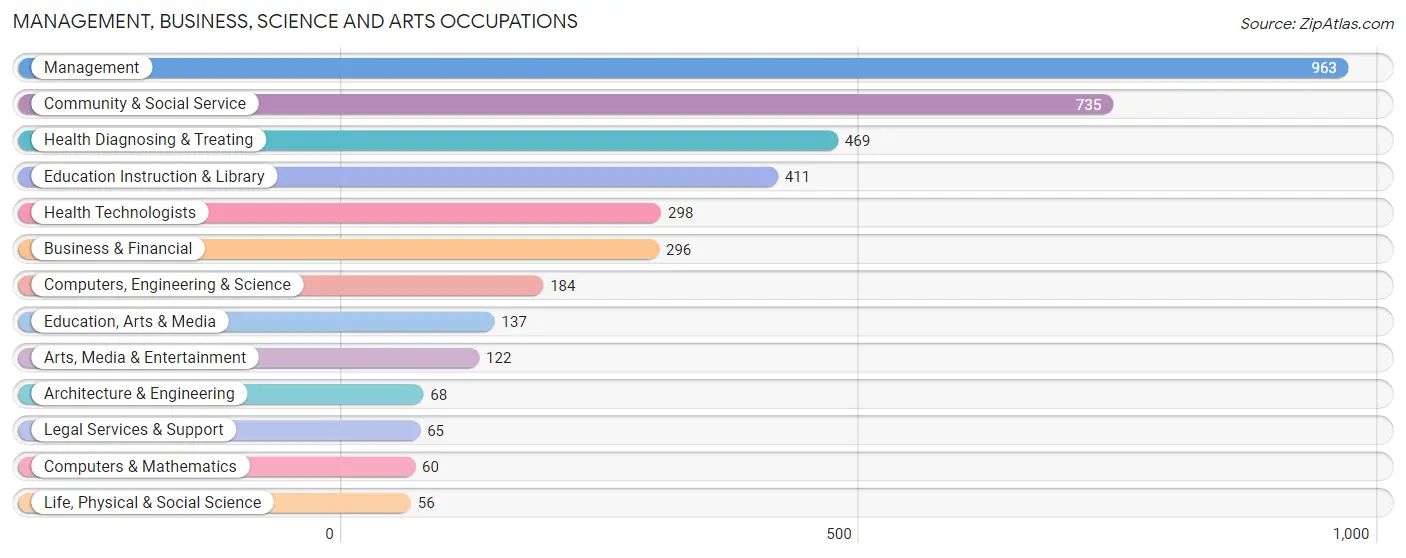
Management, Business, Science and Arts Occupations
The most common Management, Business, Science and Arts occupations in Jackson County are Management (963 | 10.4%), Community & Social Service (735 | 7.9%), Health Diagnosing & Treating (469 | 5.0%), Education Instruction & Library (411 | 4.4%), and Health Technologists (298 | 3.2%).
Management, Business, Science and Arts Occupations by Sex
Within the Management, Business, Science and Arts occupations in Jackson County, the most male-oriented occupations are Architecture & Engineering (86.8%), Management (63.9%), and Computers, Engineering & Science (63.6%), while the most female-oriented occupations are Health Technologists (88.3%), Legal Services & Support (86.2%), and Health Diagnosing & Treating (84.0%).
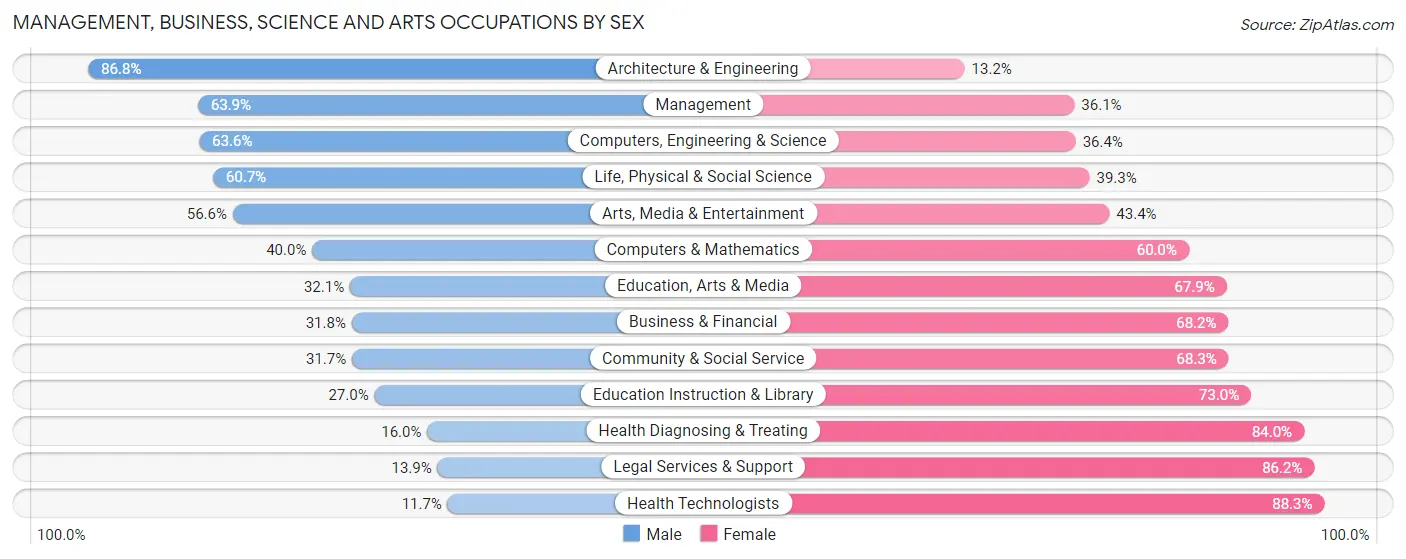
| Occupation | Male | Female |
| Management | 615 (63.9%) | 348 (36.1%) |
| Business & Financial | 94 (31.8%) | 202 (68.2%) |
| Computers, Engineering & Science | 117 (63.6%) | 67 (36.4%) |
| Computers & Mathematics | 24 (40.0%) | 36 (60.0%) |
| Architecture & Engineering | 59 (86.8%) | 9 (13.2%) |
| Life, Physical & Social Science | 34 (60.7%) | 22 (39.3%) |
| Community & Social Service | 233 (31.7%) | 502 (68.3%) |
| Education, Arts & Media | 44 (32.1%) | 93 (67.9%) |
| Legal Services & Support | 9 (13.9%) | 56 (86.2%) |
| Education Instruction & Library | 111 (27.0%) | 300 (73.0%) |
| Arts, Media & Entertainment | 69 (56.6%) | 53 (43.4%) |
| Health Diagnosing & Treating | 75 (16.0%) | 394 (84.0%) |
| Health Technologists | 35 (11.7%) | 263 (88.3%) |
| Total (Category) | 1,134 (42.8%) | 1,513 (57.2%) |
| Total (Overall) | 5,122 (55.1%) | 4,176 (44.9%) |
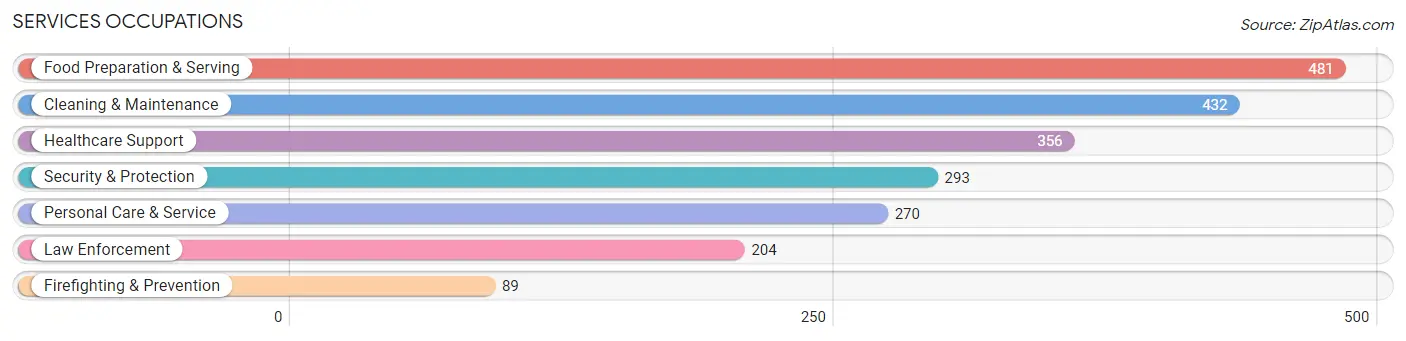
Services Occupations
The most common Services occupations in Jackson County are Food Preparation & Serving (481 | 5.2%), Cleaning & Maintenance (432 | 4.6%), Healthcare Support (356 | 3.8%), Security & Protection (293 | 3.2%), and Personal Care & Service (270 | 2.9%).
Services Occupations by Sex
Within the Services occupations in Jackson County, the most male-oriented occupations are Law Enforcement (82.4%), Security & Protection (79.5%), and Firefighting & Prevention (73.0%), while the most female-oriented occupations are Healthcare Support (93.0%), Personal Care & Service (81.1%), and Food Preparation & Serving (61.8%).

| Occupation | Male | Female |
| Healthcare Support | 25 (7.0%) | 331 (93.0%) |
| Security & Protection | 233 (79.5%) | 60 (20.5%) |
| Firefighting & Prevention | 65 (73.0%) | 24 (27.0%) |
| Law Enforcement | 168 (82.4%) | 36 (17.6%) |
| Food Preparation & Serving | 184 (38.3%) | 297 (61.8%) |
| Cleaning & Maintenance | 273 (63.2%) | 159 (36.8%) |
| Personal Care & Service | 51 (18.9%) | 219 (81.1%) |
| Total (Category) | 766 (41.8%) | 1,066 (58.2%) |
| Total (Overall) | 5,122 (55.1%) | 4,176 (44.9%) |
Sales and Office Occupations
The most common Sales and Office occupations in Jackson County are Office & Administration (785 | 8.4%), and Sales & Related (720 | 7.7%).

Sales and Office Occupations by Sex

| Occupation | Male | Female |
| Sales & Related | 356 (49.4%) | 364 (50.6%) |
| Office & Administration | 142 (18.1%) | 643 (81.9%) |
| Total (Category) | 498 (33.1%) | 1,007 (66.9%) |
| Total (Overall) | 5,122 (55.1%) | 4,176 (44.9%) |
Natural Resources, Construction and Maintenance Occupations
The most common Natural Resources, Construction and Maintenance occupations in Jackson County are Construction & Extraction (558 | 6.0%), Installation, Maintenance & Repair (440 | 4.7%), and Farming, Fishing & Forestry (320 | 3.4%).

Natural Resources, Construction and Maintenance Occupations by Sex
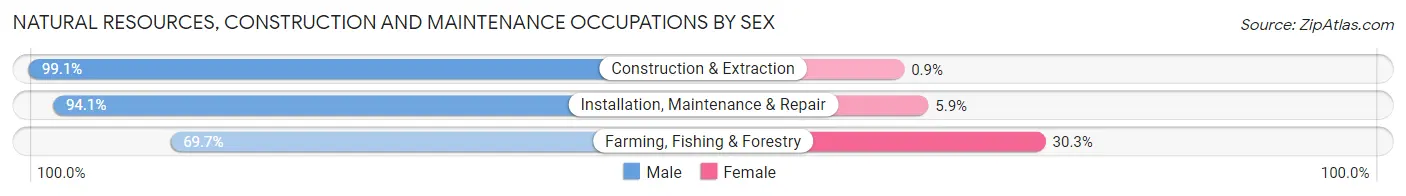
| Occupation | Male | Female |
| Farming, Fishing & Forestry | 223 (69.7%) | 97 (30.3%) |
| Construction & Extraction | 553 (99.1%) | 5 (0.9%) |
| Installation, Maintenance & Repair | 414 (94.1%) | 26 (5.9%) |
| Total (Category) | 1,190 (90.3%) | 128 (9.7%) |
| Total (Overall) | 5,122 (55.1%) | 4,176 (44.9%) |
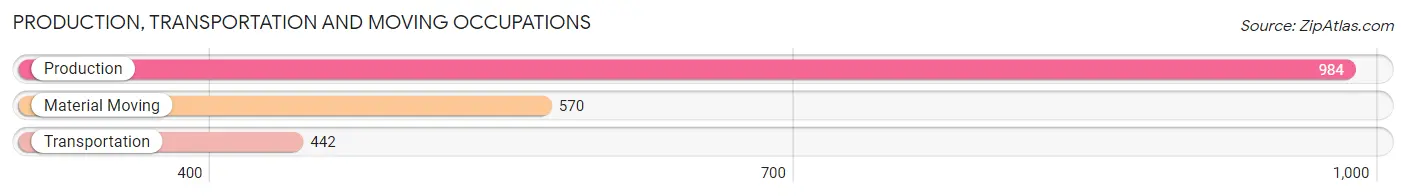
Production, Transportation and Moving Occupations
The most common Production, Transportation and Moving occupations in Jackson County are Production (984 | 10.6%), Material Moving (570 | 6.1%), and Transportation (442 | 4.8%).
Production, Transportation and Moving Occupations by Sex
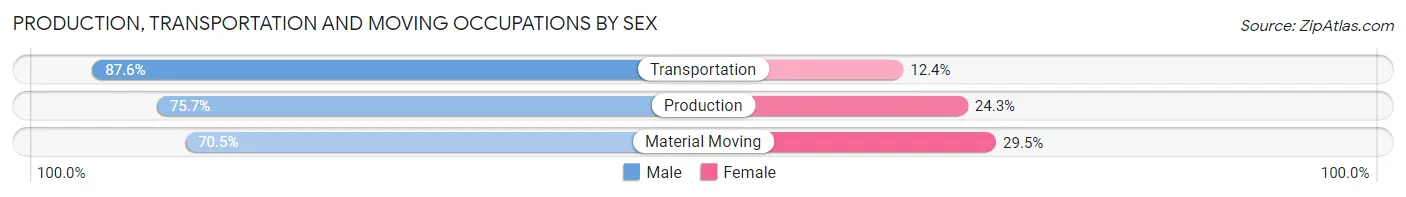
| Occupation | Male | Female |
| Production | 745 (75.7%) | 239 (24.3%) |
| Transportation | 387 (87.6%) | 55 (12.4%) |
| Material Moving | 402 (70.5%) | 168 (29.5%) |
| Total (Category) | 1,534 (76.8%) | 462 (23.2%) |
| Total (Overall) | 5,122 (55.1%) | 4,176 (44.9%) |
Employment Industries by Sex in Jackson County
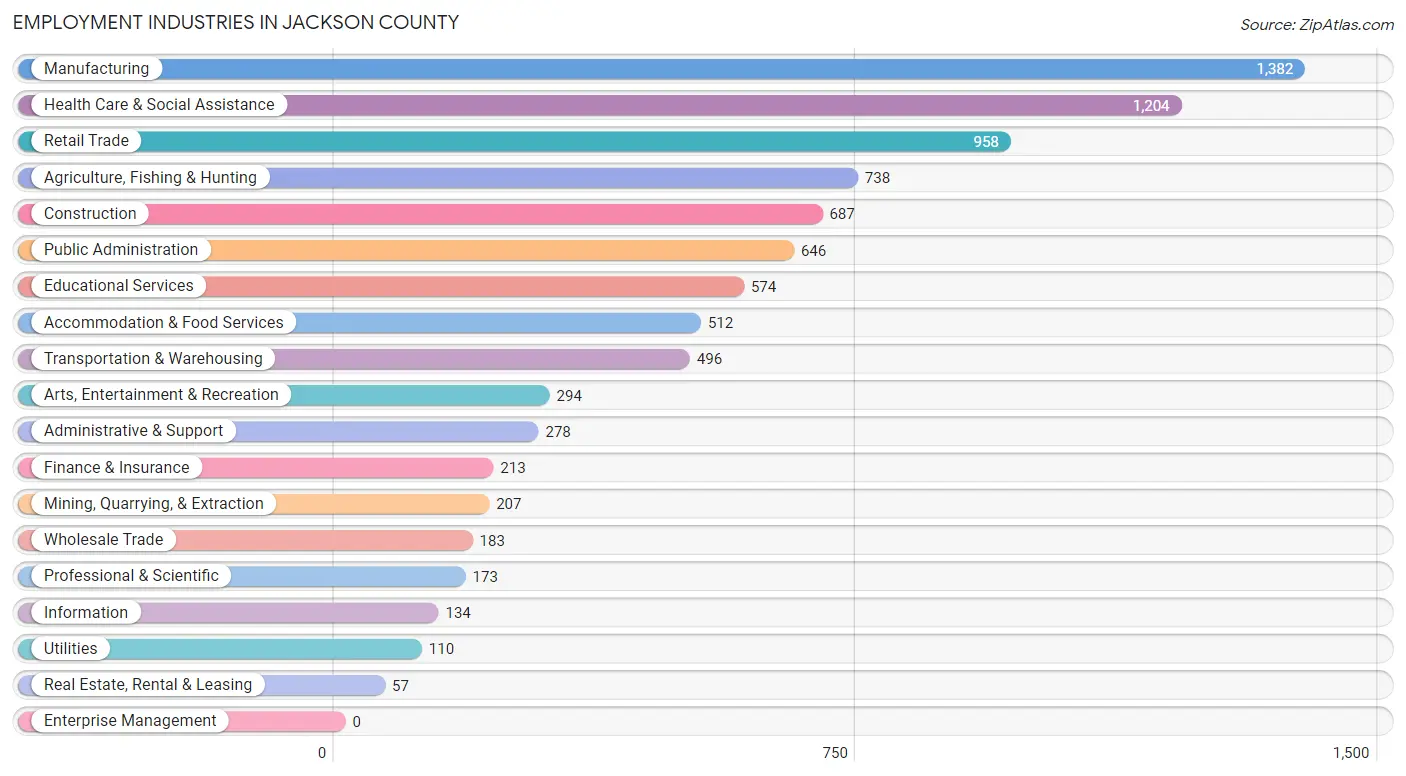
Employment Industries in Jackson County
The major employment industries in Jackson County include Manufacturing (1,382 | 14.9%), Health Care & Social Assistance (1,204 | 13.0%), Retail Trade (958 | 10.3%), Agriculture, Fishing & Hunting (738 | 7.9%), and Construction (687 | 7.4%).
Employment Industries by Sex in Jackson County
The Jackson County industries that see more men than women are Utilities (93.6%), Mining, Quarrying, & Extraction (92.7%), and Construction (89.4%), whereas the industries that tend to have a higher number of women are Health Care & Social Assistance (84.4%), Professional & Scientific (79.2%), and Finance & Insurance (77.0%).
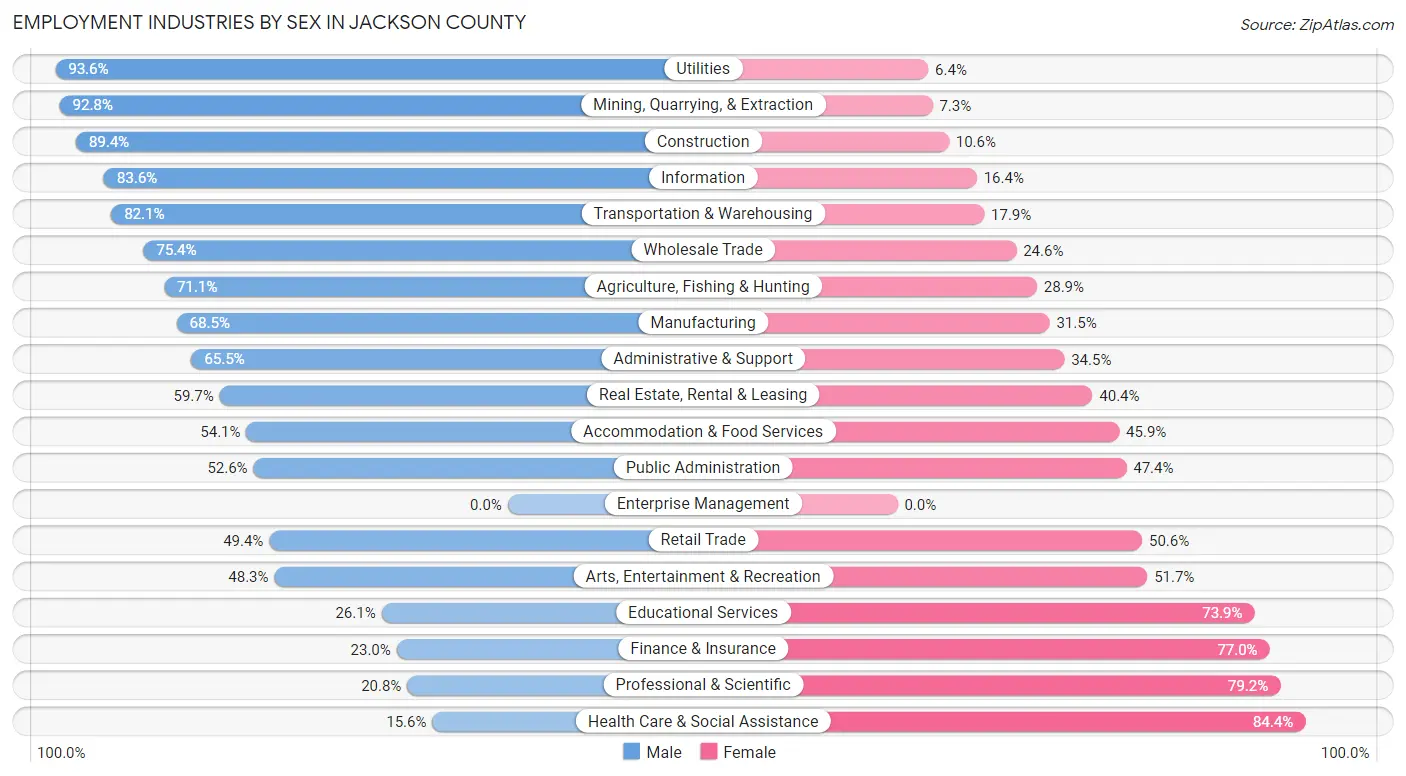
| Industry | Male | Female |
| Agriculture, Fishing & Hunting | 525 (71.1%) | 213 (28.9%) |
| Mining, Quarrying, & Extraction | 192 (92.7%) | 15 (7.2%) |
| Construction | 614 (89.4%) | 73 (10.6%) |
| Manufacturing | 947 (68.5%) | 435 (31.5%) |
| Wholesale Trade | 138 (75.4%) | 45 (24.6%) |
| Retail Trade | 473 (49.4%) | 485 (50.6%) |
| Transportation & Warehousing | 407 (82.1%) | 89 (17.9%) |
| Utilities | 103 (93.6%) | 7 (6.4%) |
| Information | 112 (83.6%) | 22 (16.4%) |
| Finance & Insurance | 49 (23.0%) | 164 (77.0%) |
| Real Estate, Rental & Leasing | 34 (59.7%) | 23 (40.4%) |
| Professional & Scientific | 36 (20.8%) | 137 (79.2%) |
| Enterprise Management | 0 (0.0%) | 0 (0.0%) |
| Administrative & Support | 182 (65.5%) | 96 (34.5%) |
| Educational Services | 150 (26.1%) | 424 (73.9%) |
| Health Care & Social Assistance | 188 (15.6%) | 1,016 (84.4%) |
| Arts, Entertainment & Recreation | 142 (48.3%) | 152 (51.7%) |
| Accommodation & Food Services | 277 (54.1%) | 235 (45.9%) |
| Public Administration | 340 (52.6%) | 306 (47.4%) |
| Total | 5,122 (55.1%) | 4,176 (44.9%) |
Education in Jackson County
School Enrollment in Jackson County
The most common levels of schooling among the 4,191 students in Jackson County are high school (1,101 | 26.3%), elementary school (1,047 | 25.0%), and middle school (988 | 23.6%).
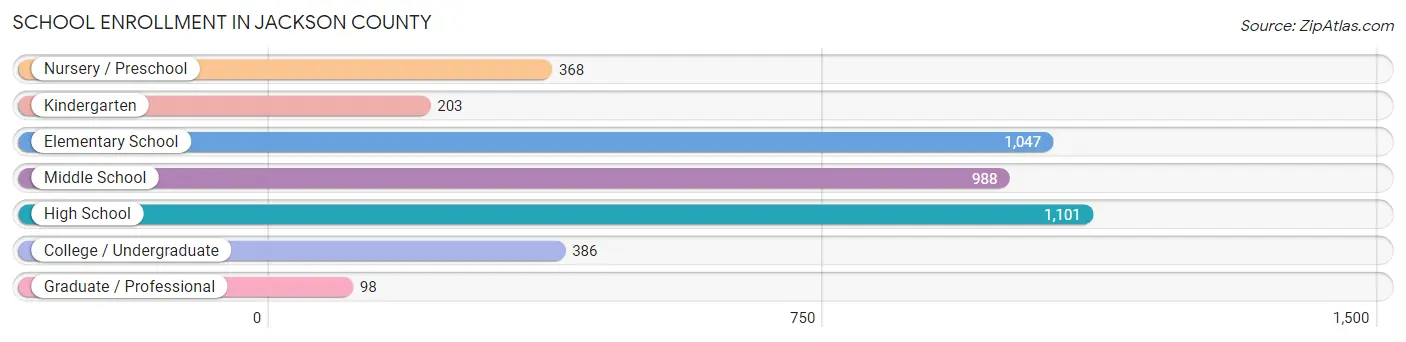
| School Level | # Students | % Students |
| Nursery / Preschool | 368 | 8.8% |
| Kindergarten | 203 | 4.8% |
| Elementary School | 1,047 | 25.0% |
| Middle School | 988 | 23.6% |
| High School | 1,101 | 26.3% |
| College / Undergraduate | 386 | 9.2% |
| Graduate / Professional | 98 | 2.3% |
| Total | 4,191 | 100.0% |
School Enrollment by Age by Funding Source in Jackson County
Out of a total of 4,191 students who are enrolled in schools in Jackson County, 386 (9.2%) attend a private institution, while the remaining 3,805 (90.8%) are enrolled in public schools. The age group of 3 to 4 year olds has the highest likelihood of being enrolled in private schools, with 57 (22.9% in the age bracket) enrolled. Conversely, the age group of 18 to 19 year olds has the lowest likelihood of being enrolled in a private school, with 218 (98.6% in the age bracket) attending a public institution.

| Age Bracket | Public School | Private School |
| 3 to 4 Year Olds | 192 (77.1%) | 57 (22.9%) |
| 5 to 9 Year Old | 1,156 (93.4%) | 81 (6.6%) |
| 10 to 14 Year Olds | 1,122 (90.3%) | 121 (9.7%) |
| 15 to 17 Year Olds | 742 (92.2%) | 63 (7.8%) |
| 18 to 19 Year Olds | 218 (98.6%) | 3 (1.4%) |
| 20 to 24 Year Olds | 87 (84.5%) | 16 (15.5%) |
| 25 to 34 Year Olds | 147 (88.5%) | 19 (11.5%) |
| 35 Years and over | 142 (85.0%) | 25 (15.0%) |
| Total | 3,805 (90.8%) | 386 (9.2%) |
Educational Attainment by Field of Study in Jackson County
Education (540 | 20.9%), business (440 | 17.0%), science & technology (335 | 12.9%), bio, nature & agricultural (311 | 12.0%), and arts & humanities (206 | 8.0%) are the most common fields of study among 2,589 individuals in Jackson County who have obtained a bachelor's degree or higher.
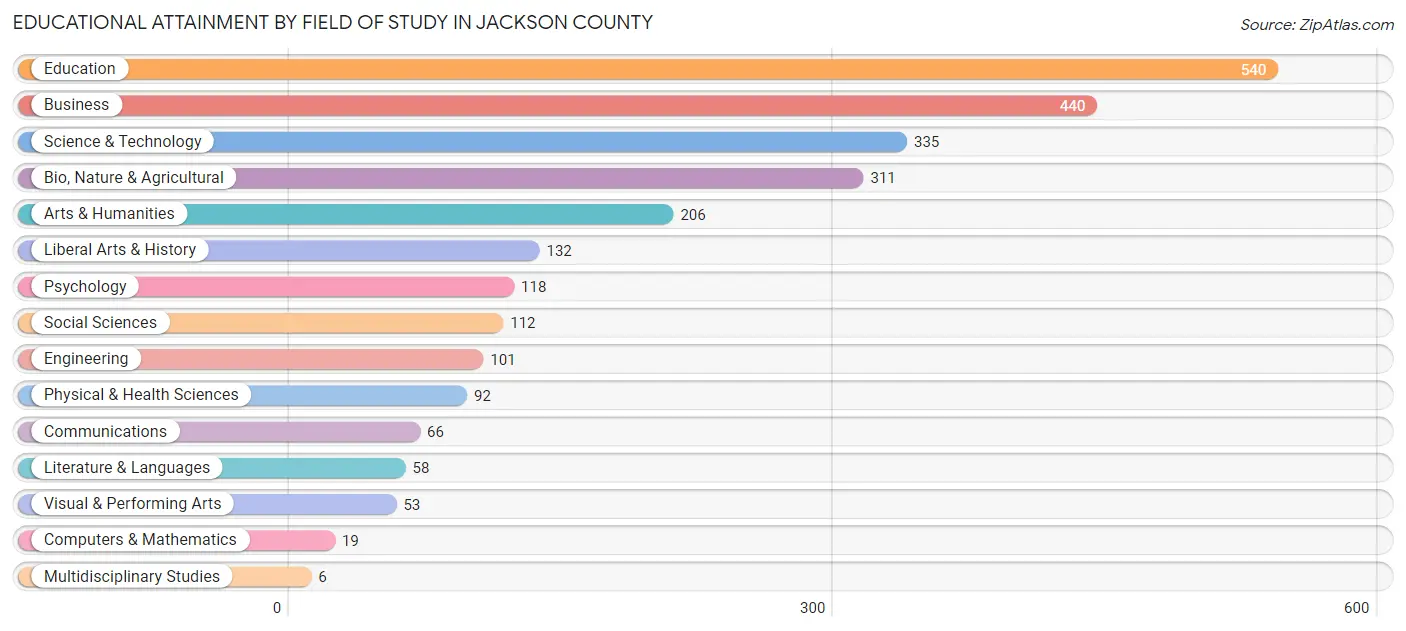
| Field of Study | # Graduates | % Graduates |
| Computers & Mathematics | 19 | 0.7% |
| Bio, Nature & Agricultural | 311 | 12.0% |
| Physical & Health Sciences | 92 | 3.5% |
| Psychology | 118 | 4.6% |
| Social Sciences | 112 | 4.3% |
| Engineering | 101 | 3.9% |
| Multidisciplinary Studies | 6 | 0.2% |
| Science & Technology | 335 | 12.9% |
| Business | 440 | 17.0% |
| Education | 540 | 20.9% |
| Literature & Languages | 58 | 2.2% |
| Liberal Arts & History | 132 | 5.1% |
| Visual & Performing Arts | 53 | 2.1% |
| Communications | 66 | 2.5% |
| Arts & Humanities | 206 | 8.0% |
| Total | 2,589 | 100.0% |
Transportation & Commute in Jackson County
Vehicle Availability by Sex in Jackson County
The most prevalent vehicle ownership categories in Jackson County are males with 2 vehicles (1,922, accounting for 38.5%) and females with 2 vehicles (1,511, making up 46.7%).

| Vehicles Available | Male | Female |
| No Vehicle | 209 (4.2%) | 146 (3.5%) |
| 1 Vehicle | 565 (11.3%) | 582 (14.1%) |
| 2 Vehicles | 1,922 (38.5%) | 1,511 (36.7%) |
| 3 Vehicles | 1,410 (28.2%) | 1,195 (29.0%) |
| 4 Vehicles | 480 (9.6%) | 433 (10.5%) |
| 5 or more Vehicles | 405 (8.1%) | 250 (6.1%) |
| Total | 4,991 (100.0%) | 4,117 (100.0%) |
Commute Time in Jackson County
The most frequently occuring commute durations in Jackson County are 5 to 9 minutes (1,271 commuters, 15.0%), 15 to 19 minutes (1,086 commuters, 12.8%), and 20 to 24 minutes (1,036 commuters, 12.2%).
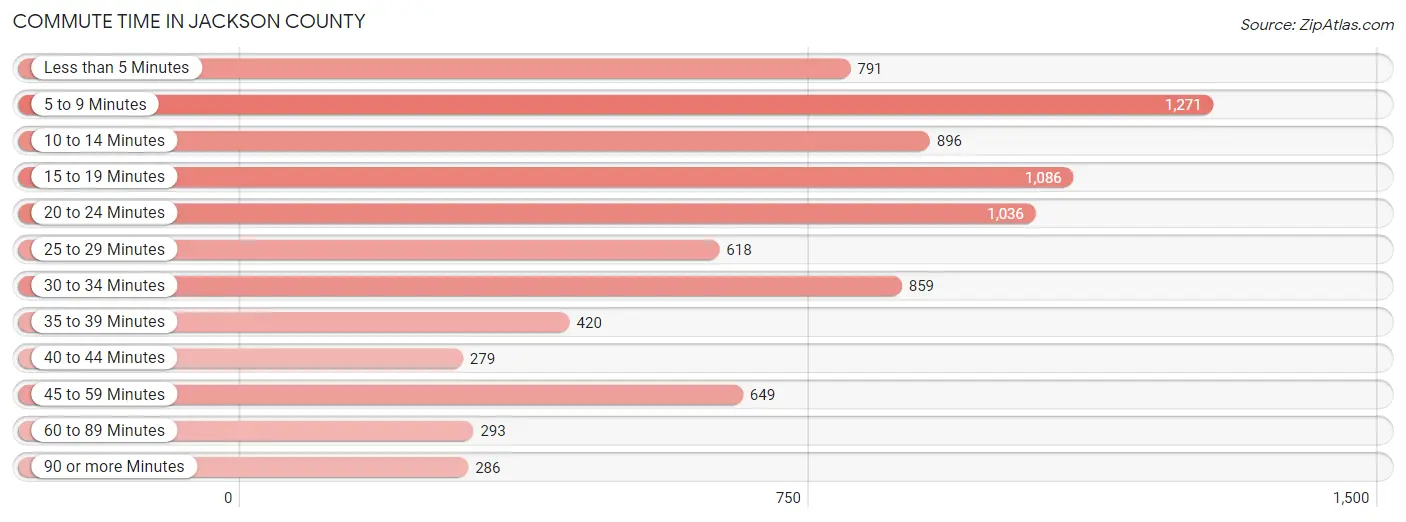
| Commute Time | # Commuters | % Commuters |
| Less than 5 Minutes | 791 | 9.3% |
| 5 to 9 Minutes | 1,271 | 15.0% |
| 10 to 14 Minutes | 896 | 10.6% |
| 15 to 19 Minutes | 1,086 | 12.8% |
| 20 to 24 Minutes | 1,036 | 12.2% |
| 25 to 29 Minutes | 618 | 7.3% |
| 30 to 34 Minutes | 859 | 10.1% |
| 35 to 39 Minutes | 420 | 5.0% |
| 40 to 44 Minutes | 279 | 3.3% |
| 45 to 59 Minutes | 649 | 7.6% |
| 60 to 89 Minutes | 293 | 3.5% |
| 90 or more Minutes | 286 | 3.4% |
Commute Time by Sex in Jackson County
The most common commute times in Jackson County are 5 to 9 minutes (647 commuters, 13.9%) for males and 5 to 9 minutes (624 commuters, 16.3%) for females.
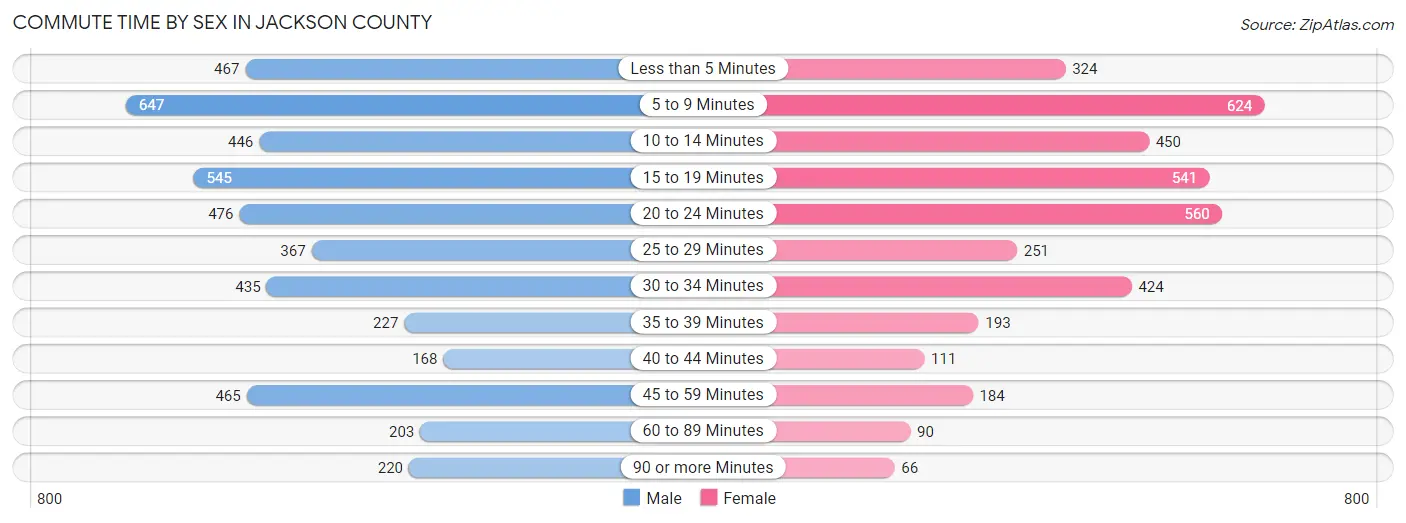
| Commute Time | Male | Female |
| Less than 5 Minutes | 467 (10.0%) | 324 (8.5%) |
| 5 to 9 Minutes | 647 (13.9%) | 624 (16.3%) |
| 10 to 14 Minutes | 446 (9.6%) | 450 (11.8%) |
| 15 to 19 Minutes | 545 (11.7%) | 541 (14.2%) |
| 20 to 24 Minutes | 476 (10.2%) | 560 (14.7%) |
| 25 to 29 Minutes | 367 (7.9%) | 251 (6.6%) |
| 30 to 34 Minutes | 435 (9.3%) | 424 (11.1%) |
| 35 to 39 Minutes | 227 (4.9%) | 193 (5.1%) |
| 40 to 44 Minutes | 168 (3.6%) | 111 (2.9%) |
| 45 to 59 Minutes | 465 (10.0%) | 184 (4.8%) |
| 60 to 89 Minutes | 203 (4.3%) | 90 (2.4%) |
| 90 or more Minutes | 220 (4.7%) | 66 (1.7%) |
Time of Departure to Work by Sex in Jackson County
The most frequent times of departure to work in Jackson County are 12:00 AM to 4:59 AM (663, 14.2%) for males and 7:00 AM to 7:29 AM (792, 20.7%) for females.
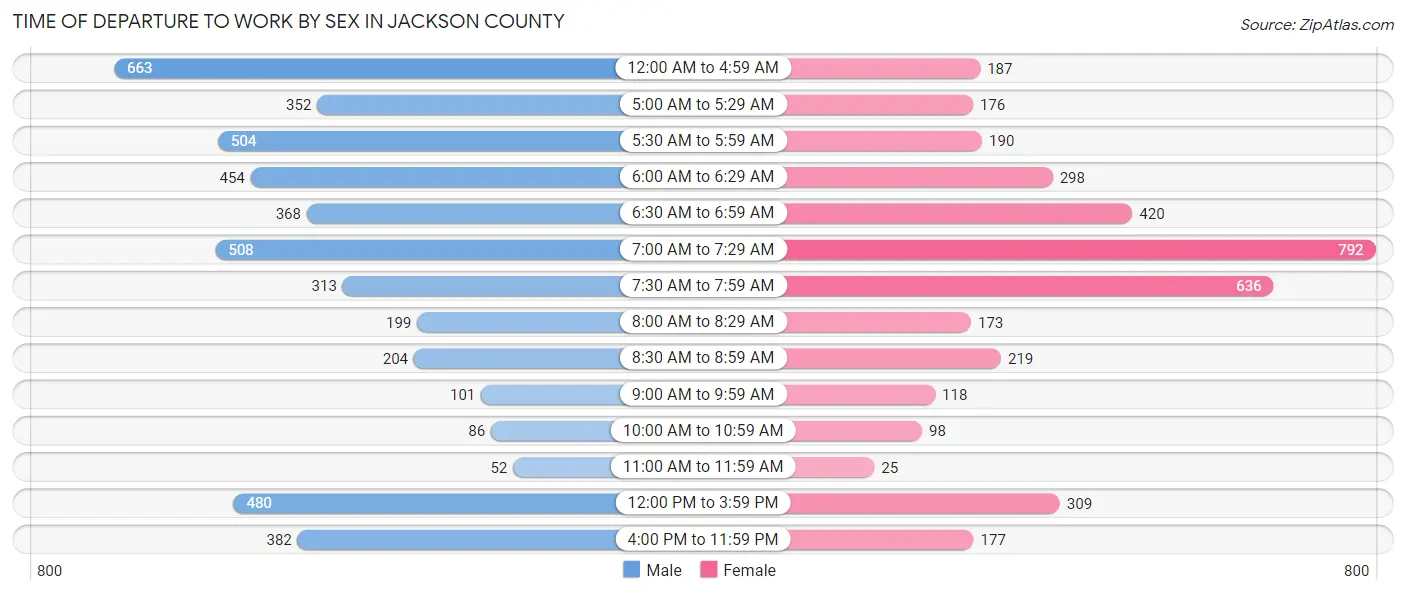
| Time of Departure | Male | Female |
| 12:00 AM to 4:59 AM | 663 (14.2%) | 187 (4.9%) |
| 5:00 AM to 5:29 AM | 352 (7.5%) | 176 (4.6%) |
| 5:30 AM to 5:59 AM | 504 (10.8%) | 190 (5.0%) |
| 6:00 AM to 6:29 AM | 454 (9.7%) | 298 (7.8%) |
| 6:30 AM to 6:59 AM | 368 (7.9%) | 420 (11.0%) |
| 7:00 AM to 7:29 AM | 508 (10.9%) | 792 (20.7%) |
| 7:30 AM to 7:59 AM | 313 (6.7%) | 636 (16.7%) |
| 8:00 AM to 8:29 AM | 199 (4.3%) | 173 (4.5%) |
| 8:30 AM to 8:59 AM | 204 (4.4%) | 219 (5.7%) |
| 9:00 AM to 9:59 AM | 101 (2.2%) | 118 (3.1%) |
| 10:00 AM to 10:59 AM | 86 (1.8%) | 98 (2.6%) |
| 11:00 AM to 11:59 AM | 52 (1.1%) | 25 (0.6%) |
| 12:00 PM to 3:59 PM | 480 (10.3%) | 309 (8.1%) |
| 4:00 PM to 11:59 PM | 382 (8.2%) | 177 (4.6%) |
| Total | 4,666 (100.0%) | 3,818 (100.0%) |
Housing Occupancy in Jackson County
Occupancy by Ownership in Jackson County
Of the total 7,990 dwellings in Jackson County, owner-occupied units account for 6,040 (75.6%), while renter-occupied units make up 1,950 (24.4%).
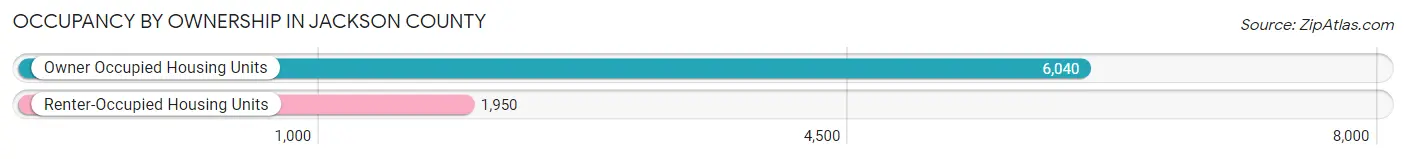
| Occupancy | # Housing Units | % Housing Units |
| Owner Occupied Housing Units | 6,040 | 75.6% |
| Renter-Occupied Housing Units | 1,950 | 24.4% |
| Total Occupied Housing Units | 7,990 | 100.0% |
Occupancy by Household Size in Jackson County

| Household Size | # Housing Units | % Housing Units |
| 1-Person Household | 2,529 | 31.7% |
| 2-Person Household | 2,924 | 36.6% |
| 3-Person Household | 973 | 12.2% |
| 4+ Person Household | 1,564 | 19.6% |
| Total Housing Units | 7,990 | 100.0% |
Occupancy by Ownership by Household Size in Jackson County
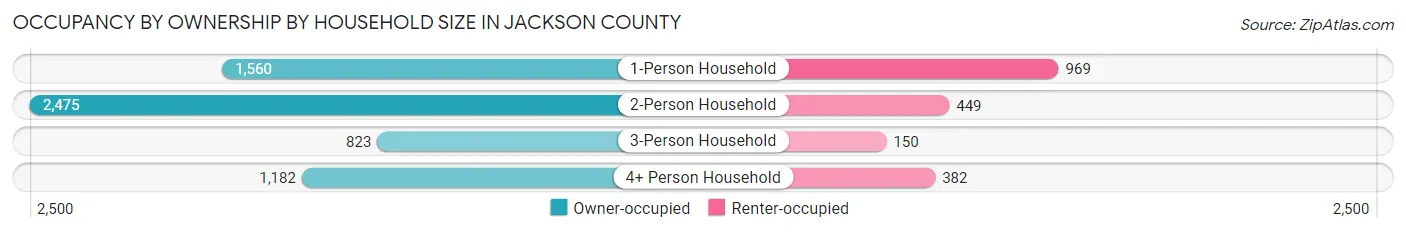
| Household Size | Owner-occupied | Renter-occupied |
| 1-Person Household | 1,560 (61.7%) | 969 (38.3%) |
| 2-Person Household | 2,475 (84.6%) | 449 (15.4%) |
| 3-Person Household | 823 (84.6%) | 150 (15.4%) |
| 4+ Person Household | 1,182 (75.6%) | 382 (24.4%) |
| Total Housing Units | 6,040 (75.6%) | 1,950 (24.4%) |
Occupancy by Educational Attainment in Jackson County
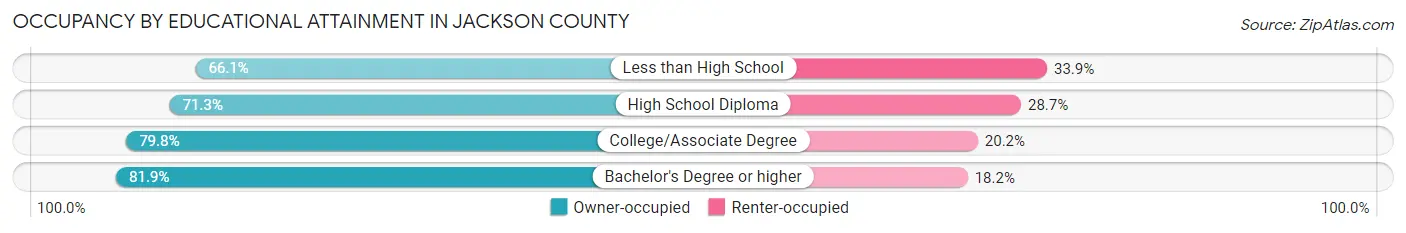
| Household Size | Owner-occupied | Renter-occupied |
| Less than High School | 363 (66.1%) | 186 (33.9%) |
| High School Diploma | 2,426 (71.3%) | 978 (28.7%) |
| College/Associate Degree | 2,119 (79.8%) | 535 (20.2%) |
| Bachelor's Degree or higher | 1,132 (81.9%) | 251 (18.1%) |
Occupancy by Age of Householder in Jackson County
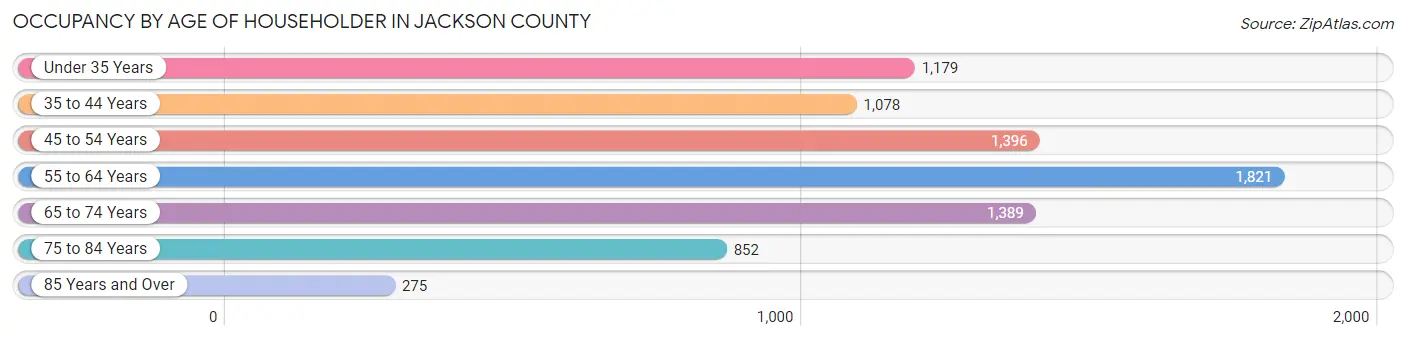
| Age Bracket | # Households | % Households |
| Under 35 Years | 1,179 | 14.8% |
| 35 to 44 Years | 1,078 | 13.5% |
| 45 to 54 Years | 1,396 | 17.5% |
| 55 to 64 Years | 1,821 | 22.8% |
| 65 to 74 Years | 1,389 | 17.4% |
| 75 to 84 Years | 852 | 10.7% |
| 85 Years and Over | 275 | 3.4% |
| Total | 7,990 | 100.0% |
Housing Finances in Jackson County
Median Income by Occupancy in Jackson County
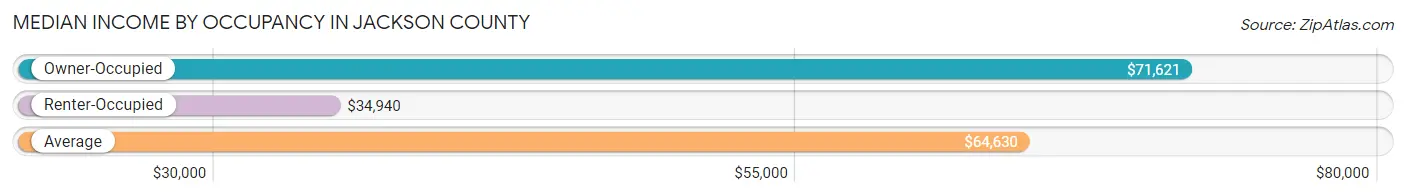
| Occupancy Type | # Households | Median Income |
| Owner-Occupied | 6,040 (75.6%) | $71,621 |
| Renter-Occupied | 1,950 (24.4%) | $34,940 |
| Average | 7,990 (100.0%) | $64,630 |
Occupancy by Householder Income Bracket in Jackson County

| Income Bracket | Owner-occupied | Renter-occupied |
| Less than $5,000 | 90 (1.5%) | 104 (5.3%) |
| $5,000 to $9,999 | 134 (2.2%) | 54 (2.8%) |
| $10,000 to $14,999 | 143 (2.4%) | 339 (17.4%) |
| $15,000 to $19,999 | 217 (3.6%) | 106 (5.4%) |
| $20,000 to $24,999 | 190 (3.2%) | 200 (10.3%) |
| $25,000 to $34,999 | 508 (8.4%) | 173 (8.9%) |
| $35,000 to $49,999 | 615 (10.2%) | 265 (13.6%) |
| $50,000 to $74,999 | 1,243 (20.6%) | 315 (16.2%) |
| $75,000 to $99,999 | 921 (15.2%) | 187 (9.6%) |
| $100,000 to $149,999 | 1,231 (20.4%) | 64 (3.3%) |
| $150,000 or more | 748 (12.4%) | 143 (7.3%) |
| Total | 6,040 (100.0%) | 1,950 (100.0%) |
Monthly Housing Cost Tiers in Jackson County

| Monthly Cost | Owner-occupied | Renter-occupied |
| Less than $300 | 164 (2.7%) | 137 (7.0%) |
| $300 to $499 | 663 (11.0%) | 236 (12.1%) |
| $500 to $799 | 1,448 (24.0%) | 575 (29.5%) |
| $800 to $999 | 999 (16.5%) | 424 (21.7%) |
| $1,000 to $1,499 | 1,347 (22.3%) | 227 (11.6%) |
| $1,500 to $1,999 | 695 (11.5%) | 35 (1.8%) |
| $2,000 to $2,499 | 377 (6.2%) | 2 (0.1%) |
| $2,500 to $2,999 | 194 (3.2%) | 0 (0.0%) |
| $3,000 or more | 153 (2.5%) | 0 (0.0%) |
| Total | 6,040 (100.0%) | 1,950 (100.0%) |
Physical Housing Characteristics in Jackson County
Housing Structures in Jackson County

| Structure Type | # Housing Units | % Housing Units |
| Single Unit, Detached | 6,345 | 79.4% |
| Single Unit, Attached | 108 | 1.3% |
| 2 Unit Apartments | 164 | 2.1% |
| 3 or 4 Unit Apartments | 151 | 1.9% |
| 5 to 9 Unit Apartments | 175 | 2.2% |
| 10 or more Apartments | 306 | 3.8% |
| Mobile Home / Other | 741 | 9.3% |
| Total | 7,990 | 100.0% |
Housing Structures by Occupancy in Jackson County
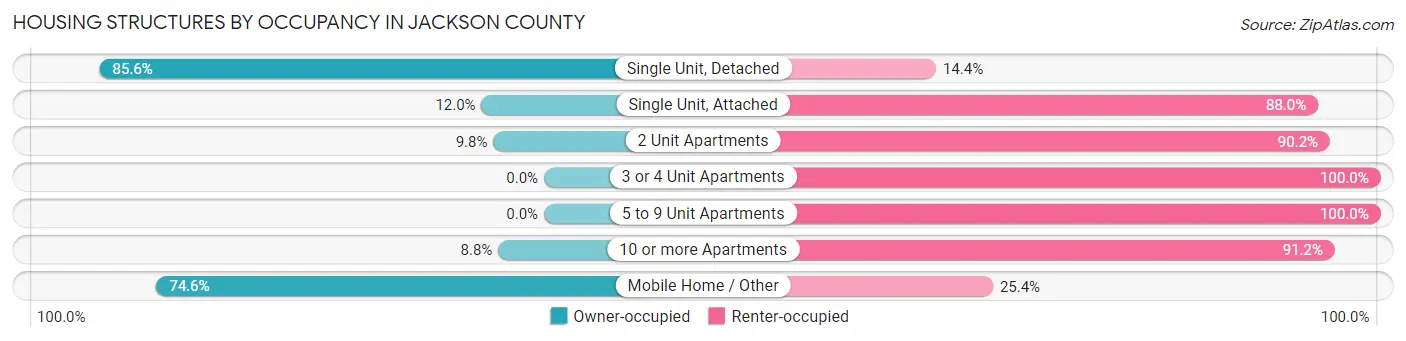
| Structure Type | Owner-occupied | Renter-occupied |
| Single Unit, Detached | 5,431 (85.6%) | 914 (14.4%) |
| Single Unit, Attached | 13 (12.0%) | 95 (88.0%) |
| 2 Unit Apartments | 16 (9.8%) | 148 (90.2%) |
| 3 or 4 Unit Apartments | 0 (0.0%) | 151 (100.0%) |
| 5 to 9 Unit Apartments | 0 (0.0%) | 175 (100.0%) |
| 10 or more Apartments | 27 (8.8%) | 279 (91.2%) |
| Mobile Home / Other | 553 (74.6%) | 188 (25.4%) |
| Total | 6,040 (75.6%) | 1,950 (24.4%) |
Housing Structures by Number of Rooms in Jackson County
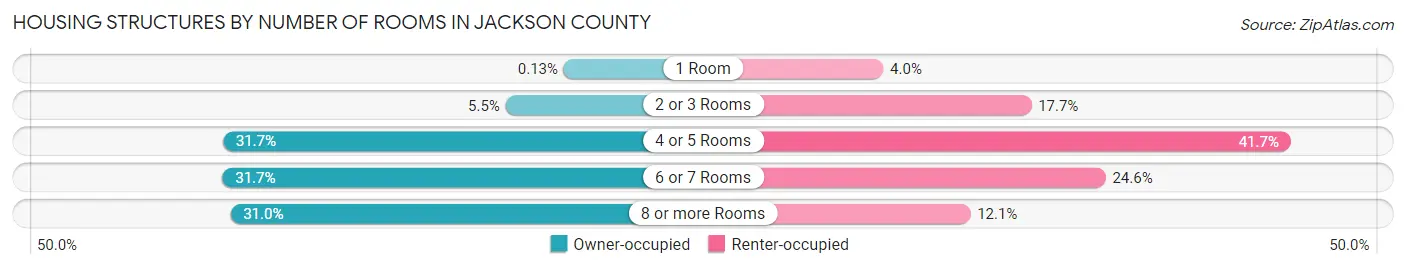
| Number of Rooms | Owner-occupied | Renter-occupied |
| 1 Room | 8 (0.1%) | 78 (4.0%) |
| 2 or 3 Rooms | 333 (5.5%) | 345 (17.7%) |
| 4 or 5 Rooms | 1,913 (31.7%) | 813 (41.7%) |
| 6 or 7 Rooms | 1,915 (31.7%) | 479 (24.6%) |
| 8 or more Rooms | 1,871 (31.0%) | 235 (12.0%) |
| Total | 6,040 (100.0%) | 1,950 (100.0%) |
Housing Structure by Heating Type in Jackson County

| Heating Type | Owner-occupied | Renter-occupied |
| Utility Gas | 1,822 (30.2%) | 725 (37.2%) |
| Bottled, Tank, or LP Gas | 2,605 (43.1%) | 376 (19.3%) |
| Electricity | 509 (8.4%) | 698 (35.8%) |
| Fuel Oil or Kerosene | 168 (2.8%) | 53 (2.7%) |
| Coal or Coke | 0 (0.0%) | 0 (0.0%) |
| All other Fuels | 910 (15.1%) | 97 (5.0%) |
| No Fuel Used | 26 (0.4%) | 1 (0.1%) |
| Total | 6,040 (100.0%) | 1,950 (100.0%) |
Household Vehicle Usage in Jackson County
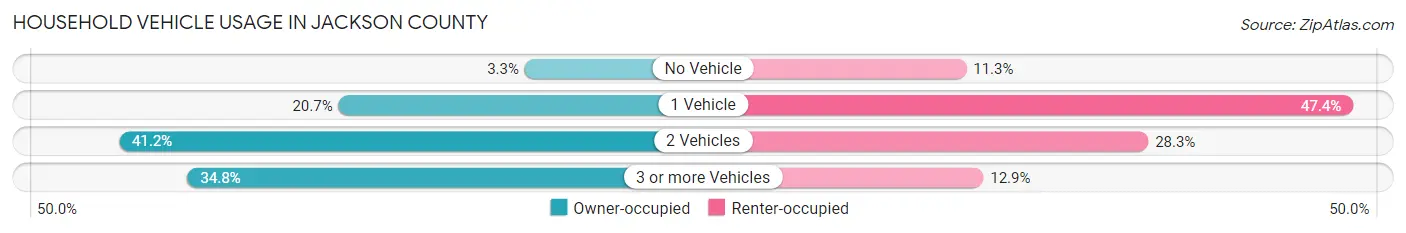
| Vehicles per Household | Owner-occupied | Renter-occupied |
| No Vehicle | 200 (3.3%) | 221 (11.3%) |
| 1 Vehicle | 1,250 (20.7%) | 925 (47.4%) |
| 2 Vehicles | 2,488 (41.2%) | 552 (28.3%) |
| 3 or more Vehicles | 2,102 (34.8%) | 252 (12.9%) |
| Total | 6,040 (100.0%) | 1,950 (100.0%) |
Real Estate & Mortgages in Jackson County
Real Estate and Mortgage Overview in Jackson County
| Characteristic | Without Mortgage | With Mortgage |
| Housing Units | 2,537 | 3,503 |
| Median Property Value | $172,100 | $168,100 |
| Median Household Income | $62,219 | $534 |
| Monthly Housing Costs | $604 | $145 |
| Real Estate Taxes | $2,691 | $91 |
Property Value by Mortgage Status in Jackson County
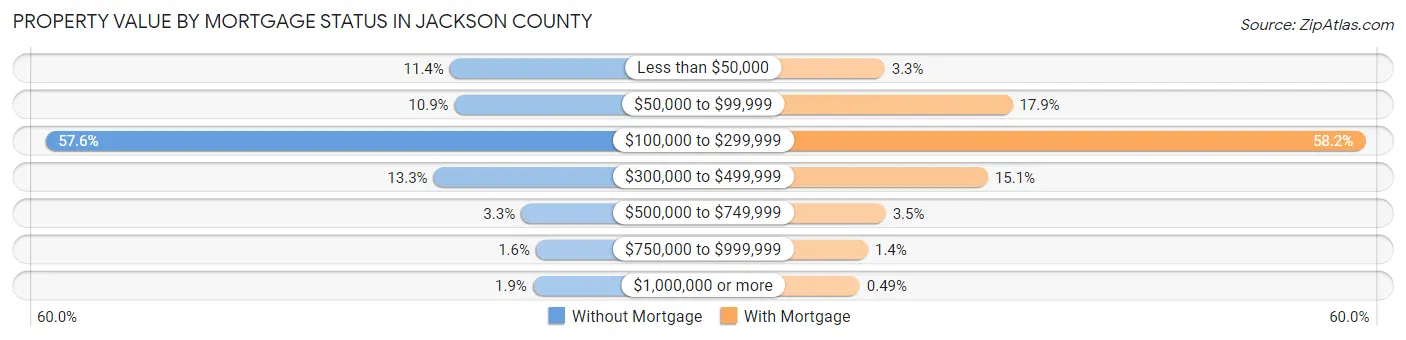
| Property Value | Without Mortgage | With Mortgage |
| Less than $50,000 | 290 (11.4%) | 117 (3.3%) |
| $50,000 to $99,999 | 276 (10.9%) | 628 (17.9%) |
| $100,000 to $299,999 | 1,462 (57.6%) | 2,040 (58.2%) |
| $300,000 to $499,999 | 337 (13.3%) | 530 (15.1%) |
| $500,000 to $749,999 | 83 (3.3%) | 121 (3.5%) |
| $750,000 to $999,999 | 40 (1.6%) | 50 (1.4%) |
| $1,000,000 or more | 49 (1.9%) | 17 (0.5%) |
| Total | 2,537 (100.0%) | 3,503 (100.0%) |
Household Income by Mortgage Status in Jackson County

| Household Income | Without Mortgage | With Mortgage |
| Less than $10,000 | 136 (5.4%) | 109 (3.1%) |
| $10,000 to $24,999 | 275 (10.8%) | 88 (2.5%) |
| $25,000 to $34,999 | 274 (10.8%) | 275 (7.9%) |
| $35,000 to $49,999 | 319 (12.6%) | 234 (6.7%) |
| $50,000 to $74,999 | 565 (22.3%) | 296 (8.5%) |
| $75,000 to $99,999 | 380 (15.0%) | 678 (19.4%) |
| $100,000 to $149,999 | 374 (14.7%) | 541 (15.4%) |
| $150,000 or more | 214 (8.4%) | 857 (24.5%) |
| Total | 2,537 (100.0%) | 3,503 (100.0%) |
Property Value to Household Income Ratio in Jackson County
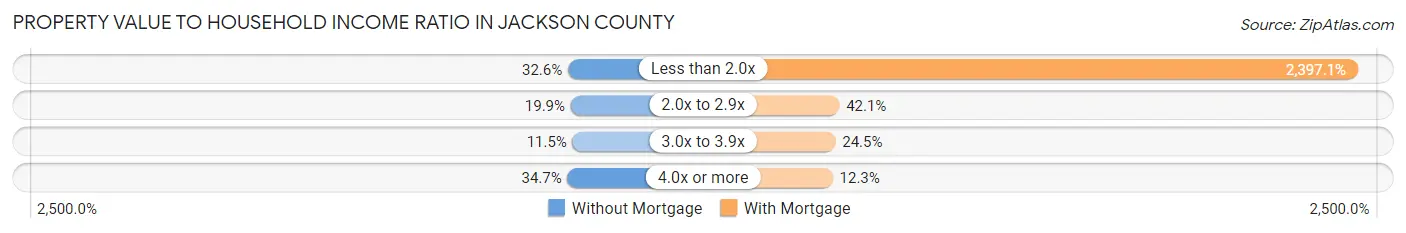
| Value-to-Income Ratio | Without Mortgage | With Mortgage |
| Less than 2.0x | 827 (32.6%) | 83,969 (2,397.1%) |
| 2.0x to 2.9x | 506 (19.9%) | 1,476 (42.1%) |
| 3.0x to 3.9x | 291 (11.5%) | 858 (24.5%) |
| 4.0x or more | 881 (34.7%) | 431 (12.3%) |
| Total | 2,537 (100.0%) | 3,503 (100.0%) |
Real Estate Taxes by Mortgage Status in Jackson County

| Property Taxes | Without Mortgage | With Mortgage |
| Less than $800 | 214 (8.4%) | 8 (0.2%) |
| $800 to $1,499 | 271 (10.7%) | 153 (4.4%) |
| $800 to $1,499 | 1,937 (76.3%) | 482 (13.8%) |
| Total | 2,537 (100.0%) | 3,503 (100.0%) |
Health & Disability in Jackson County
Health Insurance Coverage by Age in Jackson County

| Age Bracket | With Coverage | Without Coverage |
| Under 6 Years | 1,312 (92.3%) | 109 (7.7%) |
| 6 to 18 Years | 3,164 (94.5%) | 186 (5.6%) |
| 19 to 25 Years | 1,204 (85.6%) | 202 (14.4%) |
| 26 to 34 Years | 1,694 (83.6%) | 332 (16.4%) |
| 35 to 44 Years | 2,038 (92.0%) | 178 (8.0%) |
| 45 to 54 Years | 2,191 (89.2%) | 266 (10.8%) |
| 55 to 64 Years | 2,862 (93.0%) | 214 (7.0%) |
| 65 to 74 Years | 2,317 (99.9%) | 2 (0.1%) |
| 75 Years and older | 1,592 (100.0%) | 0 (0.0%) |
| Total | 18,374 (92.5%) | 1,489 (7.5%) |
Health Insurance Coverage by Citizenship Status in Jackson County

| Citizenship Status | With Coverage | Without Coverage |
| Native Born | 1,312 (92.3%) | 109 (7.7%) |
| Foreign Born, Citizen | 3,164 (94.5%) | 186 (5.6%) |
| Foreign Born, not a Citizen | 1,204 (85.6%) | 202 (14.4%) |
Health Insurance Coverage by Household Income in Jackson County
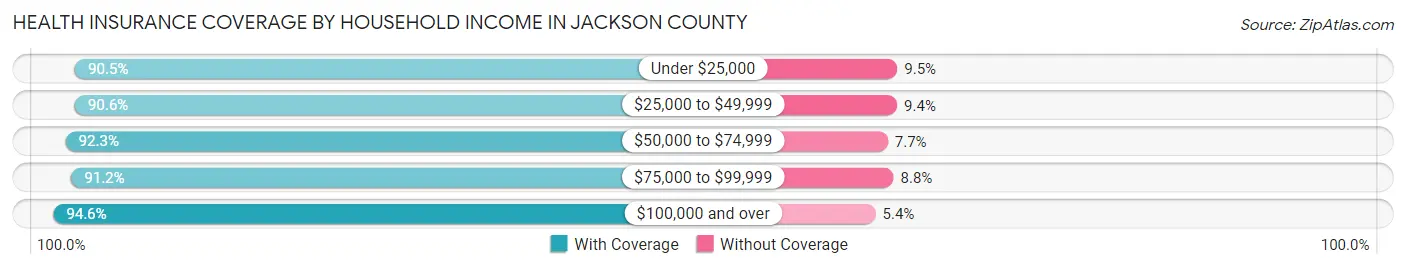
| Household Income | With Coverage | Without Coverage |
| Under $25,000 | 2,083 (90.5%) | 218 (9.5%) |
| $25,000 to $49,999 | 2,979 (90.6%) | 310 (9.4%) |
| $50,000 to $74,999 | 3,780 (92.3%) | 315 (7.7%) |
| $75,000 to $99,999 | 2,808 (91.2%) | 270 (8.8%) |
| $100,000 and over | 6,593 (94.6%) | 376 (5.4%) |
Public vs Private Health Insurance Coverage by Age in Jackson County

| Age Bracket | Public Insurance | Private Insurance |
| Under 6 | 638 (44.9%) | 761 (53.5%) |
| 6 to 18 Years | 1,383 (41.3%) | 2,004 (59.8%) |
| 19 to 25 Years | 300 (21.3%) | 957 (68.1%) |
| 25 to 34 Years | 461 (22.8%) | 1,343 (66.3%) |
| 35 to 44 Years | 587 (26.5%) | 1,547 (69.8%) |
| 45 to 54 Years | 633 (25.8%) | 1,694 (69.0%) |
| 55 to 64 Years | 721 (23.4%) | 2,334 (75.9%) |
| 65 to 74 Years | 2,281 (98.4%) | 1,496 (64.5%) |
| 75 Years and over | 1,568 (98.5%) | 1,105 (69.4%) |
| Total | 8,572 (43.2%) | 13,241 (66.7%) |
Disability Status by Sex by Age in Jackson County
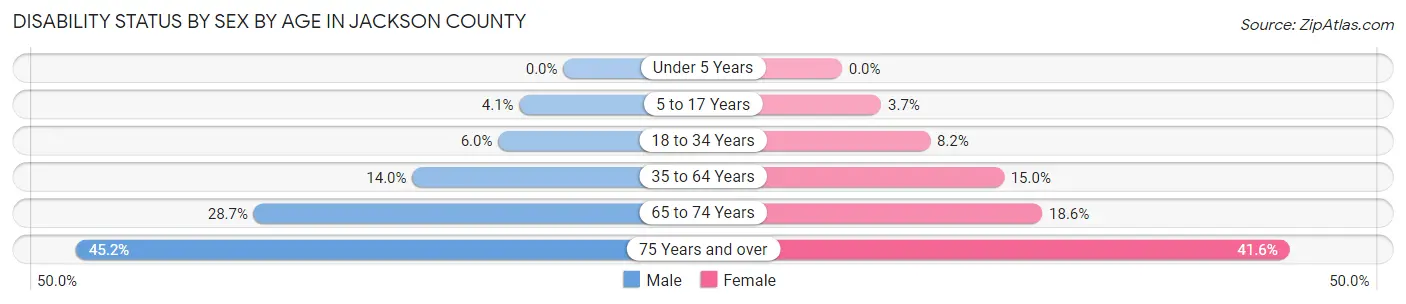
| Age Bracket | Male | Female |
| Under 5 Years | 0 (0.0%) | 0 (0.0%) |
| 5 to 17 Years | 71 (4.1%) | 58 (3.6%) |
| 18 to 34 Years | 125 (6.0%) | 132 (8.2%) |
| 35 to 64 Years | 561 (14.0%) | 563 (15.0%) |
| 65 to 74 Years | 337 (28.7%) | 213 (18.6%) |
| 75 Years and over | 337 (45.2%) | 352 (41.6%) |
Disability Class by Sex by Age in Jackson County
Disability Class: Hearing Difficulty
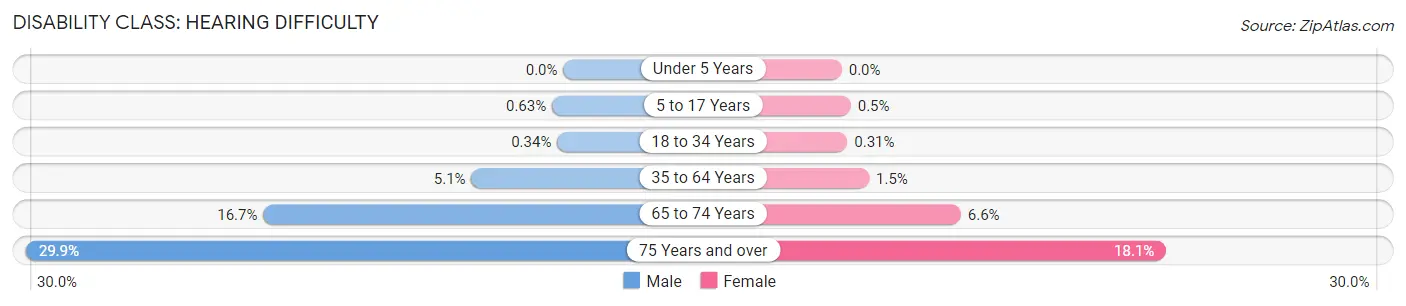
| Age Bracket | Male | Female |
| Under 5 Years | 0 (0.0%) | 0 (0.0%) |
| 5 to 17 Years | 11 (0.6%) | 8 (0.5%) |
| 18 to 34 Years | 7 (0.3%) | 5 (0.3%) |
| 35 to 64 Years | 205 (5.1%) | 57 (1.5%) |
| 65 to 74 Years | 196 (16.7%) | 76 (6.6%) |
| 75 Years and over | 223 (29.9%) | 153 (18.1%) |
Disability Class: Vision Difficulty
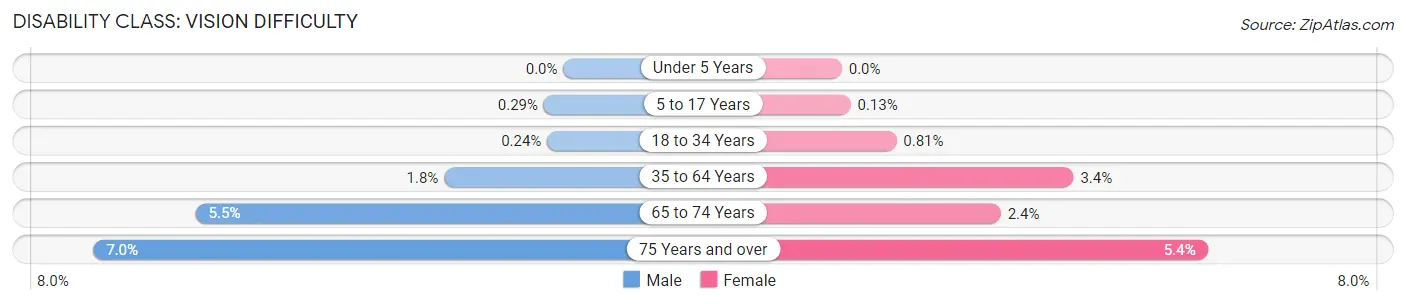
| Age Bracket | Male | Female |
| Under 5 Years | 0 (0.0%) | 0 (0.0%) |
| 5 to 17 Years | 5 (0.3%) | 2 (0.1%) |
| 18 to 34 Years | 5 (0.2%) | 13 (0.8%) |
| 35 to 64 Years | 71 (1.8%) | 129 (3.4%) |
| 65 to 74 Years | 64 (5.5%) | 27 (2.4%) |
| 75 Years and over | 52 (7.0%) | 46 (5.4%) |
Disability Class: Cognitive Difficulty
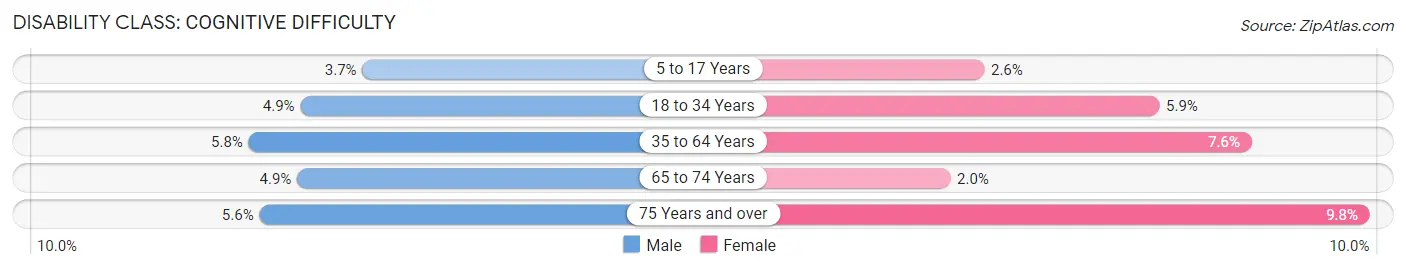
| Age Bracket | Male | Female |
| 5 to 17 Years | 65 (3.7%) | 42 (2.6%) |
| 18 to 34 Years | 101 (4.9%) | 95 (5.9%) |
| 35 to 64 Years | 234 (5.8%) | 285 (7.6%) |
| 65 to 74 Years | 58 (4.9%) | 23 (2.0%) |
| 75 Years and over | 42 (5.6%) | 83 (9.8%) |
Disability Class: Ambulatory Difficulty
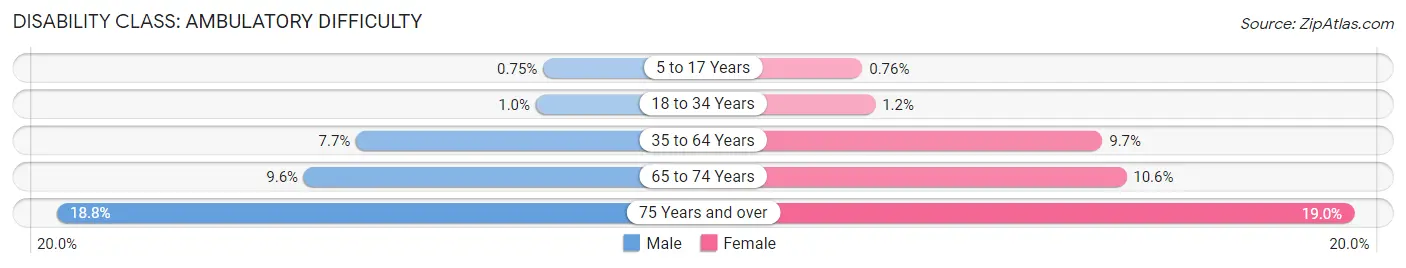
| Age Bracket | Male | Female |
| 5 to 17 Years | 13 (0.7%) | 12 (0.8%) |
| 18 to 34 Years | 21 (1.0%) | 20 (1.2%) |
| 35 to 64 Years | 308 (7.7%) | 362 (9.7%) |
| 65 to 74 Years | 113 (9.6%) | 121 (10.6%) |
| 75 Years and over | 140 (18.8%) | 161 (19.0%) |
Disability Class: Self-Care Difficulty
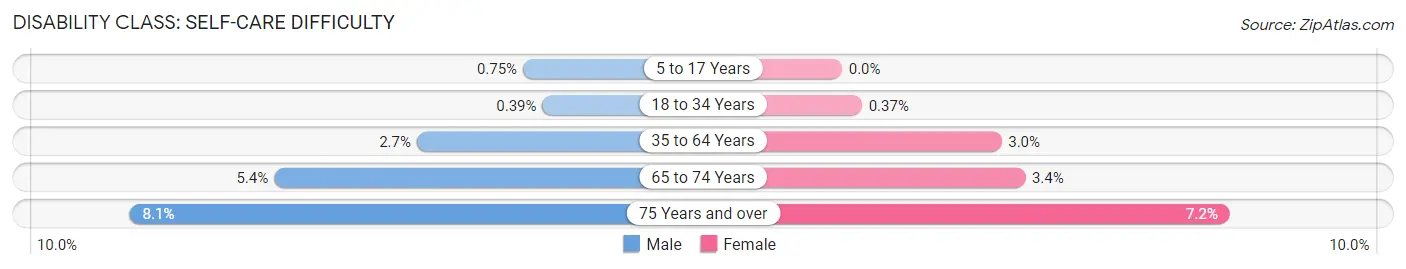
| Age Bracket | Male | Female |
| 5 to 17 Years | 13 (0.7%) | 0 (0.0%) |
| 18 to 34 Years | 8 (0.4%) | 6 (0.4%) |
| 35 to 64 Years | 109 (2.7%) | 111 (3.0%) |
| 65 to 74 Years | 63 (5.4%) | 39 (3.4%) |
| 75 Years and over | 60 (8.1%) | 61 (7.2%) |
Technology Access in Jackson County
Computing Device Access in Jackson County

| Device Type | # Households | % Households |
| Desktop or Laptop | 5,555 | 69.5% |
| Smartphone | 6,247 | 78.2% |
| Tablet | 4,101 | 51.3% |
| No Computing Device | 917 | 11.5% |
| Total | 7,990 | 100.0% |
Internet Access in Jackson County
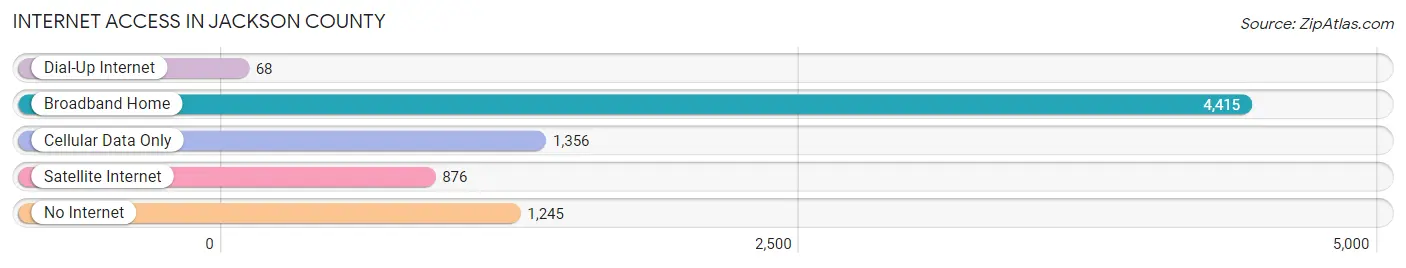
| Internet Type | # Households | % Households |
| Dial-Up Internet | 68 | 0.9% |
| Broadband Home | 4,415 | 55.3% |
| Cellular Data Only | 1,356 | 17.0% |
| Satellite Internet | 876 | 11.0% |
| No Internet | 1,245 | 15.6% |
| Total | 7,990 | 100.0% |
Jackson County Summary
Jackson County is located in the west-central part of Wisconsin, and is bordered by La Crosse County to the north, Monroe County to the east, Trempealeau County to the south, and Vernon County to the west. The county seat is Black River Falls, and the county is named after President Andrew Jackson.
History
Jackson County was established in 1853, and was originally part of Crawford County. The county was named after President Andrew Jackson, who had recently died. The first settlers in the area were mostly of German and Scandinavian descent, and they were attracted to the area by the abundance of timber and the potential for farming.
The first county seat was established in 1854 in the town of Black River Falls, and the first courthouse was built in 1856. The county was officially organized in 1858, and the first county board meeting was held in 1859.
The county experienced rapid growth in the late 19th century, as the lumber industry boomed and the population increased. The county was also home to several small towns, including Millston, Taylor, and Merrillan.
Geography
Jackson County is located in the west-central part of Wisconsin, and is bordered by La Crosse County to the north, Monroe County to the east, Trempealeau County to the south, and Vernon County to the west. The county covers an area of 576 square miles, and is home to several rivers, including the Black River, the La Crosse River, and the Trempealeau River.
The county is mostly rural, with the majority of the land being used for farming and forestry. The terrain is mostly rolling hills, with some areas of flat land. The highest point in the county is located in the town of Millston, at an elevation of 1,092 feet.
Economy
The economy of Jackson County is largely based on agriculture and forestry. The county is home to several large farms, and the majority of the land is used for growing crops such as corn, soybeans, and hay. The county is also home to several large timber companies, and the lumber industry is a major contributor to the local economy.
In addition to agriculture and forestry, Jackson County is home to several manufacturing companies, including a paper mill in Black River Falls and a cheese factory in Millston. The county is also home to several small businesses, including restaurants, retail stores, and service providers.
Demographics
As of the 2010 census, Jackson County had a population of 20,638. The population is mostly white (96.3%), with small percentages of African American (1.2%), Native American (0.7%), Asian (0.4%), and Hispanic or Latino (1.2%) residents.
The median household income in the county is $45,945, and the median family income is $54,945. The per capita income is $22,845, and the poverty rate is 11.3%. The unemployment rate is 4.2%.
Conclusion
Jackson County is a rural county located in the west-central part of Wisconsin. The county is home to several rivers, and the majority of the land is used for farming and forestry. The economy is largely based on agriculture and forestry, and the county is also home to several manufacturing companies and small businesses. The population is mostly white, and the median household income is $45,945.
Common Questions
What is the Total Population of Jackson County?
Total Population of Jackson County is 20,958.
What is the Total Male Population of Jackson County?
Total Male Population of Jackson County is 11,303.
What is the Total Female Population of Jackson County?
Total Female Population of Jackson County is 9,655.
What is the Ratio of Males per 100 Females in Jackson County?
There are 117.07 Males per 100 Females in Jackson County.
What is the Ratio of Females per 100 Males in Jackson County?
There are 85.42 Females per 100 Males in Jackson County.
What is the Median Population Age in Jackson County?
Median Population Age in Jackson County is 42.2 Years.
What is the Average Family Size in Jackson County
Average Family Size in Jackson County is 3.1 People.
What is the Average Household Size in Jackson County
Average Household Size in Jackson County is 2.5 People.
What is Per Capita Income in Jackson County?
Per Capita income in Jackson County is $32,659.
What is the Median Family Income in Jackson County?
Median Family Income in Jackson County is $80,986.
What is the Median Household income in Jackson County?
Median Household Income in Jackson County is $64,630.
What is Income or Wage Gap in Jackson County?
Income or Wage Gap in Jackson County is 22.3%.
Women in Jackson County earn 77.7 cents for every dollar earned by a man.
What is Family Income Deficit in Jackson County?
Family Income Deficit in Jackson County is $10,303.
Families that are below poverty line in Jackson County earn $10,303 less on average than the poverty threshold level.
What is Inequality or Gini Index in Jackson County?
Inequality or Gini Index in Jackson County is 0.45.
How Large is the Labor Force in Jackson County?
There are 9,864 People in the Labor Forcein in Jackson County.
What is the Percentage of People in the Labor Force in Jackson County?
58.1% of People are in the Labor Force in Jackson County.
What is the Unemployment Rate in Jackson County?
Unemployment Rate in Jackson County is 5.5%.