Iowa County, WI
Iowa County Map
Iowa County Overview
23,766
TOTAL POPULATION
12,060
MALE POPULATION
11,706
FEMALE POPULATION
103.02
MALES / 100 FEMALES
97.06
FEMALES / 100 MALES
43.5
MEDIAN AGE
3.0
AVG FAMILY SIZE
2.4
AVG HOUSEHOLD SIZE
$39,330
PER CAPITA INCOME
$101,563
AVG FAMILY INCOME
$79,226
AVG HOUSEHOLD INCOME
20.8%
WAGE / INCOME GAP [ % ]
79.2¢/ $1
WAGE / INCOME GAP [ $ ]
$11,306
FAMILY INCOME DEFICIT
0.40
INEQUALITY / GINI INDEX
13,273
LABOR FORCE [ PEOPLE ]
69.5%
PERCENT IN LABOR FORCE
2.4%
UNEMPLOYMENT RATE
Iowa County Area Codes
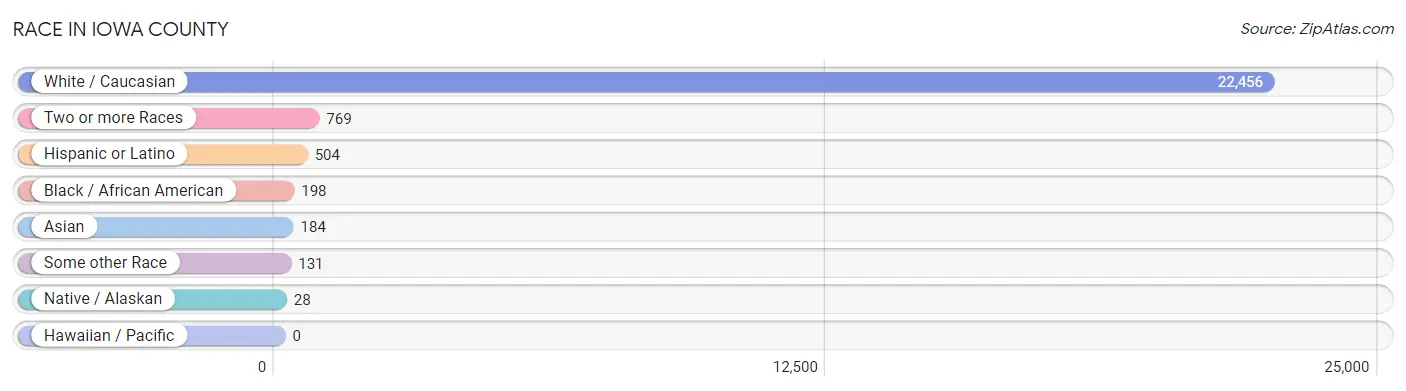
Race in Iowa County
The most populous races in Iowa County are White / Caucasian (22,456 | 94.5%), Two or more Races (769 | 3.2%), and Hispanic or Latino (504 | 2.1%).
| Race | # Population | % Population |
| Asian | 184 | 0.8% |
| Black / African American | 198 | 0.8% |
| Hawaiian / Pacific | 0 | 0.0% |
| Hispanic or Latino | 504 | 2.1% |
| Native / Alaskan | 28 | 0.1% |
| White / Caucasian | 22,456 | 94.5% |
| Two or more Races | 769 | 3.2% |
| Some other Race | 131 | 0.5% |
| Total | 23,766 | 100.0% |
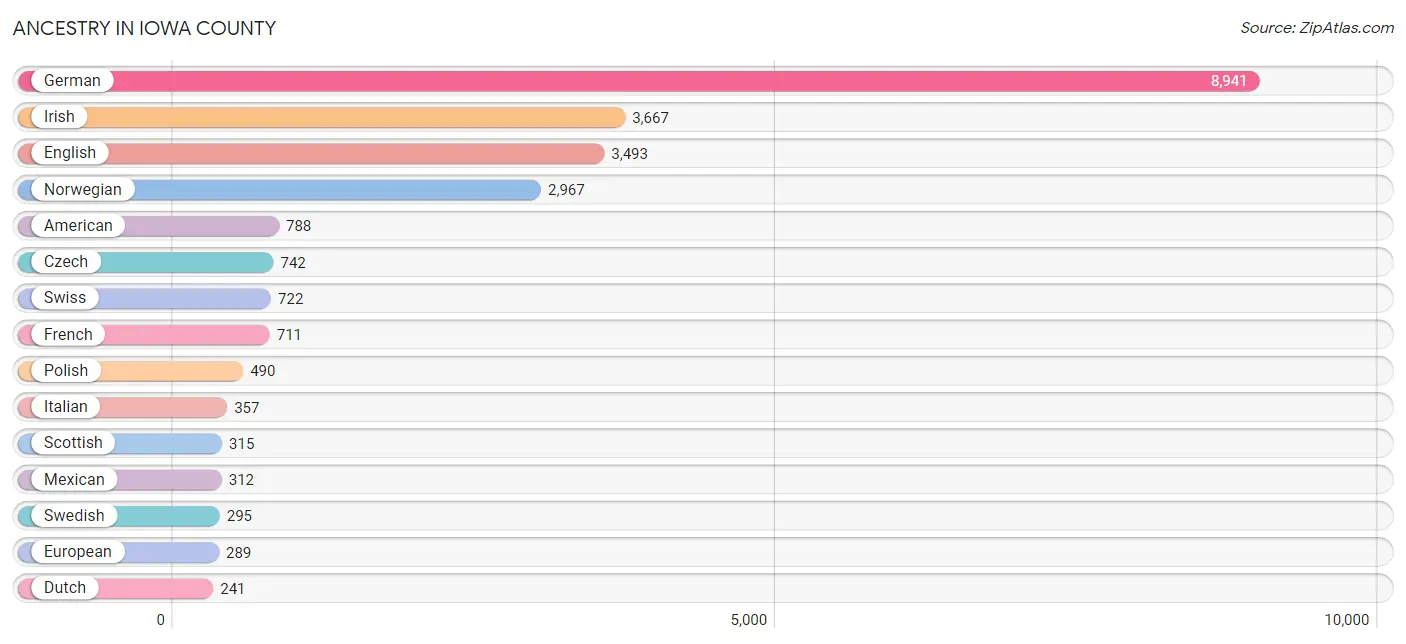
Ancestry in Iowa County
The most populous ancestries reported in Iowa County are German (8,941 | 37.6%), Irish (3,667 | 15.4%), English (3,493 | 14.7%), Norwegian (2,967 | 12.5%), and American (788 | 3.3%), together accounting for 83.6% of all Iowa County residents.
| Ancestry | # Population | % Population |
| African | 38 | 0.2% |
| American | 788 | 3.3% |
| Arab | 11 | 0.1% |
| Argentinean | 3 | 0.0% |
| Armenian | 2 | 0.0% |
| Australian | 5 | 0.0% |
| Austrian | 39 | 0.2% |
| Bangladeshi | 10 | 0.0% |
| Belgian | 82 | 0.4% |
| Bhutanese | 6 | 0.0% |
| Blackfeet | 20 | 0.1% |
| Brazilian | 21 | 0.1% |
| British | 36 | 0.2% |
| Burmese | 8 | 0.0% |
| Canadian | 14 | 0.1% |
| Celtic | 2 | 0.0% |
| Central American | 81 | 0.3% |
| Cherokee | 46 | 0.2% |
| Chippewa | 21 | 0.1% |
| Costa Rican | 37 | 0.2% |
| Croatian | 5 | 0.0% |
| Cuban | 16 | 0.1% |
| Czech | 742 | 3.1% |
| Czechoslovakian | 53 | 0.2% |
| Danish | 126 | 0.5% |
| Dutch | 241 | 1.0% |
| Eastern European | 47 | 0.2% |
| English | 3,493 | 14.7% |
| Estonian | 17 | 0.1% |
| Ethiopian | 6 | 0.0% |
| European | 289 | 1.2% |
| Finnish | 17 | 0.1% |
| French | 711 | 3.0% |
| French Canadian | 45 | 0.2% |
| German | 8,941 | 37.6% |
| Greek | 39 | 0.2% |
| Guatemalan | 2 | 0.0% |
| Haitian | 16 | 0.1% |
| Honduran | 25 | 0.1% |
| Hungarian | 31 | 0.1% |
| Icelander | 2 | 0.0% |
| Indian (Asian) | 42 | 0.2% |
| Irish | 3,667 | 15.4% |
| Iroquois | 1 | 0.0% |
| Italian | 357 | 1.5% |
| Korean | 76 | 0.3% |
| Latvian | 8 | 0.0% |
| Lithuanian | 11 | 0.1% |
| Luxembourger | 20 | 0.1% |
| Macedonian | 2 | 0.0% |
| Menominee | 3 | 0.0% |
| Mexican | 312 | 1.3% |
| Native Hawaiian | 3 | 0.0% |
| Nicaraguan | 17 | 0.1% |
| Nigerian | 18 | 0.1% |
| Northern European | 41 | 0.2% |
| Norwegian | 2,967 | 12.5% |
| Pakistani | 30 | 0.1% |
| Pennsylvania German | 2 | 0.0% |
| Polish | 490 | 2.1% |
| Portuguese | 17 | 0.1% |
| Puerto Rican | 78 | 0.3% |
| Romanian | 5 | 0.0% |
| Russian | 54 | 0.2% |
| Scandinavian | 129 | 0.5% |
| Scotch-Irish | 86 | 0.4% |
| Scottish | 315 | 1.3% |
| Serbian | 16 | 0.1% |
| Slavic | 1 | 0.0% |
| Slovak | 12 | 0.1% |
| Slovene | 6 | 0.0% |
| South American | 3 | 0.0% |
| Spaniard | 11 | 0.1% |
| Spanish | 3 | 0.0% |
| Sri Lankan | 11 | 0.1% |
| Subsaharan African | 62 | 0.3% |
| Swedish | 295 | 1.2% |
| Swiss | 722 | 3.0% |
| Thai | 68 | 0.3% |
| Ukrainian | 6 | 0.0% |
| Welsh | 169 | 0.7% |
| West Indian | 14 | 0.1% | View All 82 Rows |
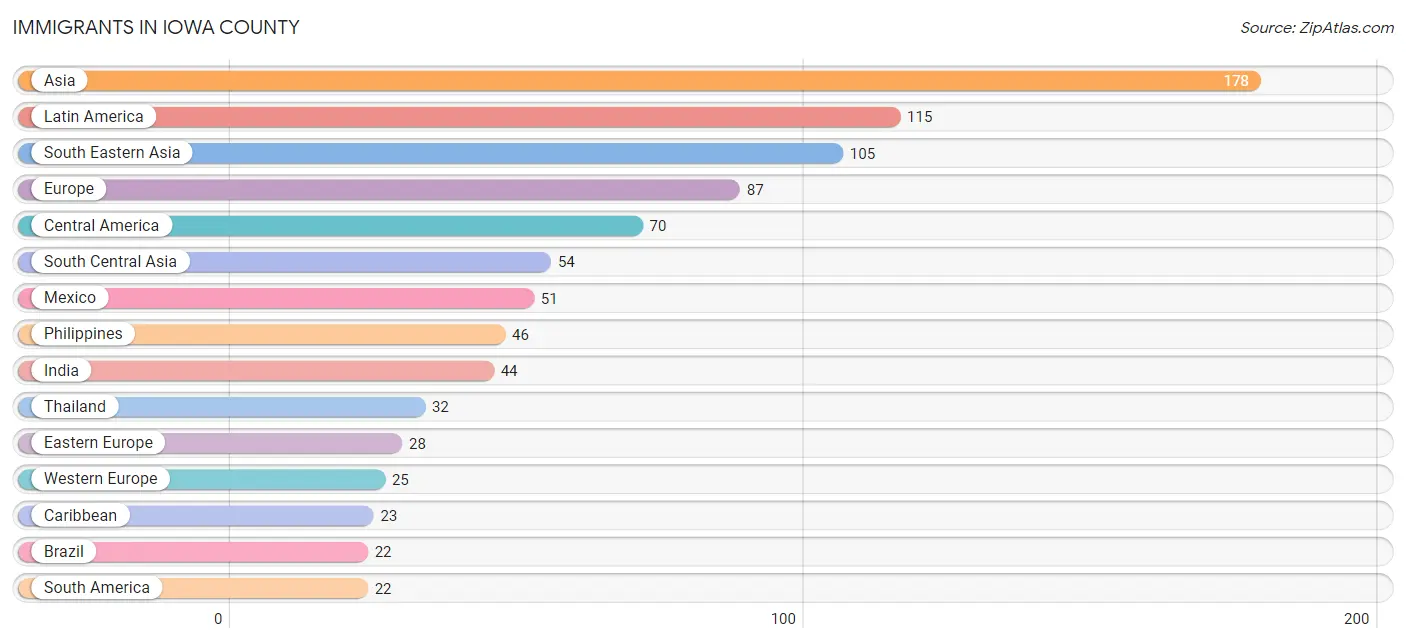
Immigrants in Iowa County
The most numerous immigrant groups reported in Iowa County came from Asia (178 | 0.7%), Latin America (115 | 0.5%), South Eastern Asia (105 | 0.4%), Europe (87 | 0.4%), and Central America (70 | 0.3%), together accounting for 2.3% of all Iowa County residents.
| Immigration Origin | # Population | % Population |
| Asia | 178 | 0.7% |
| Australia | 11 | 0.1% |
| Brazil | 22 | 0.1% |
| Canada | 7 | 0.0% |
| Caribbean | 23 | 0.1% |
| Central America | 70 | 0.3% |
| China | 8 | 0.0% |
| Cuba | 1 | 0.0% |
| Czechoslovakia | 2 | 0.0% |
| Denmark | 4 | 0.0% |
| Eastern Asia | 19 | 0.1% |
| Eastern Europe | 28 | 0.1% |
| England | 3 | 0.0% |
| Europe | 87 | 0.4% |
| France | 1 | 0.0% |
| Germany | 21 | 0.1% |
| Guatemala | 2 | 0.0% |
| Haiti | 16 | 0.1% |
| Hungary | 2 | 0.0% |
| India | 44 | 0.2% |
| Ireland | 2 | 0.0% |
| Japan | 9 | 0.0% |
| Korea | 2 | 0.0% |
| Laos | 6 | 0.0% |
| Latin America | 115 | 0.5% |
| Lithuania | 2 | 0.0% |
| Mexico | 51 | 0.2% |
| Nepal | 10 | 0.0% |
| Nicaragua | 17 | 0.1% |
| North Macedonia | 3 | 0.0% |
| Northern Europe | 21 | 0.1% |
| Oceania | 17 | 0.1% |
| Philippines | 46 | 0.2% |
| Poland | 4 | 0.0% |
| Romania | 3 | 0.0% |
| Russia | 9 | 0.0% |
| Scotland | 4 | 0.0% |
| South America | 22 | 0.1% |
| South Central Asia | 54 | 0.2% |
| South Eastern Asia | 105 | 0.4% |
| Southern Europe | 13 | 0.1% |
| Spain | 13 | 0.1% |
| Switzerland | 3 | 0.0% |
| Taiwan | 2 | 0.0% |
| Thailand | 32 | 0.1% |
| Vietnam | 21 | 0.1% |
| West Indies | 6 | 0.0% |
| Western Europe | 25 | 0.1% | View All 48 Rows |
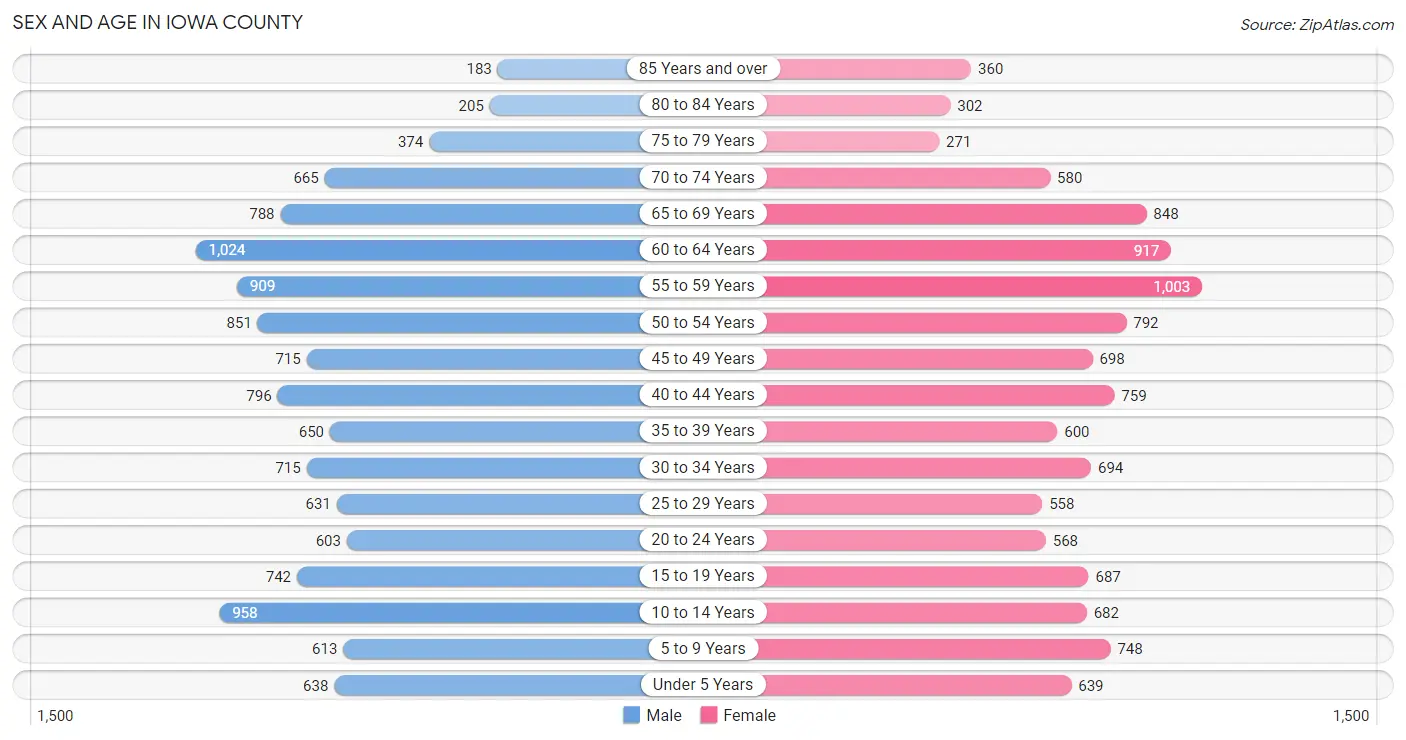
Sex and Age in Iowa County
Sex and Age in Iowa County
The most populous age groups in Iowa County are 60 to 64 Years (1,024 | 8.5%) for men and 55 to 59 Years (1,003 | 8.6%) for women.
| Age Bracket | Male | Female |
| Under 5 Years | 638 (5.3%) | 639 (5.5%) |
| 5 to 9 Years | 613 (5.1%) | 748 (6.4%) |
| 10 to 14 Years | 958 (7.9%) | 682 (5.8%) |
| 15 to 19 Years | 742 (6.1%) | 687 (5.9%) |
| 20 to 24 Years | 603 (5.0%) | 568 (4.9%) |
| 25 to 29 Years | 631 (5.2%) | 558 (4.8%) |
| 30 to 34 Years | 715 (5.9%) | 694 (5.9%) |
| 35 to 39 Years | 650 (5.4%) | 600 (5.1%) |
| 40 to 44 Years | 796 (6.6%) | 759 (6.5%) |
| 45 to 49 Years | 715 (5.9%) | 698 (6.0%) |
| 50 to 54 Years | 851 (7.1%) | 792 (6.8%) |
| 55 to 59 Years | 909 (7.5%) | 1,003 (8.6%) |
| 60 to 64 Years | 1,024 (8.5%) | 917 (7.8%) |
| 65 to 69 Years | 788 (6.5%) | 848 (7.2%) |
| 70 to 74 Years | 665 (5.5%) | 580 (5.0%) |
| 75 to 79 Years | 374 (3.1%) | 271 (2.3%) |
| 80 to 84 Years | 205 (1.7%) | 302 (2.6%) |
| 85 Years and over | 183 (1.5%) | 360 (3.1%) |
| Total | 12,060 (100.0%) | 11,706 (100.0%) |
Families and Households in Iowa County
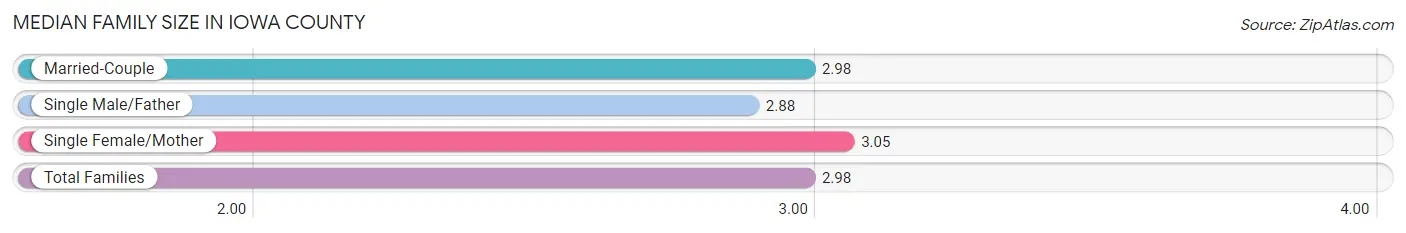
Median Family Size in Iowa County
The median family size in Iowa County is 2.98 persons per family, with single female/mother families (700 | 11.1%) accounting for the largest median family size of 3.05 persons per family. On the other hand, single male/father families (408 | 6.5%) represent the smallest median family size with 2.88 persons per family.
| Family Type | # Families | Family Size |
| Married-Couple | 5,213 (82.5%) | 2.98 |
| Single Male/Father | 408 (6.5%) | 2.88 |
| Single Female/Mother | 700 (11.1%) | 3.05 |
| Total Families | 6,321 (100.0%) | 2.98 |
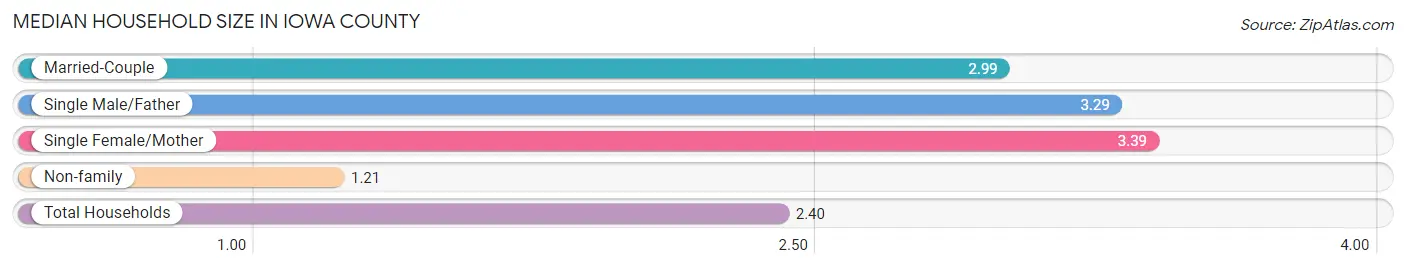
Median Household Size in Iowa County
The median household size in Iowa County is 2.40 persons per household, with single female/mother households (700 | 7.1%) accounting for the largest median household size of 3.39 persons per household. non-family households (3,474 | 35.5%) represent the smallest median household size with 1.21 persons per household.
| Household Type | # Households | Household Size |
| Married-Couple | 5,213 (53.2%) | 2.99 |
| Single Male/Father | 408 (4.2%) | 3.29 |
| Single Female/Mother | 700 (7.1%) | 3.39 |
| Non-family | 3,474 (35.5%) | 1.21 |
| Total Households | 9,795 (100.0%) | 2.40 |
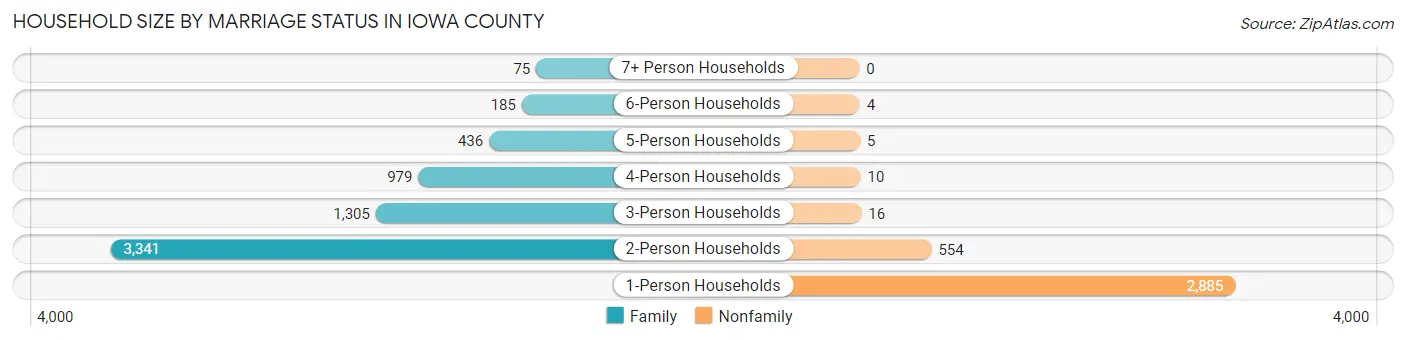
Household Size by Marriage Status in Iowa County
Out of a total of 9,795 households in Iowa County, 6,321 (64.5%) are family households, while 3,474 (35.5%) are nonfamily households. The most numerous type of family households are 2-person households, comprising 3,341, and the most common type of nonfamily households are 1-person households, comprising 2,885.
| Household Size | Family Households | Nonfamily Households |
| 1-Person Households | - | 2,885 (29.4%) |
| 2-Person Households | 3,341 (34.1%) | 554 (5.7%) |
| 3-Person Households | 1,305 (13.3%) | 16 (0.2%) |
| 4-Person Households | 979 (10.0%) | 10 (0.1%) |
| 5-Person Households | 436 (4.4%) | 5 (0.1%) |
| 6-Person Households | 185 (1.9%) | 4 (0.0%) |
| 7+ Person Households | 75 (0.8%) | 0 (0.0%) |
| Total | 6,321 (64.5%) | 3,474 (35.5%) |
Female Fertility in Iowa County
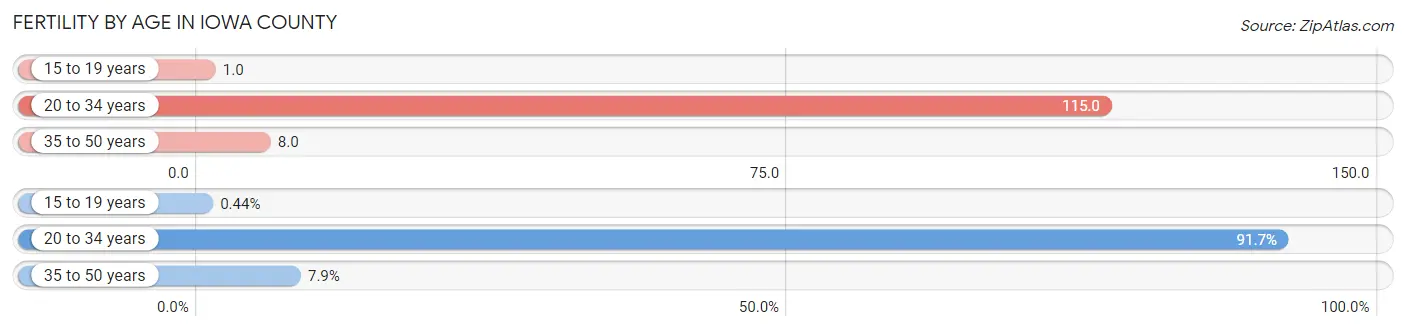
Fertility by Age in Iowa County
Average fertility rate in Iowa County is 48.0 births per 1,000 women. Women in the age bracket of 20 to 34 years have the highest fertility rate with 115.0 births per 1,000 women. Women in the age bracket of 20 to 34 years acount for 91.7% of all women with births.
| Age Bracket | Women with Births | Births / 1,000 Women |
| 15 to 19 years | 1 (0.4%) | 1.0 |
| 20 to 34 years | 209 (91.7%) | 115.0 |
| 35 to 50 years | 18 (7.9%) | 8.0 |
| Total | 228 (100.0%) | 48.0 |
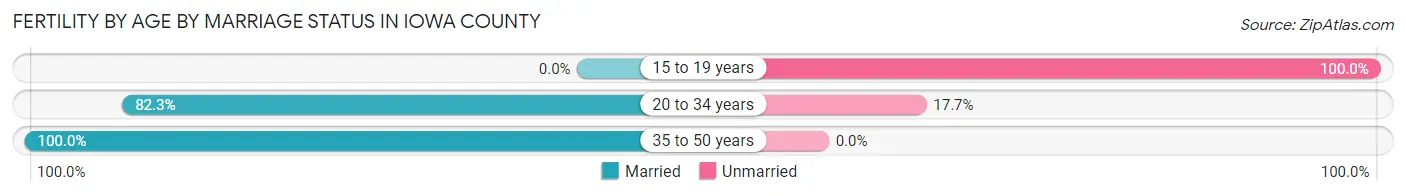
Fertility by Age by Marriage Status in Iowa County
83.3% of women with births (228) in Iowa County are married. The highest percentage of unmarried women with births falls into 15 to 19 years age bracket with 100.0% of them unmarried at the time of birth, while the lowest percentage of unmarried women with births belong to 35 to 50 years age bracket with 0.0% of them unmarried.
| Age Bracket | Married | Unmarried |
| 15 to 19 years | 0 (0.0%) | 1 (100.0%) |
| 20 to 34 years | 172 (82.3%) | 37 (17.7%) |
| 35 to 50 years | 18 (100.0%) | 0 (0.0%) |
| Total | 190 (83.3%) | 38 (16.7%) |
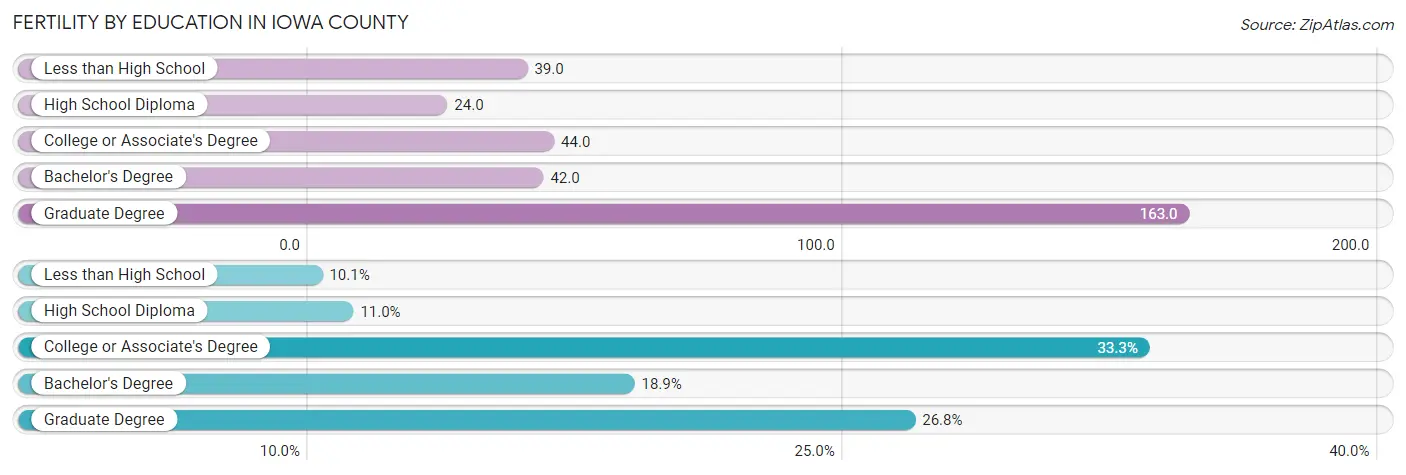
Fertility by Education in Iowa County
Average fertility rate in Iowa County is 48.0 births per 1,000 women. Women with the education attainment of graduate degree have the highest fertility rate of 163.0 births per 1,000 women, while women with the education attainment of high school diploma have the lowest fertility at 24.0 births per 1,000 women. Women with the education attainment of college or associate's degree represent 33.3% of all women with births.
| Educational Attainment | Women with Births | Births / 1,000 Women |
| Less than High School | 23 (10.1%) | 39.0 |
| High School Diploma | 25 (11.0%) | 24.0 |
| College or Associate's Degree | 76 (33.3%) | 44.0 |
| Bachelor's Degree | 43 (18.9%) | 42.0 |
| Graduate Degree | 61 (26.8%) | 163.0 |
| Total | 228 (100.0%) | 48.0 |
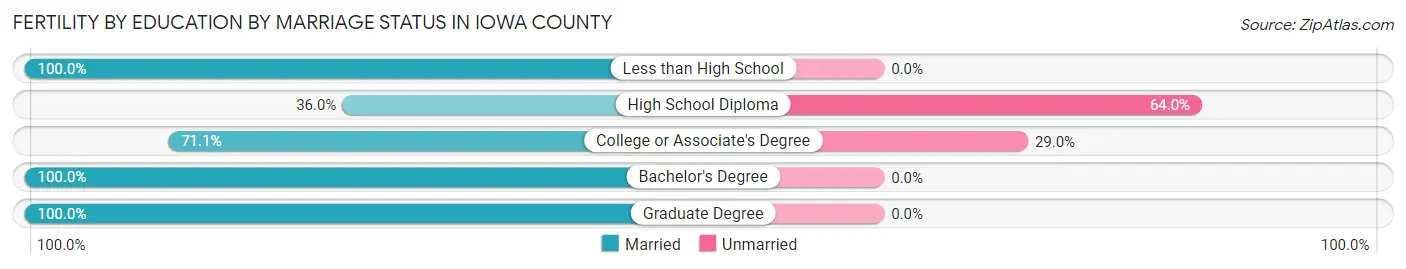
Fertility by Education by Marriage Status in Iowa County
16.7% of women with births in Iowa County are unmarried. Women with the educational attainment of less than high school are most likely to be married with 100.0% of them married at childbirth, while women with the educational attainment of high school diploma are least likely to be married with 64.0% of them unmarried at childbirth.
| Educational Attainment | Married | Unmarried |
| Less than High School | 23 (100.0%) | 0 (0.0%) |
| High School Diploma | 9 (36.0%) | 16 (64.0%) |
| College or Associate's Degree | 54 (71.1%) | 22 (28.9%) |
| Bachelor's Degree | 43 (100.0%) | 0 (0.0%) |
| Graduate Degree | 61 (100.0%) | 0 (0.0%) |
| Total | 190 (83.3%) | 38 (16.7%) |
Income in Iowa County
Income Overview in Iowa County
Per Capita Income in Iowa County is $39,330, while median incomes of families and households are $101,563 and $79,226 respectively.
| Characteristic | Number | Measure |
| Per Capita Income | 23,766 | $39,330 |
| Median Family Income | 6,321 | $101,563 |
| Mean Family Income | 6,321 | $113,282 |
| Median Household Income | 9,795 | $79,226 |
| Mean Household Income | 9,795 | $93,598 |
| Income Deficit | 6,321 | $11,306 |
| Wage / Income Gap (%) | 23,766 | 20.79% |
| Wage / Income Gap ($) | 23,766 | 79.21¢ per $1 |
| Gini / Inequality Index | 23,766 | 0.40 |
Earnings by Sex in Iowa County
Average Earnings in Iowa County are $44,296, $49,567 for men and $39,262 for women, a difference of 20.8%.
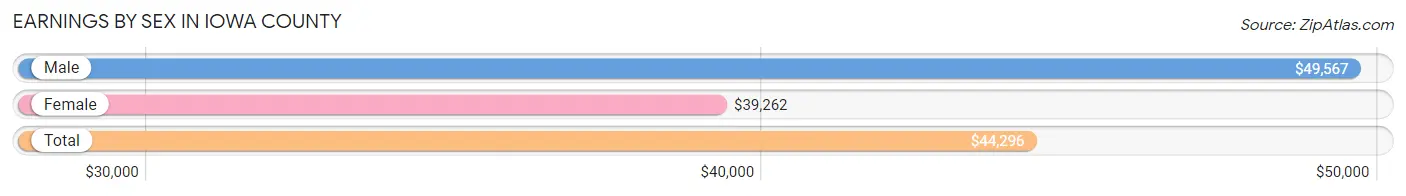
| Sex | Number | Average Earnings |
| Male | 7,506 (53.3%) | $49,567 |
| Female | 6,575 (46.7%) | $39,262 |
| Total | 14,081 (100.0%) | $44,296 |
Earnings by Sex by Income Bracket in Iowa County
The most common earnings brackets in Iowa County are $75,000 to $99,999 for men (1,012 | 13.5%) and $35,000 to $39,999 for women (578 | 8.8%).
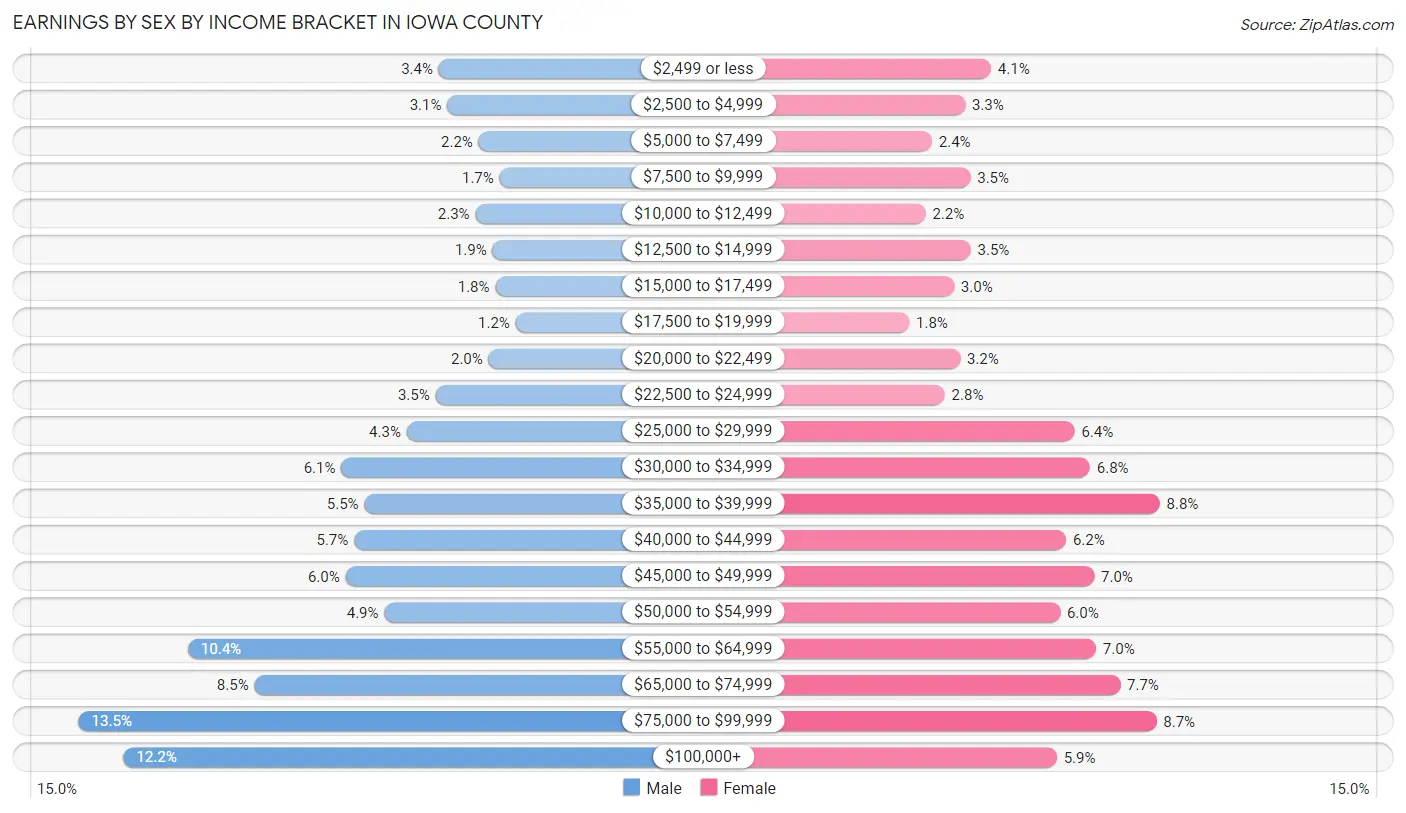
| Income | Male | Female |
| $2,499 or less | 252 (3.4%) | 266 (4.1%) |
| $2,500 to $4,999 | 234 (3.1%) | 218 (3.3%) |
| $5,000 to $7,499 | 168 (2.2%) | 157 (2.4%) |
| $7,500 to $9,999 | 124 (1.7%) | 228 (3.5%) |
| $10,000 to $12,499 | 175 (2.3%) | 145 (2.2%) |
| $12,500 to $14,999 | 139 (1.8%) | 229 (3.5%) |
| $15,000 to $17,499 | 133 (1.8%) | 198 (3.0%) |
| $17,500 to $19,999 | 90 (1.2%) | 115 (1.8%) |
| $20,000 to $22,499 | 147 (2.0%) | 209 (3.2%) |
| $22,500 to $24,999 | 259 (3.5%) | 181 (2.8%) |
| $25,000 to $29,999 | 320 (4.3%) | 421 (6.4%) |
| $30,000 to $34,999 | 458 (6.1%) | 449 (6.8%) |
| $35,000 to $39,999 | 409 (5.4%) | 578 (8.8%) |
| $40,000 to $44,999 | 431 (5.7%) | 405 (6.2%) |
| $45,000 to $49,999 | 449 (6.0%) | 457 (7.0%) |
| $50,000 to $54,999 | 367 (4.9%) | 394 (6.0%) |
| $55,000 to $64,999 | 781 (10.4%) | 460 (7.0%) |
| $65,000 to $74,999 | 641 (8.5%) | 505 (7.7%) |
| $75,000 to $99,999 | 1,012 (13.5%) | 572 (8.7%) |
| $100,000+ | 917 (12.2%) | 388 (5.9%) |
| Total | 7,506 (100.0%) | 6,575 (100.0%) |
Earnings by Sex by Educational Attainment in Iowa County
Average earnings in Iowa County are $54,652 for men and $43,525 for women, a difference of 20.4%. Men with an educational attainment of graduate degree enjoy the highest average annual earnings of $74,659, while those with high school diploma education earn the least with $44,831. Women with an educational attainment of graduate degree earn the most with the average annual earnings of $70,640, while those with high school diploma education have the smallest earnings of $34,143.
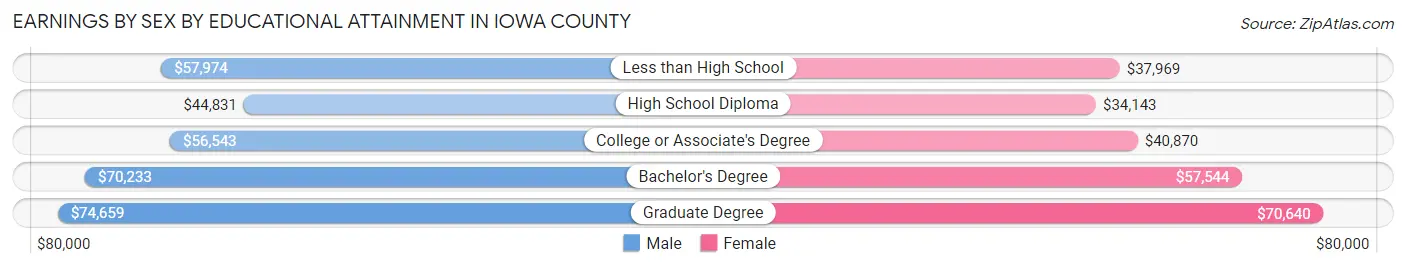
| Educational Attainment | Male Income | Female Income |
| Less than High School | $57,974 | $37,969 |
| High School Diploma | $44,831 | $34,143 |
| College or Associate's Degree | $56,543 | $40,870 |
| Bachelor's Degree | $70,233 | $57,544 |
| Graduate Degree | $74,659 | $70,640 |
| Total | $54,652 | $43,525 |
Family Income in Iowa County
Family Income Brackets in Iowa County
According to the Iowa County family income data, there are 1,757 families falling into the $100,000 to $149,999 income range, which is the most common income bracket and makes up 27.8% of all families. Conversely, the $10,000 to $14,999 income bracket is the least frequent group with only 44 families (0.7%) belonging to this category.
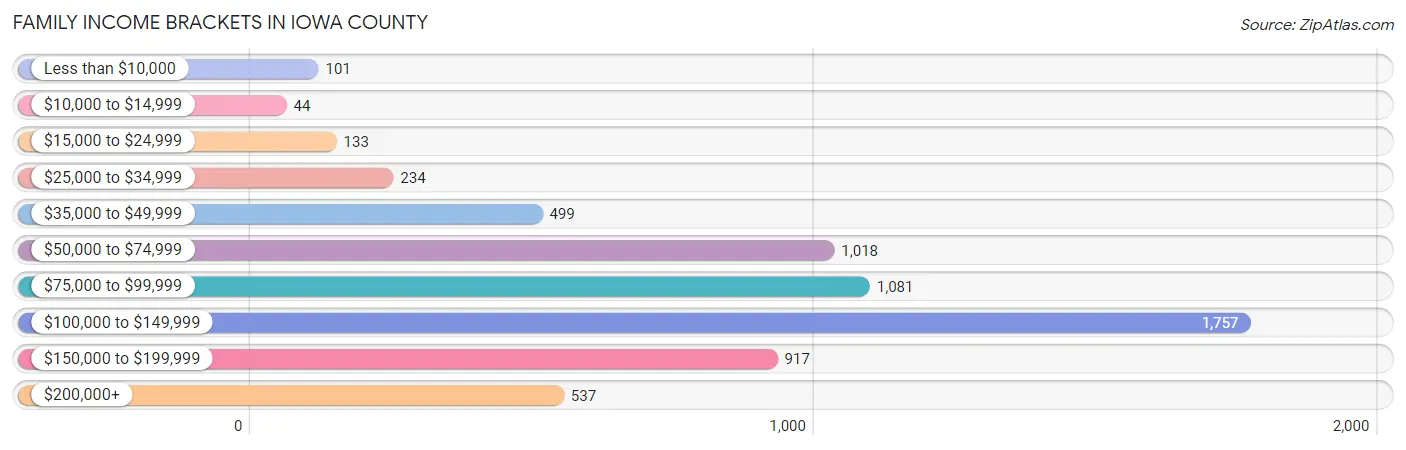
| Income Bracket | # Families | % Families |
| Less than $10,000 | 101 | 1.6% |
| $10,000 to $14,999 | 44 | 0.7% |
| $15,000 to $24,999 | 133 | 2.1% |
| $25,000 to $34,999 | 234 | 3.7% |
| $35,000 to $49,999 | 499 | 7.9% |
| $50,000 to $74,999 | 1,018 | 16.1% |
| $75,000 to $99,999 | 1,081 | 17.1% |
| $100,000 to $149,999 | 1,757 | 27.8% |
| $150,000 to $199,999 | 917 | 14.5% |
| $200,000+ | 537 | 8.5% |
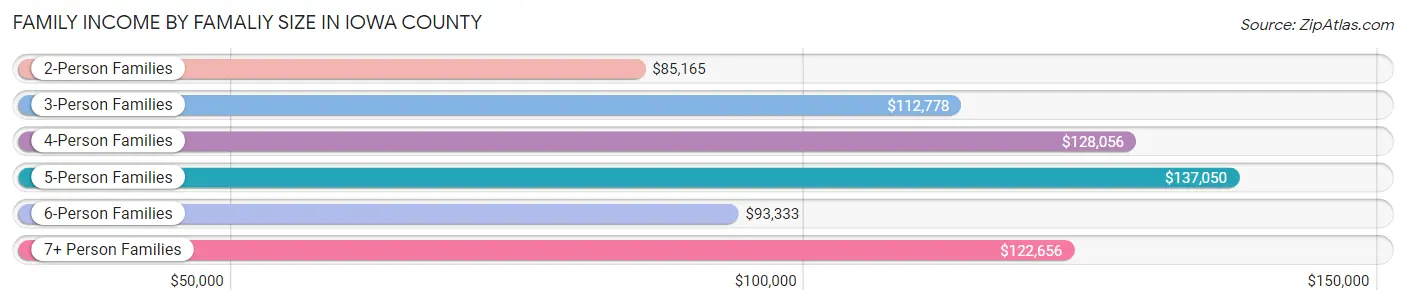
Family Income by Famaliy Size in Iowa County
5-person families (439 | 7.0%) account for the highest median family income in Iowa County with $137,050 per family, while 2-person families (3,467 | 54.8%) have the highest median income of $42,582 per family member.
| Income Bracket | # Families | Median Income |
| 2-Person Families | 3,467 (54.8%) | $85,165 |
| 3-Person Families | 1,256 (19.9%) | $112,778 |
| 4-Person Families | 956 (15.1%) | $128,056 |
| 5-Person Families | 439 (7.0%) | $137,050 |
| 6-Person Families | 142 (2.2%) | $93,333 |
| 7+ Person Families | 61 (1.0%) | $122,656 |
| Total | 6,321 (100.0%) | $101,563 |
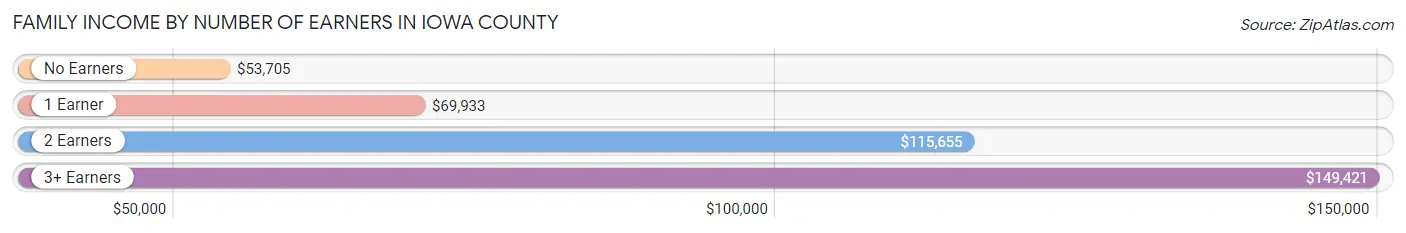
Family Income by Number of Earners in Iowa County
The median family income in Iowa County is $101,563, with families comprising 3+ earners (773) having the highest median family income of $149,421, while families with no earners (785) have the lowest median family income of $53,705, accounting for 12.2% and 12.4% of families, respectively.
| Number of Earners | # Families | Median Income |
| No Earners | 785 (12.4%) | $53,705 |
| 1 Earner | 1,457 (23.1%) | $69,933 |
| 2 Earners | 3,306 (52.3%) | $115,655 |
| 3+ Earners | 773 (12.2%) | $149,421 |
| Total | 6,321 (100.0%) | $101,563 |
Household Income in Iowa County
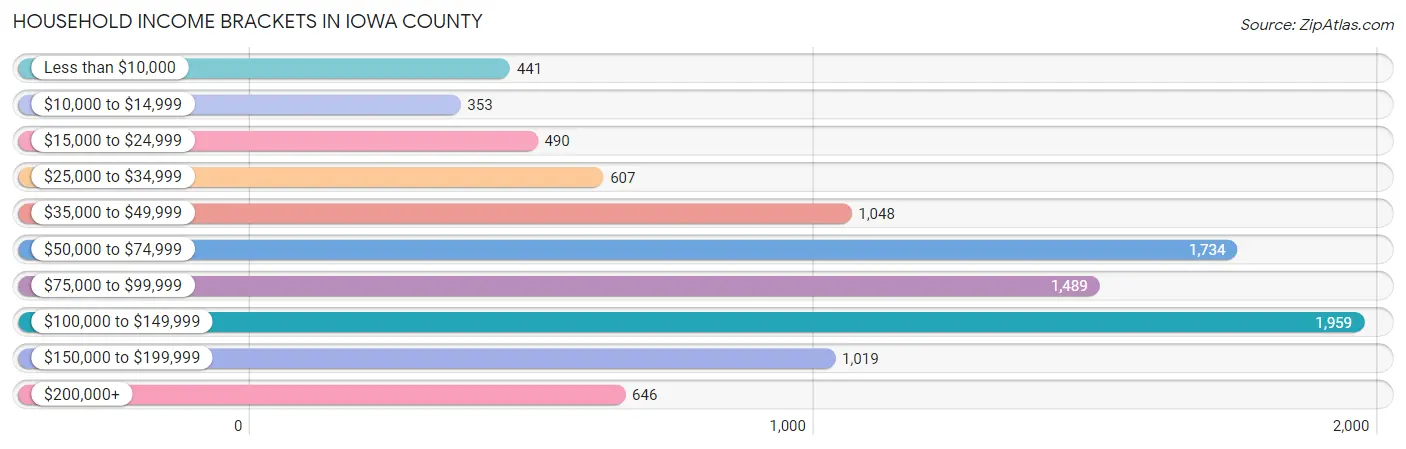
Household Income Brackets in Iowa County
With 1,959 households falling in the category, the $100,000 to $149,999 income range is the most frequent in Iowa County, accounting for 20.0% of all households. In contrast, only 353 households (3.6%) fall into the $10,000 to $14,999 income bracket, making it the least populous group.
| Income Bracket | # Households | % Households |
| Less than $10,000 | 441 | 4.5% |
| $10,000 to $14,999 | 353 | 3.6% |
| $15,000 to $24,999 | 490 | 5.0% |
| $25,000 to $34,999 | 607 | 6.2% |
| $35,000 to $49,999 | 1,048 | 10.7% |
| $50,000 to $74,999 | 1,734 | 17.7% |
| $75,000 to $99,999 | 1,489 | 15.2% |
| $100,000 to $149,999 | 1,959 | 20.0% |
| $150,000 to $199,999 | 1,019 | 10.4% |
| $200,000+ | 646 | 6.6% |
Household Income by Householder Age in Iowa County
The median household income in Iowa County is $79,226, with the highest median household income of $96,607 found in the 25 to 44 years age bracket for the primary householder. A total of 2,636 households (26.9%) fall into this category. Meanwhile, the 65+ years age bracket for the primary householder has the lowest median household income of $52,432, with 3,017 households (30.8%) in this group.

| Income Bracket | # Households | Median Income |
| 15 to 24 Years | 266 (2.7%) | $53,929 |
| 25 to 44 Years | 2,636 (26.9%) | $96,607 |
| 45 to 64 Years | 3,876 (39.6%) | $89,576 |
| 65+ Years | 3,017 (30.8%) | $52,432 |
| Total | 9,795 (100.0%) | $79,226 |
Poverty in Iowa County
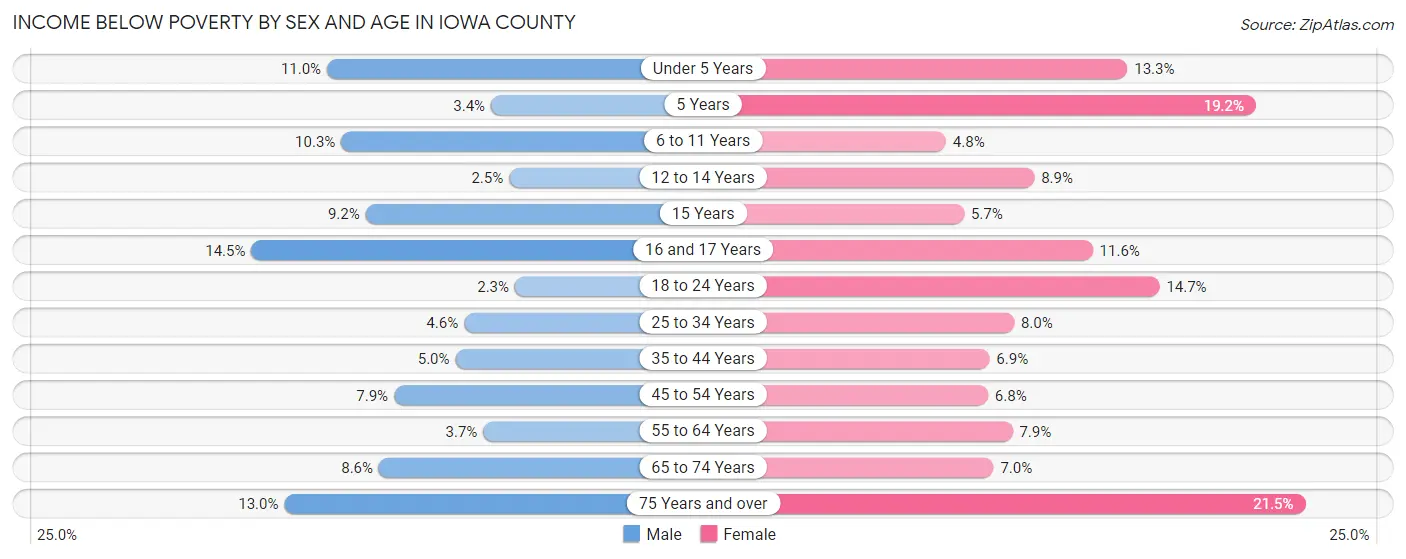
Income Below Poverty by Sex and Age in Iowa County
With 6.7% poverty level for males and 9.3% for females among the residents of Iowa County, 16 and 17 year old males and 75 year old and over females are the most vulnerable to poverty, with 42 males (14.5%) and 185 females (21.5%) in their respective age groups living below the poverty level.
| Age Bracket | Male | Female |
| Under 5 Years | 70 (11.0%) | 84 (13.3%) |
| 5 Years | 4 (3.4%) | 29 (19.2%) |
| 6 to 11 Years | 84 (10.3%) | 45 (4.8%) |
| 12 to 14 Years | 13 (2.5%) | 30 (8.9%) |
| 15 Years | 18 (9.2%) | 11 (5.7%) |
| 16 and 17 Years | 42 (14.5%) | 32 (11.6%) |
| 18 to 24 Years | 19 (2.2%) | 115 (14.7%) |
| 25 to 34 Years | 62 (4.6%) | 100 (8.0%) |
| 35 to 44 Years | 72 (5.0%) | 93 (6.9%) |
| 45 to 54 Years | 123 (7.9%) | 101 (6.8%) |
| 55 to 64 Years | 72 (3.7%) | 152 (7.9%) |
| 65 to 74 Years | 124 (8.6%) | 100 (7.0%) |
| 75 Years and over | 94 (13.0%) | 185 (21.5%) |
| Total | 797 (6.7%) | 1,077 (9.3%) |
Income Above Poverty by Sex and Age in Iowa County
According to the poverty statistics in Iowa County, males aged 18 to 24 years and females aged 6 to 11 years are the age groups that are most secure financially, with 97.8% of males and 95.2% of females in these age groups living above the poverty line.
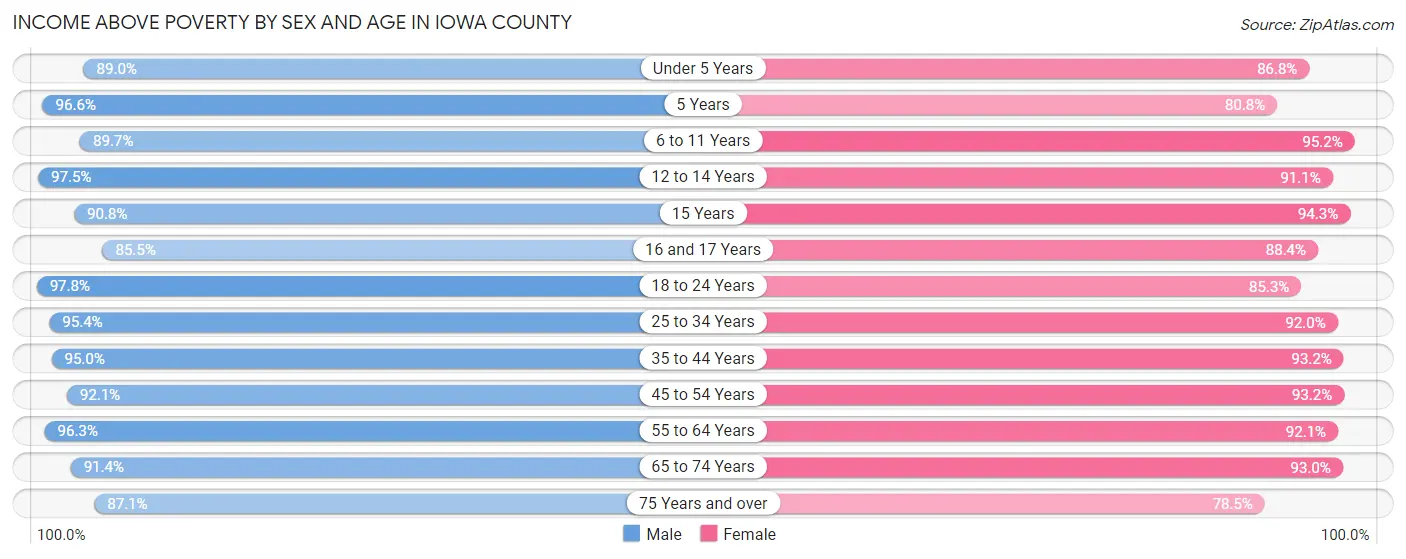
| Age Bracket | Male | Female |
| Under 5 Years | 568 (89.0%) | 550 (86.8%) |
| 5 Years | 115 (96.6%) | 122 (80.8%) |
| 6 to 11 Years | 731 (89.7%) | 887 (95.2%) |
| 12 to 14 Years | 502 (97.5%) | 306 (91.1%) |
| 15 Years | 178 (90.8%) | 183 (94.3%) |
| 16 and 17 Years | 248 (85.5%) | 243 (88.4%) |
| 18 to 24 Years | 824 (97.8%) | 665 (85.3%) |
| 25 to 34 Years | 1,282 (95.4%) | 1,151 (92.0%) |
| 35 to 44 Years | 1,366 (95.0%) | 1,264 (93.1%) |
| 45 to 54 Years | 1,442 (92.1%) | 1,389 (93.2%) |
| 55 to 64 Years | 1,861 (96.3%) | 1,768 (92.1%) |
| 65 to 74 Years | 1,325 (91.4%) | 1,321 (93.0%) |
| 75 Years and over | 632 (87.1%) | 675 (78.5%) |
| Total | 11,074 (93.3%) | 10,524 (90.7%) |
Income Below Poverty Among Married-Couple Families in Iowa County
The poverty statistics for married-couple families in Iowa County show that 2.1% or 108 of the total 5,213 families live below the poverty line. Families with 5 or more children have the highest poverty rate of 8.3%, comprising of 2 families. On the other hand, families with no children have the lowest poverty rate of 1.7%, which includes 56 families.
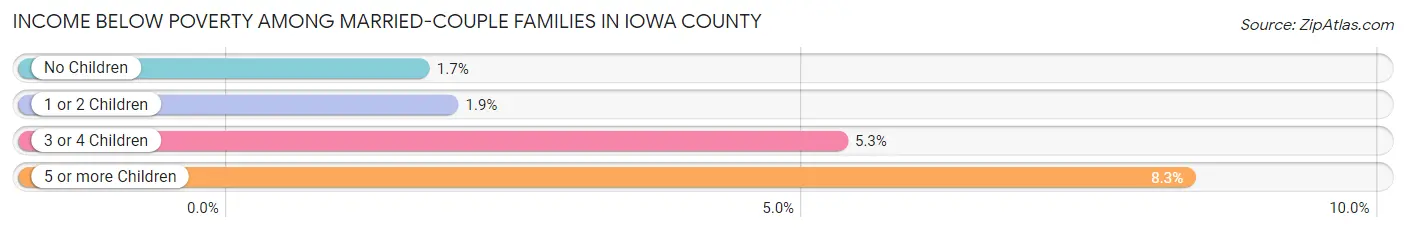
| Children | Above Poverty | Below Poverty |
| No Children | 3,292 (98.3%) | 56 (1.7%) |
| 1 or 2 Children | 1,381 (98.1%) | 27 (1.9%) |
| 3 or 4 Children | 410 (94.7%) | 23 (5.3%) |
| 5 or more Children | 22 (91.7%) | 2 (8.3%) |
| Total | 5,105 (97.9%) | 108 (2.1%) |
Income Below Poverty Among Single-Parent Households in Iowa County
According to the poverty data in Iowa County, 7.3% or 30 single-father households and 14.1% or 99 single-mother households are living below the poverty line. Among single-father households, those with 1 or 2 children have the highest poverty rate, with 23 households (10.0%) experiencing poverty. Likewise, among single-mother households, those with 3 or 4 children have the highest poverty rate, with 14 households (28.0%) falling below the poverty line.
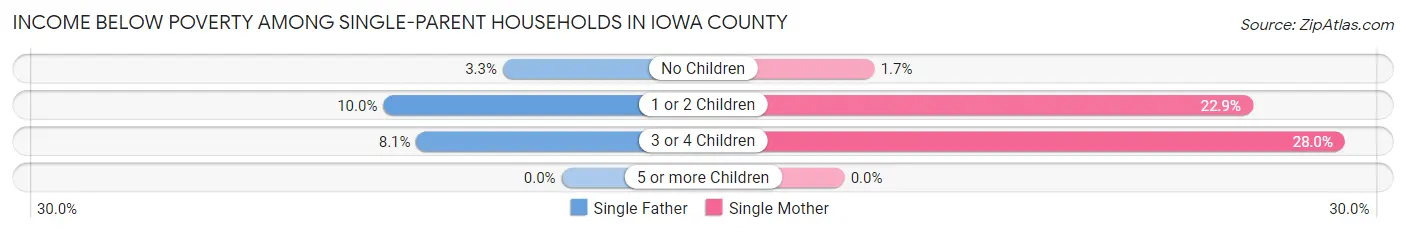
| Children | Single Father | Single Mother |
| No Children | 4 (3.3%) | 5 (1.7%) |
| 1 or 2 Children | 23 (10.0%) | 80 (22.9%) |
| 3 or 4 Children | 3 (8.1%) | 14 (28.0%) |
| 5 or more Children | 0 (0.0%) | 0 (0.0%) |
| Total | 30 (7.3%) | 99 (14.1%) |
Income Below Poverty Among Married-Couple vs Single-Parent Households in Iowa County
The poverty data for Iowa County shows that 108 of the married-couple family households (2.1%) and 129 of the single-parent households (11.6%) are living below the poverty level. Within the married-couple family households, those with 5 or more children have the highest poverty rate, with 2 households (8.3%) falling below the poverty line. Among the single-parent households, those with 3 or 4 children have the highest poverty rate, with 17 household (19.5%) living below poverty.
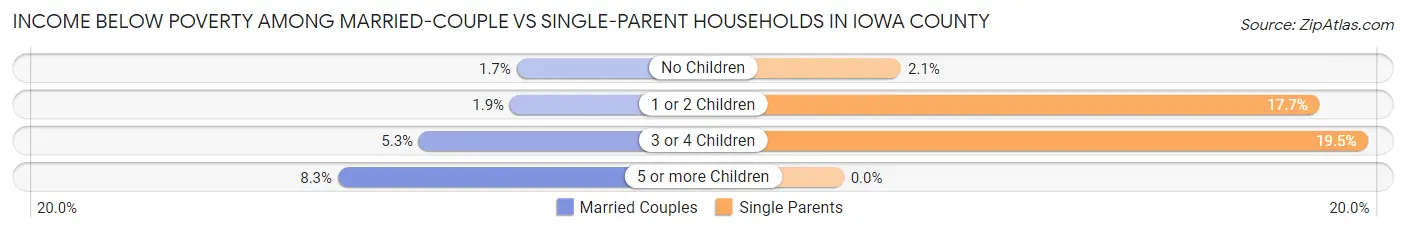
| Children | Married-Couple Families | Single-Parent Households |
| No Children | 56 (1.7%) | 9 (2.1%) |
| 1 or 2 Children | 27 (1.9%) | 103 (17.7%) |
| 3 or 4 Children | 23 (5.3%) | 17 (19.5%) |
| 5 or more Children | 2 (8.3%) | 0 (0.0%) |
| Total | 108 (2.1%) | 129 (11.6%) |
Employment Characteristics in Iowa County
Employment by Class of Employer in Iowa County
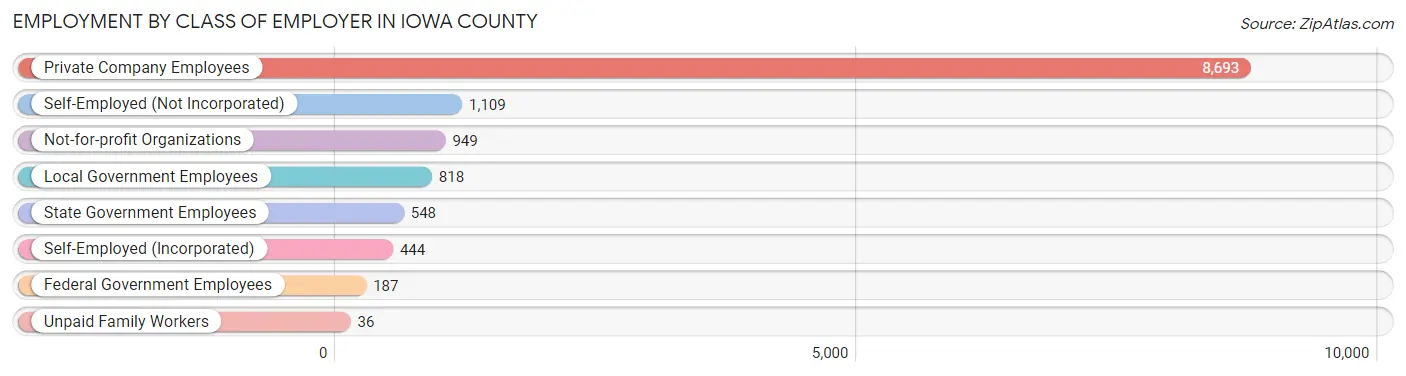
Among the 12,784 employed individuals in Iowa County, private company employees (8,693 | 68.0%), self-employed (not incorporated) (1,109 | 8.7%), and not-for-profit organizations (949 | 7.4%) make up the most common classes of employment.
| Employer Class | # Employees | % Employees |
| Private Company Employees | 8,693 | 68.0% |
| Self-Employed (Incorporated) | 444 | 3.5% |
| Self-Employed (Not Incorporated) | 1,109 | 8.7% |
| Not-for-profit Organizations | 949 | 7.4% |
| Local Government Employees | 818 | 6.4% |
| State Government Employees | 548 | 4.3% |
| Federal Government Employees | 187 | 1.5% |
| Unpaid Family Workers | 36 | 0.3% |
| Total | 12,784 | 100.0% |
Employment Status by Age in Iowa County
According to the labor force statistics for Iowa County, out of the total population over 16 years of age (19,098), 69.5% or 13,273 individuals are in the labor force, with 2.4% or 319 of them unemployed. The age group with the highest labor force participation rate is 35 to 44 years, with 92.6% or 2,597 individuals in the labor force. Within the labor force, the 20 to 24 years age range has the highest percentage of unemployed individuals, with 10.2% or 100 of them being unemployed.
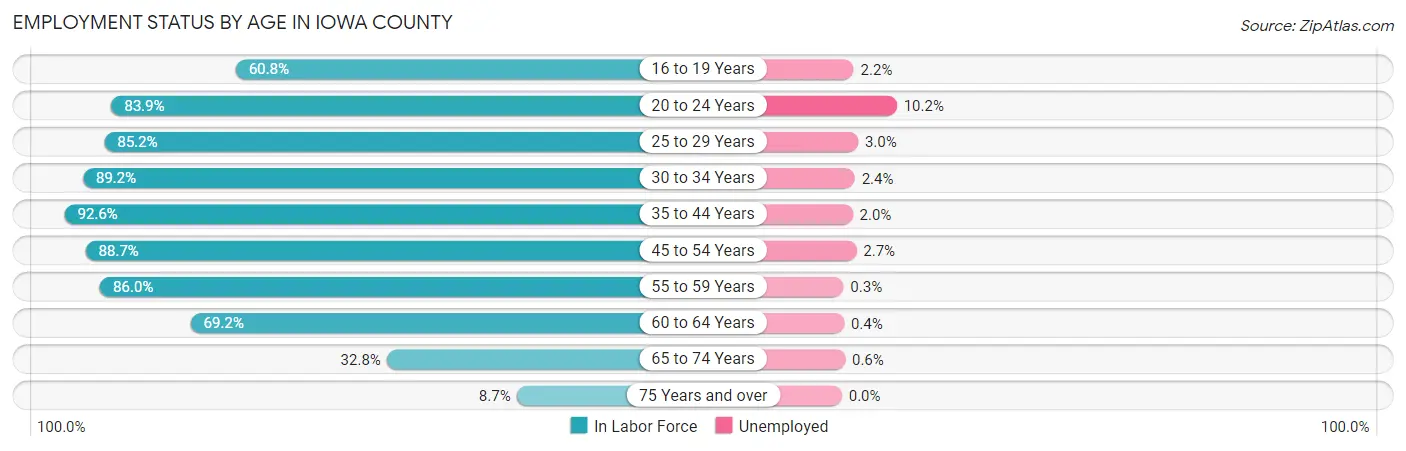
| Age Bracket | In Labor Force | Unemployed |
| 16 to 19 Years | 632 (60.8%) | 14 (2.2%) |
| 20 to 24 Years | 982 (83.9%) | 100 (10.2%) |
| 25 to 29 Years | 1,013 (85.2%) | 30 (3.0%) |
| 30 to 34 Years | 1,257 (89.2%) | 30 (2.4%) |
| 35 to 44 Years | 2,597 (92.6%) | 52 (2.0%) |
| 45 to 54 Years | 2,711 (88.7%) | 73 (2.7%) |
| 55 to 59 Years | 1,644 (86.0%) | 5 (0.3%) |
| 60 to 64 Years | 1,343 (69.2%) | 5 (0.4%) |
| 65 to 74 Years | 945 (32.8%) | 6 (0.6%) |
| 75 Years and over | 147 (8.7%) | 0 (0.0%) |
| Total | 13,273 (69.5%) | 319 (2.4%) |
Employment Status by Educational Attainment in Iowa County
According to labor force statistics for Iowa County, 85.8% of individuals (10,564) out of the total population between 25 and 64 years of age (12,312) are in the labor force, with 1.8% or 190 of them being unemployed. The group with the highest labor force participation rate are those with the educational attainment of bachelor's degree or higher, with 90.2% or 3,052 individuals in the labor force. Within the labor force, individuals with high school diploma education have the highest percentage of unemployment, with 3.5% or 109 of them being unemployed.
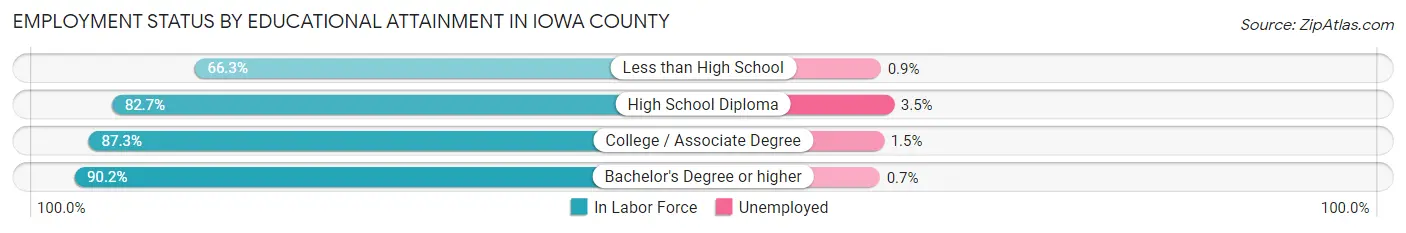
| Educational Attainment | In Labor Force | Unemployed |
| Less than High School | 337 (66.3%) | 5 (0.9%) |
| High School Diploma | 3,102 (82.7%) | 131 (3.5%) |
| College / Associate Degree | 4,076 (87.3%) | 70 (1.5%) |
| Bachelor's Degree or higher | 3,052 (90.2%) | 24 (0.7%) |
| Total | 10,564 (85.8%) | 222 (1.8%) |
Employment Occupations by Sex in Iowa County
Management, Business, Science and Arts Occupations
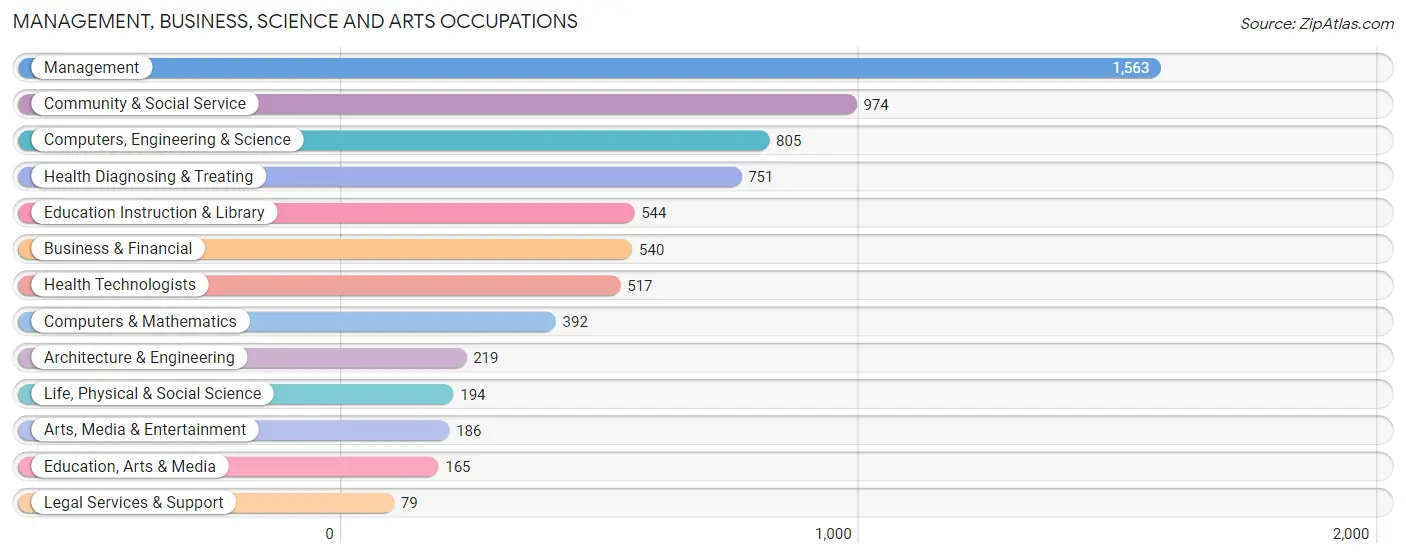
The most common Management, Business, Science and Arts occupations in Iowa County are Management (1,563 | 12.1%), Community & Social Service (974 | 7.5%), Computers, Engineering & Science (805 | 6.2%), Health Diagnosing & Treating (751 | 5.8%), and Education Instruction & Library (544 | 4.2%).
Management, Business, Science and Arts Occupations by Sex
Within the Management, Business, Science and Arts occupations in Iowa County, the most male-oriented occupations are Architecture & Engineering (81.3%), Legal Services & Support (67.1%), and Management (63.8%), while the most female-oriented occupations are Health Diagnosing & Treating (85.1%), Health Technologists (83.4%), and Arts, Media & Entertainment (78.0%).
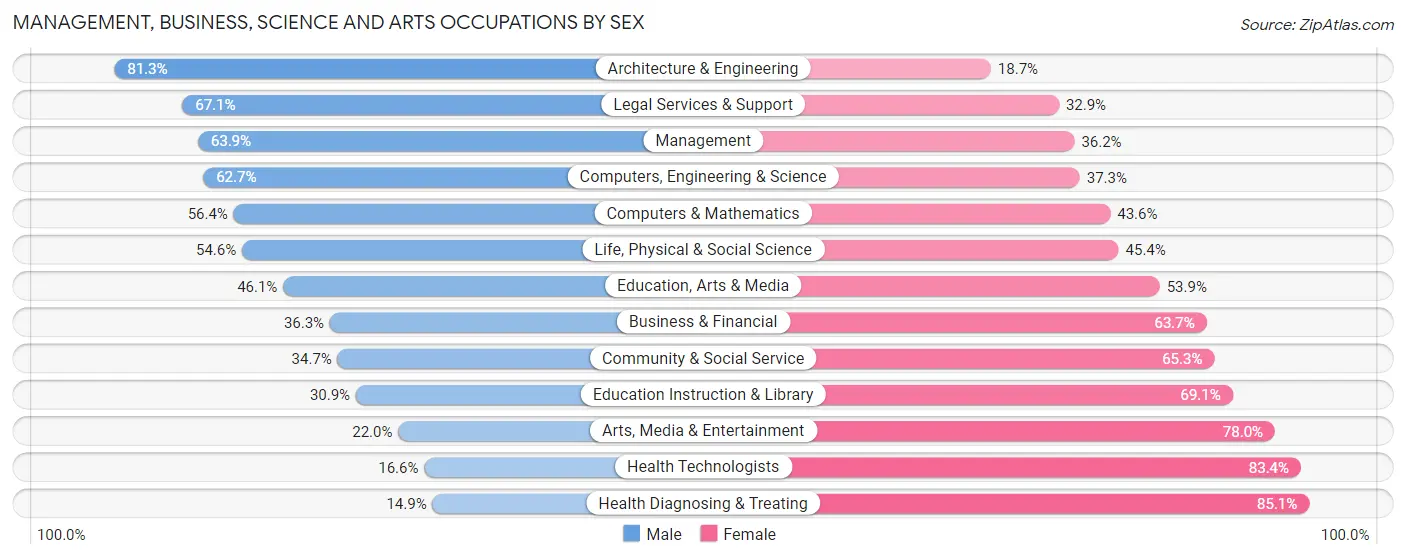
| Occupation | Male | Female |
| Management | 998 (63.8%) | 565 (36.1%) |
| Business & Financial | 196 (36.3%) | 344 (63.7%) |
| Computers, Engineering & Science | 505 (62.7%) | 300 (37.3%) |
| Computers & Mathematics | 221 (56.4%) | 171 (43.6%) |
| Architecture & Engineering | 178 (81.3%) | 41 (18.7%) |
| Life, Physical & Social Science | 106 (54.6%) | 88 (45.4%) |
| Community & Social Service | 338 (34.7%) | 636 (65.3%) |
| Education, Arts & Media | 76 (46.1%) | 89 (53.9%) |
| Legal Services & Support | 53 (67.1%) | 26 (32.9%) |
| Education Instruction & Library | 168 (30.9%) | 376 (69.1%) |
| Arts, Media & Entertainment | 41 (22.0%) | 145 (78.0%) |
| Health Diagnosing & Treating | 112 (14.9%) | 639 (85.1%) |
| Health Technologists | 86 (16.6%) | 431 (83.4%) |
| Total (Category) | 2,149 (46.4%) | 2,484 (53.6%) |
| Total (Overall) | 6,837 (52.8%) | 6,112 (47.2%) |
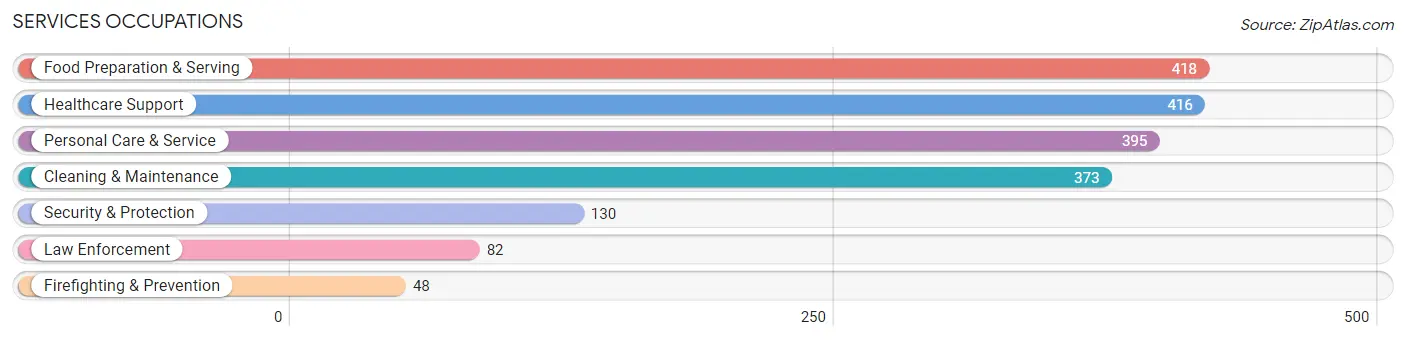
Services Occupations
The most common Services occupations in Iowa County are Food Preparation & Serving (418 | 3.2%), Healthcare Support (416 | 3.2%), Personal Care & Service (395 | 3.0%), Cleaning & Maintenance (373 | 2.9%), and Security & Protection (130 | 1.0%).
Services Occupations by Sex
Within the Services occupations in Iowa County, the most male-oriented occupations are Law Enforcement (96.3%), Security & Protection (92.3%), and Firefighting & Prevention (85.4%), while the most female-oriented occupations are Personal Care & Service (85.6%), Healthcare Support (82.9%), and Food Preparation & Serving (62.0%).
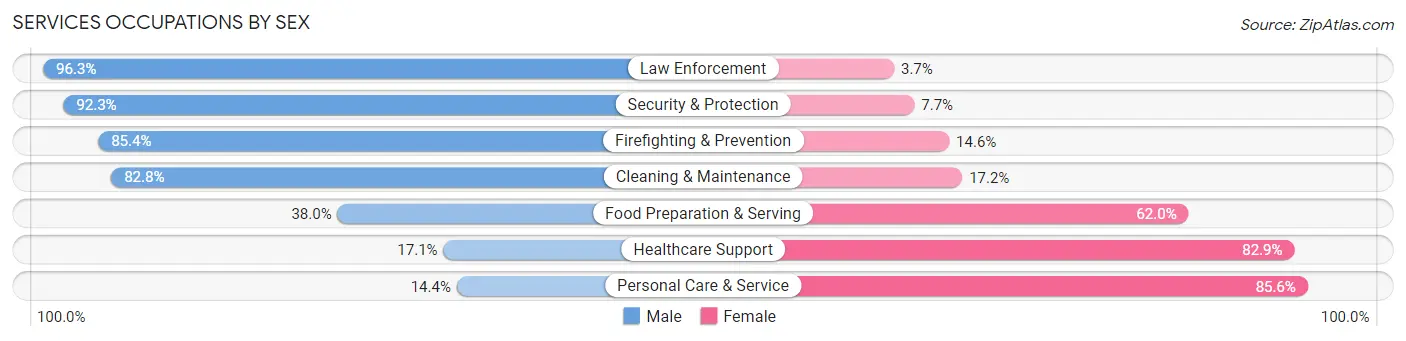
| Occupation | Male | Female |
| Healthcare Support | 71 (17.1%) | 345 (82.9%) |
| Security & Protection | 120 (92.3%) | 10 (7.7%) |
| Firefighting & Prevention | 41 (85.4%) | 7 (14.6%) |
| Law Enforcement | 79 (96.3%) | 3 (3.7%) |
| Food Preparation & Serving | 159 (38.0%) | 259 (62.0%) |
| Cleaning & Maintenance | 309 (82.8%) | 64 (17.2%) |
| Personal Care & Service | 57 (14.4%) | 338 (85.6%) |
| Total (Category) | 716 (41.3%) | 1,016 (58.7%) |
| Total (Overall) | 6,837 (52.8%) | 6,112 (47.2%) |
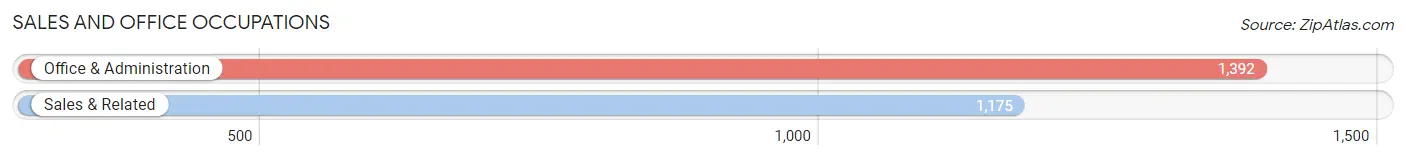
Sales and Office Occupations
The most common Sales and Office occupations in Iowa County are Office & Administration (1,392 | 10.7%), and Sales & Related (1,175 | 9.1%).
Sales and Office Occupations by Sex
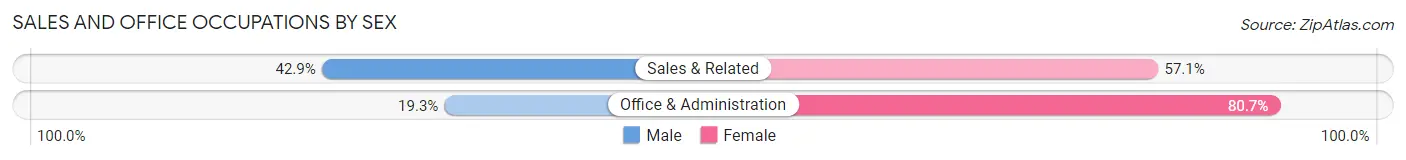
| Occupation | Male | Female |
| Sales & Related | 504 (42.9%) | 671 (57.1%) |
| Office & Administration | 269 (19.3%) | 1,123 (80.7%) |
| Total (Category) | 773 (30.1%) | 1,794 (69.9%) |
| Total (Overall) | 6,837 (52.8%) | 6,112 (47.2%) |
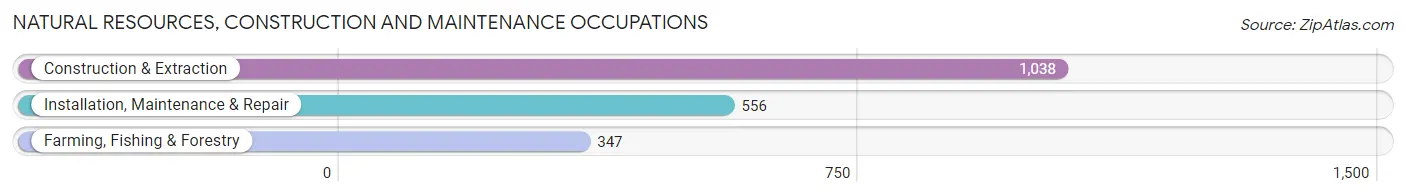
Natural Resources, Construction and Maintenance Occupations
The most common Natural Resources, Construction and Maintenance occupations in Iowa County are Construction & Extraction (1,038 | 8.0%), Installation, Maintenance & Repair (556 | 4.3%), and Farming, Fishing & Forestry (347 | 2.7%).
Natural Resources, Construction and Maintenance Occupations by Sex
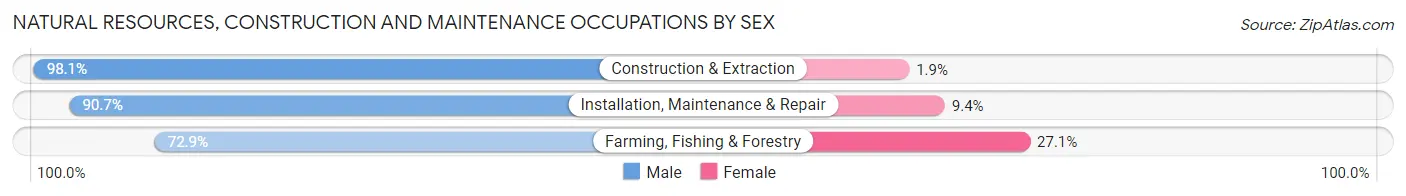
| Occupation | Male | Female |
| Farming, Fishing & Forestry | 253 (72.9%) | 94 (27.1%) |
| Construction & Extraction | 1,018 (98.1%) | 20 (1.9%) |
| Installation, Maintenance & Repair | 504 (90.6%) | 52 (9.3%) |
| Total (Category) | 1,775 (91.4%) | 166 (8.6%) |
| Total (Overall) | 6,837 (52.8%) | 6,112 (47.2%) |
Production, Transportation and Moving Occupations
The most common Production, Transportation and Moving occupations in Iowa County are Production (1,061 | 8.2%), Material Moving (650 | 5.0%), and Transportation (365 | 2.8%).

Production, Transportation and Moving Occupations by Sex
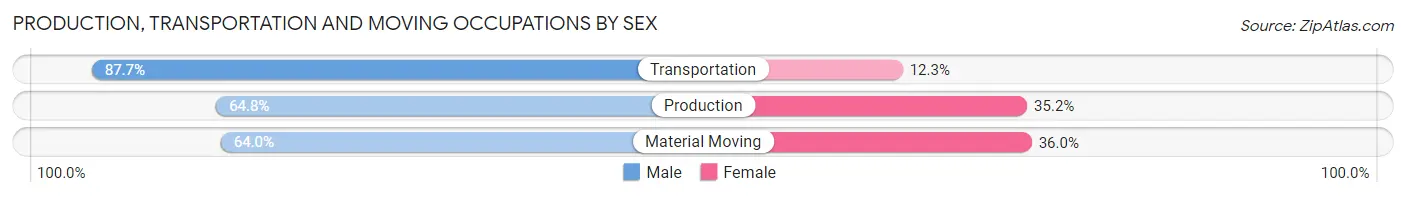
| Occupation | Male | Female |
| Production | 688 (64.8%) | 373 (35.2%) |
| Transportation | 320 (87.7%) | 45 (12.3%) |
| Material Moving | 416 (64.0%) | 234 (36.0%) |
| Total (Category) | 1,424 (68.6%) | 652 (31.4%) |
| Total (Overall) | 6,837 (52.8%) | 6,112 (47.2%) |
Employment Industries by Sex in Iowa County
Employment Industries in Iowa County
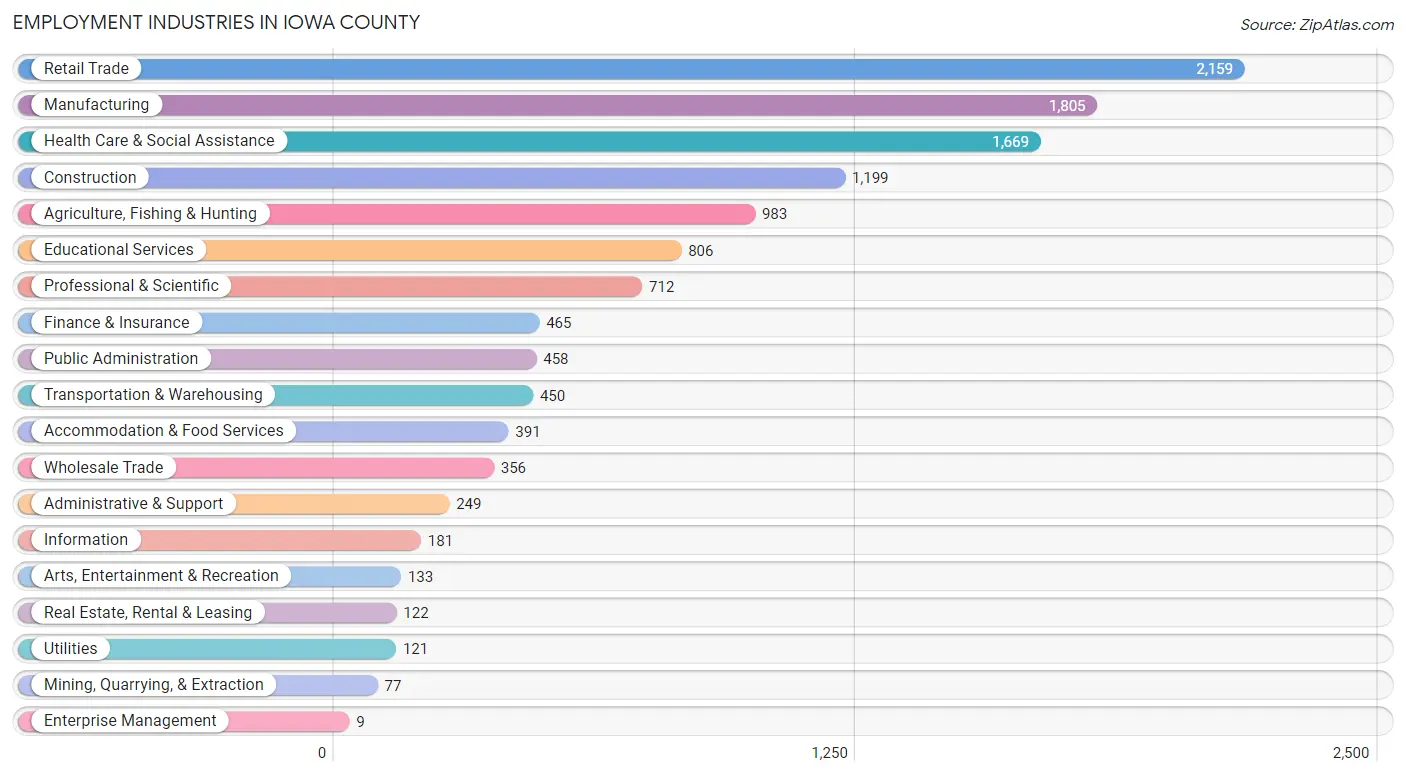
The major employment industries in Iowa County include Retail Trade (2,159 | 16.7%), Manufacturing (1,805 | 13.9%), Health Care & Social Assistance (1,669 | 12.9%), Construction (1,199 | 9.3%), and Agriculture, Fishing & Hunting (983 | 7.6%).
Employment Industries by Sex in Iowa County
The Iowa County industries that see more men than women are Mining, Quarrying, & Extraction (100.0%), Construction (93.9%), and Utilities (81.0%), whereas the industries that tend to have a higher number of women are Enterprise Management (88.9%), Finance & Insurance (82.8%), and Health Care & Social Assistance (80.3%).
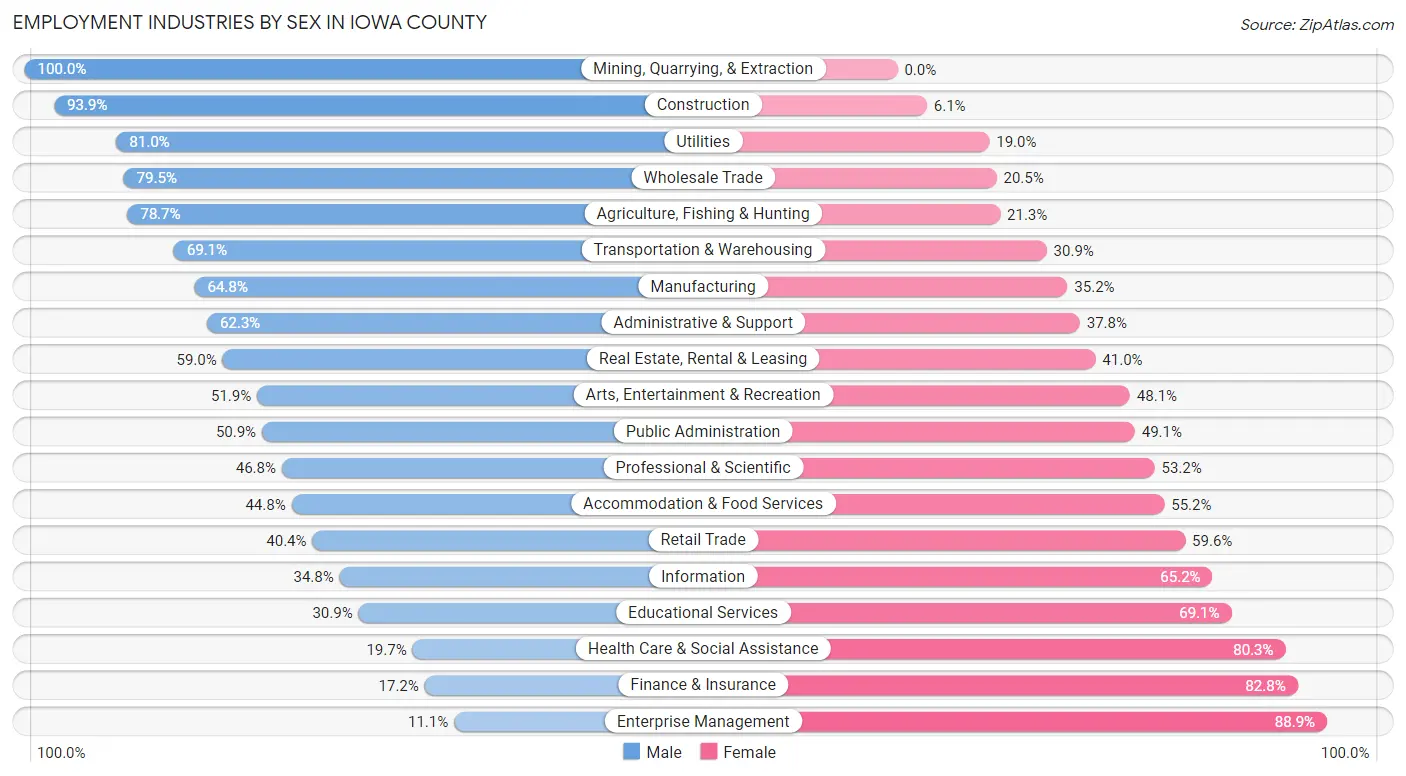
| Industry | Male | Female |
| Agriculture, Fishing & Hunting | 774 (78.7%) | 209 (21.3%) |
| Mining, Quarrying, & Extraction | 77 (100.0%) | 0 (0.0%) |
| Construction | 1,126 (93.9%) | 73 (6.1%) |
| Manufacturing | 1,170 (64.8%) | 635 (35.2%) |
| Wholesale Trade | 283 (79.5%) | 73 (20.5%) |
| Retail Trade | 873 (40.4%) | 1,286 (59.6%) |
| Transportation & Warehousing | 311 (69.1%) | 139 (30.9%) |
| Utilities | 98 (81.0%) | 23 (19.0%) |
| Information | 63 (34.8%) | 118 (65.2%) |
| Finance & Insurance | 80 (17.2%) | 385 (82.8%) |
| Real Estate, Rental & Leasing | 72 (59.0%) | 50 (41.0%) |
| Professional & Scientific | 333 (46.8%) | 379 (53.2%) |
| Enterprise Management | 1 (11.1%) | 8 (88.9%) |
| Administrative & Support | 155 (62.3%) | 94 (37.8%) |
| Educational Services | 249 (30.9%) | 557 (69.1%) |
| Health Care & Social Assistance | 329 (19.7%) | 1,340 (80.3%) |
| Arts, Entertainment & Recreation | 69 (51.9%) | 64 (48.1%) |
| Accommodation & Food Services | 175 (44.8%) | 216 (55.2%) |
| Public Administration | 233 (50.9%) | 225 (49.1%) |
| Total | 6,837 (52.8%) | 6,112 (47.2%) |
Education in Iowa County
School Enrollment in Iowa County
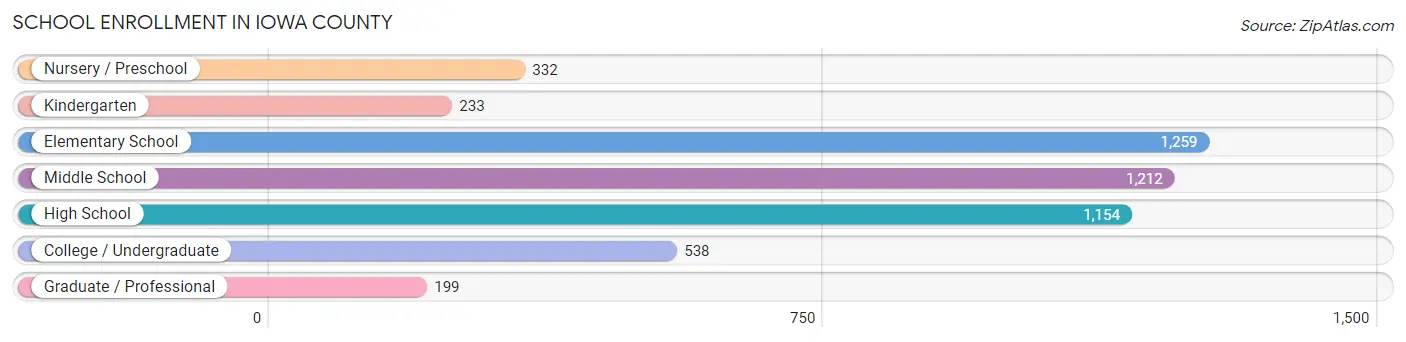
The most common levels of schooling among the 4,927 students in Iowa County are elementary school (1,259 | 25.6%), middle school (1,212 | 24.6%), and high school (1,154 | 23.4%).
| School Level | # Students | % Students |
| Nursery / Preschool | 332 | 6.7% |
| Kindergarten | 233 | 4.7% |
| Elementary School | 1,259 | 25.6% |
| Middle School | 1,212 | 24.6% |
| High School | 1,154 | 23.4% |
| College / Undergraduate | 538 | 10.9% |
| Graduate / Professional | 199 | 4.0% |
| Total | 4,927 | 100.0% |
School Enrollment by Age by Funding Source in Iowa County
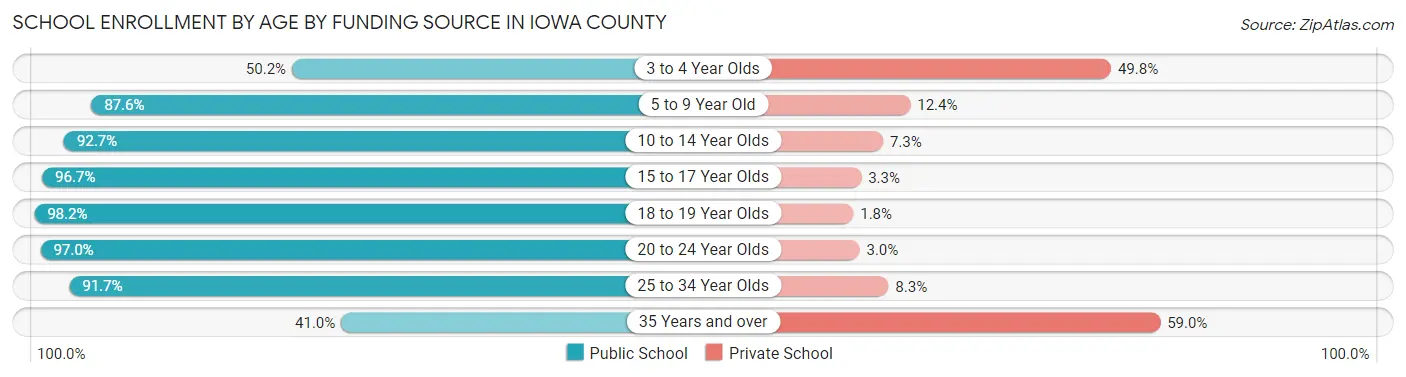
Out of a total of 4,927 students who are enrolled in schools in Iowa County, 601 (12.2%) attend a private institution, while the remaining 4,326 (87.8%) are enrolled in public schools. The age group of 35 years and over has the highest likelihood of being enrolled in private schools, with 148 (59.0% in the age bracket) enrolled. Conversely, the age group of 18 to 19 year olds has the lowest likelihood of being enrolled in a private school, with 219 (98.2% in the age bracket) attending a public institution.
| Age Bracket | Public School | Private School |
| 3 to 4 Year Olds | 120 (50.2%) | 119 (49.8%) |
| 5 to 9 Year Old | 1,158 (87.6%) | 164 (12.4%) |
| 10 to 14 Year Olds | 1,469 (92.7%) | 116 (7.3%) |
| 15 to 17 Year Olds | 887 (96.7%) | 30 (3.3%) |
| 18 to 19 Year Olds | 219 (98.2%) | 4 (1.8%) |
| 20 to 24 Year Olds | 262 (97.0%) | 8 (3.0%) |
| 25 to 34 Year Olds | 110 (91.7%) | 10 (8.3%) |
| 35 Years and over | 103 (41.0%) | 148 (59.0%) |
| Total | 4,326 (87.8%) | 601 (12.2%) |
Educational Attainment by Field of Study in Iowa County
Education (923 | 18.0%), business (898 | 17.5%), bio, nature & agricultural (714 | 13.9%), science & technology (572 | 11.1%), and arts & humanities (326 | 6.3%) are the most common fields of study among 5,138 individuals in Iowa County who have obtained a bachelor's degree or higher.
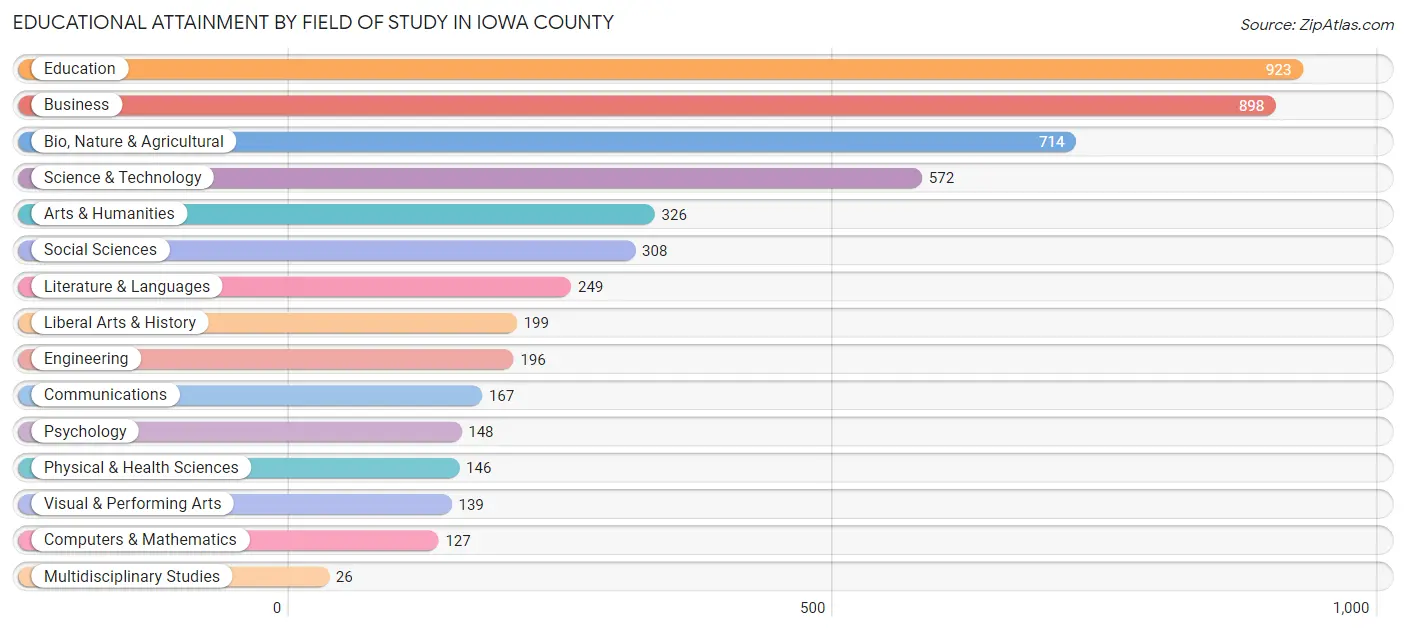
| Field of Study | # Graduates | % Graduates |
| Computers & Mathematics | 127 | 2.5% |
| Bio, Nature & Agricultural | 714 | 13.9% |
| Physical & Health Sciences | 146 | 2.8% |
| Psychology | 148 | 2.9% |
| Social Sciences | 308 | 6.0% |
| Engineering | 196 | 3.8% |
| Multidisciplinary Studies | 26 | 0.5% |
| Science & Technology | 572 | 11.1% |
| Business | 898 | 17.5% |
| Education | 923 | 18.0% |
| Literature & Languages | 249 | 4.9% |
| Liberal Arts & History | 199 | 3.9% |
| Visual & Performing Arts | 139 | 2.7% |
| Communications | 167 | 3.3% |
| Arts & Humanities | 326 | 6.3% |
| Total | 5,138 | 100.0% |
Transportation & Commute in Iowa County
Vehicle Availability by Sex in Iowa County
The most prevalent vehicle ownership categories in Iowa County are males with 2 vehicles (3,055, accounting for 45.4%) and females with 2 vehicles (2,721, making up 50.7%).
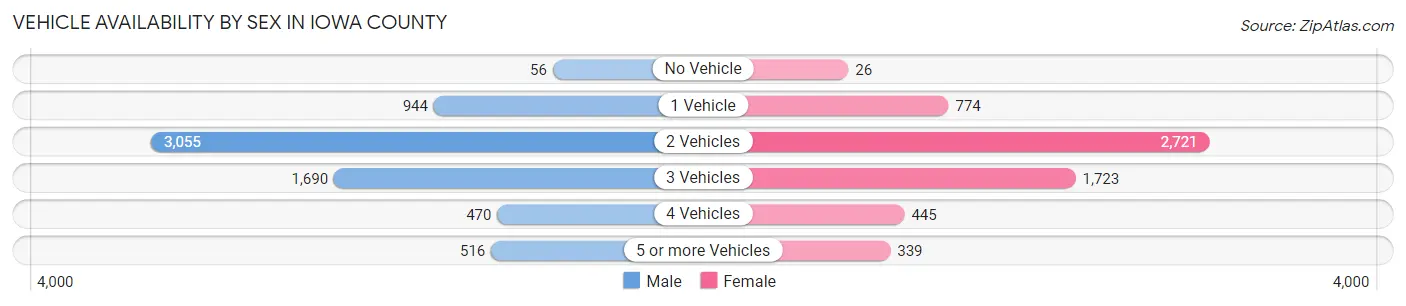
| Vehicles Available | Male | Female |
| No Vehicle | 56 (0.8%) | 26 (0.4%) |
| 1 Vehicle | 944 (14.0%) | 774 (12.8%) |
| 2 Vehicles | 3,055 (45.4%) | 2,721 (45.1%) |
| 3 Vehicles | 1,690 (25.1%) | 1,723 (28.6%) |
| 4 Vehicles | 470 (7.0%) | 445 (7.4%) |
| 5 or more Vehicles | 516 (7.7%) | 339 (5.6%) |
| Total | 6,731 (100.0%) | 6,028 (100.0%) |
Commute Time in Iowa County
The most frequently occuring commute durations in Iowa County are 5 to 9 minutes (1,669 commuters, 14.9%), 10 to 14 minutes (1,428 commuters, 12.7%), and 15 to 19 minutes (1,235 commuters, 11.0%).
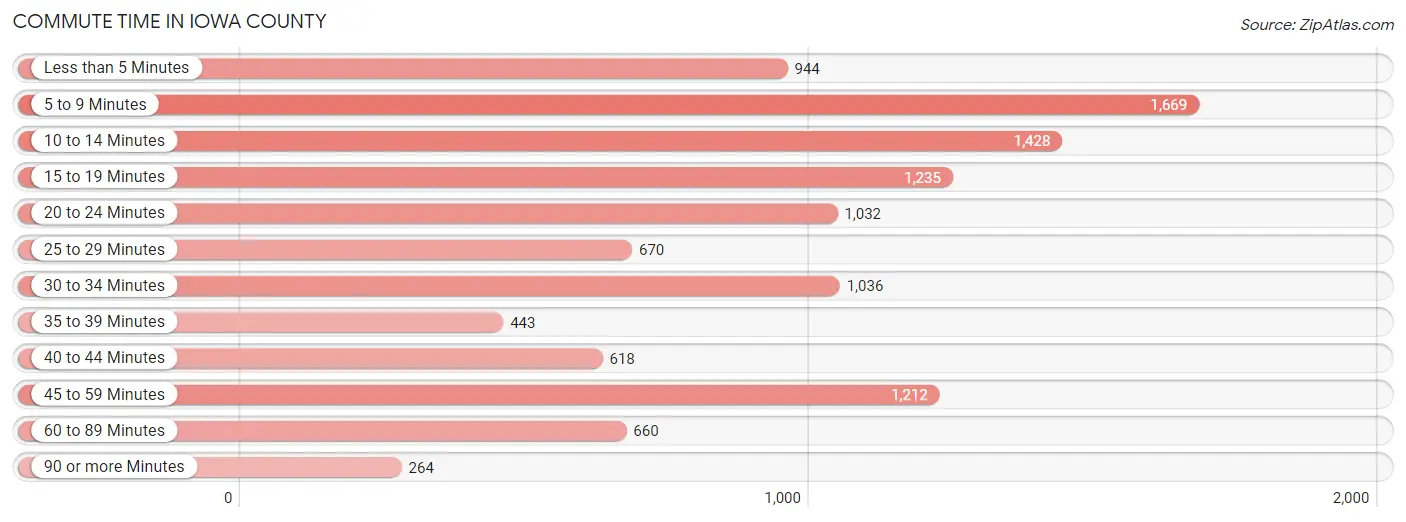
| Commute Time | # Commuters | % Commuters |
| Less than 5 Minutes | 944 | 8.4% |
| 5 to 9 Minutes | 1,669 | 14.9% |
| 10 to 14 Minutes | 1,428 | 12.7% |
| 15 to 19 Minutes | 1,235 | 11.0% |
| 20 to 24 Minutes | 1,032 | 9.2% |
| 25 to 29 Minutes | 670 | 6.0% |
| 30 to 34 Minutes | 1,036 | 9.2% |
| 35 to 39 Minutes | 443 | 4.0% |
| 40 to 44 Minutes | 618 | 5.5% |
| 45 to 59 Minutes | 1,212 | 10.8% |
| 60 to 89 Minutes | 660 | 5.9% |
| 90 or more Minutes | 264 | 2.4% |
Commute Time by Sex in Iowa County
The most common commute times in Iowa County are 5 to 9 minutes (818 commuters, 13.6%) for males and 5 to 9 minutes (851 commuters, 16.5%) for females.
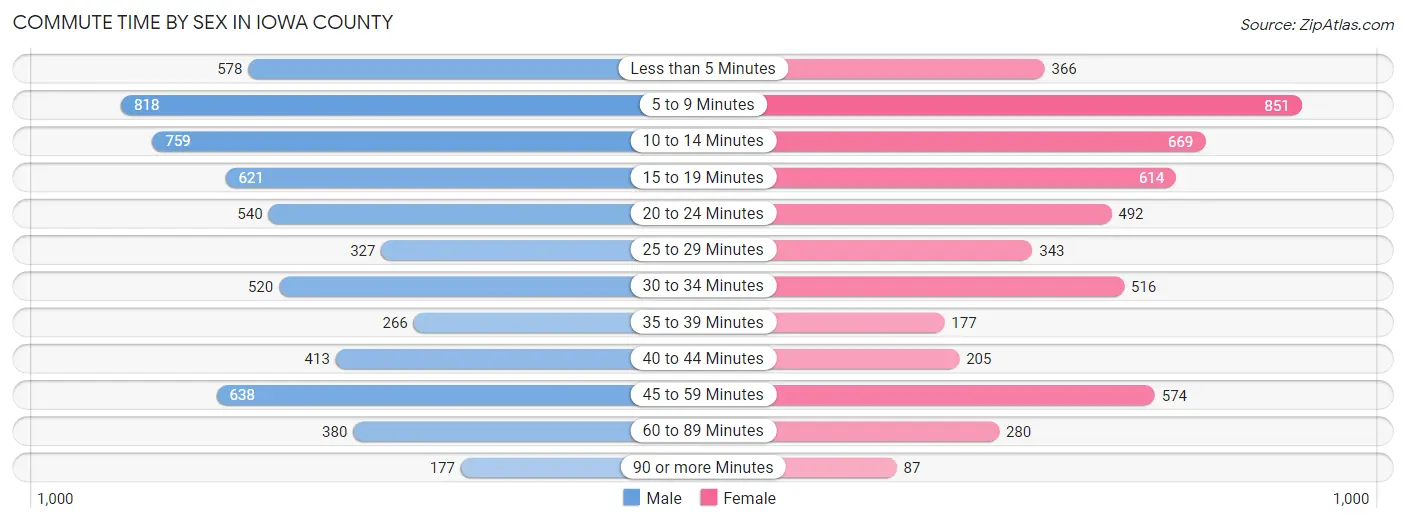
| Commute Time | Male | Female |
| Less than 5 Minutes | 578 (9.6%) | 366 (7.1%) |
| 5 to 9 Minutes | 818 (13.6%) | 851 (16.5%) |
| 10 to 14 Minutes | 759 (12.6%) | 669 (12.9%) |
| 15 to 19 Minutes | 621 (10.3%) | 614 (11.9%) |
| 20 to 24 Minutes | 540 (8.9%) | 492 (9.5%) |
| 25 to 29 Minutes | 327 (5.4%) | 343 (6.6%) |
| 30 to 34 Minutes | 520 (8.6%) | 516 (10.0%) |
| 35 to 39 Minutes | 266 (4.4%) | 177 (3.4%) |
| 40 to 44 Minutes | 413 (6.8%) | 205 (4.0%) |
| 45 to 59 Minutes | 638 (10.6%) | 574 (11.1%) |
| 60 to 89 Minutes | 380 (6.3%) | 280 (5.4%) |
| 90 or more Minutes | 177 (2.9%) | 87 (1.7%) |
Time of Departure to Work by Sex in Iowa County
The most frequent times of departure to work in Iowa County are 6:00 AM to 6:29 AM (922, 15.3%) for males and 7:00 AM to 7:29 AM (1,002, 19.4%) for females.
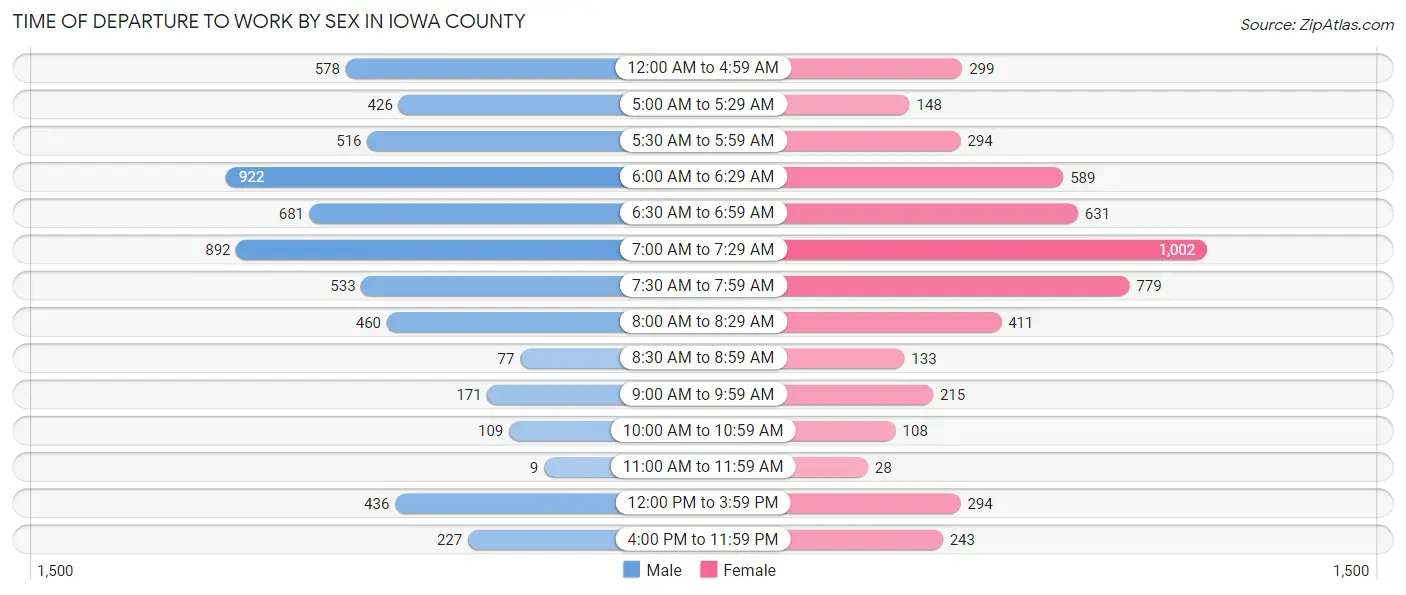
| Time of Departure | Male | Female |
| 12:00 AM to 4:59 AM | 578 (9.6%) | 299 (5.8%) |
| 5:00 AM to 5:29 AM | 426 (7.1%) | 148 (2.9%) |
| 5:30 AM to 5:59 AM | 516 (8.6%) | 294 (5.7%) |
| 6:00 AM to 6:29 AM | 922 (15.3%) | 589 (11.4%) |
| 6:30 AM to 6:59 AM | 681 (11.3%) | 631 (12.2%) |
| 7:00 AM to 7:29 AM | 892 (14.8%) | 1,002 (19.4%) |
| 7:30 AM to 7:59 AM | 533 (8.8%) | 779 (15.1%) |
| 8:00 AM to 8:29 AM | 460 (7.6%) | 411 (7.9%) |
| 8:30 AM to 8:59 AM | 77 (1.3%) | 133 (2.6%) |
| 9:00 AM to 9:59 AM | 171 (2.8%) | 215 (4.2%) |
| 10:00 AM to 10:59 AM | 109 (1.8%) | 108 (2.1%) |
| 11:00 AM to 11:59 AM | 9 (0.2%) | 28 (0.5%) |
| 12:00 PM to 3:59 PM | 436 (7.2%) | 294 (5.7%) |
| 4:00 PM to 11:59 PM | 227 (3.8%) | 243 (4.7%) |
| Total | 6,037 (100.0%) | 5,174 (100.0%) |
Housing Occupancy in Iowa County
Occupancy by Ownership in Iowa County
Of the total 9,795 dwellings in Iowa County, owner-occupied units account for 7,642 (78.0%), while renter-occupied units make up 2,153 (22.0%).
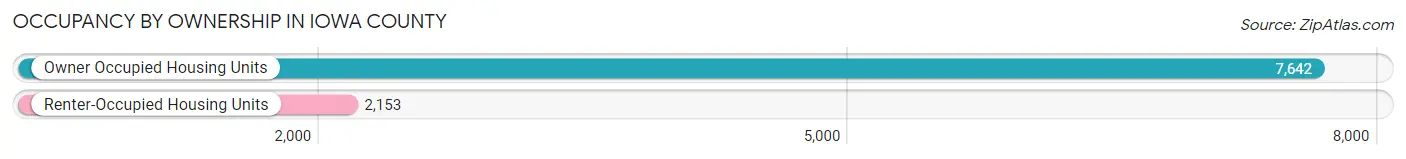
| Occupancy | # Housing Units | % Housing Units |
| Owner Occupied Housing Units | 7,642 | 78.0% |
| Renter-Occupied Housing Units | 2,153 | 22.0% |
| Total Occupied Housing Units | 9,795 | 100.0% |
Occupancy by Household Size in Iowa County
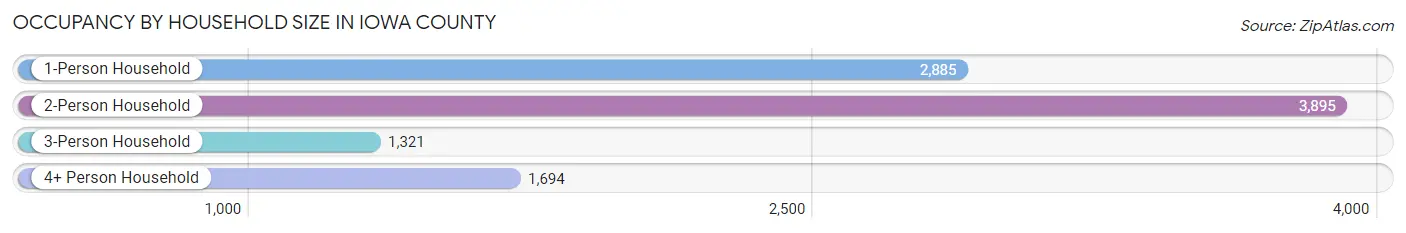
| Household Size | # Housing Units | % Housing Units |
| 1-Person Household | 2,885 | 29.4% |
| 2-Person Household | 3,895 | 39.8% |
| 3-Person Household | 1,321 | 13.5% |
| 4+ Person Household | 1,694 | 17.3% |
| Total Housing Units | 9,795 | 100.0% |
Occupancy by Ownership by Household Size in Iowa County
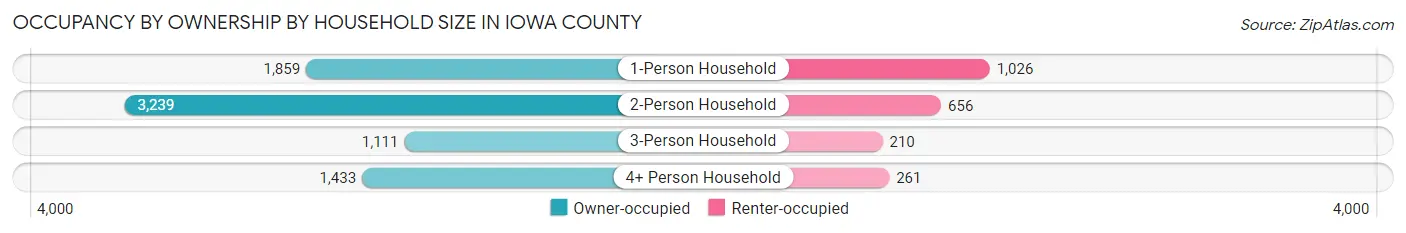
| Household Size | Owner-occupied | Renter-occupied |
| 1-Person Household | 1,859 (64.4%) | 1,026 (35.6%) |
| 2-Person Household | 3,239 (83.2%) | 656 (16.8%) |
| 3-Person Household | 1,111 (84.1%) | 210 (15.9%) |
| 4+ Person Household | 1,433 (84.6%) | 261 (15.4%) |
| Total Housing Units | 7,642 (78.0%) | 2,153 (22.0%) |
Occupancy by Educational Attainment in Iowa County
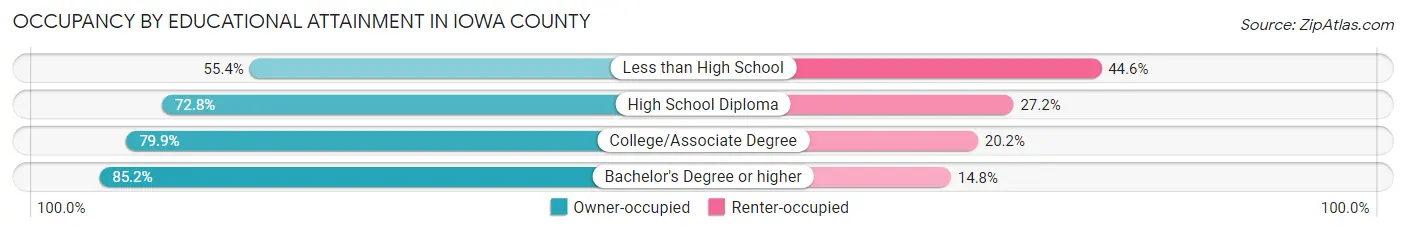
| Household Size | Owner-occupied | Renter-occupied |
| Less than High School | 247 (55.4%) | 199 (44.6%) |
| High School Diploma | 2,247 (72.8%) | 841 (27.2%) |
| College/Associate Degree | 2,778 (79.8%) | 701 (20.2%) |
| Bachelor's Degree or higher | 2,370 (85.2%) | 412 (14.8%) |
Occupancy by Age of Householder in Iowa County
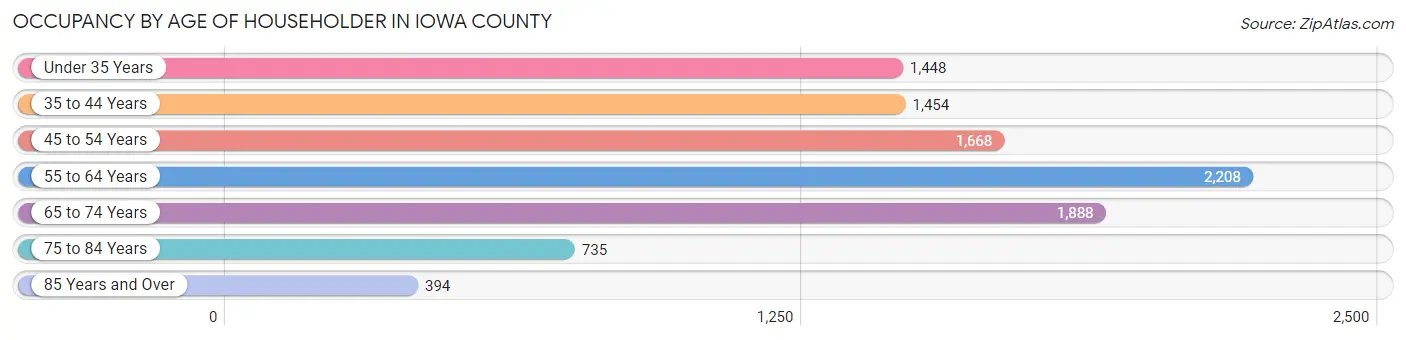
| Age Bracket | # Households | % Households |
| Under 35 Years | 1,448 | 14.8% |
| 35 to 44 Years | 1,454 | 14.8% |
| 45 to 54 Years | 1,668 | 17.0% |
| 55 to 64 Years | 2,208 | 22.5% |
| 65 to 74 Years | 1,888 | 19.3% |
| 75 to 84 Years | 735 | 7.5% |
| 85 Years and Over | 394 | 4.0% |
| Total | 9,795 | 100.0% |
Housing Finances in Iowa County
Median Income by Occupancy in Iowa County
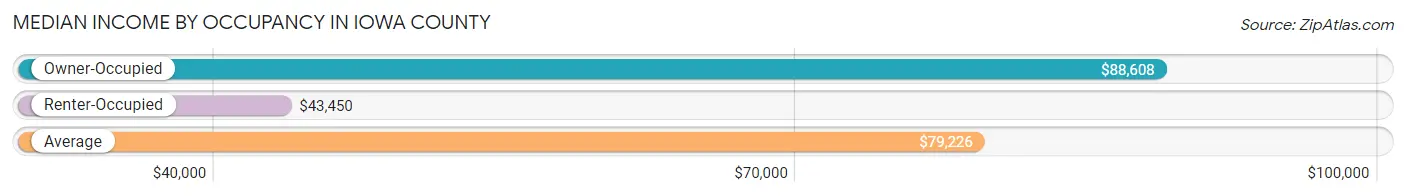
| Occupancy Type | # Households | Median Income |
| Owner-Occupied | 7,642 (78.0%) | $88,608 |
| Renter-Occupied | 2,153 (22.0%) | $43,450 |
| Average | 9,795 (100.0%) | $79,226 |
Occupancy by Householder Income Bracket in Iowa County
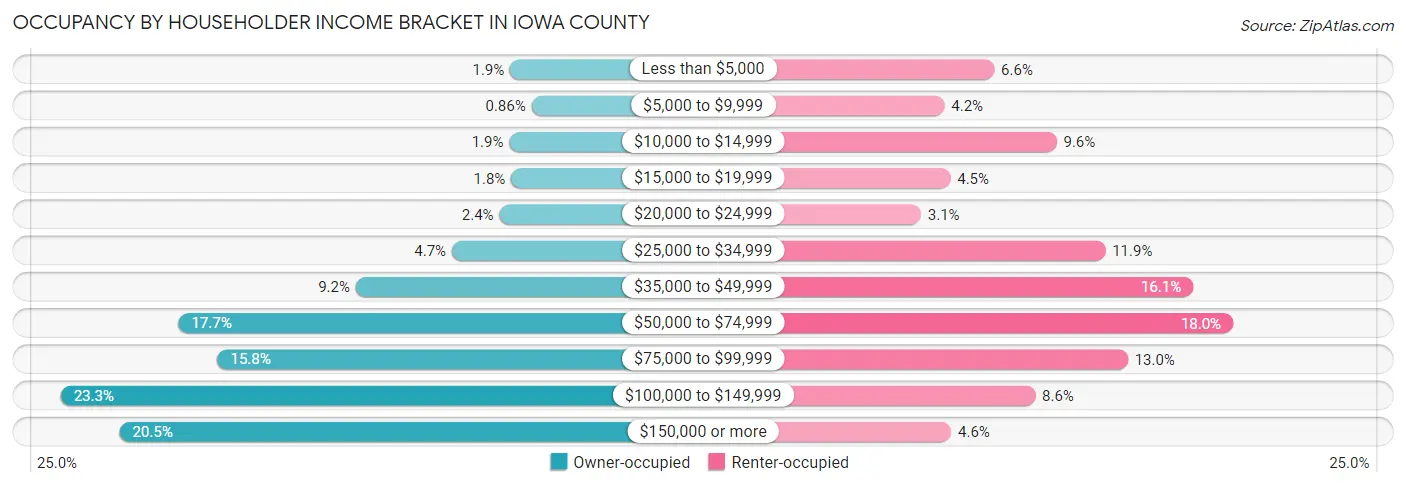
| Income Bracket | Owner-occupied | Renter-occupied |
| Less than $5,000 | 144 (1.9%) | 142 (6.6%) |
| $5,000 to $9,999 | 66 (0.9%) | 91 (4.2%) |
| $10,000 to $14,999 | 147 (1.9%) | 206 (9.6%) |
| $15,000 to $19,999 | 140 (1.8%) | 97 (4.5%) |
| $20,000 to $24,999 | 183 (2.4%) | 67 (3.1%) |
| $25,000 to $34,999 | 355 (4.6%) | 256 (11.9%) |
| $35,000 to $49,999 | 705 (9.2%) | 346 (16.1%) |
| $50,000 to $74,999 | 1,350 (17.7%) | 387 (18.0%) |
| $75,000 to $99,999 | 1,208 (15.8%) | 279 (13.0%) |
| $100,000 to $149,999 | 1,779 (23.3%) | 184 (8.6%) |
| $150,000 or more | 1,565 (20.5%) | 98 (4.5%) |
| Total | 7,642 (100.0%) | 2,153 (100.0%) |
Monthly Housing Cost Tiers in Iowa County
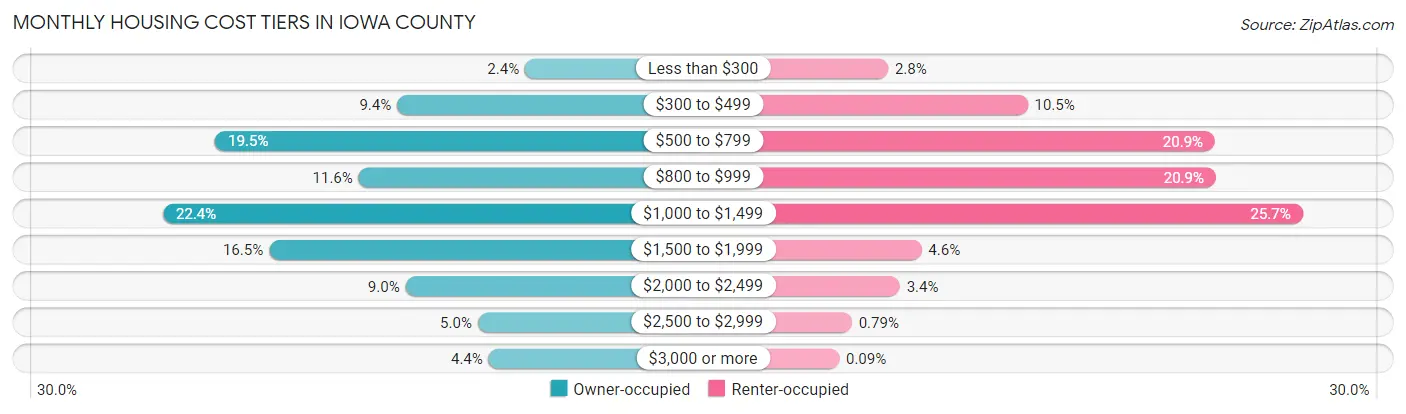
| Monthly Cost | Owner-occupied | Renter-occupied |
| Less than $300 | 180 (2.4%) | 60 (2.8%) |
| $300 to $499 | 721 (9.4%) | 226 (10.5%) |
| $500 to $799 | 1,489 (19.5%) | 449 (20.8%) |
| $800 to $999 | 883 (11.6%) | 450 (20.9%) |
| $1,000 to $1,499 | 1,709 (22.4%) | 553 (25.7%) |
| $1,500 to $1,999 | 1,261 (16.5%) | 100 (4.6%) |
| $2,000 to $2,499 | 685 (9.0%) | 74 (3.4%) |
| $2,500 to $2,999 | 380 (5.0%) | 17 (0.8%) |
| $3,000 or more | 334 (4.4%) | 2 (0.1%) |
| Total | 7,642 (100.0%) | 2,153 (100.0%) |
Physical Housing Characteristics in Iowa County
Housing Structures in Iowa County
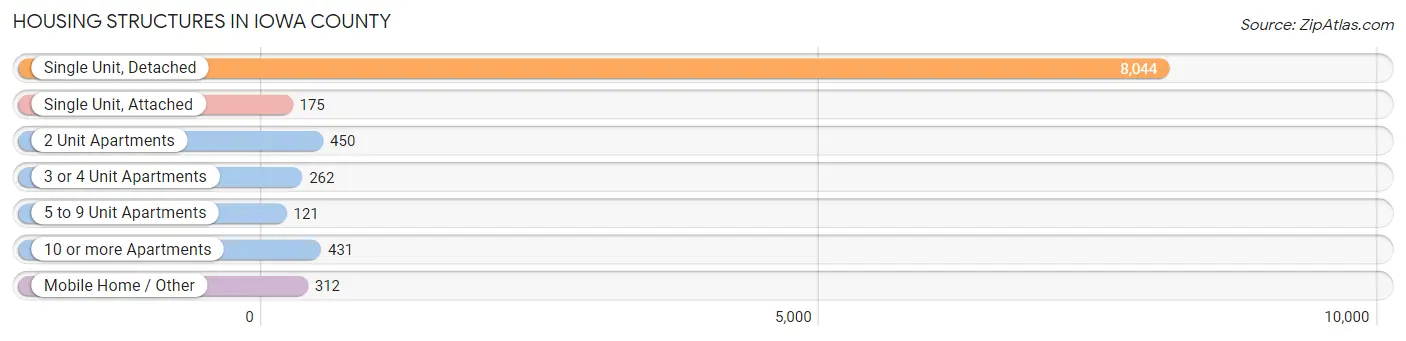
| Structure Type | # Housing Units | % Housing Units |
| Single Unit, Detached | 8,044 | 82.1% |
| Single Unit, Attached | 175 | 1.8% |
| 2 Unit Apartments | 450 | 4.6% |
| 3 or 4 Unit Apartments | 262 | 2.7% |
| 5 to 9 Unit Apartments | 121 | 1.2% |
| 10 or more Apartments | 431 | 4.4% |
| Mobile Home / Other | 312 | 3.2% |
| Total | 9,795 | 100.0% |
Housing Structures by Occupancy in Iowa County
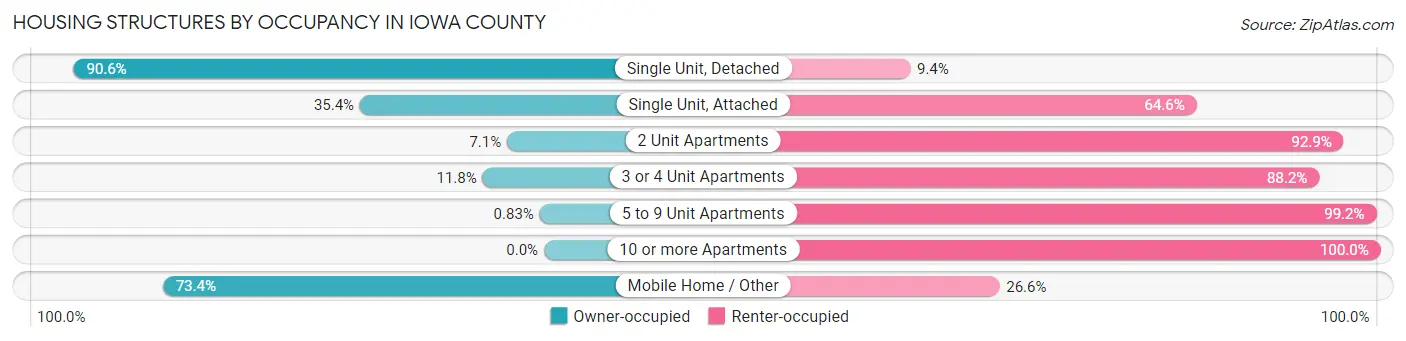
| Structure Type | Owner-occupied | Renter-occupied |
| Single Unit, Detached | 7,287 (90.6%) | 757 (9.4%) |
| Single Unit, Attached | 62 (35.4%) | 113 (64.6%) |
| 2 Unit Apartments | 32 (7.1%) | 418 (92.9%) |
| 3 or 4 Unit Apartments | 31 (11.8%) | 231 (88.2%) |
| 5 to 9 Unit Apartments | 1 (0.8%) | 120 (99.2%) |
| 10 or more Apartments | 0 (0.0%) | 431 (100.0%) |
| Mobile Home / Other | 229 (73.4%) | 83 (26.6%) |
| Total | 7,642 (78.0%) | 2,153 (22.0%) |
Housing Structures by Number of Rooms in Iowa County
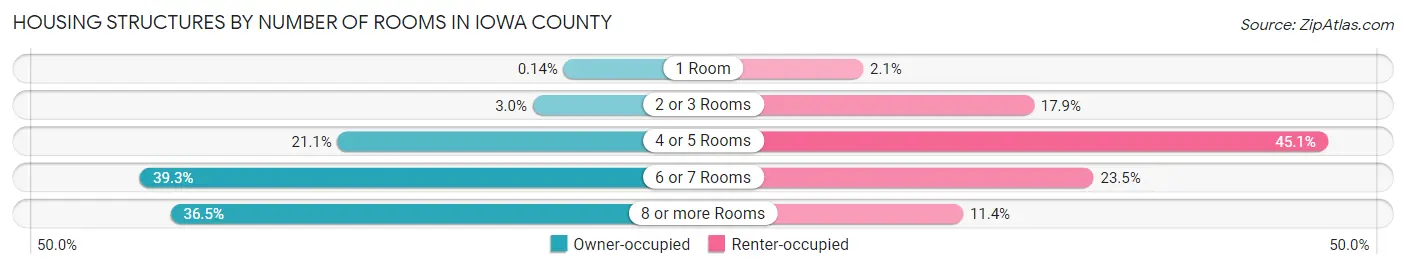
| Number of Rooms | Owner-occupied | Renter-occupied |
| 1 Room | 11 (0.1%) | 46 (2.1%) |
| 2 or 3 Rooms | 229 (3.0%) | 386 (17.9%) |
| 4 or 5 Rooms | 1,609 (21.0%) | 971 (45.1%) |
| 6 or 7 Rooms | 3,004 (39.3%) | 505 (23.5%) |
| 8 or more Rooms | 2,789 (36.5%) | 245 (11.4%) |
| Total | 7,642 (100.0%) | 2,153 (100.0%) |
Housing Structure by Heating Type in Iowa County
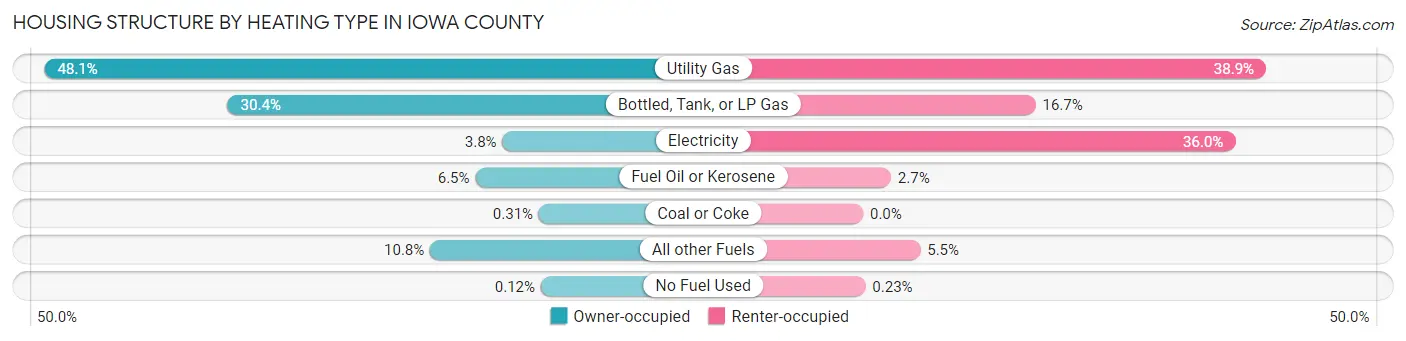
| Heating Type | Owner-occupied | Renter-occupied |
| Utility Gas | 3,674 (48.1%) | 838 (38.9%) |
| Bottled, Tank, or LP Gas | 2,322 (30.4%) | 359 (16.7%) |
| Electricity | 293 (3.8%) | 774 (35.9%) |
| Fuel Oil or Kerosene | 493 (6.5%) | 58 (2.7%) |
| Coal or Coke | 24 (0.3%) | 0 (0.0%) |
| All other Fuels | 827 (10.8%) | 119 (5.5%) |
| No Fuel Used | 9 (0.1%) | 5 (0.2%) |
| Total | 7,642 (100.0%) | 2,153 (100.0%) |
Household Vehicle Usage in Iowa County
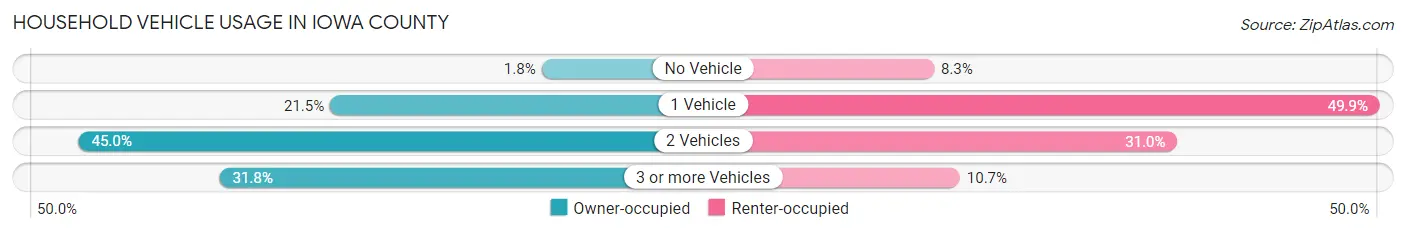
| Vehicles per Household | Owner-occupied | Renter-occupied |
| No Vehicle | 134 (1.8%) | 179 (8.3%) |
| 1 Vehicle | 1,642 (21.5%) | 1,075 (49.9%) |
| 2 Vehicles | 3,436 (45.0%) | 668 (31.0%) |
| 3 or more Vehicles | 2,430 (31.8%) | 231 (10.7%) |
| Total | 7,642 (100.0%) | 2,153 (100.0%) |
Real Estate & Mortgages in Iowa County
Real Estate and Mortgage Overview in Iowa County
| Characteristic | Without Mortgage | With Mortgage |
| Housing Units | 2,999 | 4,643 |
| Median Property Value | $227,100 | $233,500 |
| Median Household Income | $63,862 | $1,202 |
| Monthly Housing Costs | $634 | $333 |
| Real Estate Taxes | $3,664 | $17 |
Property Value by Mortgage Status in Iowa County
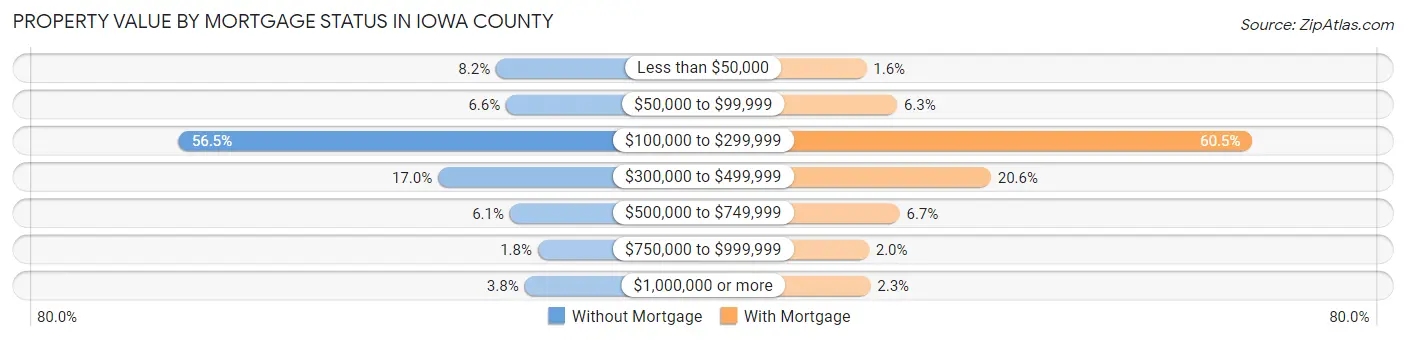
| Property Value | Without Mortgage | With Mortgage |
| Less than $50,000 | 245 (8.2%) | 76 (1.6%) |
| $50,000 to $99,999 | 199 (6.6%) | 293 (6.3%) |
| $100,000 to $299,999 | 1,694 (56.5%) | 2,807 (60.5%) |
| $300,000 to $499,999 | 510 (17.0%) | 957 (20.6%) |
| $500,000 to $749,999 | 182 (6.1%) | 311 (6.7%) |
| $750,000 to $999,999 | 54 (1.8%) | 94 (2.0%) |
| $1,000,000 or more | 115 (3.8%) | 105 (2.3%) |
| Total | 2,999 (100.0%) | 4,643 (100.0%) |
Household Income by Mortgage Status in Iowa County
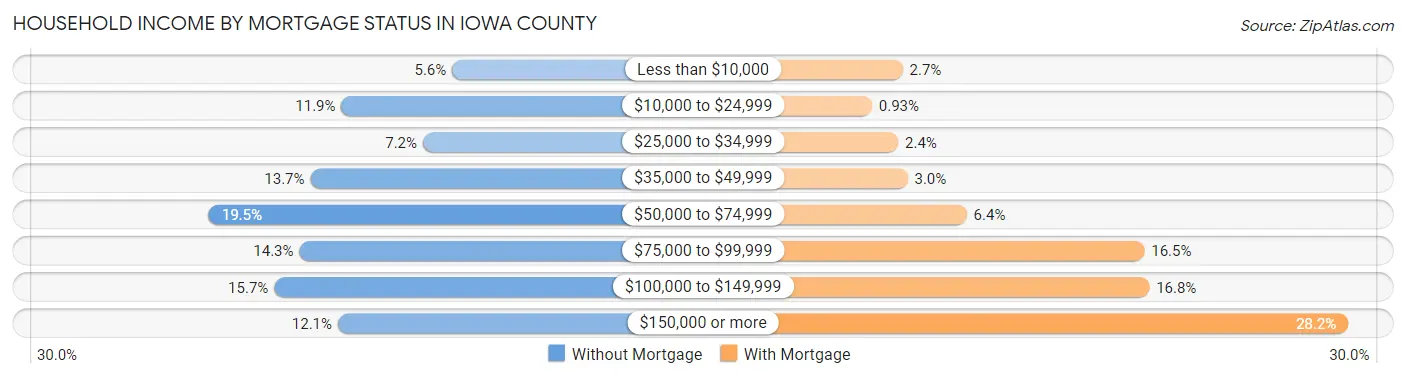
| Household Income | Without Mortgage | With Mortgage |
| Less than $10,000 | 167 (5.6%) | 125 (2.7%) |
| $10,000 to $24,999 | 357 (11.9%) | 43 (0.9%) |
| $25,000 to $34,999 | 217 (7.2%) | 113 (2.4%) |
| $35,000 to $49,999 | 410 (13.7%) | 138 (3.0%) |
| $50,000 to $74,999 | 584 (19.5%) | 295 (6.4%) |
| $75,000 to $99,999 | 429 (14.3%) | 766 (16.5%) |
| $100,000 to $149,999 | 472 (15.7%) | 779 (16.8%) |
| $150,000 or more | 363 (12.1%) | 1,307 (28.1%) |
| Total | 2,999 (100.0%) | 4,643 (100.0%) |
Property Value to Household Income Ratio in Iowa County

| Value-to-Income Ratio | Without Mortgage | With Mortgage |
| Less than 2.0x | 762 (25.4%) | 105,060 (2,262.8%) |
| 2.0x to 2.9x | 640 (21.3%) | 1,871 (40.3%) |
| 3.0x to 3.9x | 313 (10.4%) | 1,322 (28.5%) |
| 4.0x or more | 1,210 (40.4%) | 555 (11.9%) |
| Total | 2,999 (100.0%) | 4,643 (100.0%) |
Real Estate Taxes by Mortgage Status in Iowa County
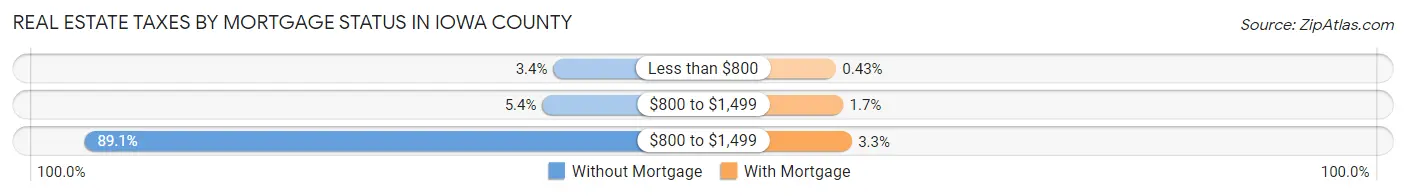
| Property Taxes | Without Mortgage | With Mortgage |
| Less than $800 | 103 (3.4%) | 20 (0.4%) |
| $800 to $1,499 | 163 (5.4%) | 81 (1.7%) |
| $800 to $1,499 | 2,671 (89.1%) | 154 (3.3%) |
| Total | 2,999 (100.0%) | 4,643 (100.0%) |
Health & Disability in Iowa County
Health Insurance Coverage by Age in Iowa County
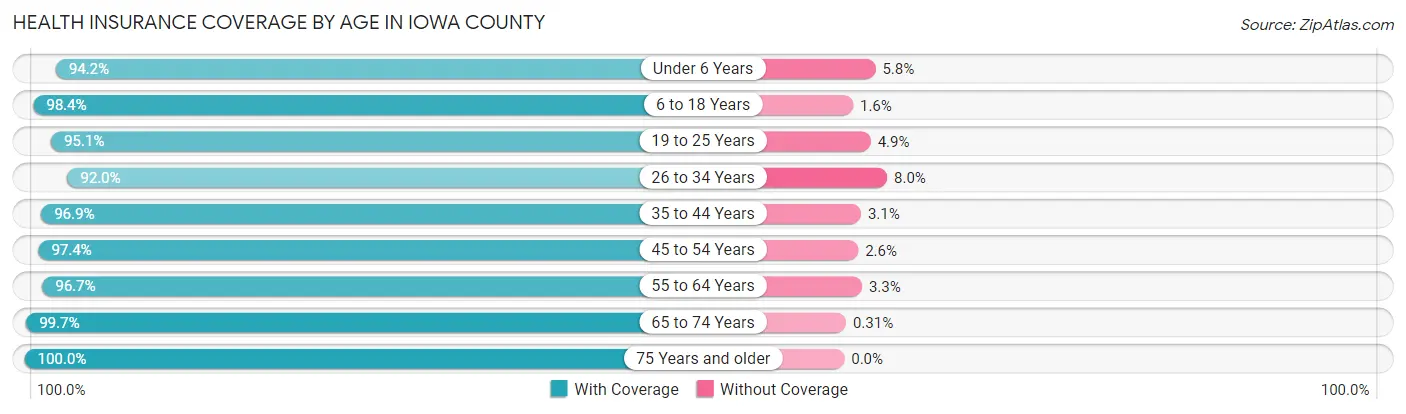
| Age Bracket | With Coverage | Without Coverage |
| Under 6 Years | 1,457 (94.2%) | 90 (5.8%) |
| 6 to 18 Years | 3,862 (98.4%) | 64 (1.6%) |
| 19 to 25 Years | 1,486 (95.1%) | 77 (4.9%) |
| 26 to 34 Years | 2,226 (92.0%) | 193 (8.0%) |
| 35 to 44 Years | 2,708 (96.9%) | 87 (3.1%) |
| 45 to 54 Years | 2,967 (97.4%) | 79 (2.6%) |
| 55 to 64 Years | 3,726 (96.7%) | 127 (3.3%) |
| 65 to 74 Years | 2,861 (99.7%) | 9 (0.3%) |
| 75 Years and older | 1,586 (100.0%) | 0 (0.0%) |
| Total | 22,879 (96.9%) | 726 (3.1%) |
Health Insurance Coverage by Citizenship Status in Iowa County
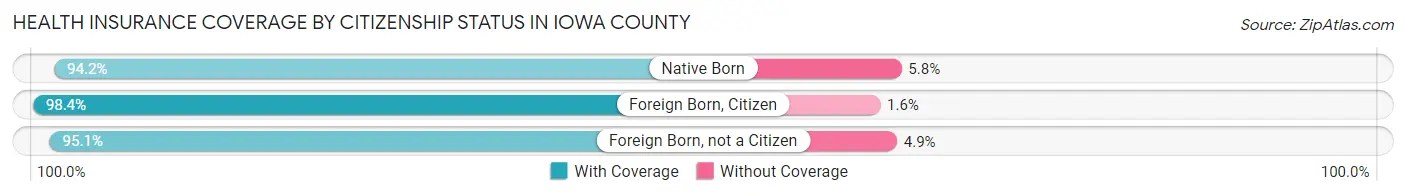
| Citizenship Status | With Coverage | Without Coverage |
| Native Born | 1,457 (94.2%) | 90 (5.8%) |
| Foreign Born, Citizen | 3,862 (98.4%) | 64 (1.6%) |
| Foreign Born, not a Citizen | 1,486 (95.1%) | 77 (4.9%) |
Health Insurance Coverage by Household Income in Iowa County
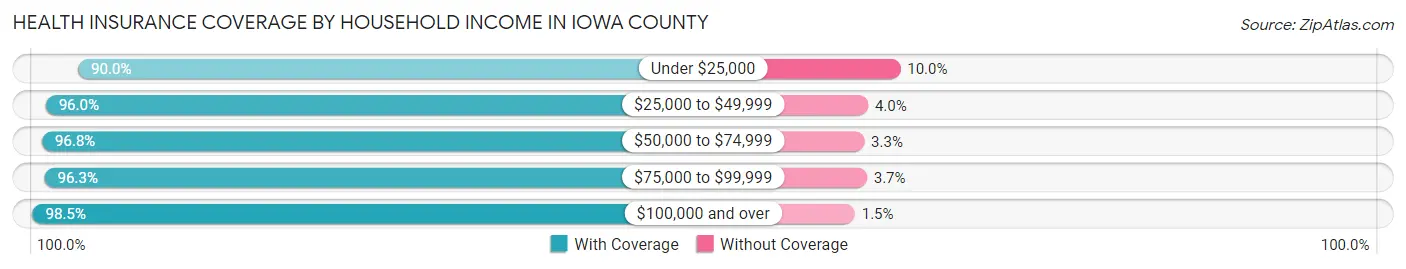
| Household Income | With Coverage | Without Coverage |
| Under $25,000 | 1,634 (90.0%) | 182 (10.0%) |
| $25,000 to $49,999 | 2,803 (96.0%) | 116 (4.0%) |
| $50,000 to $74,999 | 3,458 (96.8%) | 116 (3.3%) |
| $75,000 to $99,999 | 3,634 (96.3%) | 141 (3.7%) |
| $100,000 and over | 11,256 (98.5%) | 171 (1.5%) |
Public vs Private Health Insurance Coverage by Age in Iowa County
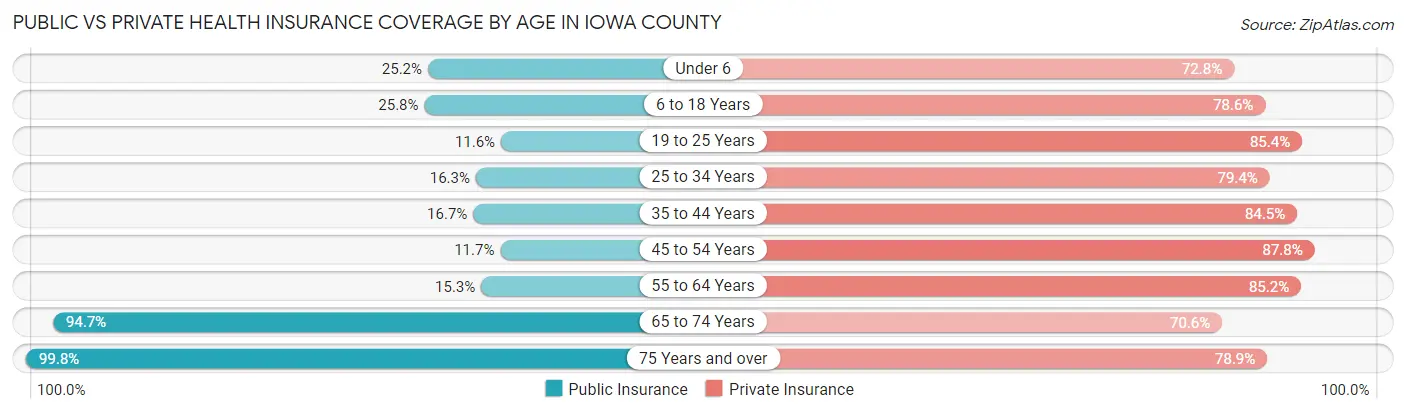
| Age Bracket | Public Insurance | Private Insurance |
| Under 6 | 389 (25.2%) | 1,126 (72.8%) |
| 6 to 18 Years | 1,013 (25.8%) | 3,085 (78.6%) |
| 19 to 25 Years | 181 (11.6%) | 1,335 (85.4%) |
| 25 to 34 Years | 393 (16.3%) | 1,921 (79.4%) |
| 35 to 44 Years | 468 (16.7%) | 2,362 (84.5%) |
| 45 to 54 Years | 357 (11.7%) | 2,673 (87.7%) |
| 55 to 64 Years | 588 (15.3%) | 3,284 (85.2%) |
| 65 to 74 Years | 2,719 (94.7%) | 2,026 (70.6%) |
| 75 Years and over | 1,582 (99.8%) | 1,252 (78.9%) |
| Total | 7,690 (32.6%) | 19,064 (80.8%) |
Disability Status by Sex by Age in Iowa County
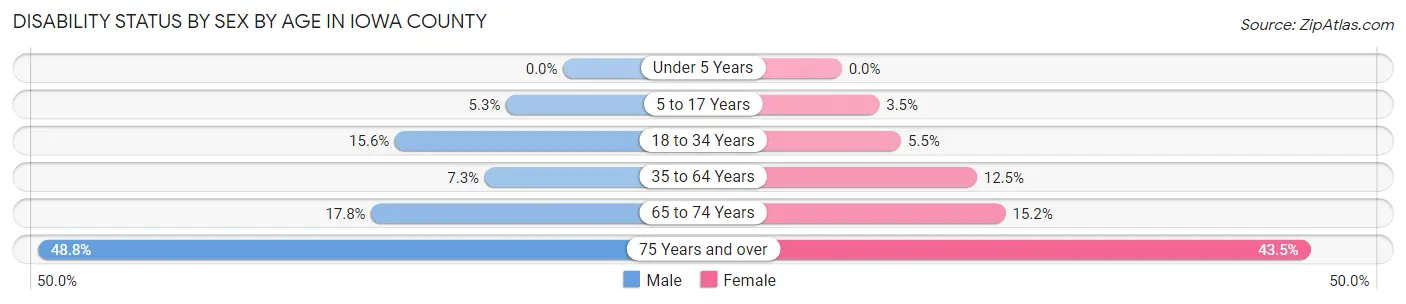
| Age Bracket | Male | Female |
| Under 5 Years | 0 (0.0%) | 0 (0.0%) |
| 5 to 17 Years | 109 (5.3%) | 66 (3.5%) |
| 18 to 34 Years | 341 (15.6%) | 112 (5.5%) |
| 35 to 64 Years | 359 (7.3%) | 597 (12.5%) |
| 65 to 74 Years | 258 (17.8%) | 216 (15.2%) |
| 75 Years and over | 354 (48.8%) | 374 (43.5%) |
Disability Class by Sex by Age in Iowa County
Disability Class: Hearing Difficulty
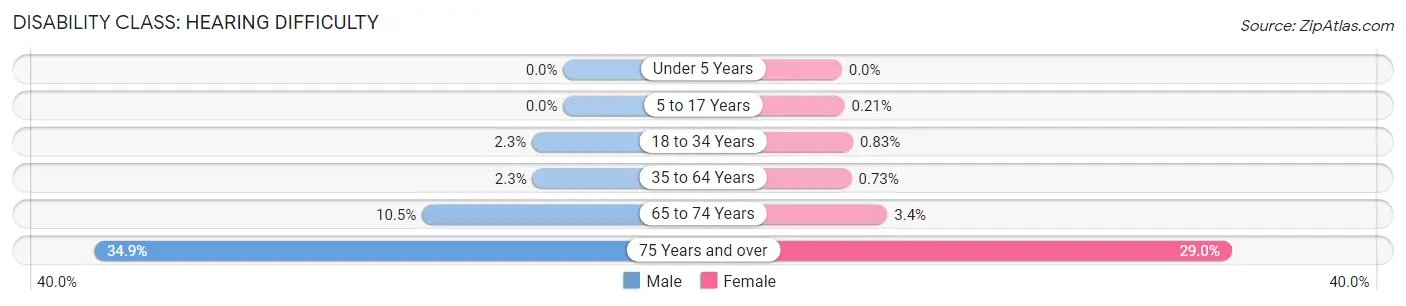
| Age Bracket | Male | Female |
| Under 5 Years | 0 (0.0%) | 0 (0.0%) |
| 5 to 17 Years | 0 (0.0%) | 4 (0.2%) |
| 18 to 34 Years | 51 (2.3%) | 17 (0.8%) |
| 35 to 64 Years | 113 (2.3%) | 35 (0.7%) |
| 65 to 74 Years | 152 (10.5%) | 48 (3.4%) |
| 75 Years and over | 253 (34.8%) | 249 (28.9%) |
Disability Class: Vision Difficulty

| Age Bracket | Male | Female |
| Under 5 Years | 0 (0.0%) | 0 (0.0%) |
| 5 to 17 Years | 2 (0.1%) | 16 (0.8%) |
| 18 to 34 Years | 21 (1.0%) | 5 (0.3%) |
| 35 to 64 Years | 76 (1.5%) | 98 (2.1%) |
| 65 to 74 Years | 26 (1.8%) | 12 (0.8%) |
| 75 Years and over | 39 (5.4%) | 58 (6.7%) |
Disability Class: Cognitive Difficulty
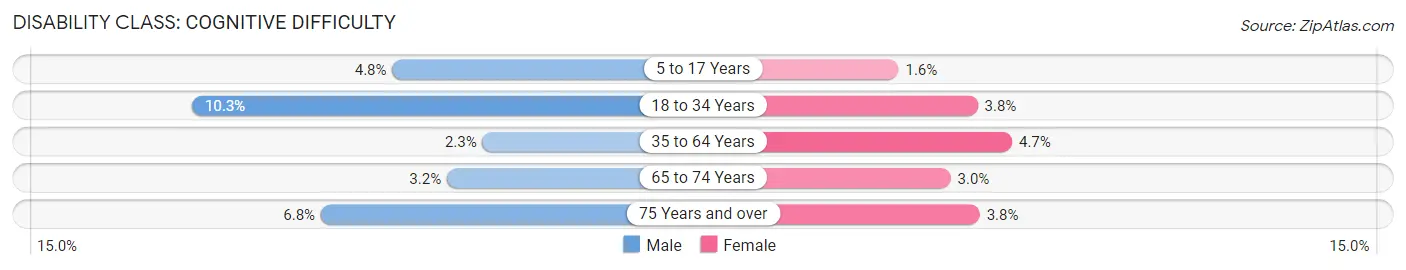
| Age Bracket | Male | Female |
| 5 to 17 Years | 98 (4.8%) | 30 (1.6%) |
| 18 to 34 Years | 226 (10.3%) | 77 (3.8%) |
| 35 to 64 Years | 111 (2.2%) | 226 (4.7%) |
| 65 to 74 Years | 47 (3.2%) | 43 (3.0%) |
| 75 Years and over | 49 (6.8%) | 33 (3.8%) |
Disability Class: Ambulatory Difficulty
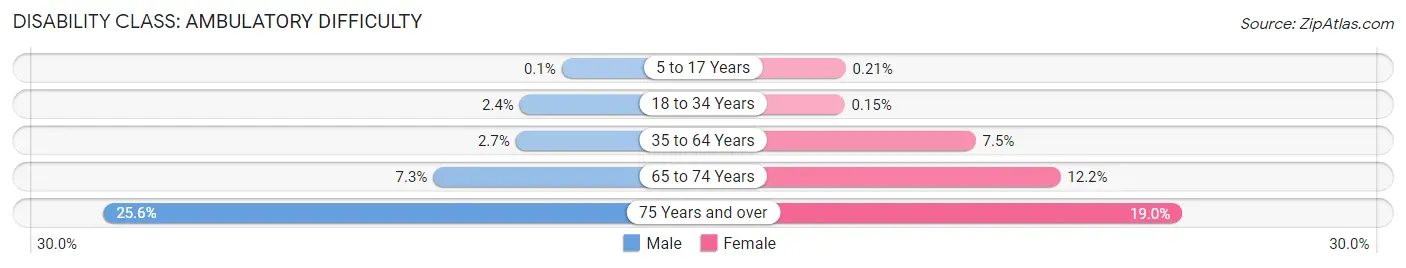
| Age Bracket | Male | Female |
| 5 to 17 Years | 2 (0.1%) | 4 (0.2%) |
| 18 to 34 Years | 53 (2.4%) | 3 (0.2%) |
| 35 to 64 Years | 131 (2.7%) | 355 (7.4%) |
| 65 to 74 Years | 105 (7.2%) | 173 (12.2%) |
| 75 Years and over | 186 (25.6%) | 163 (19.0%) |
Disability Class: Self-Care Difficulty
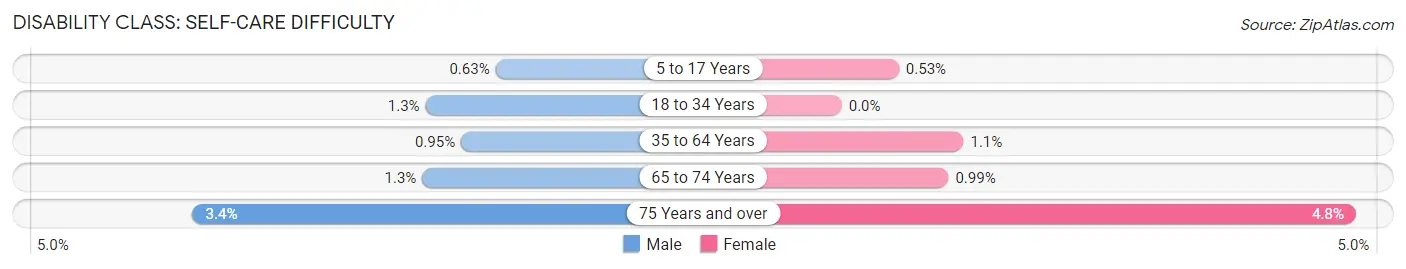
| Age Bracket | Male | Female |
| 5 to 17 Years | 13 (0.6%) | 10 (0.5%) |
| 18 to 34 Years | 28 (1.3%) | 0 (0.0%) |
| 35 to 64 Years | 47 (0.9%) | 54 (1.1%) |
| 65 to 74 Years | 19 (1.3%) | 14 (1.0%) |
| 75 Years and over | 25 (3.4%) | 41 (4.8%) |
Technology Access in Iowa County
Computing Device Access in Iowa County
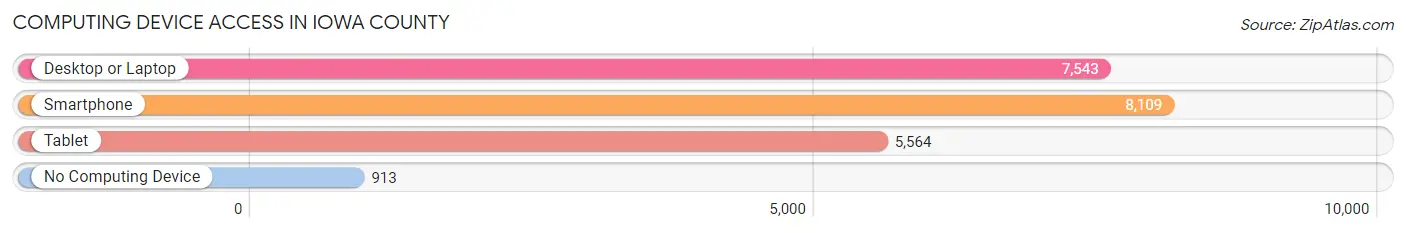
| Device Type | # Households | % Households |
| Desktop or Laptop | 7,543 | 77.0% |
| Smartphone | 8,109 | 82.8% |
| Tablet | 5,564 | 56.8% |
| No Computing Device | 913 | 9.3% |
| Total | 9,795 | 100.0% |
Internet Access in Iowa County
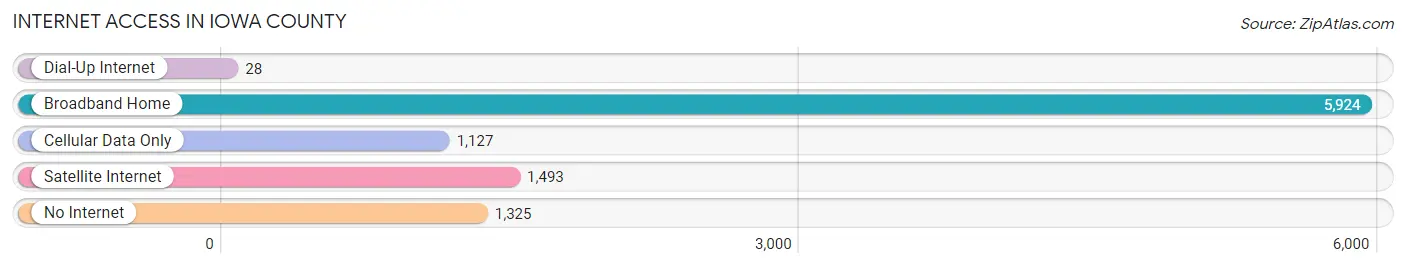
| Internet Type | # Households | % Households |
| Dial-Up Internet | 28 | 0.3% |
| Broadband Home | 5,924 | 60.5% |
| Cellular Data Only | 1,127 | 11.5% |
| Satellite Internet | 1,493 | 15.2% |
| No Internet | 1,325 | 13.5% |
| Total | 9,795 | 100.0% |
Iowa County Summary
Iowa County is located in the south-central region of Wisconsin, and is part of the Madison Metropolitan Statistical Area. The county seat is Dodgeville, and the county is bordered by Dane, Sauk, Richland, Lafayette, Grant, and Green counties. Iowa County is home to a population of 23,687 people, according to the 2010 census.
Geography
Iowa County is located in the Driftless Area of Wisconsin, which is characterized by its rugged terrain and rolling hills. The county is home to several rivers, including the Wisconsin, Pecatonica, and Sugar rivers. The highest point in the county is located in the town of Arena, at an elevation of 1,541 feet. The county is also home to several state parks, including Governor Dodge State Park, Blue Mound State Park, and Yellowstone Lake State Park.
Economy
The economy of Iowa County is largely based on agriculture, with dairy farming being the primary industry. Other major industries in the county include manufacturing, retail, and tourism. The county is home to several large employers, including the University of Wisconsin-Platteville, the Iowa County Health Care Center, and the Iowa County Courthouse.
Demographics
As of the 2010 census, the population of Iowa County was 23,687, with a population density of 39.3 people per square mile. The median household income was $50,945, and the median family income was $60,945. The median age was 40.7 years, and the population was 91.2% white, 4.2% Hispanic or Latino, 1.2% African American, 0.7% Asian, and 0.3% Native American.
Education
Iowa County is served by the Iowa County School District, which includes seven elementary schools, two middle schools, and two high schools. The county is also home to the University of Wisconsin-Platteville, which offers a variety of undergraduate and graduate degree programs.
Conclusion
Iowa County is a rural county located in the south-central region of Wisconsin. The county is home to a population of 23,687 people, and is largely based on agriculture, with dairy farming being the primary industry. The county is served by the Iowa County School District, and is home to the University of Wisconsin-Platteville. Iowa County is a great place to live, work, and raise a family.
Common Questions
What is the Total Population of Iowa County?
Total Population of Iowa County is 23,766.
What is the Total Male Population of Iowa County?
Total Male Population of Iowa County is 12,060.
What is the Total Female Population of Iowa County?
Total Female Population of Iowa County is 11,706.
What is the Ratio of Males per 100 Females in Iowa County?
There are 103.02 Males per 100 Females in Iowa County.
What is the Ratio of Females per 100 Males in Iowa County?
There are 97.06 Females per 100 Males in Iowa County.
What is the Median Population Age in Iowa County?
Median Population Age in Iowa County is 43.5 Years.
What is the Average Family Size in Iowa County
Average Family Size in Iowa County is 3.0 People.
What is the Average Household Size in Iowa County
Average Household Size in Iowa County is 2.4 People.
What is Per Capita Income in Iowa County?
Per Capita income in Iowa County is $39,330.
What is the Median Family Income in Iowa County?
Median Family Income in Iowa County is $101,563.
What is the Median Household income in Iowa County?
Median Household Income in Iowa County is $79,226.
What is Income or Wage Gap in Iowa County?
Income or Wage Gap in Iowa County is 20.8%.
Women in Iowa County earn 79.2 cents for every dollar earned by a man.
What is Family Income Deficit in Iowa County?
Family Income Deficit in Iowa County is $11,306.
Families that are below poverty line in Iowa County earn $11,306 less on average than the poverty threshold level.
What is Inequality or Gini Index in Iowa County?
Inequality or Gini Index in Iowa County is 0.40.
How Large is the Labor Force in Iowa County?
There are 13,273 People in the Labor Forcein in Iowa County.
What is the Percentage of People in the Labor Force in Iowa County?
69.5% of People are in the Labor Force in Iowa County.
What is the Unemployment Rate in Iowa County?
Unemployment Rate in Iowa County is 2.4%.