Green Lake County, WI
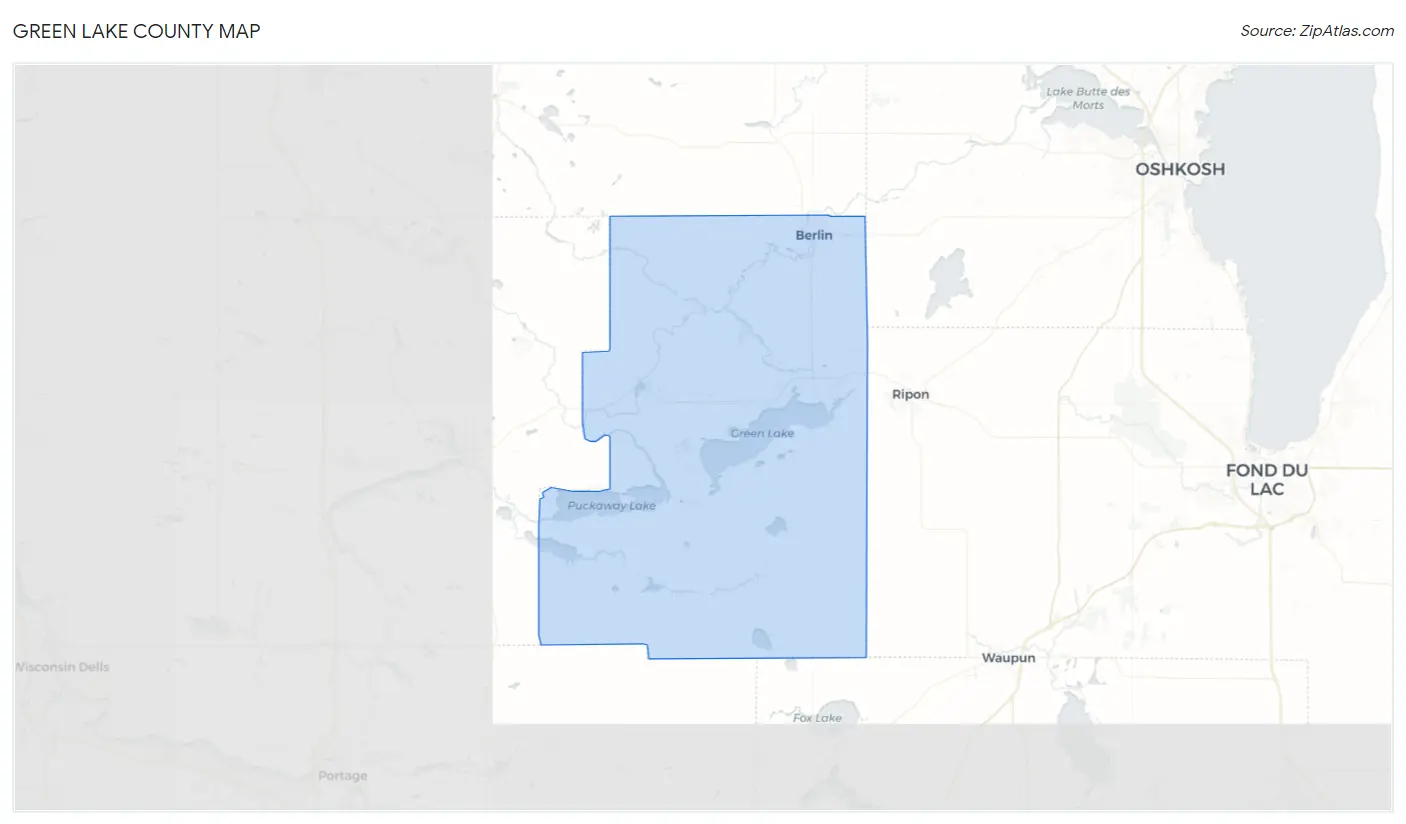
Green Lake County Map
Green Lake County Overview
19,093
TOTAL POPULATION
9,640
MALE POPULATION
9,453
FEMALE POPULATION
101.98
MALES / 100 FEMALES
98.06
FEMALES / 100 MALES
45.3
MEDIAN AGE
2.8
AVG FAMILY SIZE
2.3
AVG HOUSEHOLD SIZE
$35,222
PER CAPITA INCOME
$81,534
AVG FAMILY INCOME
$66,395
AVG HOUSEHOLD INCOME
34.6%
WAGE / INCOME GAP [ % ]
65.4¢/ $1
WAGE / INCOME GAP [ $ ]
$13,112
FAMILY INCOME DEFICIT
0.41
INEQUALITY / GINI INDEX
9,287
LABOR FORCE [ PEOPLE ]
59.9%
PERCENT IN LABOR FORCE
3.3%
UNEMPLOYMENT RATE
Green Lake County Area Codes
Race in Green Lake County
The most populous races in Green Lake County are White / Caucasian (17,932 | 93.9%), Hispanic or Latino (1,038 | 5.4%), and Two or more Races (554 | 2.9%).
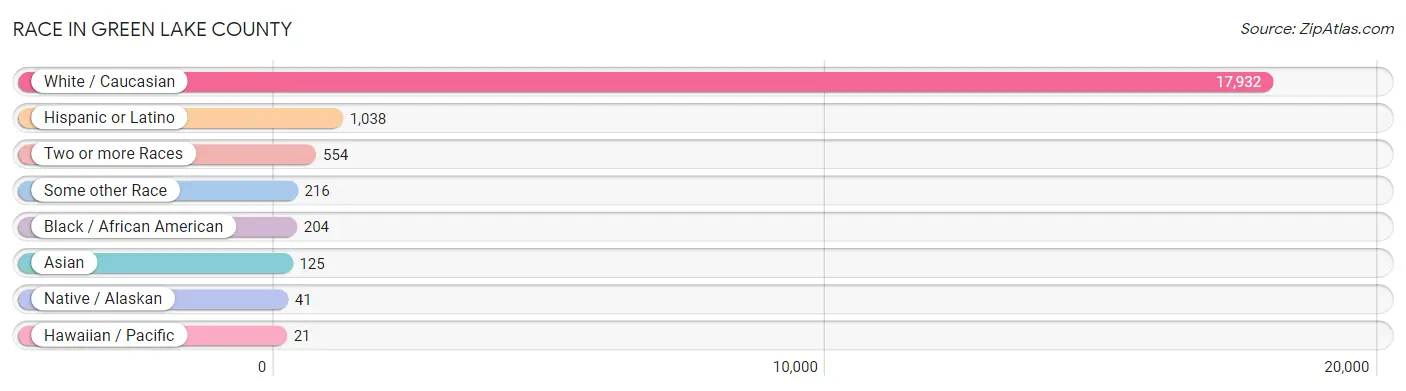
| Race | # Population | % Population |
| Asian | 125 | 0.6% |
| Black / African American | 204 | 1.1% |
| Hawaiian / Pacific | 21 | 0.1% |
| Hispanic or Latino | 1,038 | 5.4% |
| Native / Alaskan | 41 | 0.2% |
| White / Caucasian | 17,932 | 93.9% |
| Two or more Races | 554 | 2.9% |
| Some other Race | 216 | 1.1% |
| Total | 19,093 | 100.0% |
Ancestry in Green Lake County
The most populous ancestries reported in Green Lake County are German (8,592 | 45.0%), Polish (2,084 | 10.9%), Irish (2,025 | 10.6%), English (1,345 | 7.0%), and Dutch (861 | 4.5%), together accounting for 78.1% of all Green Lake County residents.
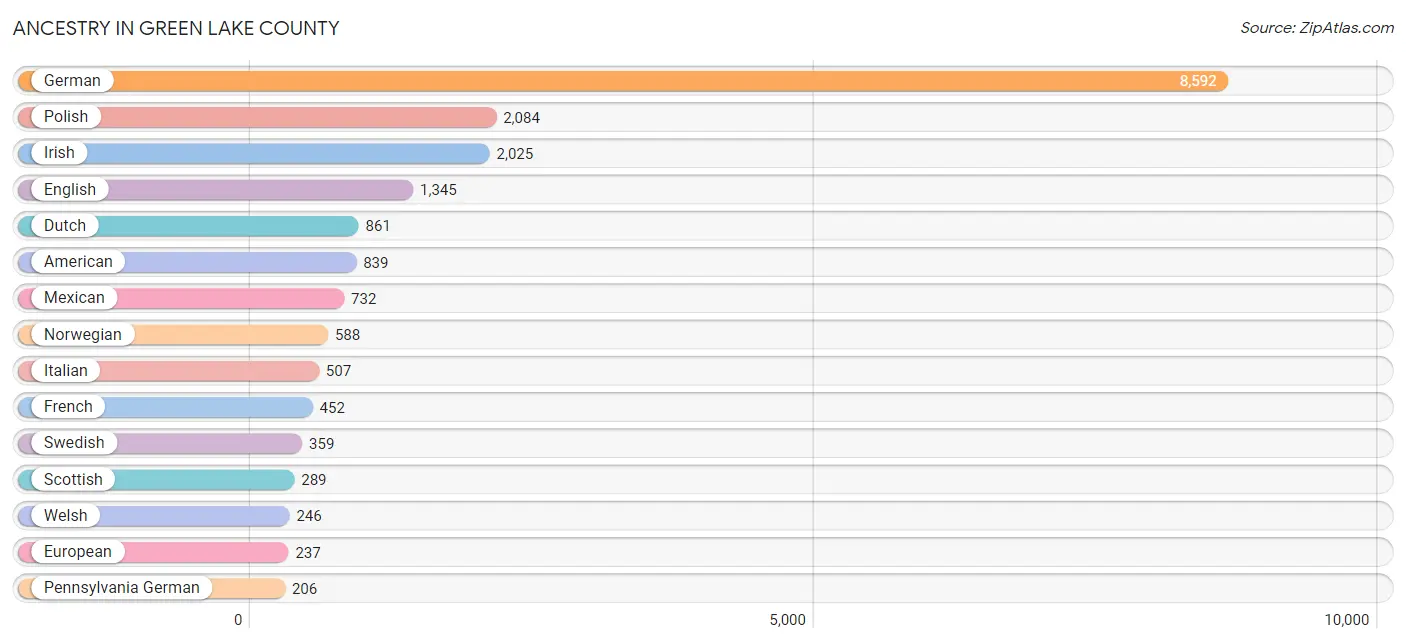
| Ancestry | # Population | % Population |
| Albanian | 42 | 0.2% |
| American | 839 | 4.4% |
| Arab | 11 | 0.1% |
| Armenian | 3 | 0.0% |
| Austrian | 48 | 0.3% |
| Bangladeshi | 117 | 0.6% |
| Belgian | 56 | 0.3% |
| Bhutanese | 4 | 0.0% |
| Blackfeet | 26 | 0.1% |
| British | 11 | 0.1% |
| Burmese | 4 | 0.0% |
| Canadian | 12 | 0.1% |
| Central American | 36 | 0.2% |
| Cherokee | 15 | 0.1% |
| Chippewa | 49 | 0.3% |
| Croatian | 27 | 0.1% |
| Cuban | 64 | 0.3% |
| Czech | 105 | 0.5% |
| Czechoslovakian | 28 | 0.2% |
| Danish | 111 | 0.6% |
| Dutch | 861 | 4.5% |
| Eastern European | 42 | 0.2% |
| English | 1,345 | 7.0% |
| European | 237 | 1.2% |
| Finnish | 60 | 0.3% |
| French | 452 | 2.4% |
| French Canadian | 80 | 0.4% |
| German | 8,592 | 45.0% |
| Greek | 12 | 0.1% |
| Guatemalan | 1 | 0.0% |
| Honduran | 2 | 0.0% |
| Hungarian | 62 | 0.3% |
| Irish | 2,025 | 10.6% |
| Italian | 507 | 2.7% |
| Korean | 7 | 0.0% |
| Lebanese | 11 | 0.1% |
| Lithuanian | 25 | 0.1% |
| Luxembourger | 29 | 0.2% |
| Menominee | 2 | 0.0% |
| Mexican | 732 | 3.8% |
| Native Hawaiian | 24 | 0.1% |
| Northern European | 10 | 0.1% |
| Norwegian | 588 | 3.1% |
| Ottawa | 18 | 0.1% |
| Panamanian | 33 | 0.2% |
| Pennsylvania German | 206 | 1.1% |
| Peruvian | 3 | 0.0% |
| Polish | 2,084 | 10.9% |
| Portuguese | 23 | 0.1% |
| Puerto Rican | 133 | 0.7% |
| Russian | 29 | 0.2% |
| Scandinavian | 53 | 0.3% |
| Scotch-Irish | 44 | 0.2% |
| Scottish | 289 | 1.5% |
| Serbian | 8 | 0.0% |
| Sioux | 3 | 0.0% |
| Slavic | 8 | 0.0% |
| Slovak | 9 | 0.1% |
| Slovene | 5 | 0.0% |
| South American | 3 | 0.0% |
| Soviet Union | 4 | 0.0% |
| Spaniard | 44 | 0.2% |
| Swedish | 359 | 1.9% |
| Swiss | 111 | 0.6% |
| Thai | 48 | 0.3% |
| Ukrainian | 24 | 0.1% |
| Welsh | 246 | 1.3% |
| Yugoslavian | 6 | 0.0% | View All 68 Rows |
Immigrants in Green Lake County
The most numerous immigrant groups reported in Green Lake County came from Latin America (210 | 1.1%), Central America (185 | 1.0%), Mexico (134 | 0.7%), Europe (90 | 0.5%), and Asia (68 | 0.4%), together accounting for 3.6% of all Green Lake County residents.

| Immigration Origin | # Population | % Population |
| Asia | 68 | 0.4% |
| Belgium | 11 | 0.1% |
| Canada | 6 | 0.0% |
| Caribbean | 22 | 0.1% |
| Central America | 185 | 1.0% |
| Costa Rica | 5 | 0.0% |
| Cuba | 22 | 0.1% |
| Eastern Europe | 38 | 0.2% |
| El Salvador | 43 | 0.2% |
| England | 24 | 0.1% |
| Europe | 90 | 0.5% |
| France | 1 | 0.0% |
| Germany | 14 | 0.1% |
| Guatemala | 1 | 0.0% |
| Honduras | 2 | 0.0% |
| Hungary | 2 | 0.0% |
| India | 37 | 0.2% |
| Ireland | 2 | 0.0% |
| Latin America | 210 | 1.1% |
| Mexico | 134 | 0.7% |
| North Macedonia | 24 | 0.1% |
| Northern Europe | 26 | 0.1% |
| Peru | 3 | 0.0% |
| Poland | 2 | 0.0% |
| Russia | 7 | 0.0% |
| South America | 3 | 0.0% |
| South Central Asia | 37 | 0.2% |
| South Eastern Asia | 31 | 0.2% |
| Thailand | 31 | 0.2% |
| Ukraine | 3 | 0.0% |
| Western Europe | 26 | 0.1% | View All 31 Rows |
Sex and Age in Green Lake County
Sex and Age in Green Lake County
The most populous age groups in Green Lake County are 60 to 64 Years (963 | 10.0%) for men and 60 to 64 Years (787 | 8.3%) for women.

| Age Bracket | Male | Female |
| Under 5 Years | 482 (5.0%) | 567 (6.0%) |
| 5 to 9 Years | 552 (5.7%) | 514 (5.4%) |
| 10 to 14 Years | 633 (6.6%) | 622 (6.6%) |
| 15 to 19 Years | 665 (6.9%) | 546 (5.8%) |
| 20 to 24 Years | 531 (5.5%) | 479 (5.1%) |
| 25 to 29 Years | 470 (4.9%) | 403 (4.3%) |
| 30 to 34 Years | 451 (4.7%) | 454 (4.8%) |
| 35 to 39 Years | 576 (6.0%) | 546 (5.8%) |
| 40 to 44 Years | 482 (5.0%) | 494 (5.2%) |
| 45 to 49 Years | 571 (5.9%) | 489 (5.2%) |
| 50 to 54 Years | 594 (6.2%) | 555 (5.9%) |
| 55 to 59 Years | 644 (6.7%) | 662 (7.0%) |
| 60 to 64 Years | 963 (10.0%) | 787 (8.3%) |
| 65 to 69 Years | 680 (7.0%) | 663 (7.0%) |
| 70 to 74 Years | 583 (6.0%) | 598 (6.3%) |
| 75 to 79 Years | 429 (4.4%) | 351 (3.7%) |
| 80 to 84 Years | 191 (2.0%) | 323 (3.4%) |
| 85 Years and over | 143 (1.5%) | 400 (4.2%) |
| Total | 9,640 (100.0%) | 9,453 (100.0%) |
Families and Households in Green Lake County
Median Family Size in Green Lake County
The median family size in Green Lake County is 2.83 persons per family, with married-couple families (4,128 | 78.3%) accounting for the largest median family size of 2.87 persons per family. On the other hand, single male/father families (415 | 7.9%) represent the smallest median family size with 2.71 persons per family.
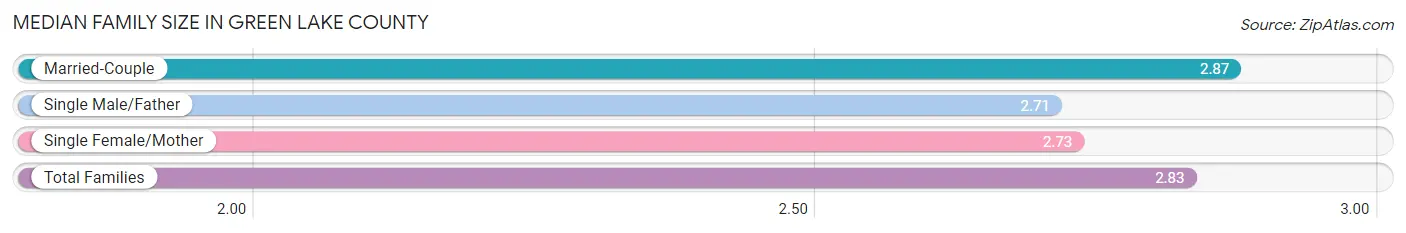
| Family Type | # Families | Family Size |
| Married-Couple | 4,128 (78.3%) | 2.87 |
| Single Male/Father | 415 (7.9%) | 2.71 |
| Single Female/Mother | 726 (13.8%) | 2.73 |
| Total Families | 5,269 (100.0%) | 2.83 |
Median Household Size in Green Lake County
The median household size in Green Lake County is 2.34 persons per household, with single male/father households (415 | 5.2%) accounting for the largest median household size of 3.36 persons per household. non-family households (2,756 | 34.3%) represent the smallest median household size with 1.20 persons per household.

| Household Type | # Households | Household Size |
| Married-Couple | 4,128 (51.4%) | 2.88 |
| Single Male/Father | 415 (5.2%) | 3.36 |
| Single Female/Mother | 726 (9.0%) | 2.95 |
| Non-family | 2,756 (34.3%) | 1.20 |
| Total Households | 8,025 (100.0%) | 2.34 |
Household Size by Marriage Status in Green Lake County
Out of a total of 8,025 households in Green Lake County, 5,269 (65.7%) are family households, while 2,756 (34.3%) are nonfamily households. The most numerous type of family households are 2-person households, comprising 2,874, and the most common type of nonfamily households are 1-person households, comprising 2,277.

| Household Size | Family Households | Nonfamily Households |
| 1-Person Households | - | 2,277 (28.4%) |
| 2-Person Households | 2,874 (35.8%) | 417 (5.2%) |
| 3-Person Households | 1,020 (12.7%) | 44 (0.5%) |
| 4-Person Households | 762 (9.5%) | 12 (0.2%) |
| 5-Person Households | 339 (4.2%) | 6 (0.1%) |
| 6-Person Households | 101 (1.3%) | 0 (0.0%) |
| 7+ Person Households | 173 (2.2%) | 0 (0.0%) |
| Total | 5,269 (65.7%) | 2,756 (34.3%) |
Female Fertility in Green Lake County
Fertility by Age in Green Lake County
Average fertility rate in Green Lake County is 55.0 births per 1,000 women. Women in the age bracket of 20 to 34 years have the highest fertility rate with 108.0 births per 1,000 women. Women in the age bracket of 20 to 34 years acount for 74.2% of all women with births.
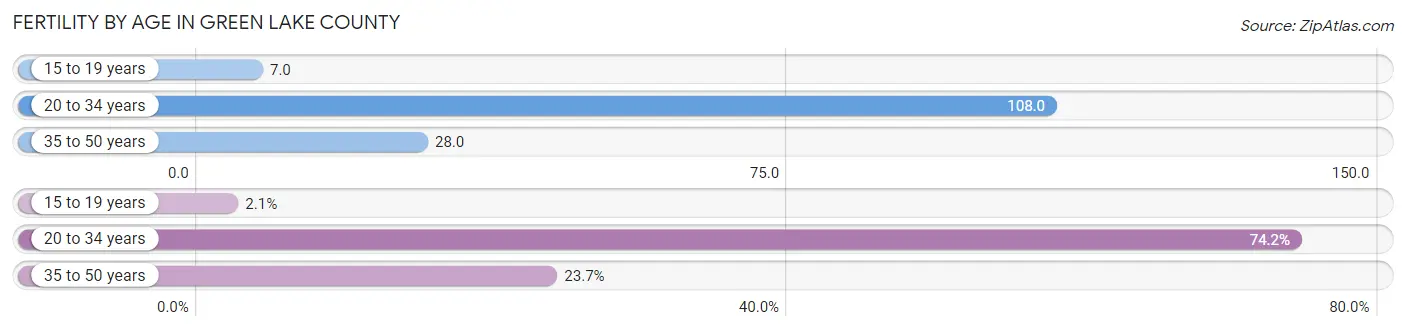
| Age Bracket | Women with Births | Births / 1,000 Women |
| 15 to 19 years | 4 (2.1%) | 7.0 |
| 20 to 34 years | 144 (74.2%) | 108.0 |
| 35 to 50 years | 46 (23.7%) | 28.0 |
| Total | 194 (100.0%) | 55.0 |
Fertility by Age by Marriage Status in Green Lake County
83.0% of women with births (194) in Green Lake County are married. The highest percentage of unmarried women with births falls into 15 to 19 years age bracket with 100.0% of them unmarried at the time of birth, while the lowest percentage of unmarried women with births belong to 35 to 50 years age bracket with 8.7% of them unmarried.
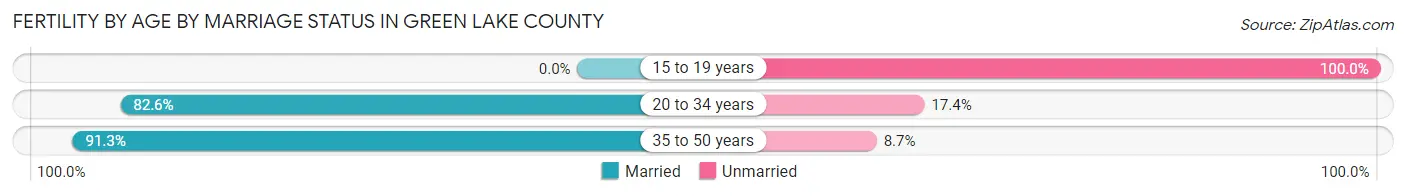
| Age Bracket | Married | Unmarried |
| 15 to 19 years | 0 (0.0%) | 4 (100.0%) |
| 20 to 34 years | 119 (82.6%) | 25 (17.4%) |
| 35 to 50 years | 42 (91.3%) | 4 (8.7%) |
| Total | 161 (83.0%) | 33 (17.0%) |
Fertility by Education in Green Lake County
Average fertility rate in Green Lake County is 55.0 births per 1,000 women. Women with the education attainment of bachelor's degree have the highest fertility rate of 103.0 births per 1,000 women, while women with the education attainment of college or associate's degree have the lowest fertility at 35.0 births per 1,000 women. Women with the education attainment of bachelor's degree represent 30.9% of all women with births.
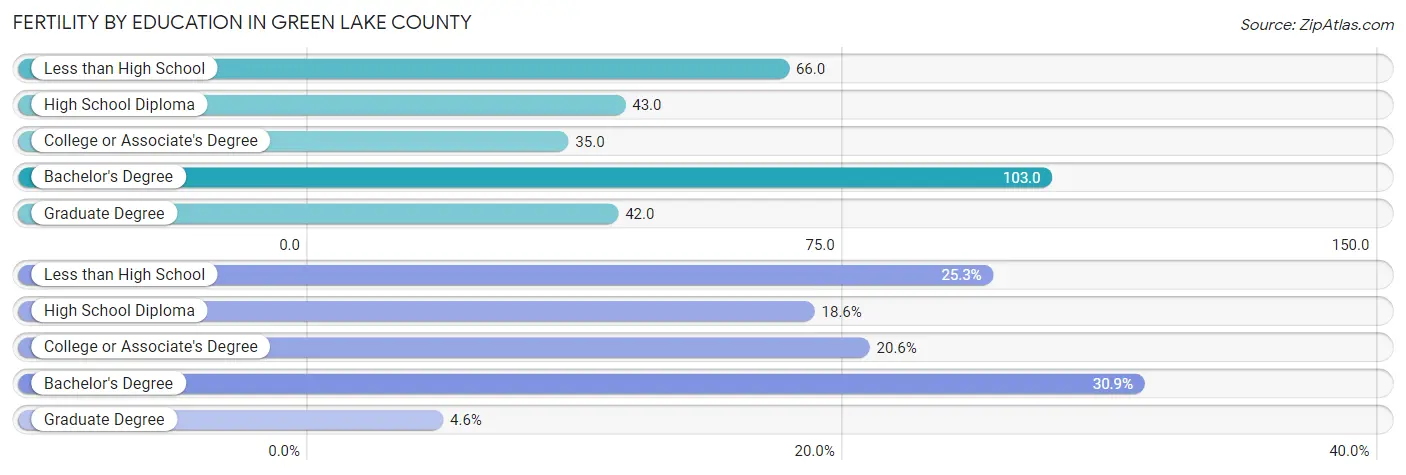
| Educational Attainment | Women with Births | Births / 1,000 Women |
| Less than High School | 49 (25.3%) | 66.0 |
| High School Diploma | 36 (18.6%) | 43.0 |
| College or Associate's Degree | 40 (20.6%) | 35.0 |
| Bachelor's Degree | 60 (30.9%) | 103.0 |
| Graduate Degree | 9 (4.6%) | 42.0 |
| Total | 194 (100.0%) | 55.0 |
Fertility by Education by Marriage Status in Green Lake County
17.0% of women with births in Green Lake County are unmarried. Women with the educational attainment of less than high school are most likely to be married with 100.0% of them married at childbirth, while women with the educational attainment of college or associate's degree are least likely to be married with 32.5% of them unmarried at childbirth.
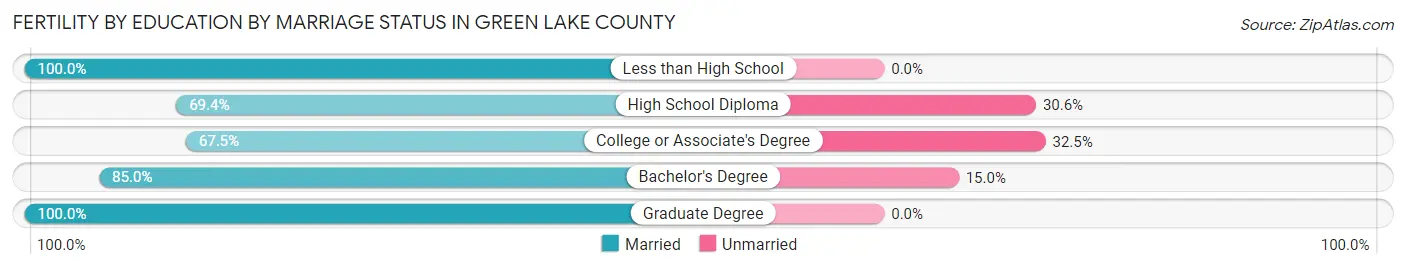
| Educational Attainment | Married | Unmarried |
| Less than High School | 49 (100.0%) | 0 (0.0%) |
| High School Diploma | 25 (69.4%) | 11 (30.6%) |
| College or Associate's Degree | 27 (67.5%) | 13 (32.5%) |
| Bachelor's Degree | 51 (85.0%) | 9 (15.0%) |
| Graduate Degree | 9 (100.0%) | 0 (0.0%) |
| Total | 161 (83.0%) | 33 (17.0%) |
Income in Green Lake County
Income Overview in Green Lake County
Per Capita Income in Green Lake County is $35,222, while median incomes of families and households are $81,534 and $66,395 respectively.
| Characteristic | Number | Measure |
| Per Capita Income | 19,093 | $35,222 |
| Median Family Income | 5,269 | $81,534 |
| Mean Family Income | 5,269 | $97,304 |
| Median Household Income | 8,025 | $66,395 |
| Mean Household Income | 8,025 | $83,262 |
| Income Deficit | 5,269 | $13,112 |
| Wage / Income Gap (%) | 19,093 | 34.56% |
| Wage / Income Gap ($) | 19,093 | 65.44¢ per $1 |
| Gini / Inequality Index | 19,093 | 0.41 |
Earnings by Sex in Green Lake County
Average Earnings in Green Lake County are $41,160, $46,609 for men and $30,500 for women, a difference of 34.6%.
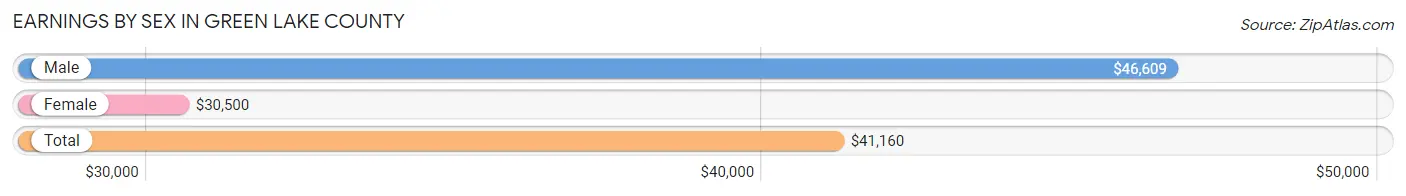
| Sex | Number | Average Earnings |
| Male | 5,551 (55.1%) | $46,609 |
| Female | 4,516 (44.9%) | $30,500 |
| Total | 10,067 (100.0%) | $41,160 |
Earnings by Sex by Income Bracket in Green Lake County
The most common earnings brackets in Green Lake County are $100,000+ for men (624 | 11.2%) and $25,000 to $29,999 for women (364 | 8.1%).

| Income | Male | Female |
| $2,499 or less | 159 (2.9%) | 301 (6.7%) |
| $2,500 to $4,999 | 169 (3.0%) | 256 (5.7%) |
| $5,000 to $7,499 | 220 (4.0%) | 245 (5.4%) |
| $7,500 to $9,999 | 100 (1.8%) | 168 (3.7%) |
| $10,000 to $12,499 | 119 (2.1%) | 118 (2.6%) |
| $12,500 to $14,999 | 92 (1.7%) | 163 (3.6%) |
| $15,000 to $17,499 | 131 (2.4%) | 177 (3.9%) |
| $17,500 to $19,999 | 67 (1.2%) | 101 (2.2%) |
| $20,000 to $22,499 | 141 (2.5%) | 146 (3.2%) |
| $22,500 to $24,999 | 196 (3.5%) | 195 (4.3%) |
| $25,000 to $29,999 | 239 (4.3%) | 364 (8.1%) |
| $30,000 to $34,999 | 311 (5.6%) | 252 (5.6%) |
| $35,000 to $39,999 | 239 (4.3%) | 209 (4.6%) |
| $40,000 to $44,999 | 375 (6.8%) | 307 (6.8%) |
| $45,000 to $49,999 | 468 (8.4%) | 316 (7.0%) |
| $50,000 to $54,999 | 411 (7.4%) | 252 (5.6%) |
| $55,000 to $64,999 | 613 (11.0%) | 265 (5.9%) |
| $65,000 to $74,999 | 345 (6.2%) | 294 (6.5%) |
| $75,000 to $99,999 | 532 (9.6%) | 184 (4.1%) |
| $100,000+ | 624 (11.2%) | 203 (4.5%) |
| Total | 5,551 (100.0%) | 4,516 (100.0%) |
Earnings by Sex by Educational Attainment in Green Lake County
Average earnings in Green Lake County are $50,012 for men and $36,710 for women, a difference of 26.6%. Men with an educational attainment of graduate degree enjoy the highest average annual earnings of $69,643, while those with less than high school education earn the least with $41,042. Women with an educational attainment of graduate degree earn the most with the average annual earnings of $71,607, while those with less than high school education have the smallest earnings of $23,750.
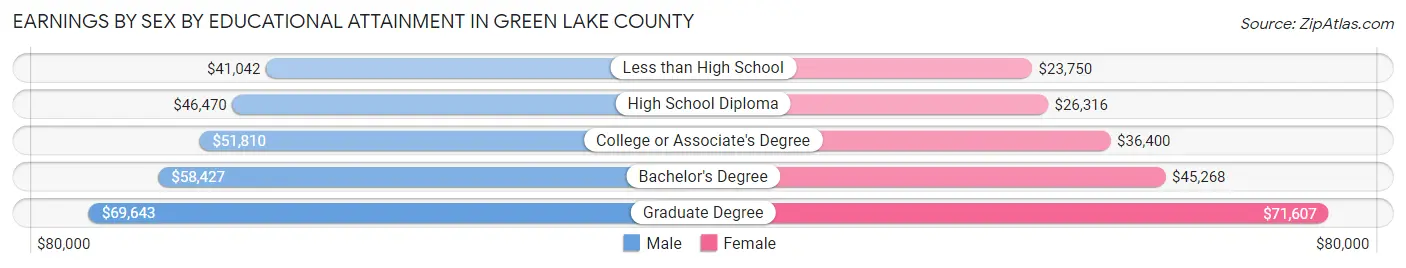
| Educational Attainment | Male Income | Female Income |
| Less than High School | $41,042 | $23,750 |
| High School Diploma | $46,470 | $26,316 |
| College or Associate's Degree | $51,810 | $36,400 |
| Bachelor's Degree | $58,427 | $45,268 |
| Graduate Degree | $69,643 | $71,607 |
| Total | $50,012 | $36,710 |
Family Income in Green Lake County
Family Income Brackets in Green Lake County
According to the Green Lake County family income data, there are 1,222 families falling into the $100,000 to $149,999 income range, which is the most common income bracket and makes up 23.2% of all families. Conversely, the $10,000 to $14,999 income bracket is the least frequent group with only 90 families (1.7%) belonging to this category.
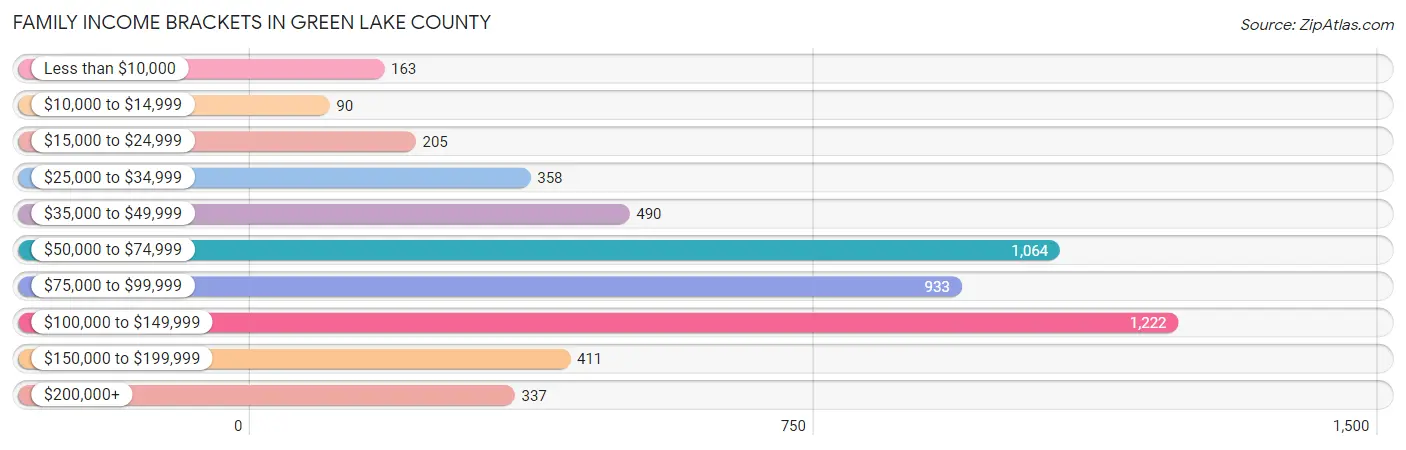
| Income Bracket | # Families | % Families |
| Less than $10,000 | 163 | 3.1% |
| $10,000 to $14,999 | 90 | 1.7% |
| $15,000 to $24,999 | 205 | 3.9% |
| $25,000 to $34,999 | 358 | 6.8% |
| $35,000 to $49,999 | 490 | 9.3% |
| $50,000 to $74,999 | 1,064 | 20.2% |
| $75,000 to $99,999 | 933 | 17.7% |
| $100,000 to $149,999 | 1,222 | 23.2% |
| $150,000 to $199,999 | 411 | 7.8% |
| $200,000+ | 337 | 6.4% |
Family Income by Famaliy Size in Green Lake County
5-person families (280 | 5.3%) account for the highest median family income in Green Lake County with $110,909 per family, while 2-person families (3,005 | 57.0%) have the highest median income of $37,088 per family member.
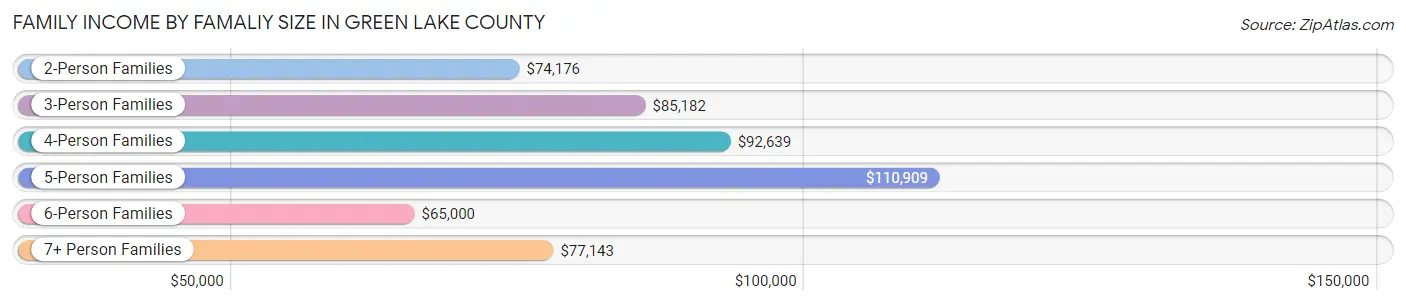
| Income Bracket | # Families | Median Income |
| 2-Person Families | 3,005 (57.0%) | $74,176 |
| 3-Person Families | 1,085 (20.6%) | $85,182 |
| 4-Person Families | 661 (12.6%) | $92,639 |
| 5-Person Families | 280 (5.3%) | $110,909 |
| 6-Person Families | 96 (1.8%) | $65,000 |
| 7+ Person Families | 142 (2.7%) | $77,143 |
| Total | 5,269 (100.0%) | $81,534 |
Family Income by Number of Earners in Green Lake County
The median family income in Green Lake County is $81,534, with families comprising 3+ earners (571) having the highest median family income of $116,625, while families with no earners (958) have the lowest median family income of $50,278, accounting for 10.8% and 18.2% of families, respectively.
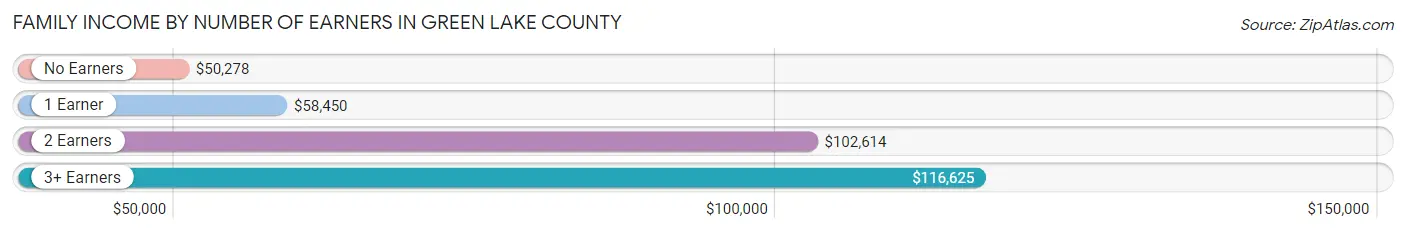
| Number of Earners | # Families | Median Income |
| No Earners | 958 (18.2%) | $50,278 |
| 1 Earner | 1,609 (30.5%) | $58,450 |
| 2 Earners | 2,131 (40.4%) | $102,614 |
| 3+ Earners | 571 (10.8%) | $116,625 |
| Total | 5,269 (100.0%) | $81,534 |
Household Income in Green Lake County
Household Income Brackets in Green Lake County
With 1,653 households falling in the category, the $50,000 to $74,999 income range is the most frequent in Green Lake County, accounting for 20.6% of all households. In contrast, only 257 households (3.2%) fall into the $10,000 to $14,999 income bracket, making it the least populous group.

| Income Bracket | # Households | % Households |
| Less than $10,000 | 281 | 3.5% |
| $10,000 to $14,999 | 257 | 3.2% |
| $15,000 to $24,999 | 626 | 7.8% |
| $25,000 to $34,999 | 770 | 9.6% |
| $35,000 to $49,999 | 907 | 11.3% |
| $50,000 to $74,999 | 1,653 | 20.6% |
| $75,000 to $99,999 | 1,148 | 14.3% |
| $100,000 to $149,999 | 1,517 | 18.9% |
| $150,000 to $199,999 | 482 | 6.0% |
| $200,000+ | 377 | 4.7% |
Household Income by Householder Age in Green Lake County
The median household income in Green Lake County is $66,395, with the highest median household income of $82,904 found in the 45 to 64 years age bracket for the primary householder. A total of 2,960 households (36.9%) fall into this category. Meanwhile, the 65+ years age bracket for the primary householder has the lowest median household income of $50,495, with 2,728 households (34.0%) in this group.
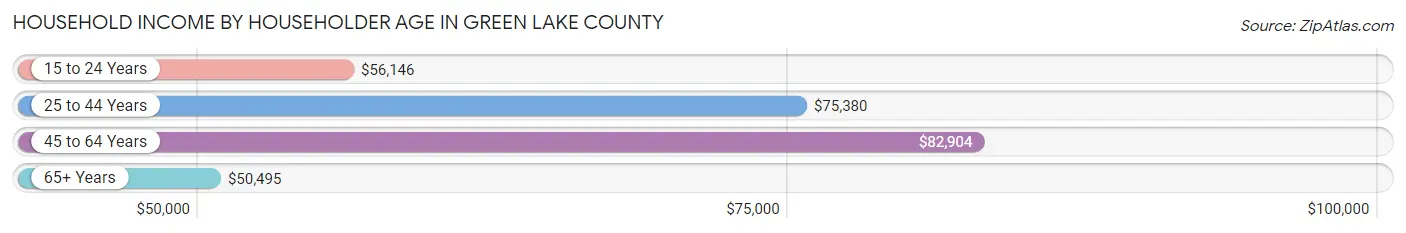
| Income Bracket | # Households | Median Income |
| 15 to 24 Years | 343 (4.3%) | $56,146 |
| 25 to 44 Years | 1,994 (24.8%) | $75,380 |
| 45 to 64 Years | 2,960 (36.9%) | $82,904 |
| 65+ Years | 2,728 (34.0%) | $50,495 |
| Total | 8,025 (100.0%) | $66,395 |
Poverty in Green Lake County
Income Below Poverty by Sex and Age in Green Lake County
With 10.1% poverty level for males and 15.5% for females among the residents of Green Lake County, 5 year old males and 5 year old females are the most vulnerable to poverty, with 51 males (33.3%) and 27 females (43.5%) in their respective age groups living below the poverty level.
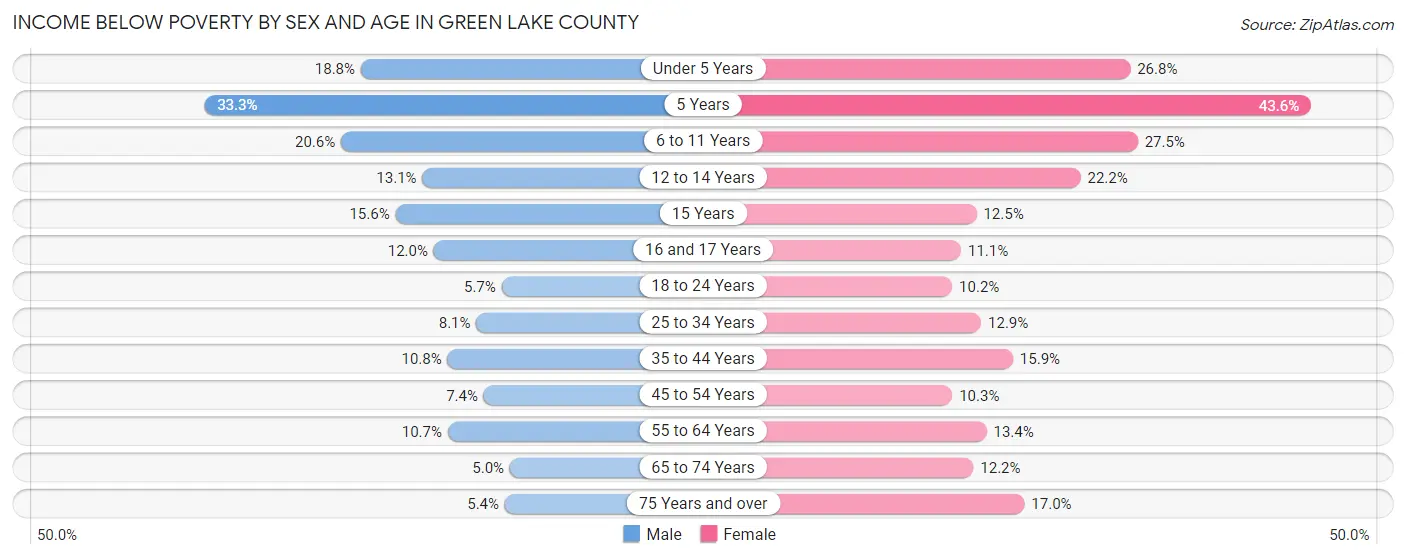
| Age Bracket | Male | Female |
| Under 5 Years | 90 (18.8%) | 140 (26.8%) |
| 5 Years | 51 (33.3%) | 27 (43.5%) |
| 6 to 11 Years | 125 (20.6%) | 184 (27.5%) |
| 12 to 14 Years | 51 (13.1%) | 76 (22.2%) |
| 15 Years | 24 (15.6%) | 8 (12.5%) |
| 16 and 17 Years | 31 (12.0%) | 34 (11.1%) |
| 18 to 24 Years | 43 (5.7%) | 65 (10.2%) |
| 25 to 34 Years | 73 (8.1%) | 109 (12.9%) |
| 35 to 44 Years | 112 (10.7%) | 165 (15.9%) |
| 45 to 54 Years | 86 (7.4%) | 107 (10.2%) |
| 55 to 64 Years | 171 (10.7%) | 194 (13.4%) |
| 65 to 74 Years | 62 (5.0%) | 154 (12.2%) |
| 75 Years and over | 40 (5.4%) | 171 (17.0%) |
| Total | 959 (10.1%) | 1,434 (15.5%) |
Income Above Poverty by Sex and Age in Green Lake County
According to the poverty statistics in Green Lake County, males aged 65 to 74 years and females aged 18 to 24 years are the age groups that are most secure financially, with 95.0% of males and 89.8% of females in these age groups living above the poverty line.

| Age Bracket | Male | Female |
| Under 5 Years | 389 (81.2%) | 383 (73.2%) |
| 5 Years | 102 (66.7%) | 35 (56.5%) |
| 6 to 11 Years | 481 (79.4%) | 486 (72.5%) |
| 12 to 14 Years | 339 (86.9%) | 267 (77.8%) |
| 15 Years | 130 (84.4%) | 56 (87.5%) |
| 16 and 17 Years | 227 (88.0%) | 273 (88.9%) |
| 18 to 24 Years | 707 (94.3%) | 570 (89.8%) |
| 25 to 34 Years | 832 (91.9%) | 734 (87.1%) |
| 35 to 44 Years | 930 (89.2%) | 874 (84.1%) |
| 45 to 54 Years | 1,079 (92.6%) | 937 (89.7%) |
| 55 to 64 Years | 1,424 (89.3%) | 1,250 (86.6%) |
| 65 to 74 Years | 1,187 (95.0%) | 1,107 (87.8%) |
| 75 Years and over | 696 (94.6%) | 838 (83.1%) |
| Total | 8,523 (89.9%) | 7,810 (84.5%) |
Income Below Poverty Among Married-Couple Families in Green Lake County
The poverty statistics for married-couple families in Green Lake County show that 5.1% or 209 of the total 4,128 families live below the poverty line. Families with 5 or more children have the highest poverty rate of 52.3%, comprising of 46 families. On the other hand, families with 1 or 2 children have the lowest poverty rate of 3.0%, which includes 28 families.
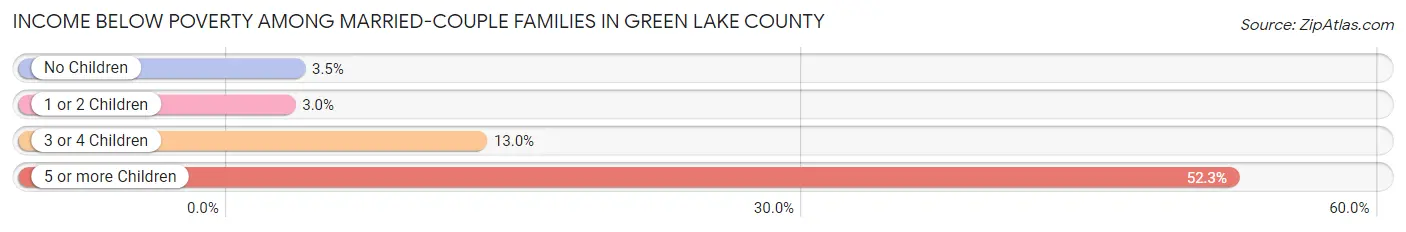
| Children | Above Poverty | Below Poverty |
| No Children | 2,726 (96.5%) | 99 (3.5%) |
| 1 or 2 Children | 910 (97.0%) | 28 (3.0%) |
| 3 or 4 Children | 241 (87.0%) | 36 (13.0%) |
| 5 or more Children | 42 (47.7%) | 46 (52.3%) |
| Total | 3,919 (94.9%) | 209 (5.1%) |
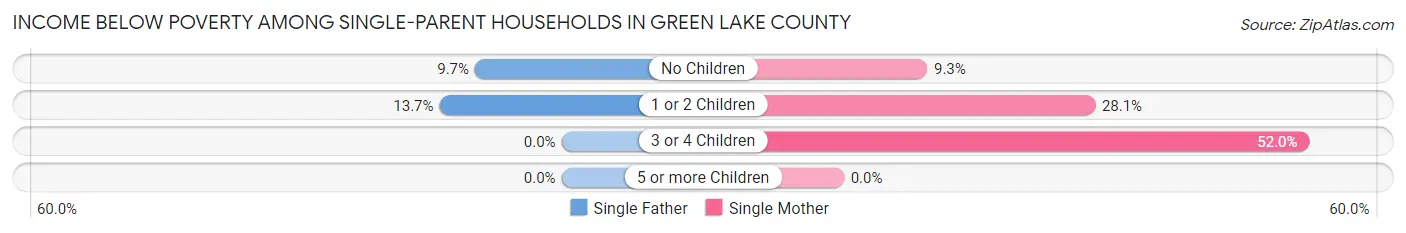
Income Below Poverty Among Single-Parent Households in Green Lake County
According to the poverty data in Green Lake County, 11.8% or 49 single-father households and 23.3% or 169 single-mother households are living below the poverty line. Among single-father households, those with 1 or 2 children have the highest poverty rate, with 34 households (13.7%) experiencing poverty. Likewise, among single-mother households, those with 3 or 4 children have the highest poverty rate, with 51 households (52.0%) falling below the poverty line.
| Children | Single Father | Single Mother |
| No Children | 15 (9.7%) | 29 (9.3%) |
| 1 or 2 Children | 34 (13.7%) | 89 (28.1%) |
| 3 or 4 Children | 0 (0.0%) | 51 (52.0%) |
| 5 or more Children | 0 (0.0%) | 0 (0.0%) |
| Total | 49 (11.8%) | 169 (23.3%) |
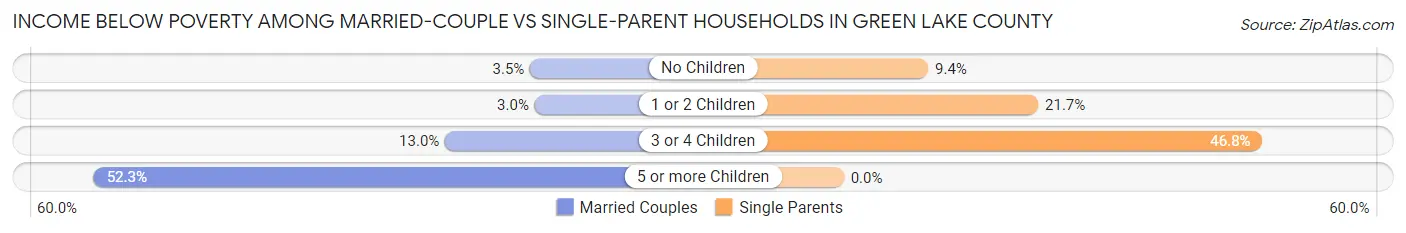
Income Below Poverty Among Married-Couple vs Single-Parent Households in Green Lake County
The poverty data for Green Lake County shows that 209 of the married-couple family households (5.1%) and 218 of the single-parent households (19.1%) are living below the poverty level. Within the married-couple family households, those with 5 or more children have the highest poverty rate, with 46 households (52.3%) falling below the poverty line. Among the single-parent households, those with 3 or 4 children have the highest poverty rate, with 51 household (46.8%) living below poverty.
| Children | Married-Couple Families | Single-Parent Households |
| No Children | 99 (3.5%) | 44 (9.4%) |
| 1 or 2 Children | 28 (3.0%) | 123 (21.7%) |
| 3 or 4 Children | 36 (13.0%) | 51 (46.8%) |
| 5 or more Children | 46 (52.3%) | 0 (0.0%) |
| Total | 209 (5.1%) | 218 (19.1%) |
Employment Characteristics in Green Lake County
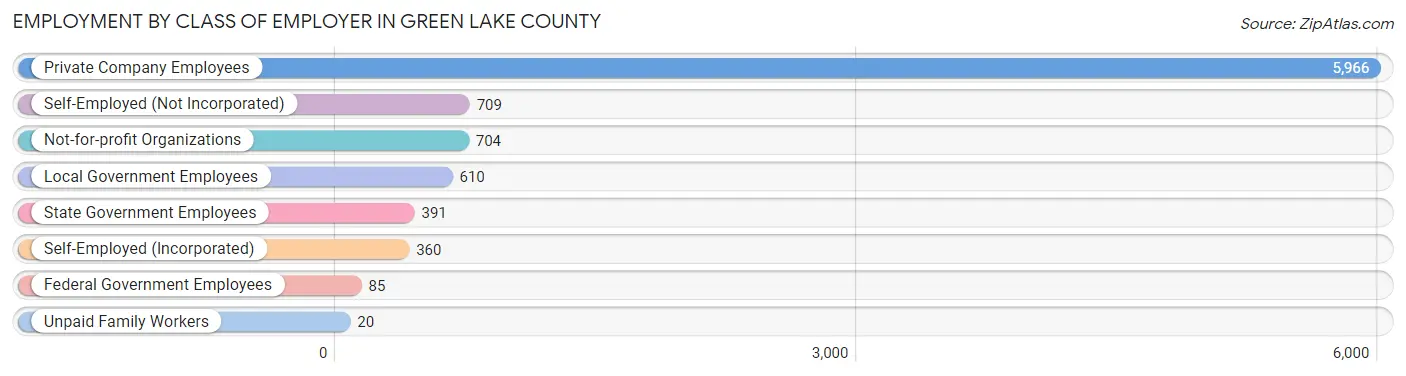
Employment by Class of Employer in Green Lake County
Among the 8,845 employed individuals in Green Lake County, private company employees (5,966 | 67.4%), self-employed (not incorporated) (709 | 8.0%), and not-for-profit organizations (704 | 8.0%) make up the most common classes of employment.
| Employer Class | # Employees | % Employees |
| Private Company Employees | 5,966 | 67.4% |
| Self-Employed (Incorporated) | 360 | 4.1% |
| Self-Employed (Not Incorporated) | 709 | 8.0% |
| Not-for-profit Organizations | 704 | 8.0% |
| Local Government Employees | 610 | 6.9% |
| State Government Employees | 391 | 4.4% |
| Federal Government Employees | 85 | 1.0% |
| Unpaid Family Workers | 20 | 0.2% |
| Total | 8,845 | 100.0% |
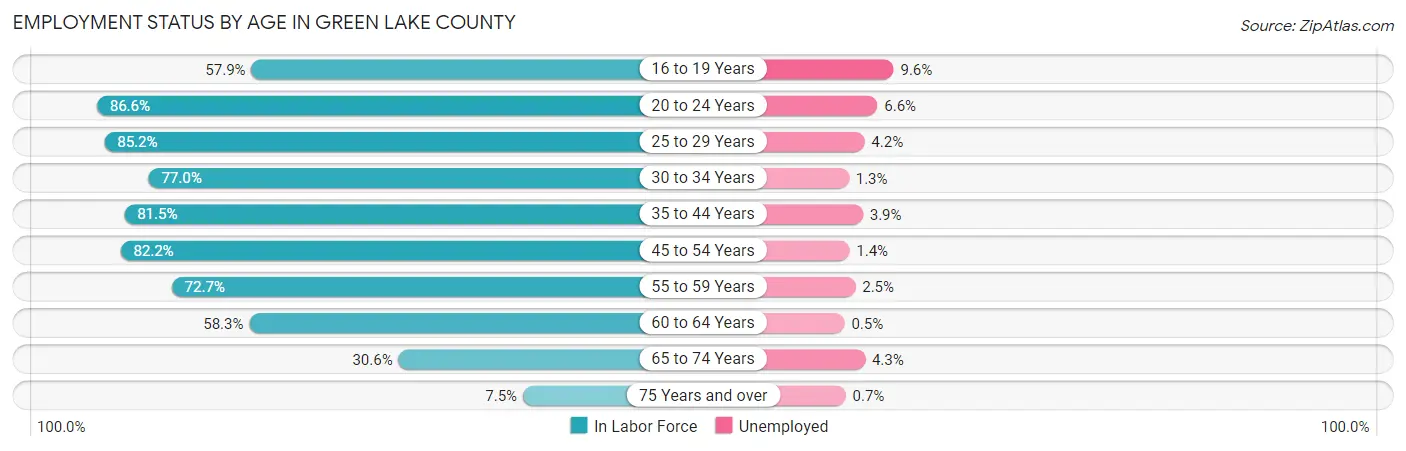
Employment Status by Age in Green Lake County
According to the labor force statistics for Green Lake County, out of the total population over 16 years of age (15,505), 59.9% or 9,287 individuals are in the labor force, with 3.3% or 306 of them unemployed. The age group with the highest labor force participation rate is 20 to 24 years, with 86.6% or 875 individuals in the labor force. Within the labor force, the 16 to 19 years age range has the highest percentage of unemployed individuals, with 9.6% or 55 of them being unemployed.
| Age Bracket | In Labor Force | Unemployed |
| 16 to 19 Years | 575 (57.9%) | 55 (9.6%) |
| 20 to 24 Years | 875 (86.6%) | 58 (6.6%) |
| 25 to 29 Years | 744 (85.2%) | 31 (4.2%) |
| 30 to 34 Years | 697 (77.0%) | 9 (1.3%) |
| 35 to 44 Years | 1,710 (81.5%) | 67 (3.9%) |
| 45 to 54 Years | 1,816 (82.2%) | 25 (1.4%) |
| 55 to 59 Years | 949 (72.7%) | 24 (2.5%) |
| 60 to 64 Years | 1,020 (58.3%) | 5 (0.5%) |
| 65 to 74 Years | 772 (30.6%) | 33 (4.3%) |
| 75 Years and over | 138 (7.5%) | 1 (0.7%) |
| Total | 9,287 (59.9%) | 306 (3.3%) |
Employment Status by Educational Attainment in Green Lake County
According to labor force statistics for Green Lake County, 75.9% of individuals (6,938) out of the total population between 25 and 64 years of age (9,141) are in the labor force, with 2.3% or 160 of them being unemployed. The group with the highest labor force participation rate are those with the educational attainment of bachelor's degree or higher, with 85.3% or 1,762 individuals in the labor force. Within the labor force, individuals with less than high school education have the highest percentage of unemployment, with 5.5% or 23 of them being unemployed.
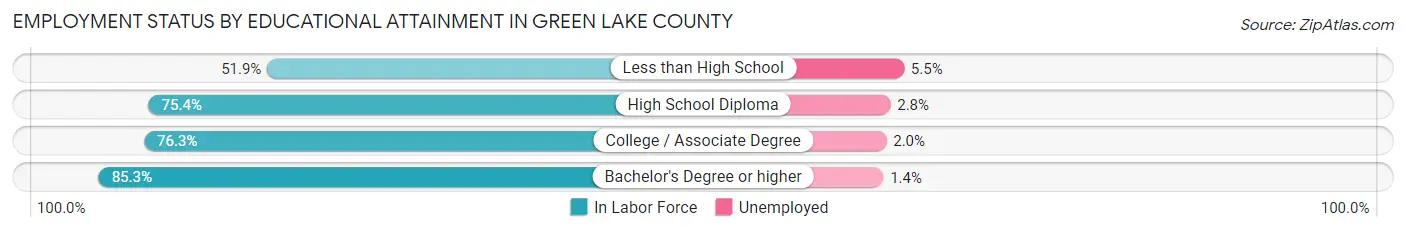
| Educational Attainment | In Labor Force | Unemployed |
| Less than High School | 422 (51.9%) | 45 (5.5%) |
| High School Diploma | 2,379 (75.4%) | 88 (2.8%) |
| College / Associate Degree | 2,371 (76.3%) | 62 (2.0%) |
| Bachelor's Degree or higher | 1,762 (85.3%) | 29 (1.4%) |
| Total | 6,938 (75.9%) | 210 (2.3%) |
Employment Occupations by Sex in Green Lake County
Management, Business, Science and Arts Occupations
The most common Management, Business, Science and Arts occupations in Green Lake County are Management (896 | 10.0%), Community & Social Service (702 | 7.8%), Health Diagnosing & Treating (445 | 5.0%), Education Instruction & Library (405 | 4.5%), and Computers, Engineering & Science (347 | 3.9%).

Management, Business, Science and Arts Occupations by Sex
Within the Management, Business, Science and Arts occupations in Green Lake County, the most male-oriented occupations are Computers & Mathematics (75.7%), Computers, Engineering & Science (71.2%), and Architecture & Engineering (67.5%), while the most female-oriented occupations are Health Diagnosing & Treating (90.1%), Health Technologists (85.8%), and Education, Arts & Media (82.9%).
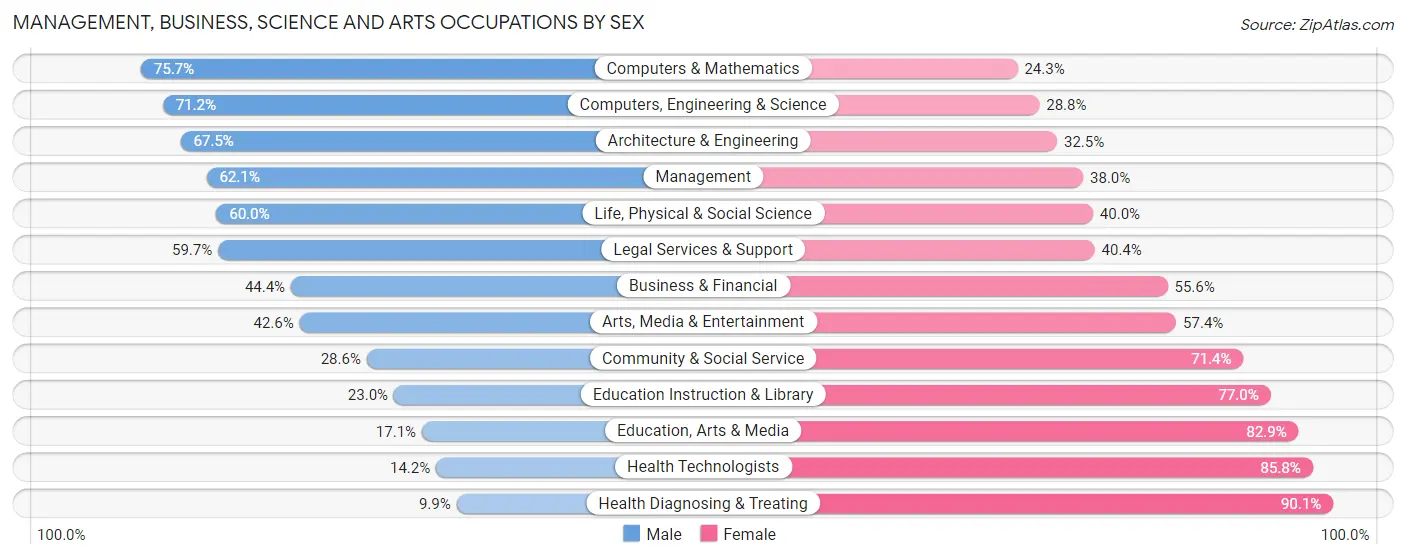
| Occupation | Male | Female |
| Management | 556 (62.1%) | 340 (38.0%) |
| Business & Financial | 124 (44.4%) | 155 (55.6%) |
| Computers, Engineering & Science | 247 (71.2%) | 100 (28.8%) |
| Computers & Mathematics | 128 (75.7%) | 41 (24.3%) |
| Architecture & Engineering | 110 (67.5%) | 53 (32.5%) |
| Life, Physical & Social Science | 9 (60.0%) | 6 (40.0%) |
| Community & Social Service | 201 (28.6%) | 501 (71.4%) |
| Education, Arts & Media | 19 (17.1%) | 92 (82.9%) |
| Legal Services & Support | 34 (59.7%) | 23 (40.4%) |
| Education Instruction & Library | 93 (23.0%) | 312 (77.0%) |
| Arts, Media & Entertainment | 55 (42.6%) | 74 (57.4%) |
| Health Diagnosing & Treating | 44 (9.9%) | 401 (90.1%) |
| Health Technologists | 35 (14.2%) | 212 (85.8%) |
| Total (Category) | 1,172 (43.9%) | 1,497 (56.1%) |
| Total (Overall) | 4,961 (55.2%) | 4,026 (44.8%) |
Services Occupations
The most common Services occupations in Green Lake County are Food Preparation & Serving (374 | 4.2%), Security & Protection (305 | 3.4%), Cleaning & Maintenance (272 | 3.0%), Healthcare Support (248 | 2.8%), and Law Enforcement (247 | 2.8%).

Services Occupations by Sex
Within the Services occupations in Green Lake County, the most male-oriented occupations are Law Enforcement (85.8%), Security & Protection (82.6%), and Firefighting & Prevention (69.0%), while the most female-oriented occupations are Healthcare Support (93.5%), Personal Care & Service (89.2%), and Food Preparation & Serving (60.7%).

| Occupation | Male | Female |
| Healthcare Support | 16 (6.5%) | 232 (93.5%) |
| Security & Protection | 252 (82.6%) | 53 (17.4%) |
| Firefighting & Prevention | 40 (69.0%) | 18 (31.0%) |
| Law Enforcement | 212 (85.8%) | 35 (14.2%) |
| Food Preparation & Serving | 147 (39.3%) | 227 (60.7%) |
| Cleaning & Maintenance | 165 (60.7%) | 107 (39.3%) |
| Personal Care & Service | 11 (10.8%) | 91 (89.2%) |
| Total (Category) | 591 (45.4%) | 710 (54.6%) |
| Total (Overall) | 4,961 (55.2%) | 4,026 (44.8%) |
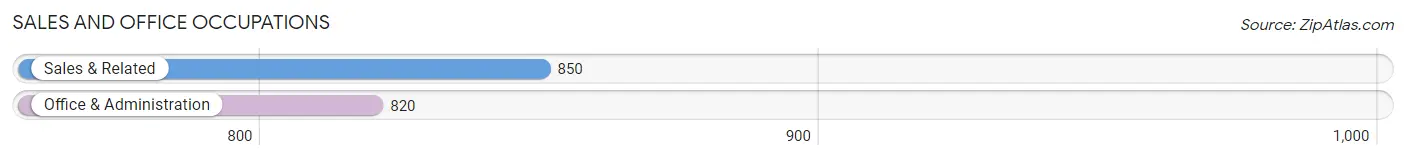
Sales and Office Occupations
The most common Sales and Office occupations in Green Lake County are Sales & Related (850 | 9.5%), and Office & Administration (820 | 9.1%).
Sales and Office Occupations by Sex
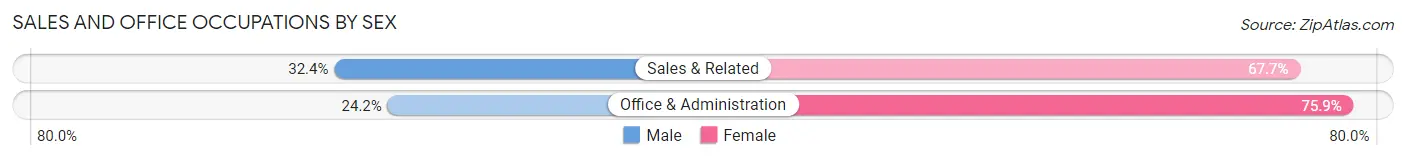
| Occupation | Male | Female |
| Sales & Related | 275 (32.4%) | 575 (67.6%) |
| Office & Administration | 198 (24.1%) | 622 (75.8%) |
| Total (Category) | 473 (28.3%) | 1,197 (71.7%) |
| Total (Overall) | 4,961 (55.2%) | 4,026 (44.8%) |
Natural Resources, Construction and Maintenance Occupations
The most common Natural Resources, Construction and Maintenance occupations in Green Lake County are Construction & Extraction (626 | 7.0%), Installation, Maintenance & Repair (454 | 5.1%), and Farming, Fishing & Forestry (178 | 2.0%).
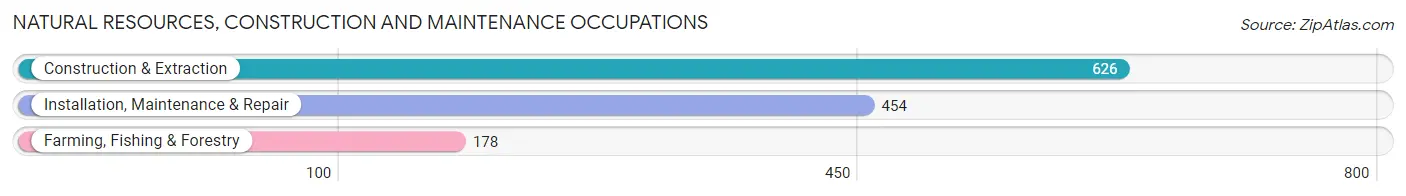
Natural Resources, Construction and Maintenance Occupations by Sex

| Occupation | Male | Female |
| Farming, Fishing & Forestry | 151 (84.8%) | 27 (15.2%) |
| Construction & Extraction | 592 (94.6%) | 34 (5.4%) |
| Installation, Maintenance & Repair | 447 (98.5%) | 7 (1.5%) |
| Total (Category) | 1,190 (94.6%) | 68 (5.4%) |
| Total (Overall) | 4,961 (55.2%) | 4,026 (44.8%) |
Production, Transportation and Moving Occupations
The most common Production, Transportation and Moving occupations in Green Lake County are Production (1,227 | 13.7%), Material Moving (558 | 6.2%), and Transportation (304 | 3.4%).
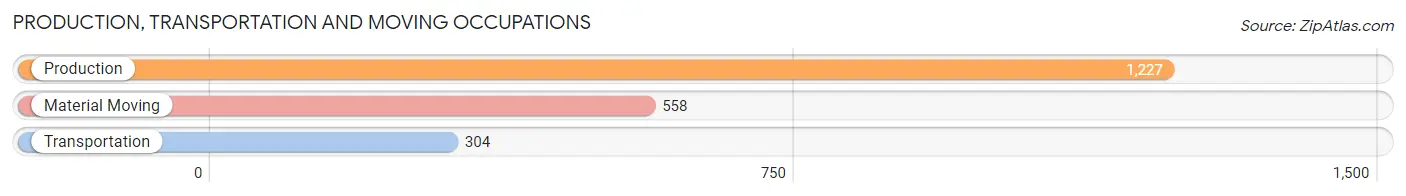
Production, Transportation and Moving Occupations by Sex
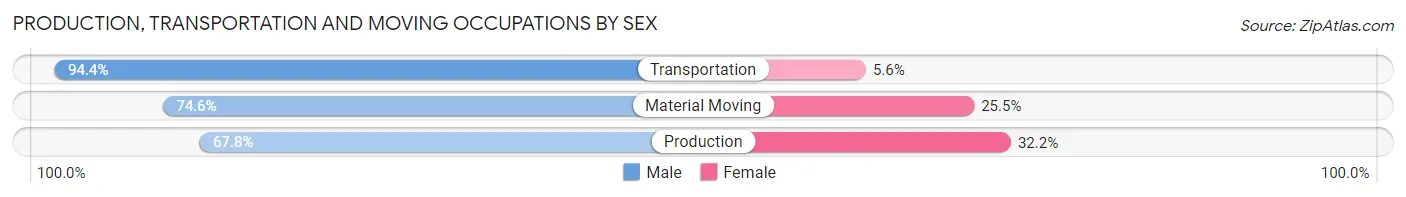
| Occupation | Male | Female |
| Production | 832 (67.8%) | 395 (32.2%) |
| Transportation | 287 (94.4%) | 17 (5.6%) |
| Material Moving | 416 (74.6%) | 142 (25.5%) |
| Total (Category) | 1,535 (73.5%) | 554 (26.5%) |
| Total (Overall) | 4,961 (55.2%) | 4,026 (44.8%) |
Employment Industries by Sex in Green Lake County
Employment Industries in Green Lake County
The major employment industries in Green Lake County include Manufacturing (2,179 | 24.2%), Retail Trade (1,100 | 12.2%), Health Care & Social Assistance (1,048 | 11.7%), Construction (810 | 9.0%), and Educational Services (497 | 5.5%).

Employment Industries by Sex in Green Lake County
The Green Lake County industries that see more men than women are Utilities (100.0%), Construction (92.1%), and Mining, Quarrying, & Extraction (85.0%), whereas the industries that tend to have a higher number of women are Enterprise Management (100.0%), Health Care & Social Assistance (85.4%), and Educational Services (71.4%).
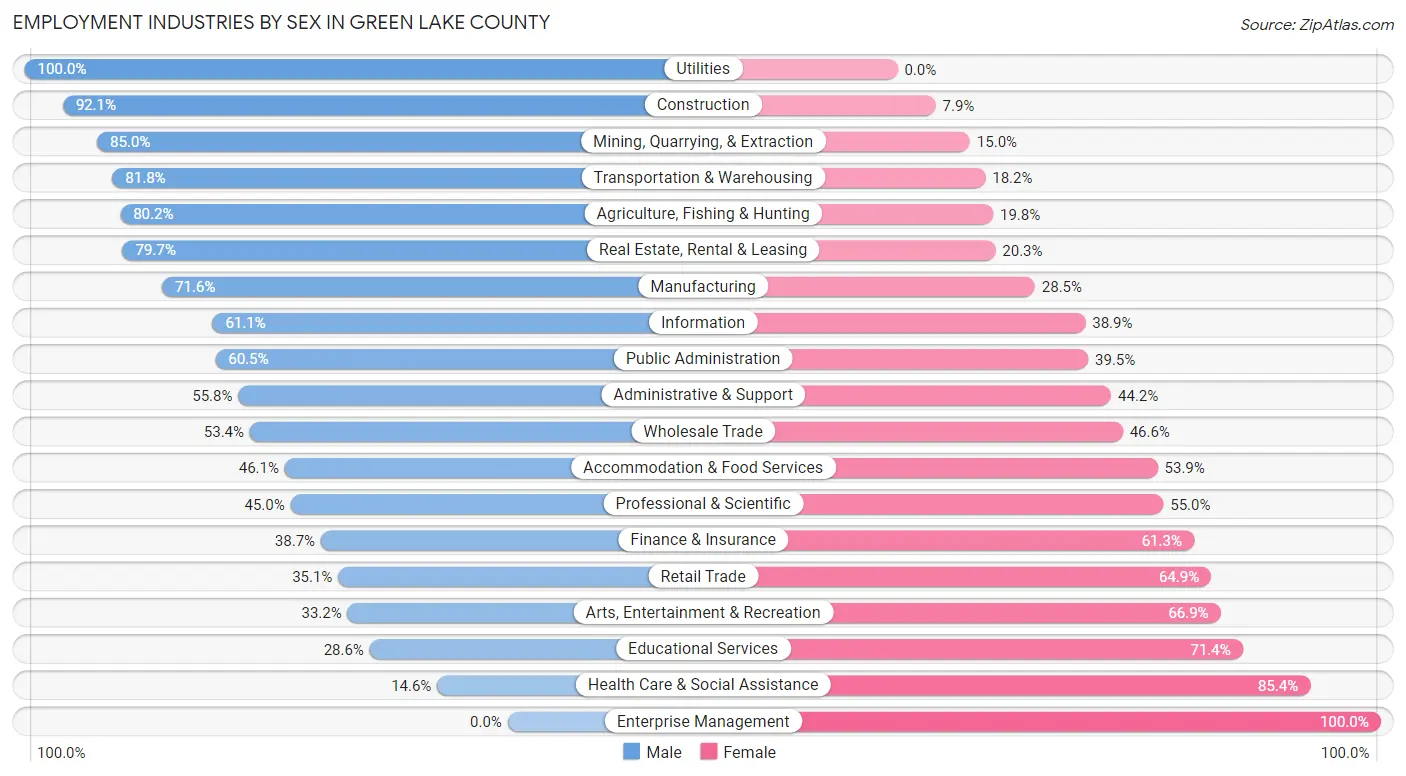
| Industry | Male | Female |
| Agriculture, Fishing & Hunting | 316 (80.2%) | 78 (19.8%) |
| Mining, Quarrying, & Extraction | 68 (85.0%) | 12 (15.0%) |
| Construction | 746 (92.1%) | 64 (7.9%) |
| Manufacturing | 1,559 (71.6%) | 620 (28.4%) |
| Wholesale Trade | 111 (53.4%) | 97 (46.6%) |
| Retail Trade | 386 (35.1%) | 714 (64.9%) |
| Transportation & Warehousing | 252 (81.8%) | 56 (18.2%) |
| Utilities | 58 (100.0%) | 0 (0.0%) |
| Information | 22 (61.1%) | 14 (38.9%) |
| Finance & Insurance | 99 (38.7%) | 157 (61.3%) |
| Real Estate, Rental & Leasing | 59 (79.7%) | 15 (20.3%) |
| Professional & Scientific | 156 (45.0%) | 191 (55.0%) |
| Enterprise Management | 0 (0.0%) | 1 (100.0%) |
| Administrative & Support | 116 (55.8%) | 92 (44.2%) |
| Educational Services | 142 (28.6%) | 355 (71.4%) |
| Health Care & Social Assistance | 153 (14.6%) | 895 (85.4%) |
| Arts, Entertainment & Recreation | 59 (33.2%) | 119 (66.8%) |
| Accommodation & Food Services | 203 (46.1%) | 237 (53.9%) |
| Public Administration | 299 (60.5%) | 195 (39.5%) |
| Total | 4,961 (55.2%) | 4,026 (44.8%) |
Education in Green Lake County
School Enrollment in Green Lake County
The most common levels of schooling among the 3,794 students in Green Lake County are high school (978 | 25.8%), middle school (915 | 24.1%), and elementary school (901 | 23.7%).
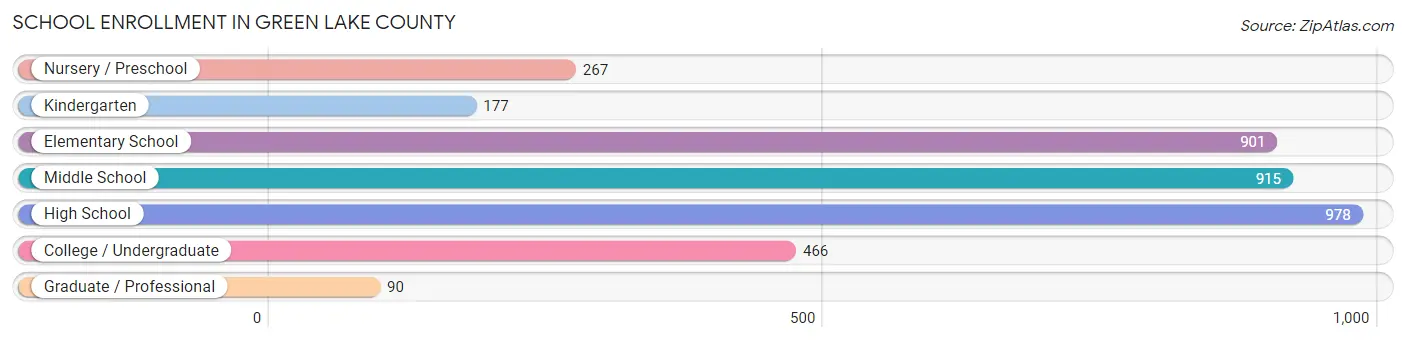
| School Level | # Students | % Students |
| Nursery / Preschool | 267 | 7.0% |
| Kindergarten | 177 | 4.7% |
| Elementary School | 901 | 23.7% |
| Middle School | 915 | 24.1% |
| High School | 978 | 25.8% |
| College / Undergraduate | 466 | 12.3% |
| Graduate / Professional | 90 | 2.4% |
| Total | 3,794 | 100.0% |
School Enrollment by Age by Funding Source in Green Lake County
Out of a total of 3,794 students who are enrolled in schools in Green Lake County, 531 (14.0%) attend a private institution, while the remaining 3,263 (86.0%) are enrolled in public schools. The age group of 35 years and over has the highest likelihood of being enrolled in private schools, with 27 (26.7% in the age bracket) enrolled. Conversely, the age group of 15 to 17 year olds has the lowest likelihood of being enrolled in a private school, with 670 (95.2% in the age bracket) attending a public institution.

| Age Bracket | Public School | Private School |
| 3 to 4 Year Olds | 147 (82.6%) | 31 (17.4%) |
| 5 to 9 Year Old | 857 (84.6%) | 156 (15.4%) |
| 10 to 14 Year Olds | 1,037 (85.2%) | 180 (14.8%) |
| 15 to 17 Year Olds | 670 (95.2%) | 34 (4.8%) |
| 18 to 19 Year Olds | 175 (86.2%) | 28 (13.8%) |
| 20 to 24 Year Olds | 190 (84.8%) | 34 (15.2%) |
| 25 to 34 Year Olds | 113 (73.4%) | 41 (26.6%) |
| 35 Years and over | 74 (73.3%) | 27 (26.7%) |
| Total | 3,263 (86.0%) | 531 (14.0%) |
Educational Attainment by Field of Study in Green Lake County
Education (628 | 19.1%), business (564 | 17.2%), science & technology (361 | 11.0%), bio, nature & agricultural (275 | 8.4%), and arts & humanities (263 | 8.0%) are the most common fields of study among 3,282 individuals in Green Lake County who have obtained a bachelor's degree or higher.
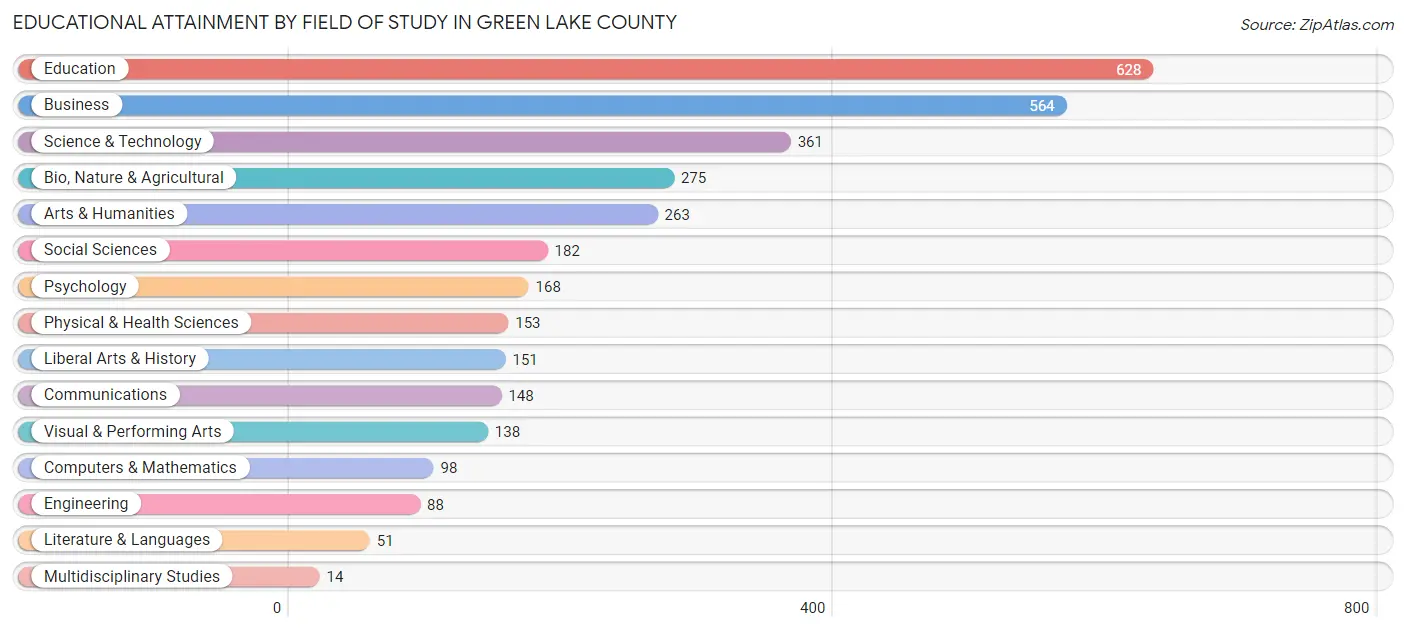
| Field of Study | # Graduates | % Graduates |
| Computers & Mathematics | 98 | 3.0% |
| Bio, Nature & Agricultural | 275 | 8.4% |
| Physical & Health Sciences | 153 | 4.7% |
| Psychology | 168 | 5.1% |
| Social Sciences | 182 | 5.6% |
| Engineering | 88 | 2.7% |
| Multidisciplinary Studies | 14 | 0.4% |
| Science & Technology | 361 | 11.0% |
| Business | 564 | 17.2% |
| Education | 628 | 19.1% |
| Literature & Languages | 51 | 1.5% |
| Liberal Arts & History | 151 | 4.6% |
| Visual & Performing Arts | 138 | 4.2% |
| Communications | 148 | 4.5% |
| Arts & Humanities | 263 | 8.0% |
| Total | 3,282 | 100.0% |
Transportation & Commute in Green Lake County
Vehicle Availability by Sex in Green Lake County
The most prevalent vehicle ownership categories in Green Lake County are males with 2 vehicles (2,031, accounting for 41.4%) and females with 2 vehicles (1,674, making up 52.0%).

| Vehicles Available | Male | Female |
| No Vehicle | 216 (4.4%) | 132 (3.4%) |
| 1 Vehicle | 696 (14.2%) | 574 (14.7%) |
| 2 Vehicles | 2,031 (41.4%) | 1,674 (42.8%) |
| 3 Vehicles | 1,245 (25.4%) | 953 (24.4%) |
| 4 Vehicles | 431 (8.8%) | 351 (9.0%) |
| 5 or more Vehicles | 282 (5.8%) | 225 (5.8%) |
| Total | 4,901 (100.0%) | 3,909 (100.0%) |
Commute Time in Green Lake County
The most frequently occuring commute durations in Green Lake County are 5 to 9 minutes (1,166 commuters, 14.6%), 20 to 24 minutes (1,144 commuters, 14.4%), and 10 to 14 minutes (1,000 commuters, 12.6%).
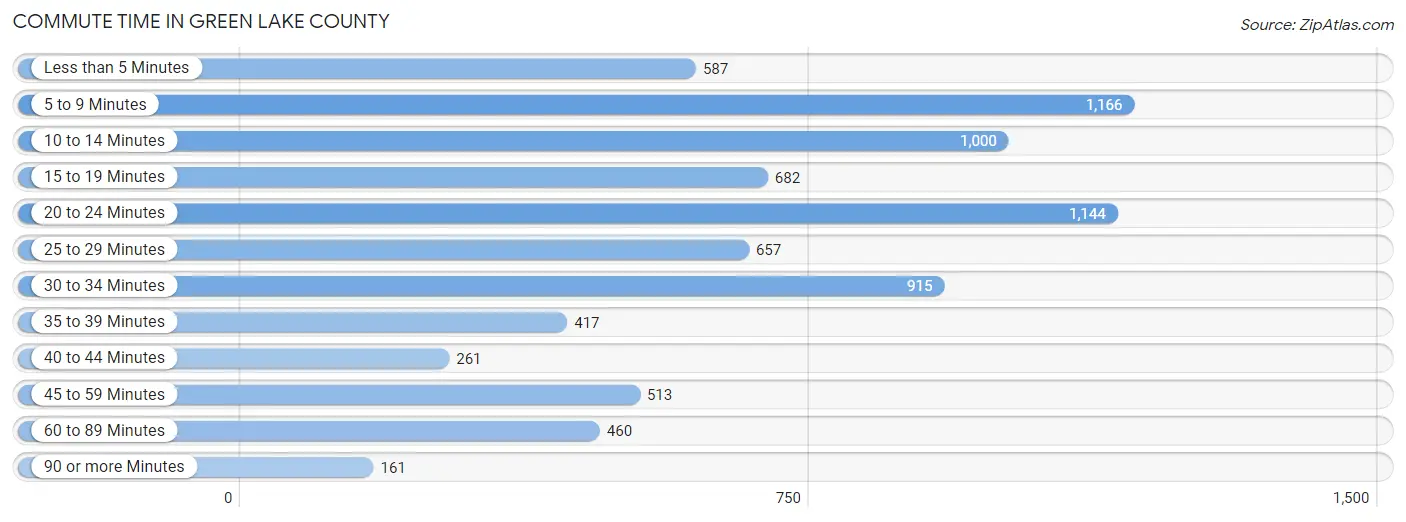
| Commute Time | # Commuters | % Commuters |
| Less than 5 Minutes | 587 | 7.4% |
| 5 to 9 Minutes | 1,166 | 14.6% |
| 10 to 14 Minutes | 1,000 | 12.6% |
| 15 to 19 Minutes | 682 | 8.6% |
| 20 to 24 Minutes | 1,144 | 14.4% |
| 25 to 29 Minutes | 657 | 8.3% |
| 30 to 34 Minutes | 915 | 11.5% |
| 35 to 39 Minutes | 417 | 5.2% |
| 40 to 44 Minutes | 261 | 3.3% |
| 45 to 59 Minutes | 513 | 6.4% |
| 60 to 89 Minutes | 460 | 5.8% |
| 90 or more Minutes | 161 | 2.0% |
Commute Time by Sex in Green Lake County
The most common commute times in Green Lake County are 20 to 24 minutes (716 commuters, 16.2%) for males and 5 to 9 minutes (664 commuters, 18.8%) for females.
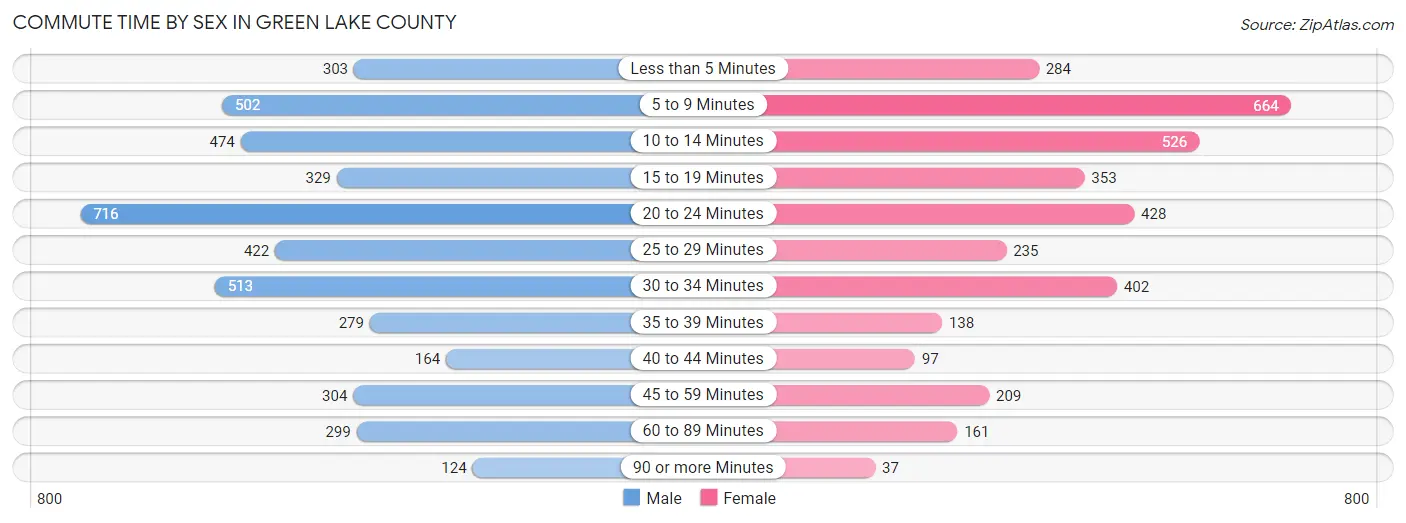
| Commute Time | Male | Female |
| Less than 5 Minutes | 303 (6.8%) | 284 (8.0%) |
| 5 to 9 Minutes | 502 (11.3%) | 664 (18.8%) |
| 10 to 14 Minutes | 474 (10.7%) | 526 (14.9%) |
| 15 to 19 Minutes | 329 (7.4%) | 353 (10.0%) |
| 20 to 24 Minutes | 716 (16.2%) | 428 (12.1%) |
| 25 to 29 Minutes | 422 (9.5%) | 235 (6.7%) |
| 30 to 34 Minutes | 513 (11.6%) | 402 (11.4%) |
| 35 to 39 Minutes | 279 (6.3%) | 138 (3.9%) |
| 40 to 44 Minutes | 164 (3.7%) | 97 (2.7%) |
| 45 to 59 Minutes | 304 (6.9%) | 209 (5.9%) |
| 60 to 89 Minutes | 299 (6.8%) | 161 (4.6%) |
| 90 or more Minutes | 124 (2.8%) | 37 (1.1%) |
Time of Departure to Work by Sex in Green Lake County
The most frequent times of departure to work in Green Lake County are 12:00 AM to 4:59 AM (609, 13.8%) for males and 7:30 AM to 7:59 AM (616, 17.4%) for females.
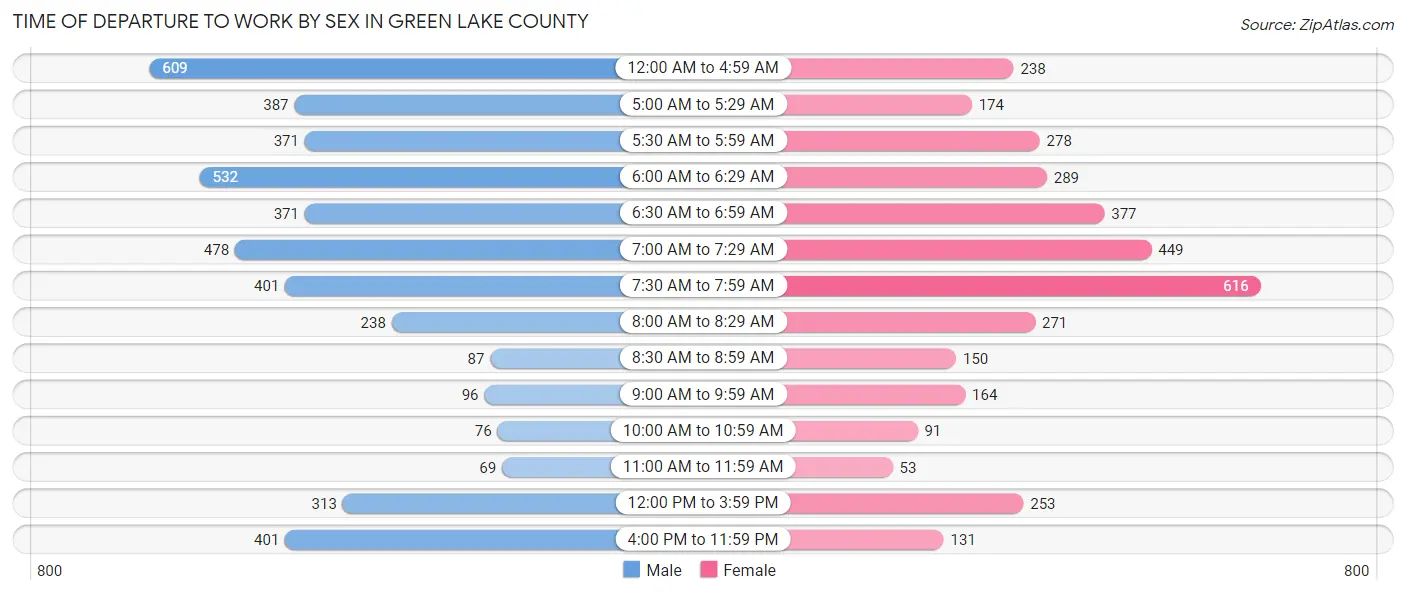
| Time of Departure | Male | Female |
| 12:00 AM to 4:59 AM | 609 (13.8%) | 238 (6.7%) |
| 5:00 AM to 5:29 AM | 387 (8.7%) | 174 (4.9%) |
| 5:30 AM to 5:59 AM | 371 (8.4%) | 278 (7.9%) |
| 6:00 AM to 6:29 AM | 532 (12.0%) | 289 (8.2%) |
| 6:30 AM to 6:59 AM | 371 (8.4%) | 377 (10.7%) |
| 7:00 AM to 7:29 AM | 478 (10.8%) | 449 (12.7%) |
| 7:30 AM to 7:59 AM | 401 (9.0%) | 616 (17.4%) |
| 8:00 AM to 8:29 AM | 238 (5.4%) | 271 (7.7%) |
| 8:30 AM to 8:59 AM | 87 (2.0%) | 150 (4.2%) |
| 9:00 AM to 9:59 AM | 96 (2.2%) | 164 (4.6%) |
| 10:00 AM to 10:59 AM | 76 (1.7%) | 91 (2.6%) |
| 11:00 AM to 11:59 AM | 69 (1.6%) | 53 (1.5%) |
| 12:00 PM to 3:59 PM | 313 (7.1%) | 253 (7.2%) |
| 4:00 PM to 11:59 PM | 401 (9.0%) | 131 (3.7%) |
| Total | 4,429 (100.0%) | 3,534 (100.0%) |
Housing Occupancy in Green Lake County
Occupancy by Ownership in Green Lake County
Of the total 8,025 dwellings in Green Lake County, owner-occupied units account for 6,158 (76.7%), while renter-occupied units make up 1,867 (23.3%).
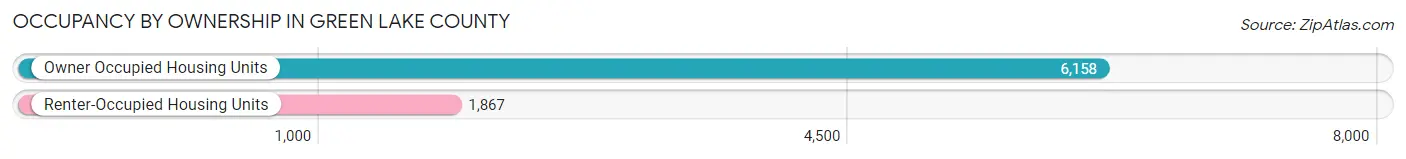
| Occupancy | # Housing Units | % Housing Units |
| Owner Occupied Housing Units | 6,158 | 76.7% |
| Renter-Occupied Housing Units | 1,867 | 23.3% |
| Total Occupied Housing Units | 8,025 | 100.0% |
Occupancy by Household Size in Green Lake County
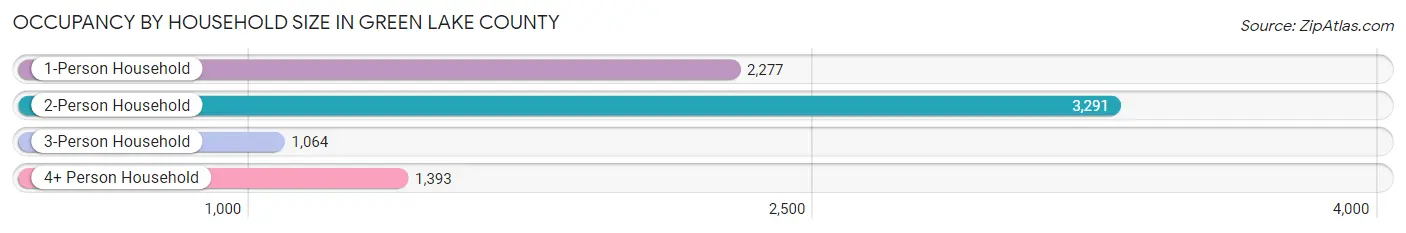
| Household Size | # Housing Units | % Housing Units |
| 1-Person Household | 2,277 | 28.4% |
| 2-Person Household | 3,291 | 41.0% |
| 3-Person Household | 1,064 | 13.3% |
| 4+ Person Household | 1,393 | 17.4% |
| Total Housing Units | 8,025 | 100.0% |
Occupancy by Ownership by Household Size in Green Lake County
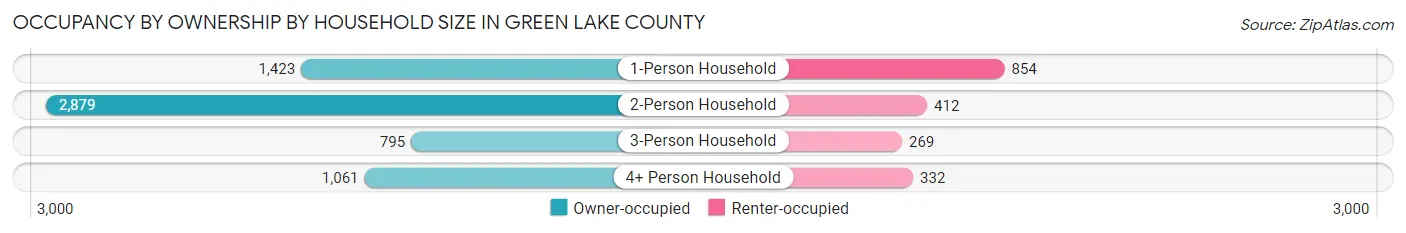
| Household Size | Owner-occupied | Renter-occupied |
| 1-Person Household | 1,423 (62.5%) | 854 (37.5%) |
| 2-Person Household | 2,879 (87.5%) | 412 (12.5%) |
| 3-Person Household | 795 (74.7%) | 269 (25.3%) |
| 4+ Person Household | 1,061 (76.2%) | 332 (23.8%) |
| Total Housing Units | 6,158 (76.7%) | 1,867 (23.3%) |
Occupancy by Educational Attainment in Green Lake County
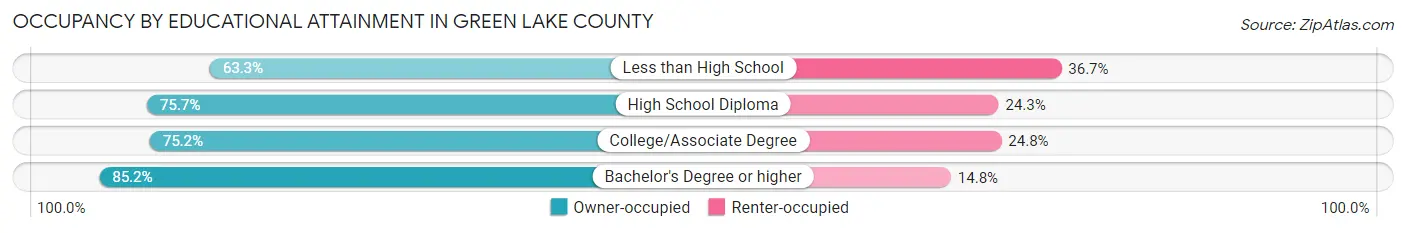
| Household Size | Owner-occupied | Renter-occupied |
| Less than High School | 436 (63.3%) | 253 (36.7%) |
| High School Diploma | 2,116 (75.7%) | 678 (24.3%) |
| College/Associate Degree | 1,974 (75.2%) | 652 (24.8%) |
| Bachelor's Degree or higher | 1,632 (85.2%) | 284 (14.8%) |
Occupancy by Age of Householder in Green Lake County

| Age Bracket | # Households | % Households |
| Under 35 Years | 1,214 | 15.1% |
| 35 to 44 Years | 1,123 | 14.0% |
| 45 to 54 Years | 1,343 | 16.7% |
| 55 to 64 Years | 1,617 | 20.2% |
| 65 to 74 Years | 1,522 | 19.0% |
| 75 to 84 Years | 870 | 10.8% |
| 85 Years and Over | 336 | 4.2% |
| Total | 8,025 | 100.0% |
Housing Finances in Green Lake County
Median Income by Occupancy in Green Lake County
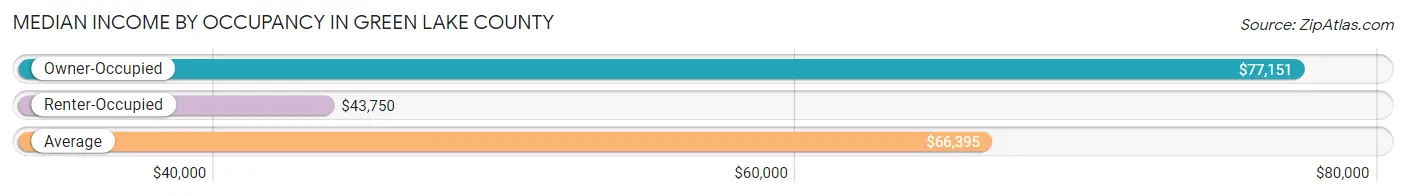
| Occupancy Type | # Households | Median Income |
| Owner-Occupied | 6,158 (76.7%) | $77,151 |
| Renter-Occupied | 1,867 (23.3%) | $43,750 |
| Average | 8,025 (100.0%) | $66,395 |
Occupancy by Householder Income Bracket in Green Lake County
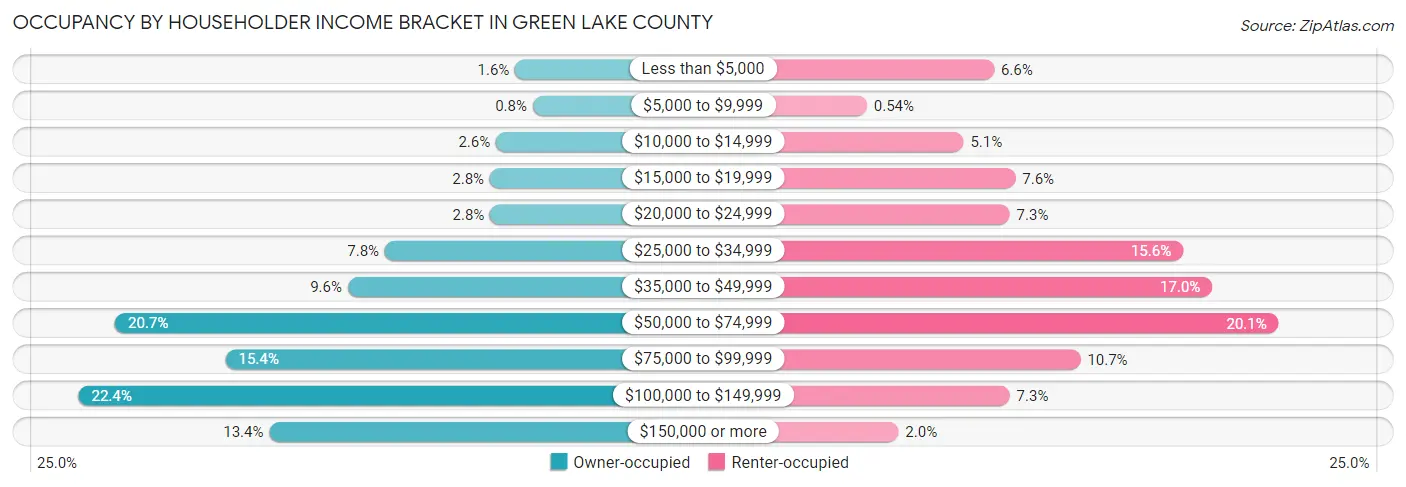
| Income Bracket | Owner-occupied | Renter-occupied |
| Less than $5,000 | 101 (1.6%) | 123 (6.6%) |
| $5,000 to $9,999 | 49 (0.8%) | 10 (0.5%) |
| $10,000 to $14,999 | 157 (2.5%) | 96 (5.1%) |
| $15,000 to $19,999 | 175 (2.8%) | 142 (7.6%) |
| $20,000 to $24,999 | 174 (2.8%) | 137 (7.3%) |
| $25,000 to $34,999 | 483 (7.8%) | 291 (15.6%) |
| $35,000 to $49,999 | 592 (9.6%) | 317 (17.0%) |
| $50,000 to $74,999 | 1,274 (20.7%) | 376 (20.1%) |
| $75,000 to $99,999 | 950 (15.4%) | 200 (10.7%) |
| $100,000 to $149,999 | 1,381 (22.4%) | 137 (7.3%) |
| $150,000 or more | 822 (13.4%) | 38 (2.0%) |
| Total | 6,158 (100.0%) | 1,867 (100.0%) |
Monthly Housing Cost Tiers in Green Lake County
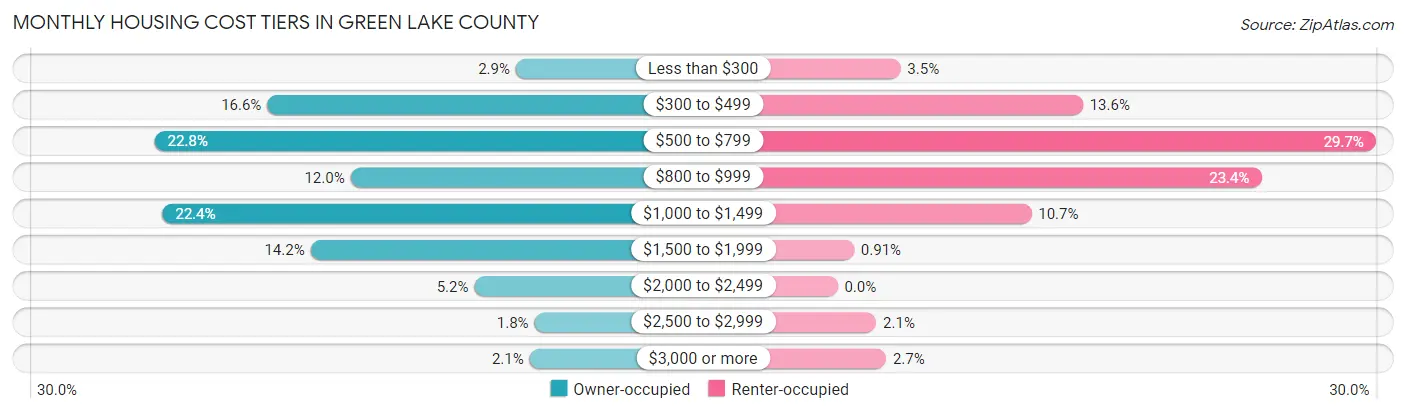
| Monthly Cost | Owner-occupied | Renter-occupied |
| Less than $300 | 177 (2.9%) | 65 (3.5%) |
| $300 to $499 | 1,022 (16.6%) | 253 (13.6%) |
| $500 to $799 | 1,405 (22.8%) | 555 (29.7%) |
| $800 to $999 | 739 (12.0%) | 437 (23.4%) |
| $1,000 to $1,499 | 1,379 (22.4%) | 200 (10.7%) |
| $1,500 to $1,999 | 875 (14.2%) | 17 (0.9%) |
| $2,000 to $2,499 | 318 (5.2%) | 0 (0.0%) |
| $2,500 to $2,999 | 113 (1.8%) | 40 (2.1%) |
| $3,000 or more | 130 (2.1%) | 50 (2.7%) |
| Total | 6,158 (100.0%) | 1,867 (100.0%) |
Physical Housing Characteristics in Green Lake County
Housing Structures in Green Lake County
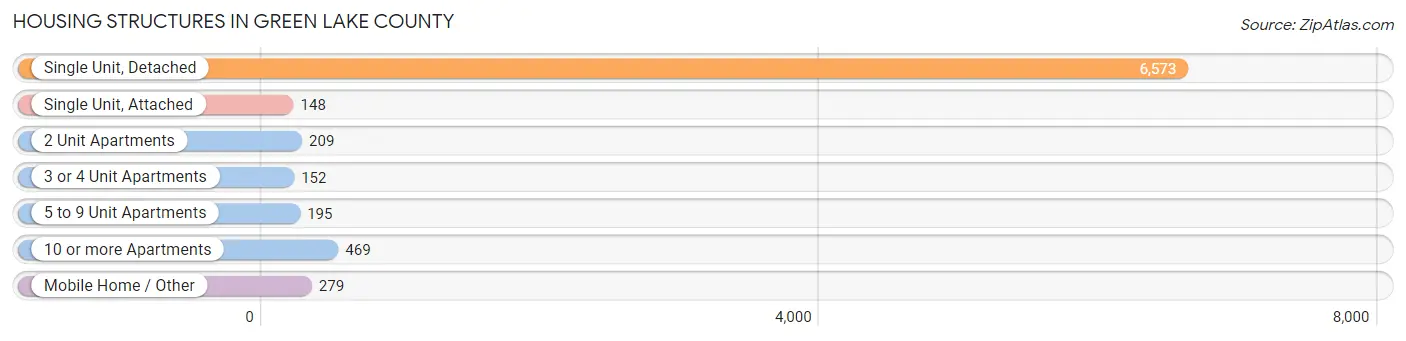
| Structure Type | # Housing Units | % Housing Units |
| Single Unit, Detached | 6,573 | 81.9% |
| Single Unit, Attached | 148 | 1.8% |
| 2 Unit Apartments | 209 | 2.6% |
| 3 or 4 Unit Apartments | 152 | 1.9% |
| 5 to 9 Unit Apartments | 195 | 2.4% |
| 10 or more Apartments | 469 | 5.8% |
| Mobile Home / Other | 279 | 3.5% |
| Total | 8,025 | 100.0% |
Housing Structures by Occupancy in Green Lake County
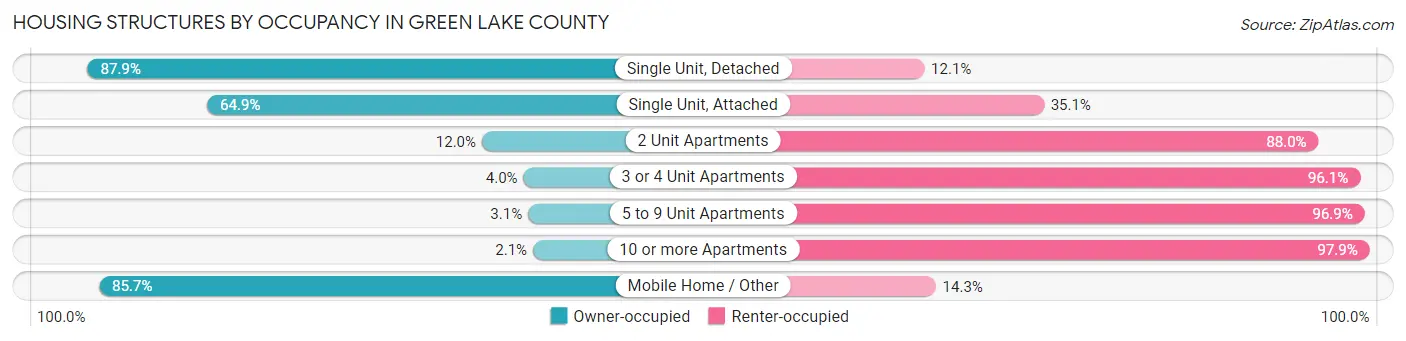
| Structure Type | Owner-occupied | Renter-occupied |
| Single Unit, Detached | 5,776 (87.9%) | 797 (12.1%) |
| Single Unit, Attached | 96 (64.9%) | 52 (35.1%) |
| 2 Unit Apartments | 25 (12.0%) | 184 (88.0%) |
| 3 or 4 Unit Apartments | 6 (4.0%) | 146 (96.1%) |
| 5 to 9 Unit Apartments | 6 (3.1%) | 189 (96.9%) |
| 10 or more Apartments | 10 (2.1%) | 459 (97.9%) |
| Mobile Home / Other | 239 (85.7%) | 40 (14.3%) |
| Total | 6,158 (76.7%) | 1,867 (23.3%) |
Housing Structures by Number of Rooms in Green Lake County
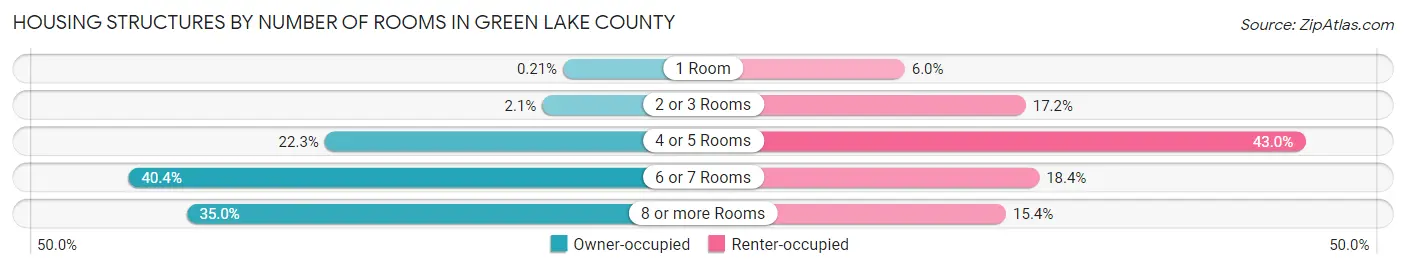
| Number of Rooms | Owner-occupied | Renter-occupied |
| 1 Room | 13 (0.2%) | 112 (6.0%) |
| 2 or 3 Rooms | 131 (2.1%) | 321 (17.2%) |
| 4 or 5 Rooms | 1,370 (22.3%) | 803 (43.0%) |
| 6 or 7 Rooms | 2,487 (40.4%) | 344 (18.4%) |
| 8 or more Rooms | 2,157 (35.0%) | 287 (15.4%) |
| Total | 6,158 (100.0%) | 1,867 (100.0%) |
Housing Structure by Heating Type in Green Lake County

| Heating Type | Owner-occupied | Renter-occupied |
| Utility Gas | 3,748 (60.9%) | 938 (50.2%) |
| Bottled, Tank, or LP Gas | 1,568 (25.5%) | 210 (11.3%) |
| Electricity | 239 (3.9%) | 619 (33.2%) |
| Fuel Oil or Kerosene | 74 (1.2%) | 25 (1.3%) |
| Coal or Coke | 6 (0.1%) | 4 (0.2%) |
| All other Fuels | 517 (8.4%) | 56 (3.0%) |
| No Fuel Used | 6 (0.1%) | 15 (0.8%) |
| Total | 6,158 (100.0%) | 1,867 (100.0%) |
Household Vehicle Usage in Green Lake County
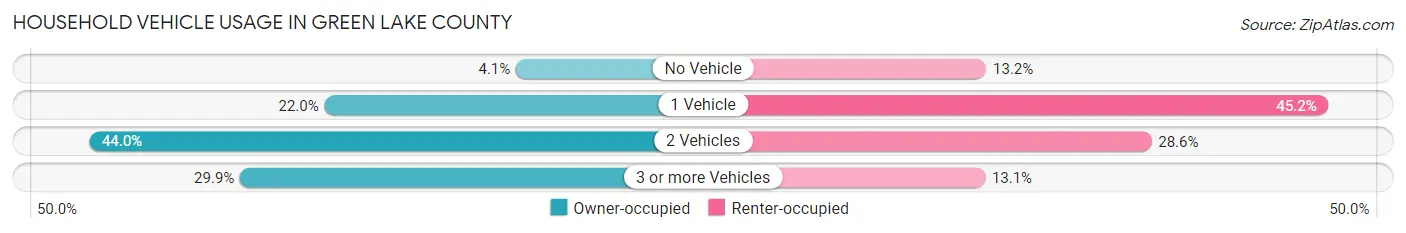
| Vehicles per Household | Owner-occupied | Renter-occupied |
| No Vehicle | 254 (4.1%) | 246 (13.2%) |
| 1 Vehicle | 1,355 (22.0%) | 843 (45.2%) |
| 2 Vehicles | 2,709 (44.0%) | 534 (28.6%) |
| 3 or more Vehicles | 1,840 (29.9%) | 244 (13.1%) |
| Total | 6,158 (100.0%) | 1,867 (100.0%) |
Real Estate & Mortgages in Green Lake County
Real Estate and Mortgage Overview in Green Lake County
| Characteristic | Without Mortgage | With Mortgage |
| Housing Units | 2,715 | 3,443 |
| Median Property Value | $183,500 | $186,900 |
| Median Household Income | $63,139 | $519 |
| Monthly Housing Costs | $530 | $119 |
| Real Estate Taxes | $2,652 | $18 |
Property Value by Mortgage Status in Green Lake County
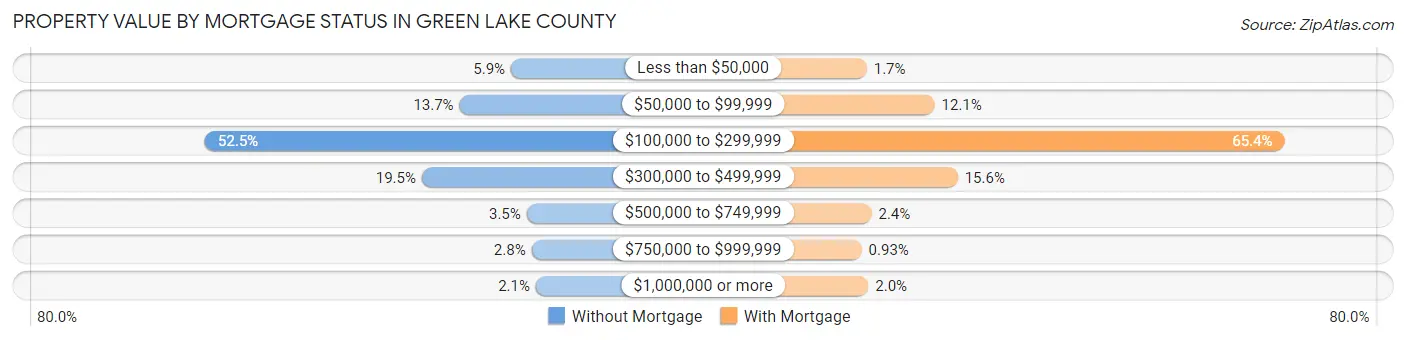
| Property Value | Without Mortgage | With Mortgage |
| Less than $50,000 | 160 (5.9%) | 59 (1.7%) |
| $50,000 to $99,999 | 373 (13.7%) | 415 (12.0%) |
| $100,000 to $299,999 | 1,426 (52.5%) | 2,250 (65.3%) |
| $300,000 to $499,999 | 529 (19.5%) | 536 (15.6%) |
| $500,000 to $749,999 | 95 (3.5%) | 84 (2.4%) |
| $750,000 to $999,999 | 75 (2.8%) | 32 (0.9%) |
| $1,000,000 or more | 57 (2.1%) | 67 (1.9%) |
| Total | 2,715 (100.0%) | 3,443 (100.0%) |
Household Income by Mortgage Status in Green Lake County
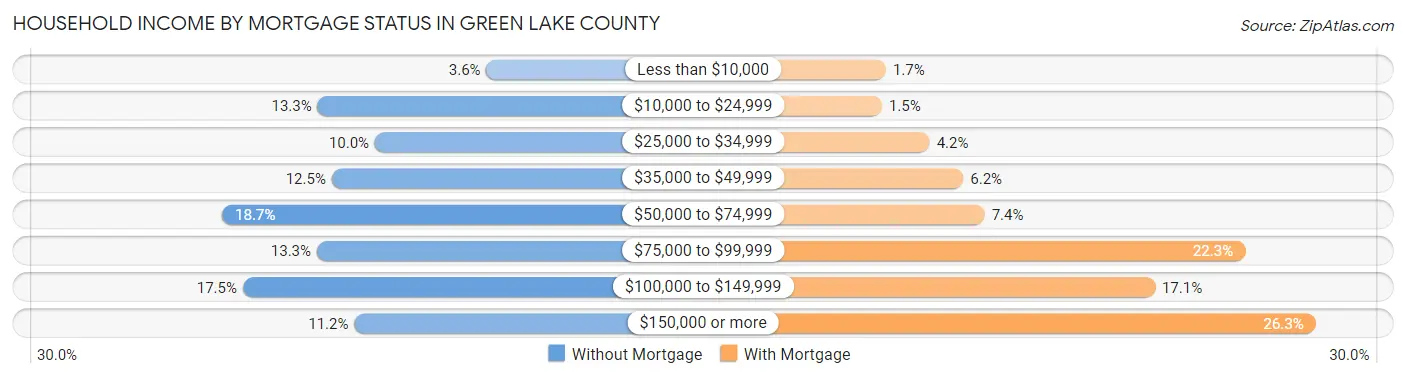
| Household Income | Without Mortgage | With Mortgage |
| Less than $10,000 | 98 (3.6%) | 60 (1.7%) |
| $10,000 to $24,999 | 360 (13.3%) | 52 (1.5%) |
| $25,000 to $34,999 | 271 (10.0%) | 146 (4.2%) |
| $35,000 to $49,999 | 338 (12.4%) | 212 (6.2%) |
| $50,000 to $74,999 | 508 (18.7%) | 254 (7.4%) |
| $75,000 to $99,999 | 361 (13.3%) | 766 (22.3%) |
| $100,000 to $149,999 | 476 (17.5%) | 589 (17.1%) |
| $150,000 or more | 303 (11.2%) | 905 (26.3%) |
| Total | 2,715 (100.0%) | 3,443 (100.0%) |
Property Value to Household Income Ratio in Green Lake County
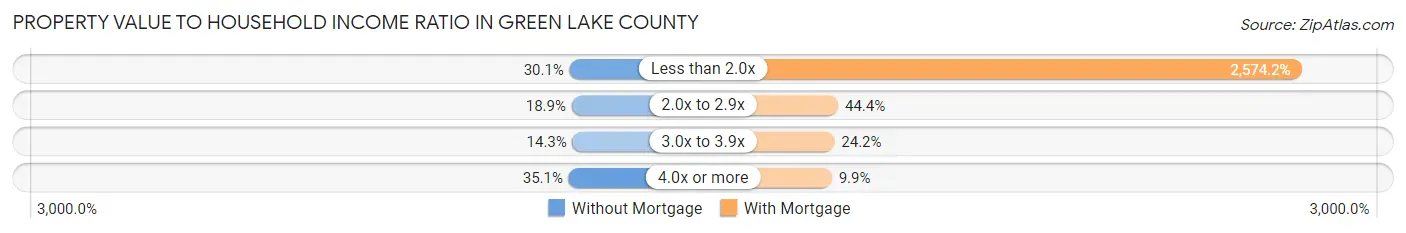
| Value-to-Income Ratio | Without Mortgage | With Mortgage |
| Less than 2.0x | 817 (30.1%) | 88,628 (2,574.1%) |
| 2.0x to 2.9x | 513 (18.9%) | 1,528 (44.4%) |
| 3.0x to 3.9x | 389 (14.3%) | 832 (24.2%) |
| 4.0x or more | 953 (35.1%) | 342 (9.9%) |
| Total | 2,715 (100.0%) | 3,443 (100.0%) |
Real Estate Taxes by Mortgage Status in Green Lake County
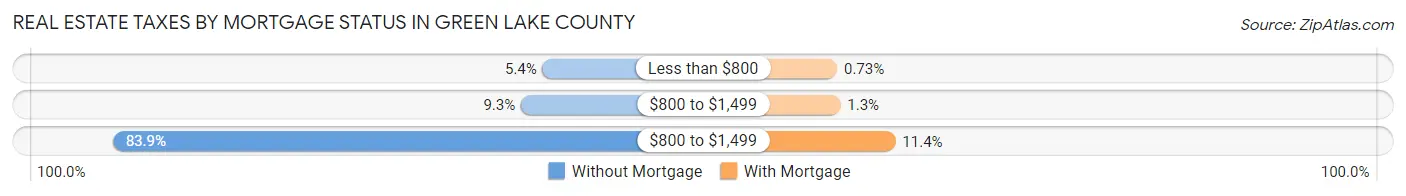
| Property Taxes | Without Mortgage | With Mortgage |
| Less than $800 | 146 (5.4%) | 25 (0.7%) |
| $800 to $1,499 | 253 (9.3%) | 46 (1.3%) |
| $800 to $1,499 | 2,278 (83.9%) | 392 (11.4%) |
| Total | 2,715 (100.0%) | 3,443 (100.0%) |
Health & Disability in Green Lake County
Health Insurance Coverage by Age in Green Lake County
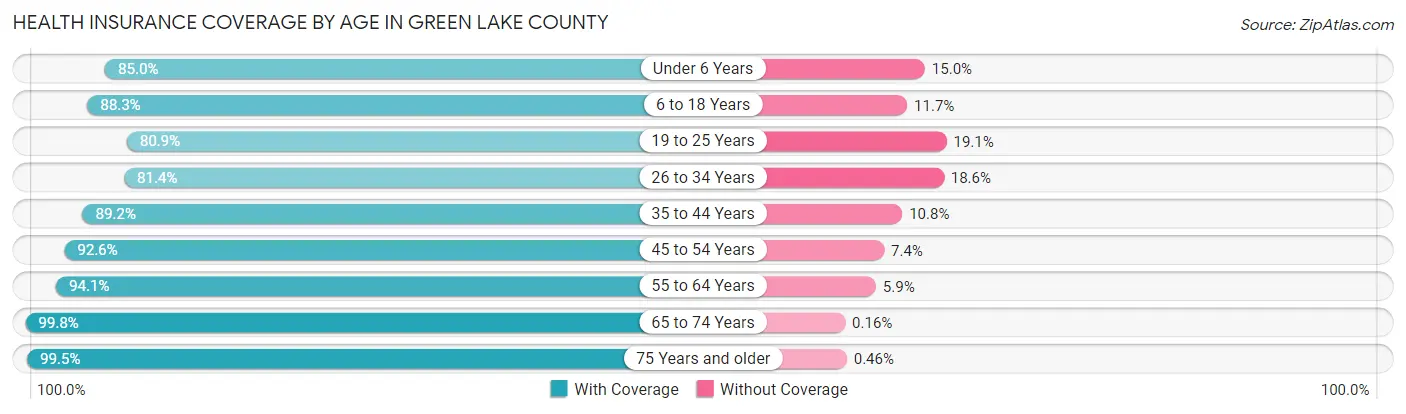
| Age Bracket | With Coverage | Without Coverage |
| Under 6 Years | 1,074 (85.0%) | 190 (15.0%) |
| 6 to 18 Years | 2,720 (88.3%) | 361 (11.7%) |
| 19 to 25 Years | 1,137 (80.9%) | 268 (19.1%) |
| 26 to 34 Years | 1,290 (81.4%) | 294 (18.6%) |
| 35 to 44 Years | 1,856 (89.2%) | 225 (10.8%) |
| 45 to 54 Years | 2,045 (92.6%) | 164 (7.4%) |
| 55 to 64 Years | 2,860 (94.1%) | 179 (5.9%) |
| 65 to 74 Years | 2,506 (99.8%) | 4 (0.2%) |
| 75 Years and older | 1,737 (99.5%) | 8 (0.5%) |
| Total | 17,225 (91.0%) | 1,693 (8.9%) |
Health Insurance Coverage by Citizenship Status in Green Lake County
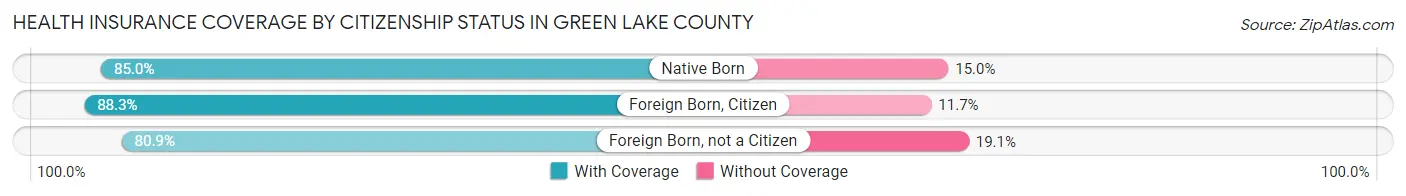
| Citizenship Status | With Coverage | Without Coverage |
| Native Born | 1,074 (85.0%) | 190 (15.0%) |
| Foreign Born, Citizen | 2,720 (88.3%) | 361 (11.7%) |
| Foreign Born, not a Citizen | 1,137 (80.9%) | 268 (19.1%) |
Health Insurance Coverage by Household Income in Green Lake County
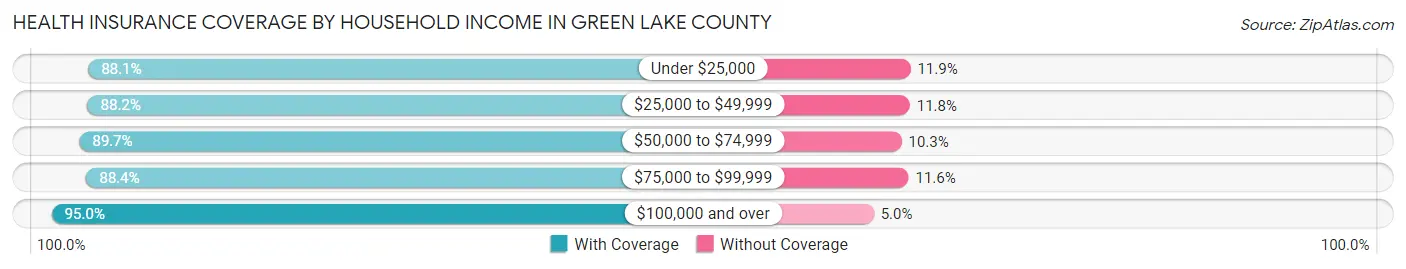
| Household Income | With Coverage | Without Coverage |
| Under $25,000 | 1,779 (88.1%) | 241 (11.9%) |
| $25,000 to $49,999 | 2,942 (88.2%) | 394 (11.8%) |
| $50,000 to $74,999 | 3,261 (89.7%) | 373 (10.3%) |
| $75,000 to $99,999 | 2,622 (88.4%) | 343 (11.6%) |
| $100,000 and over | 6,445 (95.0%) | 342 (5.0%) |
Public vs Private Health Insurance Coverage by Age in Green Lake County
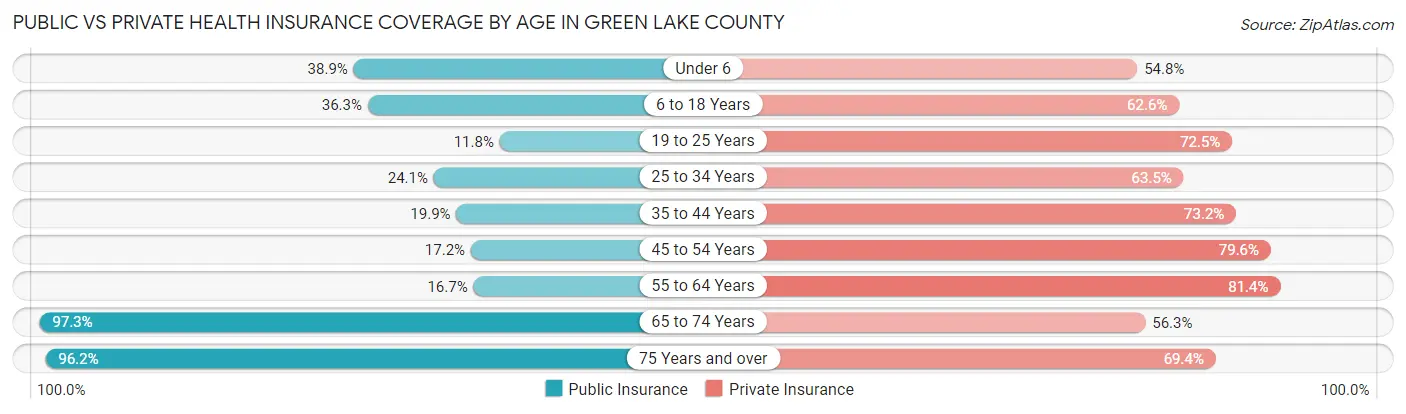
| Age Bracket | Public Insurance | Private Insurance |
| Under 6 | 492 (38.9%) | 693 (54.8%) |
| 6 to 18 Years | 1,118 (36.3%) | 1,929 (62.6%) |
| 19 to 25 Years | 166 (11.8%) | 1,018 (72.5%) |
| 25 to 34 Years | 381 (24.0%) | 1,005 (63.4%) |
| 35 to 44 Years | 413 (19.9%) | 1,523 (73.2%) |
| 45 to 54 Years | 379 (17.2%) | 1,759 (79.6%) |
| 55 to 64 Years | 507 (16.7%) | 2,473 (81.4%) |
| 65 to 74 Years | 2,441 (97.3%) | 1,414 (56.3%) |
| 75 Years and over | 1,678 (96.2%) | 1,211 (69.4%) |
| Total | 7,575 (40.0%) | 13,025 (68.9%) |
Disability Status by Sex by Age in Green Lake County
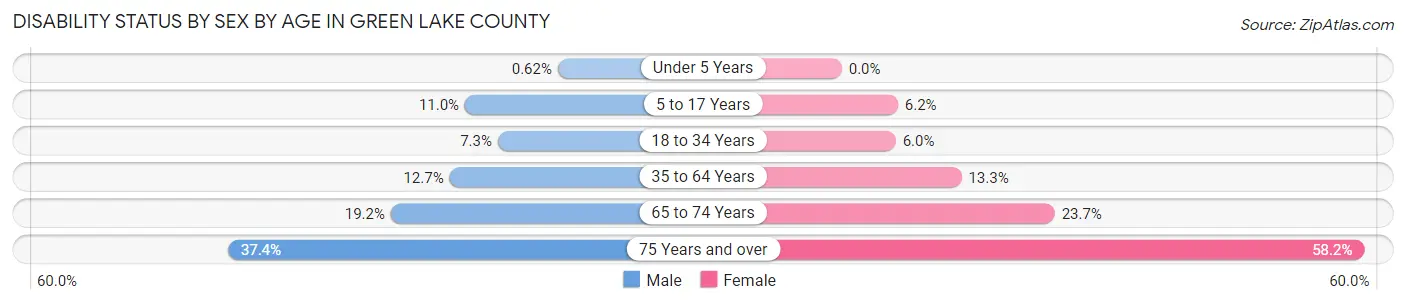
| Age Bracket | Male | Female |
| Under 5 Years | 3 (0.6%) | 0 (0.0%) |
| 5 to 17 Years | 175 (11.0%) | 94 (6.2%) |
| 18 to 34 Years | 123 (7.3%) | 90 (6.0%) |
| 35 to 64 Years | 482 (12.7%) | 470 (13.3%) |
| 65 to 74 Years | 240 (19.2%) | 299 (23.7%) |
| 75 Years and over | 275 (37.4%) | 587 (58.2%) |
Disability Class by Sex by Age in Green Lake County
Disability Class: Hearing Difficulty
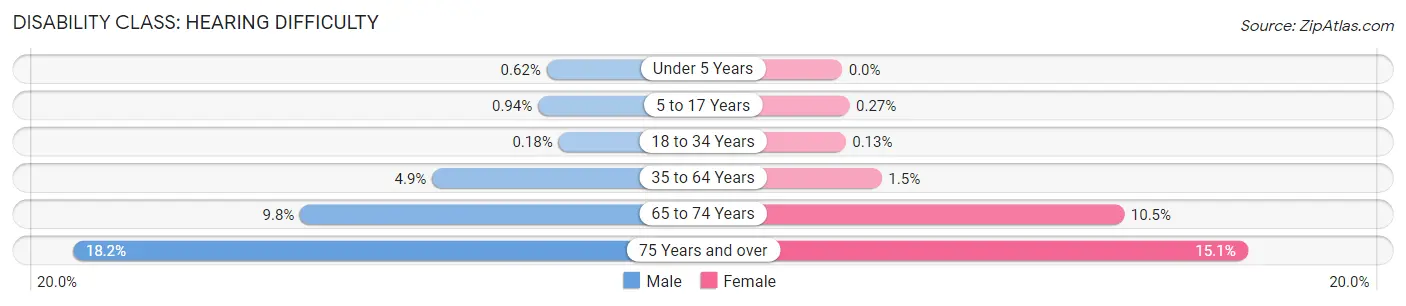
| Age Bracket | Male | Female |
| Under 5 Years | 3 (0.6%) | 0 (0.0%) |
| 5 to 17 Years | 15 (0.9%) | 4 (0.3%) |
| 18 to 34 Years | 3 (0.2%) | 2 (0.1%) |
| 35 to 64 Years | 185 (4.9%) | 52 (1.5%) |
| 65 to 74 Years | 122 (9.8%) | 132 (10.5%) |
| 75 Years and over | 134 (18.2%) | 152 (15.1%) |
Disability Class: Vision Difficulty
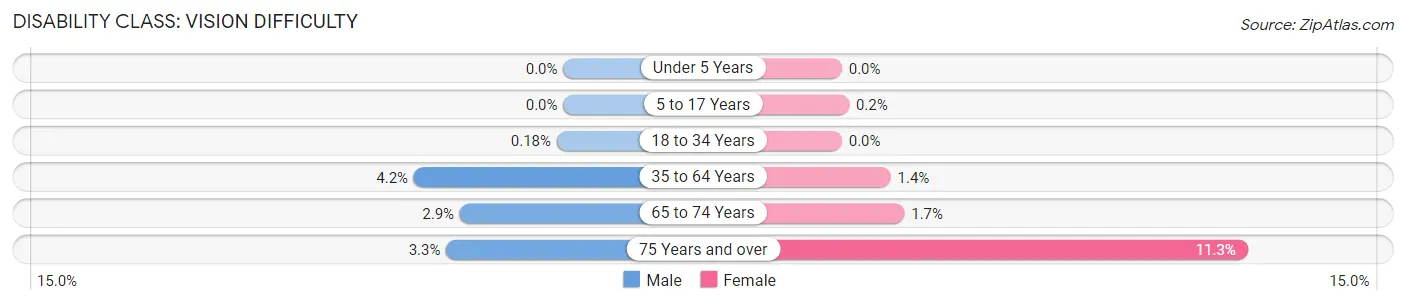
| Age Bracket | Male | Female |
| Under 5 Years | 0 (0.0%) | 0 (0.0%) |
| 5 to 17 Years | 0 (0.0%) | 3 (0.2%) |
| 18 to 34 Years | 3 (0.2%) | 0 (0.0%) |
| 35 to 64 Years | 158 (4.2%) | 48 (1.4%) |
| 65 to 74 Years | 36 (2.9%) | 22 (1.7%) |
| 75 Years and over | 24 (3.3%) | 114 (11.3%) |
Disability Class: Cognitive Difficulty

| Age Bracket | Male | Female |
| 5 to 17 Years | 160 (10.0%) | 82 (5.4%) |
| 18 to 34 Years | 112 (6.7%) | 78 (5.2%) |
| 35 to 64 Years | 243 (6.4%) | 219 (6.2%) |
| 65 to 74 Years | 28 (2.2%) | 64 (5.1%) |
| 75 Years and over | 36 (4.9%) | 135 (13.4%) |
Disability Class: Ambulatory Difficulty
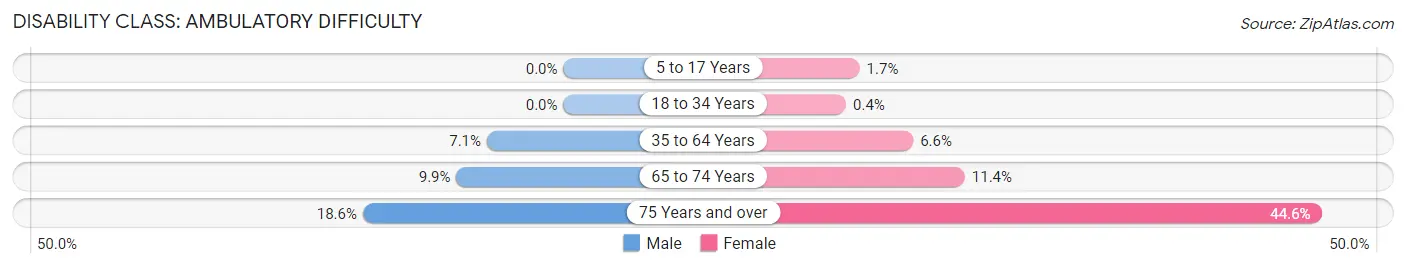
| Age Bracket | Male | Female |
| 5 to 17 Years | 0 (0.0%) | 25 (1.7%) |
| 18 to 34 Years | 0 (0.0%) | 6 (0.4%) |
| 35 to 64 Years | 270 (7.1%) | 234 (6.6%) |
| 65 to 74 Years | 124 (9.9%) | 144 (11.4%) |
| 75 Years and over | 137 (18.6%) | 450 (44.6%) |
Disability Class: Self-Care Difficulty
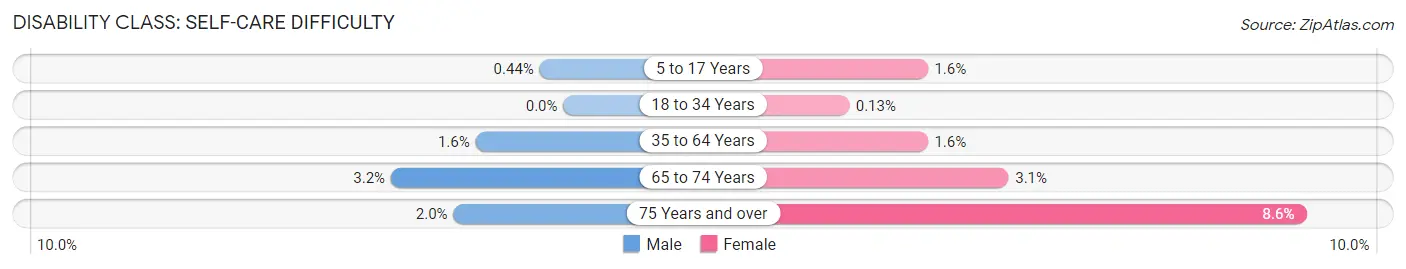
| Age Bracket | Male | Female |
| 5 to 17 Years | 7 (0.4%) | 24 (1.6%) |
| 18 to 34 Years | 0 (0.0%) | 2 (0.1%) |
| 35 to 64 Years | 62 (1.6%) | 56 (1.6%) |
| 65 to 74 Years | 40 (3.2%) | 39 (3.1%) |
| 75 Years and over | 15 (2.0%) | 87 (8.6%) |
Technology Access in Green Lake County
Computing Device Access in Green Lake County
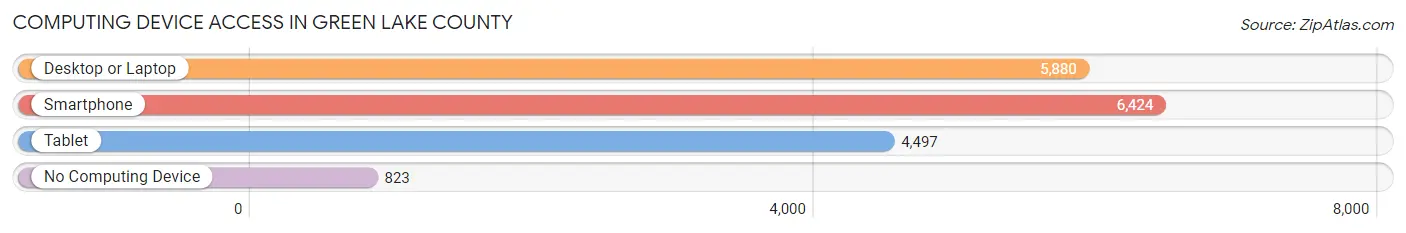
| Device Type | # Households | % Households |
| Desktop or Laptop | 5,880 | 73.3% |
| Smartphone | 6,424 | 80.0% |
| Tablet | 4,497 | 56.0% |
| No Computing Device | 823 | 10.3% |
| Total | 8,025 | 100.0% |
Internet Access in Green Lake County
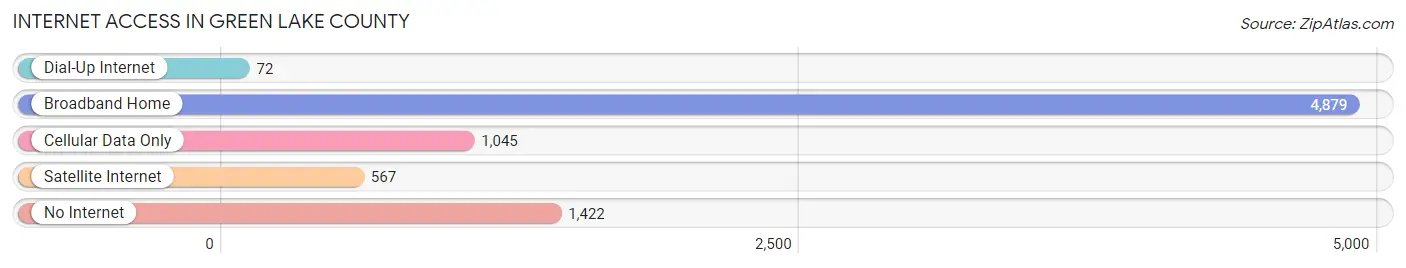
| Internet Type | # Households | % Households |
| Dial-Up Internet | 72 | 0.9% |
| Broadband Home | 4,879 | 60.8% |
| Cellular Data Only | 1,045 | 13.0% |
| Satellite Internet | 567 | 7.1% |
| No Internet | 1,422 | 17.7% |
| Total | 8,025 | 100.0% |
Green Lake County Summary
Green Lake County is located in the east-central part of Wisconsin, and is part of the Fox Valley region. It is bordered by Fond du Lac County to the north, Winnebago County to the east, Waushara County to the south, and Marquette and Adams Counties to the west. The county seat is located in the city of Green Lake.
History
Green Lake County was established in 1836, and was originally part of the Wisconsin Territory. The county was named after the lake of the same name, which was named by French explorers in the late 1600s. The first settlers arrived in the area in the early 1800s, and the county was officially organized in 1846.
The county was home to a variety of industries in the 19th century, including lumber, tanning, and agriculture. The county also had a thriving tourism industry, as the area was known for its natural beauty and recreational opportunities.
Geography
Green Lake County covers an area of 845 square miles, and is located in the Fox Valley region of Wisconsin. The county is mostly rural, with rolling hills and forests. The highest point in the county is located in the town of Kingston, at an elevation of 1,092 feet.
The county is home to several lakes, including Green Lake, which is the largest lake in the county. Other notable lakes include Big Green Lake, Silver Lake, and Lake Puckaway.
Economy
Green Lake County has a diverse economy, with a mix of agriculture, manufacturing, and tourism. The county is home to several large employers, including the Green Lake Cheese Factory, the Green Lake County Fairgrounds, and the Green Lake Conference Center.
Agriculture is a major part of the county’s economy, with dairy farming being the primary agricultural activity. Other crops grown in the county include corn, soybeans, hay, and wheat.
Manufacturing is also an important part of the county’s economy, with several companies located in the area. These companies produce a variety of products, including furniture, paper products, and automotive parts.
Tourism is also an important part of the county’s economy, with visitors coming to the area to enjoy the natural beauty and recreational opportunities. The county is home to several state parks, including Green Lake State Park, which is the largest state park in the county.
Demographics
As of the 2010 census, Green Lake County had a population of 19,051. The population is mostly white (96.2%), with small percentages of African American (1.2%), Hispanic (1.1%), and Asian (0.7%) residents.
The median household income in the county is $50,945, and the median home value is $150,400. The unemployment rate in the county is 4.2%, which is lower than the national average.
Conclusion
Green Lake County is a rural county located in east-central Wisconsin. The county has a diverse economy, with a mix of agriculture, manufacturing, and tourism. The county is home to several large employers, and is a popular destination for tourists. The population of the county is mostly white, with small percentages of African American, Hispanic, and Asian residents. The median household income in the county is $50,945, and the median home value is $150,400.
Common Questions
What is the Total Population of Green Lake County?
Total Population of Green Lake County is 19,093.
What is the Total Male Population of Green Lake County?
Total Male Population of Green Lake County is 9,640.
What is the Total Female Population of Green Lake County?
Total Female Population of Green Lake County is 9,453.
What is the Ratio of Males per 100 Females in Green Lake County?
There are 101.98 Males per 100 Females in Green Lake County.
What is the Ratio of Females per 100 Males in Green Lake County?
There are 98.06 Females per 100 Males in Green Lake County.
What is the Median Population Age in Green Lake County?
Median Population Age in Green Lake County is 45.3 Years.
What is the Average Family Size in Green Lake County
Average Family Size in Green Lake County is 2.8 People.
What is the Average Household Size in Green Lake County
Average Household Size in Green Lake County is 2.3 People.
What is Per Capita Income in Green Lake County?
Per Capita income in Green Lake County is $35,222.
What is the Median Family Income in Green Lake County?
Median Family Income in Green Lake County is $81,534.
What is the Median Household income in Green Lake County?
Median Household Income in Green Lake County is $66,395.
What is Income or Wage Gap in Green Lake County?
Income or Wage Gap in Green Lake County is 34.6%.
Women in Green Lake County earn 65.4 cents for every dollar earned by a man.
What is Family Income Deficit in Green Lake County?
Family Income Deficit in Green Lake County is $13,112.
Families that are below poverty line in Green Lake County earn $13,112 less on average than the poverty threshold level.
What is Inequality or Gini Index in Green Lake County?
Inequality or Gini Index in Green Lake County is 0.41.
How Large is the Labor Force in Green Lake County?
There are 9,287 People in the Labor Forcein in Green Lake County.
What is the Percentage of People in the Labor Force in Green Lake County?
59.9% of People are in the Labor Force in Green Lake County.
What is the Unemployment Rate in Green Lake County?
Unemployment Rate in Green Lake County is 3.3%.