Green County, WI
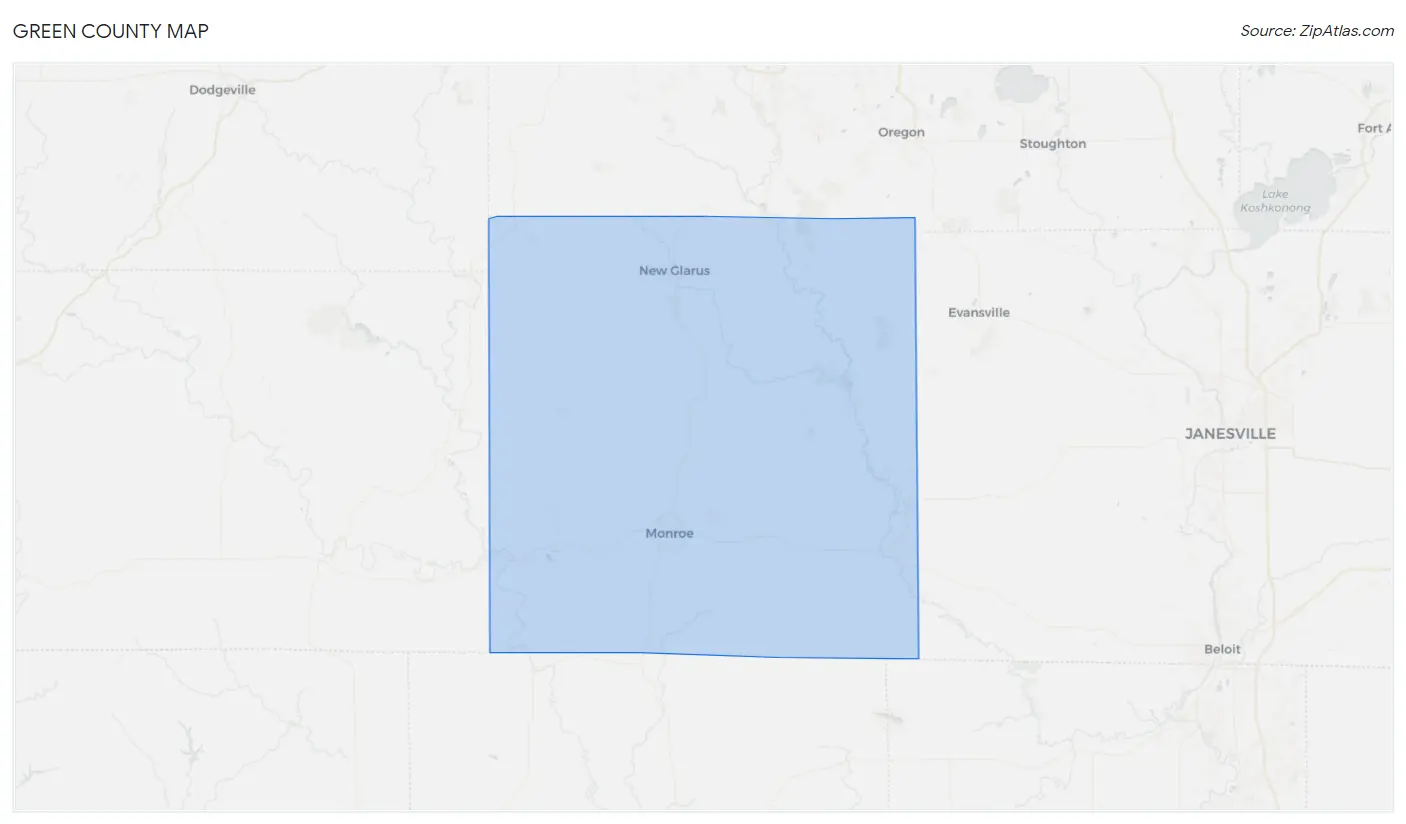
Green County Map
Green County Overview
37,066
TOTAL POPULATION
18,682
MALE POPULATION
18,384
FEMALE POPULATION
101.62
MALES / 100 FEMALES
98.40
FEMALES / 100 MALES
43.0
MEDIAN AGE
2.9
AVG FAMILY SIZE
2.4
AVG HOUSEHOLD SIZE
$40,954
PER CAPITA INCOME
$92,300
AVG FAMILY INCOME
$76,080
AVG HOUSEHOLD INCOME
31.8%
WAGE / INCOME GAP [ % ]
68.2¢/ $1
WAGE / INCOME GAP [ $ ]
$10,021
FAMILY INCOME DEFICIT
0.41
INEQUALITY / GINI INDEX
20,441
LABOR FORCE [ PEOPLE ]
68.0%
PERCENT IN LABOR FORCE
3.4%
UNEMPLOYMENT RATE
Green County Area Codes
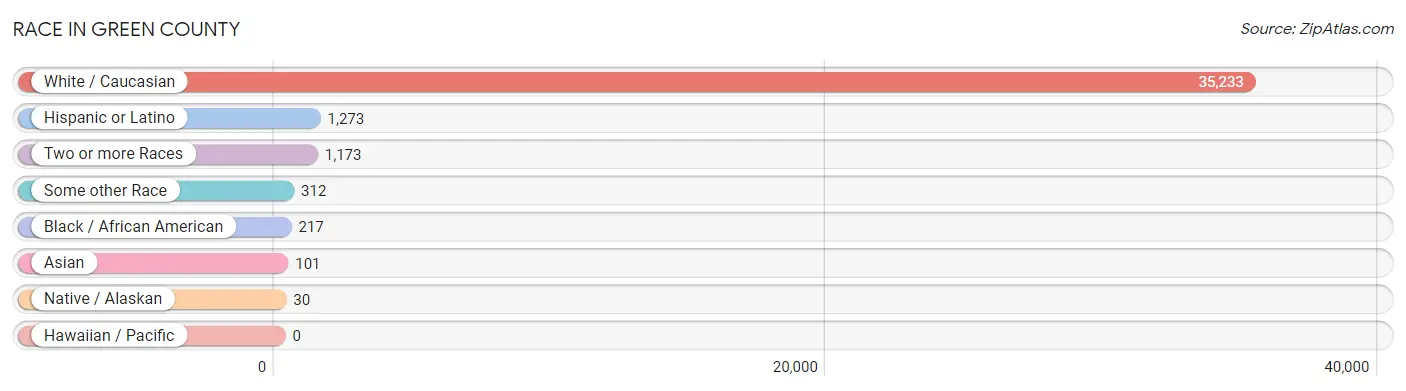
Race in Green County
The most populous races in Green County are White / Caucasian (35,233 | 95.1%), Hispanic or Latino (1,273 | 3.4%), and Two or more Races (1,173 | 3.2%).
| Race | # Population | % Population |
| Asian | 101 | 0.3% |
| Black / African American | 217 | 0.6% |
| Hawaiian / Pacific | 0 | 0.0% |
| Hispanic or Latino | 1,273 | 3.4% |
| Native / Alaskan | 30 | 0.1% |
| White / Caucasian | 35,233 | 95.1% |
| Two or more Races | 1,173 | 3.2% |
| Some other Race | 312 | 0.8% |
| Total | 37,066 | 100.0% |
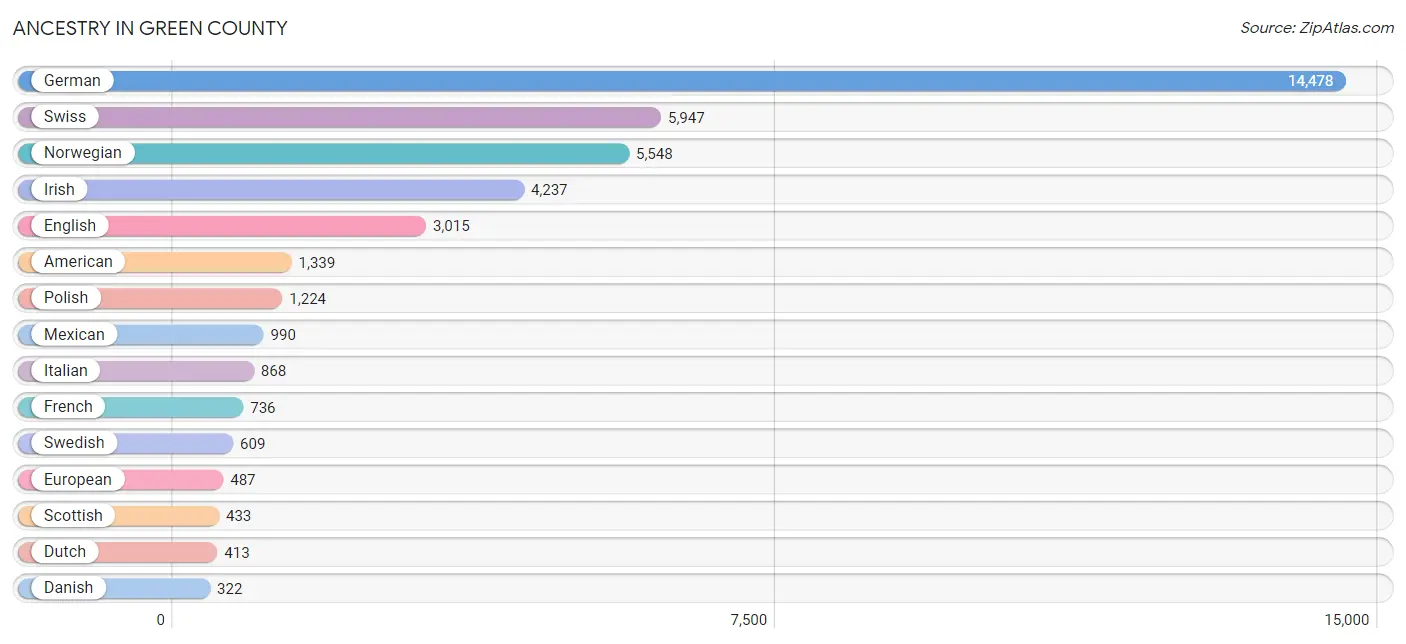
Ancestry in Green County
The most populous ancestries reported in Green County are German (14,478 | 39.1%), Swiss (5,947 | 16.0%), Norwegian (5,548 | 15.0%), Irish (4,237 | 11.4%), and English (3,015 | 8.1%), together accounting for 89.6% of all Green County residents.
| Ancestry | # Population | % Population |
| African | 17 | 0.1% |
| Albanian | 8 | 0.0% |
| American | 1,339 | 3.6% |
| Argentinean | 18 | 0.1% |
| Armenian | 3 | 0.0% |
| Australian | 24 | 0.1% |
| Austrian | 31 | 0.1% |
| Bangladeshi | 40 | 0.1% |
| Belgian | 78 | 0.2% |
| Bhutanese | 50 | 0.1% |
| Brazilian | 8 | 0.0% |
| British | 82 | 0.2% |
| Burmese | 29 | 0.1% |
| Canadian | 14 | 0.0% |
| Celtic | 8 | 0.0% |
| Central American | 7 | 0.0% |
| Central American Indian | 4 | 0.0% |
| Cherokee | 51 | 0.1% |
| Chippewa | 21 | 0.1% |
| Choctaw | 2 | 0.0% |
| Colombian | 16 | 0.0% |
| Creek | 4 | 0.0% |
| Croatian | 23 | 0.1% |
| Czech | 270 | 0.7% |
| Czechoslovakian | 14 | 0.0% |
| Danish | 322 | 0.9% |
| Dominican | 8 | 0.0% |
| Dutch | 413 | 1.1% |
| Eastern European | 11 | 0.0% |
| Ecuadorian | 21 | 0.1% |
| English | 3,015 | 8.1% |
| Estonian | 4 | 0.0% |
| Ethiopian | 4 | 0.0% |
| European | 487 | 1.3% |
| Finnish | 55 | 0.2% |
| French | 736 | 2.0% |
| French Canadian | 159 | 0.4% |
| German | 14,478 | 39.1% |
| Greek | 97 | 0.3% |
| Haitian | 14 | 0.0% |
| Hungarian | 94 | 0.3% |
| Indian (Asian) | 11 | 0.0% |
| Iranian | 7 | 0.0% |
| Irish | 4,237 | 11.4% |
| Iroquois | 7 | 0.0% |
| Italian | 868 | 2.3% |
| Jamaican | 12 | 0.0% |
| Korean | 43 | 0.1% |
| Latvian | 4 | 0.0% |
| Lithuanian | 56 | 0.2% |
| Luxembourger | 62 | 0.2% |
| Malaysian | 38 | 0.1% |
| Menominee | 34 | 0.1% |
| Mexican | 990 | 2.7% |
| Mexican American Indian | 5 | 0.0% |
| Native Hawaiian | 12 | 0.0% |
| Nigerian | 4 | 0.0% |
| Northern European | 11 | 0.0% |
| Norwegian | 5,548 | 15.0% |
| Pakistani | 23 | 0.1% |
| Pennsylvania German | 127 | 0.3% |
| Peruvian | 21 | 0.1% |
| Polish | 1,224 | 3.3% |
| Portuguese | 20 | 0.1% |
| Puerto Rican | 43 | 0.1% |
| Romanian | 80 | 0.2% |
| Russian | 116 | 0.3% |
| Salvadoran | 7 | 0.0% |
| Scandinavian | 70 | 0.2% |
| Scotch-Irish | 169 | 0.5% |
| Scottish | 433 | 1.2% |
| Serbian | 15 | 0.0% |
| Sioux | 3 | 0.0% |
| Slavic | 29 | 0.1% |
| Slovak | 38 | 0.1% |
| South American | 76 | 0.2% |
| South American Indian | 6 | 0.0% |
| Spaniard | 40 | 0.1% |
| Spanish | 41 | 0.1% |
| Sri Lankan | 75 | 0.2% |
| Subsaharan African | 25 | 0.1% |
| Swedish | 609 | 1.6% |
| Swiss | 5,947 | 16.0% |
| Thai | 27 | 0.1% |
| Ukrainian | 30 | 0.1% |
| Welsh | 238 | 0.6% | View All 86 Rows |
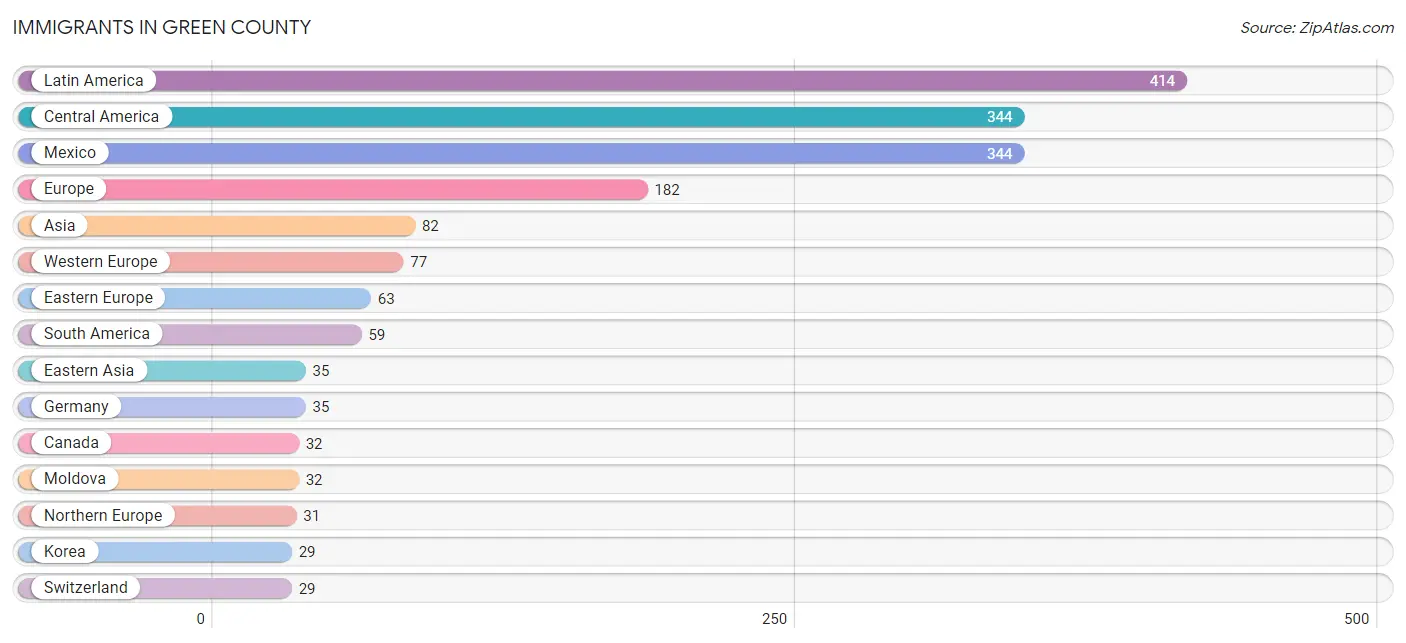
Immigrants in Green County
The most numerous immigrant groups reported in Green County came from Latin America (414 | 1.1%), Central America (344 | 0.9%), Mexico (344 | 0.9%), Europe (182 | 0.5%), and Asia (82 | 0.2%), together accounting for 3.7% of all Green County residents.
| Immigration Origin | # Population | % Population |
| Africa | 6 | 0.0% |
| Albania | 3 | 0.0% |
| Argentina | 18 | 0.1% |
| Asia | 82 | 0.2% |
| Australia | 3 | 0.0% |
| Belgium | 7 | 0.0% |
| Brazil | 6 | 0.0% |
| Canada | 32 | 0.1% |
| Caribbean | 11 | 0.0% |
| Central America | 344 | 0.9% |
| China | 6 | 0.0% |
| Colombia | 5 | 0.0% |
| Denmark | 7 | 0.0% |
| Eastern Africa | 4 | 0.0% |
| Eastern Asia | 35 | 0.1% |
| Eastern Europe | 63 | 0.2% |
| England | 7 | 0.0% |
| Ethiopia | 4 | 0.0% |
| Europe | 182 | 0.5% |
| France | 4 | 0.0% |
| Germany | 35 | 0.1% |
| Haiti | 7 | 0.0% |
| India | 11 | 0.0% |
| Iran | 7 | 0.0% |
| Israel | 4 | 0.0% |
| Jamaica | 4 | 0.0% |
| Korea | 29 | 0.1% |
| Laos | 12 | 0.0% |
| Latin America | 414 | 1.1% |
| Mexico | 344 | 0.9% |
| Moldova | 32 | 0.1% |
| Netherlands | 2 | 0.0% |
| Northern Europe | 31 | 0.1% |
| Norway | 1 | 0.0% |
| Oceania | 3 | 0.0% |
| Peru | 27 | 0.1% |
| Poland | 2 | 0.0% |
| Romania | 10 | 0.0% |
| Russia | 2 | 0.0% |
| Scotland | 1 | 0.0% |
| South America | 59 | 0.2% |
| South Central Asia | 18 | 0.1% |
| South Eastern Asia | 25 | 0.1% |
| Southern Europe | 11 | 0.0% |
| Spain | 11 | 0.0% |
| Switzerland | 29 | 0.1% |
| Thailand | 10 | 0.0% |
| Ukraine | 14 | 0.0% |
| Vietnam | 3 | 0.0% |
| Western Asia | 4 | 0.0% |
| Western Europe | 77 | 0.2% | View All 51 Rows |
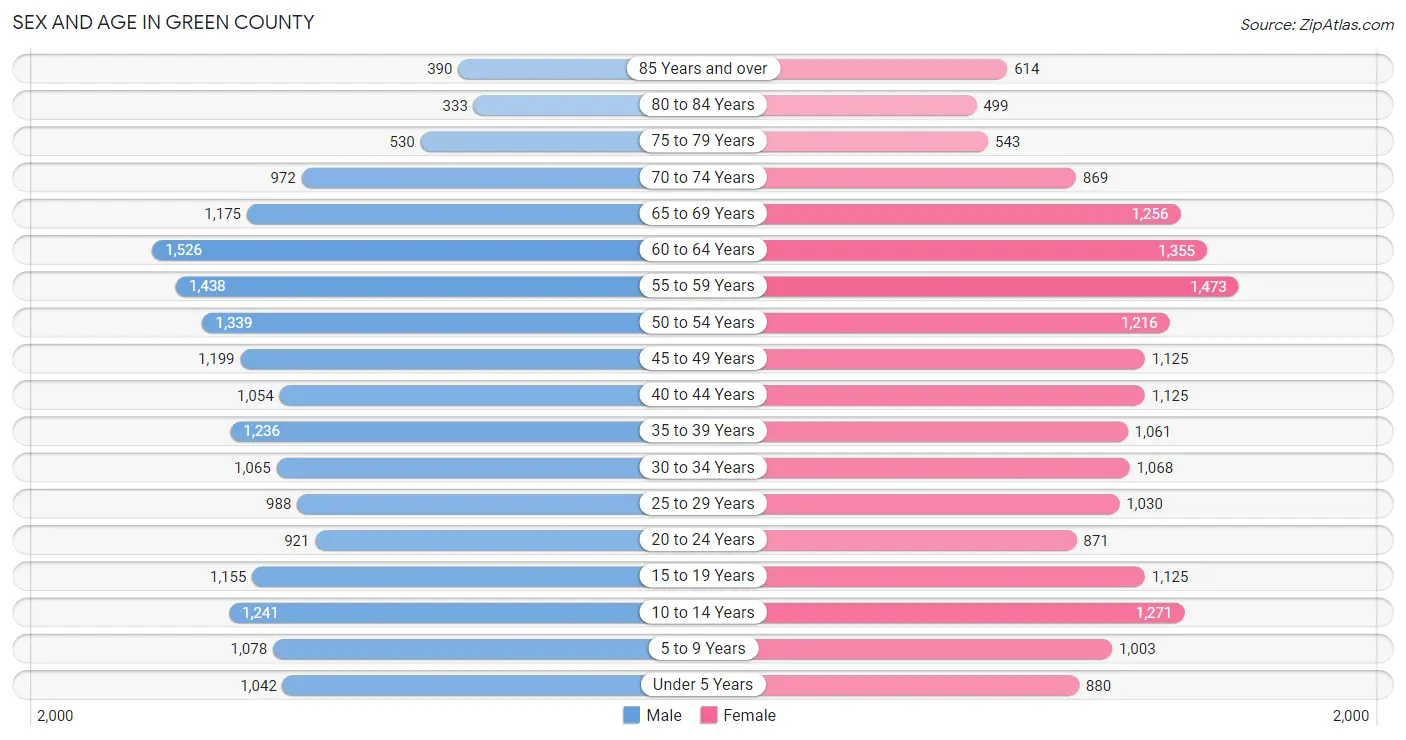
Sex and Age in Green County
Sex and Age in Green County
The most populous age groups in Green County are 60 to 64 Years (1,526 | 8.2%) for men and 55 to 59 Years (1,473 | 8.0%) for women.
| Age Bracket | Male | Female |
| Under 5 Years | 1,042 (5.6%) | 880 (4.8%) |
| 5 to 9 Years | 1,078 (5.8%) | 1,003 (5.5%) |
| 10 to 14 Years | 1,241 (6.6%) | 1,271 (6.9%) |
| 15 to 19 Years | 1,155 (6.2%) | 1,125 (6.1%) |
| 20 to 24 Years | 921 (4.9%) | 871 (4.7%) |
| 25 to 29 Years | 988 (5.3%) | 1,030 (5.6%) |
| 30 to 34 Years | 1,065 (5.7%) | 1,068 (5.8%) |
| 35 to 39 Years | 1,236 (6.6%) | 1,061 (5.8%) |
| 40 to 44 Years | 1,054 (5.6%) | 1,125 (6.1%) |
| 45 to 49 Years | 1,199 (6.4%) | 1,125 (6.1%) |
| 50 to 54 Years | 1,339 (7.2%) | 1,216 (6.6%) |
| 55 to 59 Years | 1,438 (7.7%) | 1,473 (8.0%) |
| 60 to 64 Years | 1,526 (8.2%) | 1,355 (7.4%) |
| 65 to 69 Years | 1,175 (6.3%) | 1,256 (6.8%) |
| 70 to 74 Years | 972 (5.2%) | 869 (4.7%) |
| 75 to 79 Years | 530 (2.8%) | 543 (2.9%) |
| 80 to 84 Years | 333 (1.8%) | 499 (2.7%) |
| 85 Years and over | 390 (2.1%) | 614 (3.3%) |
| Total | 18,682 (100.0%) | 18,384 (100.0%) |
Families and Households in Green County
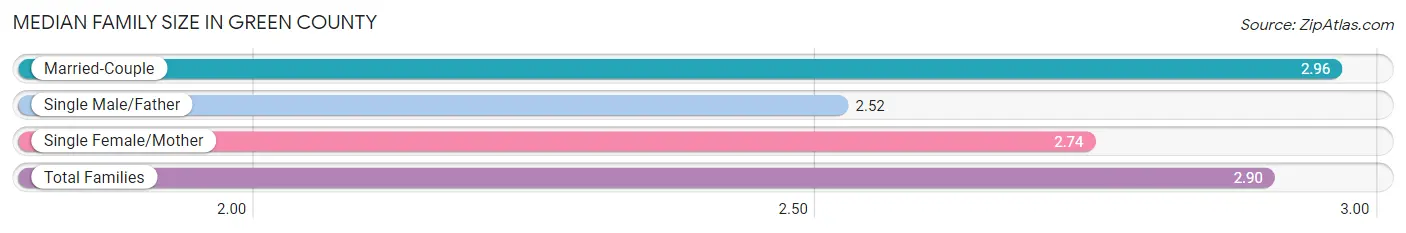
Median Family Size in Green County
The median family size in Green County is 2.90 persons per family, with married-couple families (8,005 | 81.0%) accounting for the largest median family size of 2.96 persons per family. On the other hand, single male/father families (885 | 8.9%) represent the smallest median family size with 2.52 persons per family.
| Family Type | # Families | Family Size |
| Married-Couple | 8,005 (81.0%) | 2.96 |
| Single Male/Father | 885 (8.9%) | 2.52 |
| Single Female/Mother | 997 (10.1%) | 2.74 |
| Total Families | 9,887 (100.0%) | 2.90 |
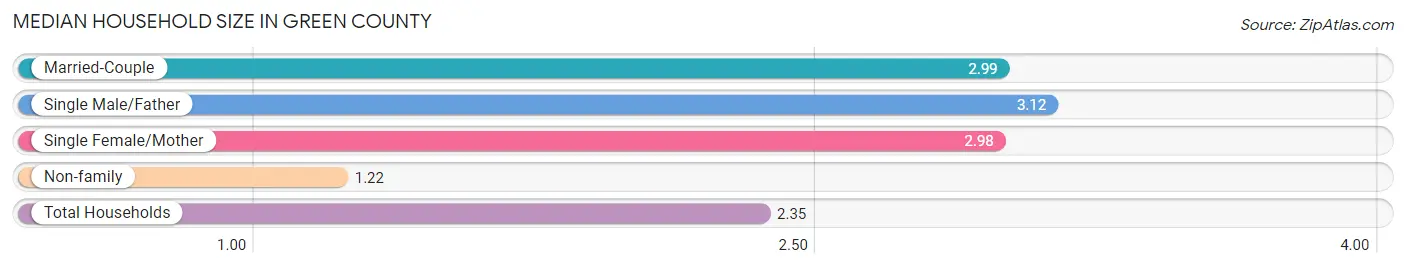
Median Household Size in Green County
The median household size in Green County is 2.35 persons per household, with single male/father households (885 | 5.7%) accounting for the largest median household size of 3.12 persons per household. non-family households (5,707 | 36.6%) represent the smallest median household size with 1.22 persons per household.
| Household Type | # Households | Household Size |
| Married-Couple | 8,005 (51.3%) | 2.99 |
| Single Male/Father | 885 (5.7%) | 3.12 |
| Single Female/Mother | 997 (6.4%) | 2.98 |
| Non-family | 5,707 (36.6%) | 1.22 |
| Total Households | 15,594 (100.0%) | 2.35 |
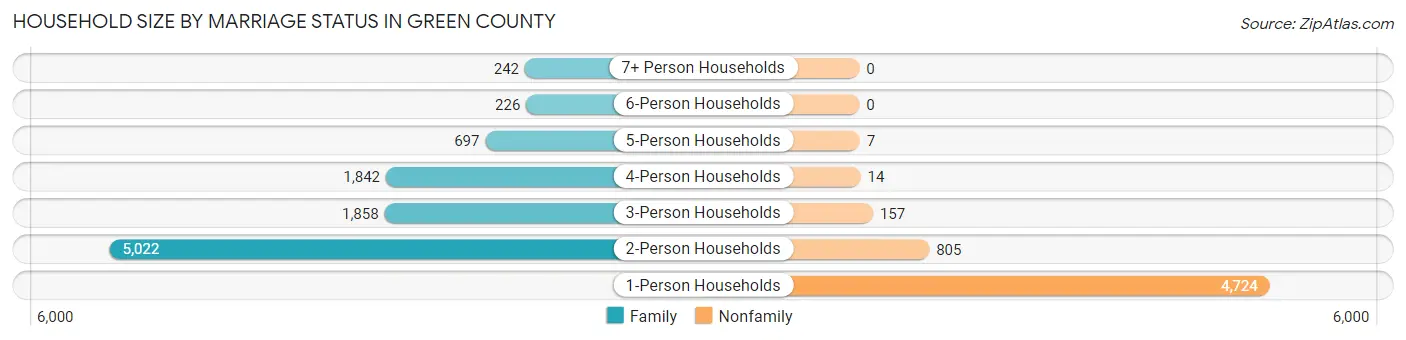
Household Size by Marriage Status in Green County
Out of a total of 15,594 households in Green County, 9,887 (63.4%) are family households, while 5,707 (36.6%) are nonfamily households. The most numerous type of family households are 2-person households, comprising 5,022, and the most common type of nonfamily households are 1-person households, comprising 4,724.
| Household Size | Family Households | Nonfamily Households |
| 1-Person Households | - | 4,724 (30.3%) |
| 2-Person Households | 5,022 (32.2%) | 805 (5.2%) |
| 3-Person Households | 1,858 (11.9%) | 157 (1.0%) |
| 4-Person Households | 1,842 (11.8%) | 14 (0.1%) |
| 5-Person Households | 697 (4.5%) | 7 (0.0%) |
| 6-Person Households | 226 (1.5%) | 0 (0.0%) |
| 7+ Person Households | 242 (1.5%) | 0 (0.0%) |
| Total | 9,887 (63.4%) | 5,707 (36.6%) |
Female Fertility in Green County
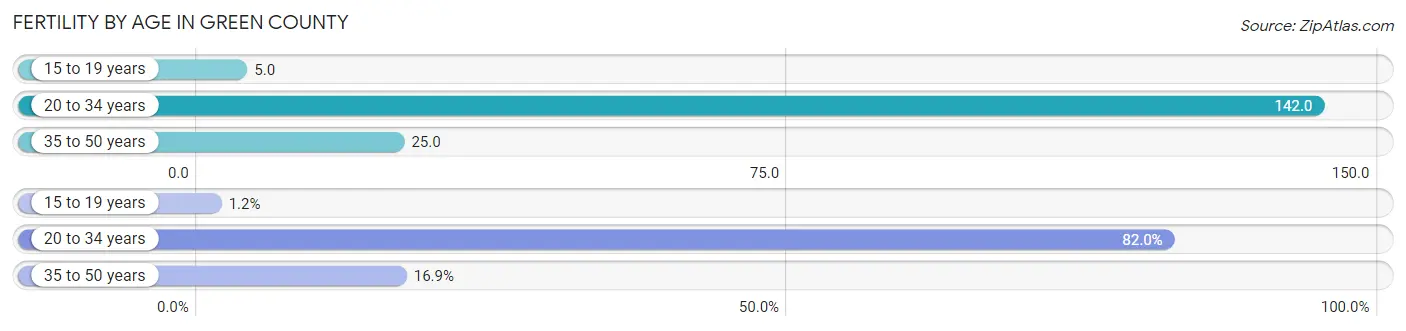
Fertility by Age in Green County
Average fertility rate in Green County is 68.0 births per 1,000 women. Women in the age bracket of 20 to 34 years have the highest fertility rate with 142.0 births per 1,000 women. Women in the age bracket of 20 to 34 years acount for 82.0% of all women with births.
| Age Bracket | Women with Births | Births / 1,000 Women |
| 15 to 19 years | 6 (1.2%) | 5.0 |
| 20 to 34 years | 423 (82.0%) | 142.0 |
| 35 to 50 years | 87 (16.9%) | 25.0 |
| Total | 516 (100.0%) | 68.0 |
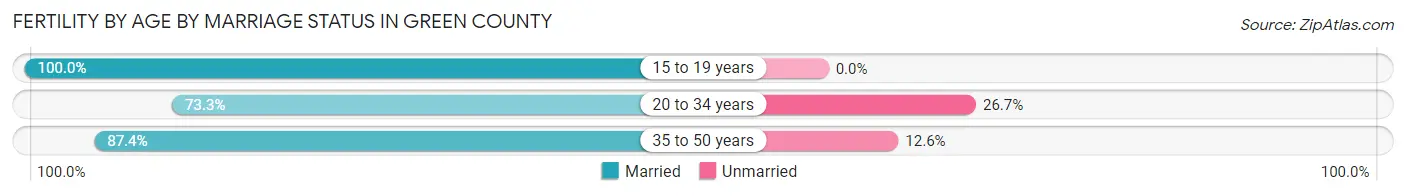
Fertility by Age by Marriage Status in Green County
76.0% of women with births (516) in Green County are married. The highest percentage of unmarried women with births falls into 20 to 34 years age bracket with 26.7% of them unmarried at the time of birth, while the lowest percentage of unmarried women with births belong to 15 to 19 years age bracket with 0.0% of them unmarried.
| Age Bracket | Married | Unmarried |
| 15 to 19 years | 6 (100.0%) | 0 (0.0%) |
| 20 to 34 years | 310 (73.3%) | 113 (26.7%) |
| 35 to 50 years | 76 (87.4%) | 11 (12.6%) |
| Total | 392 (76.0%) | 124 (24.0%) |
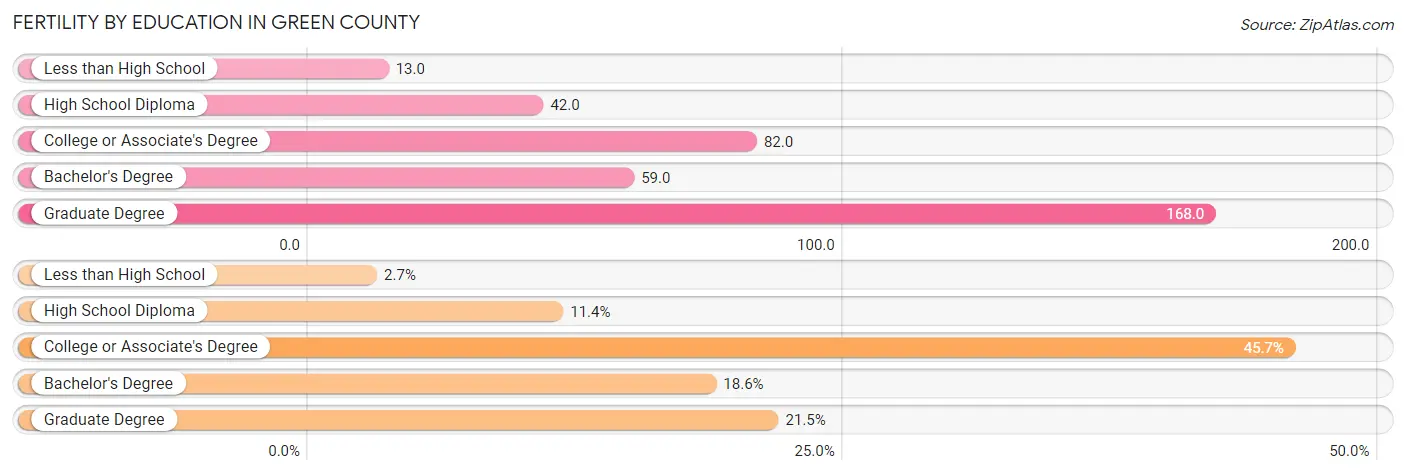
Fertility by Education in Green County
Average fertility rate in Green County is 68.0 births per 1,000 women. Women with the education attainment of graduate degree have the highest fertility rate of 168.0 births per 1,000 women, while women with the education attainment of less than high school have the lowest fertility at 13.0 births per 1,000 women. Women with the education attainment of college or associate's degree represent 45.7% of all women with births.
| Educational Attainment | Women with Births | Births / 1,000 Women |
| Less than High School | 14 (2.7%) | 13.0 |
| High School Diploma | 59 (11.4%) | 42.0 |
| College or Associate's Degree | 236 (45.7%) | 82.0 |
| Bachelor's Degree | 96 (18.6%) | 59.0 |
| Graduate Degree | 111 (21.5%) | 168.0 |
| Total | 516 (100.0%) | 68.0 |
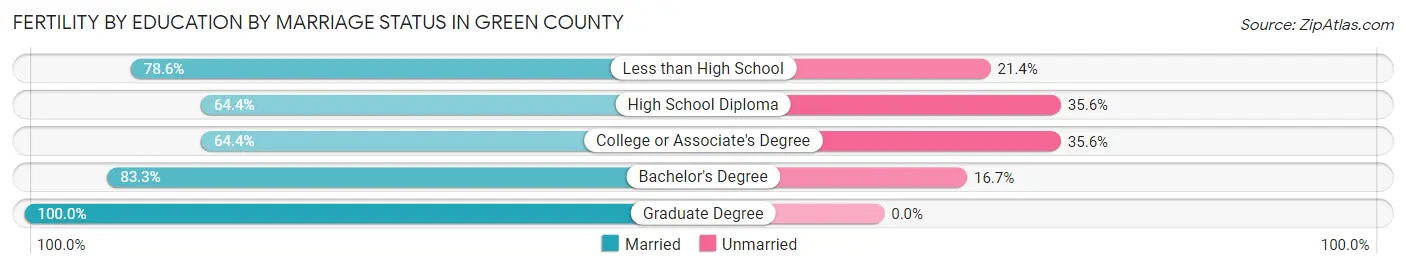
Fertility by Education by Marriage Status in Green County
24.0% of women with births in Green County are unmarried. Women with the educational attainment of graduate degree are most likely to be married with 100.0% of them married at childbirth, while women with the educational attainment of high school diploma are least likely to be married with 35.6% of them unmarried at childbirth.
| Educational Attainment | Married | Unmarried |
| Less than High School | 11 (78.6%) | 3 (21.4%) |
| High School Diploma | 38 (64.4%) | 21 (35.6%) |
| College or Associate's Degree | 152 (64.4%) | 84 (35.6%) |
| Bachelor's Degree | 80 (83.3%) | 16 (16.7%) |
| Graduate Degree | 111 (100.0%) | 0 (0.0%) |
| Total | 392 (76.0%) | 124 (24.0%) |
Income in Green County
Income Overview in Green County
Per Capita Income in Green County is $40,954, while median incomes of families and households are $92,300 and $76,080 respectively.
| Characteristic | Number | Measure |
| Per Capita Income | 37,066 | $40,954 |
| Median Family Income | 9,887 | $92,300 |
| Mean Family Income | 9,887 | $112,946 |
| Median Household Income | 15,594 | $76,080 |
| Mean Household Income | 15,594 | $93,729 |
| Income Deficit | 9,887 | $10,021 |
| Wage / Income Gap (%) | 37,066 | 31.79% |
| Wage / Income Gap ($) | 37,066 | 68.21¢ per $1 |
| Gini / Inequality Index | 37,066 | 0.41 |
Earnings by Sex in Green County
Average Earnings in Green County are $43,378, $51,167 for men and $34,899 for women, a difference of 31.8%.
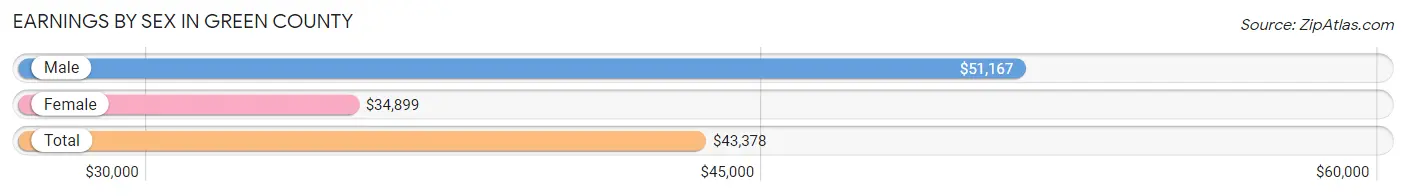
| Sex | Number | Average Earnings |
| Male | 11,344 (52.3%) | $51,167 |
| Female | 10,332 (47.7%) | $34,899 |
| Total | 21,676 (100.0%) | $43,378 |
Earnings by Sex by Income Bracket in Green County
The most common earnings brackets in Green County are $100,000+ for men (1,657 | 14.6%) and $55,000 to $64,999 for women (837 | 8.1%).
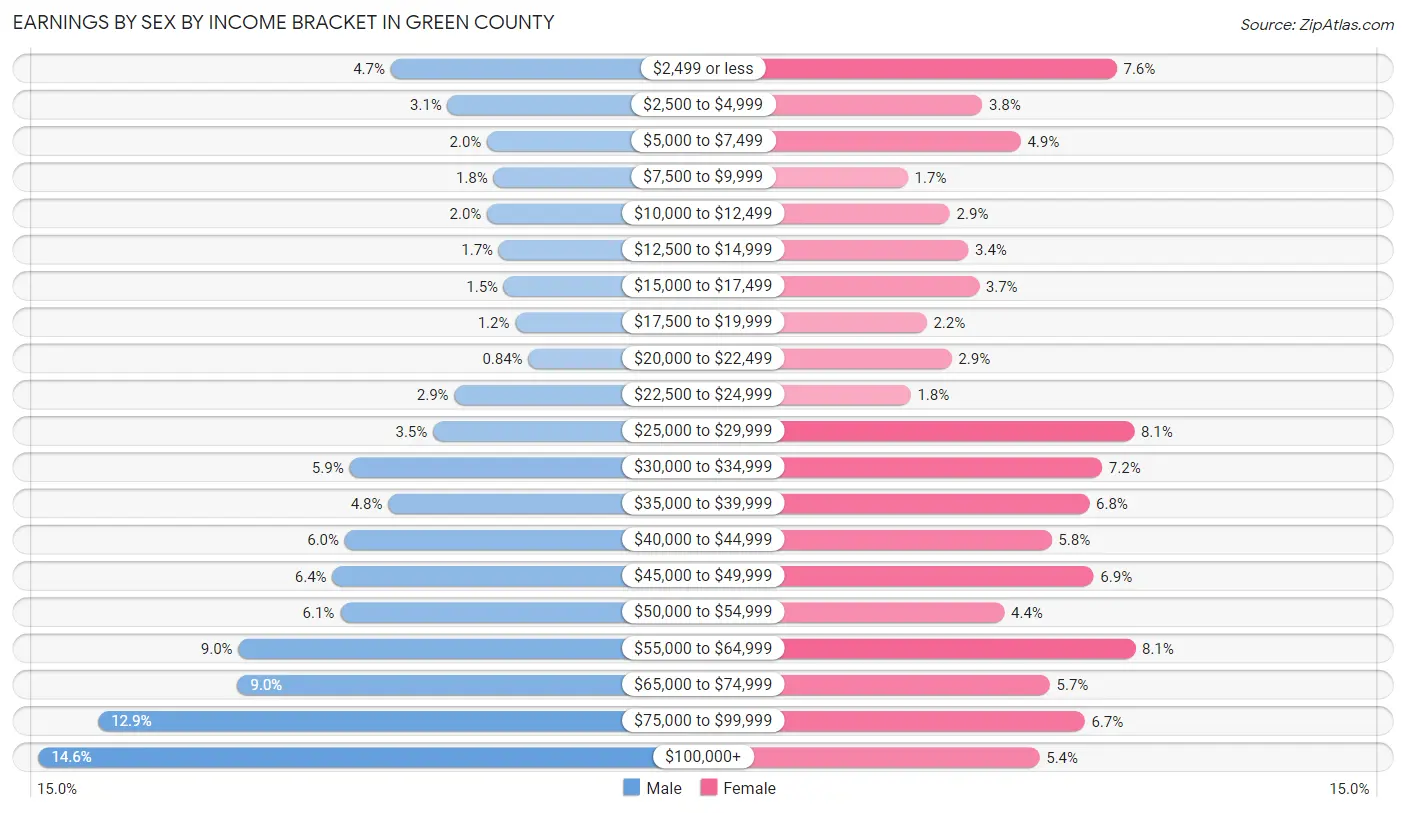
| Income | Male | Female |
| $2,499 or less | 534 (4.7%) | 783 (7.6%) |
| $2,500 to $4,999 | 353 (3.1%) | 393 (3.8%) |
| $5,000 to $7,499 | 227 (2.0%) | 504 (4.9%) |
| $7,500 to $9,999 | 207 (1.8%) | 177 (1.7%) |
| $10,000 to $12,499 | 227 (2.0%) | 299 (2.9%) |
| $12,500 to $14,999 | 190 (1.7%) | 352 (3.4%) |
| $15,000 to $17,499 | 173 (1.5%) | 383 (3.7%) |
| $17,500 to $19,999 | 137 (1.2%) | 231 (2.2%) |
| $20,000 to $22,499 | 95 (0.8%) | 304 (2.9%) |
| $22,500 to $24,999 | 331 (2.9%) | 185 (1.8%) |
| $25,000 to $29,999 | 399 (3.5%) | 834 (8.1%) |
| $30,000 to $34,999 | 666 (5.9%) | 741 (7.2%) |
| $35,000 to $39,999 | 542 (4.8%) | 704 (6.8%) |
| $40,000 to $44,999 | 681 (6.0%) | 594 (5.8%) |
| $45,000 to $49,999 | 720 (6.4%) | 716 (6.9%) |
| $50,000 to $54,999 | 695 (6.1%) | 457 (4.4%) |
| $55,000 to $64,999 | 1,020 (9.0%) | 837 (8.1%) |
| $65,000 to $74,999 | 1,023 (9.0%) | 589 (5.7%) |
| $75,000 to $99,999 | 1,467 (12.9%) | 690 (6.7%) |
| $100,000+ | 1,657 (14.6%) | 559 (5.4%) |
| Total | 11,344 (100.0%) | 10,332 (100.0%) |
Earnings by Sex by Educational Attainment in Green County
Average earnings in Green County are $55,707 for men and $39,109 for women, a difference of 29.8%. Men with an educational attainment of graduate degree enjoy the highest average annual earnings of $93,958, while those with less than high school education earn the least with $45,369. Women with an educational attainment of graduate degree earn the most with the average annual earnings of $65,081, while those with less than high school education have the smallest earnings of $21,629.
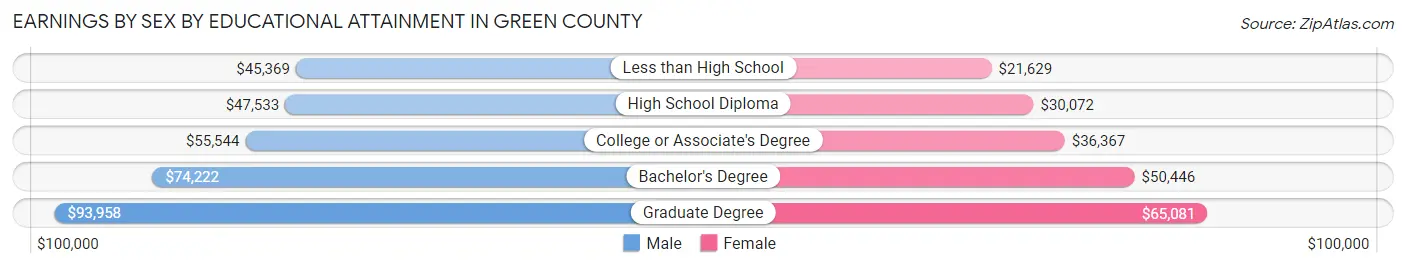
| Educational Attainment | Male Income | Female Income |
| Less than High School | $45,369 | $21,629 |
| High School Diploma | $47,533 | $30,072 |
| College or Associate's Degree | $55,544 | $36,367 |
| Bachelor's Degree | $74,222 | $50,446 |
| Graduate Degree | $93,958 | $65,081 |
| Total | $55,707 | $39,109 |
Family Income in Green County
Family Income Brackets in Green County
According to the Green County family income data, there are 2,393 families falling into the $100,000 to $149,999 income range, which is the most common income bracket and makes up 24.2% of all families. Conversely, the $10,000 to $14,999 income bracket is the least frequent group with only 99 families (1.0%) belonging to this category.
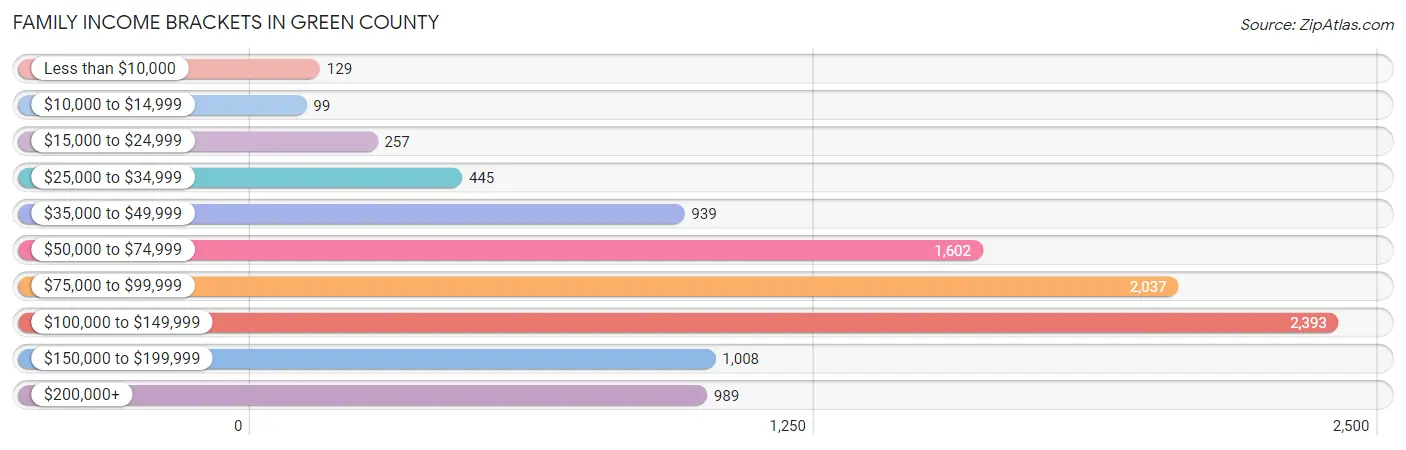
| Income Bracket | # Families | % Families |
| Less than $10,000 | 129 | 1.3% |
| $10,000 to $14,999 | 99 | 1.0% |
| $15,000 to $24,999 | 257 | 2.6% |
| $25,000 to $34,999 | 445 | 4.5% |
| $35,000 to $49,999 | 939 | 9.5% |
| $50,000 to $74,999 | 1,602 | 16.2% |
| $75,000 to $99,999 | 2,037 | 20.6% |
| $100,000 to $149,999 | 2,393 | 24.2% |
| $150,000 to $199,999 | 1,008 | 10.2% |
| $200,000+ | 989 | 10.0% |
Family Income by Famaliy Size in Green County
5-person families (608 | 6.1%) account for the highest median family income in Green County with $140,000 per family, while 2-person families (5,359 | 54.2%) have the highest median income of $40,482 per family member.
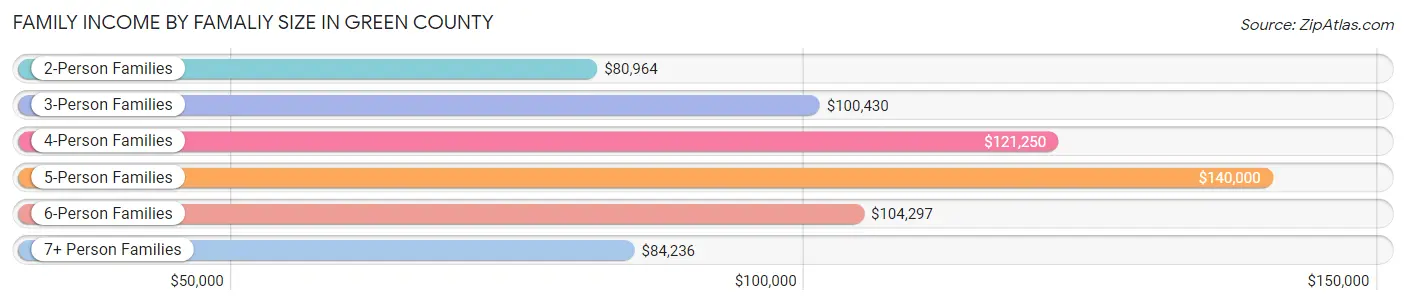
| Income Bracket | # Families | Median Income |
| 2-Person Families | 5,359 (54.2%) | $80,964 |
| 3-Person Families | 1,839 (18.6%) | $100,430 |
| 4-Person Families | 1,689 (17.1%) | $121,250 |
| 5-Person Families | 608 (6.1%) | $140,000 |
| 6-Person Families | 169 (1.7%) | $104,297 |
| 7+ Person Families | 223 (2.3%) | $84,236 |
| Total | 9,887 (100.0%) | $92,300 |
Family Income by Number of Earners in Green County
The median family income in Green County is $92,300, with families comprising 3+ earners (1,236) having the highest median family income of $139,327, while families with 1 earner (2,570) have the lowest median family income of $61,638, accounting for 12.5% and 26.0% of families, respectively.
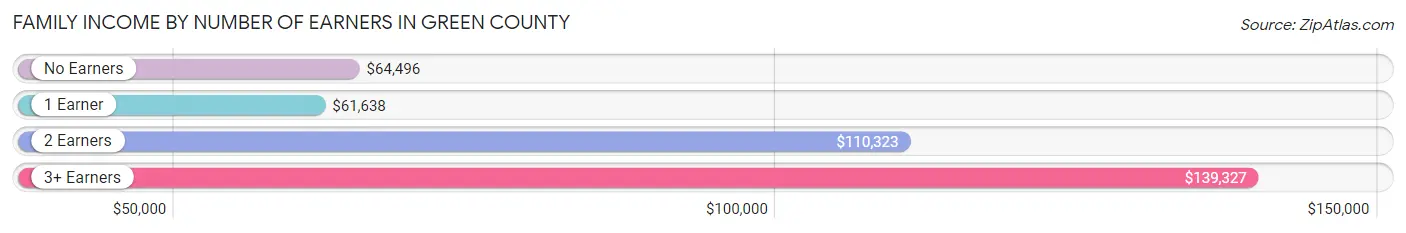
| Number of Earners | # Families | Median Income |
| No Earners | 1,437 (14.5%) | $64,496 |
| 1 Earner | 2,570 (26.0%) | $61,638 |
| 2 Earners | 4,644 (47.0%) | $110,323 |
| 3+ Earners | 1,236 (12.5%) | $139,327 |
| Total | 9,887 (100.0%) | $92,300 |
Household Income in Green County
Household Income Brackets in Green County
With 2,947 households falling in the category, the $100,000 to $149,999 income range is the most frequent in Green County, accounting for 18.9% of all households. In contrast, only 437 households (2.8%) fall into the $10,000 to $14,999 income bracket, making it the least populous group.
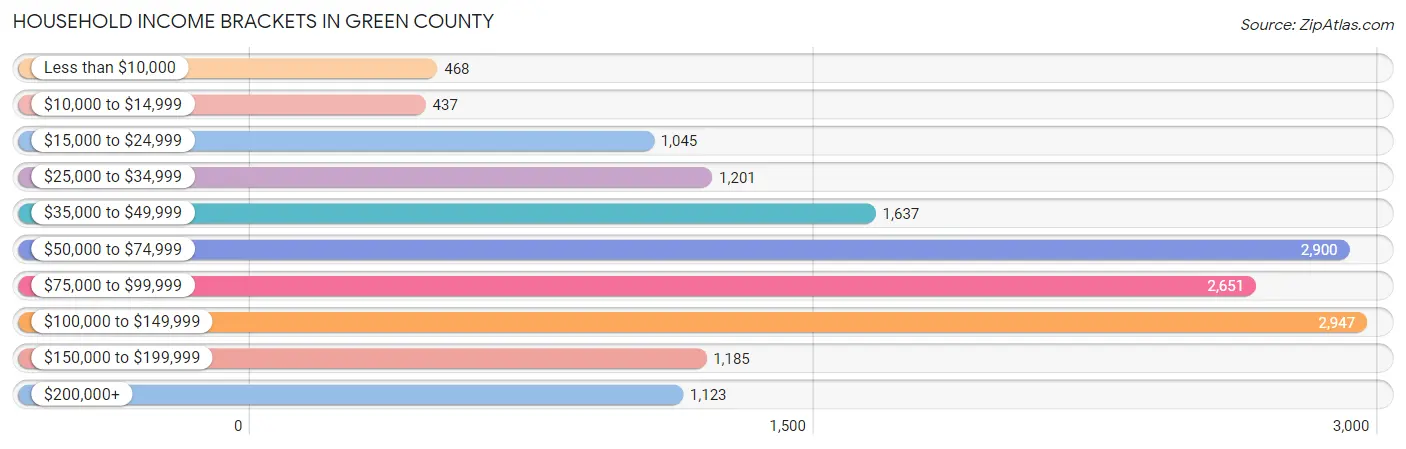
| Income Bracket | # Households | % Households |
| Less than $10,000 | 468 | 3.0% |
| $10,000 to $14,999 | 437 | 2.8% |
| $15,000 to $24,999 | 1,045 | 6.7% |
| $25,000 to $34,999 | 1,201 | 7.7% |
| $35,000 to $49,999 | 1,637 | 10.5% |
| $50,000 to $74,999 | 2,900 | 18.6% |
| $75,000 to $99,999 | 2,651 | 17.0% |
| $100,000 to $149,999 | 2,947 | 18.9% |
| $150,000 to $199,999 | 1,185 | 7.6% |
| $200,000+ | 1,123 | 7.2% |
Household Income by Householder Age in Green County
The median household income in Green County is $76,080, with the highest median household income of $86,940 found in the 45 to 64 years age bracket for the primary householder. A total of 6,161 households (39.5%) fall into this category. Meanwhile, the 65+ years age bracket for the primary householder has the lowest median household income of $52,336, with 4,669 households (29.9%) in this group.
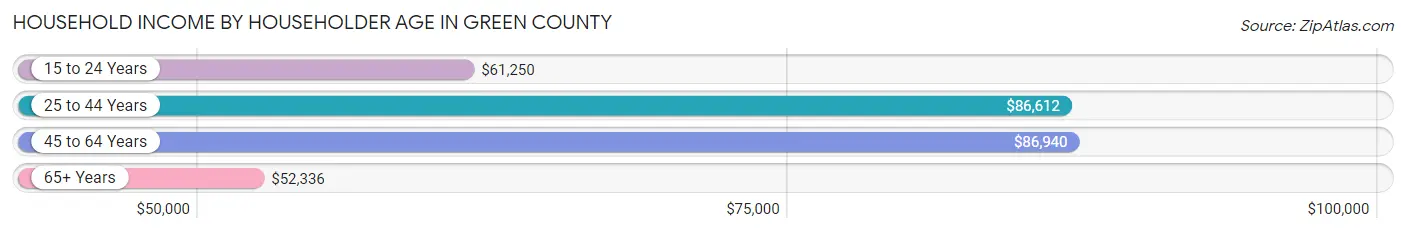
| Income Bracket | # Households | Median Income |
| 15 to 24 Years | 386 (2.5%) | $61,250 |
| 25 to 44 Years | 4,378 (28.1%) | $86,612 |
| 45 to 64 Years | 6,161 (39.5%) | $86,940 |
| 65+ Years | 4,669 (29.9%) | $52,336 |
| Total | 15,594 (100.0%) | $76,080 |
Poverty in Green County
Income Below Poverty by Sex and Age in Green County
With 5.4% poverty level for males and 7.9% for females among the residents of Green County, 5 year old males and 75 year old and over females are the most vulnerable to poverty, with 66 males (25.5%) and 183 females (12.7%) in their respective age groups living below the poverty level.
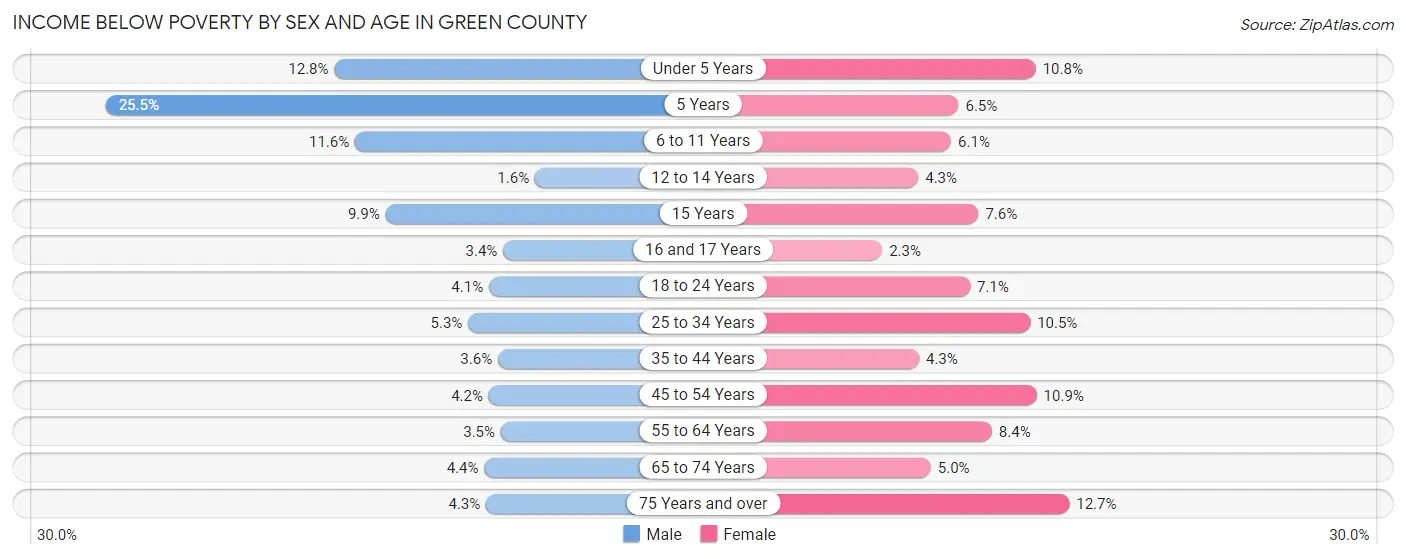
| Age Bracket | Male | Female |
| Under 5 Years | 122 (12.8%) | 93 (10.8%) |
| 5 Years | 66 (25.5%) | 16 (6.5%) |
| 6 to 11 Years | 149 (11.6%) | 75 (6.1%) |
| 12 to 14 Years | 10 (1.6%) | 32 (4.3%) |
| 15 Years | 29 (9.9%) | 15 (7.6%) |
| 16 and 17 Years | 16 (3.4%) | 13 (2.2%) |
| 18 to 24 Years | 54 (4.1%) | 87 (7.1%) |
| 25 to 34 Years | 108 (5.3%) | 220 (10.5%) |
| 35 to 44 Years | 83 (3.6%) | 94 (4.3%) |
| 45 to 54 Years | 105 (4.2%) | 254 (10.8%) |
| 55 to 64 Years | 103 (3.5%) | 235 (8.4%) |
| 65 to 74 Years | 94 (4.4%) | 105 (5.0%) |
| 75 Years and over | 53 (4.3%) | 183 (12.7%) |
| Total | 992 (5.4%) | 1,422 (7.9%) |
Income Above Poverty by Sex and Age in Green County
According to the poverty statistics in Green County, males aged 12 to 14 years and females aged 16 and 17 years are the age groups that are most secure financially, with 98.4% of males and 97.8% of females in these age groups living above the poverty line.
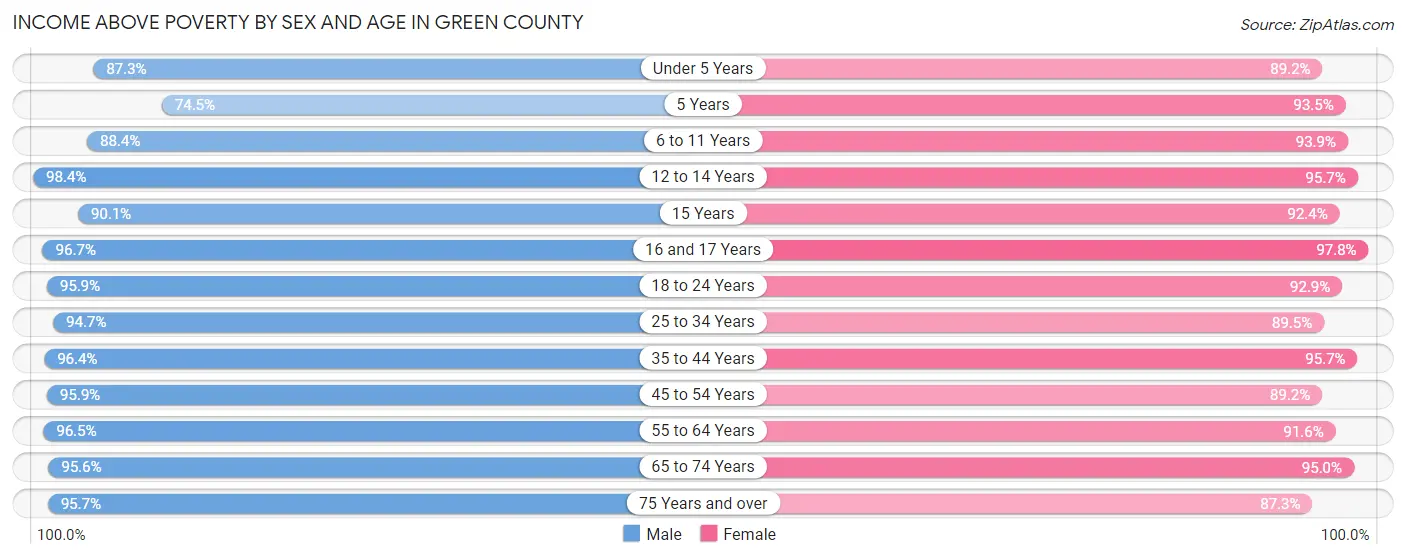
| Age Bracket | Male | Female |
| Under 5 Years | 835 (87.3%) | 768 (89.2%) |
| 5 Years | 193 (74.5%) | 230 (93.5%) |
| 6 to 11 Years | 1,135 (88.4%) | 1,156 (93.9%) |
| 12 to 14 Years | 623 (98.4%) | 720 (95.7%) |
| 15 Years | 264 (90.1%) | 182 (92.4%) |
| 16 and 17 Years | 462 (96.7%) | 565 (97.8%) |
| 18 to 24 Years | 1,251 (95.9%) | 1,131 (92.9%) |
| 25 to 34 Years | 1,928 (94.7%) | 1,878 (89.5%) |
| 35 to 44 Years | 2,197 (96.4%) | 2,092 (95.7%) |
| 45 to 54 Years | 2,428 (95.9%) | 2,087 (89.1%) |
| 55 to 64 Years | 2,856 (96.5%) | 2,575 (91.6%) |
| 65 to 74 Years | 2,043 (95.6%) | 2,012 (95.0%) |
| 75 Years and over | 1,180 (95.7%) | 1,261 (87.3%) |
| Total | 17,395 (94.6%) | 16,657 (92.1%) |
Income Below Poverty Among Married-Couple Families in Green County
The poverty statistics for married-couple families in Green County show that 1.6% or 130 of the total 8,005 families live below the poverty line. Families with 5 or more children have the highest poverty rate of 11.3%, comprising of 12 families. On the other hand, families with no children have the lowest poverty rate of 1.3%, which includes 67 families.
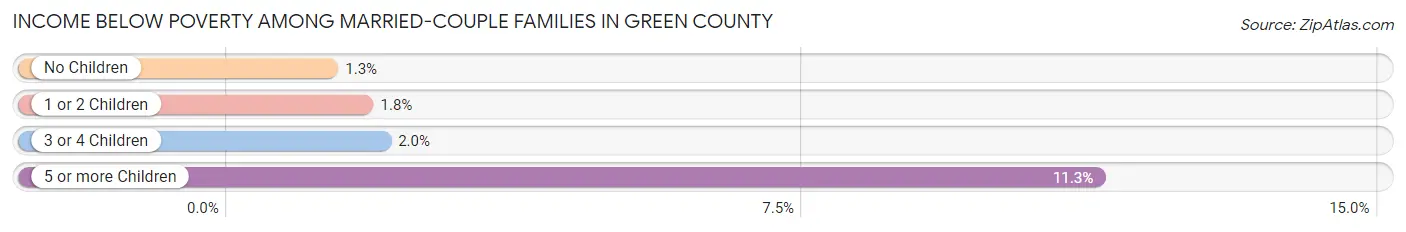
| Children | Above Poverty | Below Poverty |
| No Children | 5,030 (98.7%) | 67 (1.3%) |
| 1 or 2 Children | 2,113 (98.2%) | 38 (1.8%) |
| 3 or 4 Children | 638 (98.0%) | 13 (2.0%) |
| 5 or more Children | 94 (88.7%) | 12 (11.3%) |
| Total | 7,875 (98.4%) | 130 (1.6%) |
Income Below Poverty Among Single-Parent Households in Green County
According to the poverty data in Green County, 4.2% or 37 single-father households and 19.4% or 193 single-mother households are living below the poverty line. Among single-father households, those with 1 or 2 children have the highest poverty rate, with 37 households (7.9%) experiencing poverty. Likewise, among single-mother households, those with 5 or more children have the highest poverty rate, with 6 households (100.0%) falling below the poverty line.
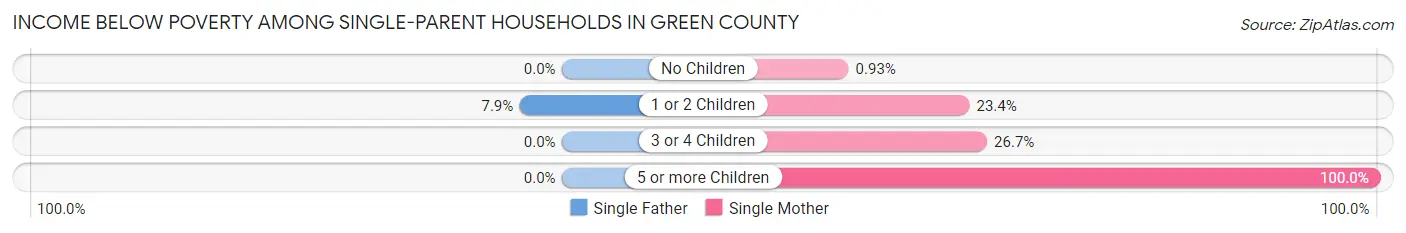
| Children | Single Father | Single Mother |
| No Children | 0 (0.0%) | 2 (0.9%) |
| 1 or 2 Children | 37 (7.9%) | 158 (23.4%) |
| 3 or 4 Children | 0 (0.0%) | 27 (26.7%) |
| 5 or more Children | 0 (0.0%) | 6 (100.0%) |
| Total | 37 (4.2%) | 193 (19.4%) |
Income Below Poverty Among Married-Couple vs Single-Parent Households in Green County
The poverty data for Green County shows that 130 of the married-couple family households (1.6%) and 230 of the single-parent households (12.2%) are living below the poverty level. Within the married-couple family households, those with 5 or more children have the highest poverty rate, with 12 households (11.3%) falling below the poverty line. Among the single-parent households, those with 5 or more children have the highest poverty rate, with 6 household (75.0%) living below poverty.
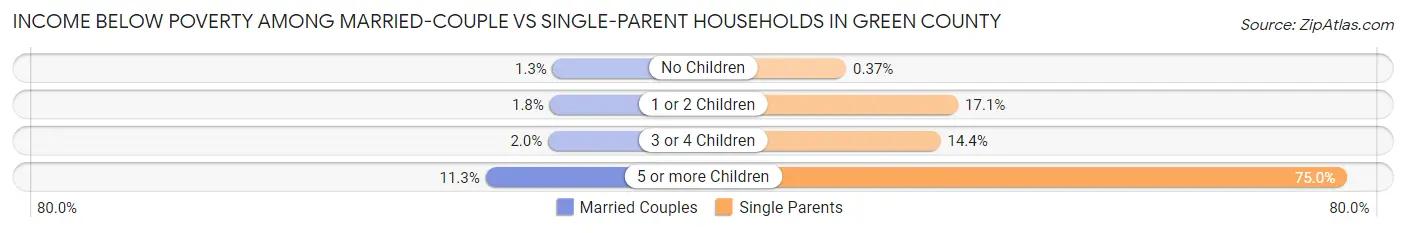
| Children | Married-Couple Families | Single-Parent Households |
| No Children | 67 (1.3%) | 2 (0.4%) |
| 1 or 2 Children | 38 (1.8%) | 195 (17.1%) |
| 3 or 4 Children | 13 (2.0%) | 27 (14.4%) |
| 5 or more Children | 12 (11.3%) | 6 (75.0%) |
| Total | 130 (1.6%) | 230 (12.2%) |
Employment Characteristics in Green County
Employment by Class of Employer in Green County
Among the 19,534 employed individuals in Green County, private company employees (13,349 | 68.3%), not-for-profit organizations (1,735 | 8.9%), and self-employed (not incorporated) (1,403 | 7.2%) make up the most common classes of employment.
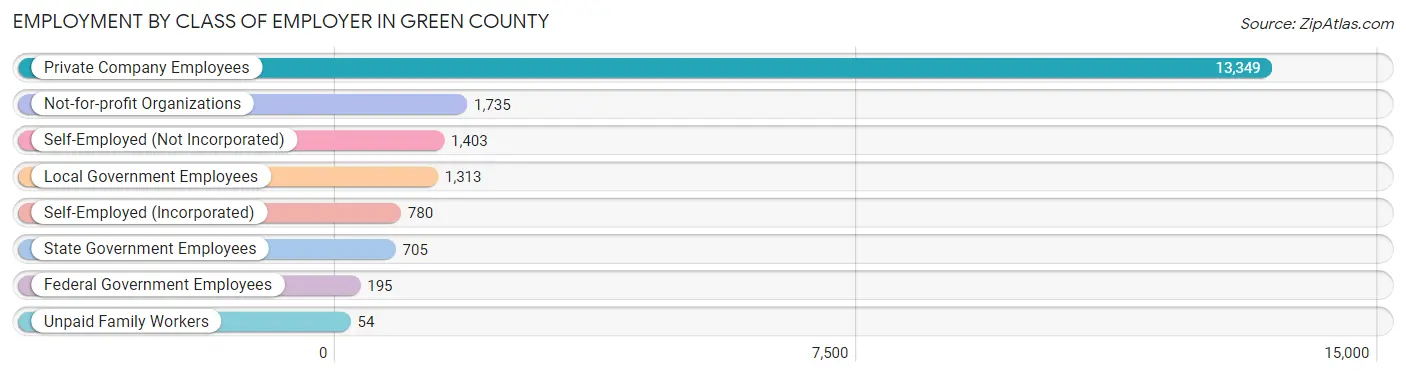
| Employer Class | # Employees | % Employees |
| Private Company Employees | 13,349 | 68.3% |
| Self-Employed (Incorporated) | 780 | 4.0% |
| Self-Employed (Not Incorporated) | 1,403 | 7.2% |
| Not-for-profit Organizations | 1,735 | 8.9% |
| Local Government Employees | 1,313 | 6.7% |
| State Government Employees | 705 | 3.6% |
| Federal Government Employees | 195 | 1.0% |
| Unpaid Family Workers | 54 | 0.3% |
| Total | 19,534 | 100.0% |
Employment Status by Age in Green County
According to the labor force statistics for Green County, out of the total population over 16 years of age (30,060), 68.0% or 20,441 individuals are in the labor force, with 3.4% or 695 of them unemployed. The age group with the highest labor force participation rate is 30 to 34 years, with 90.9% or 1,939 individuals in the labor force. Within the labor force, the 16 to 19 years age range has the highest percentage of unemployed individuals, with 8.2% or 79 of them being unemployed.
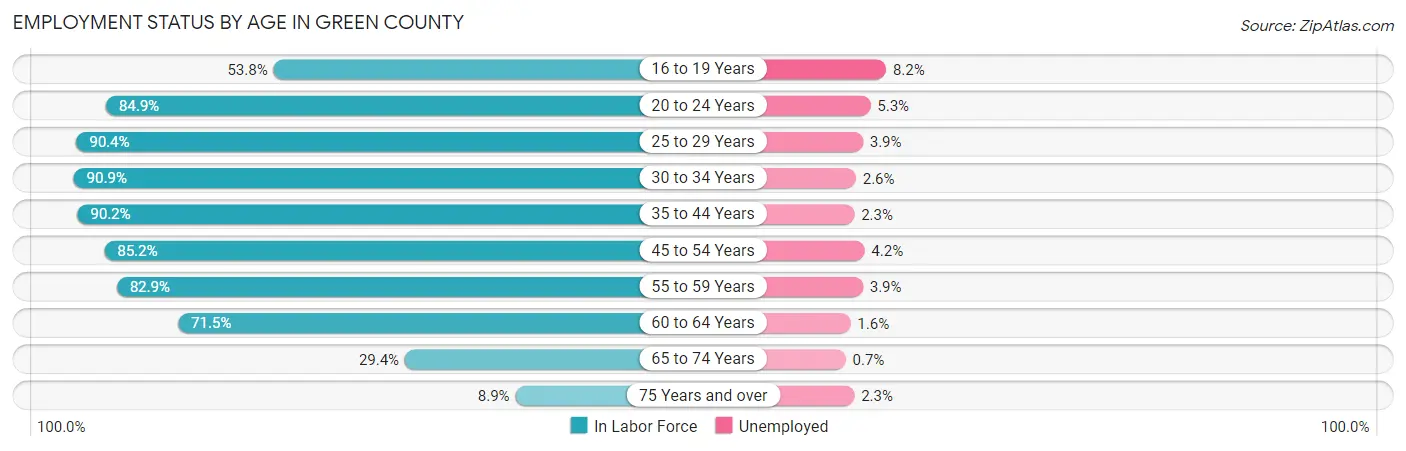
| Age Bracket | In Labor Force | Unemployed |
| 16 to 19 Years | 962 (53.8%) | 79 (8.2%) |
| 20 to 24 Years | 1,521 (84.9%) | 81 (5.3%) |
| 25 to 29 Years | 1,824 (90.4%) | 71 (3.9%) |
| 30 to 34 Years | 1,939 (90.9%) | 50 (2.6%) |
| 35 to 44 Years | 4,037 (90.2%) | 93 (2.3%) |
| 45 to 54 Years | 4,157 (85.2%) | 175 (4.2%) |
| 55 to 59 Years | 2,413 (82.9%) | 94 (3.9%) |
| 60 to 64 Years | 2,060 (71.5%) | 33 (1.6%) |
| 65 to 74 Years | 1,256 (29.4%) | 9 (0.7%) |
| 75 Years and over | 259 (8.9%) | 6 (2.3%) |
| Total | 20,441 (68.0%) | 695 (3.4%) |
Employment Status by Educational Attainment in Green County
According to labor force statistics for Green County, 85.1% of individuals (16,423) out of the total population between 25 and 64 years of age (19,298) are in the labor force, with 3.2% or 526 of them being unemployed. The group with the highest labor force participation rate are those with the educational attainment of bachelor's degree or higher, with 90.0% or 4,917 individuals in the labor force. Within the labor force, individuals with less than high school education have the highest percentage of unemployment, with 9.8% or 85 of them being unemployed.
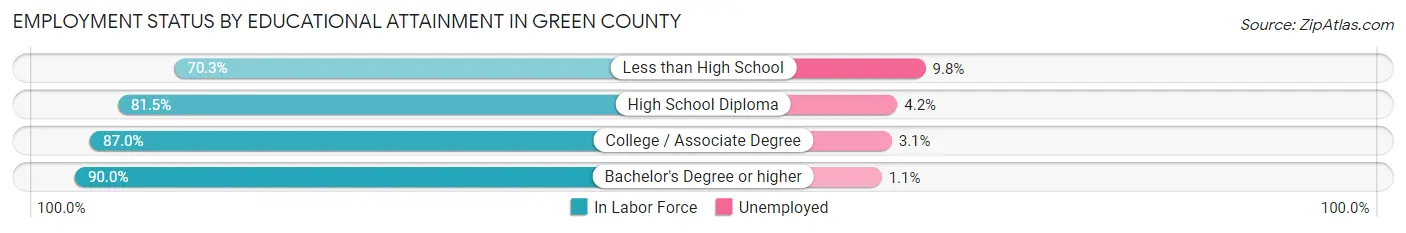
| Educational Attainment | In Labor Force | Unemployed |
| Less than High School | 870 (70.3%) | 121 (9.8%) |
| High School Diploma | 4,650 (81.5%) | 240 (4.2%) |
| College / Associate Degree | 5,995 (87.0%) | 214 (3.1%) |
| Bachelor's Degree or higher | 4,917 (90.0%) | 60 (1.1%) |
| Total | 16,423 (85.1%) | 618 (3.2%) |
Employment Occupations by Sex in Green County
Management, Business, Science and Arts Occupations
The most common Management, Business, Science and Arts occupations in Green County are Management (2,206 | 11.2%), Community & Social Service (1,747 | 8.8%), Health Diagnosing & Treating (1,341 | 6.8%), Computers, Engineering & Science (1,050 | 5.3%), and Education Instruction & Library (1,050 | 5.3%).
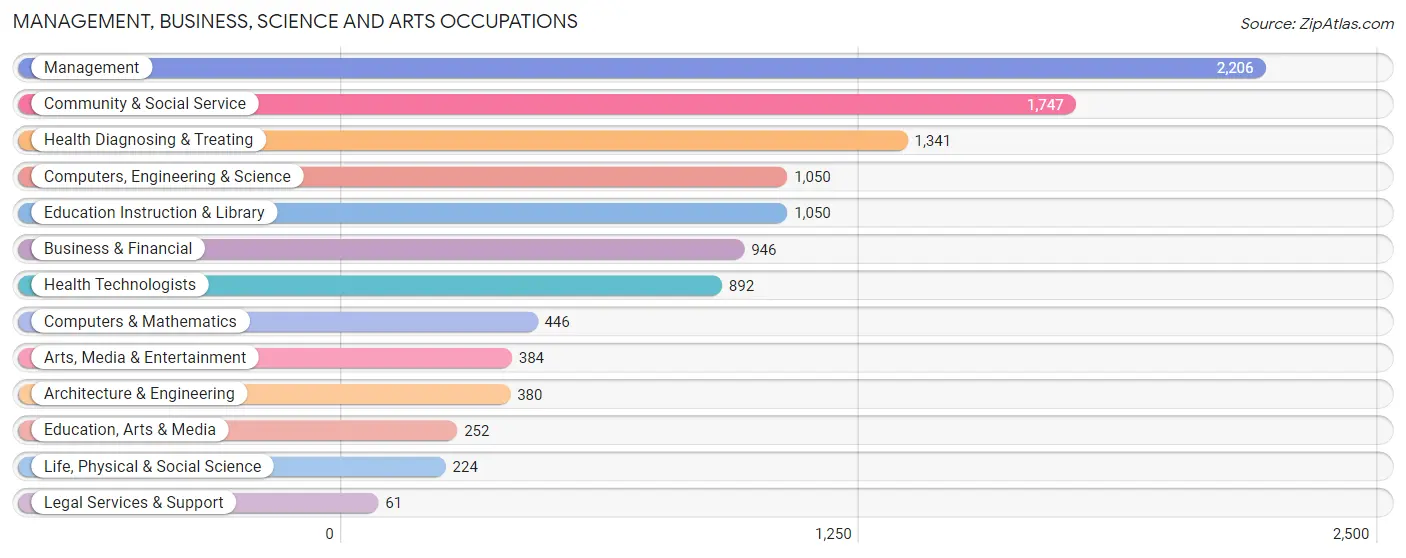
Management, Business, Science and Arts Occupations by Sex
Within the Management, Business, Science and Arts occupations in Green County, the most male-oriented occupations are Architecture & Engineering (85.0%), Computers, Engineering & Science (72.6%), and Computers & Mathematics (71.3%), while the most female-oriented occupations are Health Diagnosing & Treating (85.3%), Health Technologists (82.6%), and Education Instruction & Library (82.0%).
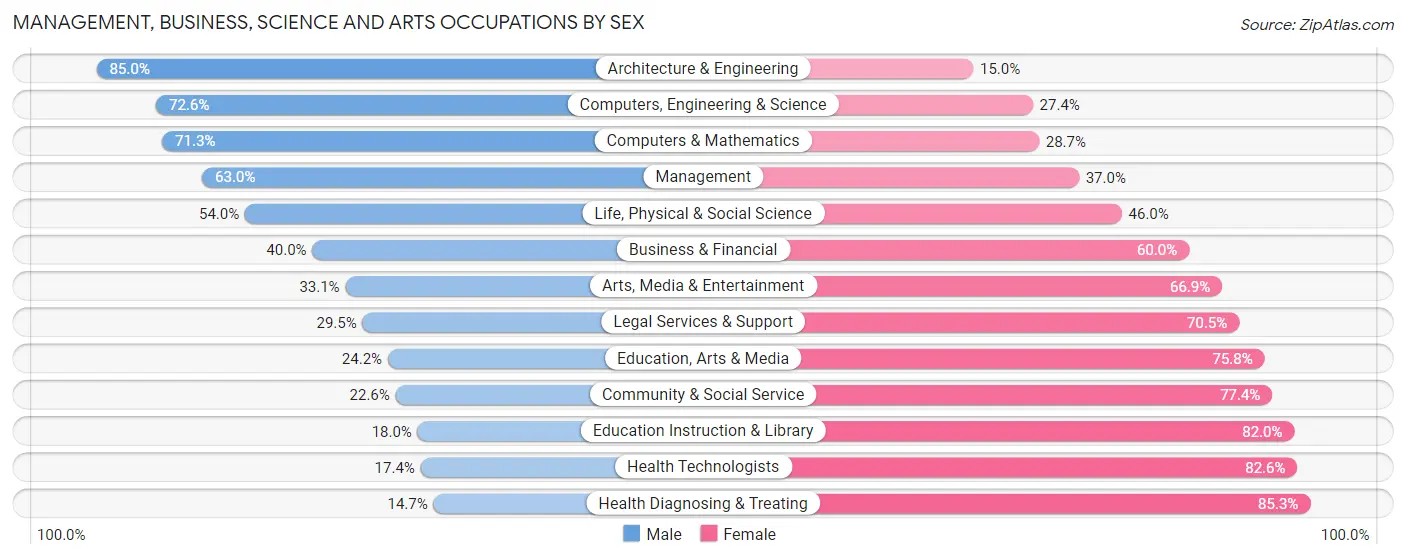
| Occupation | Male | Female |
| Management | 1,389 (63.0%) | 817 (37.0%) |
| Business & Financial | 378 (40.0%) | 568 (60.0%) |
| Computers, Engineering & Science | 762 (72.6%) | 288 (27.4%) |
| Computers & Mathematics | 318 (71.3%) | 128 (28.7%) |
| Architecture & Engineering | 323 (85.0%) | 57 (15.0%) |
| Life, Physical & Social Science | 121 (54.0%) | 103 (46.0%) |
| Community & Social Service | 395 (22.6%) | 1,352 (77.4%) |
| Education, Arts & Media | 61 (24.2%) | 191 (75.8%) |
| Legal Services & Support | 18 (29.5%) | 43 (70.5%) |
| Education Instruction & Library | 189 (18.0%) | 861 (82.0%) |
| Arts, Media & Entertainment | 127 (33.1%) | 257 (66.9%) |
| Health Diagnosing & Treating | 197 (14.7%) | 1,144 (85.3%) |
| Health Technologists | 155 (17.4%) | 737 (82.6%) |
| Total (Category) | 3,121 (42.8%) | 4,169 (57.2%) |
| Total (Overall) | 10,534 (53.4%) | 9,197 (46.6%) |
Services Occupations
The most common Services occupations in Green County are Food Preparation & Serving (763 | 3.9%), Cleaning & Maintenance (661 | 3.4%), Healthcare Support (568 | 2.9%), Personal Care & Service (349 | 1.8%), and Security & Protection (224 | 1.1%).
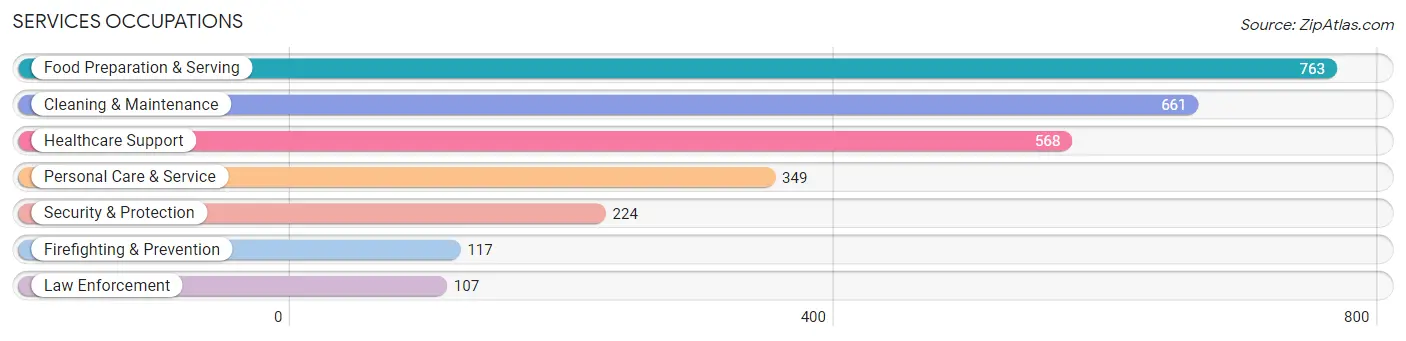
Services Occupations by Sex
Within the Services occupations in Green County, the most male-oriented occupations are Law Enforcement (98.1%), Security & Protection (93.8%), and Firefighting & Prevention (89.7%), while the most female-oriented occupations are Healthcare Support (95.3%), Personal Care & Service (78.2%), and Food Preparation & Serving (59.4%).
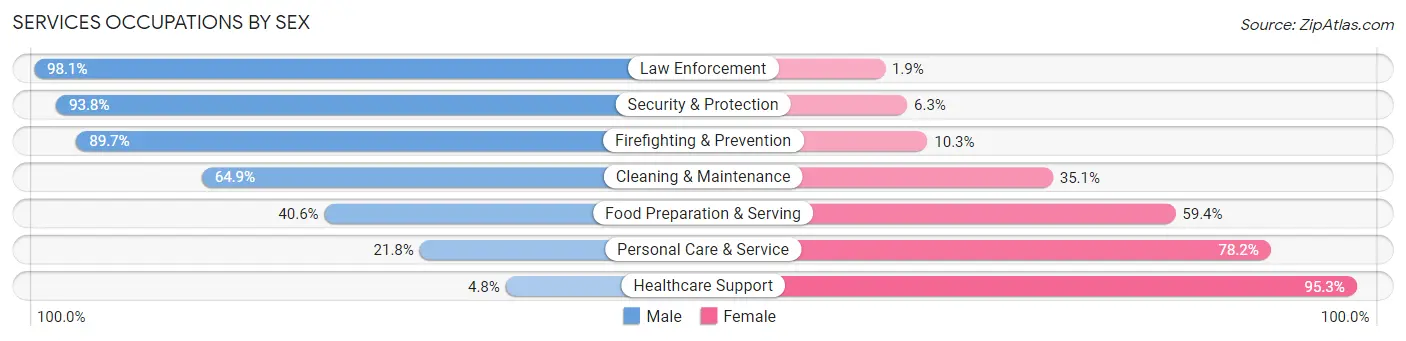
| Occupation | Male | Female |
| Healthcare Support | 27 (4.8%) | 541 (95.3%) |
| Security & Protection | 210 (93.8%) | 14 (6.2%) |
| Firefighting & Prevention | 105 (89.7%) | 12 (10.3%) |
| Law Enforcement | 105 (98.1%) | 2 (1.9%) |
| Food Preparation & Serving | 310 (40.6%) | 453 (59.4%) |
| Cleaning & Maintenance | 429 (64.9%) | 232 (35.1%) |
| Personal Care & Service | 76 (21.8%) | 273 (78.2%) |
| Total (Category) | 1,052 (41.0%) | 1,513 (59.0%) |
| Total (Overall) | 10,534 (53.4%) | 9,197 (46.6%) |
Sales and Office Occupations
The most common Sales and Office occupations in Green County are Office & Administration (2,180 | 11.1%), and Sales & Related (1,478 | 7.5%).

Sales and Office Occupations by Sex
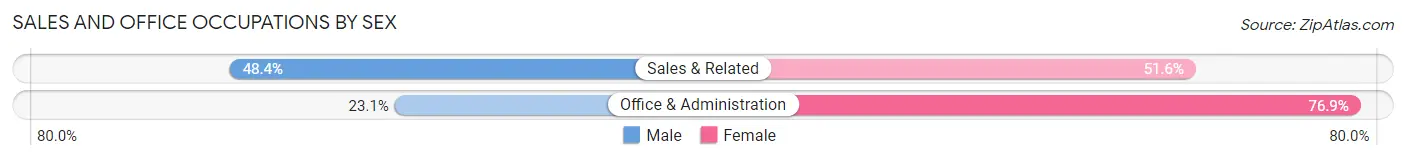
| Occupation | Male | Female |
| Sales & Related | 716 (48.4%) | 762 (51.6%) |
| Office & Administration | 503 (23.1%) | 1,677 (76.9%) |
| Total (Category) | 1,219 (33.3%) | 2,439 (66.7%) |
| Total (Overall) | 10,534 (53.4%) | 9,197 (46.6%) |
Natural Resources, Construction and Maintenance Occupations
The most common Natural Resources, Construction and Maintenance occupations in Green County are Construction & Extraction (1,164 | 5.9%), Installation, Maintenance & Repair (718 | 3.6%), and Farming, Fishing & Forestry (487 | 2.5%).

Natural Resources, Construction and Maintenance Occupations by Sex
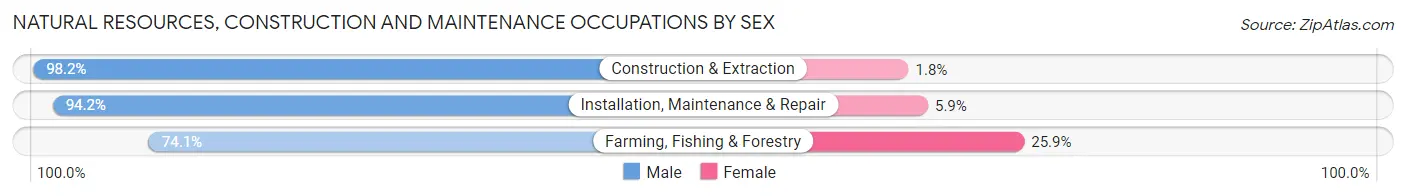
| Occupation | Male | Female |
| Farming, Fishing & Forestry | 361 (74.1%) | 126 (25.9%) |
| Construction & Extraction | 1,143 (98.2%) | 21 (1.8%) |
| Installation, Maintenance & Repair | 676 (94.2%) | 42 (5.9%) |
| Total (Category) | 2,180 (92.0%) | 189 (8.0%) |
| Total (Overall) | 10,534 (53.4%) | 9,197 (46.6%) |
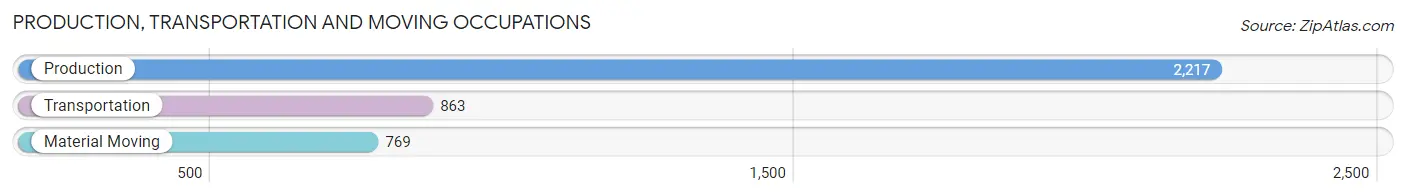
Production, Transportation and Moving Occupations
The most common Production, Transportation and Moving occupations in Green County are Production (2,217 | 11.2%), Transportation (863 | 4.4%), and Material Moving (769 | 3.9%).
Production, Transportation and Moving Occupations by Sex
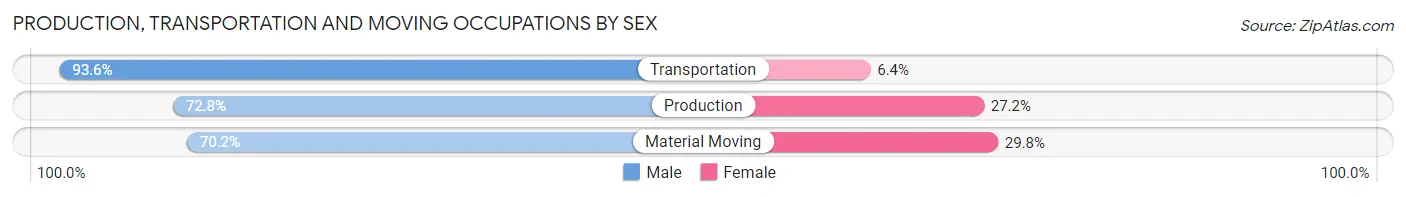
| Occupation | Male | Female |
| Production | 1,614 (72.8%) | 603 (27.2%) |
| Transportation | 808 (93.6%) | 55 (6.4%) |
| Material Moving | 540 (70.2%) | 229 (29.8%) |
| Total (Category) | 2,962 (77.0%) | 887 (23.0%) |
| Total (Overall) | 10,534 (53.4%) | 9,197 (46.6%) |
Employment Industries by Sex in Green County
Employment Industries in Green County
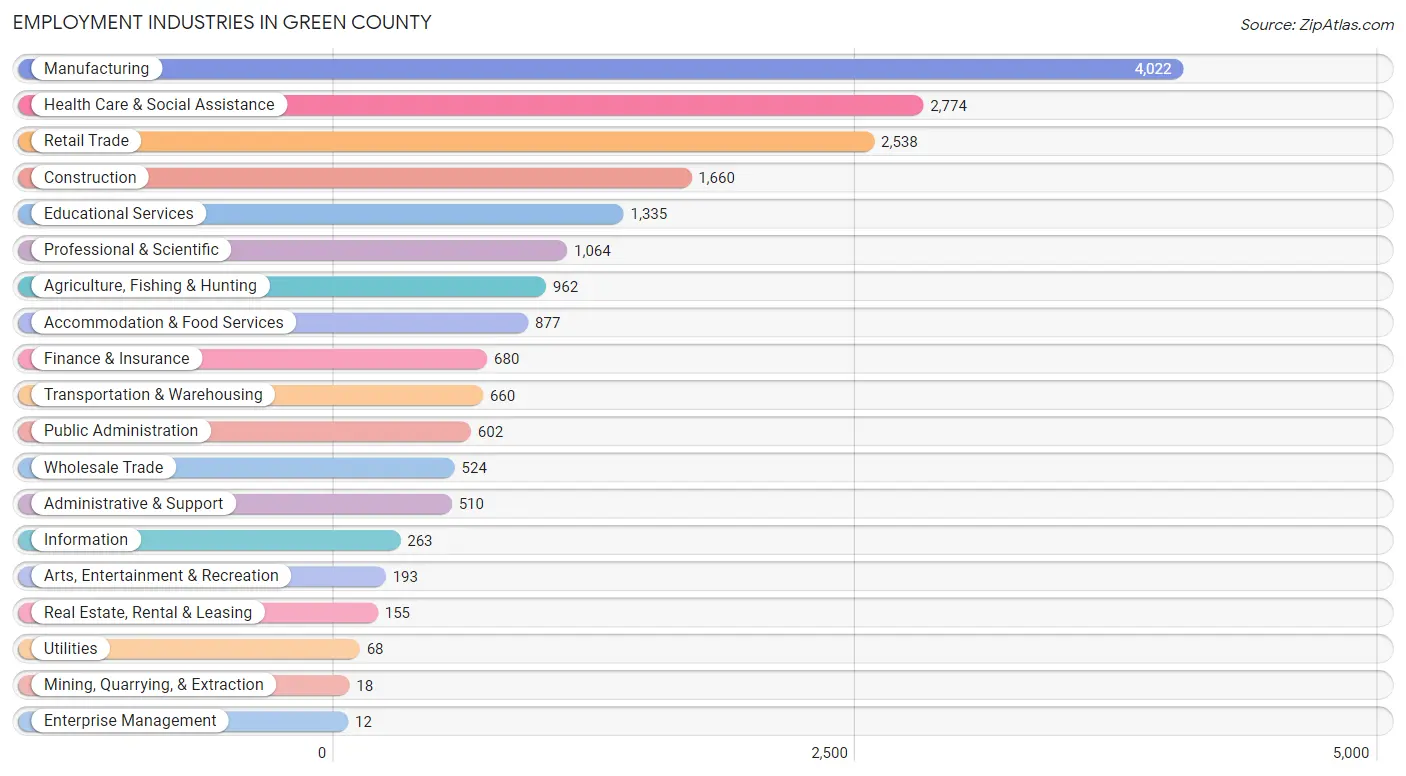
The major employment industries in Green County include Manufacturing (4,022 | 20.4%), Health Care & Social Assistance (2,774 | 14.1%), Retail Trade (2,538 | 12.9%), Construction (1,660 | 8.4%), and Educational Services (1,335 | 6.8%).
Employment Industries by Sex in Green County
The Green County industries that see more men than women are Mining, Quarrying, & Extraction (100.0%), Construction (89.4%), and Wholesale Trade (80.9%), whereas the industries that tend to have a higher number of women are Enterprise Management (100.0%), Health Care & Social Assistance (84.6%), and Educational Services (75.0%).
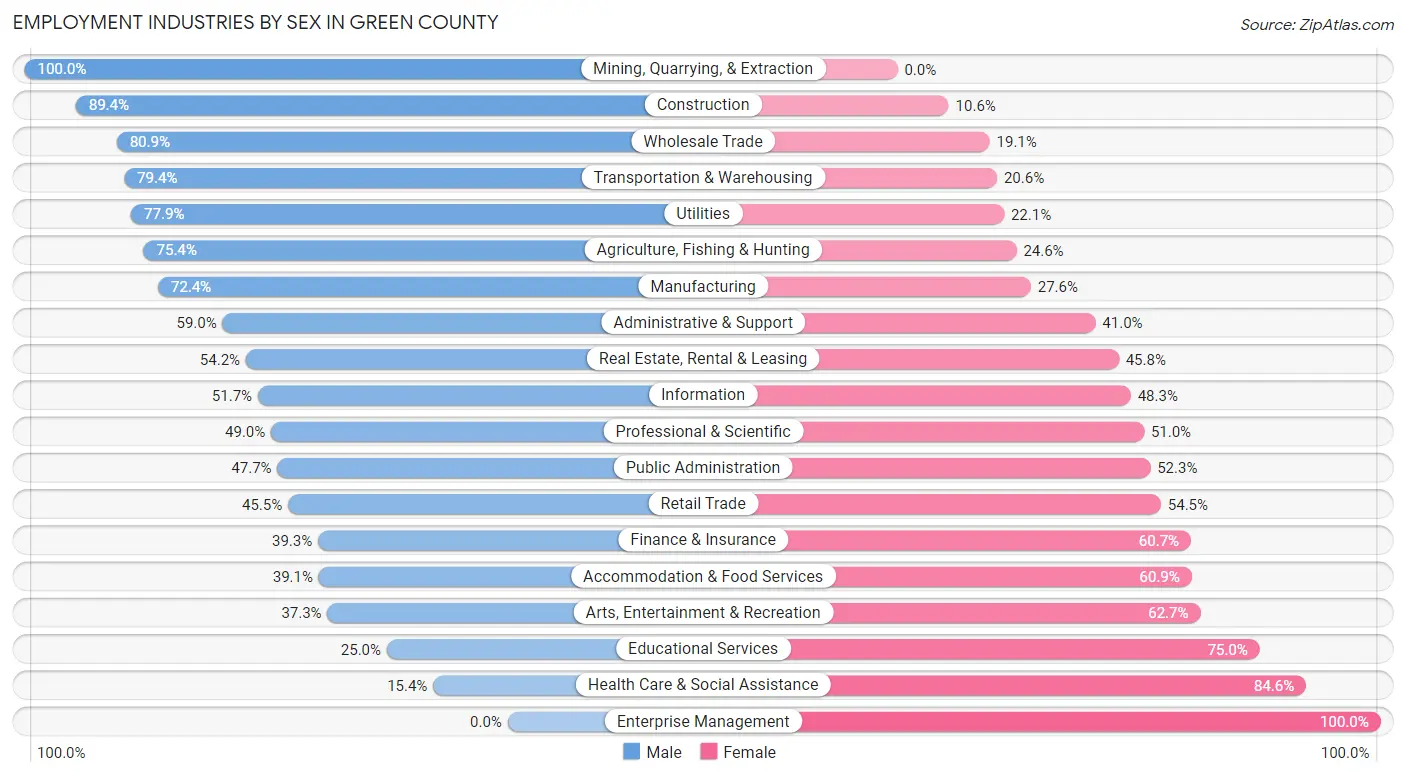
| Industry | Male | Female |
| Agriculture, Fishing & Hunting | 725 (75.4%) | 237 (24.6%) |
| Mining, Quarrying, & Extraction | 18 (100.0%) | 0 (0.0%) |
| Construction | 1,484 (89.4%) | 176 (10.6%) |
| Manufacturing | 2,912 (72.4%) | 1,110 (27.6%) |
| Wholesale Trade | 424 (80.9%) | 100 (19.1%) |
| Retail Trade | 1,154 (45.5%) | 1,384 (54.5%) |
| Transportation & Warehousing | 524 (79.4%) | 136 (20.6%) |
| Utilities | 53 (77.9%) | 15 (22.1%) |
| Information | 136 (51.7%) | 127 (48.3%) |
| Finance & Insurance | 267 (39.3%) | 413 (60.7%) |
| Real Estate, Rental & Leasing | 84 (54.2%) | 71 (45.8%) |
| Professional & Scientific | 521 (49.0%) | 543 (51.0%) |
| Enterprise Management | 0 (0.0%) | 12 (100.0%) |
| Administrative & Support | 301 (59.0%) | 209 (41.0%) |
| Educational Services | 334 (25.0%) | 1,001 (75.0%) |
| Health Care & Social Assistance | 428 (15.4%) | 2,346 (84.6%) |
| Arts, Entertainment & Recreation | 72 (37.3%) | 121 (62.7%) |
| Accommodation & Food Services | 343 (39.1%) | 534 (60.9%) |
| Public Administration | 287 (47.7%) | 315 (52.3%) |
| Total | 10,534 (53.4%) | 9,197 (46.6%) |
Education in Green County
School Enrollment in Green County
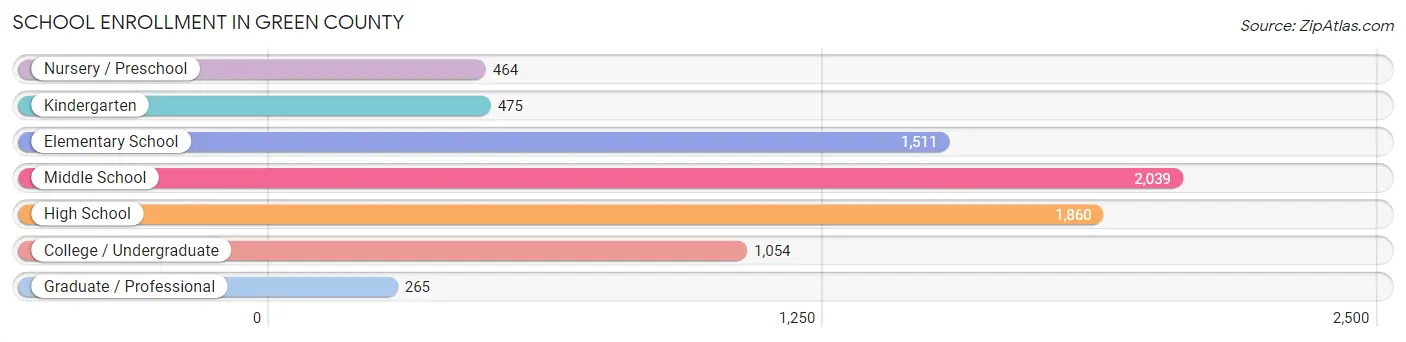
The most common levels of schooling among the 7,668 students in Green County are middle school (2,039 | 26.6%), high school (1,860 | 24.3%), and elementary school (1,511 | 19.7%).
| School Level | # Students | % Students |
| Nursery / Preschool | 464 | 6.0% |
| Kindergarten | 475 | 6.2% |
| Elementary School | 1,511 | 19.7% |
| Middle School | 2,039 | 26.6% |
| High School | 1,860 | 24.3% |
| College / Undergraduate | 1,054 | 13.8% |
| Graduate / Professional | 265 | 3.5% |
| Total | 7,668 | 100.0% |
School Enrollment by Age by Funding Source in Green County
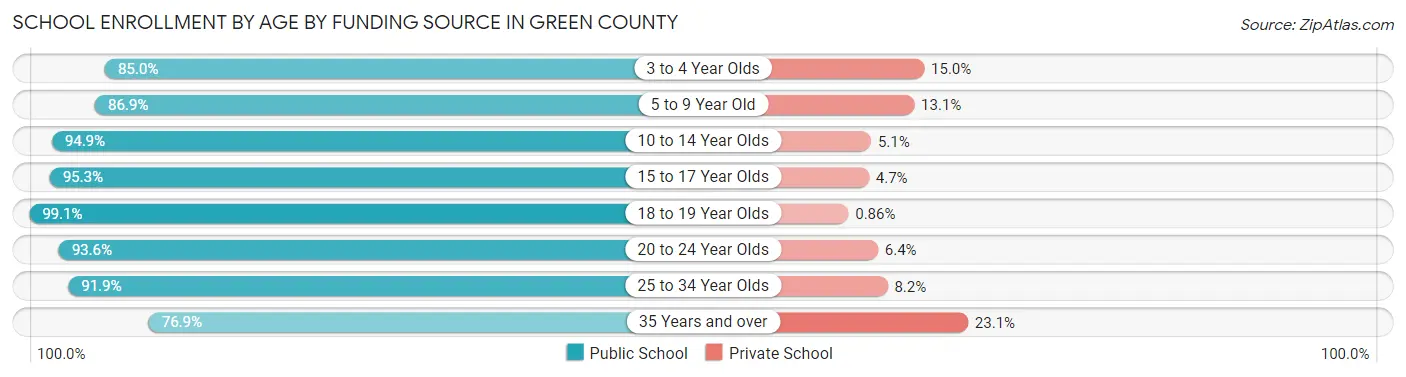
Out of a total of 7,668 students who are enrolled in schools in Green County, 629 (8.2%) attend a private institution, while the remaining 7,039 (91.8%) are enrolled in public schools. The age group of 35 years and over has the highest likelihood of being enrolled in private schools, with 84 (23.1% in the age bracket) enrolled. Conversely, the age group of 18 to 19 year olds has the lowest likelihood of being enrolled in a private school, with 462 (99.1% in the age bracket) attending a public institution.
| Age Bracket | Public School | Private School |
| 3 to 4 Year Olds | 227 (85.0%) | 40 (15.0%) |
| 5 to 9 Year Old | 1,747 (86.9%) | 264 (13.1%) |
| 10 to 14 Year Olds | 2,260 (94.9%) | 121 (5.1%) |
| 15 to 17 Year Olds | 1,361 (95.3%) | 67 (4.7%) |
| 18 to 19 Year Olds | 462 (99.1%) | 4 (0.9%) |
| 20 to 24 Year Olds | 486 (93.6%) | 33 (6.4%) |
| 25 to 34 Year Olds | 214 (91.8%) | 19 (8.2%) |
| 35 Years and over | 279 (76.9%) | 84 (23.1%) |
| Total | 7,039 (91.8%) | 629 (8.2%) |
Educational Attainment by Field of Study in Green County
Education (1,433 | 19.1%), business (1,253 | 16.7%), bio, nature & agricultural (1,068 | 14.2%), science & technology (896 | 11.9%), and engineering (407 | 5.4%) are the most common fields of study among 7,517 individuals in Green County who have obtained a bachelor's degree or higher.
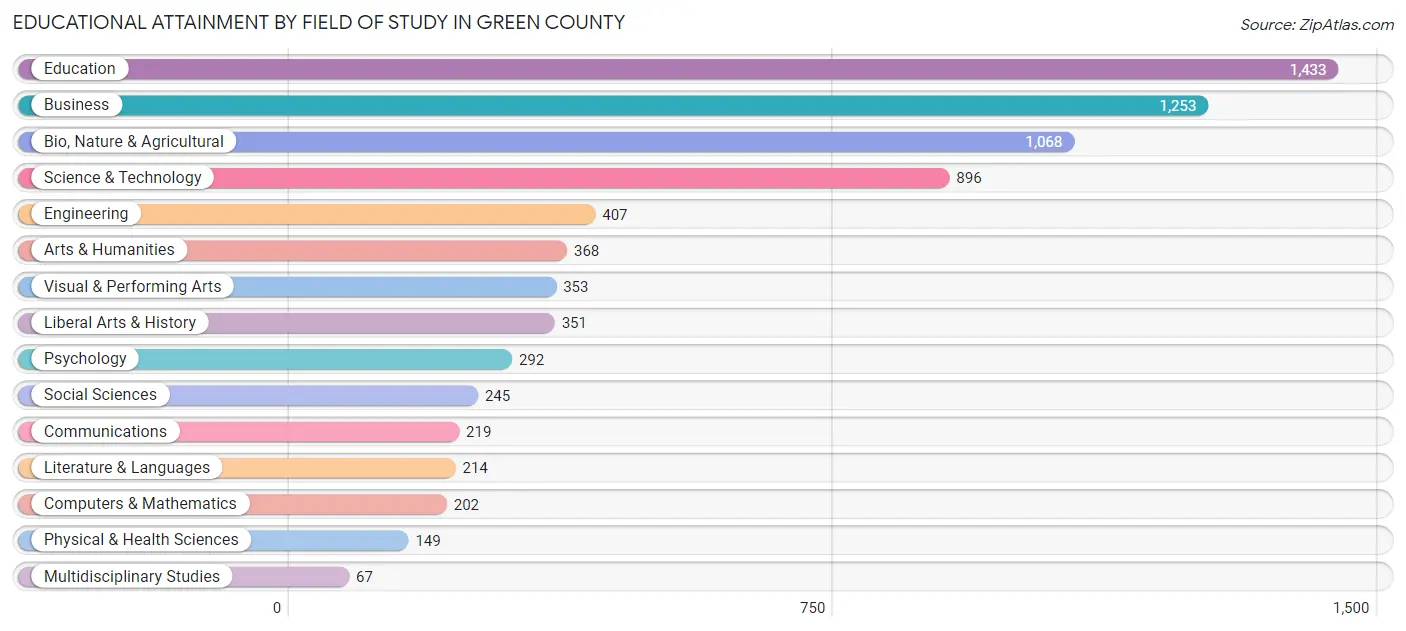
| Field of Study | # Graduates | % Graduates |
| Computers & Mathematics | 202 | 2.7% |
| Bio, Nature & Agricultural | 1,068 | 14.2% |
| Physical & Health Sciences | 149 | 2.0% |
| Psychology | 292 | 3.9% |
| Social Sciences | 245 | 3.3% |
| Engineering | 407 | 5.4% |
| Multidisciplinary Studies | 67 | 0.9% |
| Science & Technology | 896 | 11.9% |
| Business | 1,253 | 16.7% |
| Education | 1,433 | 19.1% |
| Literature & Languages | 214 | 2.9% |
| Liberal Arts & History | 351 | 4.7% |
| Visual & Performing Arts | 353 | 4.7% |
| Communications | 219 | 2.9% |
| Arts & Humanities | 368 | 4.9% |
| Total | 7,517 | 100.0% |
Transportation & Commute in Green County
Vehicle Availability by Sex in Green County
The most prevalent vehicle ownership categories in Green County are males with 2 vehicles (4,390, accounting for 42.0%) and females with 2 vehicles (3,767, making up 48.6%).
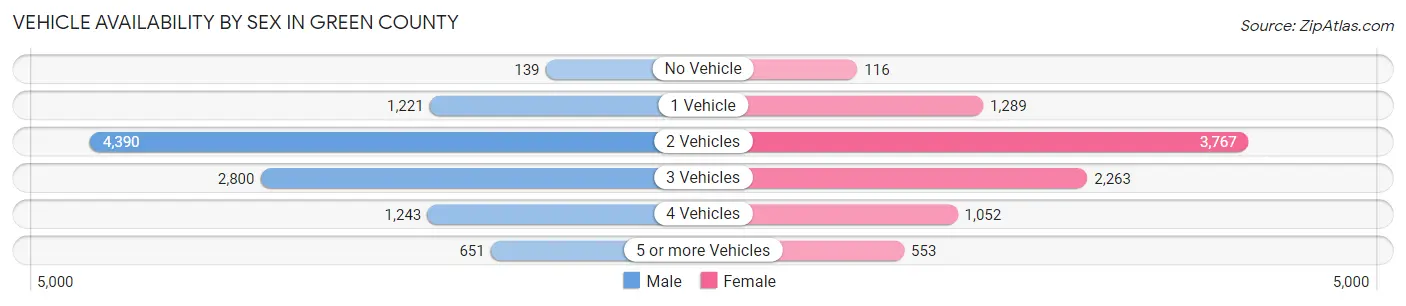
| Vehicles Available | Male | Female |
| No Vehicle | 139 (1.3%) | 116 (1.3%) |
| 1 Vehicle | 1,221 (11.7%) | 1,289 (14.3%) |
| 2 Vehicles | 4,390 (42.0%) | 3,767 (41.7%) |
| 3 Vehicles | 2,800 (26.8%) | 2,263 (25.0%) |
| 4 Vehicles | 1,243 (11.9%) | 1,052 (11.6%) |
| 5 or more Vehicles | 651 (6.2%) | 553 (6.1%) |
| Total | 10,444 (100.0%) | 9,040 (100.0%) |
Commute Time in Green County
The most frequently occuring commute durations in Green County are 5 to 9 minutes (3,304 commuters, 18.8%), 10 to 14 minutes (2,223 commuters, 12.6%), and 45 to 59 minutes (1,895 commuters, 10.8%).

| Commute Time | # Commuters | % Commuters |
| Less than 5 Minutes | 1,314 | 7.5% |
| 5 to 9 Minutes | 3,304 | 18.8% |
| 10 to 14 Minutes | 2,223 | 12.6% |
| 15 to 19 Minutes | 1,821 | 10.3% |
| 20 to 24 Minutes | 1,582 | 9.0% |
| 25 to 29 Minutes | 912 | 5.2% |
| 30 to 34 Minutes | 1,378 | 7.8% |
| 35 to 39 Minutes | 823 | 4.7% |
| 40 to 44 Minutes | 888 | 5.1% |
| 45 to 59 Minutes | 1,895 | 10.8% |
| 60 to 89 Minutes | 1,113 | 6.3% |
| 90 or more Minutes | 345 | 2.0% |
Commute Time by Sex in Green County
The most common commute times in Green County are 5 to 9 minutes (1,538 commuters, 16.0%) for males and 5 to 9 minutes (1,766 commuters, 22.1%) for females.
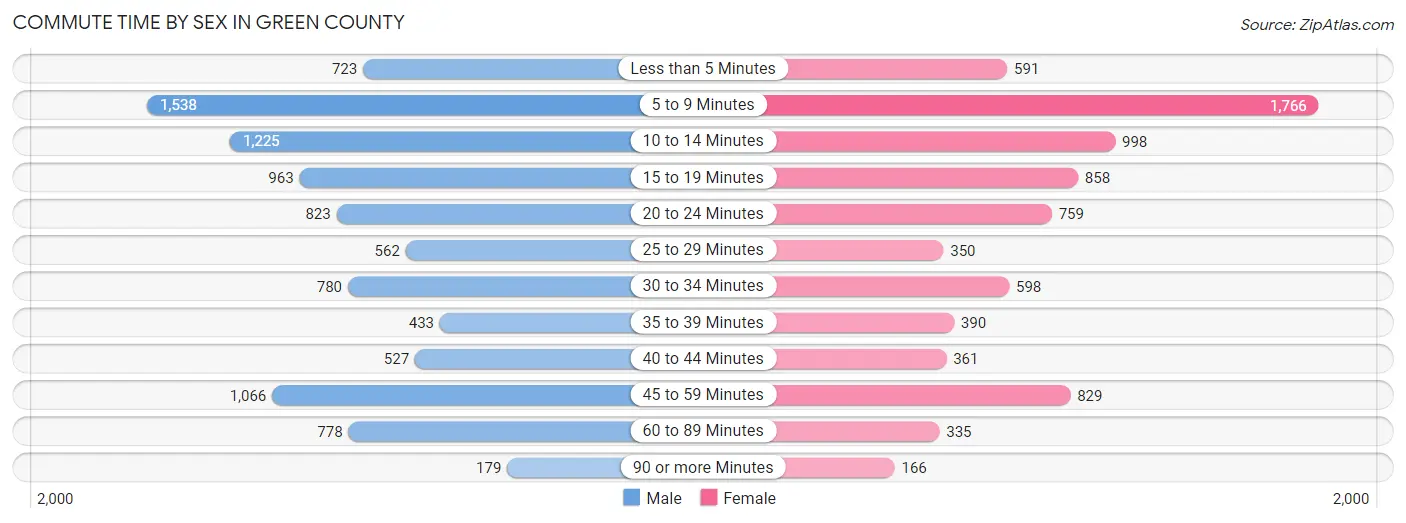
| Commute Time | Male | Female |
| Less than 5 Minutes | 723 (7.5%) | 591 (7.4%) |
| 5 to 9 Minutes | 1,538 (16.0%) | 1,766 (22.1%) |
| 10 to 14 Minutes | 1,225 (12.8%) | 998 (12.5%) |
| 15 to 19 Minutes | 963 (10.0%) | 858 (10.7%) |
| 20 to 24 Minutes | 823 (8.6%) | 759 (9.5%) |
| 25 to 29 Minutes | 562 (5.9%) | 350 (4.4%) |
| 30 to 34 Minutes | 780 (8.1%) | 598 (7.5%) |
| 35 to 39 Minutes | 433 (4.5%) | 390 (4.9%) |
| 40 to 44 Minutes | 527 (5.5%) | 361 (4.5%) |
| 45 to 59 Minutes | 1,066 (11.1%) | 829 (10.4%) |
| 60 to 89 Minutes | 778 (8.1%) | 335 (4.2%) |
| 90 or more Minutes | 179 (1.9%) | 166 (2.1%) |
Time of Departure to Work by Sex in Green County
The most frequent times of departure to work in Green County are 7:00 AM to 7:29 AM (1,348, 14.1%) for males and 7:30 AM to 7:59 AM (1,587, 19.8%) for females.
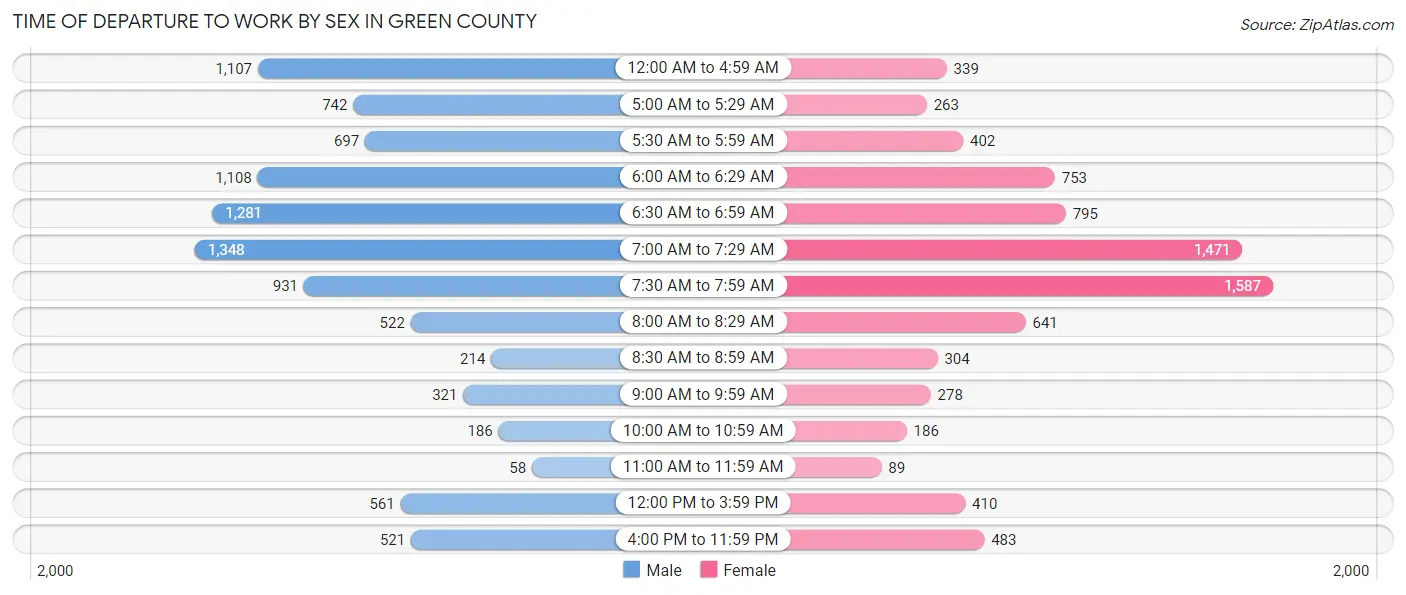
| Time of Departure | Male | Female |
| 12:00 AM to 4:59 AM | 1,107 (11.5%) | 339 (4.2%) |
| 5:00 AM to 5:29 AM | 742 (7.7%) | 263 (3.3%) |
| 5:30 AM to 5:59 AM | 697 (7.3%) | 402 (5.0%) |
| 6:00 AM to 6:29 AM | 1,108 (11.6%) | 753 (9.4%) |
| 6:30 AM to 6:59 AM | 1,281 (13.4%) | 795 (9.9%) |
| 7:00 AM to 7:29 AM | 1,348 (14.1%) | 1,471 (18.4%) |
| 7:30 AM to 7:59 AM | 931 (9.7%) | 1,587 (19.8%) |
| 8:00 AM to 8:29 AM | 522 (5.4%) | 641 (8.0%) |
| 8:30 AM to 8:59 AM | 214 (2.2%) | 304 (3.8%) |
| 9:00 AM to 9:59 AM | 321 (3.3%) | 278 (3.5%) |
| 10:00 AM to 10:59 AM | 186 (1.9%) | 186 (2.3%) |
| 11:00 AM to 11:59 AM | 58 (0.6%) | 89 (1.1%) |
| 12:00 PM to 3:59 PM | 561 (5.9%) | 410 (5.1%) |
| 4:00 PM to 11:59 PM | 521 (5.4%) | 483 (6.0%) |
| Total | 9,597 (100.0%) | 8,001 (100.0%) |
Housing Occupancy in Green County
Occupancy by Ownership in Green County
Of the total 15,594 dwellings in Green County, owner-occupied units account for 11,754 (75.4%), while renter-occupied units make up 3,840 (24.6%).
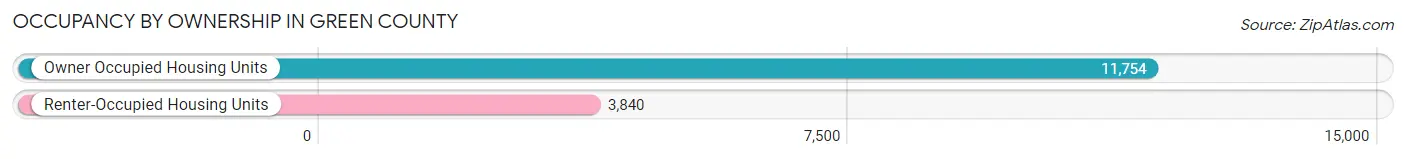
| Occupancy | # Housing Units | % Housing Units |
| Owner Occupied Housing Units | 11,754 | 75.4% |
| Renter-Occupied Housing Units | 3,840 | 24.6% |
| Total Occupied Housing Units | 15,594 | 100.0% |
Occupancy by Household Size in Green County
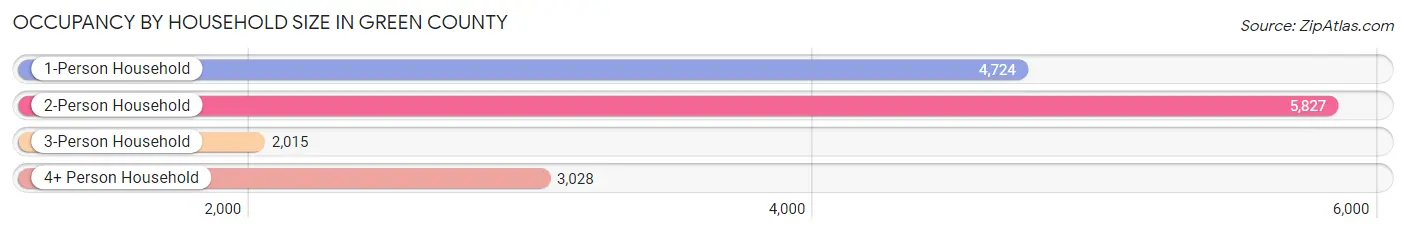
| Household Size | # Housing Units | % Housing Units |
| 1-Person Household | 4,724 | 30.3% |
| 2-Person Household | 5,827 | 37.4% |
| 3-Person Household | 2,015 | 12.9% |
| 4+ Person Household | 3,028 | 19.4% |
| Total Housing Units | 15,594 | 100.0% |
Occupancy by Ownership by Household Size in Green County
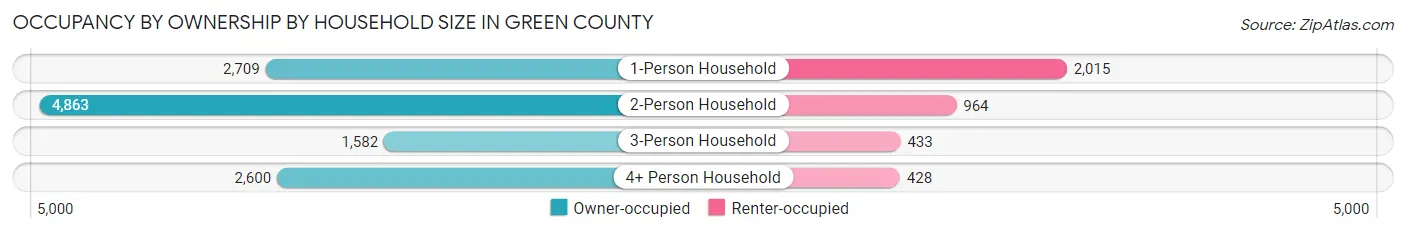
| Household Size | Owner-occupied | Renter-occupied |
| 1-Person Household | 2,709 (57.4%) | 2,015 (42.6%) |
| 2-Person Household | 4,863 (83.5%) | 964 (16.5%) |
| 3-Person Household | 1,582 (78.5%) | 433 (21.5%) |
| 4+ Person Household | 2,600 (85.9%) | 428 (14.1%) |
| Total Housing Units | 11,754 (75.4%) | 3,840 (24.6%) |
Occupancy by Educational Attainment in Green County
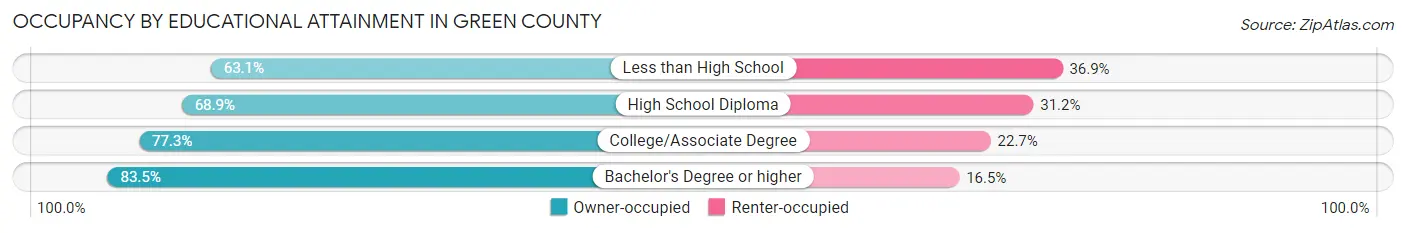
| Household Size | Owner-occupied | Renter-occupied |
| Less than High School | 673 (63.1%) | 394 (36.9%) |
| High School Diploma | 3,426 (68.9%) | 1,550 (31.1%) |
| College/Associate Degree | 4,020 (77.3%) | 1,180 (22.7%) |
| Bachelor's Degree or higher | 3,635 (83.5%) | 716 (16.5%) |
Occupancy by Age of Householder in Green County
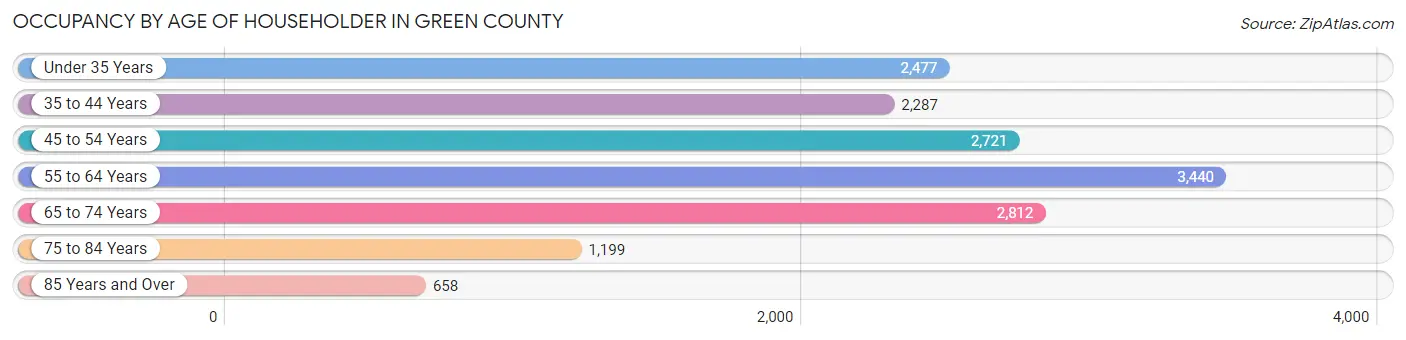
| Age Bracket | # Households | % Households |
| Under 35 Years | 2,477 | 15.9% |
| 35 to 44 Years | 2,287 | 14.7% |
| 45 to 54 Years | 2,721 | 17.4% |
| 55 to 64 Years | 3,440 | 22.1% |
| 65 to 74 Years | 2,812 | 18.0% |
| 75 to 84 Years | 1,199 | 7.7% |
| 85 Years and Over | 658 | 4.2% |
| Total | 15,594 | 100.0% |
Housing Finances in Green County
Median Income by Occupancy in Green County

| Occupancy Type | # Households | Median Income |
| Owner-Occupied | 11,754 (75.4%) | $88,602 |
| Renter-Occupied | 3,840 (24.6%) | $40,934 |
| Average | 15,594 (100.0%) | $76,080 |
Occupancy by Householder Income Bracket in Green County
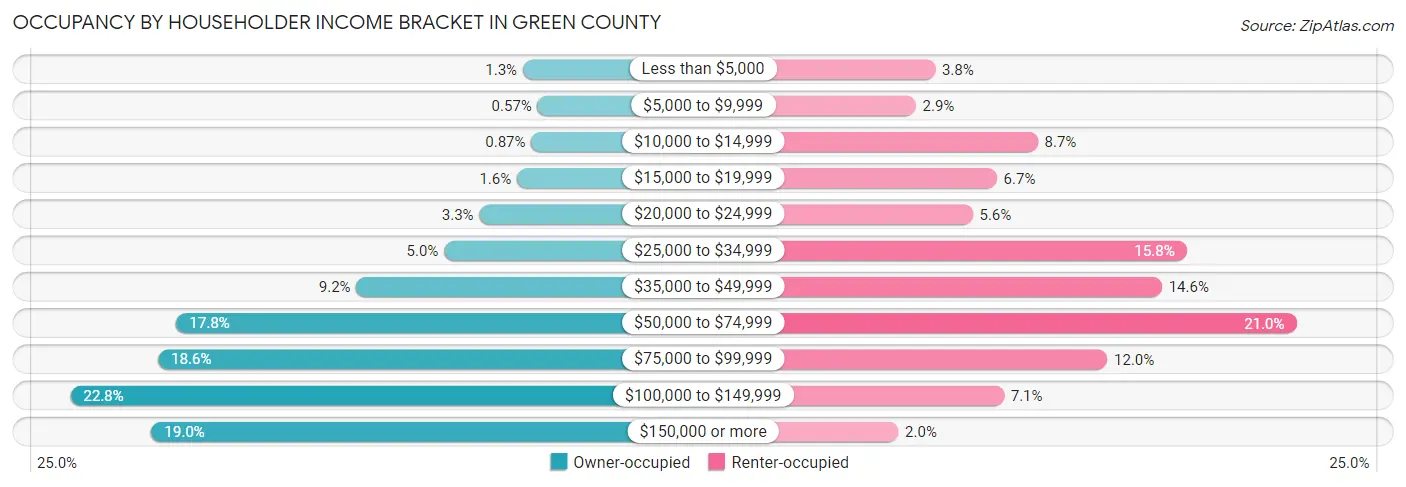
| Income Bracket | Owner-occupied | Renter-occupied |
| Less than $5,000 | 149 (1.3%) | 145 (3.8%) |
| $5,000 to $9,999 | 67 (0.6%) | 110 (2.9%) |
| $10,000 to $14,999 | 102 (0.9%) | 333 (8.7%) |
| $15,000 to $19,999 | 182 (1.5%) | 258 (6.7%) |
| $20,000 to $24,999 | 392 (3.3%) | 214 (5.6%) |
| $25,000 to $34,999 | 590 (5.0%) | 605 (15.8%) |
| $35,000 to $49,999 | 1,081 (9.2%) | 560 (14.6%) |
| $50,000 to $74,999 | 2,089 (17.8%) | 806 (21.0%) |
| $75,000 to $99,999 | 2,191 (18.6%) | 460 (12.0%) |
| $100,000 to $149,999 | 2,682 (22.8%) | 271 (7.1%) |
| $150,000 or more | 2,229 (19.0%) | 78 (2.0%) |
| Total | 11,754 (100.0%) | 3,840 (100.0%) |
Monthly Housing Cost Tiers in Green County
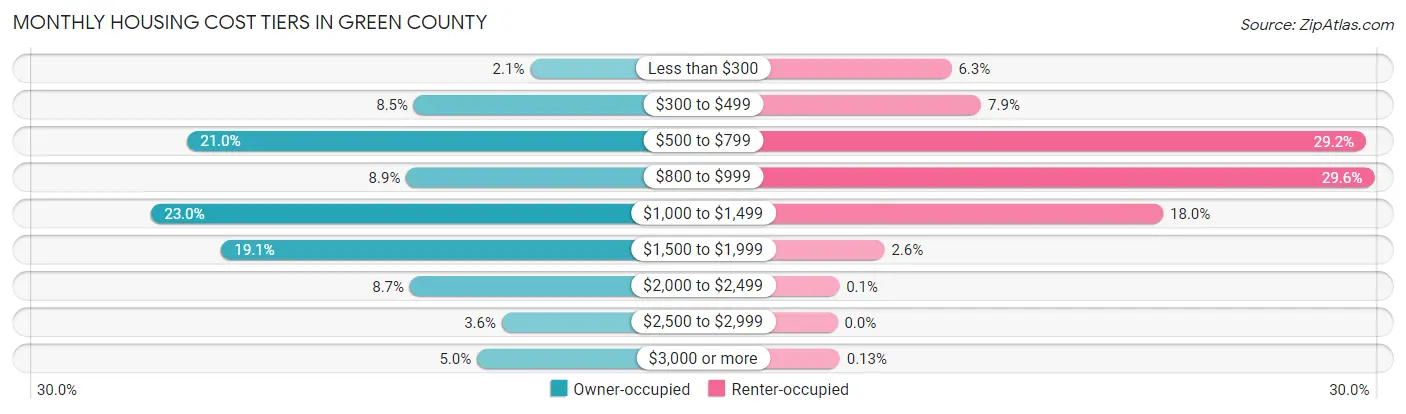
| Monthly Cost | Owner-occupied | Renter-occupied |
| Less than $300 | 243 (2.1%) | 242 (6.3%) |
| $300 to $499 | 999 (8.5%) | 305 (7.9%) |
| $500 to $799 | 2,470 (21.0%) | 1,121 (29.2%) |
| $800 to $999 | 1,048 (8.9%) | 1,138 (29.6%) |
| $1,000 to $1,499 | 2,704 (23.0%) | 691 (18.0%) |
| $1,500 to $1,999 | 2,248 (19.1%) | 100 (2.6%) |
| $2,000 to $2,499 | 1,025 (8.7%) | 4 (0.1%) |
| $2,500 to $2,999 | 428 (3.6%) | 0 (0.0%) |
| $3,000 or more | 589 (5.0%) | 5 (0.1%) |
| Total | 11,754 (100.0%) | 3,840 (100.0%) |
Physical Housing Characteristics in Green County
Housing Structures in Green County
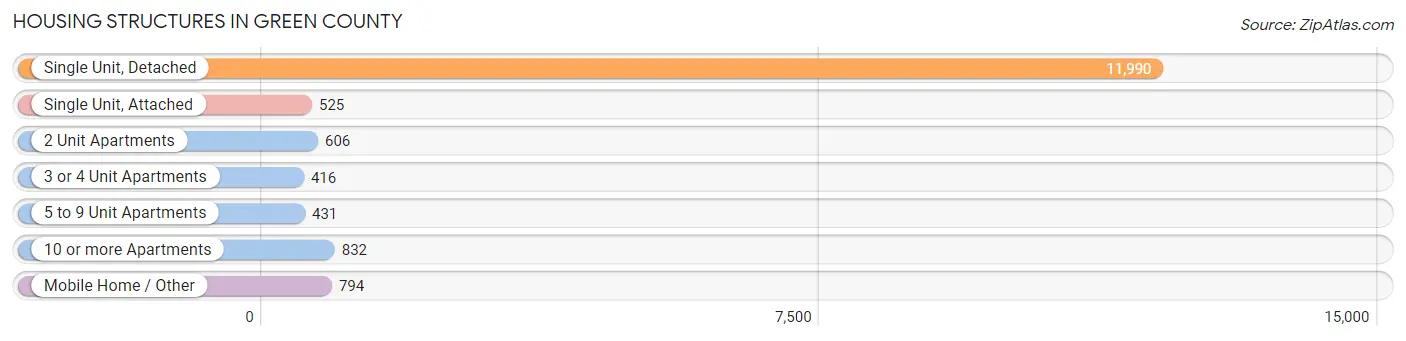
| Structure Type | # Housing Units | % Housing Units |
| Single Unit, Detached | 11,990 | 76.9% |
| Single Unit, Attached | 525 | 3.4% |
| 2 Unit Apartments | 606 | 3.9% |
| 3 or 4 Unit Apartments | 416 | 2.7% |
| 5 to 9 Unit Apartments | 431 | 2.8% |
| 10 or more Apartments | 832 | 5.3% |
| Mobile Home / Other | 794 | 5.1% |
| Total | 15,594 | 100.0% |
Housing Structures by Occupancy in Green County
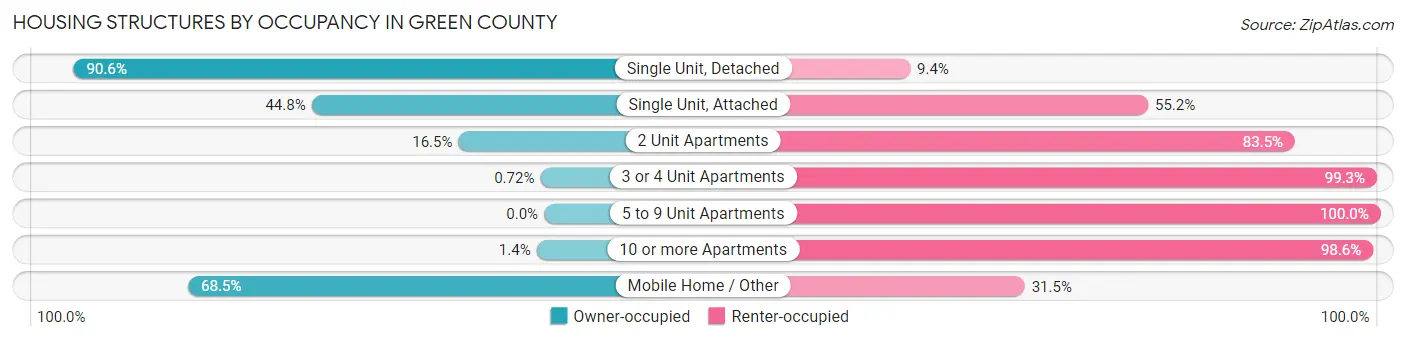
| Structure Type | Owner-occupied | Renter-occupied |
| Single Unit, Detached | 10,860 (90.6%) | 1,130 (9.4%) |
| Single Unit, Attached | 235 (44.8%) | 290 (55.2%) |
| 2 Unit Apartments | 100 (16.5%) | 506 (83.5%) |
| 3 or 4 Unit Apartments | 3 (0.7%) | 413 (99.3%) |
| 5 to 9 Unit Apartments | 0 (0.0%) | 431 (100.0%) |
| 10 or more Apartments | 12 (1.4%) | 820 (98.6%) |
| Mobile Home / Other | 544 (68.5%) | 250 (31.5%) |
| Total | 11,754 (75.4%) | 3,840 (24.6%) |
Housing Structures by Number of Rooms in Green County
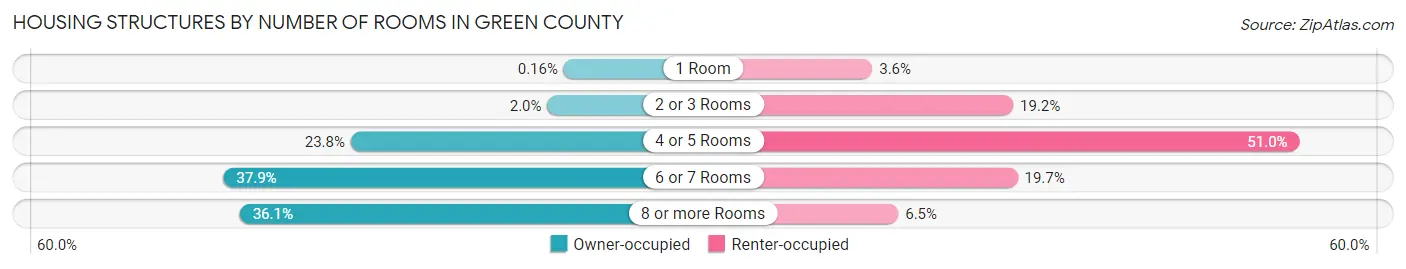
| Number of Rooms | Owner-occupied | Renter-occupied |
| 1 Room | 19 (0.2%) | 138 (3.6%) |
| 2 or 3 Rooms | 233 (2.0%) | 738 (19.2%) |
| 4 or 5 Rooms | 2,798 (23.8%) | 1,958 (51.0%) |
| 6 or 7 Rooms | 4,458 (37.9%) | 757 (19.7%) |
| 8 or more Rooms | 4,246 (36.1%) | 249 (6.5%) |
| Total | 11,754 (100.0%) | 3,840 (100.0%) |
Housing Structure by Heating Type in Green County
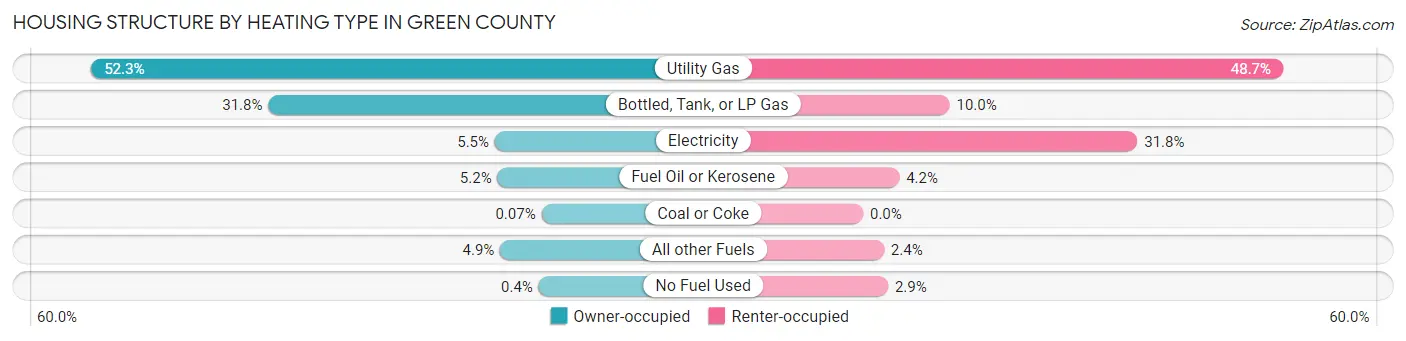
| Heating Type | Owner-occupied | Renter-occupied |
| Utility Gas | 6,144 (52.3%) | 1,869 (48.7%) |
| Bottled, Tank, or LP Gas | 3,732 (31.8%) | 385 (10.0%) |
| Electricity | 644 (5.5%) | 1,221 (31.8%) |
| Fuel Oil or Kerosene | 608 (5.2%) | 161 (4.2%) |
| Coal or Coke | 8 (0.1%) | 0 (0.0%) |
| All other Fuels | 571 (4.9%) | 93 (2.4%) |
| No Fuel Used | 47 (0.4%) | 111 (2.9%) |
| Total | 11,754 (100.0%) | 3,840 (100.0%) |
Household Vehicle Usage in Green County
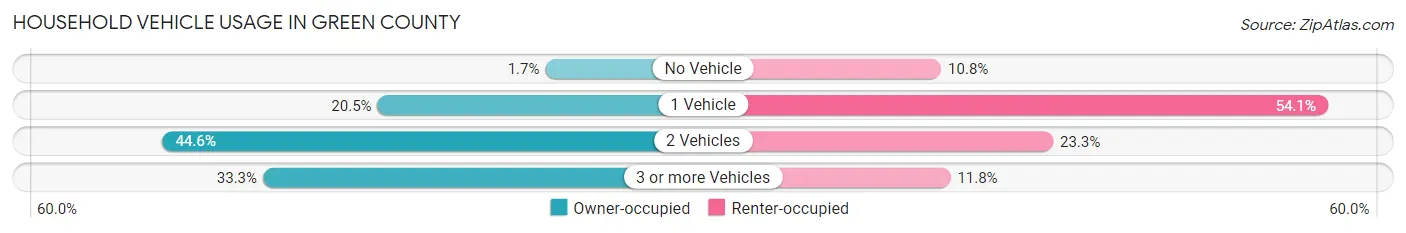
| Vehicles per Household | Owner-occupied | Renter-occupied |
| No Vehicle | 196 (1.7%) | 414 (10.8%) |
| 1 Vehicle | 2,407 (20.5%) | 2,077 (54.1%) |
| 2 Vehicles | 5,236 (44.6%) | 895 (23.3%) |
| 3 or more Vehicles | 3,915 (33.3%) | 454 (11.8%) |
| Total | 11,754 (100.0%) | 3,840 (100.0%) |
Real Estate & Mortgages in Green County
Real Estate and Mortgage Overview in Green County
| Characteristic | Without Mortgage | With Mortgage |
| Housing Units | 4,471 | 7,283 |
| Median Property Value | $190,400 | $232,500 |
| Median Household Income | $68,343 | $1,729 |
| Monthly Housing Costs | $604 | $585 |
| Real Estate Taxes | $3,554 | $132 |
Property Value by Mortgage Status in Green County
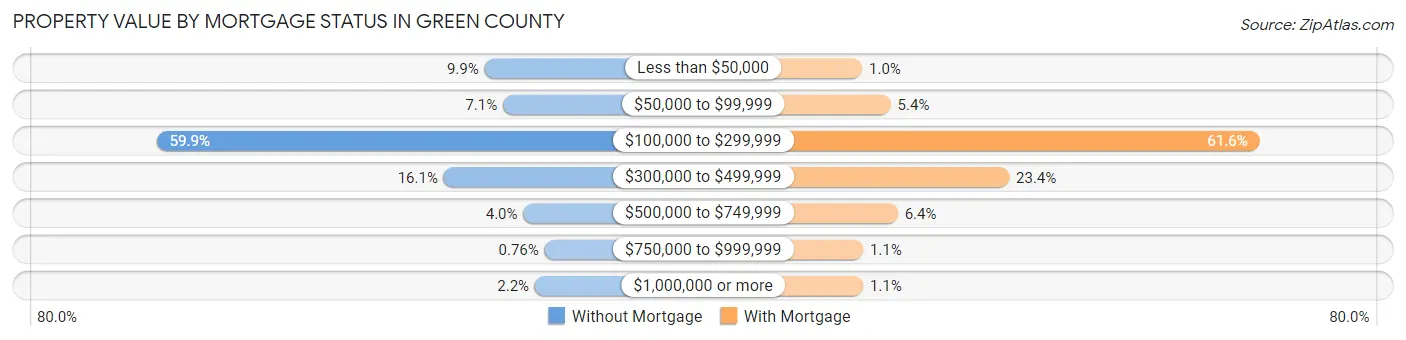
| Property Value | Without Mortgage | With Mortgage |
| Less than $50,000 | 443 (9.9%) | 73 (1.0%) |
| $50,000 to $99,999 | 317 (7.1%) | 390 (5.3%) |
| $100,000 to $299,999 | 2,677 (59.9%) | 4,484 (61.6%) |
| $300,000 to $499,999 | 721 (16.1%) | 1,704 (23.4%) |
| $500,000 to $749,999 | 179 (4.0%) | 468 (6.4%) |
| $750,000 to $999,999 | 34 (0.8%) | 82 (1.1%) |
| $1,000,000 or more | 100 (2.2%) | 82 (1.1%) |
| Total | 4,471 (100.0%) | 7,283 (100.0%) |
Household Income by Mortgage Status in Green County
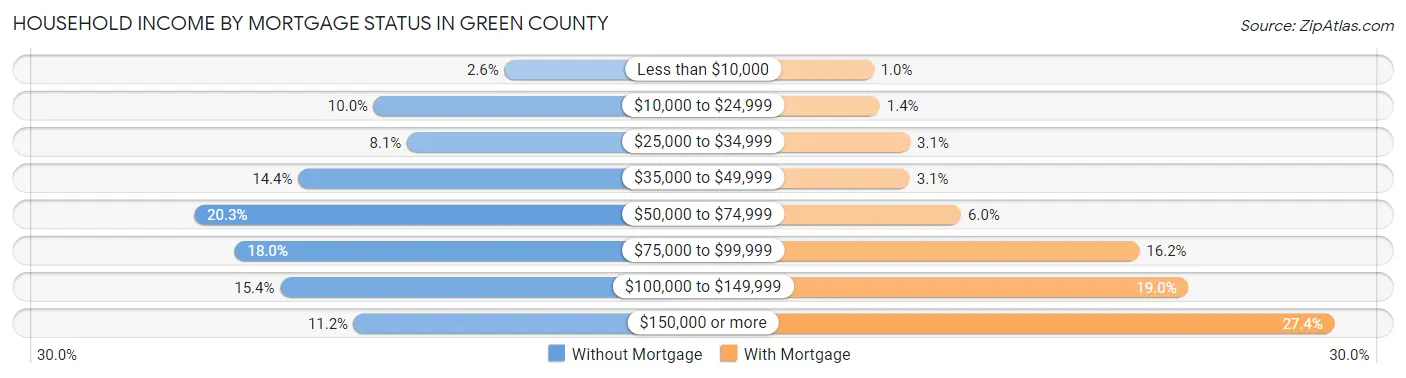
| Household Income | Without Mortgage | With Mortgage |
| Less than $10,000 | 115 (2.6%) | 76 (1.0%) |
| $10,000 to $24,999 | 449 (10.0%) | 101 (1.4%) |
| $25,000 to $34,999 | 364 (8.1%) | 227 (3.1%) |
| $35,000 to $49,999 | 642 (14.4%) | 226 (3.1%) |
| $50,000 to $74,999 | 908 (20.3%) | 439 (6.0%) |
| $75,000 to $99,999 | 805 (18.0%) | 1,181 (16.2%) |
| $100,000 to $149,999 | 688 (15.4%) | 1,386 (19.0%) |
| $150,000 or more | 500 (11.2%) | 1,994 (27.4%) |
| Total | 4,471 (100.0%) | 7,283 (100.0%) |
Property Value to Household Income Ratio in Green County
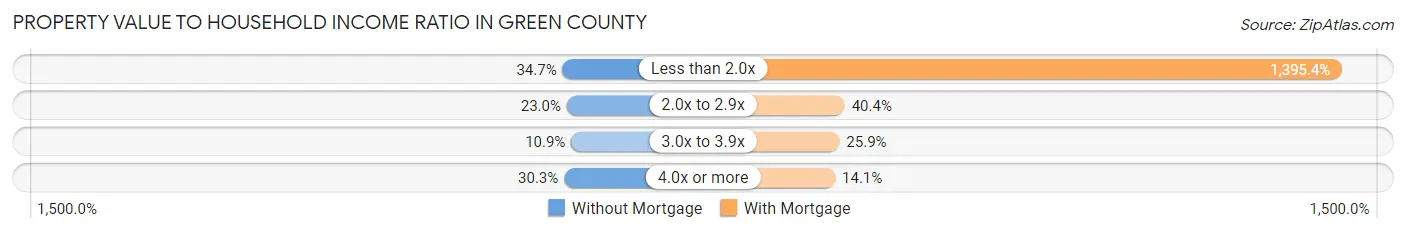
| Value-to-Income Ratio | Without Mortgage | With Mortgage |
| Less than 2.0x | 1,551 (34.7%) | 101,630 (1,395.4%) |
| 2.0x to 2.9x | 1,030 (23.0%) | 2,939 (40.4%) |
| 3.0x to 3.9x | 488 (10.9%) | 1,886 (25.9%) |
| 4.0x or more | 1,354 (30.3%) | 1,030 (14.1%) |
| Total | 4,471 (100.0%) | 7,283 (100.0%) |
Real Estate Taxes by Mortgage Status in Green County
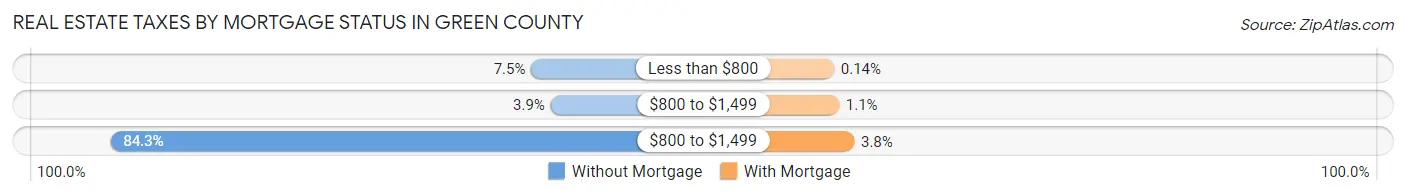
| Property Taxes | Without Mortgage | With Mortgage |
| Less than $800 | 333 (7.4%) | 10 (0.1%) |
| $800 to $1,499 | 175 (3.9%) | 77 (1.1%) |
| $800 to $1,499 | 3,771 (84.3%) | 279 (3.8%) |
| Total | 4,471 (100.0%) | 7,283 (100.0%) |
Health & Disability in Green County
Health Insurance Coverage by Age in Green County

| Age Bracket | With Coverage | Without Coverage |
| Under 6 Years | 2,262 (93.1%) | 168 (6.9%) |
| 6 to 18 Years | 5,867 (97.9%) | 127 (2.1%) |
| 19 to 25 Years | 2,249 (90.6%) | 234 (9.4%) |
| 26 to 34 Years | 3,485 (91.5%) | 325 (8.5%) |
| 35 to 44 Years | 4,239 (94.9%) | 227 (5.1%) |
| 45 to 54 Years | 4,628 (95.0%) | 244 (5.0%) |
| 55 to 64 Years | 5,542 (96.1%) | 227 (3.9%) |
| 65 to 74 Years | 4,248 (99.9%) | 6 (0.1%) |
| 75 Years and older | 2,675 (99.9%) | 2 (0.1%) |
| Total | 35,195 (95.8%) | 1,560 (4.2%) |
Health Insurance Coverage by Citizenship Status in Green County
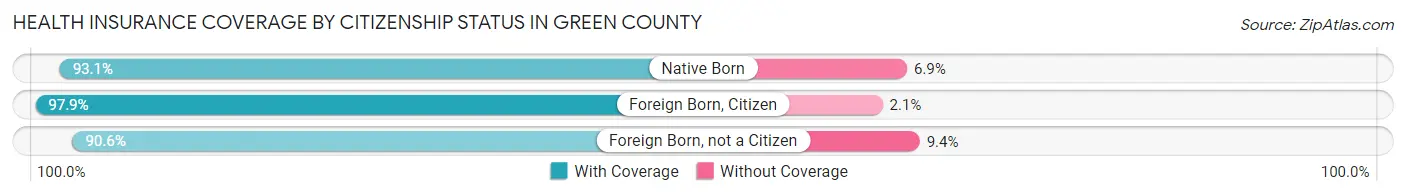
| Citizenship Status | With Coverage | Without Coverage |
| Native Born | 2,262 (93.1%) | 168 (6.9%) |
| Foreign Born, Citizen | 5,867 (97.9%) | 127 (2.1%) |
| Foreign Born, not a Citizen | 2,249 (90.6%) | 234 (9.4%) |
Health Insurance Coverage by Household Income in Green County
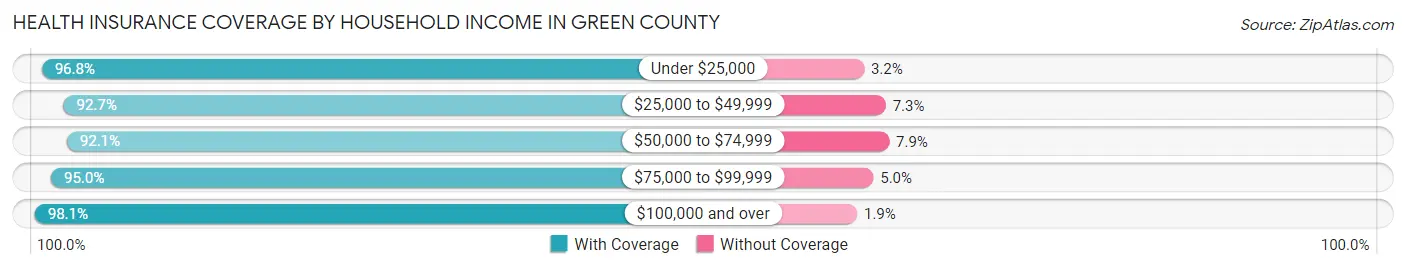
| Household Income | With Coverage | Without Coverage |
| Under $25,000 | 2,529 (96.8%) | 84 (3.2%) |
| $25,000 to $49,999 | 4,483 (92.7%) | 353 (7.3%) |
| $50,000 to $74,999 | 5,350 (92.1%) | 460 (7.9%) |
| $75,000 to $99,999 | 6,643 (95.0%) | 347 (5.0%) |
| $100,000 and over | 16,084 (98.1%) | 315 (1.9%) |
Public vs Private Health Insurance Coverage by Age in Green County
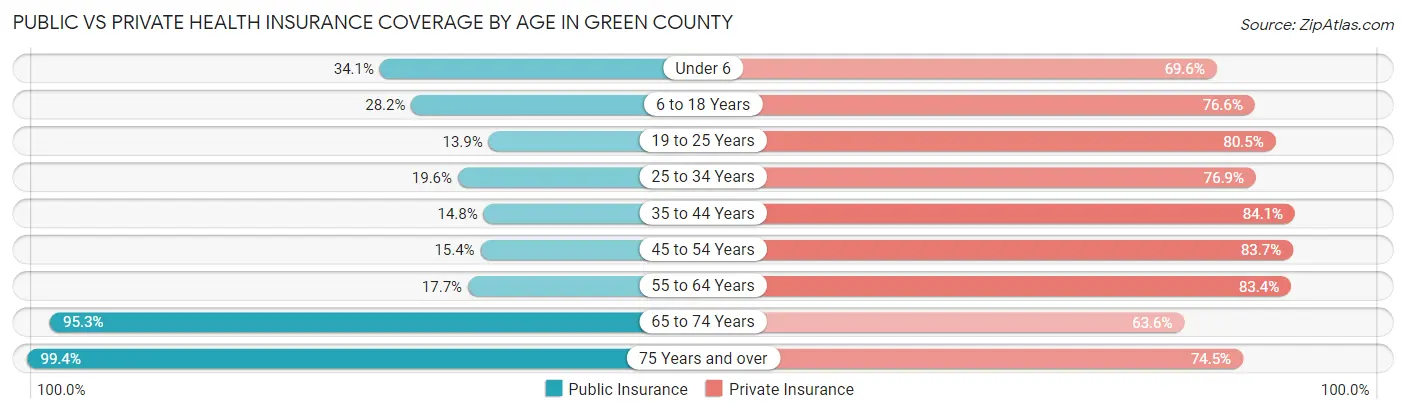
| Age Bracket | Public Insurance | Private Insurance |
| Under 6 | 828 (34.1%) | 1,691 (69.6%) |
| 6 to 18 Years | 1,692 (28.2%) | 4,594 (76.6%) |
| 19 to 25 Years | 345 (13.9%) | 1,999 (80.5%) |
| 25 to 34 Years | 746 (19.6%) | 2,928 (76.8%) |
| 35 to 44 Years | 662 (14.8%) | 3,756 (84.1%) |
| 45 to 54 Years | 750 (15.4%) | 4,080 (83.7%) |
| 55 to 64 Years | 1,022 (17.7%) | 4,810 (83.4%) |
| 65 to 74 Years | 4,052 (95.3%) | 2,704 (63.6%) |
| 75 Years and over | 2,662 (99.4%) | 1,993 (74.5%) |
| Total | 12,759 (34.7%) | 28,555 (77.7%) |
Disability Status by Sex by Age in Green County
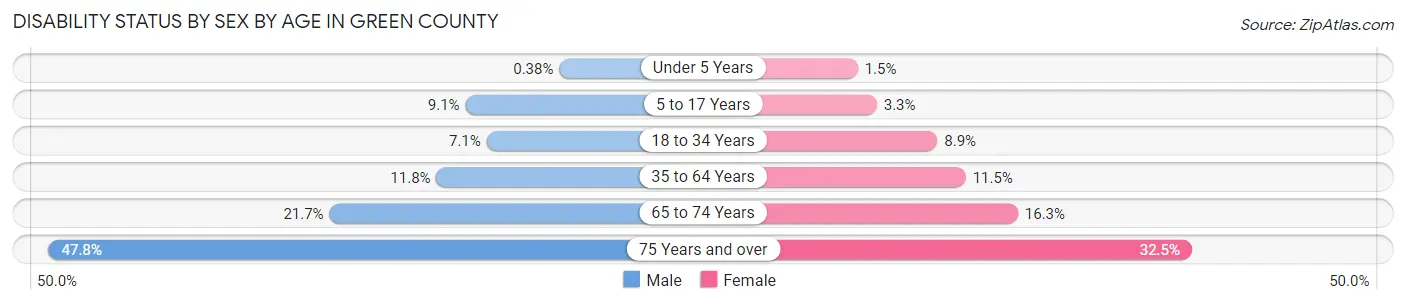
| Age Bracket | Male | Female |
| Under 5 Years | 4 (0.4%) | 13 (1.5%) |
| 5 to 17 Years | 281 (9.1%) | 99 (3.3%) |
| 18 to 34 Years | 238 (7.1%) | 294 (8.9%) |
| 35 to 64 Years | 915 (11.8%) | 844 (11.5%) |
| 65 to 74 Years | 464 (21.7%) | 346 (16.3%) |
| 75 Years and over | 589 (47.8%) | 469 (32.5%) |
Disability Class by Sex by Age in Green County
Disability Class: Hearing Difficulty
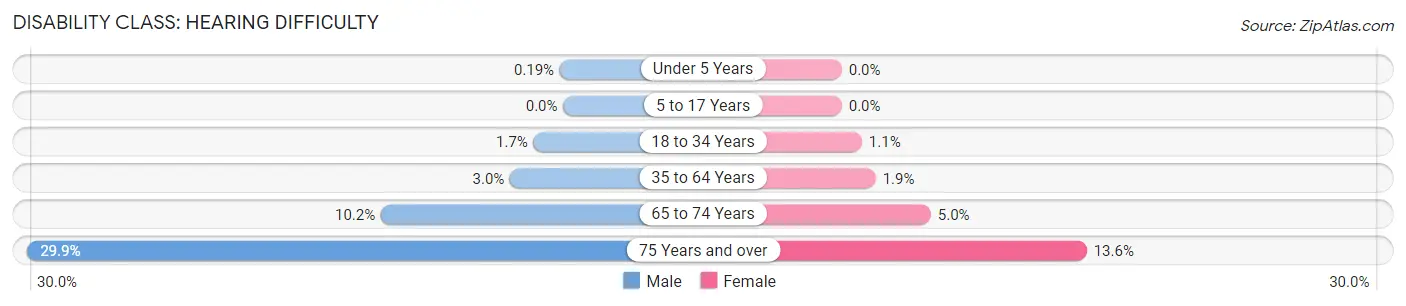
| Age Bracket | Male | Female |
| Under 5 Years | 2 (0.2%) | 0 (0.0%) |
| 5 to 17 Years | 0 (0.0%) | 0 (0.0%) |
| 18 to 34 Years | 55 (1.7%) | 37 (1.1%) |
| 35 to 64 Years | 230 (3.0%) | 139 (1.9%) |
| 65 to 74 Years | 217 (10.2%) | 105 (5.0%) |
| 75 Years and over | 368 (29.8%) | 197 (13.6%) |
Disability Class: Vision Difficulty
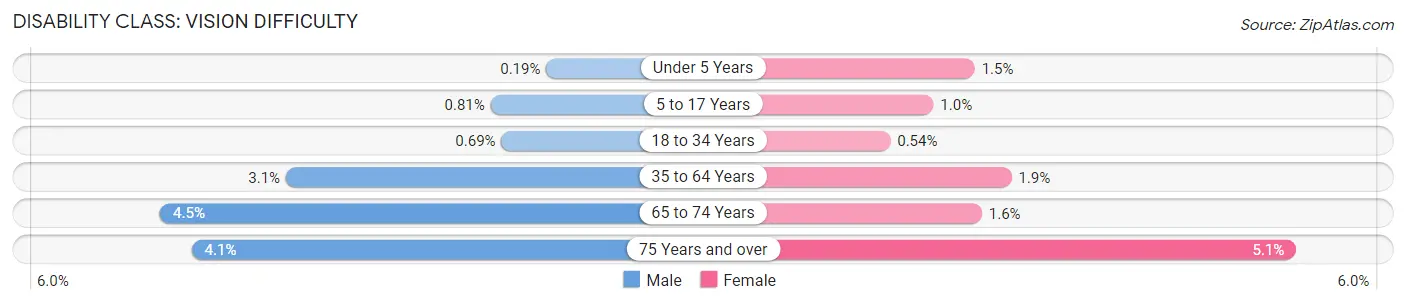
| Age Bracket | Male | Female |
| Under 5 Years | 2 (0.2%) | 13 (1.5%) |
| 5 to 17 Years | 25 (0.8%) | 31 (1.0%) |
| 18 to 34 Years | 23 (0.7%) | 18 (0.5%) |
| 35 to 64 Years | 240 (3.1%) | 139 (1.9%) |
| 65 to 74 Years | 96 (4.5%) | 33 (1.6%) |
| 75 Years and over | 51 (4.1%) | 73 (5.1%) |
Disability Class: Cognitive Difficulty
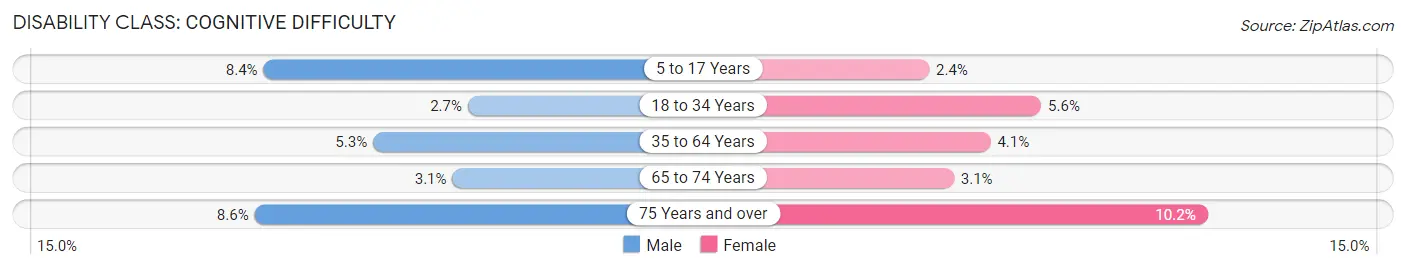
| Age Bracket | Male | Female |
| 5 to 17 Years | 258 (8.4%) | 74 (2.4%) |
| 18 to 34 Years | 89 (2.7%) | 184 (5.6%) |
| 35 to 64 Years | 412 (5.3%) | 304 (4.1%) |
| 65 to 74 Years | 66 (3.1%) | 66 (3.1%) |
| 75 Years and over | 106 (8.6%) | 147 (10.2%) |
Disability Class: Ambulatory Difficulty
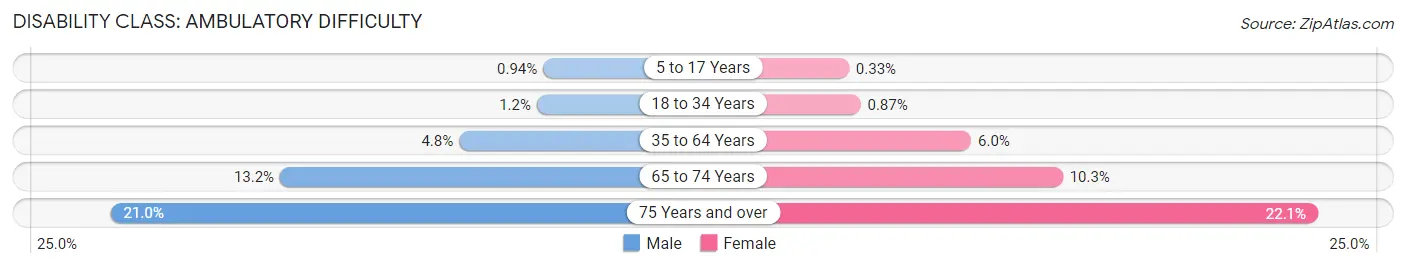
| Age Bracket | Male | Female |
| 5 to 17 Years | 29 (0.9%) | 10 (0.3%) |
| 18 to 34 Years | 41 (1.2%) | 29 (0.9%) |
| 35 to 64 Years | 376 (4.8%) | 440 (6.0%) |
| 65 to 74 Years | 281 (13.2%) | 217 (10.2%) |
| 75 Years and over | 259 (21.0%) | 319 (22.1%) |
Disability Class: Self-Care Difficulty
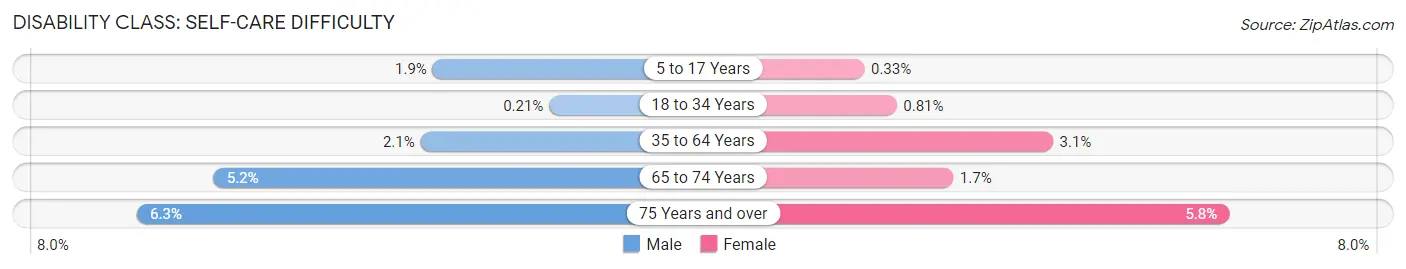
| Age Bracket | Male | Female |
| 5 to 17 Years | 60 (1.9%) | 10 (0.3%) |
| 18 to 34 Years | 7 (0.2%) | 27 (0.8%) |
| 35 to 64 Years | 165 (2.1%) | 230 (3.1%) |
| 65 to 74 Years | 111 (5.2%) | 35 (1.7%) |
| 75 Years and over | 78 (6.3%) | 83 (5.8%) |
Technology Access in Green County
Computing Device Access in Green County
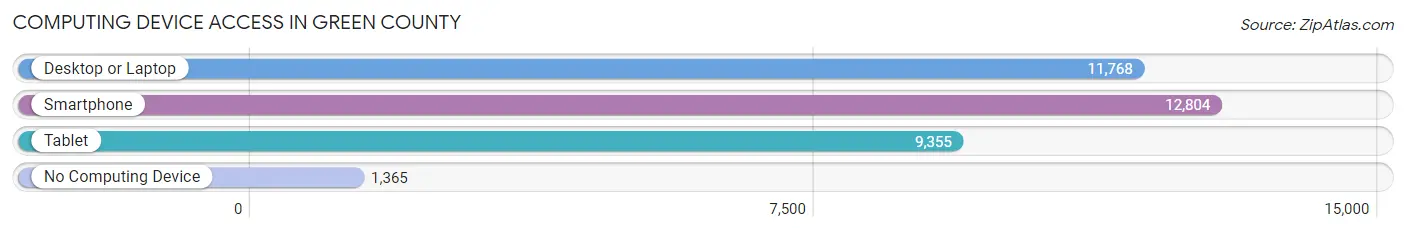
| Device Type | # Households | % Households |
| Desktop or Laptop | 11,768 | 75.5% |
| Smartphone | 12,804 | 82.1% |
| Tablet | 9,355 | 60.0% |
| No Computing Device | 1,365 | 8.7% |
| Total | 15,594 | 100.0% |
Internet Access in Green County
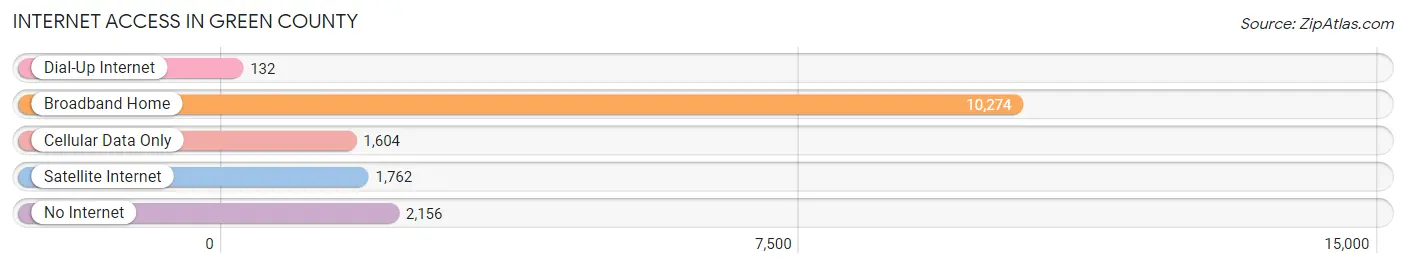
| Internet Type | # Households | % Households |
| Dial-Up Internet | 132 | 0.9% |
| Broadband Home | 10,274 | 65.9% |
| Cellular Data Only | 1,604 | 10.3% |
| Satellite Internet | 1,762 | 11.3% |
| No Internet | 2,156 | 13.8% |
| Total | 15,594 | 100.0% |
Green County Summary
Green County is located in the south-central part of Wisconsin, and is part of the Madison Metropolitan Statistical Area. The county was established in 1836 and is named after Nathanael Greene, a major general in the American Revolutionary War. As of the 2010 census, the population was 36,842. The county seat is Monroe.
Geography
Green County is located in the south-central part of Wisconsin, and is part of the Madison Metropolitan Statistical Area. The county is bordered by Rock County to the north, Dane County to the east, Iowa County to the south, and Lafayette County to the west. The county has a total area of 545 square miles, of which 543 square miles is land and 2.2 square miles is water. The highest point in the county is located in the Town of Cadiz, at 1,541 feet above sea level.
The county is home to several rivers and streams, including the Pecatonica River, Sugar River, and Badfish Creek. The county is also home to several lakes, including Lake Koshkonong, Lake Leota, and Lake Belle View.
Economy
Green County is home to a diverse economy, with a mix of manufacturing, agriculture, and tourism. The county is home to several large employers, including the Monroe Clinic, the Monroe School District, and the University of Wisconsin-Platteville.
Agriculture is a major part of the county’s economy, with dairy farming being the primary agricultural activity. Other agricultural activities include beef and poultry production, as well as fruit and vegetable production.
Manufacturing is also a major part of the county’s economy, with several large companies located in the county. These companies include the Monroe Truck Equipment Company, the Monroe Bearing Company, and the Monroe Tool and Die Company.
Tourism is also an important part of the county’s economy, with several popular attractions located in the county. These attractions include the Monroe County Historical Society Museum, the Green County Fairgrounds, and the Sugar River State Trail.
Demographics
As of the 2010 census, the population of Green County was 36,842. The racial makeup of the county was 95.3% White, 0.7% Black or African American, 0.3% Native American, 0.7% Asian, 0.1% Pacific Islander, 1.7% from other races, and 1.1% from two or more races. Hispanic or Latino of any race were 3.7% of the population.
The median income for a household in the county was $50,945, and the median income for a family was $60,945. The per capita income for the county was $24,845. About 6.2% of families and 8.7% of the population were below the poverty line, including 10.2% of those under age 18 and 6.7% of those age 65 or over.
Conclusion
Green County is a diverse county located in the south-central part of Wisconsin. The county is home to a mix of manufacturing, agriculture, and tourism, and is home to several large employers. The population of the county is 36,842, and the median income for a household is $50,945. Green County is a great place to live, work, and visit, and is a great example of the diversity of Wisconsin.
Common Questions
What is the Total Population of Green County?
Total Population of Green County is 37,066.
What is the Total Male Population of Green County?
Total Male Population of Green County is 18,682.
What is the Total Female Population of Green County?
Total Female Population of Green County is 18,384.
What is the Ratio of Males per 100 Females in Green County?
There are 101.62 Males per 100 Females in Green County.
What is the Ratio of Females per 100 Males in Green County?
There are 98.40 Females per 100 Males in Green County.
What is the Median Population Age in Green County?
Median Population Age in Green County is 43.0 Years.
What is the Average Family Size in Green County
Average Family Size in Green County is 2.9 People.
What is the Average Household Size in Green County
Average Household Size in Green County is 2.4 People.
What is Per Capita Income in Green County?
Per Capita income in Green County is $40,954.
What is the Median Family Income in Green County?
Median Family Income in Green County is $92,300.
What is the Median Household income in Green County?
Median Household Income in Green County is $76,080.
What is Income or Wage Gap in Green County?
Income or Wage Gap in Green County is 31.8%.
Women in Green County earn 68.2 cents for every dollar earned by a man.
What is Family Income Deficit in Green County?
Family Income Deficit in Green County is $10,021.
Families that are below poverty line in Green County earn $10,021 less on average than the poverty threshold level.
What is Inequality or Gini Index in Green County?
Inequality or Gini Index in Green County is 0.41.
How Large is the Labor Force in Green County?
There are 20,441 People in the Labor Forcein in Green County.
What is the Percentage of People in the Labor Force in Green County?
68.0% of People are in the Labor Force in Green County.
What is the Unemployment Rate in Green County?
Unemployment Rate in Green County is 3.4%.