Grant County, WI
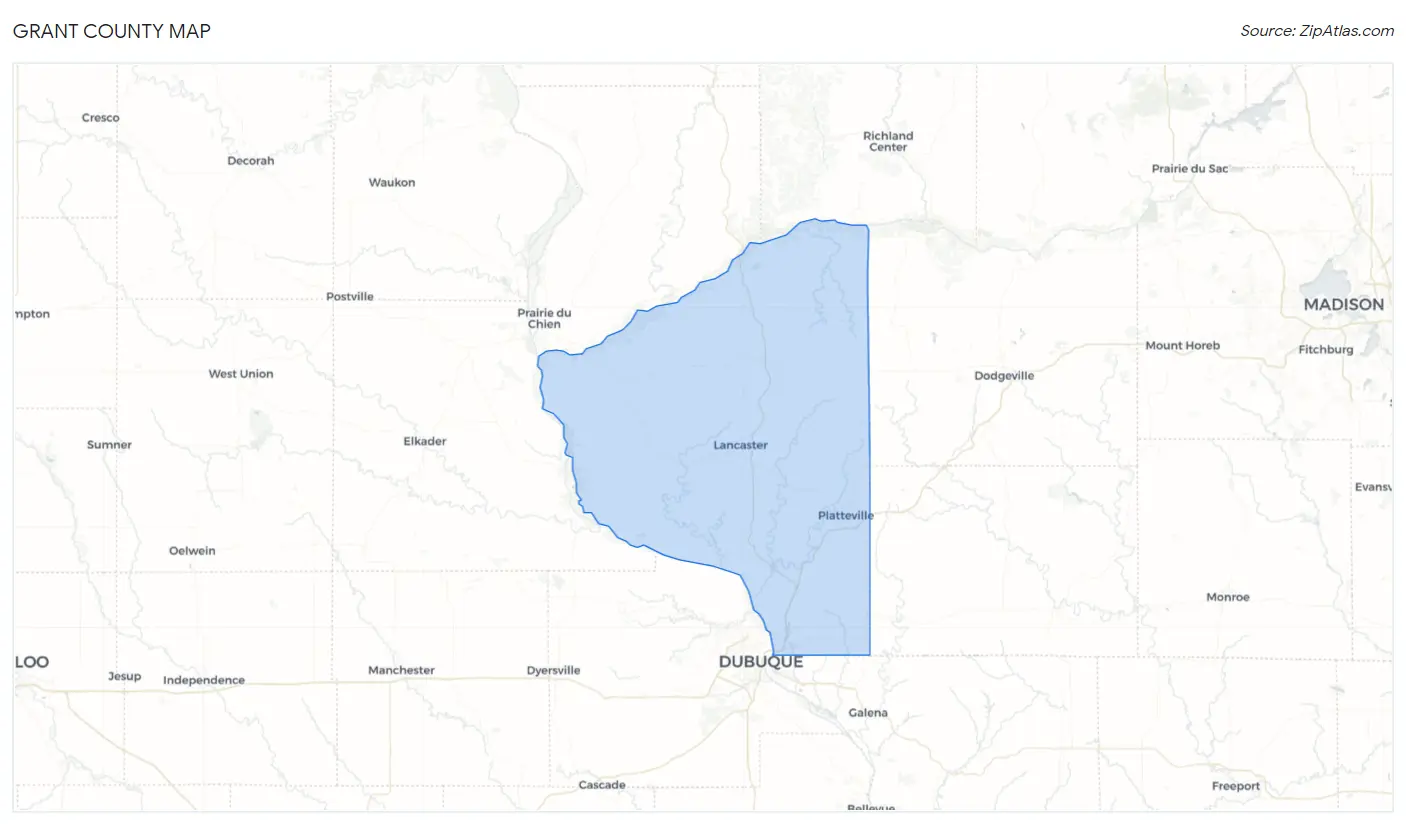
Grant County Map
Grant County Overview
51,842
TOTAL POPULATION
26,948
MALE POPULATION
24,894
FEMALE POPULATION
108.25
MALES / 100 FEMALES
92.38
FEMALES / 100 MALES
36.8
MEDIAN AGE
3.0
AVG FAMILY SIZE
2.4
AVG HOUSEHOLD SIZE
$32,097
PER CAPITA INCOME
$83,145
AVG FAMILY INCOME
$63,497
AVG HOUSEHOLD INCOME
20.1%
WAGE / INCOME GAP [ % ]
79.9¢/ $1
WAGE / INCOME GAP [ $ ]
$11,844
FAMILY INCOME DEFICIT
0.43
INEQUALITY / GINI INDEX
27,033
LABOR FORCE [ PEOPLE ]
64.0%
PERCENT IN LABOR FORCE
3.1%
UNEMPLOYMENT RATE
Grant County Area Codes
Race in Grant County
The most populous races in Grant County are White / Caucasian (49,279 | 95.1%), Hispanic or Latino (1,028 | 2.0%), and Two or more Races (951 | 1.8%).
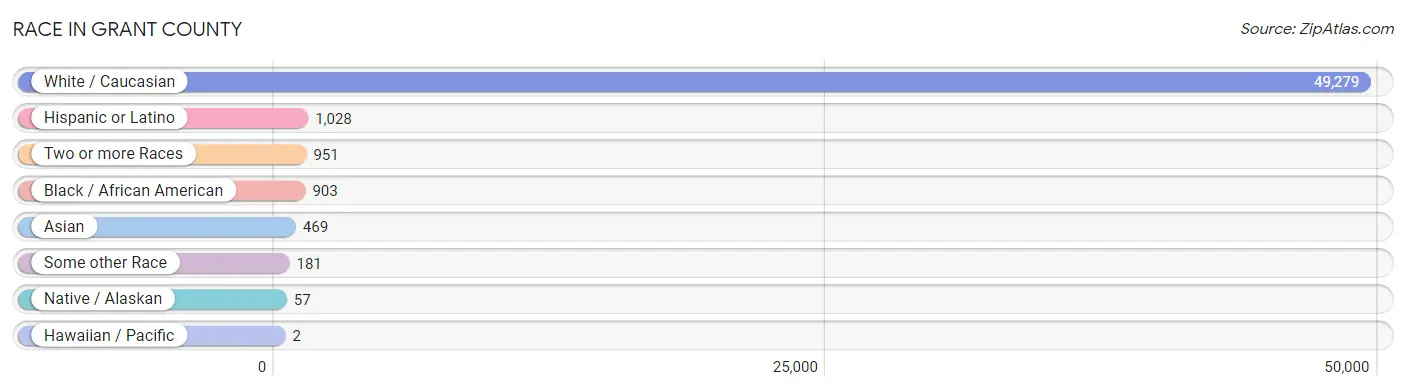
| Race | # Population | % Population |
| Asian | 469 | 0.9% |
| Black / African American | 903 | 1.7% |
| Hawaiian / Pacific | 2 | 0.0% |
| Hispanic or Latino | 1,028 | 2.0% |
| Native / Alaskan | 57 | 0.1% |
| White / Caucasian | 49,279 | 95.1% |
| Two or more Races | 951 | 1.8% |
| Some other Race | 181 | 0.4% |
| Total | 51,842 | 100.0% |
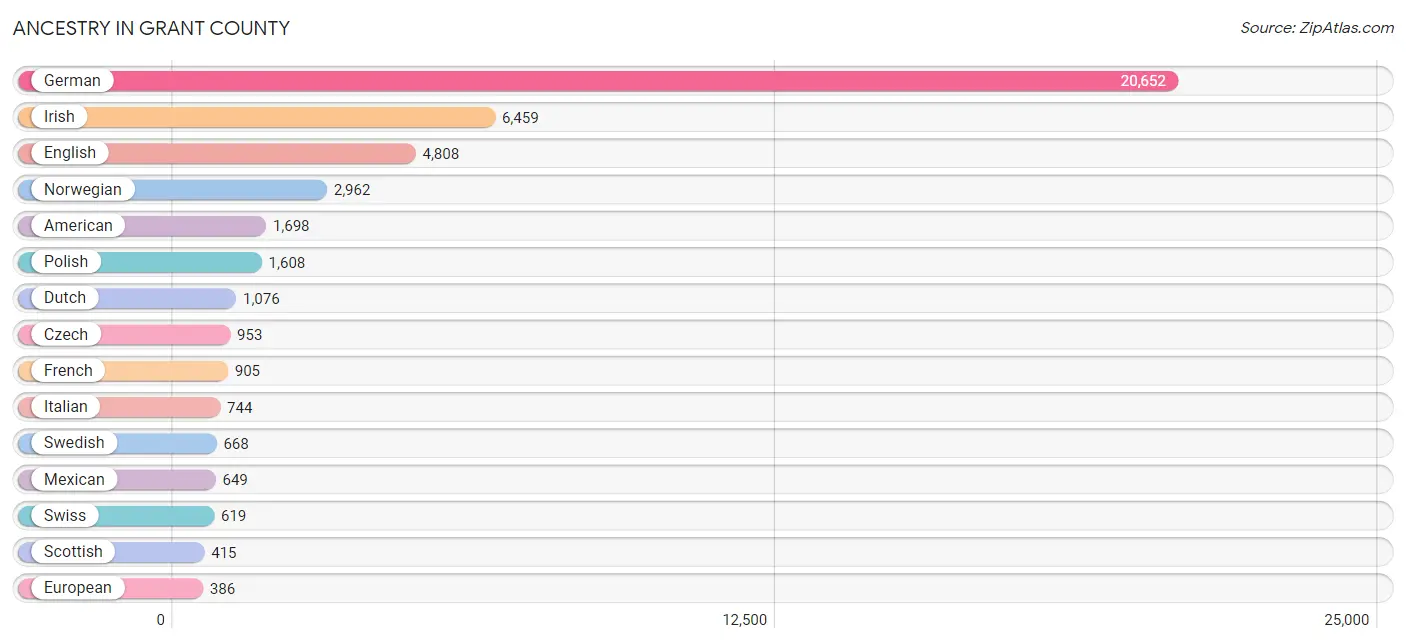
Ancestry in Grant County
The most populous ancestries reported in Grant County are German (20,652 | 39.8%), Irish (6,459 | 12.5%), English (4,808 | 9.3%), Norwegian (2,962 | 5.7%), and American (1,698 | 3.3%), together accounting for 70.6% of all Grant County residents.
| Ancestry | # Population | % Population |
| African | 86 | 0.2% |
| American | 1,698 | 3.3% |
| Arab | 74 | 0.1% |
| Australian | 1 | 0.0% |
| Austrian | 25 | 0.1% |
| Bangladeshi | 22 | 0.0% |
| Barbadian | 2 | 0.0% |
| Belgian | 53 | 0.1% |
| Bhutanese | 26 | 0.1% |
| Blackfeet | 34 | 0.1% |
| Brazilian | 51 | 0.1% |
| British | 66 | 0.1% |
| Bulgarian | 12 | 0.0% |
| Burmese | 49 | 0.1% |
| Canadian | 8 | 0.0% |
| Central American | 115 | 0.2% |
| Cherokee | 53 | 0.1% |
| Chippewa | 38 | 0.1% |
| Costa Rican | 8 | 0.0% |
| Croatian | 12 | 0.0% |
| Cuban | 66 | 0.1% |
| Czech | 953 | 1.8% |
| Czechoslovakian | 37 | 0.1% |
| Danish | 251 | 0.5% |
| Dominican | 2 | 0.0% |
| Dutch | 1,076 | 2.1% |
| Eastern European | 53 | 0.1% |
| Ecuadorian | 9 | 0.0% |
| English | 4,808 | 9.3% |
| European | 386 | 0.7% |
| Filipino | 24 | 0.1% |
| Finnish | 200 | 0.4% |
| French | 905 | 1.8% |
| French Canadian | 185 | 0.4% |
| German | 20,652 | 39.8% |
| Greek | 54 | 0.1% |
| Guatemalan | 14 | 0.0% |
| Haitian | 1 | 0.0% |
| Honduran | 26 | 0.1% |
| Hungarian | 74 | 0.1% |
| Icelander | 27 | 0.1% |
| Indian (Asian) | 142 | 0.3% |
| Inupiat | 7 | 0.0% |
| Irish | 6,459 | 12.5% |
| Iroquois | 34 | 0.1% |
| Italian | 744 | 1.4% |
| Jamaican | 24 | 0.1% |
| Korean | 90 | 0.2% |
| Laotian | 28 | 0.1% |
| Latvian | 12 | 0.0% |
| Lebanese | 66 | 0.1% |
| Lithuanian | 42 | 0.1% |
| Luxembourger | 62 | 0.1% |
| Menominee | 7 | 0.0% |
| Mexican | 649 | 1.3% |
| Mexican American Indian | 13 | 0.0% |
| Moroccan | 3 | 0.0% |
| Native Hawaiian | 2 | 0.0% |
| Nicaraguan | 54 | 0.1% |
| Nigerian | 16 | 0.0% |
| Northern European | 74 | 0.1% |
| Norwegian | 2,962 | 5.7% |
| Pakistani | 24 | 0.1% |
| Panamanian | 6 | 0.0% |
| Pennsylvania German | 344 | 0.7% |
| Peruvian | 17 | 0.0% |
| Polish | 1,608 | 3.1% |
| Portuguese | 23 | 0.0% |
| Puerto Rican | 64 | 0.1% |
| Romanian | 16 | 0.0% |
| Russian | 96 | 0.2% |
| Salvadoran | 7 | 0.0% |
| Samoan | 10 | 0.0% |
| Scandinavian | 111 | 0.2% |
| Scotch-Irish | 210 | 0.4% |
| Scottish | 415 | 0.8% |
| Serbian | 15 | 0.0% |
| Sioux | 3 | 0.0% |
| Slavic | 2 | 0.0% |
| Slovak | 7 | 0.0% |
| Slovene | 30 | 0.1% |
| South American | 26 | 0.1% |
| Spaniard | 10 | 0.0% |
| Spanish | 52 | 0.1% |
| Subsaharan African | 88 | 0.2% |
| Swedish | 668 | 1.3% |
| Swiss | 619 | 1.2% |
| Syrian | 5 | 0.0% |
| Thai | 93 | 0.2% |
| Tongan | 10 | 0.0% |
| Ukrainian | 13 | 0.0% |
| Vietnamese | 105 | 0.2% |
| Welsh | 253 | 0.5% |
| Yugoslavian | 2 | 0.0% | View All 94 Rows |
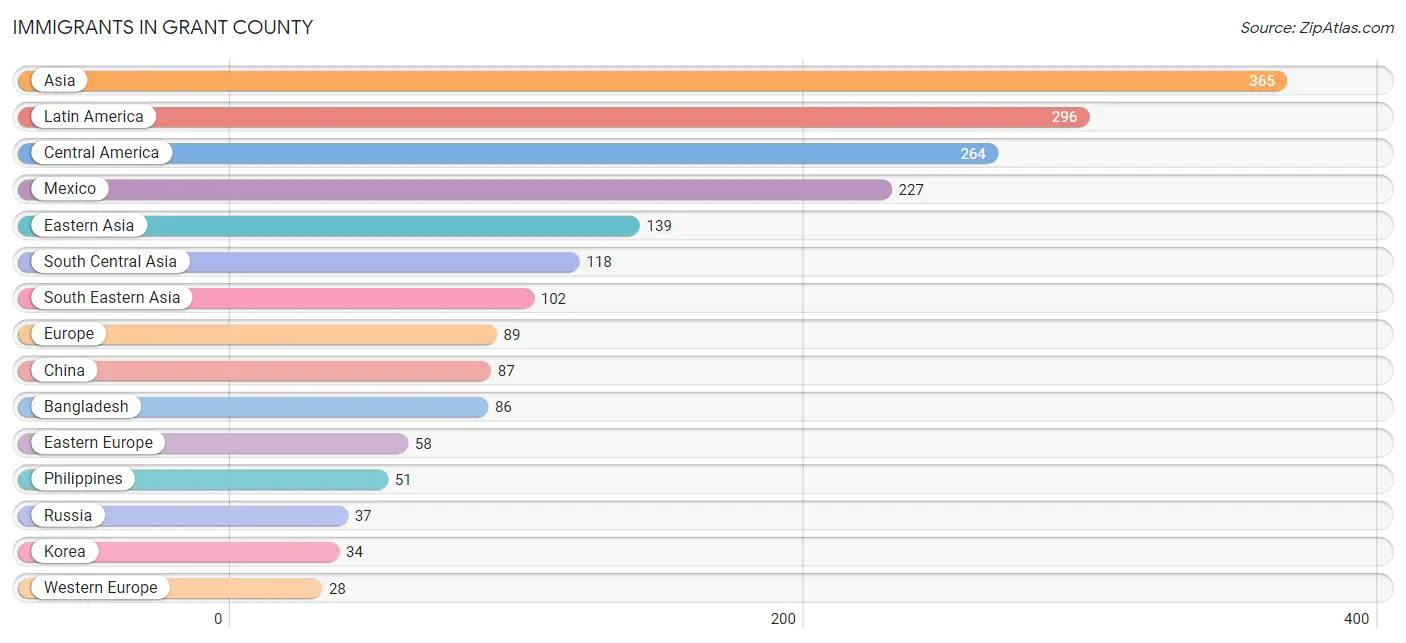
Immigrants in Grant County
The most numerous immigrant groups reported in Grant County came from Asia (365 | 0.7%), Latin America (296 | 0.6%), Central America (264 | 0.5%), Mexico (227 | 0.4%), and Eastern Asia (139 | 0.3%), together accounting for 2.5% of all Grant County residents.
| Immigration Origin | # Population | % Population |
| Africa | 27 | 0.1% |
| Armenia | 2 | 0.0% |
| Asia | 365 | 0.7% |
| Australia | 1 | 0.0% |
| Bangladesh | 86 | 0.2% |
| Barbados | 2 | 0.0% |
| Brazil | 10 | 0.0% |
| Canada | 13 | 0.0% |
| Caribbean | 5 | 0.0% |
| Central America | 264 | 0.5% |
| China | 87 | 0.2% |
| Costa Rica | 8 | 0.0% |
| Cuba | 3 | 0.0% |
| Eastern Asia | 139 | 0.3% |
| Eastern Europe | 58 | 0.1% |
| El Salvador | 2 | 0.0% |
| Europe | 89 | 0.2% |
| Germany | 24 | 0.1% |
| Guatemala | 3 | 0.0% |
| Hungary | 2 | 0.0% |
| India | 9 | 0.0% |
| Indonesia | 16 | 0.0% |
| Ireland | 1 | 0.0% |
| Japan | 18 | 0.0% |
| Korea | 34 | 0.1% |
| Laos | 10 | 0.0% |
| Latin America | 296 | 0.6% |
| Latvia | 9 | 0.0% |
| Lebanon | 4 | 0.0% |
| Mexico | 227 | 0.4% |
| Morocco | 3 | 0.0% |
| Netherlands | 4 | 0.0% |
| Nicaragua | 24 | 0.1% |
| Nigeria | 16 | 0.0% |
| Northern Africa | 3 | 0.0% |
| Northern Europe | 3 | 0.0% |
| Oceania | 3 | 0.0% |
| Pakistan | 23 | 0.0% |
| Peru | 17 | 0.0% |
| Philippines | 51 | 0.1% |
| Poland | 2 | 0.0% |
| Romania | 4 | 0.0% |
| Russia | 37 | 0.1% |
| Serbia | 4 | 0.0% |
| South America | 27 | 0.1% |
| South Central Asia | 118 | 0.2% |
| South Eastern Asia | 102 | 0.2% |
| Taiwan | 12 | 0.0% |
| Thailand | 25 | 0.1% |
| Western Africa | 16 | 0.0% |
| Western Asia | 6 | 0.0% |
| Western Europe | 28 | 0.1% | View All 52 Rows |
Sex and Age in Grant County
Sex and Age in Grant County
The most populous age groups in Grant County are 20 to 24 Years (3,317 | 12.3%) for men and 20 to 24 Years (2,422 | 9.7%) for women.
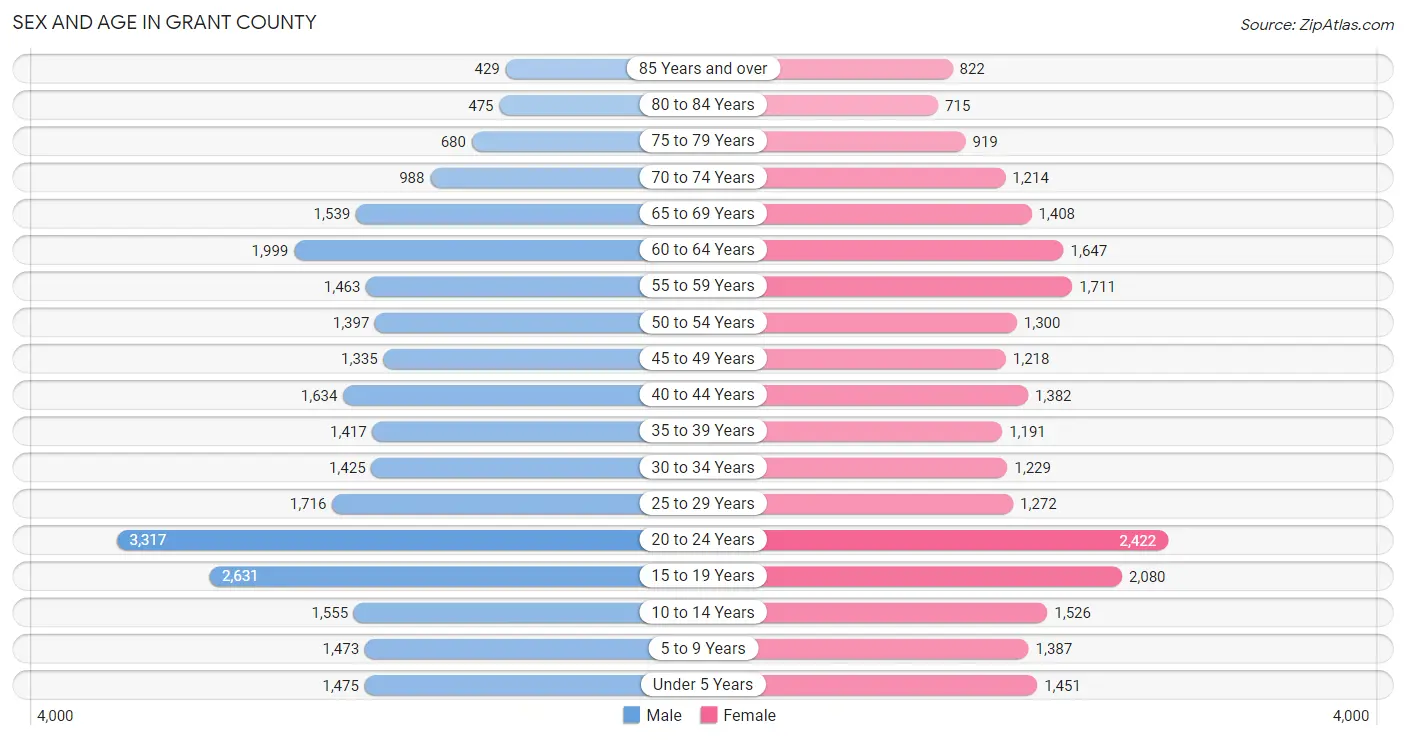
| Age Bracket | Male | Female |
| Under 5 Years | 1,475 (5.5%) | 1,451 (5.8%) |
| 5 to 9 Years | 1,473 (5.5%) | 1,387 (5.6%) |
| 10 to 14 Years | 1,555 (5.8%) | 1,526 (6.1%) |
| 15 to 19 Years | 2,631 (9.8%) | 2,080 (8.4%) |
| 20 to 24 Years | 3,317 (12.3%) | 2,422 (9.7%) |
| 25 to 29 Years | 1,716 (6.4%) | 1,272 (5.1%) |
| 30 to 34 Years | 1,425 (5.3%) | 1,229 (4.9%) |
| 35 to 39 Years | 1,417 (5.3%) | 1,191 (4.8%) |
| 40 to 44 Years | 1,634 (6.1%) | 1,382 (5.6%) |
| 45 to 49 Years | 1,335 (5.0%) | 1,218 (4.9%) |
| 50 to 54 Years | 1,397 (5.2%) | 1,300 (5.2%) |
| 55 to 59 Years | 1,463 (5.4%) | 1,711 (6.9%) |
| 60 to 64 Years | 1,999 (7.4%) | 1,647 (6.6%) |
| 65 to 69 Years | 1,539 (5.7%) | 1,408 (5.7%) |
| 70 to 74 Years | 988 (3.7%) | 1,214 (4.9%) |
| 75 to 79 Years | 680 (2.5%) | 919 (3.7%) |
| 80 to 84 Years | 475 (1.8%) | 715 (2.9%) |
| 85 Years and over | 429 (1.6%) | 822 (3.3%) |
| Total | 26,948 (100.0%) | 24,894 (100.0%) |
Families and Households in Grant County
Median Family Size in Grant County
The median family size in Grant County is 3.04 persons per family, with married-couple families (9,910 | 82.4%) accounting for the largest median family size of 3.07 persons per family. On the other hand, single male/father families (715 | 5.9%) represent the smallest median family size with 2.70 persons per family.
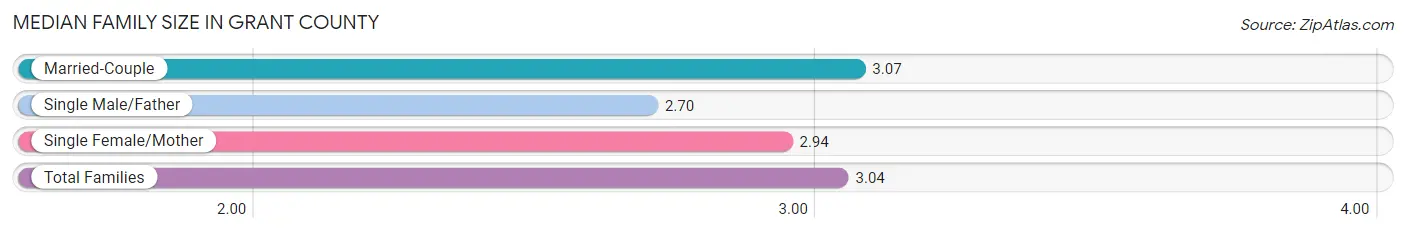
| Family Type | # Families | Family Size |
| Married-Couple | 9,910 (82.4%) | 3.07 |
| Single Male/Father | 715 (5.9%) | 2.70 |
| Single Female/Mother | 1,405 (11.7%) | 2.94 |
| Total Families | 12,030 (100.0%) | 3.04 |
Median Household Size in Grant County
The median household size in Grant County is 2.43 persons per household, with single female/mother households (1,405 | 7.1%) accounting for the largest median household size of 3.31 persons per household. non-family households (7,833 | 39.4%) represent the smallest median household size with 1.37 persons per household.
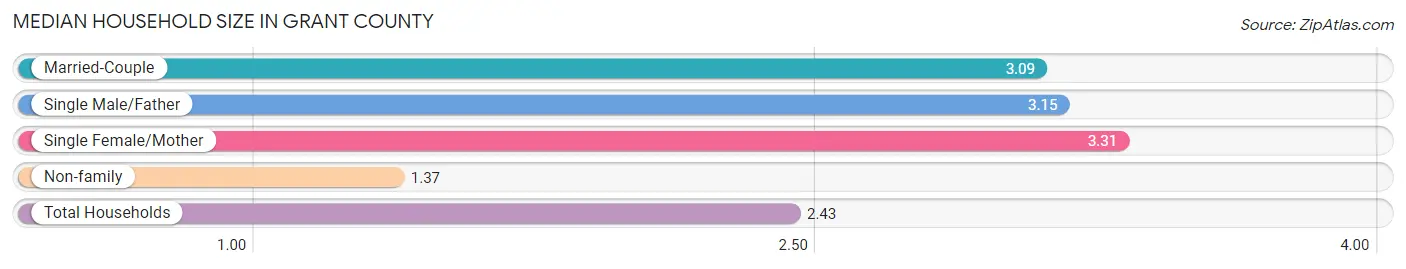
| Household Type | # Households | Household Size |
| Married-Couple | 9,910 (49.9%) | 3.09 |
| Single Male/Father | 715 (3.6%) | 3.15 |
| Single Female/Mother | 1,405 (7.1%) | 3.31 |
| Non-family | 7,833 (39.4%) | 1.37 |
| Total Households | 19,863 (100.0%) | 2.43 |
Household Size by Marriage Status in Grant County
Out of a total of 19,863 households in Grant County, 12,030 (60.6%) are family households, while 7,833 (39.4%) are nonfamily households. The most numerous type of family households are 2-person households, comprising 6,042, and the most common type of nonfamily households are 1-person households, comprising 5,836.
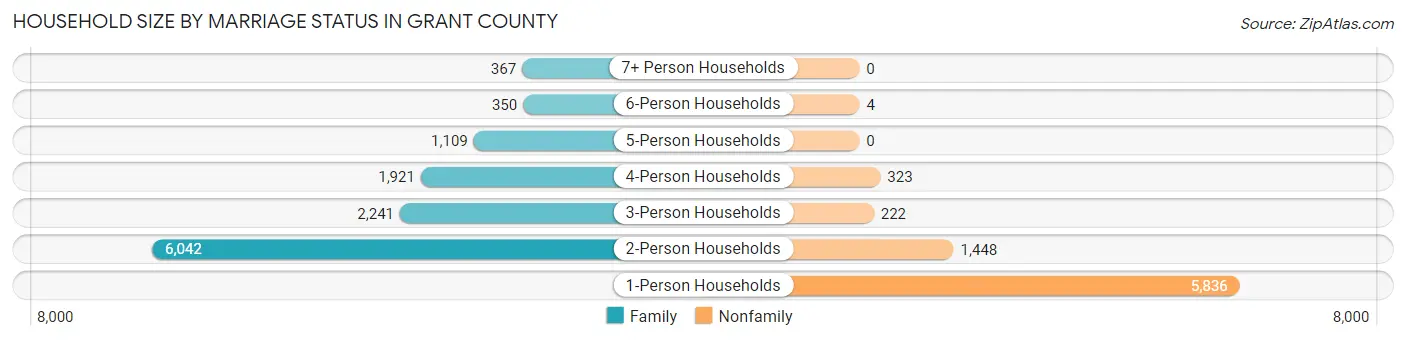
| Household Size | Family Households | Nonfamily Households |
| 1-Person Households | - | 5,836 (29.4%) |
| 2-Person Households | 6,042 (30.4%) | 1,448 (7.3%) |
| 3-Person Households | 2,241 (11.3%) | 222 (1.1%) |
| 4-Person Households | 1,921 (9.7%) | 323 (1.6%) |
| 5-Person Households | 1,109 (5.6%) | 0 (0.0%) |
| 6-Person Households | 350 (1.8%) | 4 (0.0%) |
| 7+ Person Households | 367 (1.8%) | 0 (0.0%) |
| Total | 12,030 (60.6%) | 7,833 (39.4%) |
Female Fertility in Grant County
Fertility by Age in Grant County
Average fertility rate in Grant County is 60.0 births per 1,000 women. Women in the age bracket of 20 to 34 years have the highest fertility rate with 106.0 births per 1,000 women. Women in the age bracket of 20 to 34 years acount for 79.4% of all women with births.
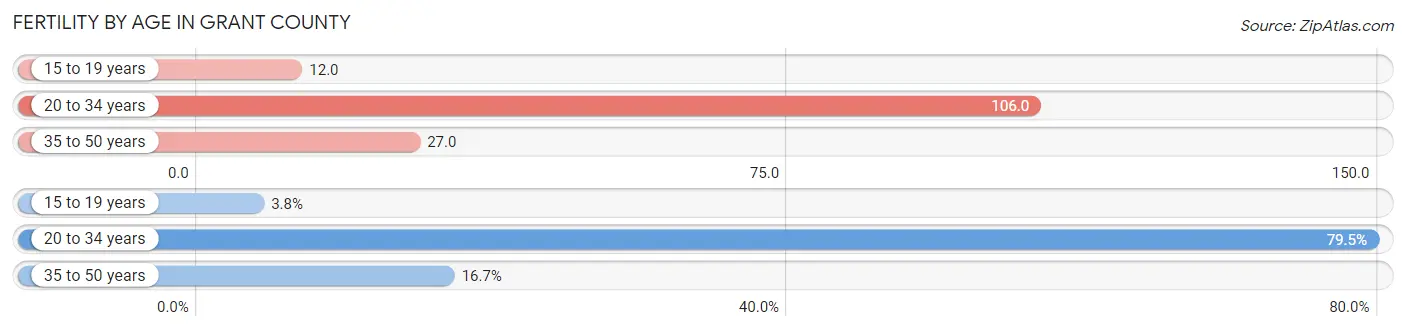
| Age Bracket | Women with Births | Births / 1,000 Women |
| 15 to 19 years | 25 (3.8%) | 12.0 |
| 20 to 34 years | 522 (79.4%) | 106.0 |
| 35 to 50 years | 110 (16.7%) | 27.0 |
| Total | 657 (100.0%) | 60.0 |
Fertility by Age by Marriage Status in Grant County
79.8% of women with births (657) in Grant County are married. The highest percentage of unmarried women with births falls into 15 to 19 years age bracket with 100.0% of them unmarried at the time of birth, while the lowest percentage of unmarried women with births belong to 35 to 50 years age bracket with 7.3% of them unmarried.
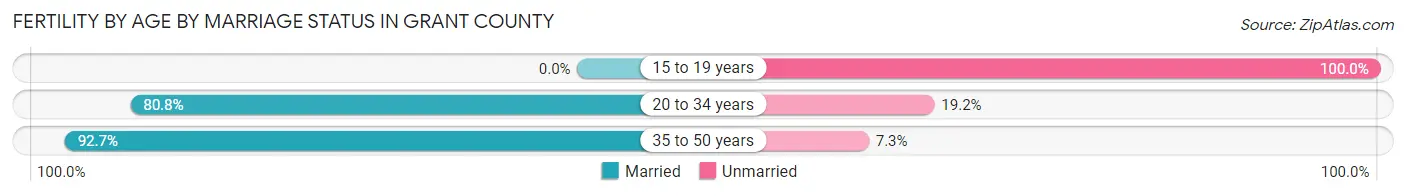
| Age Bracket | Married | Unmarried |
| 15 to 19 years | 0 (0.0%) | 25 (100.0%) |
| 20 to 34 years | 422 (80.8%) | 100 (19.2%) |
| 35 to 50 years | 102 (92.7%) | 8 (7.3%) |
| Total | 524 (79.8%) | 133 (20.2%) |
Fertility by Education in Grant County
Average fertility rate in Grant County is 60.0 births per 1,000 women. Women with the education attainment of graduate degree have the highest fertility rate of 97.0 births per 1,000 women, while women with the education attainment of college or associate's degree have the lowest fertility at 30.0 births per 1,000 women. Women with the education attainment of bachelor's degree represent 26.3% of all women with births.
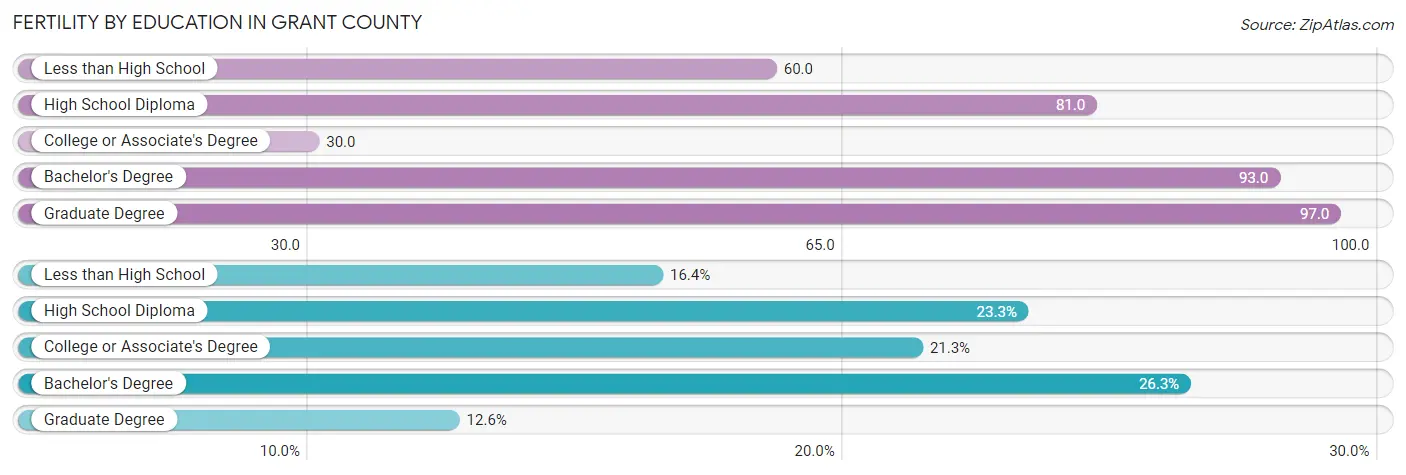
| Educational Attainment | Women with Births | Births / 1,000 Women |
| Less than High School | 108 (16.4%) | 60.0 |
| High School Diploma | 153 (23.3%) | 81.0 |
| College or Associate's Degree | 140 (21.3%) | 30.0 |
| Bachelor's Degree | 173 (26.3%) | 93.0 |
| Graduate Degree | 83 (12.6%) | 97.0 |
| Total | 657 (100.0%) | 60.0 |
Fertility by Education by Marriage Status in Grant County
20.2% of women with births in Grant County are unmarried. Women with the educational attainment of less than high school are most likely to be married with 100.0% of them married at childbirth, while women with the educational attainment of high school diploma are least likely to be married with 49.0% of them unmarried at childbirth.
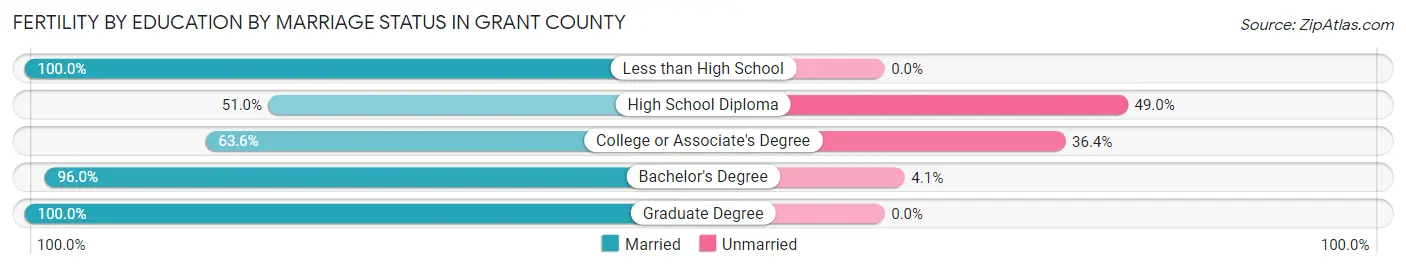
| Educational Attainment | Married | Unmarried |
| Less than High School | 108 (100.0%) | 0 (0.0%) |
| High School Diploma | 78 (51.0%) | 75 (49.0%) |
| College or Associate's Degree | 89 (63.6%) | 51 (36.4%) |
| Bachelor's Degree | 166 (96.0%) | 7 (4.1%) |
| Graduate Degree | 83 (100.0%) | 0 (0.0%) |
| Total | 524 (79.8%) | 133 (20.2%) |
Income in Grant County
Income Overview in Grant County
Per Capita Income in Grant County is $32,097, while median incomes of families and households are $83,145 and $63,497 respectively.
| Characteristic | Number | Measure |
| Per Capita Income | 51,842 | $32,097 |
| Median Family Income | 12,030 | $83,145 |
| Mean Family Income | 12,030 | $99,123 |
| Median Household Income | 19,863 | $63,497 |
| Mean Household Income | 19,863 | $81,183 |
| Income Deficit | 12,030 | $11,844 |
| Wage / Income Gap (%) | 51,842 | 20.05% |
| Wage / Income Gap ($) | 51,842 | 79.95¢ per $1 |
| Gini / Inequality Index | 51,842 | 0.43 |
Earnings by Sex in Grant County
Average Earnings in Grant County are $33,733, $37,681 for men and $30,125 for women, a difference of 20.1%.
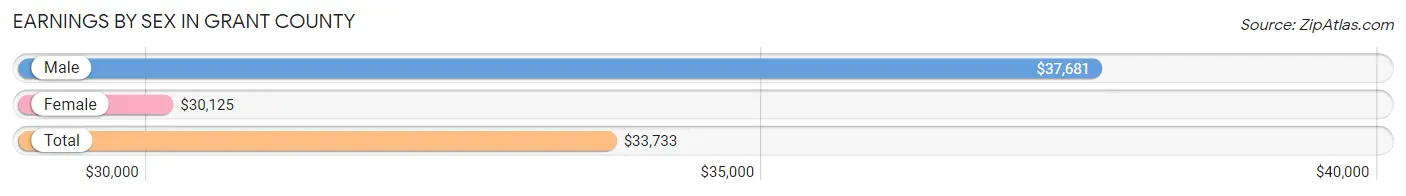
| Sex | Number | Average Earnings |
| Male | 16,403 (55.2%) | $37,681 |
| Female | 13,317 (44.8%) | $30,125 |
| Total | 29,720 (100.0%) | $33,733 |
Earnings by Sex by Income Bracket in Grant County
The most common earnings brackets in Grant County are $55,000 to $64,999 for men (1,662 | 10.1%) and $30,000 to $34,999 for women (955 | 7.2%).
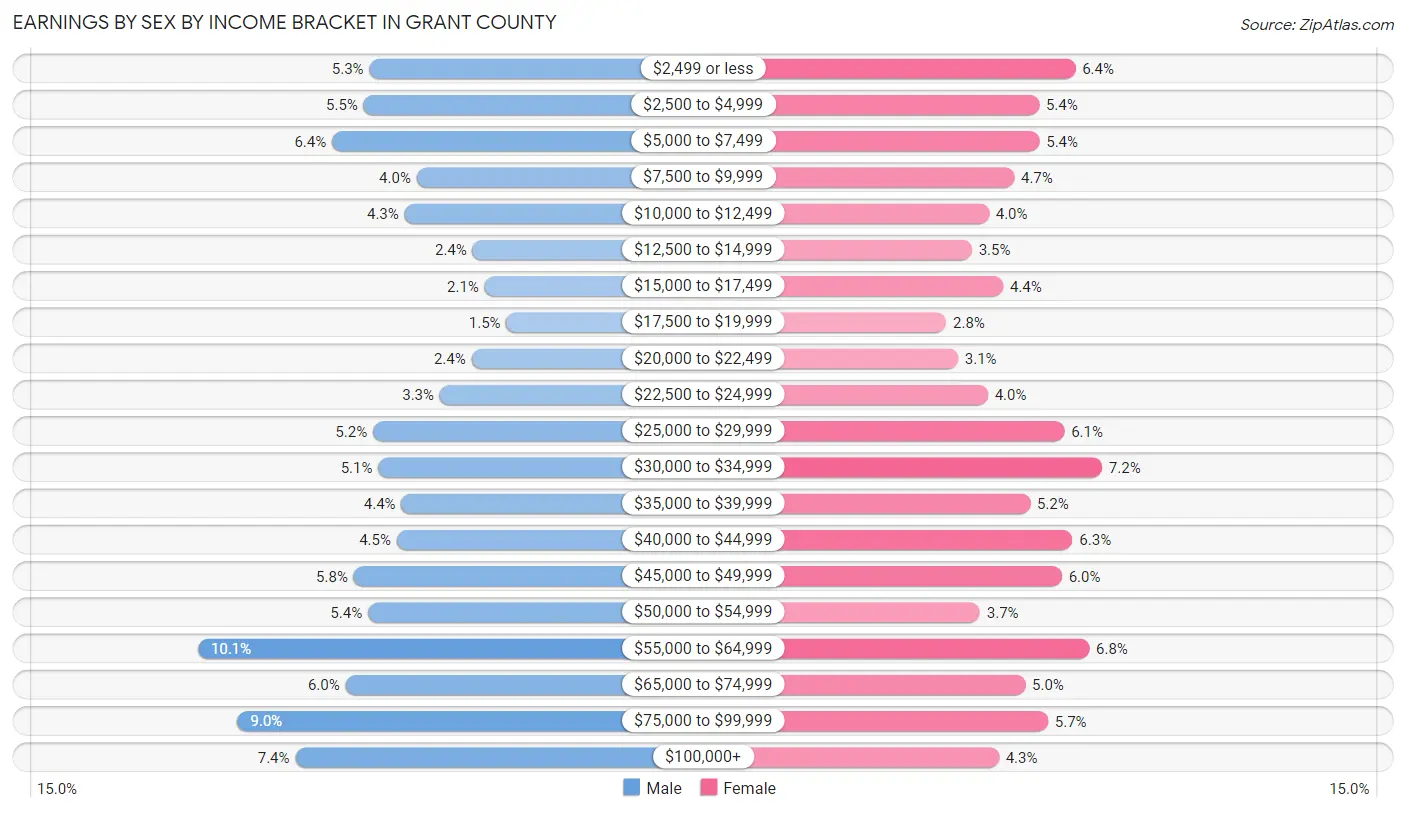
| Income | Male | Female |
| $2,499 or less | 871 (5.3%) | 855 (6.4%) |
| $2,500 to $4,999 | 897 (5.5%) | 719 (5.4%) |
| $5,000 to $7,499 | 1,043 (6.4%) | 720 (5.4%) |
| $7,500 to $9,999 | 653 (4.0%) | 626 (4.7%) |
| $10,000 to $12,499 | 708 (4.3%) | 532 (4.0%) |
| $12,500 to $14,999 | 395 (2.4%) | 468 (3.5%) |
| $15,000 to $17,499 | 339 (2.1%) | 585 (4.4%) |
| $17,500 to $19,999 | 240 (1.5%) | 372 (2.8%) |
| $20,000 to $22,499 | 401 (2.4%) | 416 (3.1%) |
| $22,500 to $24,999 | 546 (3.3%) | 528 (4.0%) |
| $25,000 to $29,999 | 855 (5.2%) | 814 (6.1%) |
| $30,000 to $34,999 | 830 (5.1%) | 955 (7.2%) |
| $35,000 to $39,999 | 724 (4.4%) | 686 (5.1%) |
| $40,000 to $44,999 | 745 (4.5%) | 844 (6.3%) |
| $45,000 to $49,999 | 943 (5.8%) | 804 (6.0%) |
| $50,000 to $54,999 | 878 (5.3%) | 498 (3.7%) |
| $55,000 to $64,999 | 1,662 (10.1%) | 907 (6.8%) |
| $65,000 to $74,999 | 981 (6.0%) | 667 (5.0%) |
| $75,000 to $99,999 | 1,480 (9.0%) | 752 (5.7%) |
| $100,000+ | 1,212 (7.4%) | 569 (4.3%) |
| Total | 16,403 (100.0%) | 13,317 (100.0%) |
Earnings by Sex by Educational Attainment in Grant County
Average earnings in Grant County are $49,345 for men and $39,170 for women, a difference of 20.6%. Men with an educational attainment of graduate degree enjoy the highest average annual earnings of $68,190, while those with less than high school education earn the least with $39,809. Women with an educational attainment of graduate degree earn the most with the average annual earnings of $64,583, while those with less than high school education have the smallest earnings of $18,365.
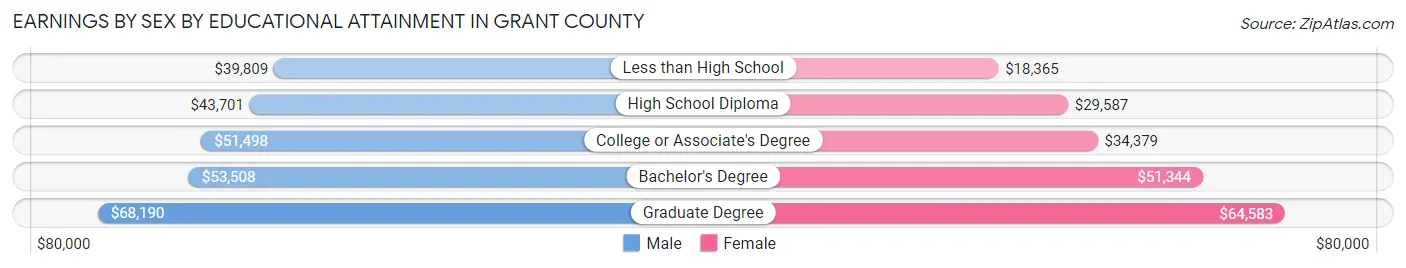
| Educational Attainment | Male Income | Female Income |
| Less than High School | $39,809 | $18,365 |
| High School Diploma | $43,701 | $29,587 |
| College or Associate's Degree | $51,498 | $34,379 |
| Bachelor's Degree | $53,508 | $51,344 |
| Graduate Degree | $68,190 | $64,583 |
| Total | $49,345 | $39,170 |
Family Income in Grant County
Family Income Brackets in Grant County
According to the Grant County family income data, there are 2,947 families falling into the $100,000 to $149,999 income range, which is the most common income bracket and makes up 24.5% of all families. Conversely, the $10,000 to $14,999 income bracket is the least frequent group with only 168 families (1.4%) belonging to this category.
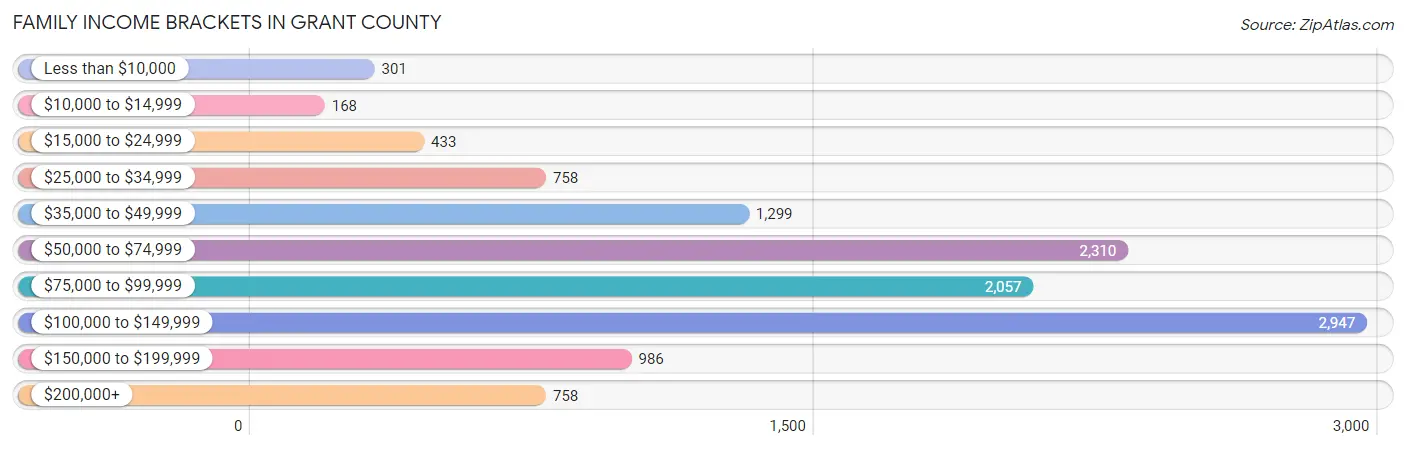
| Income Bracket | # Families | % Families |
| Less than $10,000 | 301 | 2.5% |
| $10,000 to $14,999 | 168 | 1.4% |
| $15,000 to $24,999 | 433 | 3.6% |
| $25,000 to $34,999 | 758 | 6.3% |
| $35,000 to $49,999 | 1,299 | 10.8% |
| $50,000 to $74,999 | 2,310 | 19.2% |
| $75,000 to $99,999 | 2,057 | 17.1% |
| $100,000 to $149,999 | 2,947 | 24.5% |
| $150,000 to $199,999 | 986 | 8.2% |
| $200,000+ | 758 | 6.3% |
Family Income by Famaliy Size in Grant County
6-person families (322 | 2.7%) account for the highest median family income in Grant County with $108,077 per family, while 2-person families (6,385 | 53.1%) have the highest median income of $37,220 per family member.
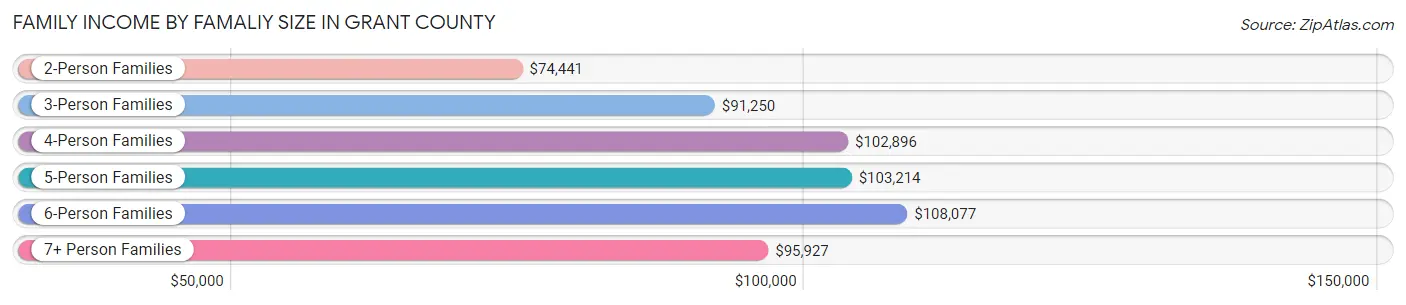
| Income Bracket | # Families | Median Income |
| 2-Person Families | 6,385 (53.1%) | $74,441 |
| 3-Person Families | 2,129 (17.7%) | $91,250 |
| 4-Person Families | 1,881 (15.6%) | $102,896 |
| 5-Person Families | 996 (8.3%) | $103,214 |
| 6-Person Families | 322 (2.7%) | $108,077 |
| 7+ Person Families | 317 (2.6%) | $95,927 |
| Total | 12,030 (100.0%) | $83,145 |
Family Income by Number of Earners in Grant County
The median family income in Grant County is $83,145, with families comprising 3+ earners (1,265) having the highest median family income of $128,835, while families with no earners (1,746) have the lowest median family income of $49,271, accounting for 10.5% and 14.5% of families, respectively.
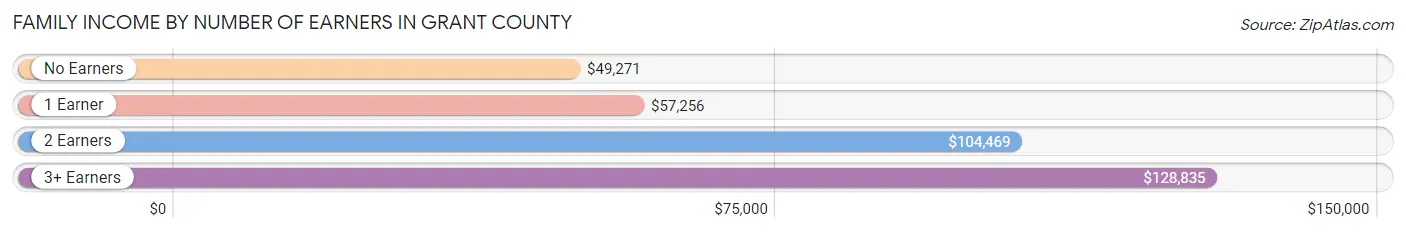
| Number of Earners | # Families | Median Income |
| No Earners | 1,746 (14.5%) | $49,271 |
| 1 Earner | 3,395 (28.2%) | $57,256 |
| 2 Earners | 5,624 (46.8%) | $104,469 |
| 3+ Earners | 1,265 (10.5%) | $128,835 |
| Total | 12,030 (100.0%) | $83,145 |
Household Income in Grant County
Household Income Brackets in Grant County
With 4,012 households falling in the category, the $50,000 to $74,999 income range is the most frequent in Grant County, accounting for 20.2% of all households. In contrast, only 775 households (3.9%) fall into the $10,000 to $14,999 income bracket, making it the least populous group.
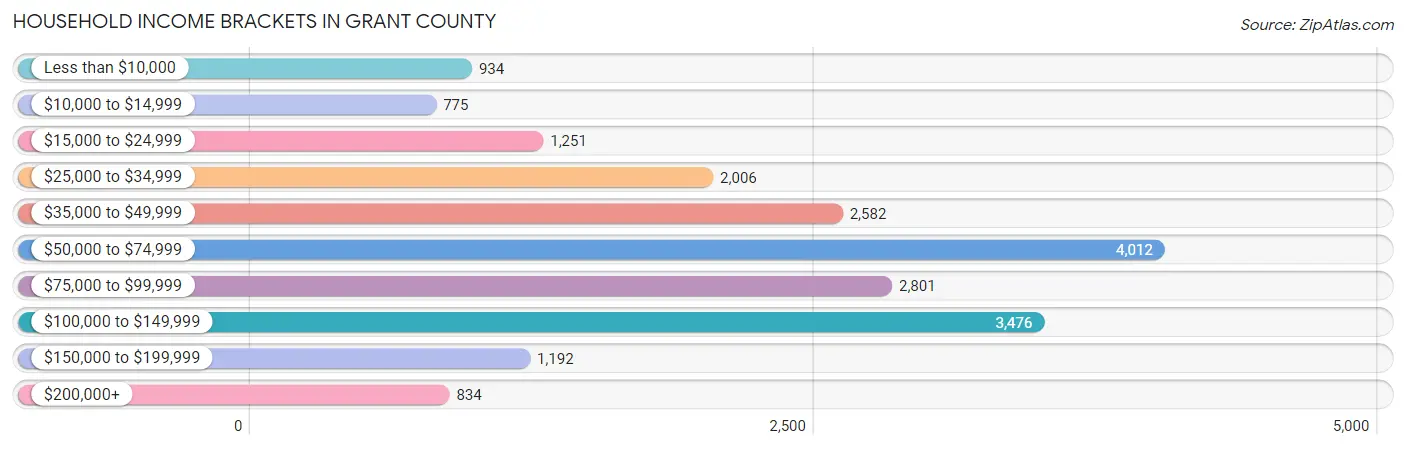
| Income Bracket | # Households | % Households |
| Less than $10,000 | 934 | 4.7% |
| $10,000 to $14,999 | 775 | 3.9% |
| $15,000 to $24,999 | 1,251 | 6.3% |
| $25,000 to $34,999 | 2,006 | 10.1% |
| $35,000 to $49,999 | 2,582 | 13.0% |
| $50,000 to $74,999 | 4,012 | 20.2% |
| $75,000 to $99,999 | 2,801 | 14.1% |
| $100,000 to $149,999 | 3,476 | 17.5% |
| $150,000 to $199,999 | 1,192 | 6.0% |
| $200,000+ | 834 | 4.2% |
Household Income by Householder Age in Grant County
The median household income in Grant County is $63,497, with the highest median household income of $80,933 found in the 45 to 64 years age bracket for the primary householder. A total of 6,796 households (34.2%) fall into this category. Meanwhile, the 15 to 24 years age bracket for the primary householder has the lowest median household income of $34,978, with 1,670 households (8.4%) in this group.
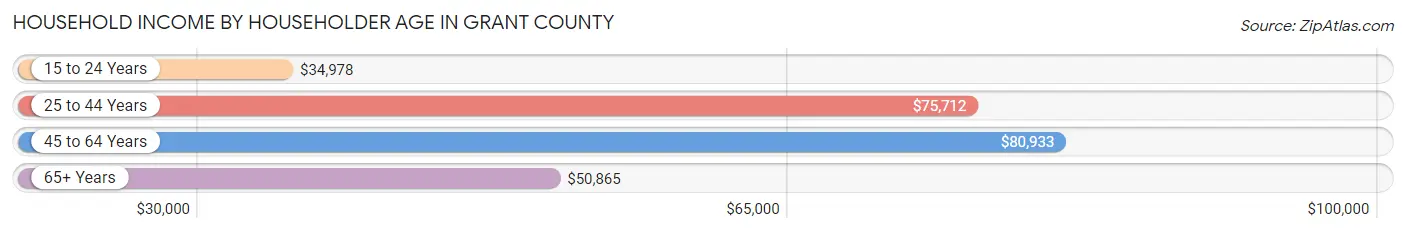
| Income Bracket | # Households | Median Income |
| 15 to 24 Years | 1,670 (8.4%) | $34,978 |
| 25 to 44 Years | 5,836 (29.4%) | $75,712 |
| 45 to 64 Years | 6,796 (34.2%) | $80,933 |
| 65+ Years | 5,561 (28.0%) | $50,865 |
| Total | 19,863 (100.0%) | $63,497 |
Poverty in Grant County
Income Below Poverty by Sex and Age in Grant County
With 13.7% poverty level for males and 13.9% for females among the residents of Grant County, 18 to 24 year old males and 18 to 24 year old females are the most vulnerable to poverty, with 1,201 males (34.7%) and 948 females (33.7%) in their respective age groups living below the poverty level.
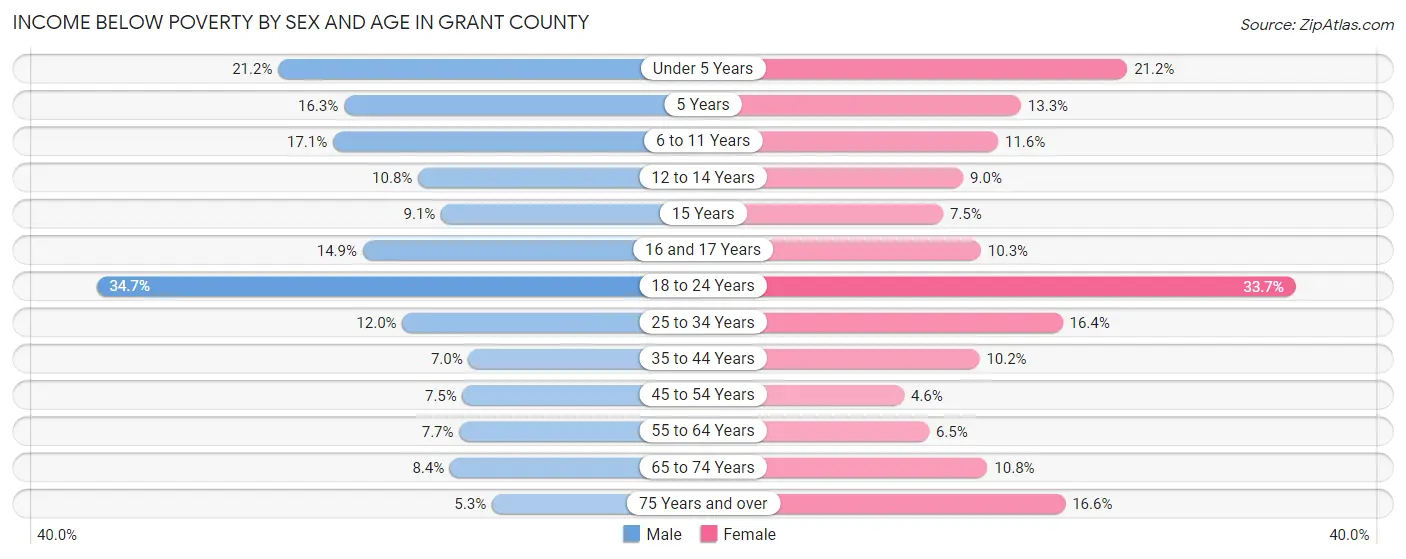
| Age Bracket | Male | Female |
| Under 5 Years | 305 (21.2%) | 307 (21.2%) |
| 5 Years | 63 (16.3%) | 31 (13.3%) |
| 6 to 11 Years | 276 (17.1%) | 199 (11.6%) |
| 12 to 14 Years | 108 (10.8%) | 77 (9.0%) |
| 15 Years | 40 (9.1%) | 22 (7.5%) |
| 16 and 17 Years | 81 (14.9%) | 69 (10.3%) |
| 18 to 24 Years | 1,201 (34.7%) | 948 (33.7%) |
| 25 to 34 Years | 359 (11.9%) | 410 (16.4%) |
| 35 to 44 Years | 203 (7.0%) | 261 (10.2%) |
| 45 to 54 Years | 196 (7.5%) | 116 (4.6%) |
| 55 to 64 Years | 260 (7.7%) | 212 (6.5%) |
| 65 to 74 Years | 210 (8.4%) | 279 (10.8%) |
| 75 Years and over | 76 (5.3%) | 370 (16.6%) |
| Total | 3,378 (13.7%) | 3,301 (13.9%) |
Income Above Poverty by Sex and Age in Grant County
According to the poverty statistics in Grant County, males aged 75 years and over and females aged 45 to 54 years are the age groups that are most secure financially, with 94.7% of males and 95.4% of females in these age groups living above the poverty line.
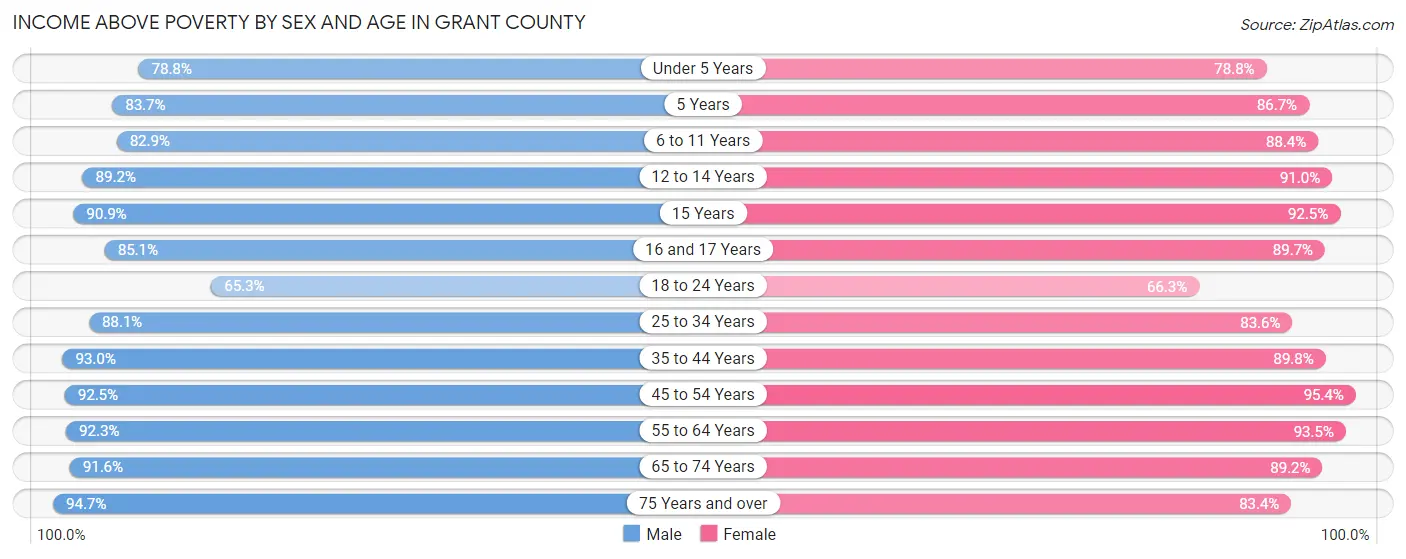
| Age Bracket | Male | Female |
| Under 5 Years | 1,136 (78.8%) | 1,142 (78.8%) |
| 5 Years | 324 (83.7%) | 202 (86.7%) |
| 6 to 11 Years | 1,338 (82.9%) | 1,516 (88.4%) |
| 12 to 14 Years | 894 (89.2%) | 778 (91.0%) |
| 15 Years | 401 (90.9%) | 271 (92.5%) |
| 16 and 17 Years | 463 (85.1%) | 599 (89.7%) |
| 18 to 24 Years | 2,264 (65.3%) | 1,866 (66.3%) |
| 25 to 34 Years | 2,644 (88.0%) | 2,091 (83.6%) |
| 35 to 44 Years | 2,682 (93.0%) | 2,292 (89.8%) |
| 45 to 54 Years | 2,424 (92.5%) | 2,397 (95.4%) |
| 55 to 64 Years | 3,106 (92.3%) | 3,066 (93.5%) |
| 65 to 74 Years | 2,286 (91.6%) | 2,301 (89.2%) |
| 75 Years and over | 1,357 (94.7%) | 1,860 (83.4%) |
| Total | 21,319 (86.3%) | 20,381 (86.1%) |
Income Below Poverty Among Married-Couple Families in Grant County
The poverty statistics for married-couple families in Grant County show that 4.7% or 464 of the total 9,910 families live below the poverty line. Families with 5 or more children have the highest poverty rate of 22.8%, comprising of 48 families. On the other hand, families with no children have the lowest poverty rate of 2.9%, which includes 180 families.
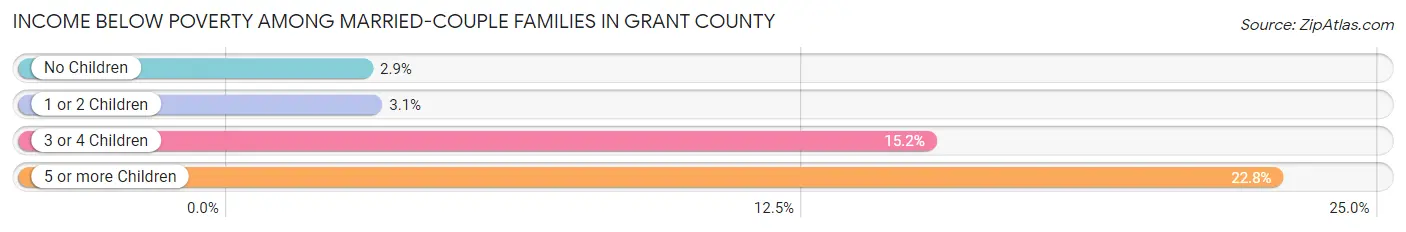
| Children | Above Poverty | Below Poverty |
| No Children | 5,946 (97.1%) | 180 (2.9%) |
| 1 or 2 Children | 2,467 (96.9%) | 80 (3.1%) |
| 3 or 4 Children | 870 (84.8%) | 156 (15.2%) |
| 5 or more Children | 163 (77.2%) | 48 (22.8%) |
| Total | 9,446 (95.3%) | 464 (4.7%) |
Income Below Poverty Among Single-Parent Households in Grant County
According to the poverty data in Grant County, 13.2% or 94 single-father households and 19.8% or 278 single-mother households are living below the poverty line. Among single-father households, those with 5 or more children have the highest poverty rate, with 3 households (100.0%) experiencing poverty. Likewise, among single-mother households, those with 5 or more children have the highest poverty rate, with 1 households (100.0%) falling below the poverty line.
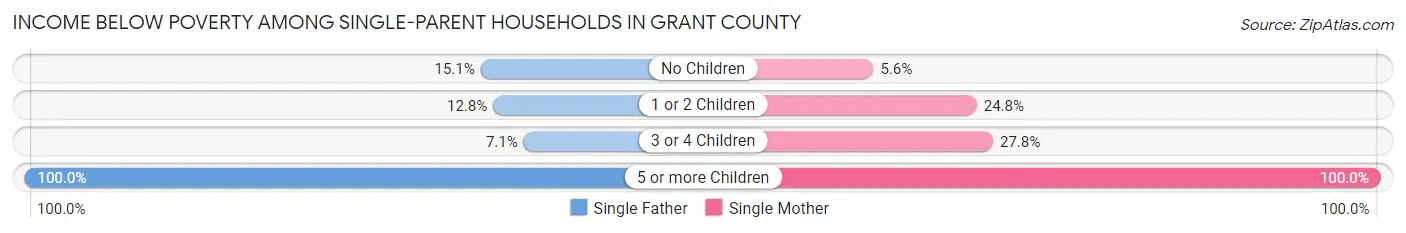
| Children | Single Father | Single Mother |
| No Children | 33 (15.1%) | 23 (5.6%) |
| 1 or 2 Children | 52 (12.8%) | 175 (24.8%) |
| 3 or 4 Children | 6 (7.1%) | 79 (27.8%) |
| 5 or more Children | 3 (100.0%) | 1 (100.0%) |
| Total | 94 (13.2%) | 278 (19.8%) |
Income Below Poverty Among Married-Couple vs Single-Parent Households in Grant County
The poverty data for Grant County shows that 464 of the married-couple family households (4.7%) and 372 of the single-parent households (17.5%) are living below the poverty level. Within the married-couple family households, those with 5 or more children have the highest poverty rate, with 48 households (22.8%) falling below the poverty line. Among the single-parent households, those with 5 or more children have the highest poverty rate, with 4 household (100.0%) living below poverty.
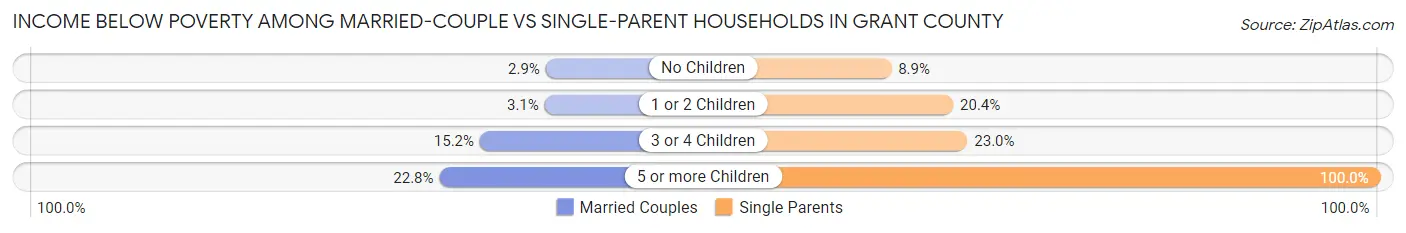
| Children | Married-Couple Families | Single-Parent Households |
| No Children | 180 (2.9%) | 56 (8.8%) |
| 1 or 2 Children | 80 (3.1%) | 227 (20.4%) |
| 3 or 4 Children | 156 (15.2%) | 85 (23.0%) |
| 5 or more Children | 48 (22.8%) | 4 (100.0%) |
| Total | 464 (4.7%) | 372 (17.5%) |
Employment Characteristics in Grant County
Employment by Class of Employer in Grant County
Among the 25,660 employed individuals in Grant County, private company employees (16,791 | 65.4%), self-employed (not incorporated) (2,138 | 8.3%), and state government employees (1,944 | 7.6%) make up the most common classes of employment.
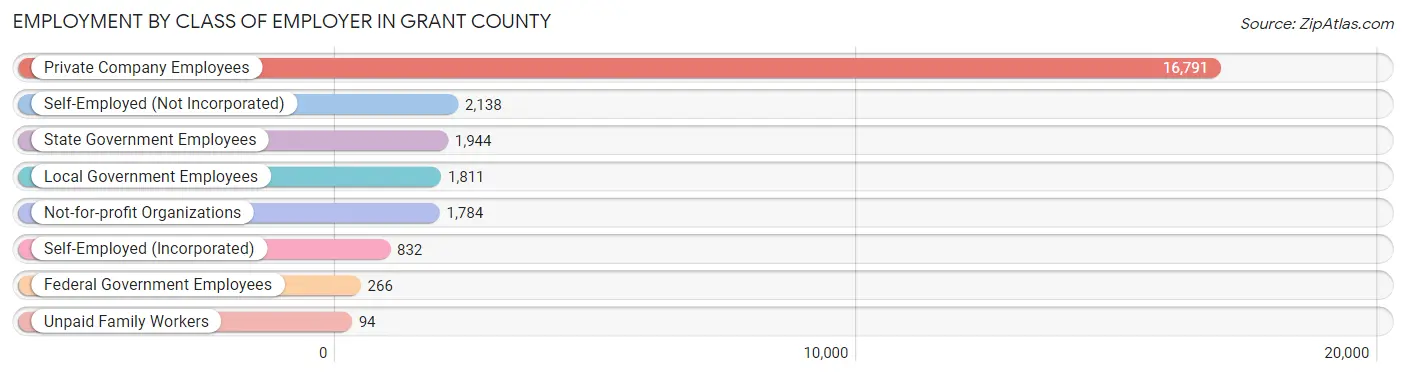
| Employer Class | # Employees | % Employees |
| Private Company Employees | 16,791 | 65.4% |
| Self-Employed (Incorporated) | 832 | 3.2% |
| Self-Employed (Not Incorporated) | 2,138 | 8.3% |
| Not-for-profit Organizations | 1,784 | 7.0% |
| Local Government Employees | 1,811 | 7.1% |
| State Government Employees | 1,944 | 7.6% |
| Federal Government Employees | 266 | 1.0% |
| Unpaid Family Workers | 94 | 0.4% |
| Total | 25,660 | 100.0% |
Employment Status by Age in Grant County
According to the labor force statistics for Grant County, out of the total population over 16 years of age (42,239), 64.0% or 27,033 individuals are in the labor force, with 3.1% or 838 of them unemployed. The age group with the highest labor force participation rate is 45 to 54 years, with 87.4% or 4,588 individuals in the labor force. Within the labor force, the 25 to 29 years age range has the highest percentage of unemployed individuals, with 6.7% or 170 of them being unemployed.
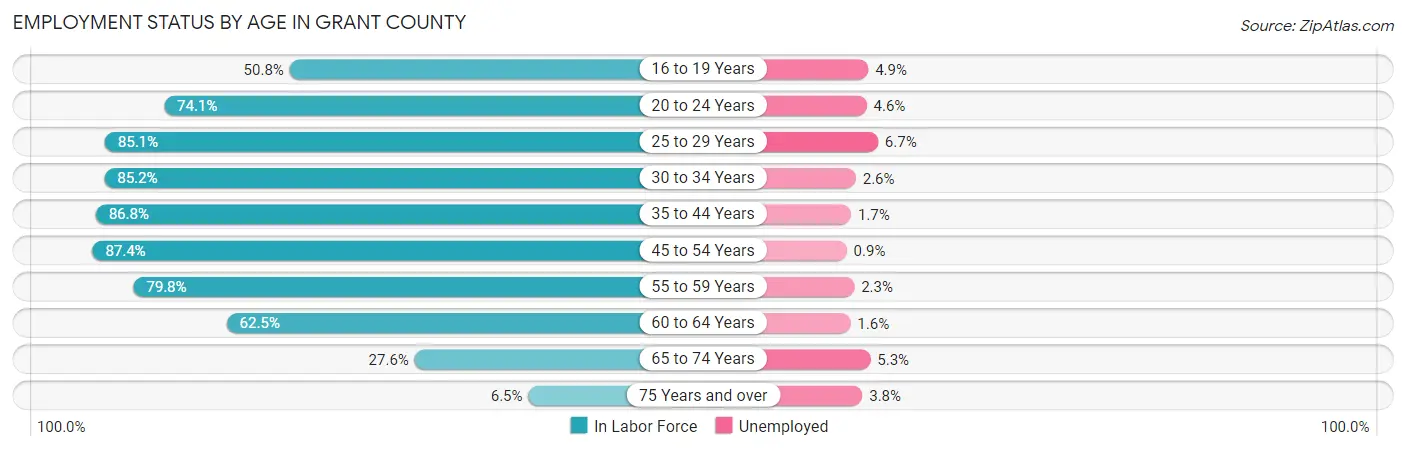
| Age Bracket | In Labor Force | Unemployed |
| 16 to 19 Years | 2,019 (50.8%) | 99 (4.9%) |
| 20 to 24 Years | 4,253 (74.1%) | 196 (4.6%) |
| 25 to 29 Years | 2,543 (85.1%) | 170 (6.7%) |
| 30 to 34 Years | 2,261 (85.2%) | 59 (2.6%) |
| 35 to 44 Years | 4,882 (86.8%) | 83 (1.7%) |
| 45 to 54 Years | 4,589 (87.4%) | 41 (0.9%) |
| 55 to 59 Years | 2,533 (79.8%) | 58 (2.3%) |
| 60 to 64 Years | 2,279 (62.5%) | 36 (1.6%) |
| 65 to 74 Years | 1,421 (27.6%) | 75 (5.3%) |
| 75 Years and over | 263 (6.5%) | 10 (3.8%) |
| Total | 27,033 (64.0%) | 838 (3.1%) |
Employment Status by Educational Attainment in Grant County
According to labor force statistics for Grant County, 81.8% of individuals (19,089) out of the total population between 25 and 64 years of age (23,336) are in the labor force, with 2.3% or 439 of them being unemployed. The group with the highest labor force participation rate are those with the educational attainment of bachelor's degree or higher, with 90.6% or 5,382 individuals in the labor force. Within the labor force, individuals with high school diploma education have the highest percentage of unemployment, with 3.7% or 185 of them being unemployed.
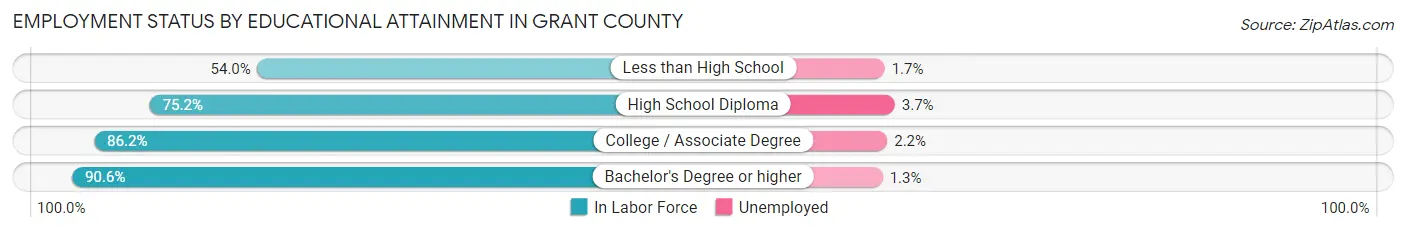
| Educational Attainment | In Labor Force | Unemployed |
| Less than High School | 931 (54.0%) | 29 (1.7%) |
| High School Diploma | 5,007 (75.2%) | 246 (3.7%) |
| College / Associate Degree | 7,770 (86.2%) | 198 (2.2%) |
| Bachelor's Degree or higher | 5,382 (90.6%) | 77 (1.3%) |
| Total | 19,089 (81.8%) | 537 (2.3%) |
Employment Occupations by Sex in Grant County
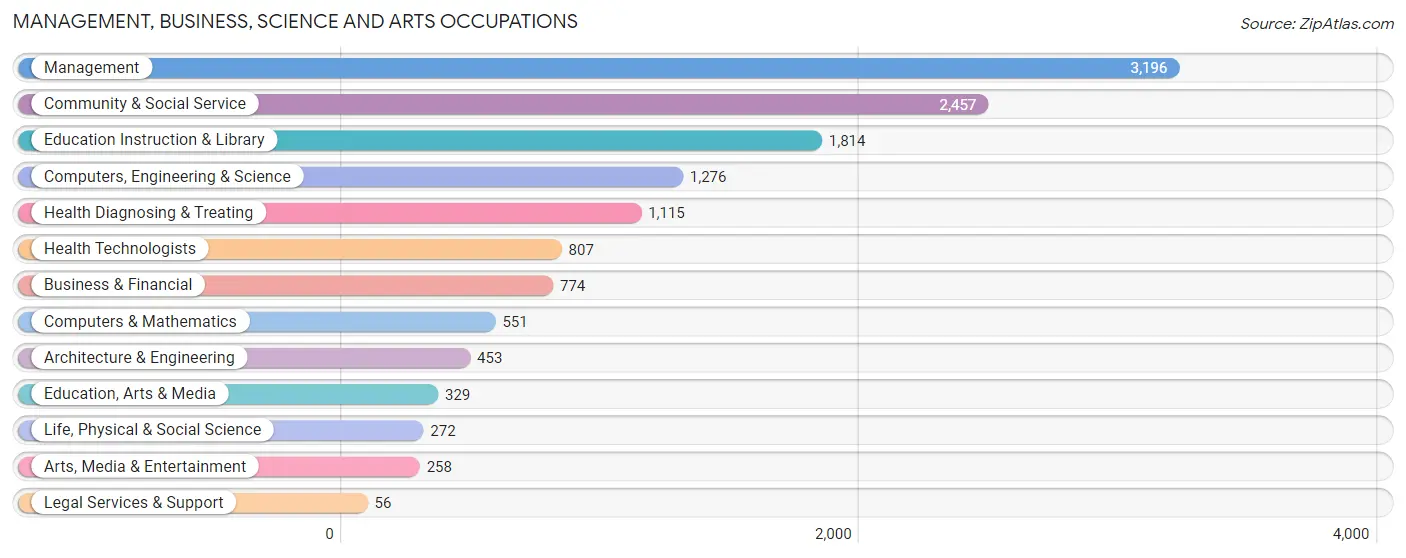
Management, Business, Science and Arts Occupations
The most common Management, Business, Science and Arts occupations in Grant County are Management (3,196 | 12.2%), Community & Social Service (2,457 | 9.4%), Education Instruction & Library (1,814 | 6.9%), Computers, Engineering & Science (1,276 | 4.9%), and Health Diagnosing & Treating (1,115 | 4.3%).
Management, Business, Science and Arts Occupations by Sex
Within the Management, Business, Science and Arts occupations in Grant County, the most male-oriented occupations are Architecture & Engineering (76.8%), Computers & Mathematics (71.5%), and Computers, Engineering & Science (68.9%), while the most female-oriented occupations are Health Diagnosing & Treating (86.3%), Health Technologists (84.8%), and Education Instruction & Library (75.4%).
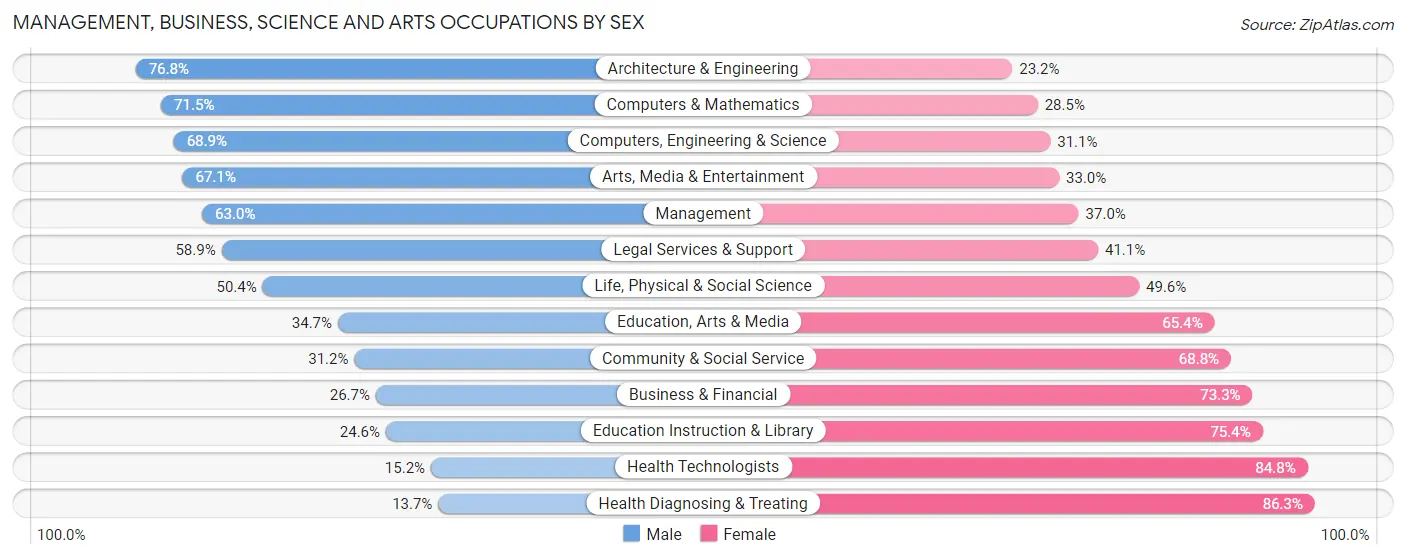
| Occupation | Male | Female |
| Management | 2,013 (63.0%) | 1,183 (37.0%) |
| Business & Financial | 207 (26.7%) | 567 (73.3%) |
| Computers, Engineering & Science | 879 (68.9%) | 397 (31.1%) |
| Computers & Mathematics | 394 (71.5%) | 157 (28.5%) |
| Architecture & Engineering | 348 (76.8%) | 105 (23.2%) |
| Life, Physical & Social Science | 137 (50.4%) | 135 (49.6%) |
| Community & Social Service | 767 (31.2%) | 1,690 (68.8%) |
| Education, Arts & Media | 114 (34.6%) | 215 (65.3%) |
| Legal Services & Support | 33 (58.9%) | 23 (41.1%) |
| Education Instruction & Library | 447 (24.6%) | 1,367 (75.4%) |
| Arts, Media & Entertainment | 173 (67.0%) | 85 (33.0%) |
| Health Diagnosing & Treating | 153 (13.7%) | 962 (86.3%) |
| Health Technologists | 123 (15.2%) | 684 (84.8%) |
| Total (Category) | 4,019 (45.6%) | 4,799 (54.4%) |
| Total (Overall) | 14,224 (54.3%) | 11,981 (45.7%) |
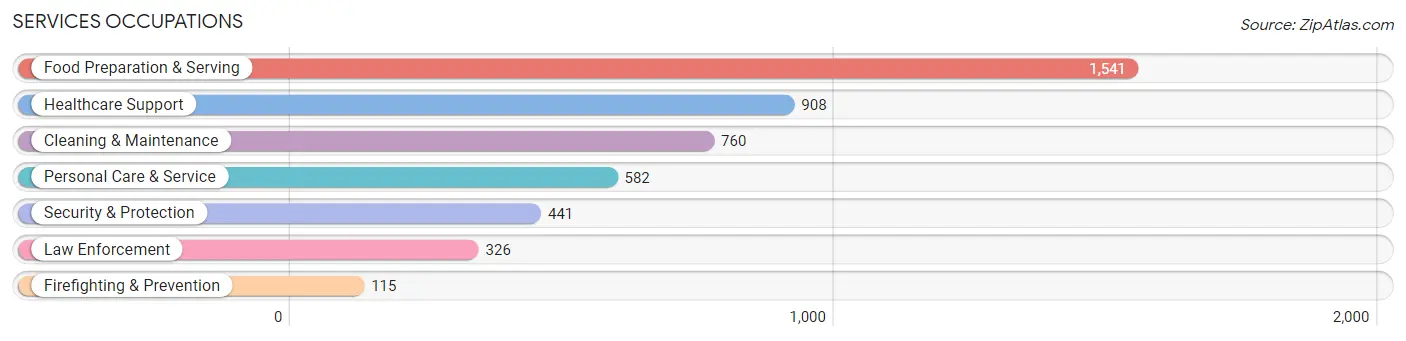
Services Occupations
The most common Services occupations in Grant County are Food Preparation & Serving (1,541 | 5.9%), Healthcare Support (908 | 3.5%), Cleaning & Maintenance (760 | 2.9%), Personal Care & Service (582 | 2.2%), and Security & Protection (441 | 1.7%).
Services Occupations by Sex
Within the Services occupations in Grant County, the most male-oriented occupations are Law Enforcement (88.6%), Security & Protection (76.9%), and Cleaning & Maintenance (59.9%), while the most female-oriented occupations are Healthcare Support (91.3%), Personal Care & Service (62.2%), and Food Preparation & Serving (60.6%).
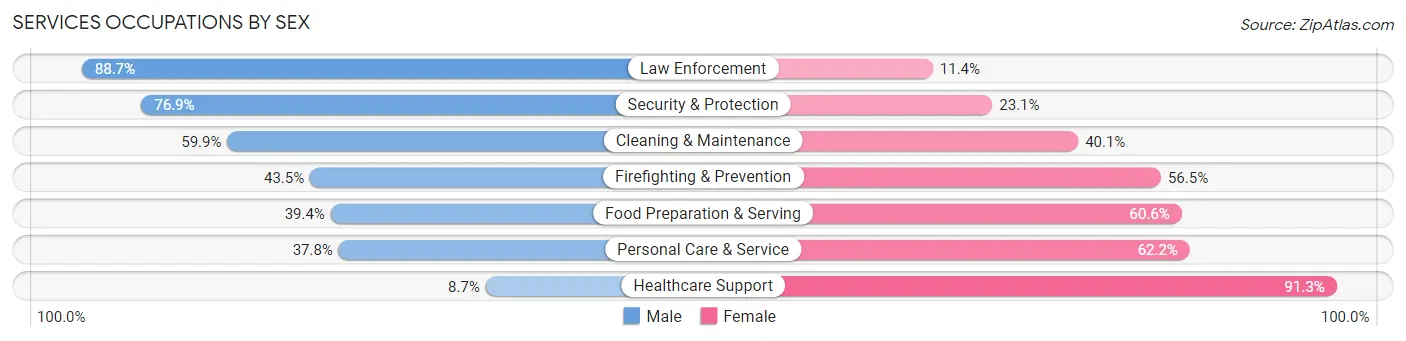
| Occupation | Male | Female |
| Healthcare Support | 79 (8.7%) | 829 (91.3%) |
| Security & Protection | 339 (76.9%) | 102 (23.1%) |
| Firefighting & Prevention | 50 (43.5%) | 65 (56.5%) |
| Law Enforcement | 289 (88.6%) | 37 (11.4%) |
| Food Preparation & Serving | 607 (39.4%) | 934 (60.6%) |
| Cleaning & Maintenance | 455 (59.9%) | 305 (40.1%) |
| Personal Care & Service | 220 (37.8%) | 362 (62.2%) |
| Total (Category) | 1,700 (40.2%) | 2,532 (59.8%) |
| Total (Overall) | 14,224 (54.3%) | 11,981 (45.7%) |
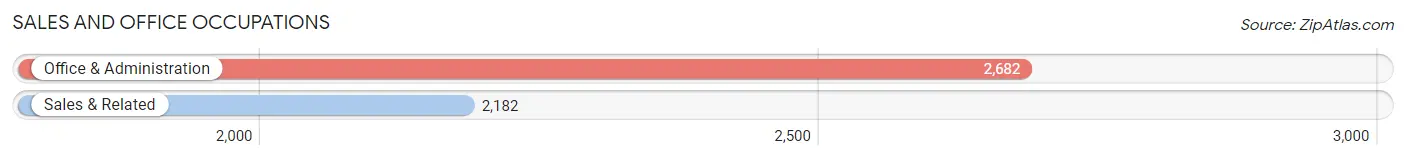
Sales and Office Occupations
The most common Sales and Office occupations in Grant County are Office & Administration (2,682 | 10.2%), and Sales & Related (2,182 | 8.3%).
Sales and Office Occupations by Sex
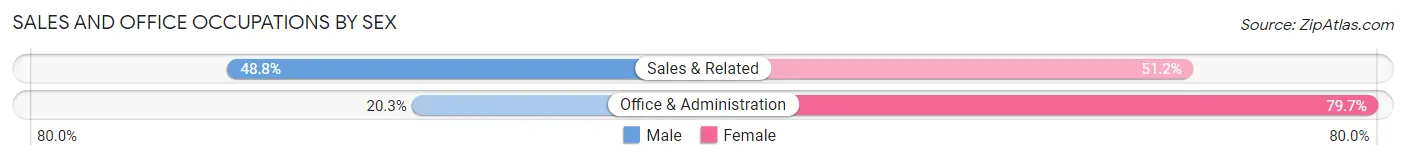
| Occupation | Male | Female |
| Sales & Related | 1,064 (48.8%) | 1,118 (51.2%) |
| Office & Administration | 545 (20.3%) | 2,137 (79.7%) |
| Total (Category) | 1,609 (33.1%) | 3,255 (66.9%) |
| Total (Overall) | 14,224 (54.3%) | 11,981 (45.7%) |
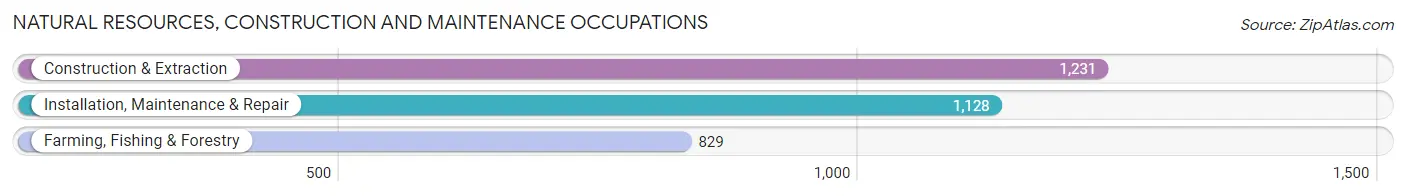
Natural Resources, Construction and Maintenance Occupations
The most common Natural Resources, Construction and Maintenance occupations in Grant County are Construction & Extraction (1,231 | 4.7%), Installation, Maintenance & Repair (1,128 | 4.3%), and Farming, Fishing & Forestry (829 | 3.2%).
Natural Resources, Construction and Maintenance Occupations by Sex
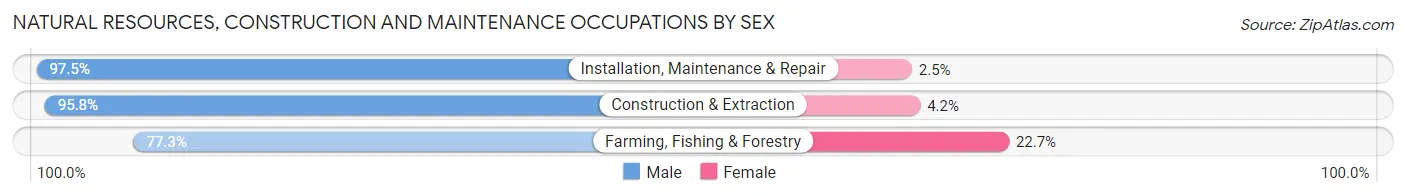
| Occupation | Male | Female |
| Farming, Fishing & Forestry | 641 (77.3%) | 188 (22.7%) |
| Construction & Extraction | 1,179 (95.8%) | 52 (4.2%) |
| Installation, Maintenance & Repair | 1,100 (97.5%) | 28 (2.5%) |
| Total (Category) | 2,920 (91.6%) | 268 (8.4%) |
| Total (Overall) | 14,224 (54.3%) | 11,981 (45.7%) |
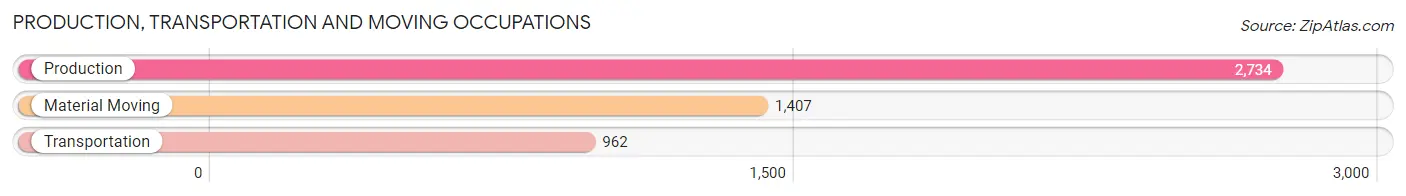
Production, Transportation and Moving Occupations
The most common Production, Transportation and Moving occupations in Grant County are Production (2,734 | 10.4%), Material Moving (1,407 | 5.4%), and Transportation (962 | 3.7%).
Production, Transportation and Moving Occupations by Sex
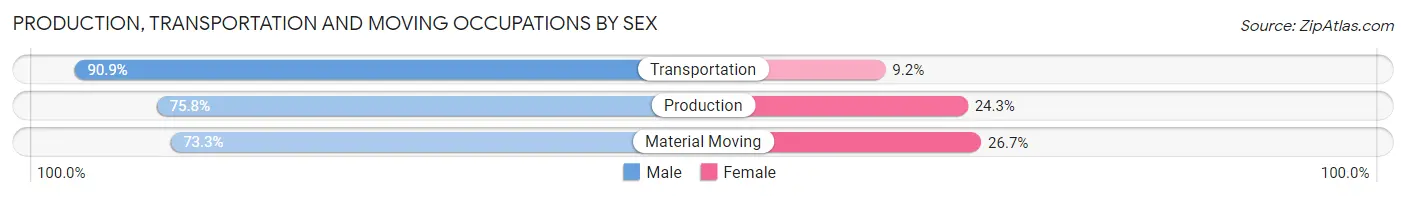
| Occupation | Male | Female |
| Production | 2,071 (75.7%) | 663 (24.2%) |
| Transportation | 874 (90.8%) | 88 (9.1%) |
| Material Moving | 1,031 (73.3%) | 376 (26.7%) |
| Total (Category) | 3,976 (77.9%) | 1,127 (22.1%) |
| Total (Overall) | 14,224 (54.3%) | 11,981 (45.7%) |
Employment Industries by Sex in Grant County
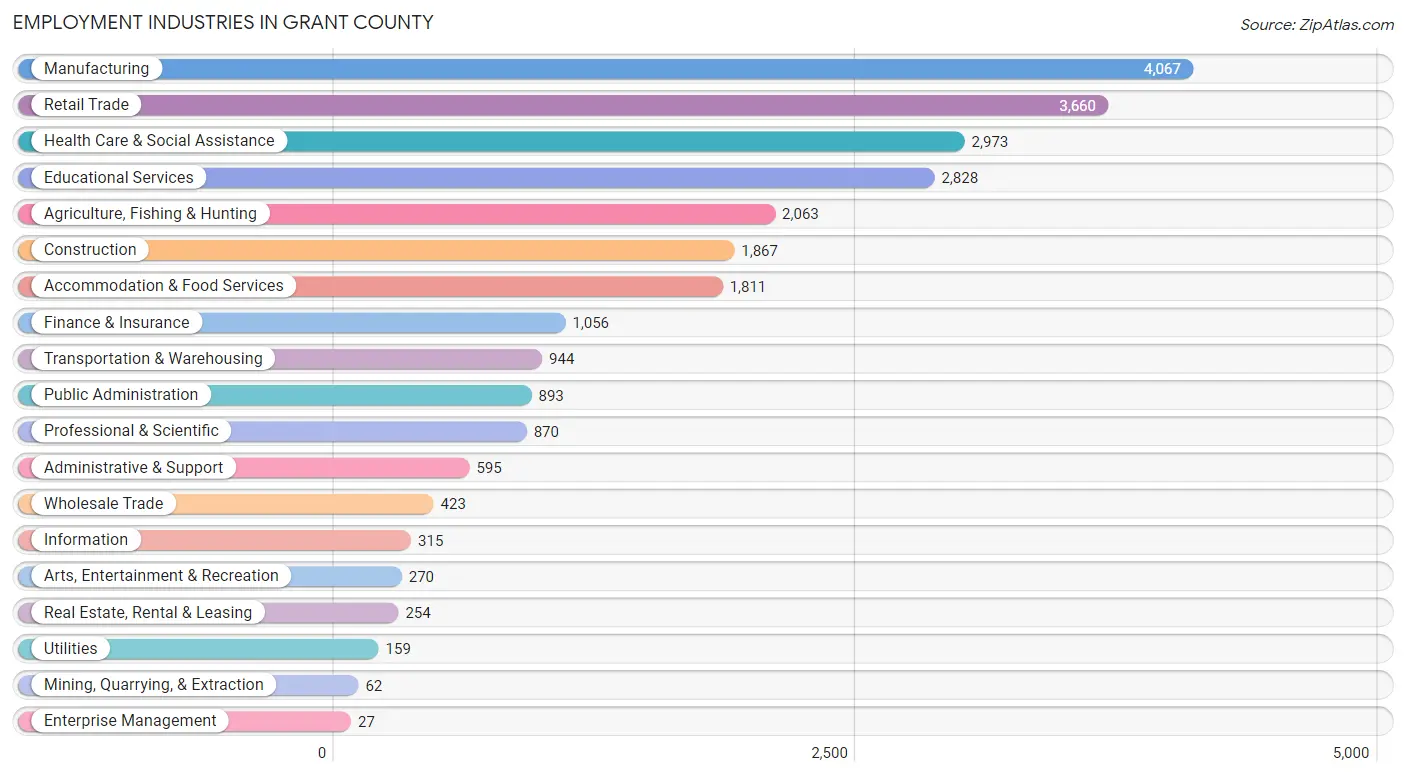
Employment Industries in Grant County
The major employment industries in Grant County include Manufacturing (4,067 | 15.5%), Retail Trade (3,660 | 14.0%), Health Care & Social Assistance (2,973 | 11.4%), Educational Services (2,828 | 10.8%), and Agriculture, Fishing & Hunting (2,063 | 7.9%).
Employment Industries by Sex in Grant County
The Grant County industries that see more men than women are Construction (90.0%), Utilities (88.7%), and Mining, Quarrying, & Extraction (87.1%), whereas the industries that tend to have a higher number of women are Health Care & Social Assistance (86.8%), Finance & Insurance (72.0%), and Information (69.8%).
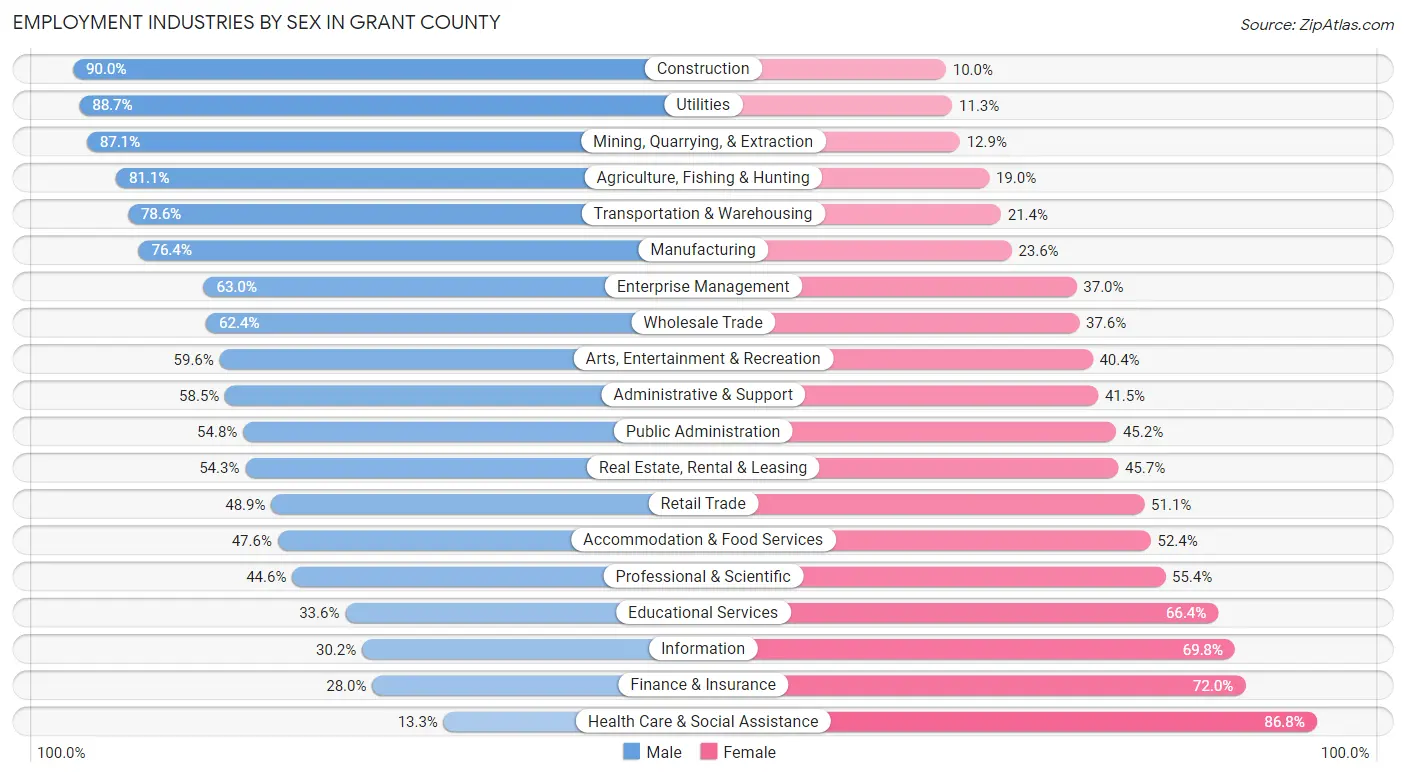
| Industry | Male | Female |
| Agriculture, Fishing & Hunting | 1,672 (81.0%) | 391 (19.0%) |
| Mining, Quarrying, & Extraction | 54 (87.1%) | 8 (12.9%) |
| Construction | 1,680 (90.0%) | 187 (10.0%) |
| Manufacturing | 3,107 (76.4%) | 960 (23.6%) |
| Wholesale Trade | 264 (62.4%) | 159 (37.6%) |
| Retail Trade | 1,791 (48.9%) | 1,869 (51.1%) |
| Transportation & Warehousing | 742 (78.6%) | 202 (21.4%) |
| Utilities | 141 (88.7%) | 18 (11.3%) |
| Information | 95 (30.2%) | 220 (69.8%) |
| Finance & Insurance | 296 (28.0%) | 760 (72.0%) |
| Real Estate, Rental & Leasing | 138 (54.3%) | 116 (45.7%) |
| Professional & Scientific | 388 (44.6%) | 482 (55.4%) |
| Enterprise Management | 17 (63.0%) | 10 (37.0%) |
| Administrative & Support | 348 (58.5%) | 247 (41.5%) |
| Educational Services | 951 (33.6%) | 1,877 (66.4%) |
| Health Care & Social Assistance | 394 (13.3%) | 2,579 (86.8%) |
| Arts, Entertainment & Recreation | 161 (59.6%) | 109 (40.4%) |
| Accommodation & Food Services | 862 (47.6%) | 949 (52.4%) |
| Public Administration | 489 (54.8%) | 404 (45.2%) |
| Total | 14,224 (54.3%) | 11,981 (45.7%) |
Education in Grant County
School Enrollment in Grant County
The most common levels of schooling among the 14,673 students in Grant County are college / undergraduate (6,095 | 41.5%), high school (2,535 | 17.3%), and middle school (2,447 | 16.7%).
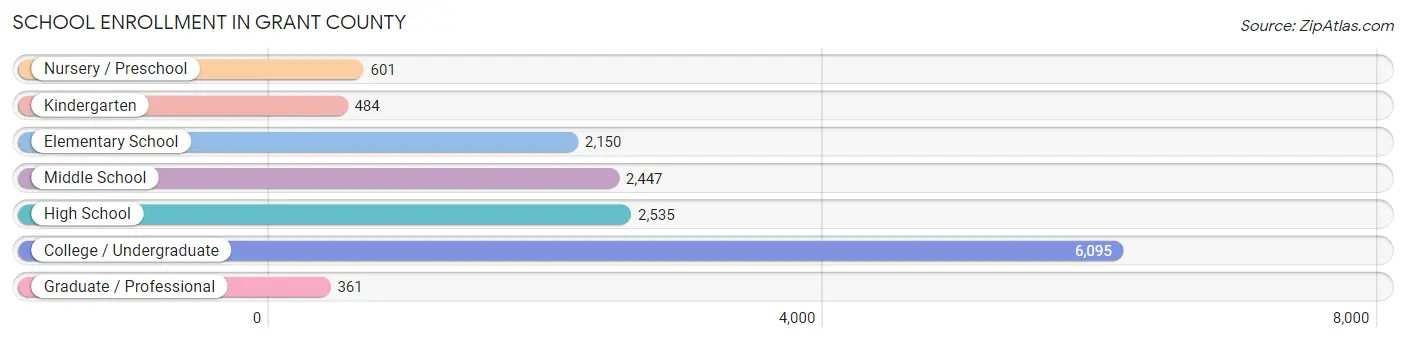
| School Level | # Students | % Students |
| Nursery / Preschool | 601 | 4.1% |
| Kindergarten | 484 | 3.3% |
| Elementary School | 2,150 | 14.6% |
| Middle School | 2,447 | 16.7% |
| High School | 2,535 | 17.3% |
| College / Undergraduate | 6,095 | 41.5% |
| Graduate / Professional | 361 | 2.5% |
| Total | 14,673 | 100.0% |
School Enrollment by Age by Funding Source in Grant County
Out of a total of 14,673 students who are enrolled in schools in Grant County, 1,717 (11.7%) attend a private institution, while the remaining 12,956 (88.3%) are enrolled in public schools. The age group of 35 years and over has the highest likelihood of being enrolled in private schools, with 130 (35.4% in the age bracket) enrolled. Conversely, the age group of 18 to 19 year olds has the lowest likelihood of being enrolled in a private school, with 2,259 (98.5% in the age bracket) attending a public institution.
| Age Bracket | Public School | Private School |
| 3 to 4 Year Olds | 366 (84.1%) | 69 (15.9%) |
| 5 to 9 Year Old | 2,023 (80.5%) | 491 (19.5%) |
| 10 to 14 Year Olds | 2,417 (82.3%) | 521 (17.7%) |
| 15 to 17 Year Olds | 1,608 (89.7%) | 184 (10.3%) |
| 18 to 19 Year Olds | 2,259 (98.5%) | 34 (1.5%) |
| 20 to 24 Year Olds | 3,461 (96.4%) | 131 (3.6%) |
| 25 to 34 Year Olds | 588 (79.2%) | 154 (20.7%) |
| 35 Years and over | 237 (64.6%) | 130 (35.4%) |
| Total | 12,956 (88.3%) | 1,717 (11.7%) |
Educational Attainment by Field of Study in Grant County
Education (1,858 | 21.8%), business (1,318 | 15.5%), bio, nature & agricultural (1,093 | 12.8%), science & technology (952 | 11.2%), and arts & humanities (511 | 6.0%) are the most common fields of study among 8,517 individuals in Grant County who have obtained a bachelor's degree or higher.
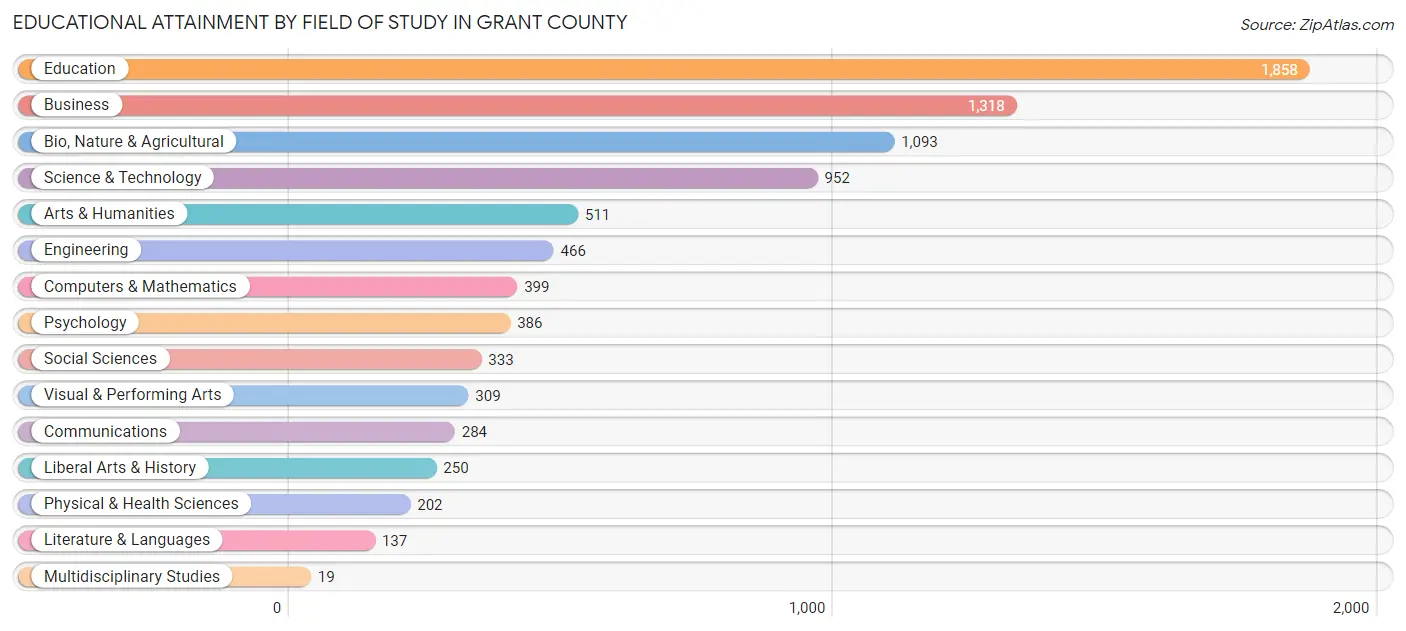
| Field of Study | # Graduates | % Graduates |
| Computers & Mathematics | 399 | 4.7% |
| Bio, Nature & Agricultural | 1,093 | 12.8% |
| Physical & Health Sciences | 202 | 2.4% |
| Psychology | 386 | 4.5% |
| Social Sciences | 333 | 3.9% |
| Engineering | 466 | 5.5% |
| Multidisciplinary Studies | 19 | 0.2% |
| Science & Technology | 952 | 11.2% |
| Business | 1,318 | 15.5% |
| Education | 1,858 | 21.8% |
| Literature & Languages | 137 | 1.6% |
| Liberal Arts & History | 250 | 2.9% |
| Visual & Performing Arts | 309 | 3.6% |
| Communications | 284 | 3.3% |
| Arts & Humanities | 511 | 6.0% |
| Total | 8,517 | 100.0% |
Transportation & Commute in Grant County
Vehicle Availability by Sex in Grant County
The most prevalent vehicle ownership categories in Grant County are males with 2 vehicles (5,115, accounting for 38.3%) and females with 2 vehicles (4,510, making up 45.4%).
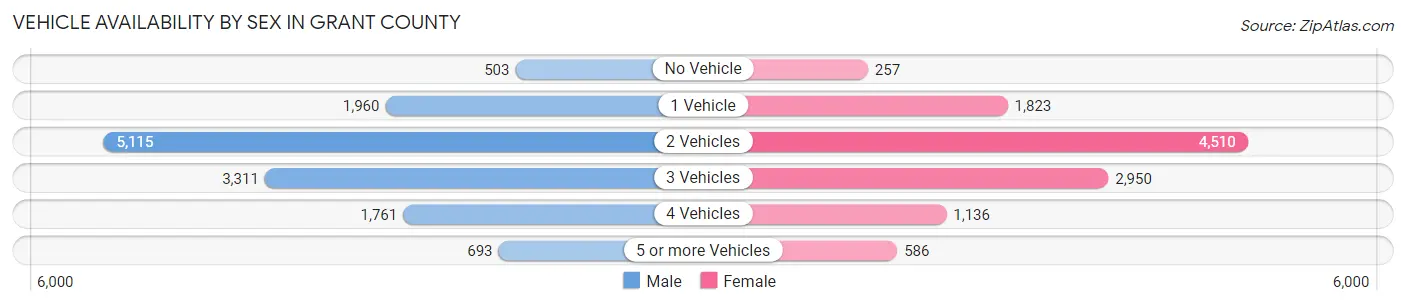
| Vehicles Available | Male | Female |
| No Vehicle | 503 (3.8%) | 257 (2.3%) |
| 1 Vehicle | 1,960 (14.7%) | 1,823 (16.2%) |
| 2 Vehicles | 5,115 (38.3%) | 4,510 (40.1%) |
| 3 Vehicles | 3,311 (24.8%) | 2,950 (26.2%) |
| 4 Vehicles | 1,761 (13.2%) | 1,136 (10.1%) |
| 5 or more Vehicles | 693 (5.2%) | 586 (5.2%) |
| Total | 13,343 (100.0%) | 11,262 (100.0%) |
Commute Time in Grant County
The most frequently occuring commute durations in Grant County are 5 to 9 minutes (4,733 commuters, 20.4%), 10 to 14 minutes (3,342 commuters, 14.4%), and 20 to 24 minutes (2,724 commuters, 11.7%).
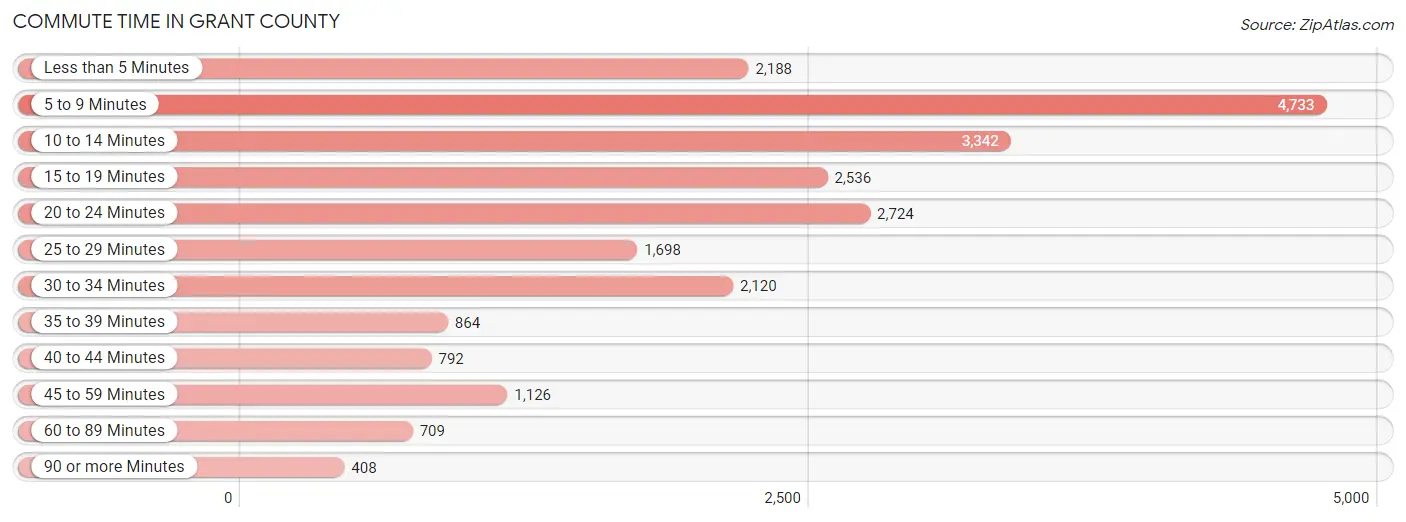
| Commute Time | # Commuters | % Commuters |
| Less than 5 Minutes | 2,188 | 9.4% |
| 5 to 9 Minutes | 4,733 | 20.4% |
| 10 to 14 Minutes | 3,342 | 14.4% |
| 15 to 19 Minutes | 2,536 | 10.9% |
| 20 to 24 Minutes | 2,724 | 11.7% |
| 25 to 29 Minutes | 1,698 | 7.3% |
| 30 to 34 Minutes | 2,120 | 9.1% |
| 35 to 39 Minutes | 864 | 3.7% |
| 40 to 44 Minutes | 792 | 3.4% |
| 45 to 59 Minutes | 1,126 | 4.9% |
| 60 to 89 Minutes | 709 | 3.0% |
| 90 or more Minutes | 408 | 1.8% |
Commute Time by Sex in Grant County
The most common commute times in Grant County are 5 to 9 minutes (2,463 commuters, 19.7%) for males and 5 to 9 minutes (2,270 commuters, 21.2%) for females.
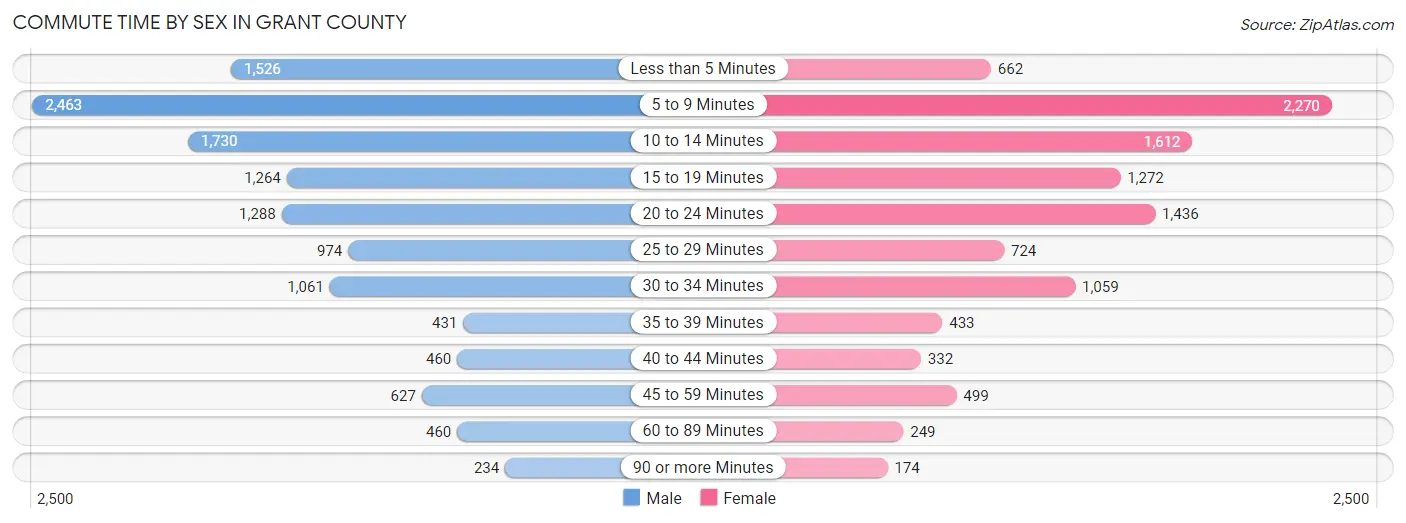
| Commute Time | Male | Female |
| Less than 5 Minutes | 1,526 (12.2%) | 662 (6.2%) |
| 5 to 9 Minutes | 2,463 (19.7%) | 2,270 (21.2%) |
| 10 to 14 Minutes | 1,730 (13.8%) | 1,612 (15.0%) |
| 15 to 19 Minutes | 1,264 (10.1%) | 1,272 (11.9%) |
| 20 to 24 Minutes | 1,288 (10.3%) | 1,436 (13.4%) |
| 25 to 29 Minutes | 974 (7.8%) | 724 (6.8%) |
| 30 to 34 Minutes | 1,061 (8.5%) | 1,059 (9.9%) |
| 35 to 39 Minutes | 431 (3.4%) | 433 (4.0%) |
| 40 to 44 Minutes | 460 (3.7%) | 332 (3.1%) |
| 45 to 59 Minutes | 627 (5.0%) | 499 (4.6%) |
| 60 to 89 Minutes | 460 (3.7%) | 249 (2.3%) |
| 90 or more Minutes | 234 (1.9%) | 174 (1.6%) |
Time of Departure to Work by Sex in Grant County
The most frequent times of departure to work in Grant County are 7:00 AM to 7:29 AM (1,763, 14.1%) for males and 7:00 AM to 7:29 AM (2,267, 21.1%) for females.
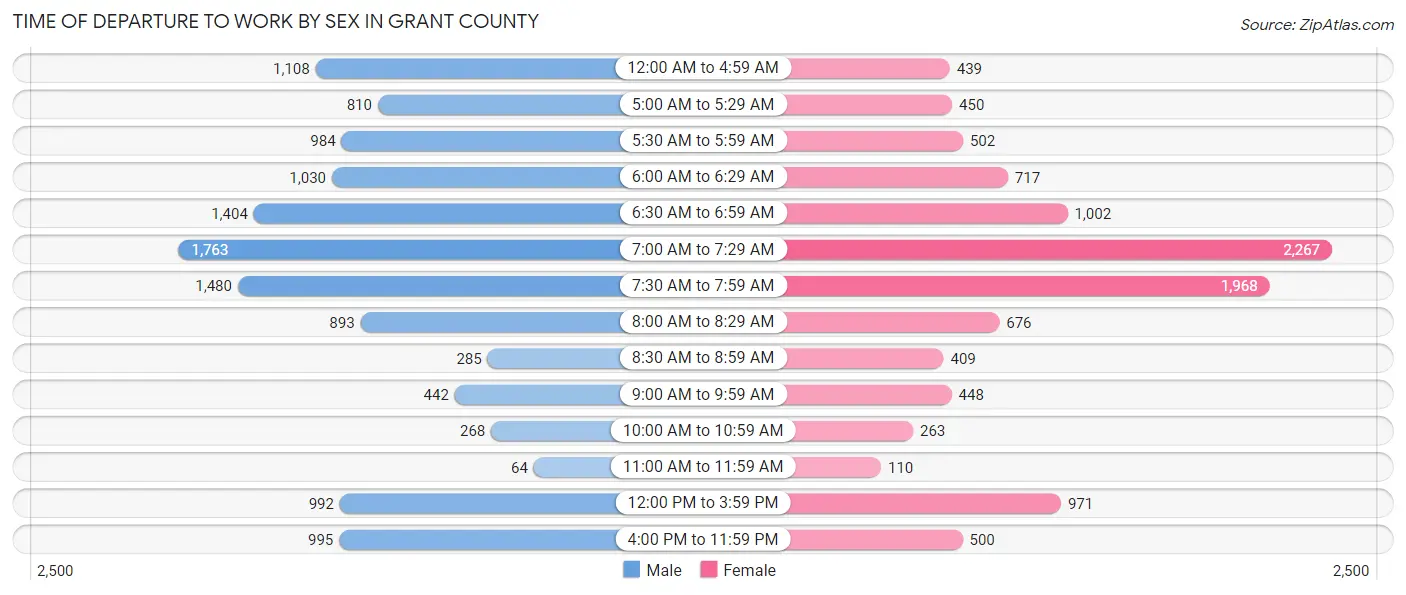
| Time of Departure | Male | Female |
| 12:00 AM to 4:59 AM | 1,108 (8.8%) | 439 (4.1%) |
| 5:00 AM to 5:29 AM | 810 (6.5%) | 450 (4.2%) |
| 5:30 AM to 5:59 AM | 984 (7.9%) | 502 (4.7%) |
| 6:00 AM to 6:29 AM | 1,030 (8.2%) | 717 (6.7%) |
| 6:30 AM to 6:59 AM | 1,404 (11.2%) | 1,002 (9.3%) |
| 7:00 AM to 7:29 AM | 1,763 (14.1%) | 2,267 (21.1%) |
| 7:30 AM to 7:59 AM | 1,480 (11.8%) | 1,968 (18.3%) |
| 8:00 AM to 8:29 AM | 893 (7.1%) | 676 (6.3%) |
| 8:30 AM to 8:59 AM | 285 (2.3%) | 409 (3.8%) |
| 9:00 AM to 9:59 AM | 442 (3.5%) | 448 (4.2%) |
| 10:00 AM to 10:59 AM | 268 (2.1%) | 263 (2.5%) |
| 11:00 AM to 11:59 AM | 64 (0.5%) | 110 (1.0%) |
| 12:00 PM to 3:59 PM | 992 (7.9%) | 971 (9.1%) |
| 4:00 PM to 11:59 PM | 995 (8.0%) | 500 (4.7%) |
| Total | 12,518 (100.0%) | 10,722 (100.0%) |
Housing Occupancy in Grant County
Occupancy by Ownership in Grant County
Of the total 19,863 dwellings in Grant County, owner-occupied units account for 13,839 (69.7%), while renter-occupied units make up 6,024 (30.3%).
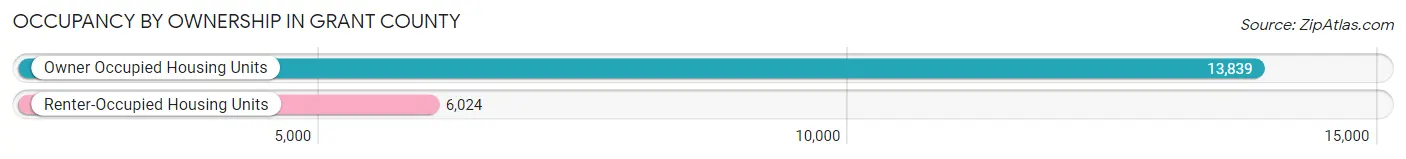
| Occupancy | # Housing Units | % Housing Units |
| Owner Occupied Housing Units | 13,839 | 69.7% |
| Renter-Occupied Housing Units | 6,024 | 30.3% |
| Total Occupied Housing Units | 19,863 | 100.0% |
Occupancy by Household Size in Grant County
| Household Size | # Housing Units | % Housing Units |
| 1-Person Household | 5,836 | 29.4% |
| 2-Person Household | 7,490 | 37.7% |
| 3-Person Household | 2,463 | 12.4% |
| 4+ Person Household | 4,074 | 20.5% |
| Total Housing Units | 19,863 | 100.0% |
Occupancy by Ownership by Household Size in Grant County
| Household Size | Owner-occupied | Renter-occupied |
| 1-Person Household | 3,278 (56.2%) | 2,558 (43.8%) |
| 2-Person Household | 5,795 (77.4%) | 1,695 (22.6%) |
| 3-Person Household | 1,719 (69.8%) | 744 (30.2%) |
| 4+ Person Household | 3,047 (74.8%) | 1,027 (25.2%) |
| Total Housing Units | 13,839 (69.7%) | 6,024 (30.3%) |
Occupancy by Educational Attainment in Grant County
| Household Size | Owner-occupied | Renter-occupied |
| Less than High School | 646 (57.4%) | 479 (42.6%) |
| High School Diploma | 4,408 (71.3%) | 1,776 (28.7%) |
| College/Associate Degree | 5,005 (65.0%) | 2,696 (35.0%) |
| Bachelor's Degree or higher | 3,780 (77.9%) | 1,073 (22.1%) |
Occupancy by Age of Householder in Grant County
| Age Bracket | # Households | % Households |
| Under 35 Years | 4,403 | 22.2% |
| 35 to 44 Years | 3,103 | 15.6% |
| 45 to 54 Years | 2,901 | 14.6% |
| 55 to 64 Years | 3,895 | 19.6% |
| 65 to 74 Years | 3,179 | 16.0% |
| 75 to 84 Years | 1,698 | 8.6% |
| 85 Years and Over | 684 | 3.4% |
| Total | 19,863 | 100.0% |
Housing Finances in Grant County
Median Income by Occupancy in Grant County
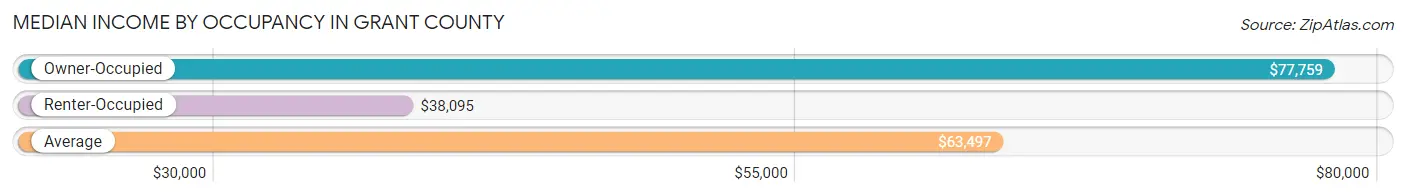
| Occupancy Type | # Households | Median Income |
| Owner-Occupied | 13,839 (69.7%) | $77,759 |
| Renter-Occupied | 6,024 (30.3%) | $38,095 |
| Average | 19,863 (100.0%) | $63,497 |
Occupancy by Householder Income Bracket in Grant County
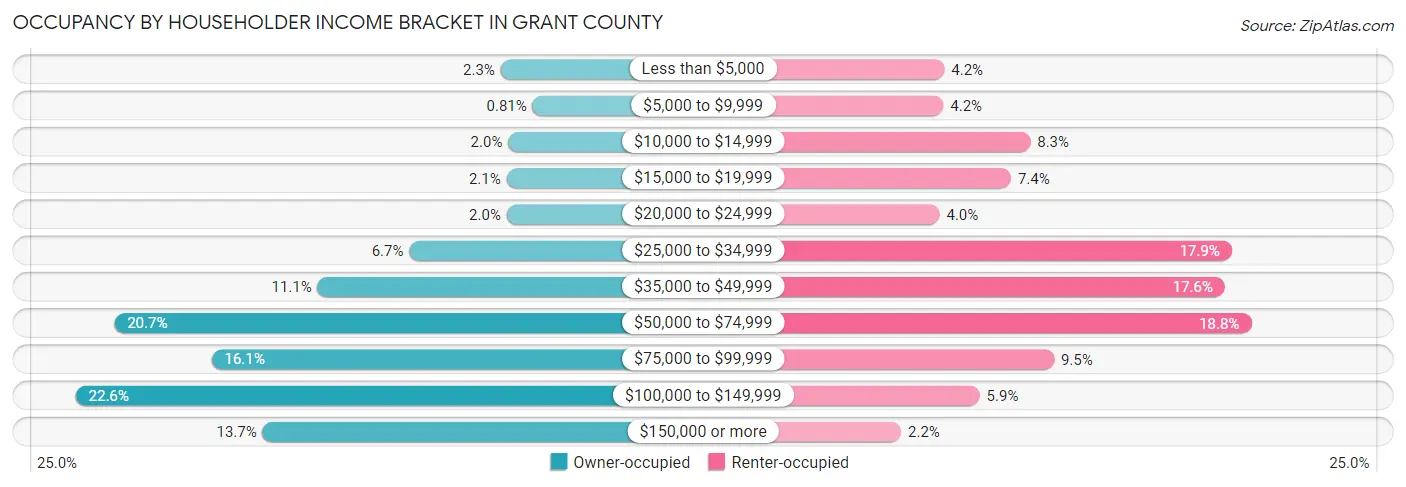
| Income Bracket | Owner-occupied | Renter-occupied |
| Less than $5,000 | 322 (2.3%) | 255 (4.2%) |
| $5,000 to $9,999 | 112 (0.8%) | 252 (4.2%) |
| $10,000 to $14,999 | 273 (2.0%) | 501 (8.3%) |
| $15,000 to $19,999 | 284 (2.1%) | 446 (7.4%) |
| $20,000 to $24,999 | 282 (2.0%) | 241 (4.0%) |
| $25,000 to $34,999 | 924 (6.7%) | 1,079 (17.9%) |
| $35,000 to $49,999 | 1,529 (11.1%) | 1,059 (17.6%) |
| $50,000 to $74,999 | 2,869 (20.7%) | 1,135 (18.8%) |
| $75,000 to $99,999 | 2,228 (16.1%) | 569 (9.5%) |
| $100,000 to $149,999 | 3,124 (22.6%) | 356 (5.9%) |
| $150,000 or more | 1,892 (13.7%) | 131 (2.2%) |
| Total | 13,839 (100.0%) | 6,024 (100.0%) |
Monthly Housing Cost Tiers in Grant County
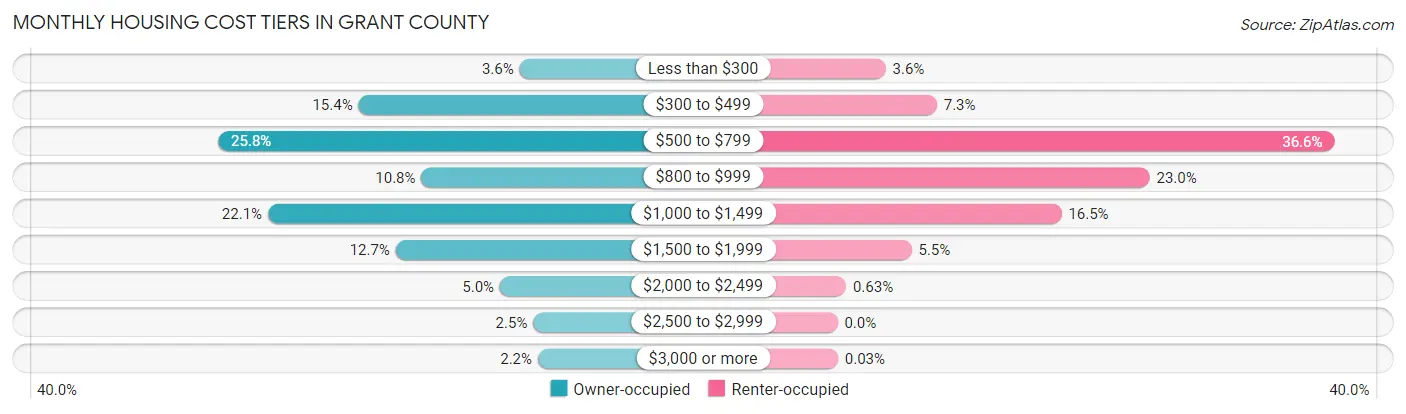
| Monthly Cost | Owner-occupied | Renter-occupied |
| Less than $300 | 491 (3.5%) | 214 (3.5%) |
| $300 to $499 | 2,133 (15.4%) | 441 (7.3%) |
| $500 to $799 | 3,565 (25.8%) | 2,204 (36.6%) |
| $800 to $999 | 1,492 (10.8%) | 1,385 (23.0%) |
| $1,000 to $1,499 | 3,056 (22.1%) | 994 (16.5%) |
| $1,500 to $1,999 | 1,754 (12.7%) | 329 (5.5%) |
| $2,000 to $2,499 | 691 (5.0%) | 38 (0.6%) |
| $2,500 to $2,999 | 352 (2.5%) | 0 (0.0%) |
| $3,000 or more | 305 (2.2%) | 2 (0.0%) |
| Total | 13,839 (100.0%) | 6,024 (100.0%) |
Physical Housing Characteristics in Grant County
Housing Structures in Grant County
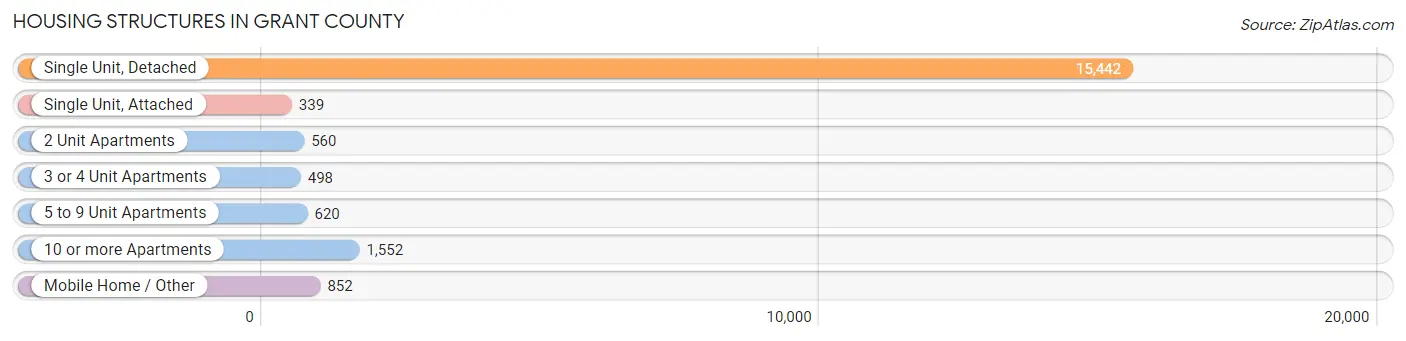
| Structure Type | # Housing Units | % Housing Units |
| Single Unit, Detached | 15,442 | 77.7% |
| Single Unit, Attached | 339 | 1.7% |
| 2 Unit Apartments | 560 | 2.8% |
| 3 or 4 Unit Apartments | 498 | 2.5% |
| 5 to 9 Unit Apartments | 620 | 3.1% |
| 10 or more Apartments | 1,552 | 7.8% |
| Mobile Home / Other | 852 | 4.3% |
| Total | 19,863 | 100.0% |
Housing Structures by Occupancy in Grant County
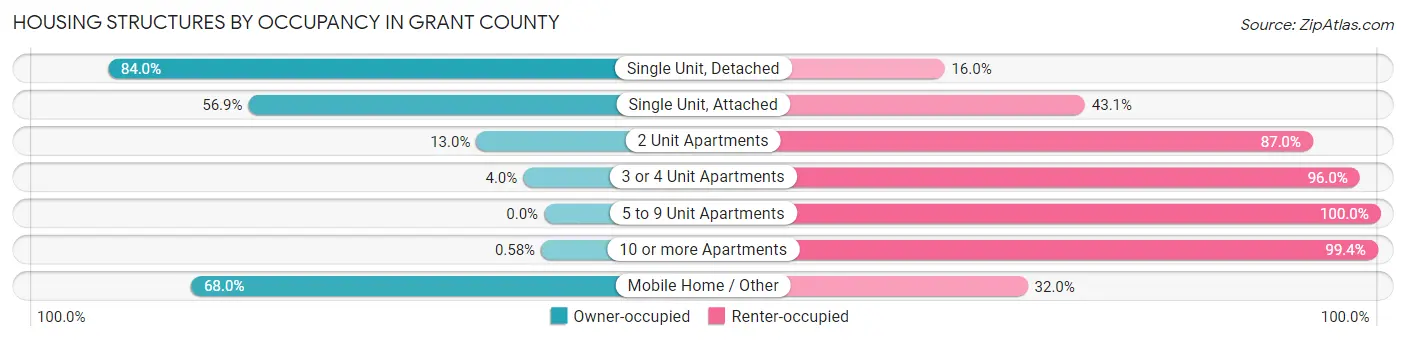
| Structure Type | Owner-occupied | Renter-occupied |
| Single Unit, Detached | 12,965 (84.0%) | 2,477 (16.0%) |
| Single Unit, Attached | 193 (56.9%) | 146 (43.1%) |
| 2 Unit Apartments | 73 (13.0%) | 487 (87.0%) |
| 3 or 4 Unit Apartments | 20 (4.0%) | 478 (96.0%) |
| 5 to 9 Unit Apartments | 0 (0.0%) | 620 (100.0%) |
| 10 or more Apartments | 9 (0.6%) | 1,543 (99.4%) |
| Mobile Home / Other | 579 (68.0%) | 273 (32.0%) |
| Total | 13,839 (69.7%) | 6,024 (30.3%) |
Housing Structures by Number of Rooms in Grant County
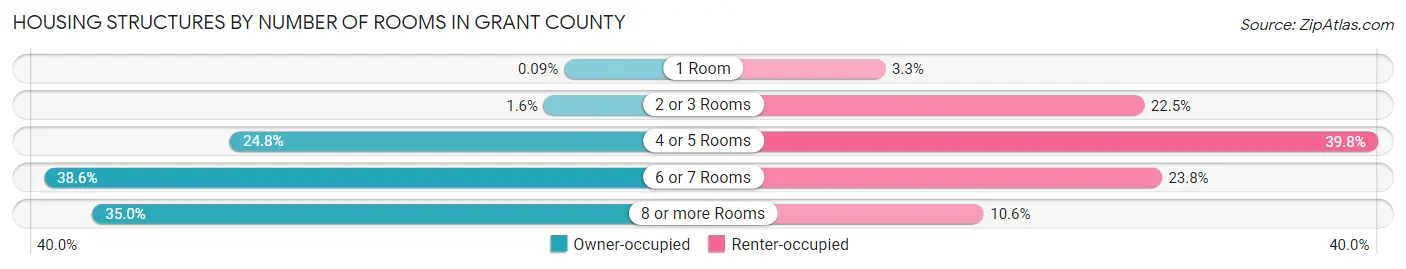
| Number of Rooms | Owner-occupied | Renter-occupied |
| 1 Room | 12 (0.1%) | 201 (3.3%) |
| 2 or 3 Rooms | 218 (1.6%) | 1,355 (22.5%) |
| 4 or 5 Rooms | 3,431 (24.8%) | 2,396 (39.8%) |
| 6 or 7 Rooms | 5,337 (38.6%) | 1,433 (23.8%) |
| 8 or more Rooms | 4,841 (35.0%) | 639 (10.6%) |
| Total | 13,839 (100.0%) | 6,024 (100.0%) |
Housing Structure by Heating Type in Grant County
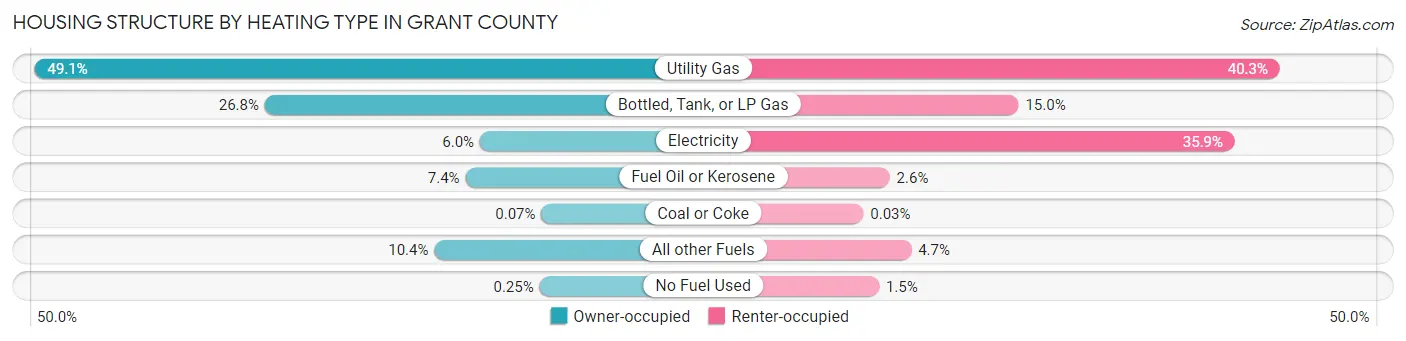
| Heating Type | Owner-occupied | Renter-occupied |
| Utility Gas | 6,788 (49.0%) | 2,425 (40.3%) |
| Bottled, Tank, or LP Gas | 3,708 (26.8%) | 905 (15.0%) |
| Electricity | 832 (6.0%) | 2,164 (35.9%) |
| Fuel Oil or Kerosene | 1,025 (7.4%) | 155 (2.6%) |
| Coal or Coke | 9 (0.1%) | 2 (0.0%) |
| All other Fuels | 1,442 (10.4%) | 280 (4.6%) |
| No Fuel Used | 35 (0.3%) | 93 (1.5%) |
| Total | 13,839 (100.0%) | 6,024 (100.0%) |
Household Vehicle Usage in Grant County
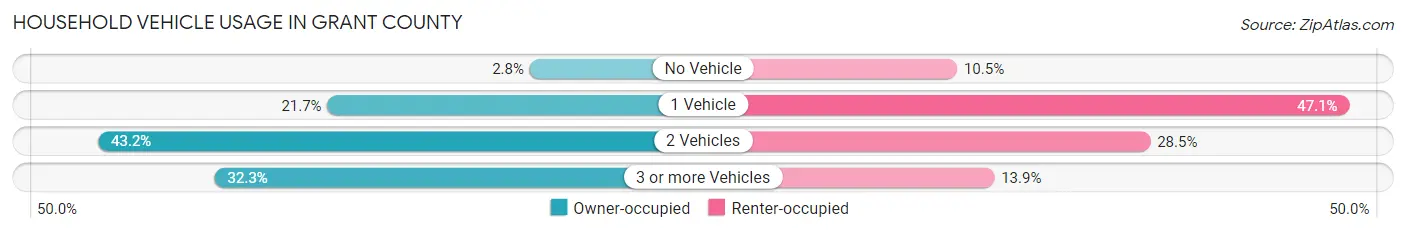
| Vehicles per Household | Owner-occupied | Renter-occupied |
| No Vehicle | 393 (2.8%) | 630 (10.5%) |
| 1 Vehicle | 3,007 (21.7%) | 2,837 (47.1%) |
| 2 Vehicles | 5,972 (43.1%) | 1,717 (28.5%) |
| 3 or more Vehicles | 4,467 (32.3%) | 840 (13.9%) |
| Total | 13,839 (100.0%) | 6,024 (100.0%) |
Real Estate & Mortgages in Grant County
Real Estate and Mortgage Overview in Grant County
| Characteristic | Without Mortgage | With Mortgage |
| Housing Units | 6,556 | 7,283 |
| Median Property Value | $165,100 | $184,600 |
| Median Household Income | $60,302 | $1,181 |
| Monthly Housing Costs | $550 | $299 |
| Real Estate Taxes | $2,661 | $17 |
Property Value by Mortgage Status in Grant County
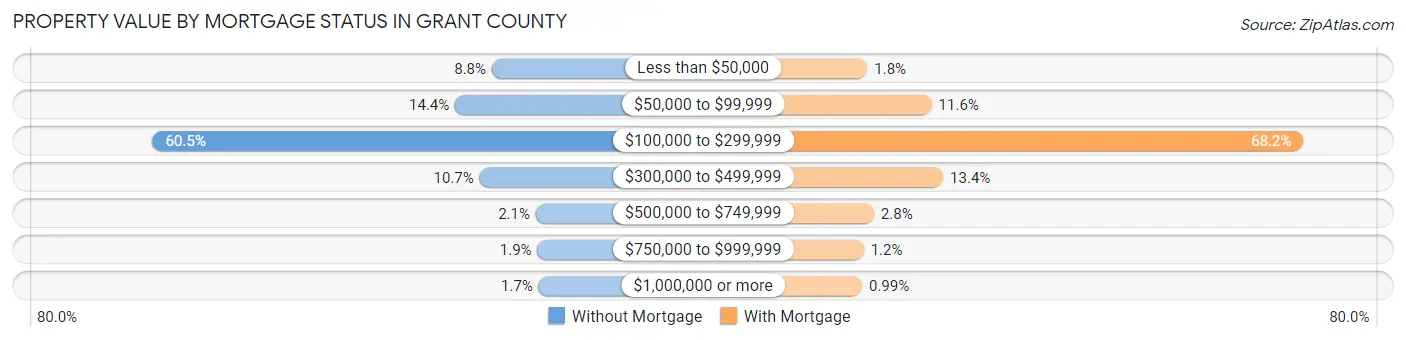
| Property Value | Without Mortgage | With Mortgage |
| Less than $50,000 | 577 (8.8%) | 131 (1.8%) |
| $50,000 to $99,999 | 944 (14.4%) | 845 (11.6%) |
| $100,000 to $299,999 | 3,967 (60.5%) | 4,969 (68.2%) |
| $300,000 to $499,999 | 700 (10.7%) | 972 (13.4%) |
| $500,000 to $749,999 | 138 (2.1%) | 204 (2.8%) |
| $750,000 to $999,999 | 121 (1.8%) | 90 (1.2%) |
| $1,000,000 or more | 109 (1.7%) | 72 (1.0%) |
| Total | 6,556 (100.0%) | 7,283 (100.0%) |
Household Income by Mortgage Status in Grant County
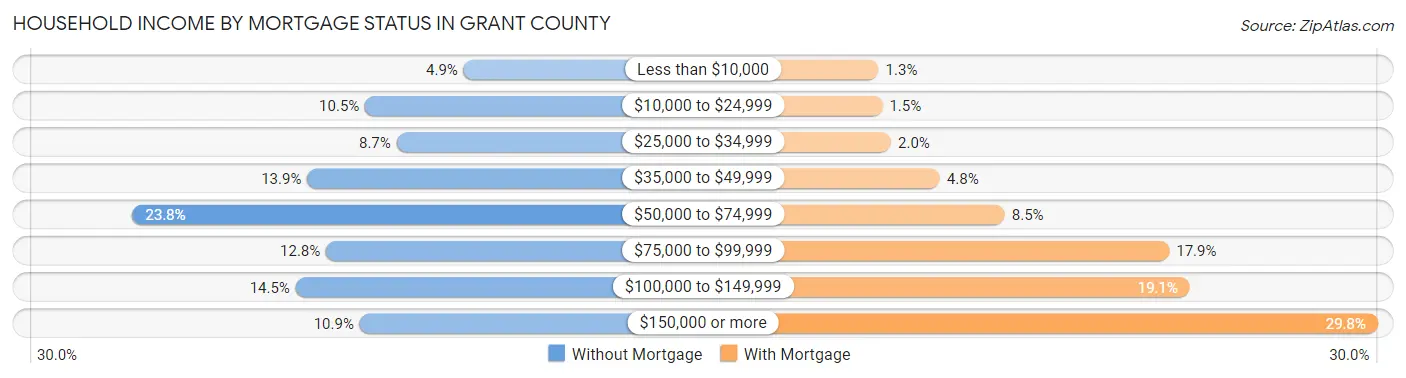
| Household Income | Without Mortgage | With Mortgage |
| Less than $10,000 | 322 (4.9%) | 96 (1.3%) |
| $10,000 to $24,999 | 691 (10.5%) | 112 (1.5%) |
| $25,000 to $34,999 | 573 (8.7%) | 148 (2.0%) |
| $35,000 to $49,999 | 908 (13.9%) | 351 (4.8%) |
| $50,000 to $74,999 | 1,563 (23.8%) | 621 (8.5%) |
| $75,000 to $99,999 | 837 (12.8%) | 1,306 (17.9%) |
| $100,000 to $149,999 | 951 (14.5%) | 1,391 (19.1%) |
| $150,000 or more | 711 (10.8%) | 2,173 (29.8%) |
| Total | 6,556 (100.0%) | 7,283 (100.0%) |
Property Value to Household Income Ratio in Grant County
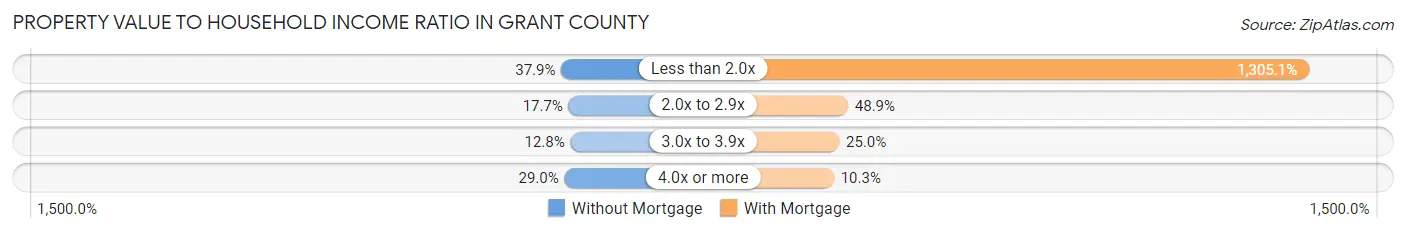
| Value-to-Income Ratio | Without Mortgage | With Mortgage |
| Less than 2.0x | 2,484 (37.9%) | 95,051 (1,305.1%) |
| 2.0x to 2.9x | 1,162 (17.7%) | 3,558 (48.8%) |
| 3.0x to 3.9x | 837 (12.8%) | 1,819 (25.0%) |
| 4.0x or more | 1,904 (29.0%) | 752 (10.3%) |
| Total | 6,556 (100.0%) | 7,283 (100.0%) |
Real Estate Taxes by Mortgage Status in Grant County
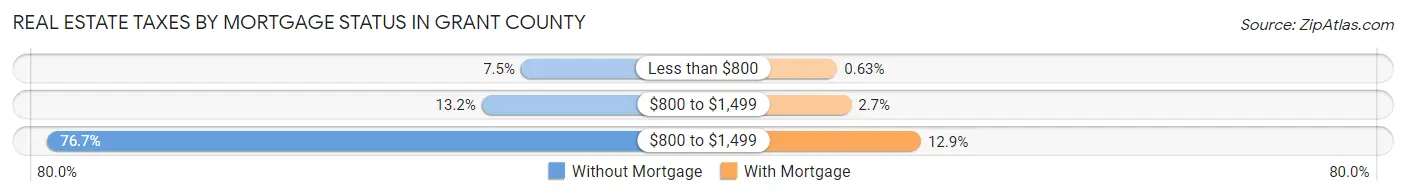
| Property Taxes | Without Mortgage | With Mortgage |
| Less than $800 | 492 (7.5%) | 46 (0.6%) |
| $800 to $1,499 | 867 (13.2%) | 194 (2.7%) |
| $800 to $1,499 | 5,027 (76.7%) | 936 (12.9%) |
| Total | 6,556 (100.0%) | 7,283 (100.0%) |
Health & Disability in Grant County
Health Insurance Coverage by Age in Grant County
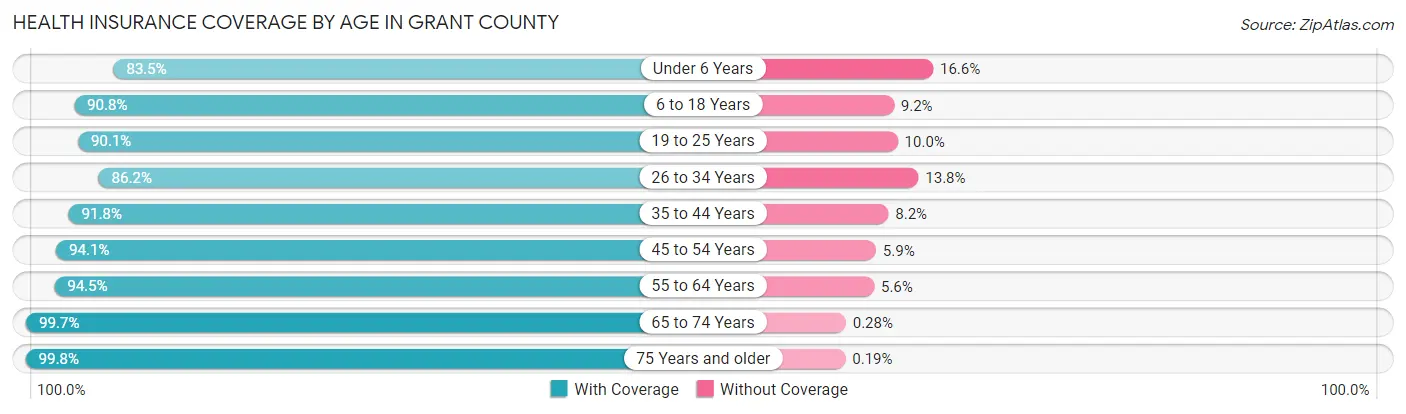
| Age Bracket | With Coverage | Without Coverage |
| Under 6 Years | 2,960 (83.5%) | 587 (16.6%) |
| 6 to 18 Years | 8,028 (90.8%) | 817 (9.2%) |
| 19 to 25 Years | 6,730 (90.0%) | 744 (10.0%) |
| 26 to 34 Years | 4,255 (86.2%) | 682 (13.8%) |
| 35 to 44 Years | 4,988 (91.8%) | 446 (8.2%) |
| 45 to 54 Years | 4,829 (94.1%) | 302 (5.9%) |
| 55 to 64 Years | 6,275 (94.5%) | 369 (5.6%) |
| 65 to 74 Years | 5,062 (99.7%) | 14 (0.3%) |
| 75 Years and older | 3,656 (99.8%) | 7 (0.2%) |
| Total | 46,783 (92.2%) | 3,968 (7.8%) |
Health Insurance Coverage by Citizenship Status in Grant County
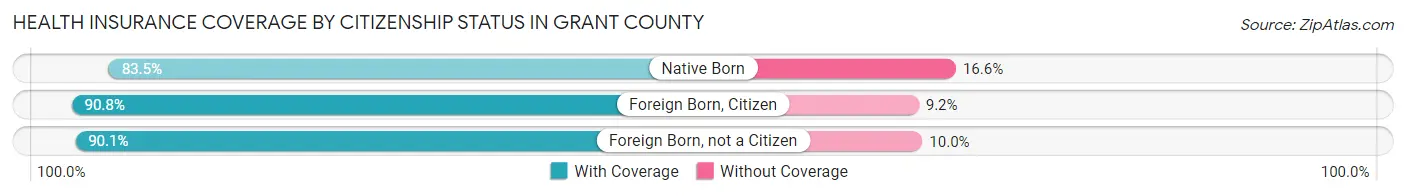
| Citizenship Status | With Coverage | Without Coverage |
| Native Born | 2,960 (83.5%) | 587 (16.6%) |
| Foreign Born, Citizen | 8,028 (90.8%) | 817 (9.2%) |
| Foreign Born, not a Citizen | 6,730 (90.0%) | 744 (10.0%) |
Health Insurance Coverage by Household Income in Grant County
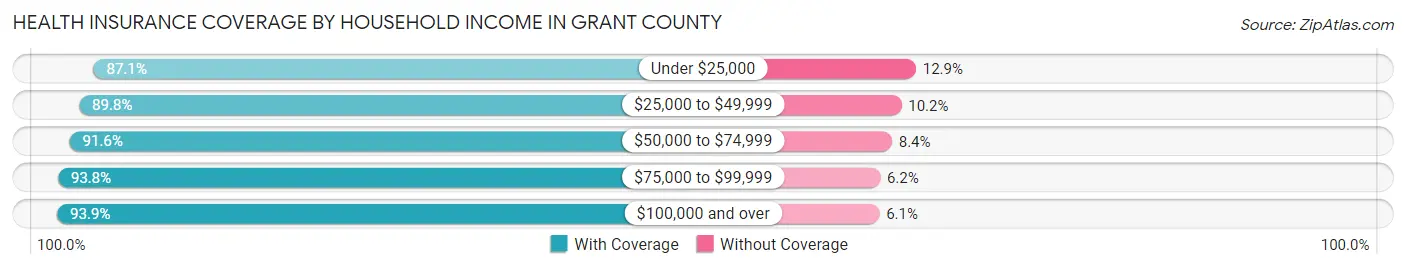
| Household Income | With Coverage | Without Coverage |
| Under $25,000 | 4,390 (87.1%) | 652 (12.9%) |
| $25,000 to $49,999 | 8,184 (89.8%) | 931 (10.2%) |
| $50,000 to $74,999 | 8,218 (91.6%) | 757 (8.4%) |
| $75,000 to $99,999 | 7,288 (93.8%) | 483 (6.2%) |
| $100,000 and over | 16,270 (93.9%) | 1,053 (6.1%) |
Public vs Private Health Insurance Coverage by Age in Grant County
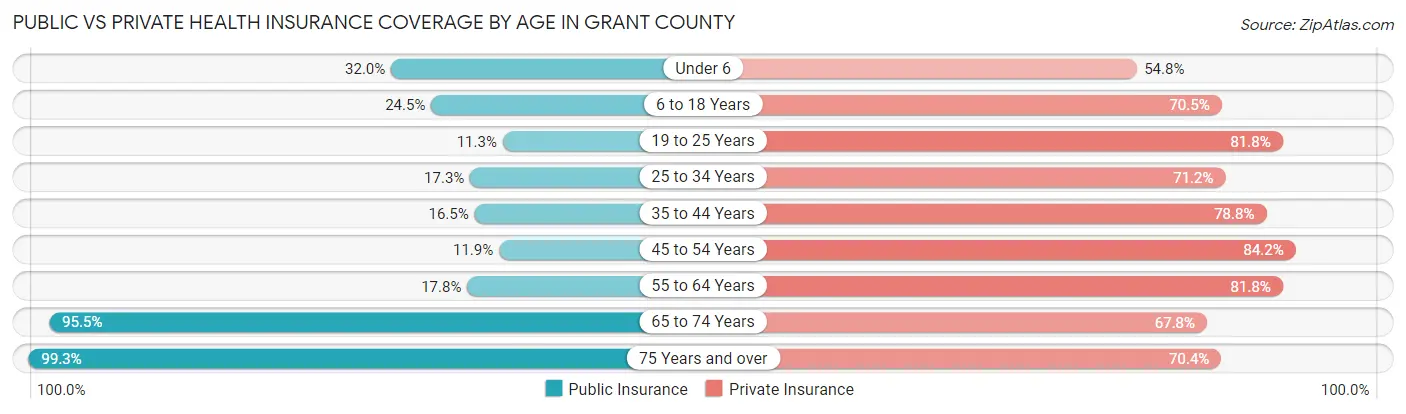
| Age Bracket | Public Insurance | Private Insurance |
| Under 6 | 1,134 (32.0%) | 1,945 (54.8%) |
| 6 to 18 Years | 2,169 (24.5%) | 6,233 (70.5%) |
| 19 to 25 Years | 841 (11.3%) | 6,113 (81.8%) |
| 25 to 34 Years | 854 (17.3%) | 3,514 (71.2%) |
| 35 to 44 Years | 896 (16.5%) | 4,281 (78.8%) |
| 45 to 54 Years | 612 (11.9%) | 4,321 (84.2%) |
| 55 to 64 Years | 1,185 (17.8%) | 5,436 (81.8%) |
| 65 to 74 Years | 4,845 (95.5%) | 3,439 (67.7%) |
| 75 Years and over | 3,637 (99.3%) | 2,579 (70.4%) |
| Total | 16,173 (31.9%) | 37,861 (74.6%) |
Disability Status by Sex by Age in Grant County
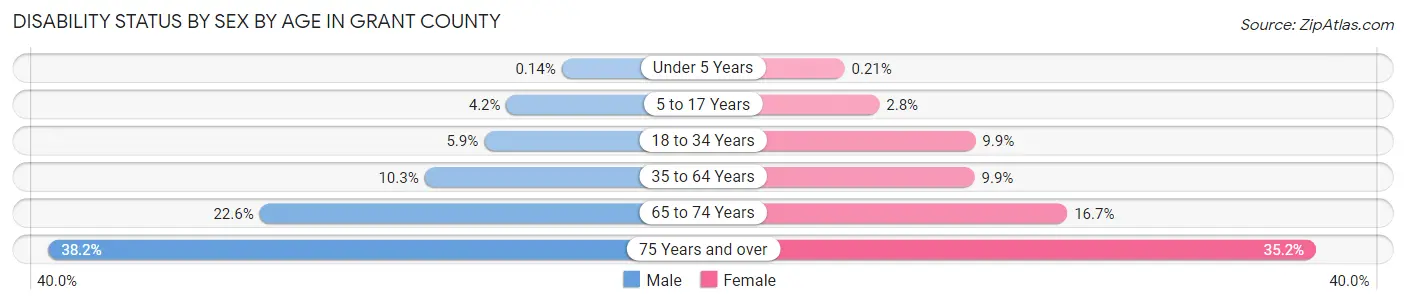
| Age Bracket | Male | Female |
| Under 5 Years | 2 (0.1%) | 3 (0.2%) |
| 5 to 17 Years | 170 (4.2%) | 108 (2.8%) |
| 18 to 34 Years | 468 (5.9%) | 599 (9.9%) |
| 35 to 64 Years | 914 (10.3%) | 823 (9.9%) |
| 65 to 74 Years | 563 (22.6%) | 432 (16.7%) |
| 75 Years and over | 548 (38.2%) | 785 (35.2%) |
Disability Class by Sex by Age in Grant County
Disability Class: Hearing Difficulty
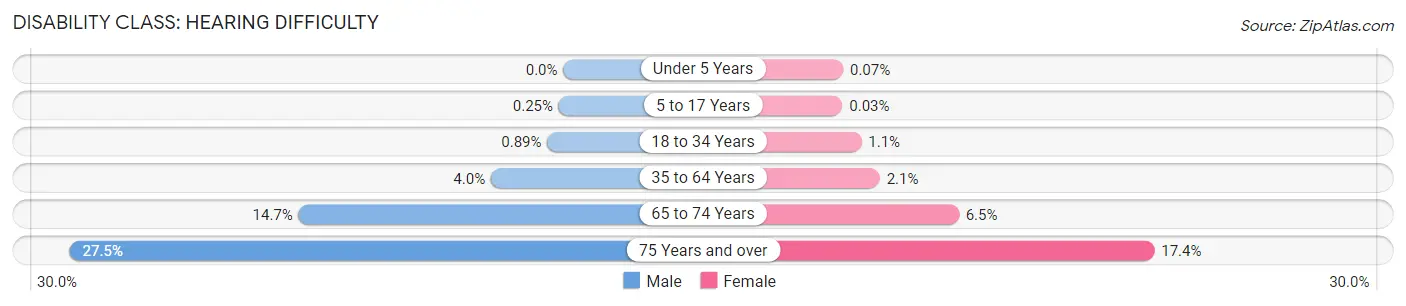
| Age Bracket | Male | Female |
| Under 5 Years | 0 (0.0%) | 1 (0.1%) |
| 5 to 17 Years | 10 (0.3%) | 1 (0.0%) |
| 18 to 34 Years | 71 (0.9%) | 66 (1.1%) |
| 35 to 64 Years | 357 (4.0%) | 176 (2.1%) |
| 65 to 74 Years | 368 (14.7%) | 168 (6.5%) |
| 75 Years and over | 394 (27.5%) | 388 (17.4%) |
Disability Class: Vision Difficulty
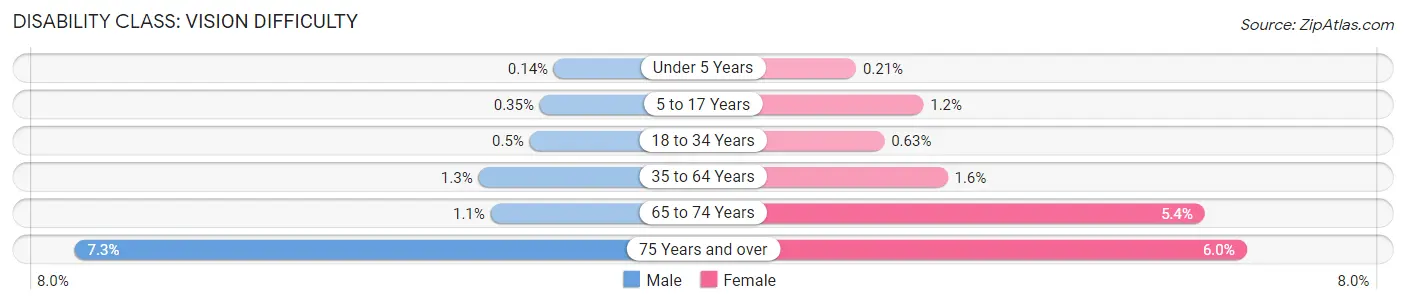
| Age Bracket | Male | Female |
| Under 5 Years | 2 (0.1%) | 3 (0.2%) |
| 5 to 17 Years | 14 (0.4%) | 47 (1.2%) |
| 18 to 34 Years | 40 (0.5%) | 38 (0.6%) |
| 35 to 64 Years | 112 (1.3%) | 131 (1.6%) |
| 65 to 74 Years | 27 (1.1%) | 139 (5.4%) |
| 75 Years and over | 104 (7.3%) | 134 (6.0%) |
Disability Class: Cognitive Difficulty
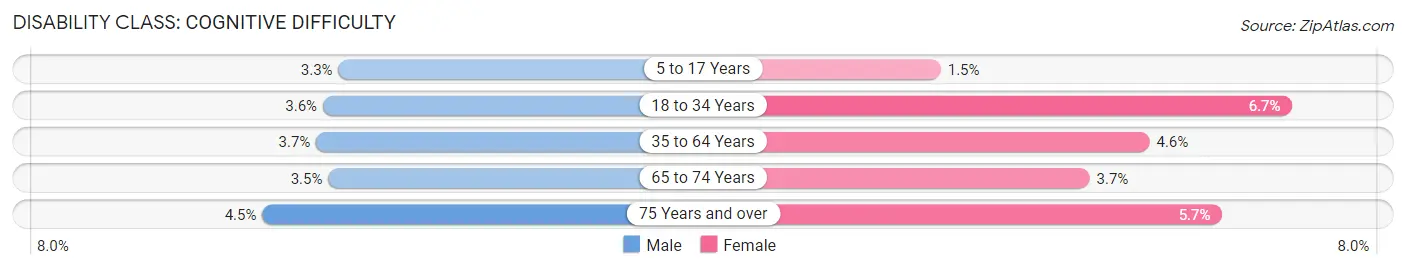
| Age Bracket | Male | Female |
| 5 to 17 Years | 134 (3.3%) | 57 (1.5%) |
| 18 to 34 Years | 284 (3.6%) | 404 (6.7%) |
| 35 to 64 Years | 325 (3.7%) | 381 (4.6%) |
| 65 to 74 Years | 87 (3.5%) | 95 (3.7%) |
| 75 Years and over | 64 (4.5%) | 126 (5.7%) |
Disability Class: Ambulatory Difficulty
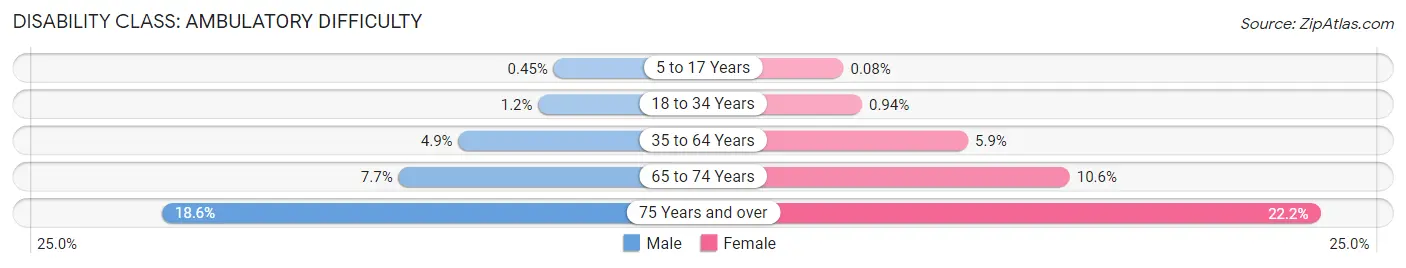
| Age Bracket | Male | Female |
| 5 to 17 Years | 18 (0.4%) | 3 (0.1%) |
| 18 to 34 Years | 92 (1.2%) | 57 (0.9%) |
| 35 to 64 Years | 432 (4.9%) | 489 (5.9%) |
| 65 to 74 Years | 191 (7.6%) | 273 (10.6%) |
| 75 Years and over | 267 (18.6%) | 495 (22.2%) |
Disability Class: Self-Care Difficulty
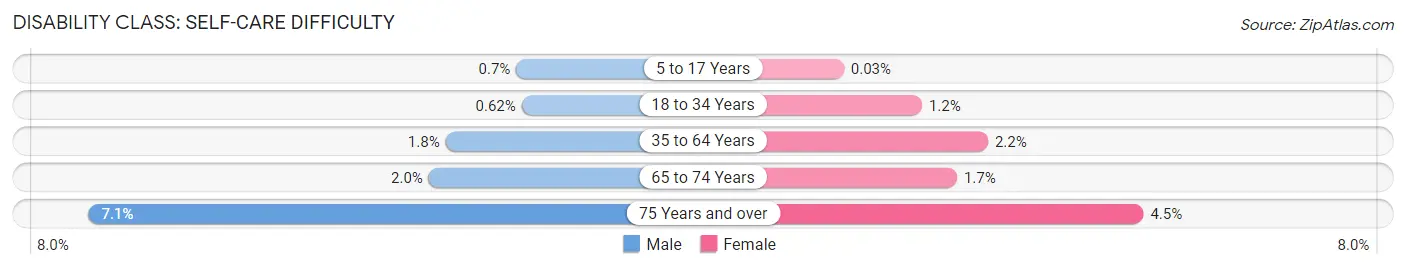
| Age Bracket | Male | Female |
| 5 to 17 Years | 28 (0.7%) | 1 (0.0%) |
| 18 to 34 Years | 49 (0.6%) | 72 (1.2%) |
| 35 to 64 Years | 155 (1.8%) | 181 (2.2%) |
| 65 to 74 Years | 50 (2.0%) | 44 (1.7%) |
| 75 Years and over | 101 (7.0%) | 100 (4.5%) |
Technology Access in Grant County
Computing Device Access in Grant County
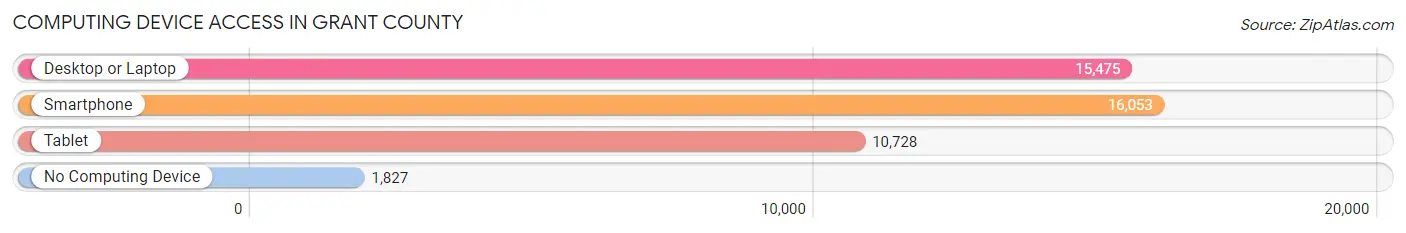
| Device Type | # Households | % Households |
| Desktop or Laptop | 15,475 | 77.9% |
| Smartphone | 16,053 | 80.8% |
| Tablet | 10,728 | 54.0% |
| No Computing Device | 1,827 | 9.2% |
| Total | 19,863 | 100.0% |
Internet Access in Grant County
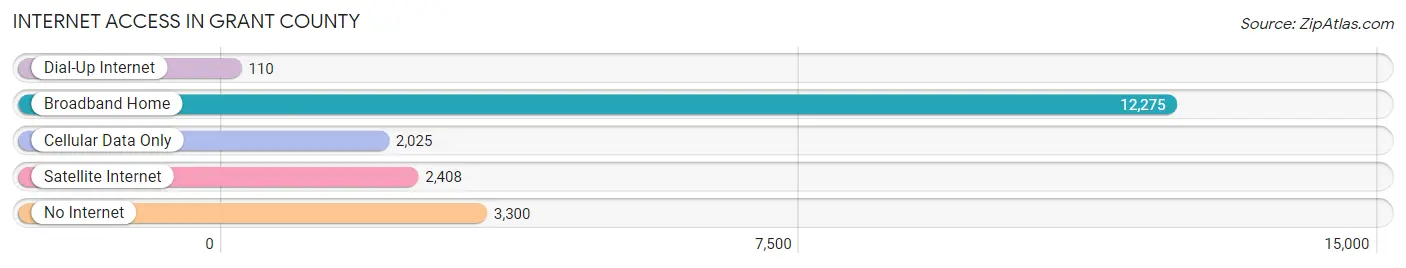
| Internet Type | # Households | % Households |
| Dial-Up Internet | 110 | 0.5% |
| Broadband Home | 12,275 | 61.8% |
| Cellular Data Only | 2,025 | 10.2% |
| Satellite Internet | 2,408 | 12.1% |
| No Internet | 3,300 | 16.6% |
| Total | 19,863 | 100.0% |
Grant County Summary
County History
Grant County, Wisconsin is located in the southwestern corner of the state and is bordered by Iowa to the west and Minnesota to the north. The county was established in 1836 and was named after Ulysses S. Grant, the 18th President of the United States. The county was originally part of the Wisconsin Territory and was one of the original counties established when Wisconsin became a state in 1848.
The first settlers in the area were mostly of German and Irish descent. The first permanent settlement was established in 1845 by a group of German immigrants led by John G. Ullrich. The settlers were attracted to the area by the abundance of natural resources, including timber, water, and fertile soil.
The county was primarily an agricultural area for much of its history. The main crops were corn, wheat, and oats. Dairy farming was also an important part of the economy. The county was also home to several small towns, including Lancaster, Platteville, and Fennimore.
The county experienced a population boom in the late 19th and early 20th centuries, as immigrants from Europe and other parts of the United States moved to the area. The population peaked in 1920, when it reached nearly 40,000.
Geography
Grant County is located in the southwestern corner of Wisconsin and is bordered by Iowa to the west and Minnesota to the north. The county covers an area of 1,072 square miles and is the fifth largest county in the state. The county is mostly rural, with the majority of the land being used for agricultural purposes.
The county is divided into two distinct regions: the Driftless Area and the Central Plain. The Driftless Area is located in the western part of the county and is characterized by rolling hills and valleys. The Central Plain is located in the eastern part of the county and is characterized by flat, open land.
The county is home to several rivers, including the Wisconsin, Pecatonica, and Platte. The Wisconsin River forms the western border of the county. The county also contains several lakes, including Lake Petenwell, the second largest lake in Wisconsin.
Economy
The economy of Grant County is largely based on agriculture. The main crops are corn, wheat, and oats. Dairy farming is also an important part of the economy. The county is also home to several small businesses, including manufacturing, retail, and tourism.
The county is home to several higher education institutions, including the University of Wisconsin-Platteville and Southwest Wisconsin Technical College. The county is also home to several state parks, including Wyalusing State Park and Tower Hill State Park.
Demographics
As of the 2010 census, the population of Grant County was 50,743. The population is mostly white (96.2%), with small percentages of African American (1.2%), Hispanic (1.1%), and Asian (0.7%) residents. The median household income is $50,945, and the median age is 40.
The county is home to several small towns, including Lancaster, Platteville, and Fennimore. The county seat is Lancaster, which is the largest city in the county with a population of 10,845. The county is also home to several unincorporated communities, including Beetown, Bloomington, and Woodman.
Common Questions
What is the Total Population of Grant County?
Total Population of Grant County is 51,842.
What is the Total Male Population of Grant County?
Total Male Population of Grant County is 26,948.
What is the Total Female Population of Grant County?
Total Female Population of Grant County is 24,894.
What is the Ratio of Males per 100 Females in Grant County?
There are 108.25 Males per 100 Females in Grant County.
What is the Ratio of Females per 100 Males in Grant County?
There are 92.38 Females per 100 Males in Grant County.
What is the Median Population Age in Grant County?
Median Population Age in Grant County is 36.8 Years.
What is the Average Family Size in Grant County
Average Family Size in Grant County is 3.0 People.
What is the Average Household Size in Grant County
Average Household Size in Grant County is 2.4 People.
What is Per Capita Income in Grant County?
Per Capita income in Grant County is $32,097.
What is the Median Family Income in Grant County?
Median Family Income in Grant County is $83,145.
What is the Median Household income in Grant County?
Median Household Income in Grant County is $63,497.
What is Income or Wage Gap in Grant County?
Income or Wage Gap in Grant County is 20.1%.
Women in Grant County earn 79.9 cents for every dollar earned by a man.
What is Family Income Deficit in Grant County?
Family Income Deficit in Grant County is $11,844.
Families that are below poverty line in Grant County earn $11,844 less on average than the poverty threshold level.
What is Inequality or Gini Index in Grant County?
Inequality or Gini Index in Grant County is 0.43.
How Large is the Labor Force in Grant County?
There are 27,033 People in the Labor Forcein in Grant County.
What is the Percentage of People in the Labor Force in Grant County?
64.0% of People are in the Labor Force in Grant County.
What is the Unemployment Rate in Grant County?
Unemployment Rate in Grant County is 3.1%.