Fond du Lac County, WI
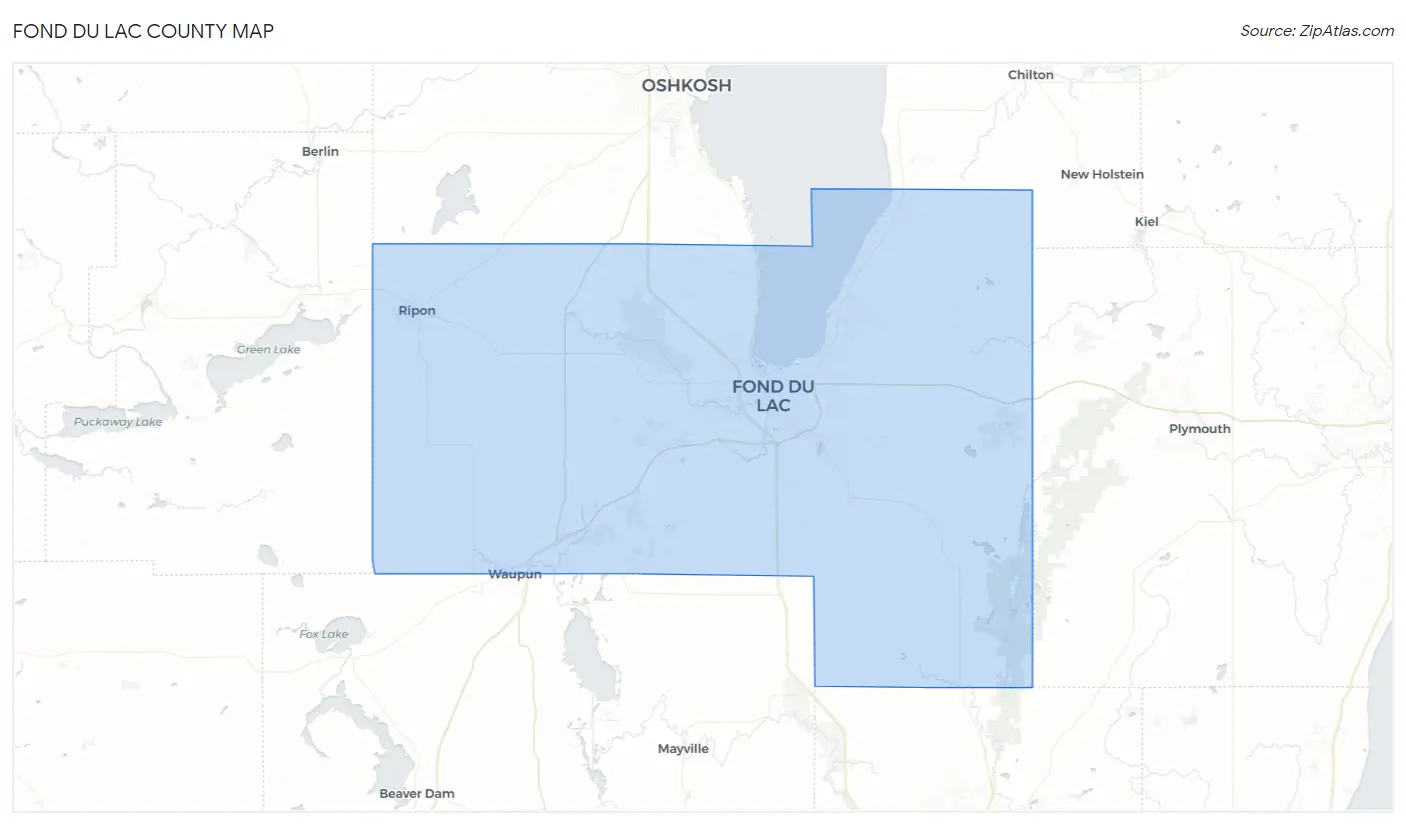
Fond du Lac County Map
Fond du Lac County Overview
104,027
TOTAL POPULATION
51,551
MALE POPULATION
52,476
FEMALE POPULATION
98.24
MALES / 100 FEMALES
101.79
FEMALES / 100 MALES
41.9
MEDIAN AGE
3.0
AVG FAMILY SIZE
2.4
AVG HOUSEHOLD SIZE
$36,824
PER CAPITA INCOME
$93,158
AVG FAMILY INCOME
$70,368
AVG HOUSEHOLD INCOME
35.8%
WAGE / INCOME GAP [ % ]
64.2¢/ $1
WAGE / INCOME GAP [ $ ]
$10,438
FAMILY INCOME DEFICIT
0.41
INEQUALITY / GINI INDEX
55,223
LABOR FORCE [ PEOPLE ]
65.1%
PERCENT IN LABOR FORCE
3.3%
UNEMPLOYMENT RATE
Fond du Lac County Area Codes
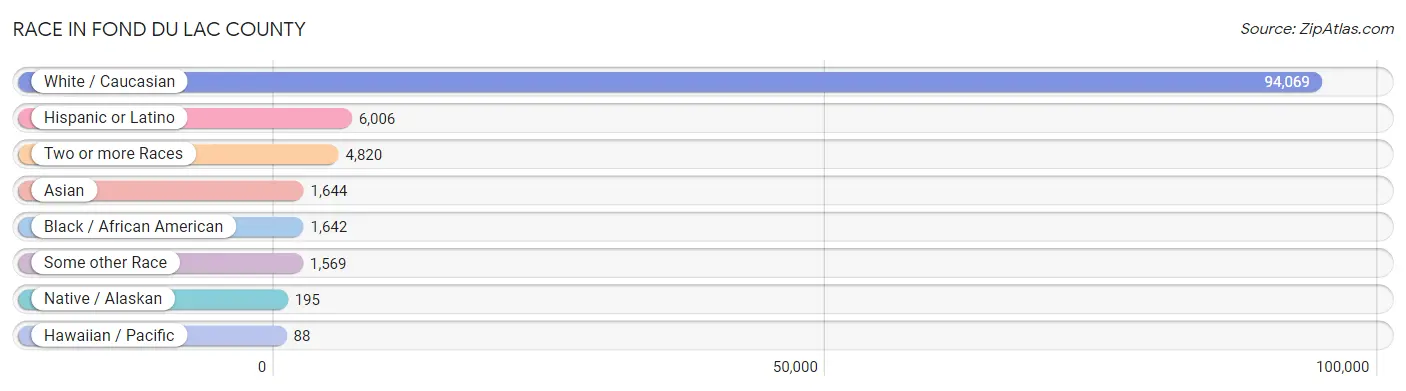
Race in Fond du Lac County
The most populous races in Fond du Lac County are White / Caucasian (94,069 | 90.4%), Hispanic or Latino (6,006 | 5.8%), and Two or more Races (4,820 | 4.6%).
| Race | # Population | % Population |
| Asian | 1,644 | 1.6% |
| Black / African American | 1,642 | 1.6% |
| Hawaiian / Pacific | 88 | 0.1% |
| Hispanic or Latino | 6,006 | 5.8% |
| Native / Alaskan | 195 | 0.2% |
| White / Caucasian | 94,069 | 90.4% |
| Two or more Races | 4,820 | 4.6% |
| Some other Race | 1,569 | 1.5% |
| Total | 104,027 | 100.0% |
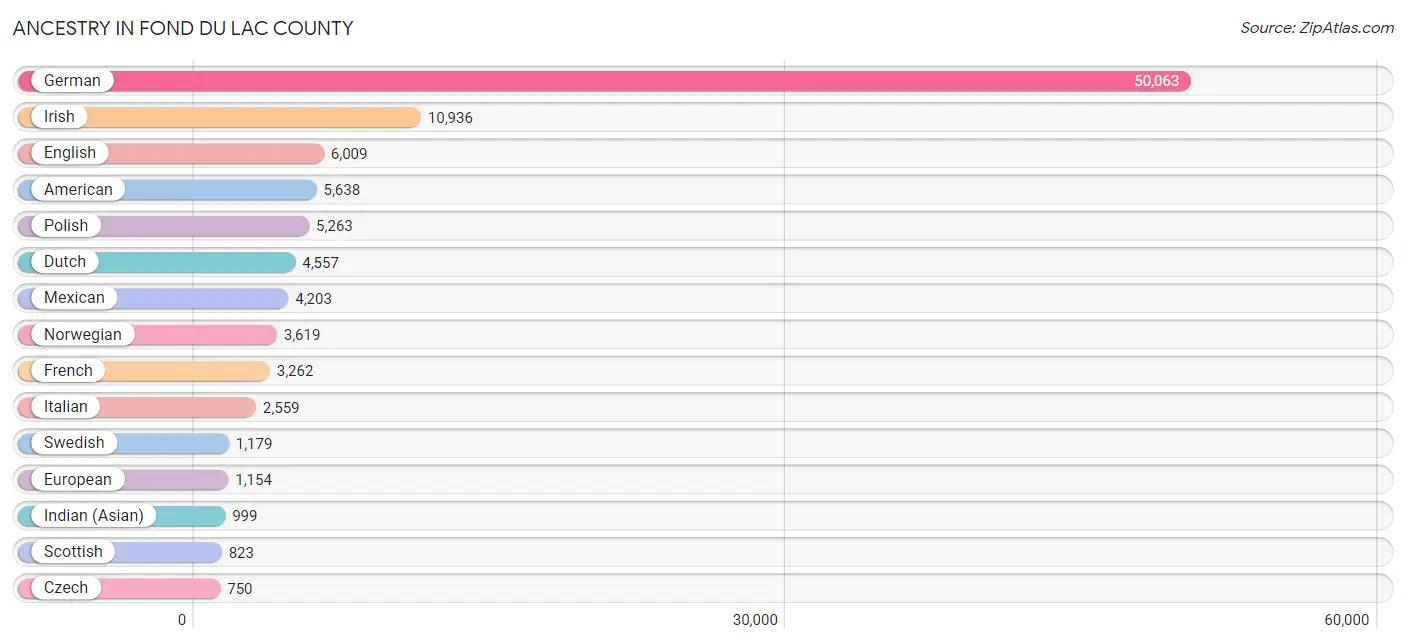
Ancestry in Fond du Lac County
The most populous ancestries reported in Fond du Lac County are German (50,063 | 48.1%), Irish (10,936 | 10.5%), English (6,009 | 5.8%), American (5,638 | 5.4%), and Polish (5,263 | 5.1%), together accounting for 74.9% of all Fond du Lac County residents.
| Ancestry | # Population | % Population |
| African | 204 | 0.2% |
| American | 5,638 | 5.4% |
| Arab | 172 | 0.2% |
| Armenian | 39 | 0.0% |
| Australian | 3 | 0.0% |
| Austrian | 228 | 0.2% |
| Bangladeshi | 280 | 0.3% |
| Belgian | 126 | 0.1% |
| Bhutanese | 118 | 0.1% |
| Blackfeet | 42 | 0.0% |
| Brazilian | 47 | 0.1% |
| British | 161 | 0.2% |
| Burmese | 82 | 0.1% |
| Cambodian | 12 | 0.0% |
| Canadian | 73 | 0.1% |
| Celtic | 2 | 0.0% |
| Central American | 216 | 0.2% |
| Central American Indian | 26 | 0.0% |
| Cherokee | 66 | 0.1% |
| Chilean | 14 | 0.0% |
| Chinese | 23 | 0.0% |
| Chippewa | 50 | 0.1% |
| Choctaw | 4 | 0.0% |
| Colombian | 43 | 0.0% |
| Comanche | 1 | 0.0% |
| Costa Rican | 2 | 0.0% |
| Creek | 33 | 0.0% |
| Croatian | 259 | 0.3% |
| Cuban | 52 | 0.1% |
| Czech | 750 | 0.7% |
| Czechoslovakian | 55 | 0.1% |
| Danish | 695 | 0.7% |
| Dominican | 35 | 0.0% |
| Dutch | 4,557 | 4.4% |
| Dutch West Indian | 2 | 0.0% |
| Eastern European | 208 | 0.2% |
| Egyptian | 17 | 0.0% |
| English | 6,009 | 5.8% |
| Ethiopian | 1 | 0.0% |
| European | 1,154 | 1.1% |
| Fijian | 88 | 0.1% |
| Finnish | 443 | 0.4% |
| French | 3,262 | 3.1% |
| French American Indian | 1 | 0.0% |
| French Canadian | 701 | 0.7% |
| German | 50,063 | 48.1% |
| Greek | 427 | 0.4% |
| Guatemalan | 13 | 0.0% |
| Honduran | 121 | 0.1% |
| Hungarian | 363 | 0.4% |
| Icelander | 4 | 0.0% |
| Indian (Asian) | 999 | 1.0% |
| Indonesian | 246 | 0.2% |
| Irish | 10,936 | 10.5% |
| Iroquois | 110 | 0.1% |
| Italian | 2,559 | 2.5% |
| Kenyan | 2 | 0.0% |
| Korean | 213 | 0.2% |
| Laotian | 11 | 0.0% |
| Latvian | 38 | 0.0% |
| Lebanese | 136 | 0.1% |
| Liberian | 140 | 0.1% |
| Lithuanian | 84 | 0.1% |
| Luxembourger | 96 | 0.1% |
| Malaysian | 100 | 0.1% |
| Menominee | 49 | 0.1% |
| Mexican | 4,203 | 4.0% |
| Mexican American Indian | 6 | 0.0% |
| Native Hawaiian | 133 | 0.1% |
| Navajo | 1 | 0.0% |
| Nicaraguan | 46 | 0.0% |
| Nigerian | 57 | 0.1% |
| Northern European | 148 | 0.1% |
| Norwegian | 3,619 | 3.5% |
| Ottawa | 8 | 0.0% |
| Pakistani | 25 | 0.0% |
| Palestinian | 2 | 0.0% |
| Panamanian | 2 | 0.0% |
| Paraguayan | 413 | 0.4% |
| Pennsylvania German | 32 | 0.0% |
| Polish | 5,263 | 5.1% |
| Portuguese | 23 | 0.0% |
| Potawatomi | 100 | 0.1% |
| Puerto Rican | 303 | 0.3% |
| Romanian | 28 | 0.0% |
| Russian | 615 | 0.6% |
| Salvadoran | 32 | 0.0% |
| Samoan | 71 | 0.1% |
| Scandinavian | 277 | 0.3% |
| Scotch-Irish | 292 | 0.3% |
| Scottish | 823 | 0.8% |
| Serbian | 2 | 0.0% |
| Sioux | 29 | 0.0% |
| Slavic | 10 | 0.0% |
| Slovak | 73 | 0.1% |
| Slovene | 33 | 0.0% |
| South African | 6 | 0.0% |
| South American | 476 | 0.5% |
| Spaniard | 68 | 0.1% |
| Spanish | 16 | 0.0% |
| Sri Lankan | 20 | 0.0% |
| Subsaharan African | 450 | 0.4% |
| Swedish | 1,179 | 1.1% |
| Swiss | 397 | 0.4% |
| Thai | 62 | 0.1% |
| Turkish | 38 | 0.0% |
| Ukrainian | 50 | 0.1% |
| Venezuelan | 6 | 0.0% |
| Welsh | 541 | 0.5% |
| West Indian | 23 | 0.0% |
| Yugoslavian | 39 | 0.0% | View All 111 Rows |
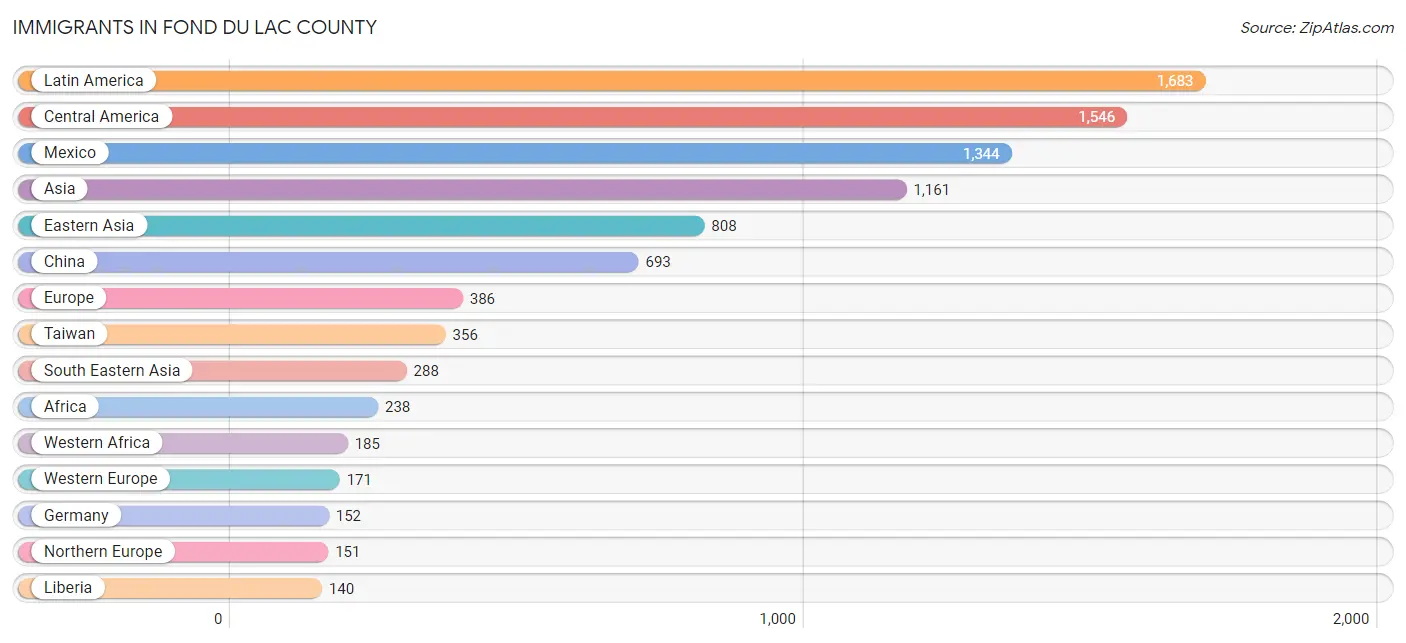
Immigrants in Fond du Lac County
The most numerous immigrant groups reported in Fond du Lac County came from Latin America (1,683 | 1.6%), Central America (1,546 | 1.5%), Mexico (1,344 | 1.3%), Asia (1,161 | 1.1%), and Eastern Asia (808 | 0.8%), together accounting for 6.3% of all Fond du Lac County residents.
| Immigration Origin | # Population | % Population |
| Africa | 238 | 0.2% |
| Asia | 1,161 | 1.1% |
| Bosnia and Herzegovina | 29 | 0.0% |
| Brazil | 57 | 0.1% |
| Canada | 97 | 0.1% |
| Caribbean | 28 | 0.0% |
| Central America | 1,546 | 1.5% |
| Chile | 14 | 0.0% |
| China | 693 | 0.7% |
| Colombia | 1 | 0.0% |
| Costa Rica | 2 | 0.0% |
| Cuba | 17 | 0.0% |
| Denmark | 3 | 0.0% |
| Dominican Republic | 11 | 0.0% |
| Eastern Africa | 30 | 0.0% |
| Eastern Asia | 808 | 0.8% |
| Eastern Europe | 64 | 0.1% |
| Egypt | 3 | 0.0% |
| El Salvador | 16 | 0.0% |
| England | 28 | 0.0% |
| Ethiopia | 1 | 0.0% |
| Europe | 386 | 0.4% |
| Germany | 152 | 0.2% |
| Ghana | 7 | 0.0% |
| Guatemala | 36 | 0.0% |
| Honduras | 100 | 0.1% |
| India | 1 | 0.0% |
| Iran | 8 | 0.0% |
| Iraq | 14 | 0.0% |
| Japan | 81 | 0.1% |
| Jordan | 2 | 0.0% |
| Kenya | 2 | 0.0% |
| Korea | 22 | 0.0% |
| Laos | 12 | 0.0% |
| Latin America | 1,683 | 1.6% |
| Lebanon | 2 | 0.0% |
| Liberia | 140 | 0.1% |
| Mexico | 1,344 | 1.3% |
| Middle Africa | 2 | 0.0% |
| Netherlands | 19 | 0.0% |
| Nicaragua | 46 | 0.0% |
| Northern Africa | 3 | 0.0% |
| Northern Europe | 151 | 0.2% |
| Panama | 2 | 0.0% |
| Philippines | 97 | 0.1% |
| Romania | 4 | 0.0% |
| Scotland | 2 | 0.0% |
| South Africa | 18 | 0.0% |
| South America | 109 | 0.1% |
| South Central Asia | 9 | 0.0% |
| South Eastern Asia | 288 | 0.3% |
| Sweden | 36 | 0.0% |
| Taiwan | 356 | 0.3% |
| Thailand | 52 | 0.1% |
| Turkey | 38 | 0.0% |
| Uganda | 27 | 0.0% |
| Venezuela | 6 | 0.0% |
| Vietnam | 14 | 0.0% |
| Western Africa | 185 | 0.2% |
| Western Asia | 56 | 0.1% |
| Western Europe | 171 | 0.2% |
| Zaire | 2 | 0.0% | View All 62 Rows |
Sex and Age in Fond du Lac County
Sex and Age in Fond du Lac County
The most populous age groups in Fond du Lac County are 60 to 64 Years (4,071 | 7.9%) for men and 60 to 64 Years (3,759 | 7.2%) for women.
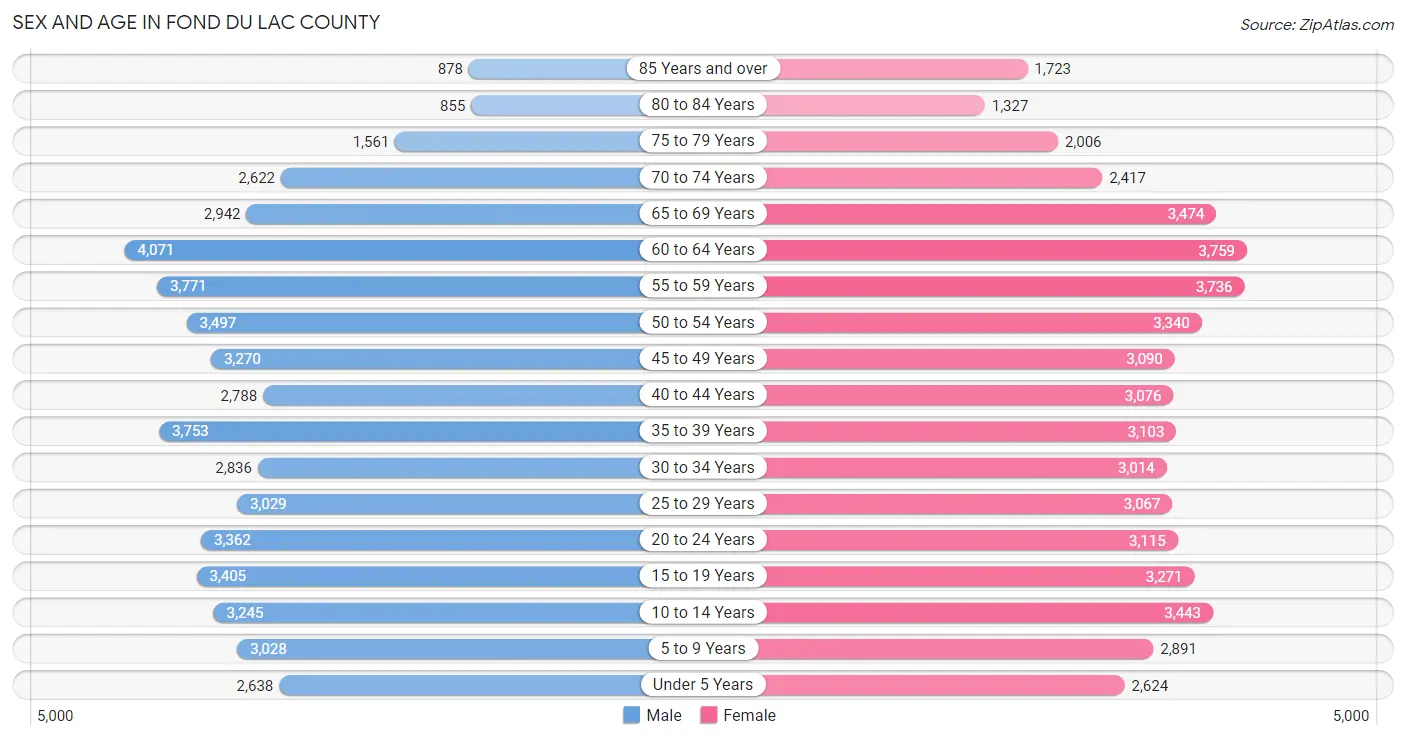
| Age Bracket | Male | Female |
| Under 5 Years | 2,638 (5.1%) | 2,624 (5.0%) |
| 5 to 9 Years | 3,028 (5.9%) | 2,891 (5.5%) |
| 10 to 14 Years | 3,245 (6.3%) | 3,443 (6.6%) |
| 15 to 19 Years | 3,405 (6.6%) | 3,271 (6.2%) |
| 20 to 24 Years | 3,362 (6.5%) | 3,115 (5.9%) |
| 25 to 29 Years | 3,029 (5.9%) | 3,067 (5.8%) |
| 30 to 34 Years | 2,836 (5.5%) | 3,014 (5.7%) |
| 35 to 39 Years | 3,753 (7.3%) | 3,103 (5.9%) |
| 40 to 44 Years | 2,788 (5.4%) | 3,076 (5.9%) |
| 45 to 49 Years | 3,270 (6.3%) | 3,090 (5.9%) |
| 50 to 54 Years | 3,497 (6.8%) | 3,340 (6.4%) |
| 55 to 59 Years | 3,771 (7.3%) | 3,736 (7.1%) |
| 60 to 64 Years | 4,071 (7.9%) | 3,759 (7.2%) |
| 65 to 69 Years | 2,942 (5.7%) | 3,474 (6.6%) |
| 70 to 74 Years | 2,622 (5.1%) | 2,417 (4.6%) |
| 75 to 79 Years | 1,561 (3.0%) | 2,006 (3.8%) |
| 80 to 84 Years | 855 (1.7%) | 1,327 (2.5%) |
| 85 Years and over | 878 (1.7%) | 1,723 (3.3%) |
| Total | 51,551 (100.0%) | 52,476 (100.0%) |
Families and Households in Fond du Lac County
Median Family Size in Fond du Lac County
The median family size in Fond du Lac County is 2.98 persons per family, with married-couple families (21,694 | 81.7%) accounting for the largest median family size of 3 persons per family. On the other hand, single male/father families (1,629 | 6.1%) represent the smallest median family size with 2.77 persons per family.
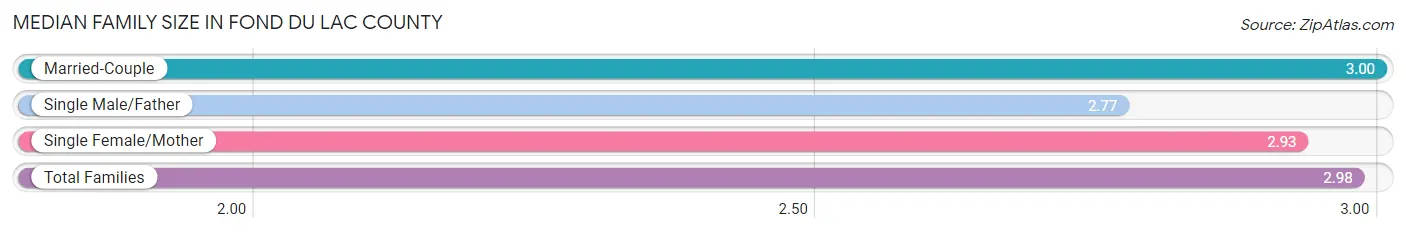
| Family Type | # Families | Family Size |
| Married-Couple | 21,694 (81.7%) | 3.00 |
| Single Male/Father | 1,629 (6.1%) | 2.77 |
| Single Female/Mother | 3,231 (12.2%) | 2.93 |
| Total Families | 26,554 (100.0%) | 2.98 |
Median Household Size in Fond du Lac County
The median household size in Fond du Lac County is 2.37 persons per household, with single male/father households (1,629 | 3.8%) accounting for the largest median household size of 3.32 persons per household. non-family households (15,814 | 37.3%) represent the smallest median household size with 1.21 persons per household.
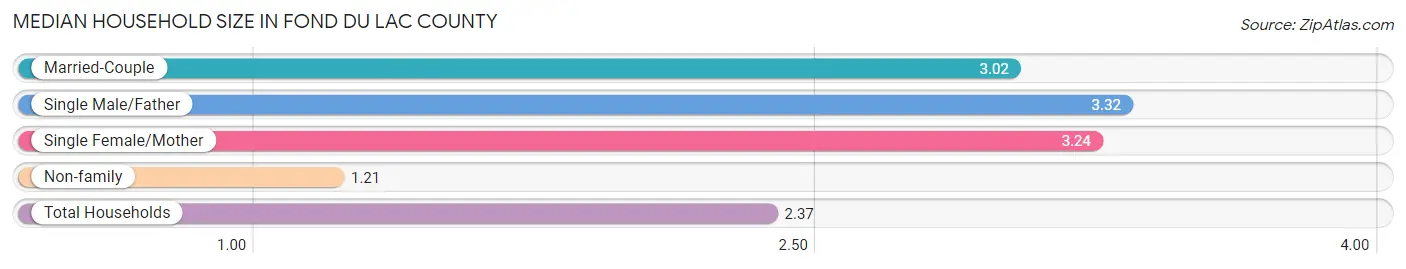
| Household Type | # Households | Household Size |
| Married-Couple | 21,694 (51.2%) | 3.02 |
| Single Male/Father | 1,629 (3.8%) | 3.32 |
| Single Female/Mother | 3,231 (7.6%) | 3.24 |
| Non-family | 15,814 (37.3%) | 1.21 |
| Total Households | 42,368 (100.0%) | 2.37 |
Household Size by Marriage Status in Fond du Lac County
Out of a total of 42,368 households in Fond du Lac County, 26,554 (62.7%) are family households, while 15,814 (37.3%) are nonfamily households. The most numerous type of family households are 2-person households, comprising 13,912, and the most common type of nonfamily households are 1-person households, comprising 13,193.
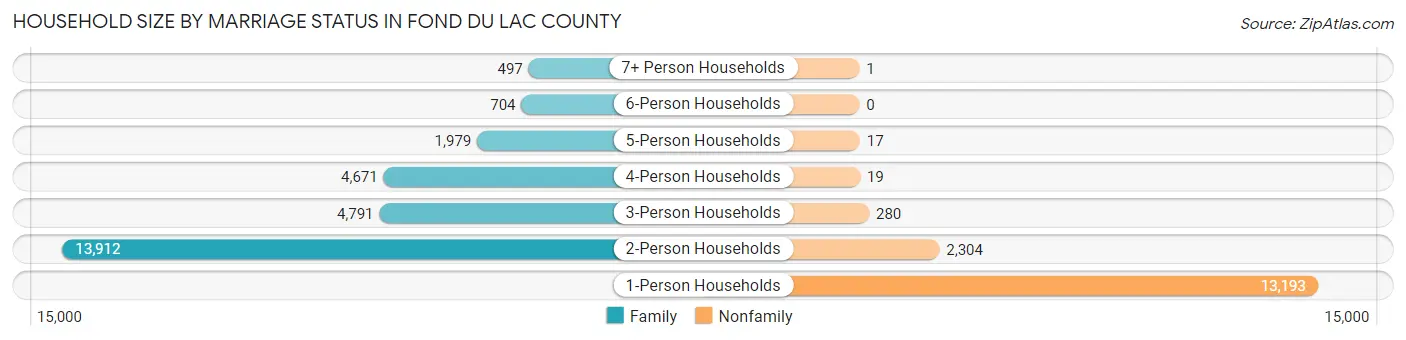
| Household Size | Family Households | Nonfamily Households |
| 1-Person Households | - | 13,193 (31.1%) |
| 2-Person Households | 13,912 (32.8%) | 2,304 (5.4%) |
| 3-Person Households | 4,791 (11.3%) | 280 (0.7%) |
| 4-Person Households | 4,671 (11.0%) | 19 (0.0%) |
| 5-Person Households | 1,979 (4.7%) | 17 (0.0%) |
| 6-Person Households | 704 (1.7%) | 0 (0.0%) |
| 7+ Person Households | 497 (1.2%) | 1 (0.0%) |
| Total | 26,554 (62.7%) | 15,814 (37.3%) |
Female Fertility in Fond du Lac County
Fertility by Age in Fond du Lac County
Average fertility rate in Fond du Lac County is 52.0 births per 1,000 women. Women in the age bracket of 20 to 34 years have the highest fertility rate with 93.0 births per 1,000 women. Women in the age bracket of 20 to 34 years acount for 73.6% of all women with births.
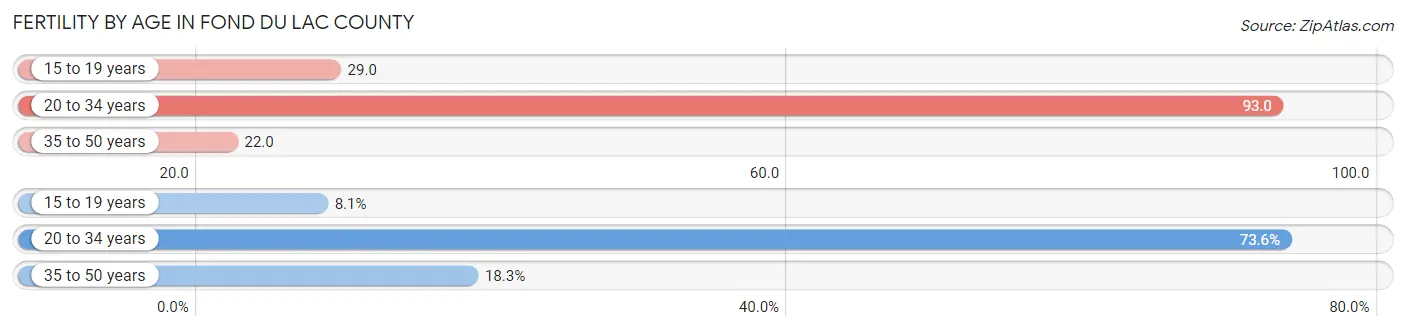
| Age Bracket | Women with Births | Births / 1,000 Women |
| 15 to 19 years | 94 (8.1%) | 29.0 |
| 20 to 34 years | 851 (73.6%) | 93.0 |
| 35 to 50 years | 212 (18.3%) | 22.0 |
| Total | 1,157 (100.0%) | 52.0 |
Fertility by Age by Marriage Status in Fond du Lac County
56.1% of women with births (1,157) in Fond du Lac County are married. The highest percentage of unmarried women with births falls into 15 to 19 years age bracket with 100.0% of them unmarried at the time of birth, while the lowest percentage of unmarried women with births belong to 35 to 50 years age bracket with 26.4% of them unmarried.
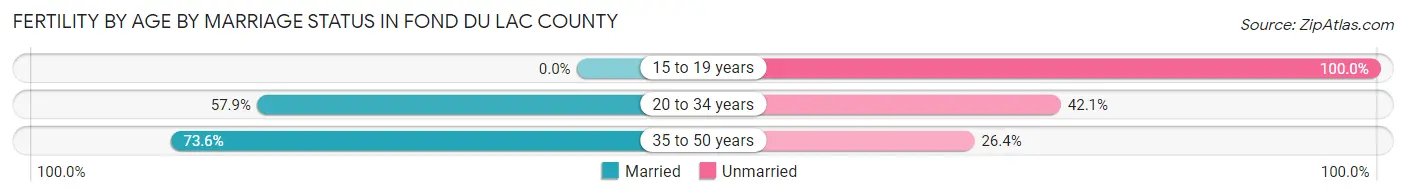
| Age Bracket | Married | Unmarried |
| 15 to 19 years | 0 (0.0%) | 94 (100.0%) |
| 20 to 34 years | 493 (57.9%) | 358 (42.1%) |
| 35 to 50 years | 156 (73.6%) | 56 (26.4%) |
| Total | 649 (56.1%) | 508 (43.9%) |
Fertility by Education in Fond du Lac County
Average fertility rate in Fond du Lac County is 52.0 births per 1,000 women. Women with the education attainment of less than high school have the highest fertility rate of 65.0 births per 1,000 women, while women with the education attainment of bachelor's degree have the lowest fertility at 47.0 births per 1,000 women. Women with the education attainment of college or associate's degree represent 34.7% of all women with births.
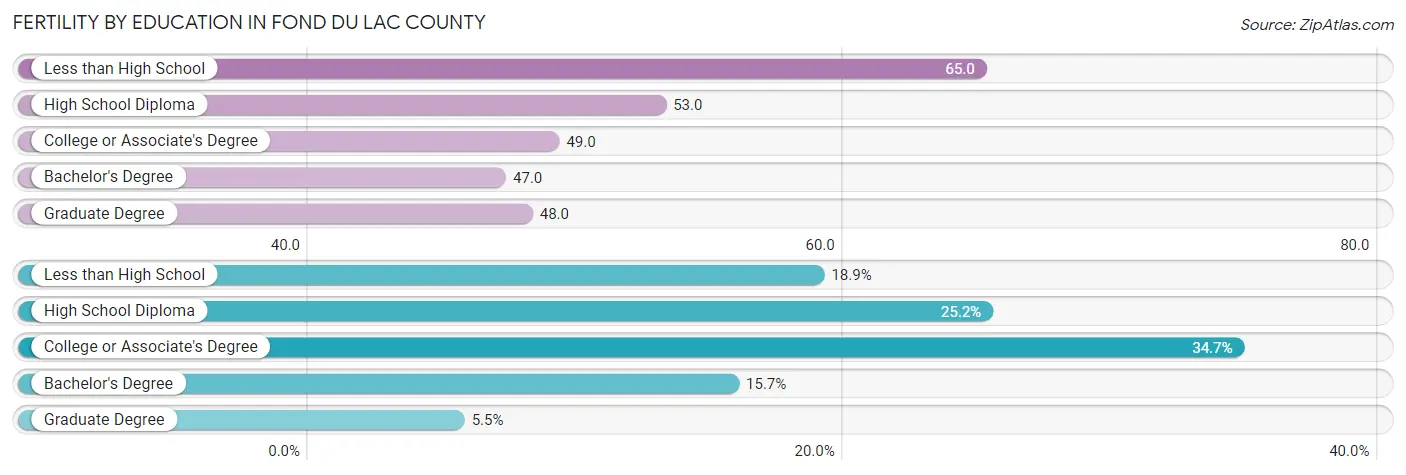
| Educational Attainment | Women with Births | Births / 1,000 Women |
| Less than High School | 219 (18.9%) | 65.0 |
| High School Diploma | 292 (25.2%) | 53.0 |
| College or Associate's Degree | 401 (34.7%) | 49.0 |
| Bachelor's Degree | 182 (15.7%) | 47.0 |
| Graduate Degree | 63 (5.4%) | 48.0 |
| Total | 1,157 (100.0%) | 52.0 |
Fertility by Education by Marriage Status in Fond du Lac County
43.9% of women with births in Fond du Lac County are unmarried. Women with the educational attainment of graduate degree are most likely to be married with 100.0% of them married at childbirth, while women with the educational attainment of less than high school are least likely to be married with 72.6% of them unmarried at childbirth.
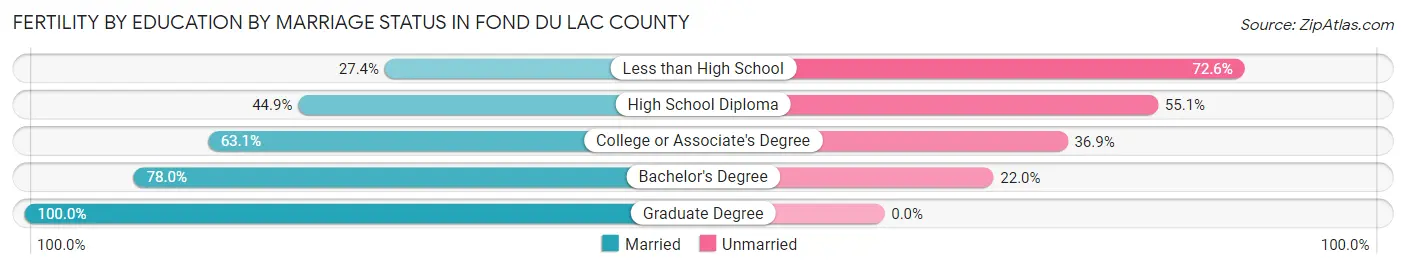
| Educational Attainment | Married | Unmarried |
| Less than High School | 60 (27.4%) | 159 (72.6%) |
| High School Diploma | 131 (44.9%) | 161 (55.1%) |
| College or Associate's Degree | 253 (63.1%) | 148 (36.9%) |
| Bachelor's Degree | 142 (78.0%) | 40 (22.0%) |
| Graduate Degree | 63 (100.0%) | 0 (0.0%) |
| Total | 649 (56.1%) | 508 (43.9%) |
Income in Fond du Lac County
Income Overview in Fond du Lac County
Per Capita Income in Fond du Lac County is $36,824, while median incomes of families and households are $93,158 and $70,368 respectively.
| Characteristic | Number | Measure |
| Per Capita Income | 104,027 | $36,824 |
| Median Family Income | 26,554 | $93,158 |
| Mean Family Income | 26,554 | $106,007 |
| Median Household Income | 42,368 | $70,368 |
| Mean Household Income | 42,368 | $87,987 |
| Income Deficit | 26,554 | $10,438 |
| Wage / Income Gap (%) | 104,027 | 35.83% |
| Wage / Income Gap ($) | 104,027 | 64.17¢ per $1 |
| Gini / Inequality Index | 104,027 | 0.41 |
Earnings by Sex in Fond du Lac County
Average Earnings in Fond du Lac County are $42,012, $51,615 for men and $33,119 for women, a difference of 35.8%.
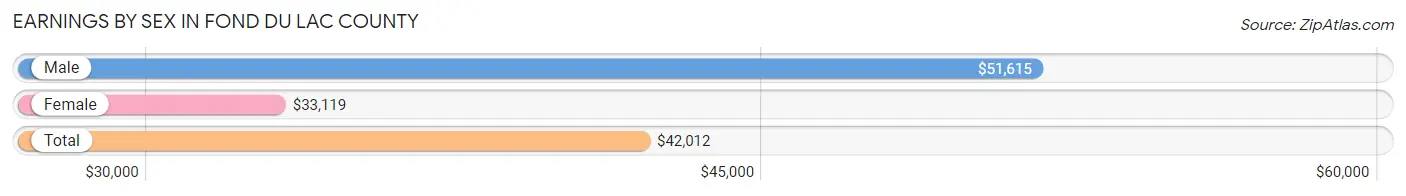
| Sex | Number | Average Earnings |
| Male | 31,139 (53.1%) | $51,615 |
| Female | 27,525 (46.9%) | $33,119 |
| Total | 58,664 (100.0%) | $42,012 |
Earnings by Sex by Income Bracket in Fond du Lac County
The most common earnings brackets in Fond du Lac County are $75,000 to $99,999 for men (3,992 | 12.8%) and $55,000 to $64,999 for women (2,205 | 8.0%).
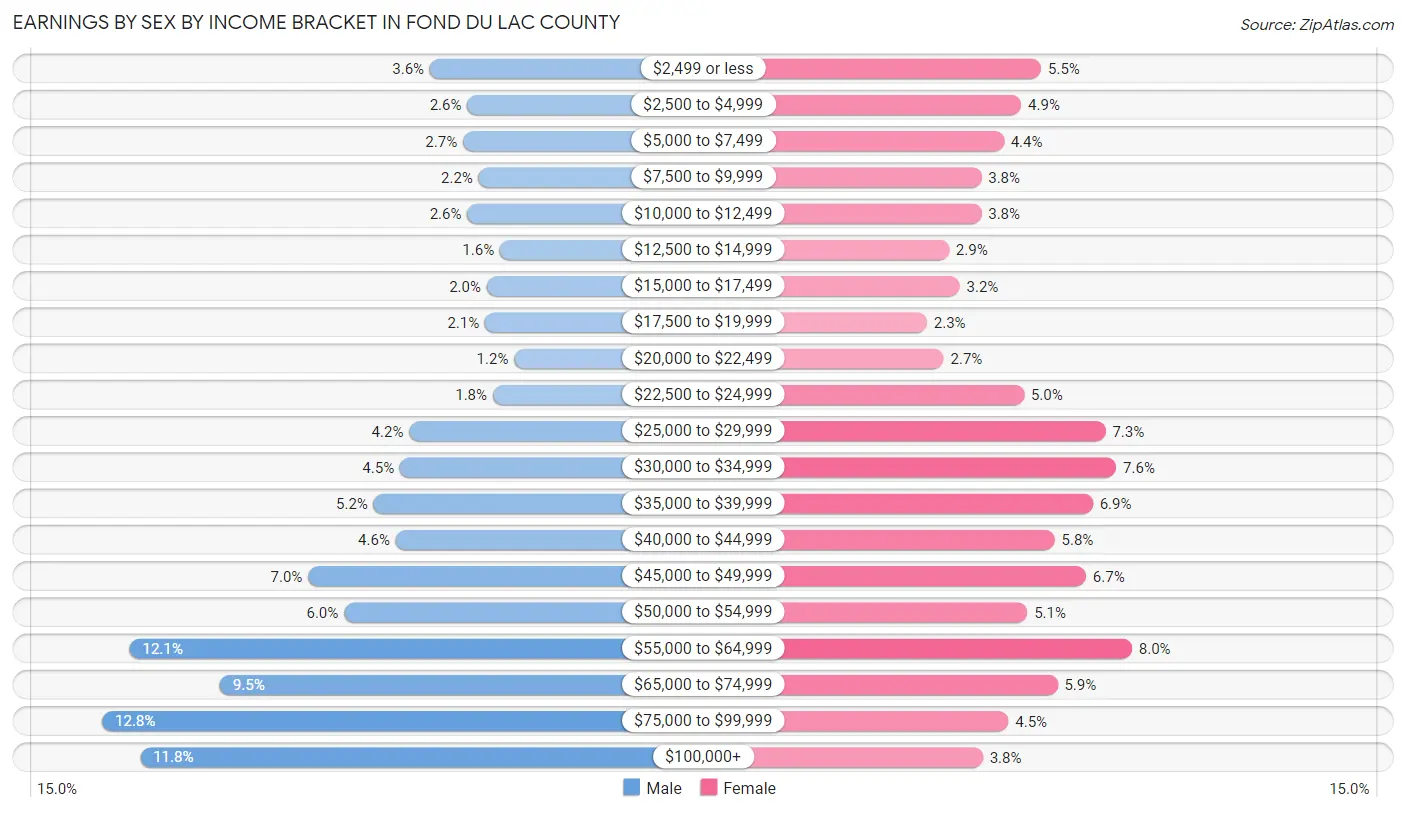
| Income | Male | Female |
| $2,499 or less | 1,123 (3.6%) | 1,502 (5.5%) |
| $2,500 to $4,999 | 796 (2.6%) | 1,349 (4.9%) |
| $5,000 to $7,499 | 833 (2.7%) | 1,213 (4.4%) |
| $7,500 to $9,999 | 696 (2.2%) | 1,041 (3.8%) |
| $10,000 to $12,499 | 798 (2.6%) | 1,040 (3.8%) |
| $12,500 to $14,999 | 511 (1.6%) | 791 (2.9%) |
| $15,000 to $17,499 | 625 (2.0%) | 872 (3.2%) |
| $17,500 to $19,999 | 640 (2.1%) | 618 (2.2%) |
| $20,000 to $22,499 | 387 (1.2%) | 750 (2.7%) |
| $22,500 to $24,999 | 573 (1.8%) | 1,371 (5.0%) |
| $25,000 to $29,999 | 1,304 (4.2%) | 2,002 (7.3%) |
| $30,000 to $34,999 | 1,387 (4.4%) | 2,085 (7.6%) |
| $35,000 to $39,999 | 1,617 (5.2%) | 1,902 (6.9%) |
| $40,000 to $44,999 | 1,422 (4.6%) | 1,607 (5.8%) |
| $45,000 to $49,999 | 2,189 (7.0%) | 1,850 (6.7%) |
| $50,000 to $54,999 | 1,876 (6.0%) | 1,395 (5.1%) |
| $55,000 to $64,999 | 3,751 (12.0%) | 2,205 (8.0%) |
| $65,000 to $74,999 | 2,960 (9.5%) | 1,630 (5.9%) |
| $75,000 to $99,999 | 3,992 (12.8%) | 1,250 (4.5%) |
| $100,000+ | 3,659 (11.7%) | 1,052 (3.8%) |
| Total | 31,139 (100.0%) | 27,525 (100.0%) |
Earnings by Sex by Educational Attainment in Fond du Lac County
Average earnings in Fond du Lac County are $56,503 for men and $37,015 for women, a difference of 34.5%. Men with an educational attainment of graduate degree enjoy the highest average annual earnings of $91,348, while those with less than high school education earn the least with $39,530. Women with an educational attainment of graduate degree earn the most with the average annual earnings of $65,645, while those with high school diploma education have the smallest earnings of $27,723.
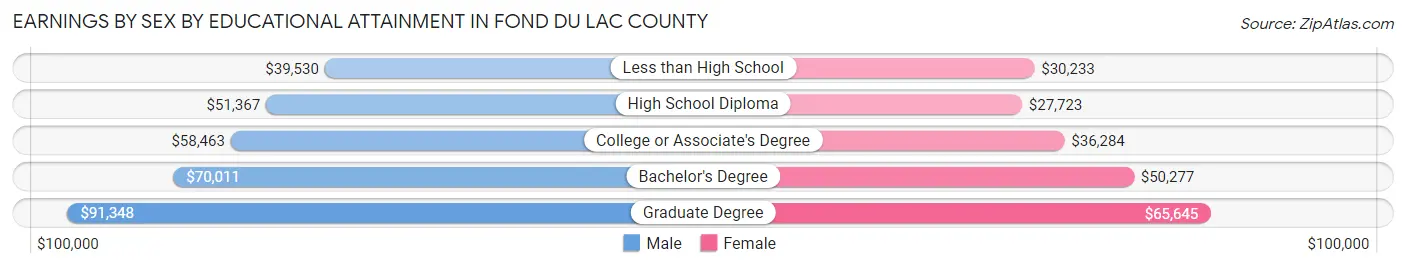
| Educational Attainment | Male Income | Female Income |
| Less than High School | $39,530 | $30,233 |
| High School Diploma | $51,367 | $27,723 |
| College or Associate's Degree | $58,463 | $36,284 |
| Bachelor's Degree | $70,011 | $50,277 |
| Graduate Degree | $91,348 | $65,645 |
| Total | $56,503 | $37,015 |
Family Income in Fond du Lac County
Family Income Brackets in Fond du Lac County
According to the Fond du Lac County family income data, there are 7,276 families falling into the $100,000 to $149,999 income range, which is the most common income bracket and makes up 27.4% of all families. Conversely, the $10,000 to $14,999 income bracket is the least frequent group with only 239 families (0.9%) belonging to this category.
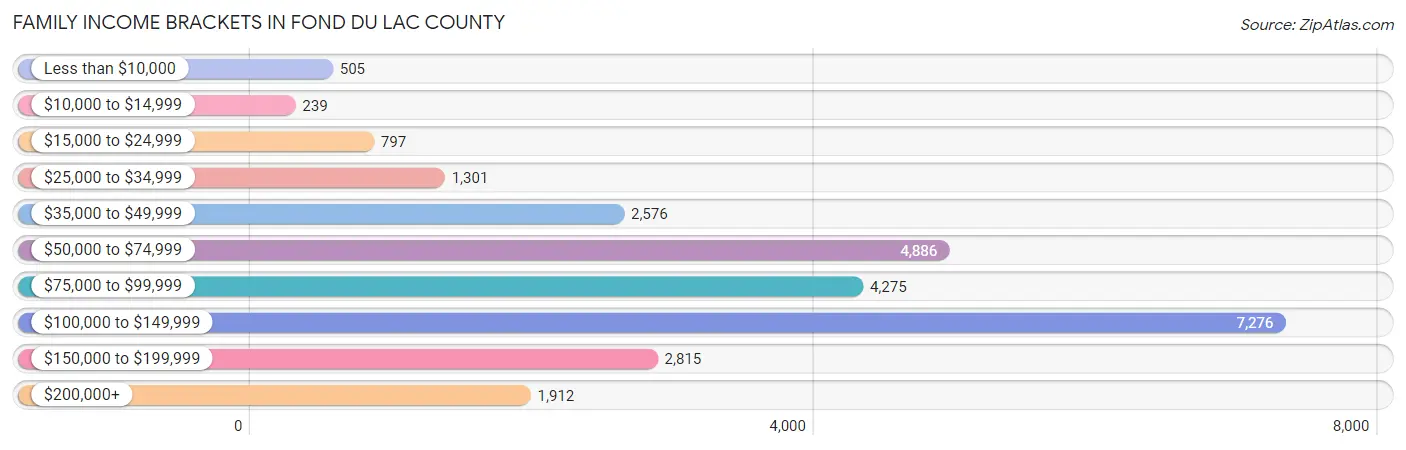
| Income Bracket | # Families | % Families |
| Less than $10,000 | 505 | 1.9% |
| $10,000 to $14,999 | 239 | 0.9% |
| $15,000 to $24,999 | 797 | 3.0% |
| $25,000 to $34,999 | 1,301 | 4.9% |
| $35,000 to $49,999 | 2,576 | 9.7% |
| $50,000 to $74,999 | 4,886 | 18.4% |
| $75,000 to $99,999 | 4,275 | 16.1% |
| $100,000 to $149,999 | 7,276 | 27.4% |
| $150,000 to $199,999 | 2,815 | 10.6% |
| $200,000+ | 1,912 | 7.2% |
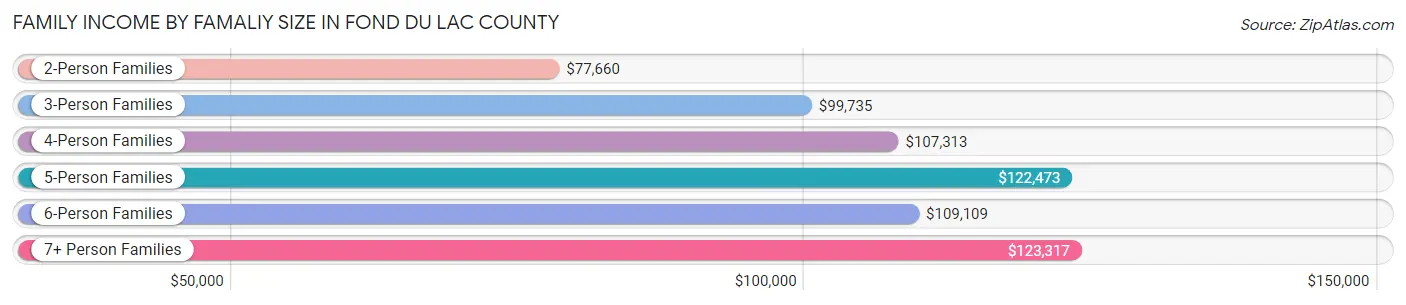
Family Income by Famaliy Size in Fond du Lac County
7+ person families (441 | 1.7%) account for the highest median family income in Fond du Lac County with $123,317 per family, while 2-person families (14,618 | 55.0%) have the highest median income of $38,830 per family member.
| Income Bracket | # Families | Median Income |
| 2-Person Families | 14,618 (55.0%) | $77,660 |
| 3-Person Families | 4,782 (18.0%) | $99,735 |
| 4-Person Families | 4,396 (16.6%) | $107,313 |
| 5-Person Families | 1,681 (6.3%) | $122,473 |
| 6-Person Families | 636 (2.4%) | $109,109 |
| 7+ Person Families | 441 (1.7%) | $123,317 |
| Total | 26,554 (100.0%) | $93,158 |
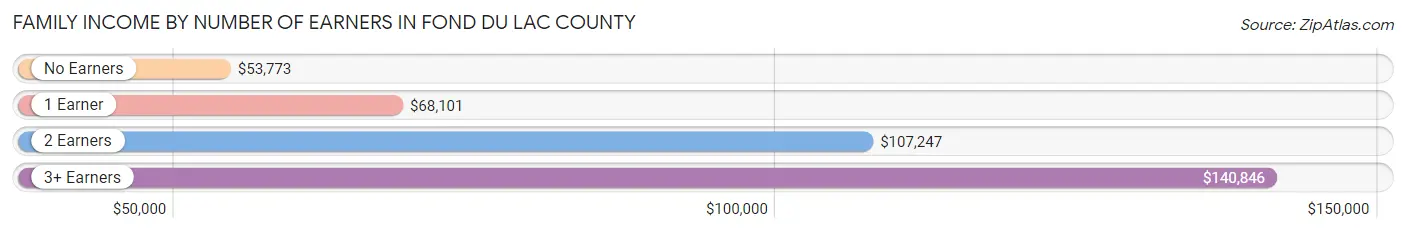
Family Income by Number of Earners in Fond du Lac County
The median family income in Fond du Lac County is $93,158, with families comprising 3+ earners (3,435) having the highest median family income of $140,846, while families with no earners (4,403) have the lowest median family income of $53,773, accounting for 12.9% and 16.6% of families, respectively.
| Number of Earners | # Families | Median Income |
| No Earners | 4,403 (16.6%) | $53,773 |
| 1 Earner | 6,907 (26.0%) | $68,101 |
| 2 Earners | 11,809 (44.5%) | $107,247 |
| 3+ Earners | 3,435 (12.9%) | $140,846 |
| Total | 26,554 (100.0%) | $93,158 |
Household Income in Fond du Lac County
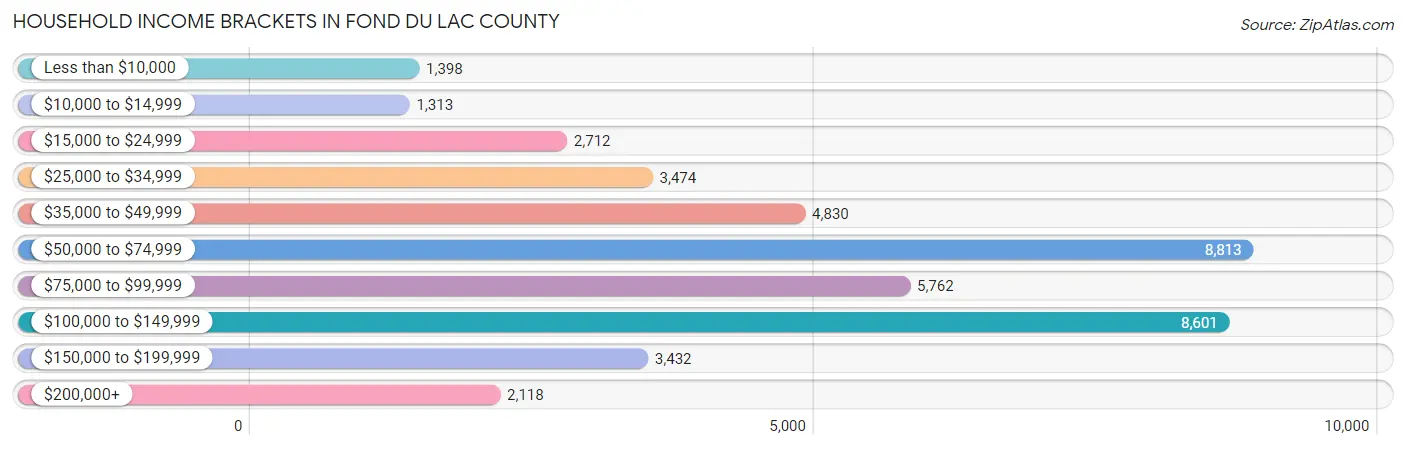
Household Income Brackets in Fond du Lac County
With 8,813 households falling in the category, the $50,000 to $74,999 income range is the most frequent in Fond du Lac County, accounting for 20.8% of all households. In contrast, only 1,313 households (3.1%) fall into the $10,000 to $14,999 income bracket, making it the least populous group.
| Income Bracket | # Households | % Households |
| Less than $10,000 | 1,398 | 3.3% |
| $10,000 to $14,999 | 1,313 | 3.1% |
| $15,000 to $24,999 | 2,712 | 6.4% |
| $25,000 to $34,999 | 3,474 | 8.2% |
| $35,000 to $49,999 | 4,830 | 11.4% |
| $50,000 to $74,999 | 8,813 | 20.8% |
| $75,000 to $99,999 | 5,762 | 13.6% |
| $100,000 to $149,999 | 8,601 | 20.3% |
| $150,000 to $199,999 | 3,432 | 8.1% |
| $200,000+ | 2,118 | 5.0% |
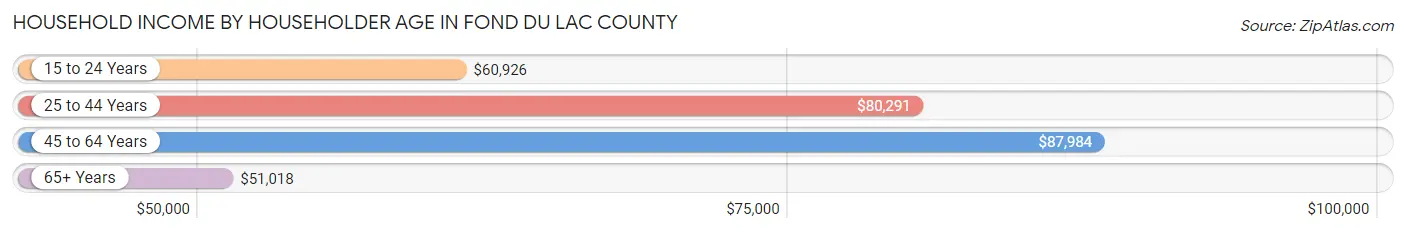
Household Income by Householder Age in Fond du Lac County
The median household income in Fond du Lac County is $70,368, with the highest median household income of $87,984 found in the 45 to 64 years age bracket for the primary householder. A total of 16,349 households (38.6%) fall into this category. Meanwhile, the 65+ years age bracket for the primary householder has the lowest median household income of $51,018, with 12,214 households (28.8%) in this group.
| Income Bracket | # Households | Median Income |
| 15 to 24 Years | 1,486 (3.5%) | $60,926 |
| 25 to 44 Years | 12,319 (29.1%) | $80,291 |
| 45 to 64 Years | 16,349 (38.6%) | $87,984 |
| 65+ Years | 12,214 (28.8%) | $51,018 |
| Total | 42,368 (100.0%) | $70,368 |
Poverty in Fond du Lac County
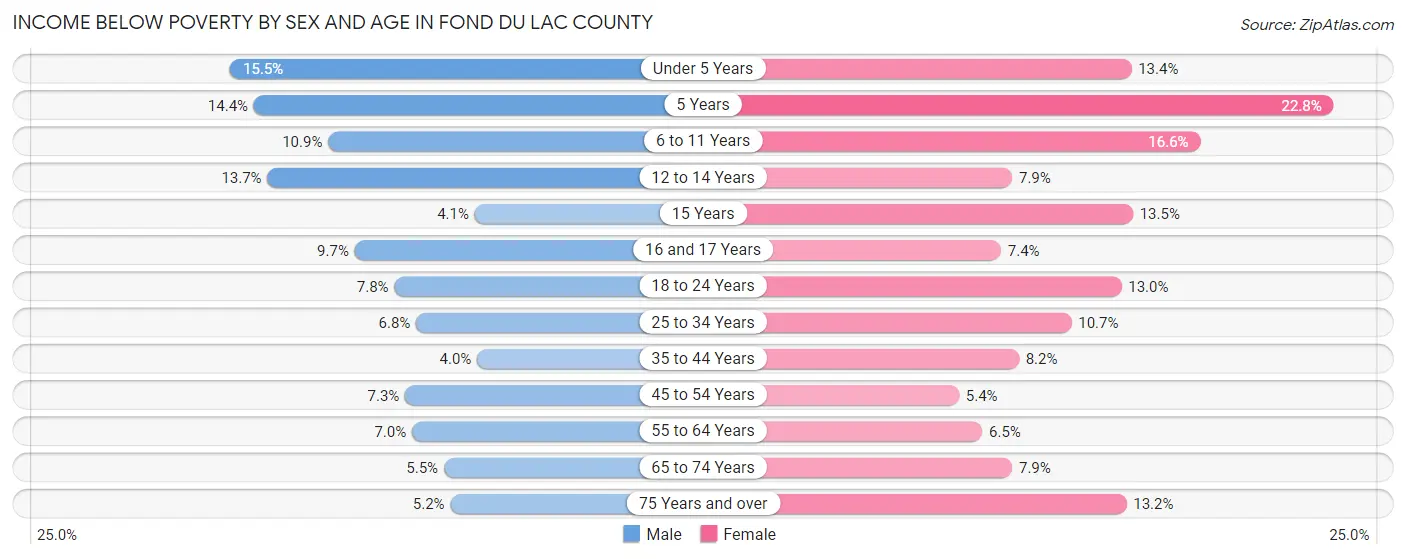
Income Below Poverty by Sex and Age in Fond du Lac County
With 7.5% poverty level for males and 9.7% for females among the residents of Fond du Lac County, under 5 year old males and 5 year old females are the most vulnerable to poverty, with 392 males (15.5%) and 118 females (22.8%) in their respective age groups living below the poverty level.
| Age Bracket | Male | Female |
| Under 5 Years | 392 (15.5%) | 345 (13.4%) |
| 5 Years | 88 (14.4%) | 118 (22.8%) |
| 6 to 11 Years | 389 (10.9%) | 576 (16.6%) |
| 12 to 14 Years | 265 (13.7%) | 164 (7.9%) |
| 15 Years | 33 (4.1%) | 71 (13.5%) |
| 16 and 17 Years | 126 (9.7%) | 109 (7.4%) |
| 18 to 24 Years | 338 (7.8%) | 438 (13.0%) |
| 25 to 34 Years | 397 (6.8%) | 621 (10.6%) |
| 35 to 44 Years | 260 (4.0%) | 487 (8.2%) |
| 45 to 54 Years | 495 (7.3%) | 341 (5.4%) |
| 55 to 64 Years | 549 (7.0%) | 478 (6.5%) |
| 65 to 74 Years | 306 (5.5%) | 455 (7.9%) |
| 75 Years and over | 165 (5.2%) | 628 (13.2%) |
| Total | 3,803 (7.5%) | 4,831 (9.7%) |
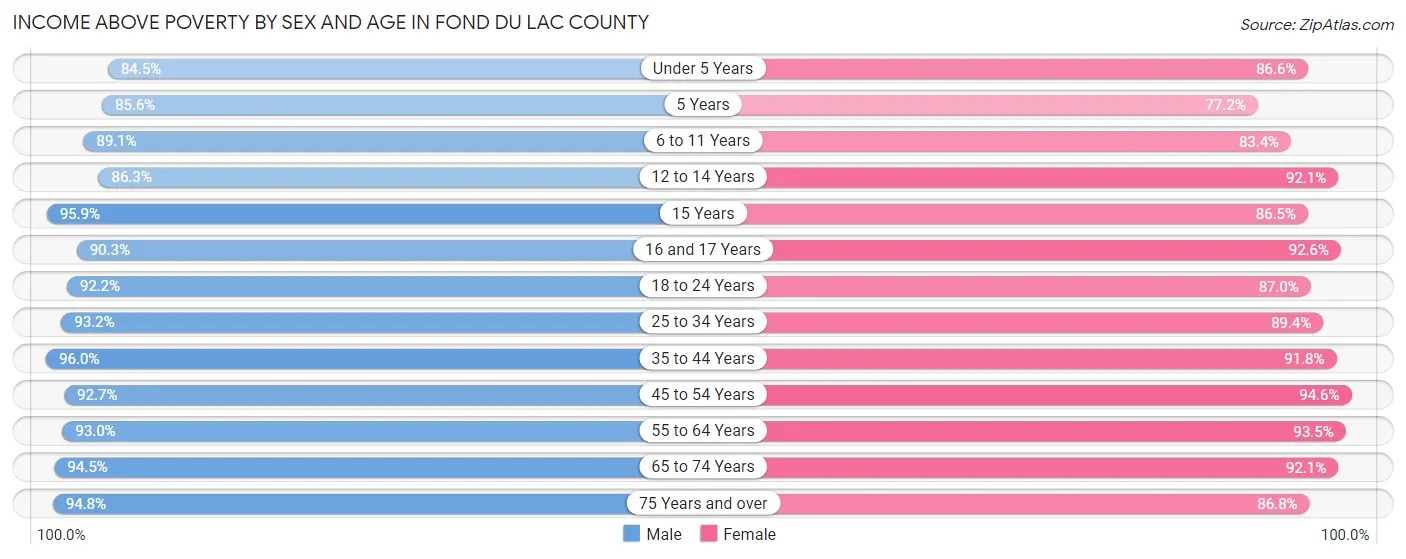
Income Above Poverty by Sex and Age in Fond du Lac County
According to the poverty statistics in Fond du Lac County, males aged 35 to 44 years and females aged 45 to 54 years are the age groups that are most secure financially, with 96.0% of males and 94.6% of females in these age groups living above the poverty line.
| Age Bracket | Male | Female |
| Under 5 Years | 2,142 (84.5%) | 2,223 (86.6%) |
| 5 Years | 525 (85.6%) | 399 (77.2%) |
| 6 to 11 Years | 3,176 (89.1%) | 2,885 (83.4%) |
| 12 to 14 Years | 1,665 (86.3%) | 1,911 (92.1%) |
| 15 Years | 770 (95.9%) | 455 (86.5%) |
| 16 and 17 Years | 1,175 (90.3%) | 1,367 (92.6%) |
| 18 to 24 Years | 3,975 (92.2%) | 2,940 (87.0%) |
| 25 to 34 Years | 5,413 (93.2%) | 5,211 (89.3%) |
| 35 to 44 Years | 6,242 (96.0%) | 5,447 (91.8%) |
| 45 to 54 Years | 6,253 (92.7%) | 5,936 (94.6%) |
| 55 to 64 Years | 7,271 (93.0%) | 6,867 (93.5%) |
| 65 to 74 Years | 5,214 (94.5%) | 5,302 (92.1%) |
| 75 Years and over | 2,984 (94.8%) | 4,131 (86.8%) |
| Total | 46,805 (92.5%) | 45,074 (90.3%) |
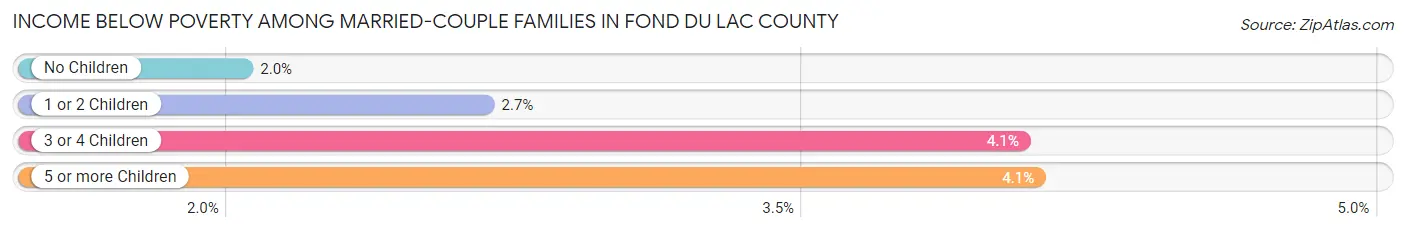
Income Below Poverty Among Married-Couple Families in Fond du Lac County
The poverty statistics for married-couple families in Fond du Lac County show that 2.4% or 513 of the total 21,694 families live below the poverty line. Families with 5 or more children have the highest poverty rate of 4.1%, comprising of 9 families. On the other hand, families with no children have the lowest poverty rate of 2.0%, which includes 298 families.
| Children | Above Poverty | Below Poverty |
| No Children | 14,293 (98.0%) | 298 (2.0%) |
| 1 or 2 Children | 5,170 (97.3%) | 142 (2.7%) |
| 3 or 4 Children | 1,508 (95.9%) | 64 (4.1%) |
| 5 or more Children | 210 (95.9%) | 9 (4.1%) |
| Total | 21,181 (97.6%) | 513 (2.4%) |
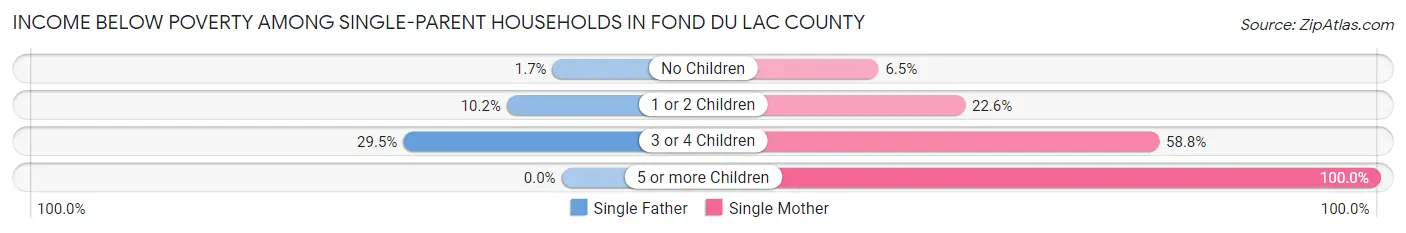
Income Below Poverty Among Single-Parent Households in Fond du Lac County
According to the poverty data in Fond du Lac County, 7.4% or 121 single-father households and 23.1% or 745 single-mother households are living below the poverty line. Among single-father households, those with 3 or 4 children have the highest poverty rate, with 23 households (29.5%) experiencing poverty. Likewise, among single-mother households, those with 5 or more children have the highest poverty rate, with 1 households (100.0%) falling below the poverty line.
| Children | Single Father | Single Mother |
| No Children | 12 (1.7%) | 65 (6.5%) |
| 1 or 2 Children | 86 (10.2%) | 394 (22.6%) |
| 3 or 4 Children | 23 (29.5%) | 285 (58.8%) |
| 5 or more Children | 0 (0.0%) | 1 (100.0%) |
| Total | 121 (7.4%) | 745 (23.1%) |
Income Below Poverty Among Married-Couple vs Single-Parent Households in Fond du Lac County
The poverty data for Fond du Lac County shows that 513 of the married-couple family households (2.4%) and 866 of the single-parent households (17.8%) are living below the poverty level. Within the married-couple family households, those with 5 or more children have the highest poverty rate, with 9 households (4.1%) falling below the poverty line. Among the single-parent households, those with 5 or more children have the highest poverty rate, with 1 household (100.0%) living below poverty.

| Children | Married-Couple Families | Single-Parent Households |
| No Children | 298 (2.0%) | 77 (4.5%) |
| 1 or 2 Children | 142 (2.7%) | 480 (18.6%) |
| 3 or 4 Children | 64 (4.1%) | 308 (54.7%) |
| 5 or more Children | 9 (4.1%) | 1 (100.0%) |
| Total | 513 (2.4%) | 866 (17.8%) |
Employment Characteristics in Fond du Lac County
Employment by Class of Employer in Fond du Lac County
Among the 52,489 employed individuals in Fond du Lac County, private company employees (38,572 | 73.5%), not-for-profit organizations (4,309 | 8.2%), and local government employees (3,261 | 6.2%) make up the most common classes of employment.
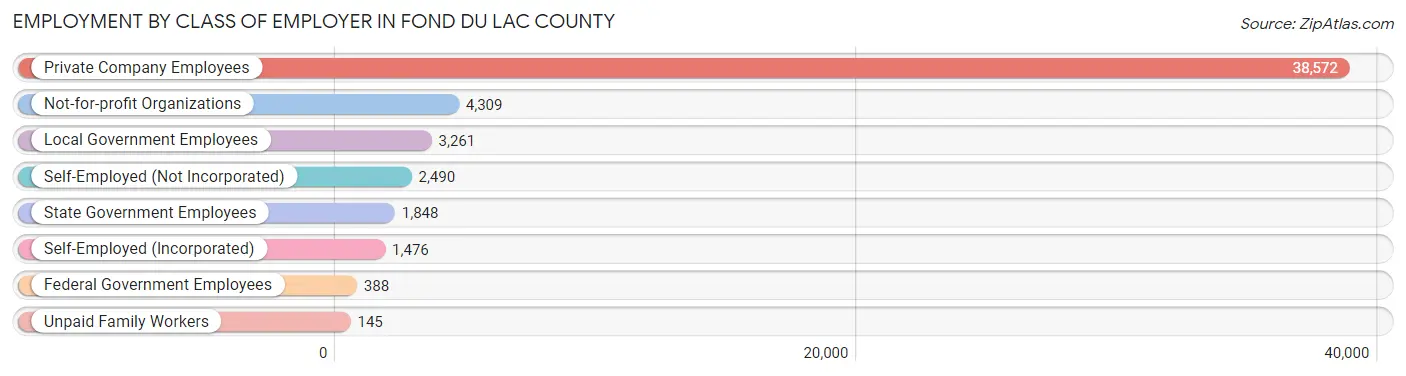
| Employer Class | # Employees | % Employees |
| Private Company Employees | 38,572 | 73.5% |
| Self-Employed (Incorporated) | 1,476 | 2.8% |
| Self-Employed (Not Incorporated) | 2,490 | 4.7% |
| Not-for-profit Organizations | 4,309 | 8.2% |
| Local Government Employees | 3,261 | 6.2% |
| State Government Employees | 1,848 | 3.5% |
| Federal Government Employees | 388 | 0.7% |
| Unpaid Family Workers | 145 | 0.3% |
| Total | 52,489 | 100.0% |
Employment Status by Age in Fond du Lac County
According to the labor force statistics for Fond du Lac County, out of the total population over 16 years of age (84,828), 65.1% or 55,223 individuals are in the labor force, with 3.3% or 1,822 of them unemployed. The age group with the highest labor force participation rate is 35 to 44 years, with 89.2% or 11,346 individuals in the labor force. Within the labor force, the 16 to 19 years age range has the highest percentage of unemployed individuals, with 12.2% or 351 of them being unemployed.
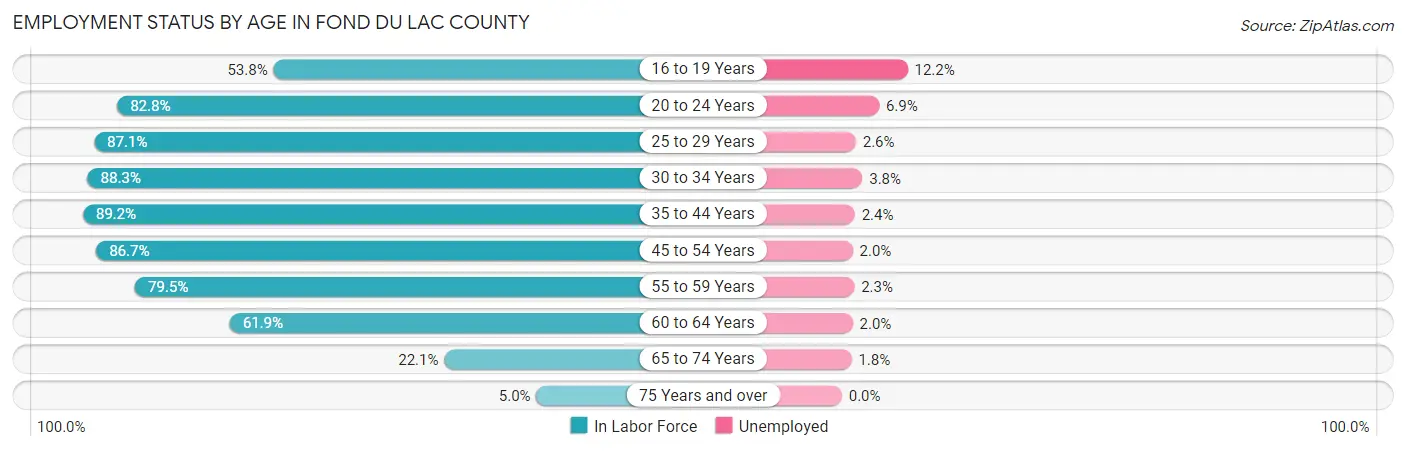
| Age Bracket | In Labor Force | Unemployed |
| 16 to 19 Years | 2,876 (53.8%) | 351 (12.2%) |
| 20 to 24 Years | 5,363 (82.8%) | 370 (6.9%) |
| 25 to 29 Years | 5,310 (87.1%) | 138 (2.6%) |
| 30 to 34 Years | 5,166 (88.3%) | 196 (3.8%) |
| 35 to 44 Years | 11,346 (89.2%) | 272 (2.4%) |
| 45 to 54 Years | 11,442 (86.7%) | 229 (2.0%) |
| 55 to 59 Years | 5,968 (79.5%) | 137 (2.3%) |
| 60 to 64 Years | 4,847 (61.9%) | 97 (2.0%) |
| 65 to 74 Years | 2,532 (22.1%) | 46 (1.8%) |
| 75 Years and over | 418 (5.0%) | 0 (0.0%) |
| Total | 55,223 (65.1%) | 1,822 (3.3%) |
Employment Status by Educational Attainment in Fond du Lac County
According to labor force statistics for Fond du Lac County, 82.8% of individuals (44,050) out of the total population between 25 and 64 years of age (53,200) are in the labor force, with 2.4% or 1,057 of them being unemployed. The group with the highest labor force participation rate are those with the educational attainment of bachelor's degree or higher, with 90.8% or 11,304 individuals in the labor force. Within the labor force, individuals with less than high school education have the highest percentage of unemployment, with 9.1% or 228 of them being unemployed.
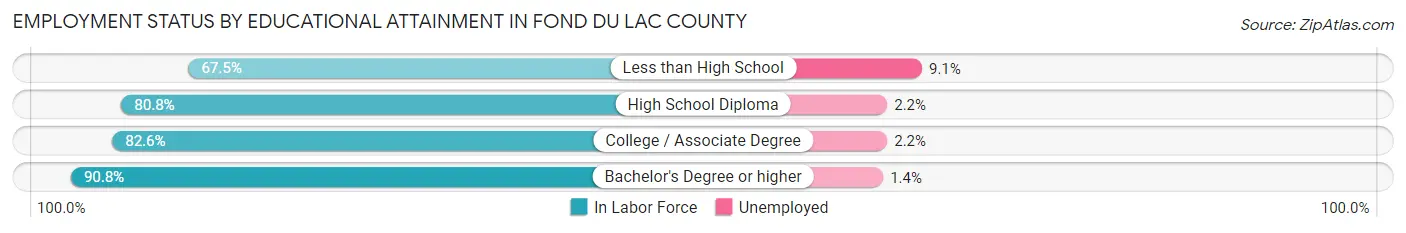
| Educational Attainment | In Labor Force | Unemployed |
| Less than High School | 2,505 (67.5%) | 338 (9.1%) |
| High School Diploma | 14,603 (80.8%) | 398 (2.2%) |
| College / Associate Degree | 15,667 (82.6%) | 417 (2.2%) |
| Bachelor's Degree or higher | 11,304 (90.8%) | 174 (1.4%) |
| Total | 44,050 (82.8%) | 1,277 (2.4%) |
Employment Occupations by Sex in Fond du Lac County
Management, Business, Science and Arts Occupations
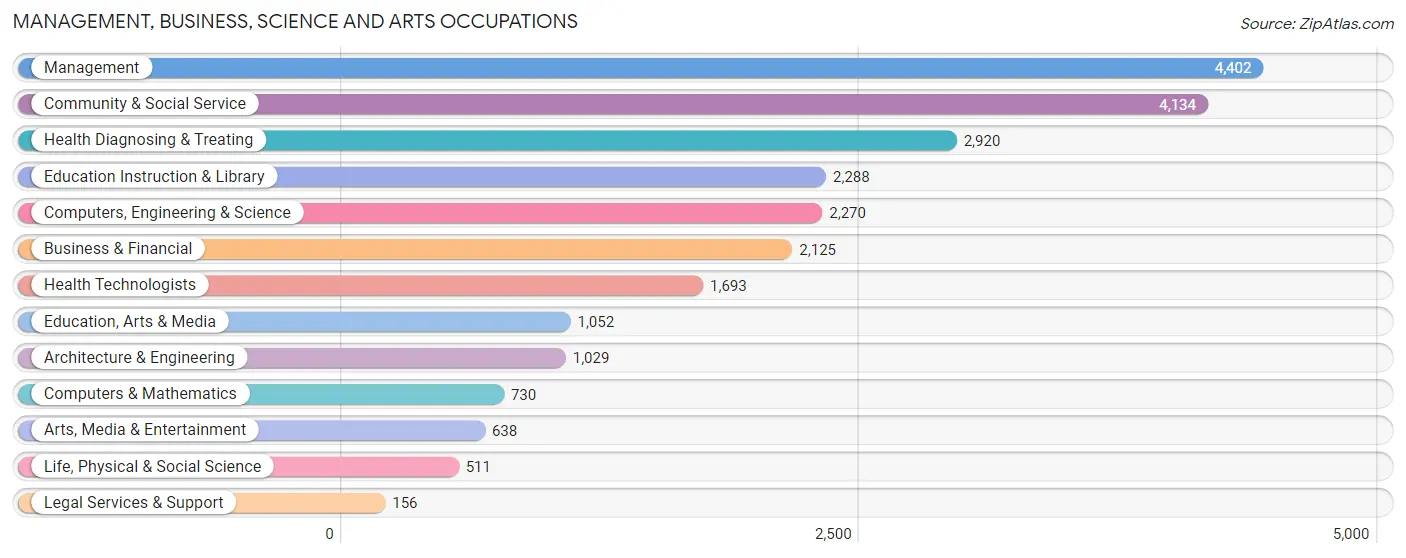
The most common Management, Business, Science and Arts occupations in Fond du Lac County are Management (4,402 | 8.2%), Community & Social Service (4,134 | 7.7%), Health Diagnosing & Treating (2,920 | 5.5%), Education Instruction & Library (2,288 | 4.3%), and Computers, Engineering & Science (2,270 | 4.3%).
Management, Business, Science and Arts Occupations by Sex
Within the Management, Business, Science and Arts occupations in Fond du Lac County, the most male-oriented occupations are Architecture & Engineering (88.0%), Computers, Engineering & Science (71.9%), and Computers & Mathematics (69.2%), while the most female-oriented occupations are Health Diagnosing & Treating (82.9%), Health Technologists (80.7%), and Education Instruction & Library (78.4%).
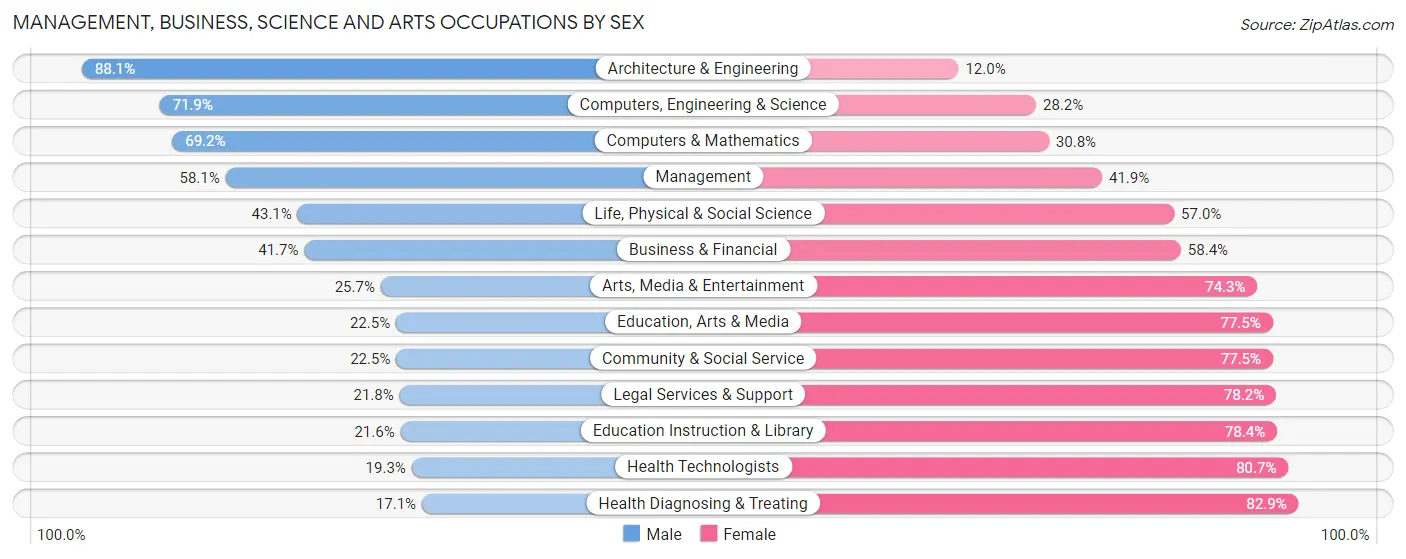
| Occupation | Male | Female |
| Management | 2,557 (58.1%) | 1,845 (41.9%) |
| Business & Financial | 885 (41.6%) | 1,240 (58.4%) |
| Computers, Engineering & Science | 1,631 (71.9%) | 639 (28.1%) |
| Computers & Mathematics | 505 (69.2%) | 225 (30.8%) |
| Architecture & Engineering | 906 (88.0%) | 123 (11.9%) |
| Life, Physical & Social Science | 220 (43.0%) | 291 (57.0%) |
| Community & Social Service | 929 (22.5%) | 3,205 (77.5%) |
| Education, Arts & Media | 237 (22.5%) | 815 (77.5%) |
| Legal Services & Support | 34 (21.8%) | 122 (78.2%) |
| Education Instruction & Library | 494 (21.6%) | 1,794 (78.4%) |
| Arts, Media & Entertainment | 164 (25.7%) | 474 (74.3%) |
| Health Diagnosing & Treating | 500 (17.1%) | 2,420 (82.9%) |
| Health Technologists | 326 (19.3%) | 1,367 (80.7%) |
| Total (Category) | 6,502 (41.0%) | 9,349 (59.0%) |
| Total (Overall) | 28,585 (53.5%) | 24,832 (46.5%) |
Services Occupations
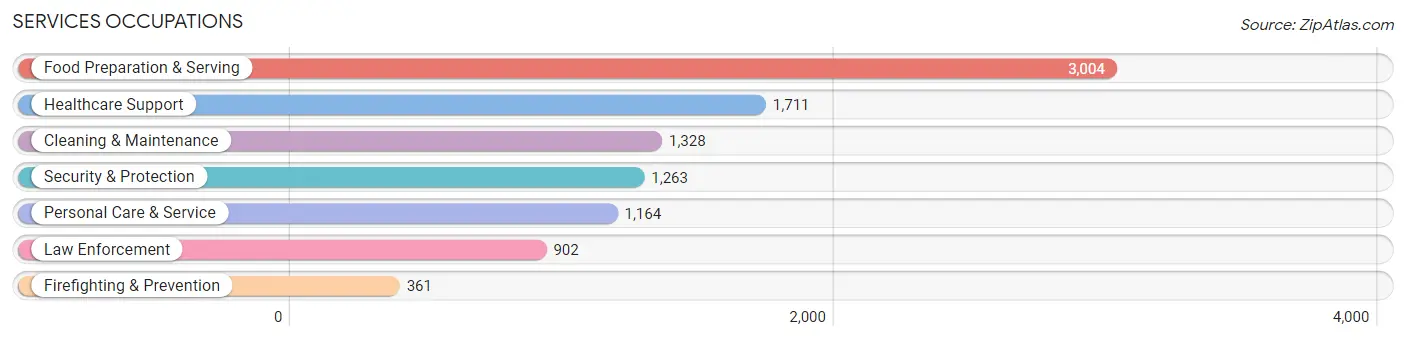
The most common Services occupations in Fond du Lac County are Food Preparation & Serving (3,004 | 5.6%), Healthcare Support (1,711 | 3.2%), Cleaning & Maintenance (1,328 | 2.5%), Security & Protection (1,263 | 2.4%), and Personal Care & Service (1,164 | 2.2%).
Services Occupations by Sex
Within the Services occupations in Fond du Lac County, the most male-oriented occupations are Firefighting & Prevention (82.0%), Security & Protection (81.2%), and Law Enforcement (80.9%), while the most female-oriented occupations are Healthcare Support (88.0%), Personal Care & Service (84.5%), and Food Preparation & Serving (62.9%).
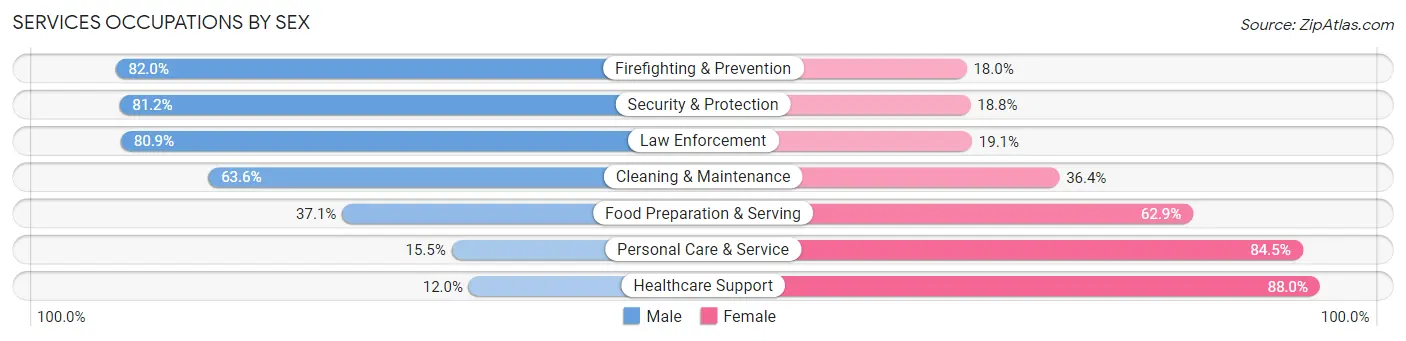
| Occupation | Male | Female |
| Healthcare Support | 206 (12.0%) | 1,505 (88.0%) |
| Security & Protection | 1,026 (81.2%) | 237 (18.8%) |
| Firefighting & Prevention | 296 (82.0%) | 65 (18.0%) |
| Law Enforcement | 730 (80.9%) | 172 (19.1%) |
| Food Preparation & Serving | 1,115 (37.1%) | 1,889 (62.9%) |
| Cleaning & Maintenance | 845 (63.6%) | 483 (36.4%) |
| Personal Care & Service | 180 (15.5%) | 984 (84.5%) |
| Total (Category) | 3,372 (39.8%) | 5,098 (60.2%) |
| Total (Overall) | 28,585 (53.5%) | 24,832 (46.5%) |
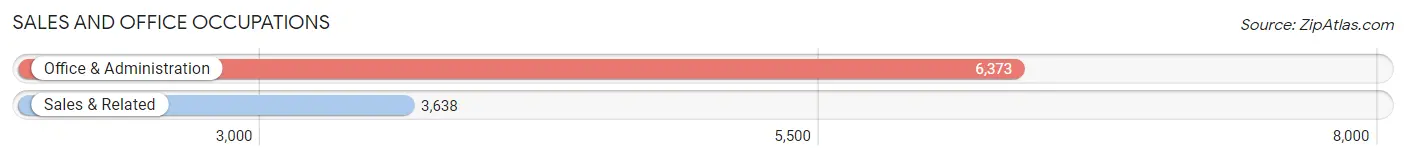
Sales and Office Occupations
The most common Sales and Office occupations in Fond du Lac County are Office & Administration (6,373 | 11.9%), and Sales & Related (3,638 | 6.8%).
Sales and Office Occupations by Sex
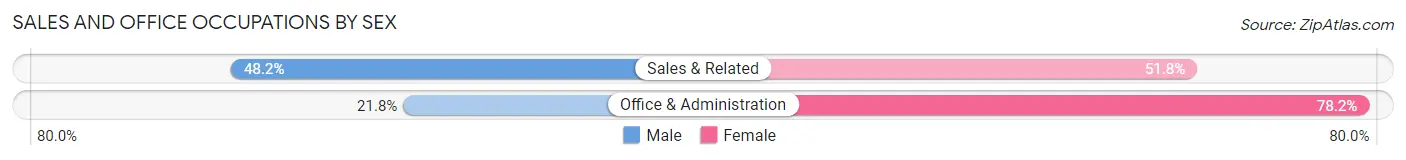
| Occupation | Male | Female |
| Sales & Related | 1,755 (48.2%) | 1,883 (51.8%) |
| Office & Administration | 1,387 (21.8%) | 4,986 (78.2%) |
| Total (Category) | 3,142 (31.4%) | 6,869 (68.6%) |
| Total (Overall) | 28,585 (53.5%) | 24,832 (46.5%) |
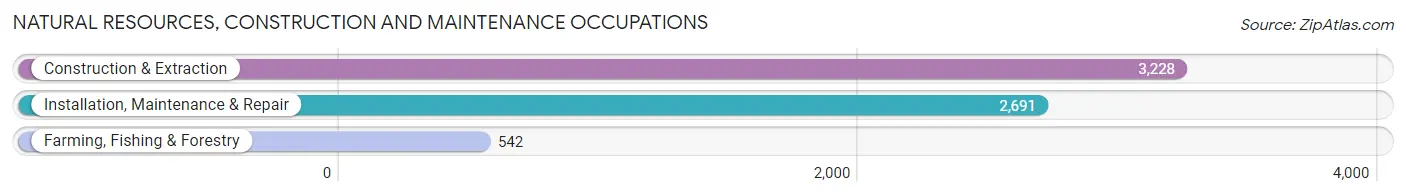
Natural Resources, Construction and Maintenance Occupations
The most common Natural Resources, Construction and Maintenance occupations in Fond du Lac County are Construction & Extraction (3,228 | 6.0%), Installation, Maintenance & Repair (2,691 | 5.0%), and Farming, Fishing & Forestry (542 | 1.0%).
Natural Resources, Construction and Maintenance Occupations by Sex
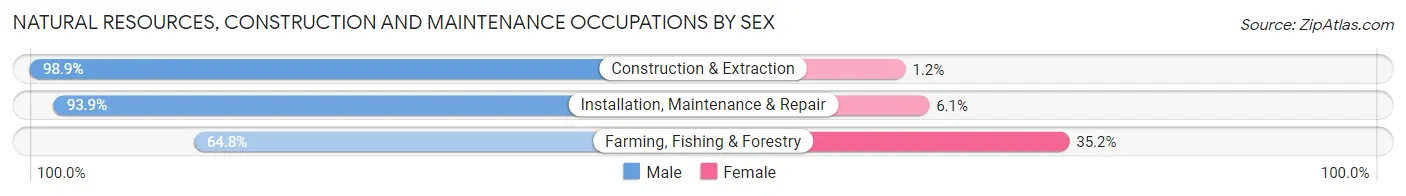
| Occupation | Male | Female |
| Farming, Fishing & Forestry | 351 (64.8%) | 191 (35.2%) |
| Construction & Extraction | 3,191 (98.9%) | 37 (1.1%) |
| Installation, Maintenance & Repair | 2,527 (93.9%) | 164 (6.1%) |
| Total (Category) | 6,069 (93.9%) | 392 (6.1%) |
| Total (Overall) | 28,585 (53.5%) | 24,832 (46.5%) |
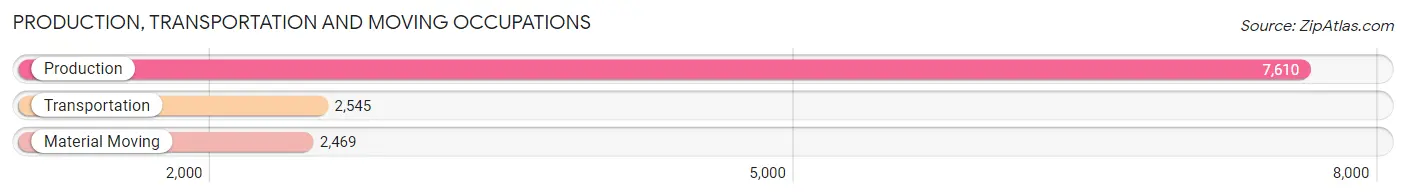
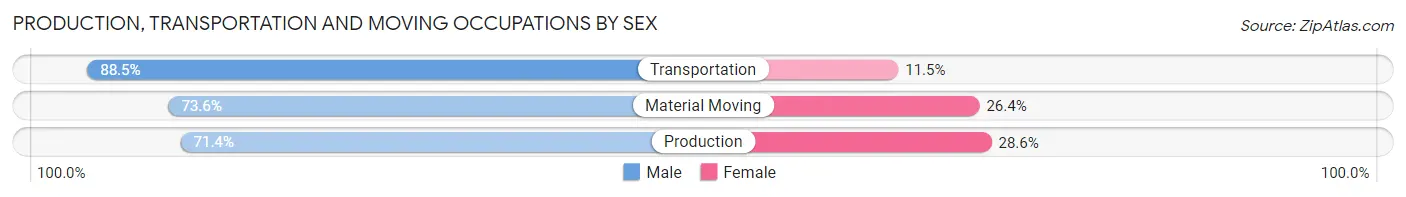
Production, Transportation and Moving Occupations
The most common Production, Transportation and Moving occupations in Fond du Lac County are Production (7,610 | 14.2%), Transportation (2,545 | 4.8%), and Material Moving (2,469 | 4.6%).
Production, Transportation and Moving Occupations by Sex
| Occupation | Male | Female |
| Production | 5,431 (71.4%) | 2,179 (28.6%) |
| Transportation | 2,252 (88.5%) | 293 (11.5%) |
| Material Moving | 1,817 (73.6%) | 652 (26.4%) |
| Total (Category) | 9,500 (75.2%) | 3,124 (24.7%) |
| Total (Overall) | 28,585 (53.5%) | 24,832 (46.5%) |
Employment Industries by Sex in Fond du Lac County
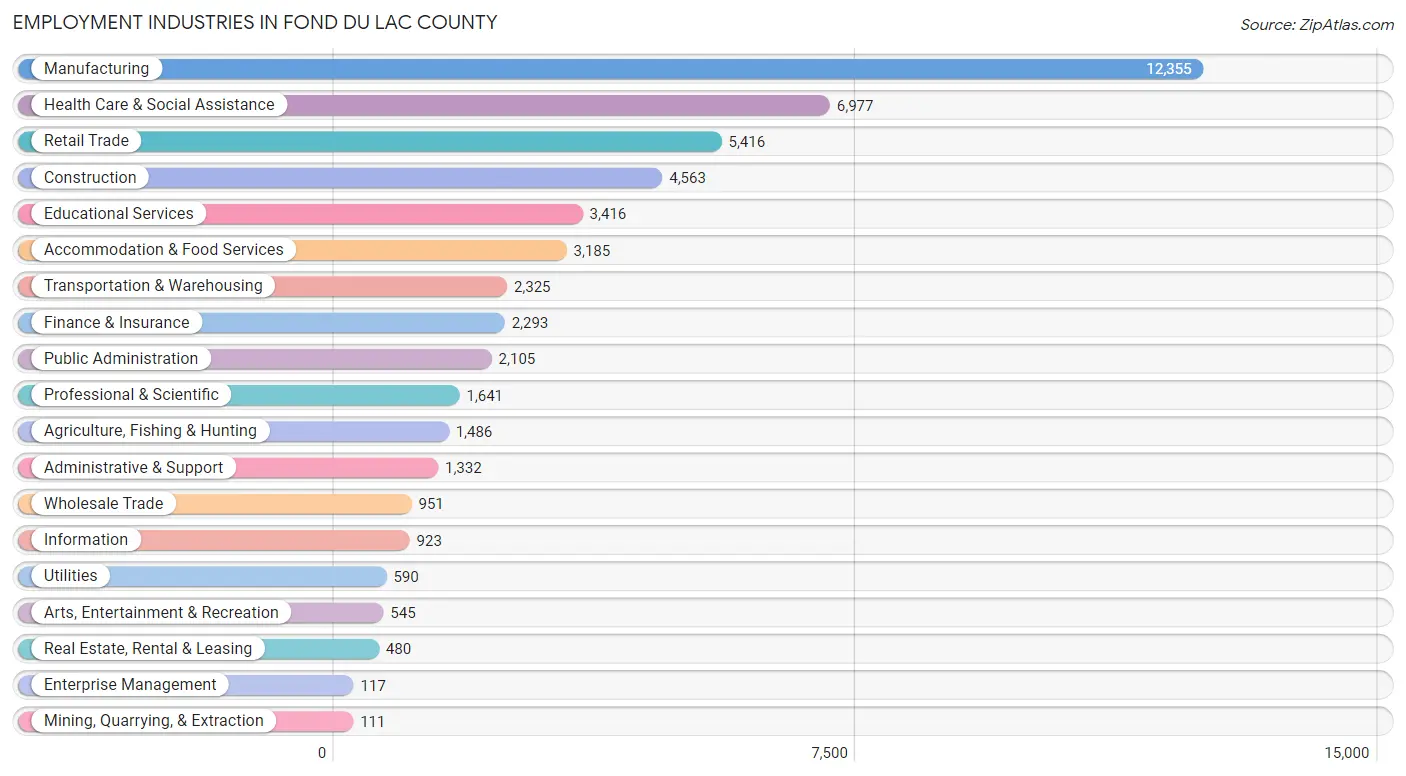
Employment Industries in Fond du Lac County
The major employment industries in Fond du Lac County include Manufacturing (12,355 | 23.1%), Health Care & Social Assistance (6,977 | 13.1%), Retail Trade (5,416 | 10.1%), Construction (4,563 | 8.5%), and Educational Services (3,416 | 6.4%).
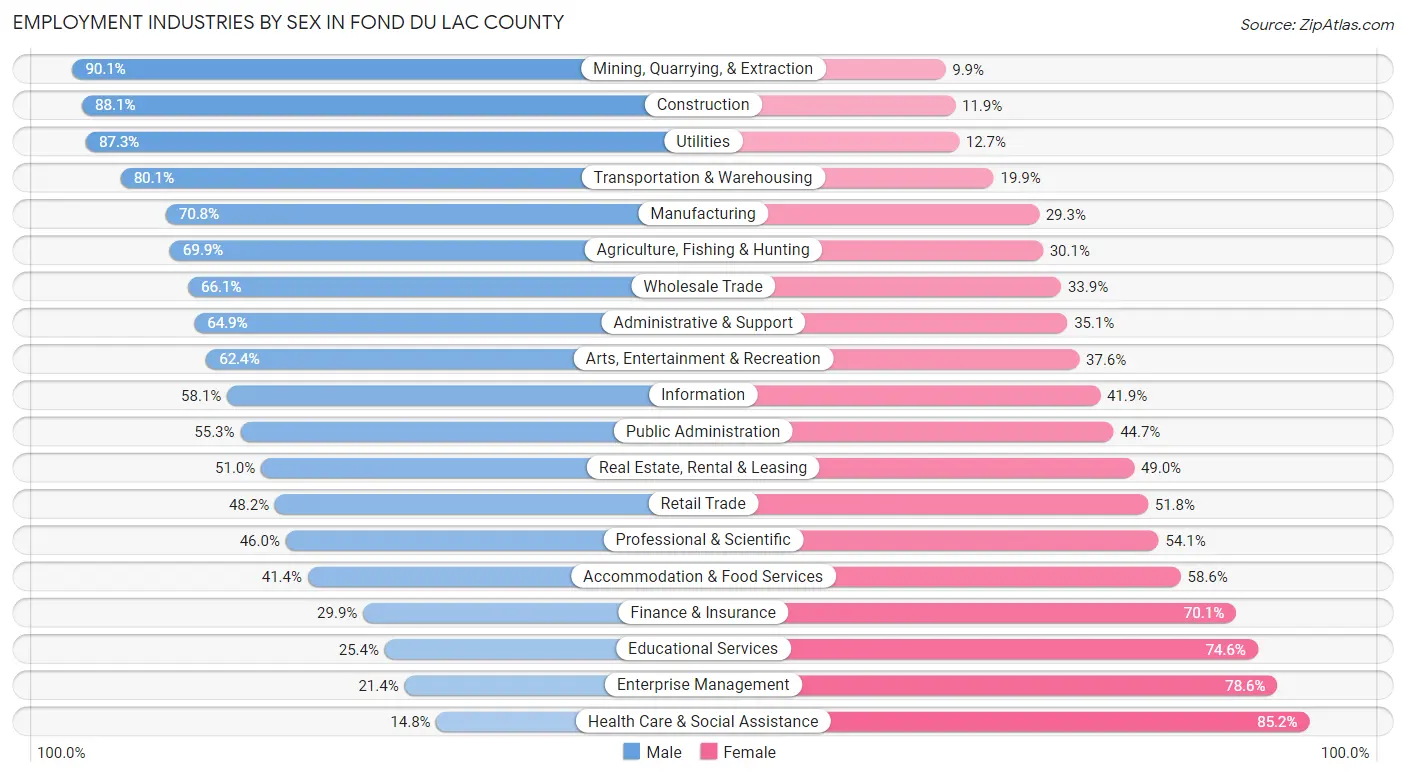
Employment Industries by Sex in Fond du Lac County
The Fond du Lac County industries that see more men than women are Mining, Quarrying, & Extraction (90.1%), Construction (88.1%), and Utilities (87.3%), whereas the industries that tend to have a higher number of women are Health Care & Social Assistance (85.2%), Enterprise Management (78.6%), and Educational Services (74.6%).
| Industry | Male | Female |
| Agriculture, Fishing & Hunting | 1,039 (69.9%) | 447 (30.1%) |
| Mining, Quarrying, & Extraction | 100 (90.1%) | 11 (9.9%) |
| Construction | 4,019 (88.1%) | 544 (11.9%) |
| Manufacturing | 8,741 (70.8%) | 3,614 (29.2%) |
| Wholesale Trade | 629 (66.1%) | 322 (33.9%) |
| Retail Trade | 2,609 (48.2%) | 2,807 (51.8%) |
| Transportation & Warehousing | 1,862 (80.1%) | 463 (19.9%) |
| Utilities | 515 (87.3%) | 75 (12.7%) |
| Information | 536 (58.1%) | 387 (41.9%) |
| Finance & Insurance | 686 (29.9%) | 1,607 (70.1%) |
| Real Estate, Rental & Leasing | 245 (51.0%) | 235 (49.0%) |
| Professional & Scientific | 754 (46.0%) | 887 (54.0%) |
| Enterprise Management | 25 (21.4%) | 92 (78.6%) |
| Administrative & Support | 864 (64.9%) | 468 (35.1%) |
| Educational Services | 869 (25.4%) | 2,547 (74.6%) |
| Health Care & Social Assistance | 1,030 (14.8%) | 5,947 (85.2%) |
| Arts, Entertainment & Recreation | 340 (62.4%) | 205 (37.6%) |
| Accommodation & Food Services | 1,318 (41.4%) | 1,867 (58.6%) |
| Public Administration | 1,165 (55.3%) | 940 (44.7%) |
| Total | 28,585 (53.5%) | 24,832 (46.5%) |
Education in Fond du Lac County
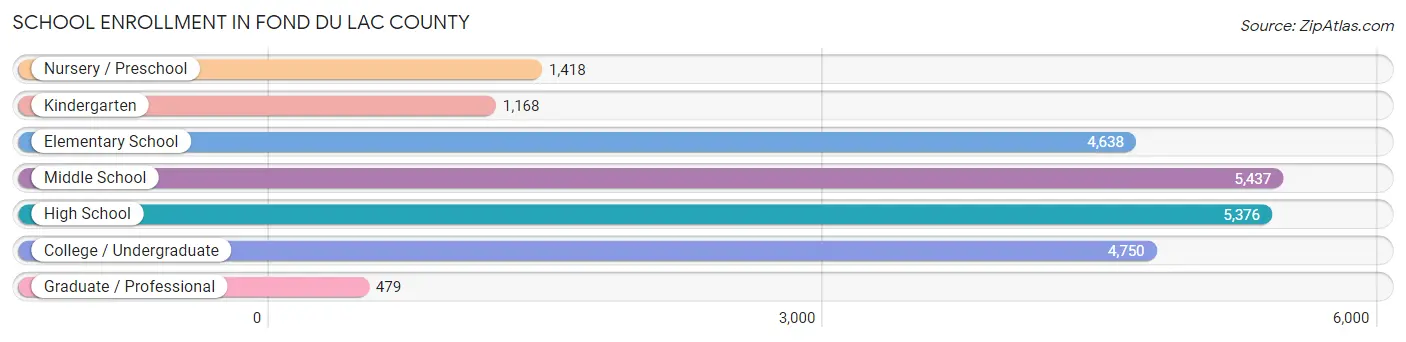
School Enrollment in Fond du Lac County
The most common levels of schooling among the 23,266 students in Fond du Lac County are middle school (5,437 | 23.4%), high school (5,376 | 23.1%), and college / undergraduate (4,750 | 20.4%).
| School Level | # Students | % Students |
| Nursery / Preschool | 1,418 | 6.1% |
| Kindergarten | 1,168 | 5.0% |
| Elementary School | 4,638 | 19.9% |
| Middle School | 5,437 | 23.4% |
| High School | 5,376 | 23.1% |
| College / Undergraduate | 4,750 | 20.4% |
| Graduate / Professional | 479 | 2.1% |
| Total | 23,266 | 100.0% |
School Enrollment by Age by Funding Source in Fond du Lac County
Out of a total of 23,266 students who are enrolled in schools in Fond du Lac County, 5,700 (24.5%) attend a private institution, while the remaining 17,566 (75.5%) are enrolled in public schools. The age group of 20 to 24 year olds has the highest likelihood of being enrolled in private schools, with 1,263 (55.2% in the age bracket) enrolled. Conversely, the age group of 15 to 17 year olds has the lowest likelihood of being enrolled in a private school, with 3,442 (84.6% in the age bracket) attending a public institution.
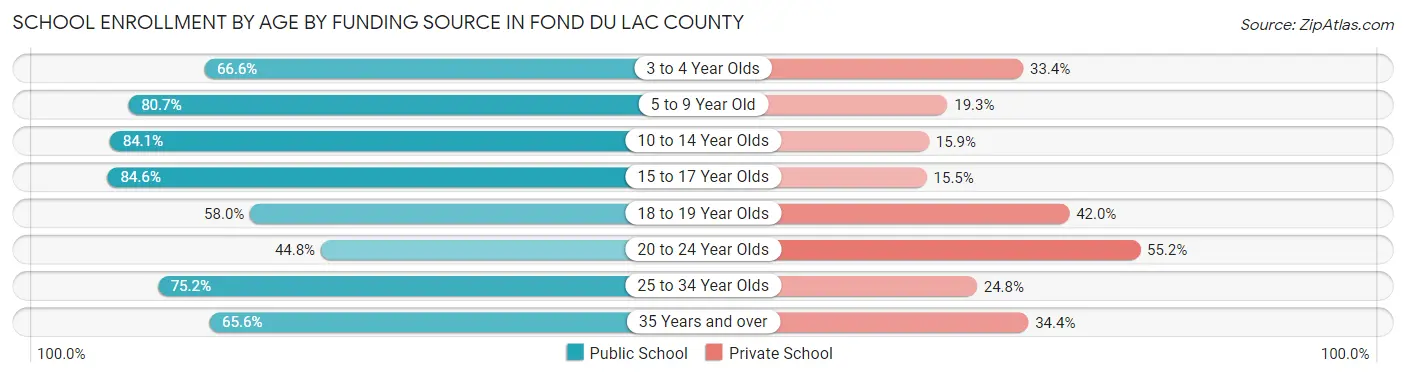
| Age Bracket | Public School | Private School |
| 3 to 4 Year Olds | 610 (66.6%) | 306 (33.4%) |
| 5 to 9 Year Old | 4,533 (80.7%) | 1,085 (19.3%) |
| 10 to 14 Year Olds | 5,544 (84.1%) | 1,046 (15.9%) |
| 15 to 17 Year Olds | 3,442 (84.6%) | 629 (15.4%) |
| 18 to 19 Year Olds | 1,121 (58.0%) | 812 (42.0%) |
| 20 to 24 Year Olds | 1,025 (44.8%) | 1,263 (55.2%) |
| 25 to 34 Year Olds | 652 (75.2%) | 215 (24.8%) |
| 35 Years and over | 645 (65.6%) | 338 (34.4%) |
| Total | 17,566 (75.5%) | 5,700 (24.5%) |
Educational Attainment by Field of Study in Fond du Lac County
Education (3,436 | 19.3%), business (3,107 | 17.5%), science & technology (1,962 | 11.0%), arts & humanities (1,742 | 9.8%), and bio, nature & agricultural (1,528 | 8.6%) are the most common fields of study among 17,789 individuals in Fond du Lac County who have obtained a bachelor's degree or higher.
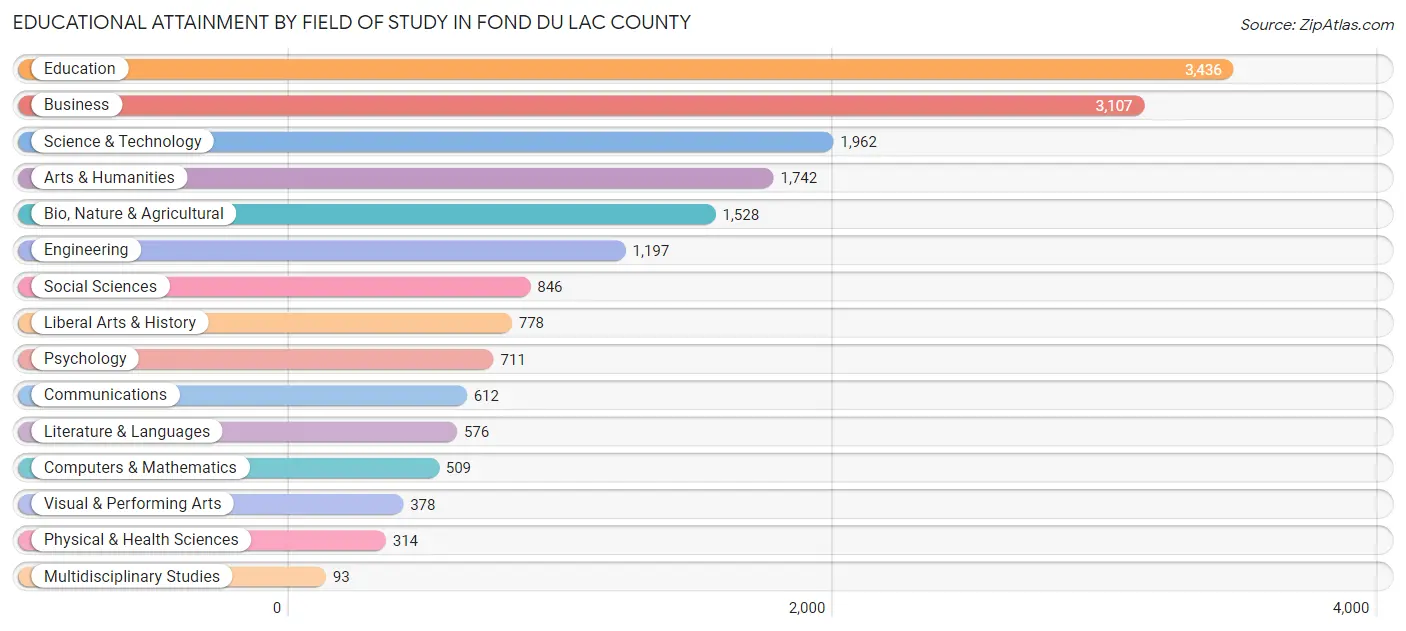
| Field of Study | # Graduates | % Graduates |
| Computers & Mathematics | 509 | 2.9% |
| Bio, Nature & Agricultural | 1,528 | 8.6% |
| Physical & Health Sciences | 314 | 1.8% |
| Psychology | 711 | 4.0% |
| Social Sciences | 846 | 4.8% |
| Engineering | 1,197 | 6.7% |
| Multidisciplinary Studies | 93 | 0.5% |
| Science & Technology | 1,962 | 11.0% |
| Business | 3,107 | 17.5% |
| Education | 3,436 | 19.3% |
| Literature & Languages | 576 | 3.2% |
| Liberal Arts & History | 778 | 4.4% |
| Visual & Performing Arts | 378 | 2.1% |
| Communications | 612 | 3.4% |
| Arts & Humanities | 1,742 | 9.8% |
| Total | 17,789 | 100.0% |
Transportation & Commute in Fond du Lac County
Vehicle Availability by Sex in Fond du Lac County
The most prevalent vehicle ownership categories in Fond du Lac County are males with 2 vehicles (10,961, accounting for 39.1%) and females with 2 vehicles (9,576, making up 46.3%).
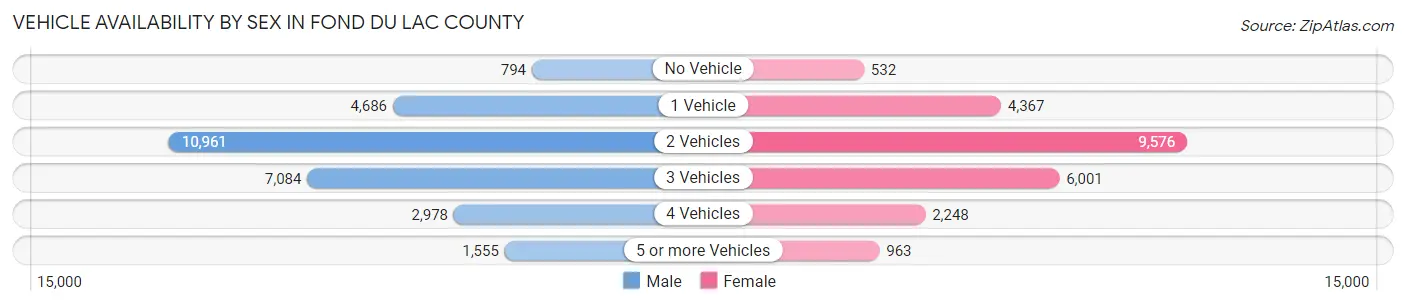
| Vehicles Available | Male | Female |
| No Vehicle | 794 (2.8%) | 532 (2.2%) |
| 1 Vehicle | 4,686 (16.7%) | 4,367 (18.4%) |
| 2 Vehicles | 10,961 (39.1%) | 9,576 (40.4%) |
| 3 Vehicles | 7,084 (25.3%) | 6,001 (25.3%) |
| 4 Vehicles | 2,978 (10.6%) | 2,248 (9.5%) |
| 5 or more Vehicles | 1,555 (5.5%) | 963 (4.1%) |
| Total | 28,058 (100.0%) | 23,687 (100.0%) |
Commute Time in Fond du Lac County
The most frequently occuring commute durations in Fond du Lac County are 10 to 14 minutes (9,287 commuters, 19.1%), 5 to 9 minutes (8,192 commuters, 16.8%), and 15 to 19 minutes (8,116 commuters, 16.7%).
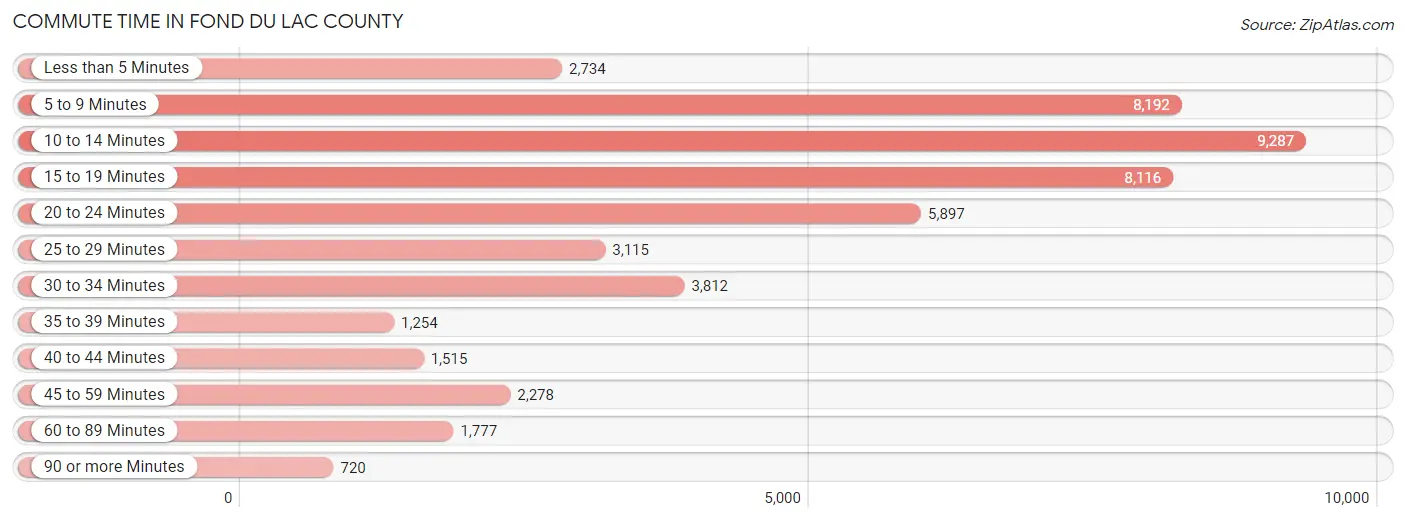
| Commute Time | # Commuters | % Commuters |
| Less than 5 Minutes | 2,734 | 5.6% |
| 5 to 9 Minutes | 8,192 | 16.8% |
| 10 to 14 Minutes | 9,287 | 19.1% |
| 15 to 19 Minutes | 8,116 | 16.7% |
| 20 to 24 Minutes | 5,897 | 12.1% |
| 25 to 29 Minutes | 3,115 | 6.4% |
| 30 to 34 Minutes | 3,812 | 7.8% |
| 35 to 39 Minutes | 1,254 | 2.6% |
| 40 to 44 Minutes | 1,515 | 3.1% |
| 45 to 59 Minutes | 2,278 | 4.7% |
| 60 to 89 Minutes | 1,777 | 3.6% |
| 90 or more Minutes | 720 | 1.5% |
Commute Time by Sex in Fond du Lac County
The most common commute times in Fond du Lac County are 10 to 14 minutes (4,936 commuters, 18.6%) for males and 10 to 14 minutes (4,351 commuters, 19.7%) for females.
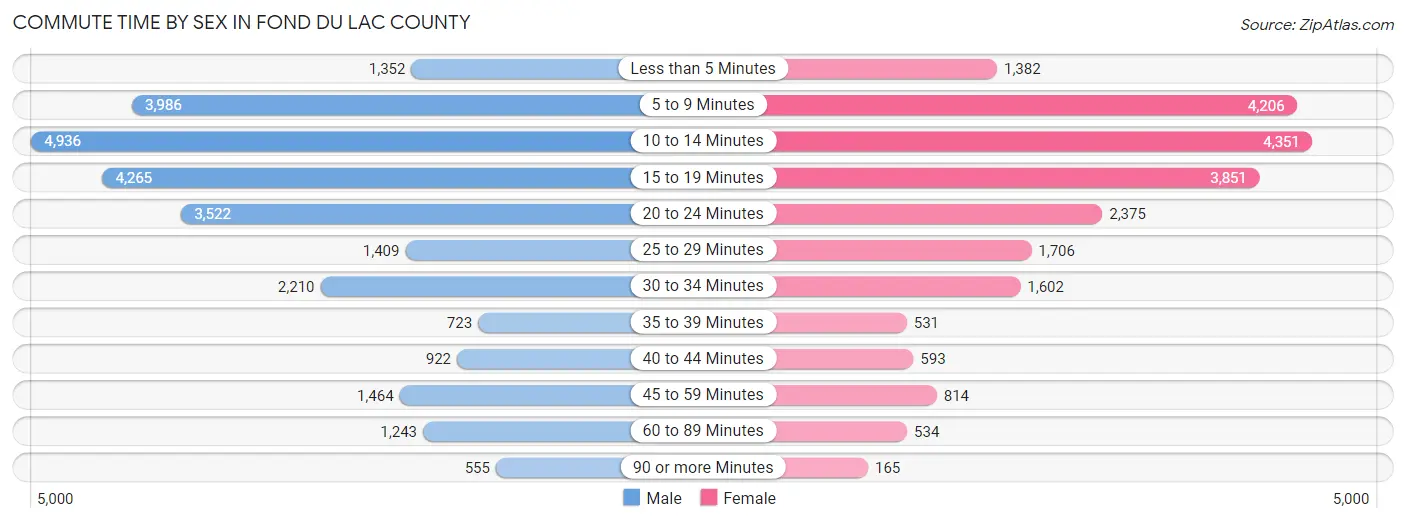
| Commute Time | Male | Female |
| Less than 5 Minutes | 1,352 (5.1%) | 1,382 (6.2%) |
| 5 to 9 Minutes | 3,986 (15.0%) | 4,206 (19.0%) |
| 10 to 14 Minutes | 4,936 (18.6%) | 4,351 (19.7%) |
| 15 to 19 Minutes | 4,265 (16.0%) | 3,851 (17.4%) |
| 20 to 24 Minutes | 3,522 (13.3%) | 2,375 (10.7%) |
| 25 to 29 Minutes | 1,409 (5.3%) | 1,706 (7.7%) |
| 30 to 34 Minutes | 2,210 (8.3%) | 1,602 (7.2%) |
| 35 to 39 Minutes | 723 (2.7%) | 531 (2.4%) |
| 40 to 44 Minutes | 922 (3.5%) | 593 (2.7%) |
| 45 to 59 Minutes | 1,464 (5.5%) | 814 (3.7%) |
| 60 to 89 Minutes | 1,243 (4.7%) | 534 (2.4%) |
| 90 or more Minutes | 555 (2.1%) | 165 (0.7%) |
Time of Departure to Work by Sex in Fond du Lac County
The most frequent times of departure to work in Fond du Lac County are 12:00 AM to 4:59 AM (3,395, 12.8%) for males and 7:00 AM to 7:29 AM (3,900, 17.6%) for females.
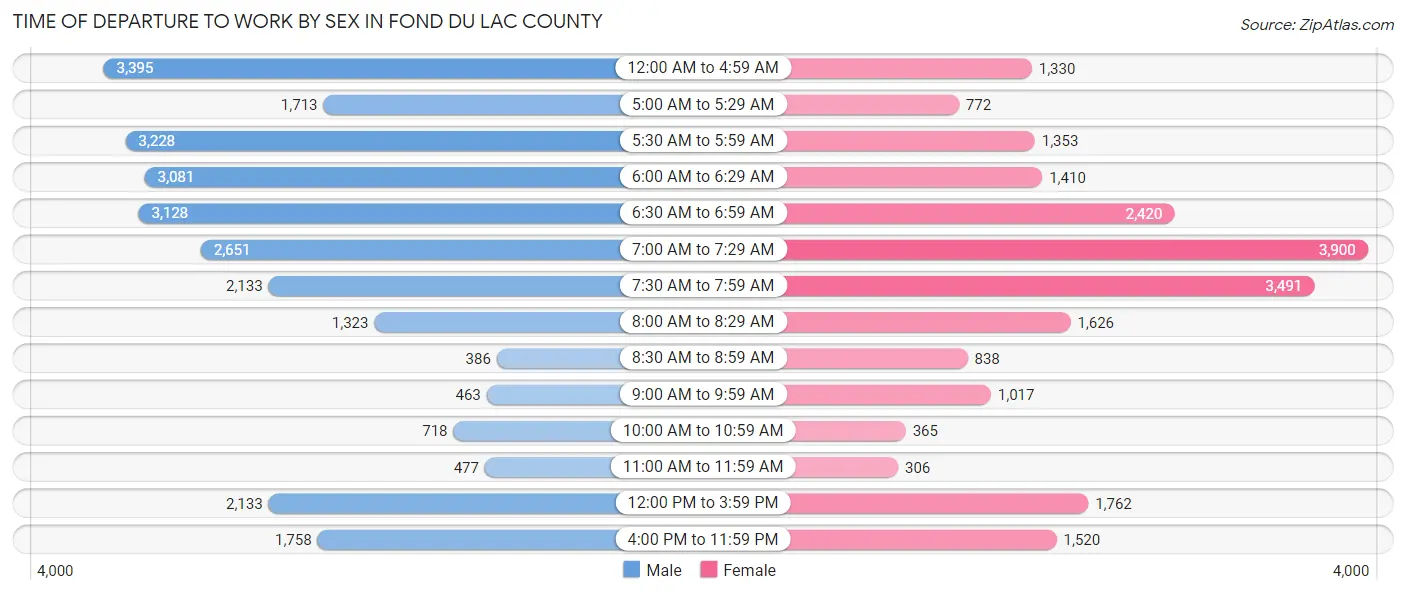
| Time of Departure | Male | Female |
| 12:00 AM to 4:59 AM | 3,395 (12.8%) | 1,330 (6.0%) |
| 5:00 AM to 5:29 AM | 1,713 (6.4%) | 772 (3.5%) |
| 5:30 AM to 5:59 AM | 3,228 (12.1%) | 1,353 (6.1%) |
| 6:00 AM to 6:29 AM | 3,081 (11.6%) | 1,410 (6.4%) |
| 6:30 AM to 6:59 AM | 3,128 (11.8%) | 2,420 (11.0%) |
| 7:00 AM to 7:29 AM | 2,651 (10.0%) | 3,900 (17.6%) |
| 7:30 AM to 7:59 AM | 2,133 (8.0%) | 3,491 (15.8%) |
| 8:00 AM to 8:29 AM | 1,323 (5.0%) | 1,626 (7.3%) |
| 8:30 AM to 8:59 AM | 386 (1.5%) | 838 (3.8%) |
| 9:00 AM to 9:59 AM | 463 (1.7%) | 1,017 (4.6%) |
| 10:00 AM to 10:59 AM | 718 (2.7%) | 365 (1.7%) |
| 11:00 AM to 11:59 AM | 477 (1.8%) | 306 (1.4%) |
| 12:00 PM to 3:59 PM | 2,133 (8.0%) | 1,762 (8.0%) |
| 4:00 PM to 11:59 PM | 1,758 (6.6%) | 1,520 (6.9%) |
| Total | 26,587 (100.0%) | 22,110 (100.0%) |
Housing Occupancy in Fond du Lac County
Occupancy by Ownership in Fond du Lac County
Of the total 42,368 dwellings in Fond du Lac County, owner-occupied units account for 29,931 (70.7%), while renter-occupied units make up 12,437 (29.3%).
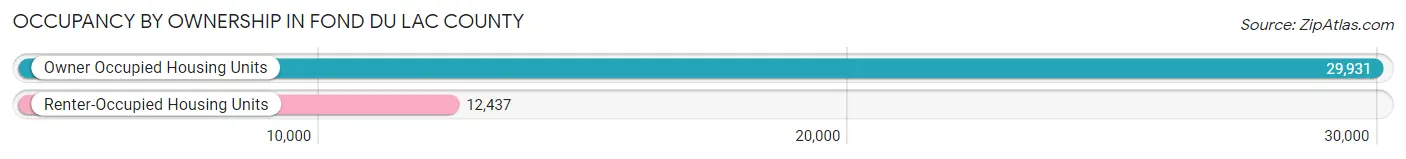
| Occupancy | # Housing Units | % Housing Units |
| Owner Occupied Housing Units | 29,931 | 70.7% |
| Renter-Occupied Housing Units | 12,437 | 29.3% |
| Total Occupied Housing Units | 42,368 | 100.0% |
Occupancy by Household Size in Fond du Lac County
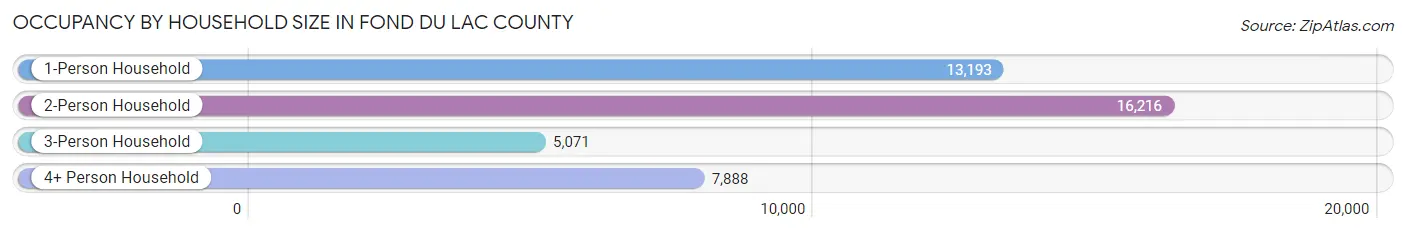
| Household Size | # Housing Units | % Housing Units |
| 1-Person Household | 13,193 | 31.1% |
| 2-Person Household | 16,216 | 38.3% |
| 3-Person Household | 5,071 | 12.0% |
| 4+ Person Household | 7,888 | 18.6% |
| Total Housing Units | 42,368 | 100.0% |
Occupancy by Ownership by Household Size in Fond du Lac County
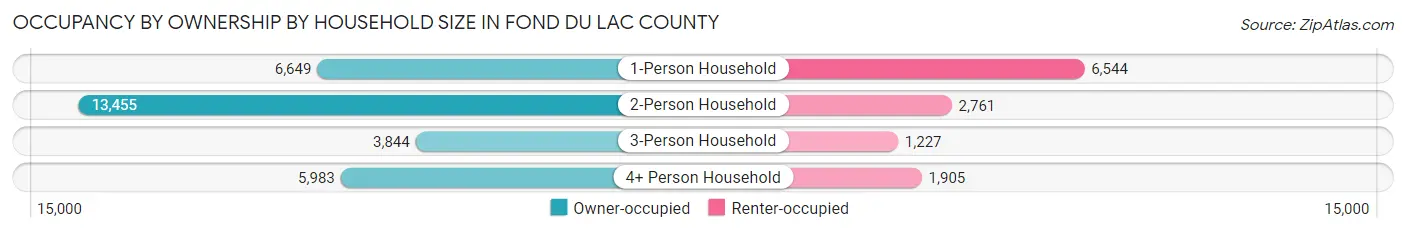
| Household Size | Owner-occupied | Renter-occupied |
| 1-Person Household | 6,649 (50.4%) | 6,544 (49.6%) |
| 2-Person Household | 13,455 (83.0%) | 2,761 (17.0%) |
| 3-Person Household | 3,844 (75.8%) | 1,227 (24.2%) |
| 4+ Person Household | 5,983 (75.8%) | 1,905 (24.1%) |
| Total Housing Units | 29,931 (70.7%) | 12,437 (29.3%) |
Occupancy by Educational Attainment in Fond du Lac County
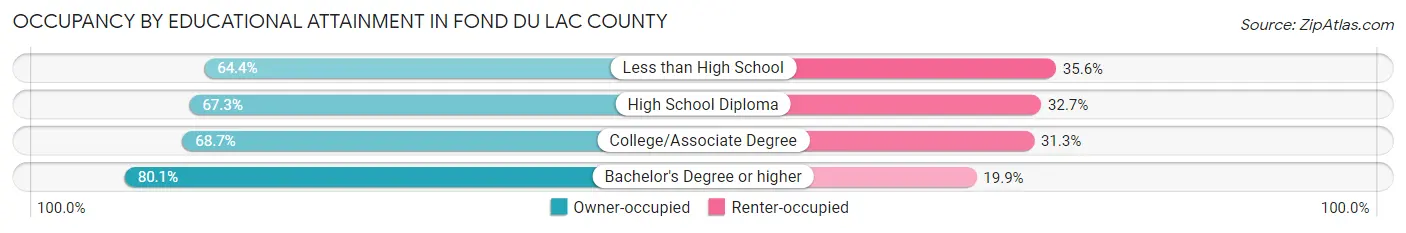
| Household Size | Owner-occupied | Renter-occupied |
| Less than High School | 1,732 (64.4%) | 959 (35.6%) |
| High School Diploma | 10,041 (67.3%) | 4,879 (32.7%) |
| College/Associate Degree | 10,109 (68.7%) | 4,603 (31.3%) |
| Bachelor's Degree or higher | 8,049 (80.1%) | 1,996 (19.9%) |
Occupancy by Age of Householder in Fond du Lac County
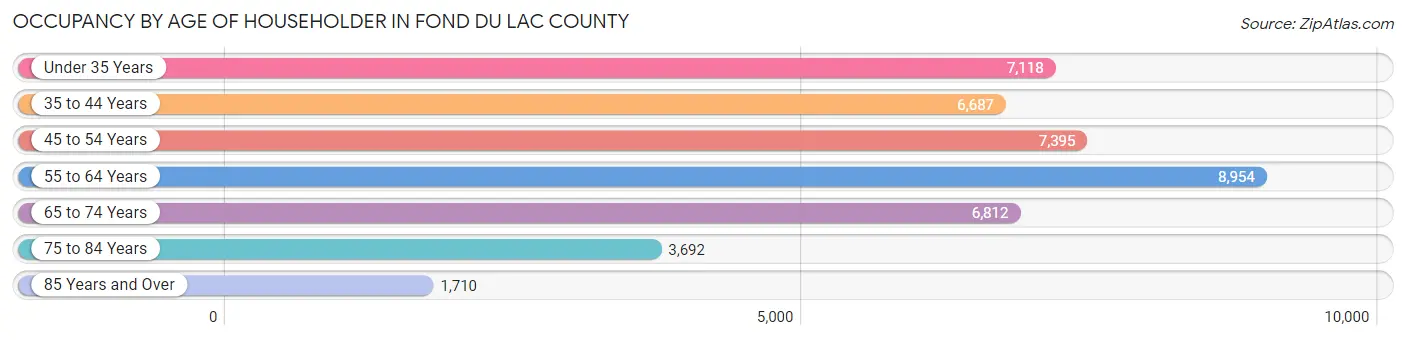
| Age Bracket | # Households | % Households |
| Under 35 Years | 7,118 | 16.8% |
| 35 to 44 Years | 6,687 | 15.8% |
| 45 to 54 Years | 7,395 | 17.4% |
| 55 to 64 Years | 8,954 | 21.1% |
| 65 to 74 Years | 6,812 | 16.1% |
| 75 to 84 Years | 3,692 | 8.7% |
| 85 Years and Over | 1,710 | 4.0% |
| Total | 42,368 | 100.0% |
Housing Finances in Fond du Lac County
Median Income by Occupancy in Fond du Lac County
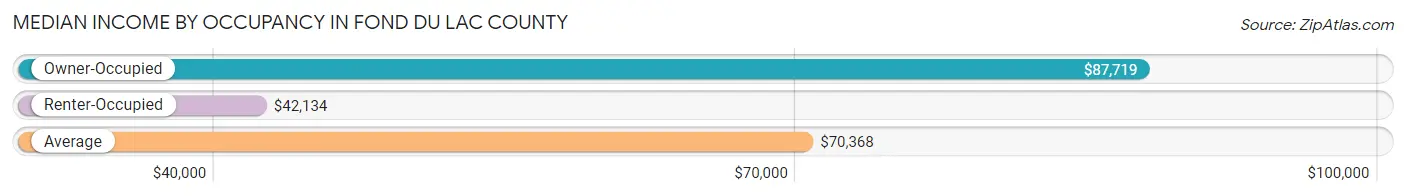
| Occupancy Type | # Households | Median Income |
| Owner-Occupied | 29,931 (70.7%) | $87,719 |
| Renter-Occupied | 12,437 (29.3%) | $42,134 |
| Average | 42,368 (100.0%) | $70,368 |
Occupancy by Householder Income Bracket in Fond du Lac County
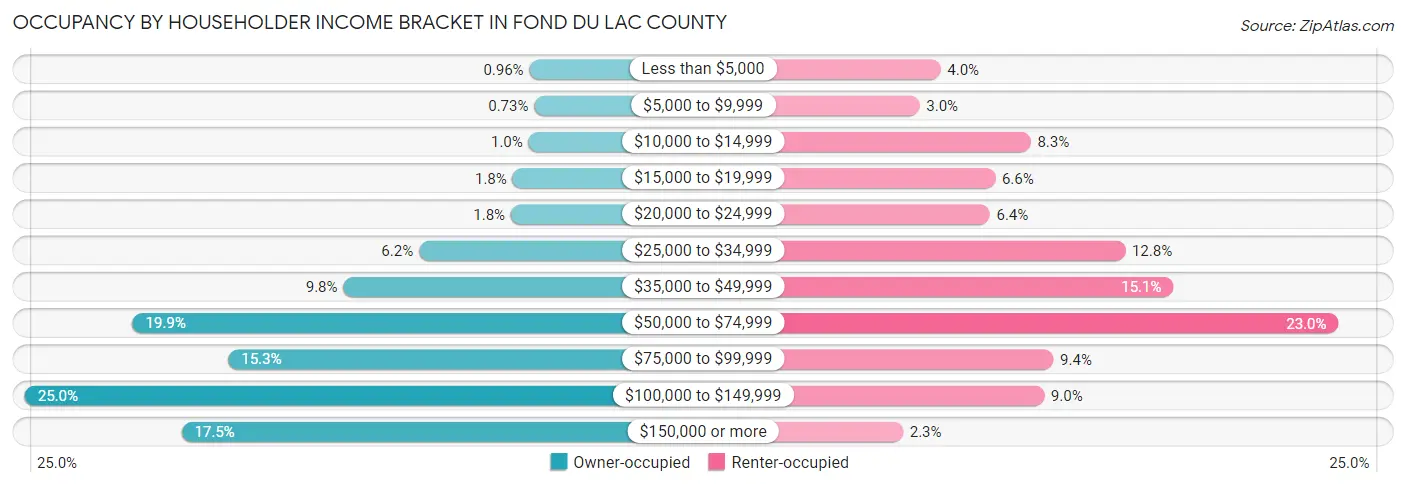
| Income Bracket | Owner-occupied | Renter-occupied |
| Less than $5,000 | 286 (1.0%) | 502 (4.0%) |
| $5,000 to $9,999 | 217 (0.7%) | 378 (3.0%) |
| $10,000 to $14,999 | 298 (1.0%) | 1,036 (8.3%) |
| $15,000 to $19,999 | 527 (1.8%) | 826 (6.6%) |
| $20,000 to $24,999 | 552 (1.8%) | 793 (6.4%) |
| $25,000 to $34,999 | 1,863 (6.2%) | 1,596 (12.8%) |
| $35,000 to $49,999 | 2,939 (9.8%) | 1,882 (15.1%) |
| $50,000 to $74,999 | 5,944 (19.9%) | 2,859 (23.0%) |
| $75,000 to $99,999 | 4,578 (15.3%) | 1,170 (9.4%) |
| $100,000 to $149,999 | 7,479 (25.0%) | 1,115 (9.0%) |
| $150,000 or more | 5,248 (17.5%) | 280 (2.2%) |
| Total | 29,931 (100.0%) | 12,437 (100.0%) |
Monthly Housing Cost Tiers in Fond du Lac County
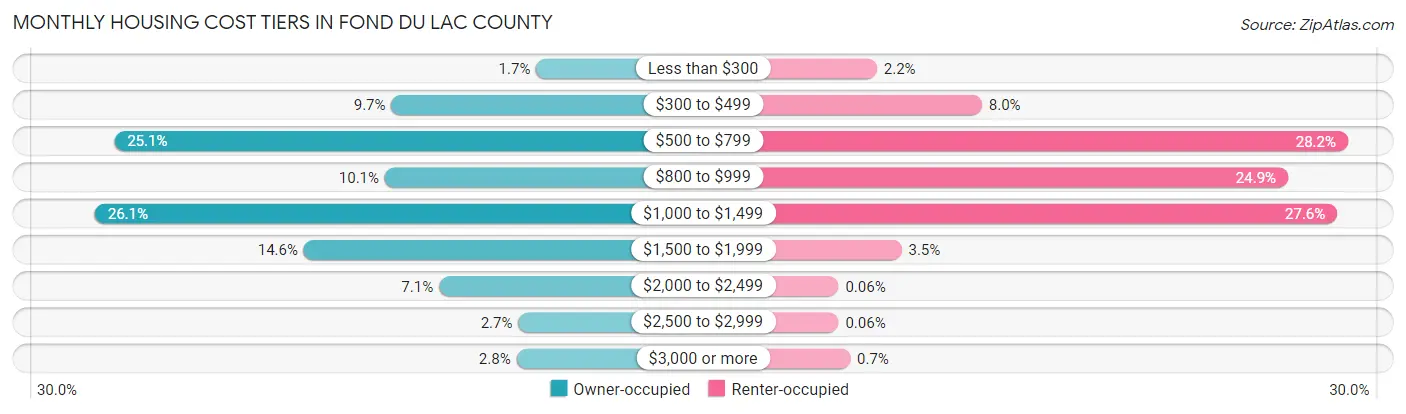
| Monthly Cost | Owner-occupied | Renter-occupied |
| Less than $300 | 522 (1.7%) | 271 (2.2%) |
| $300 to $499 | 2,914 (9.7%) | 992 (8.0%) |
| $500 to $799 | 7,499 (25.1%) | 3,506 (28.2%) |
| $800 to $999 | 3,022 (10.1%) | 3,094 (24.9%) |
| $1,000 to $1,499 | 7,817 (26.1%) | 3,433 (27.6%) |
| $1,500 to $1,999 | 4,365 (14.6%) | 440 (3.5%) |
| $2,000 to $2,499 | 2,127 (7.1%) | 7 (0.1%) |
| $2,500 to $2,999 | 817 (2.7%) | 7 (0.1%) |
| $3,000 or more | 848 (2.8%) | 87 (0.7%) |
| Total | 29,931 (100.0%) | 12,437 (100.0%) |
Physical Housing Characteristics in Fond du Lac County
Housing Structures in Fond du Lac County
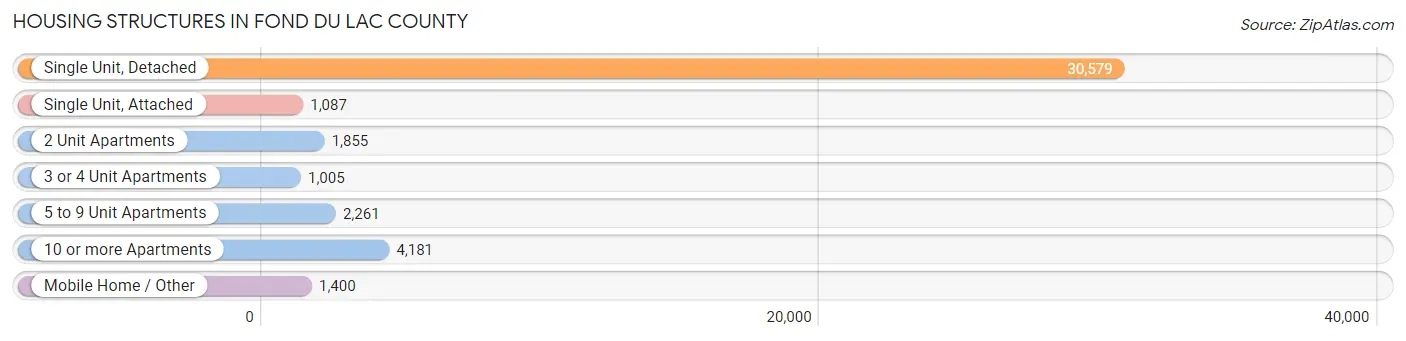
| Structure Type | # Housing Units | % Housing Units |
| Single Unit, Detached | 30,579 | 72.2% |
| Single Unit, Attached | 1,087 | 2.6% |
| 2 Unit Apartments | 1,855 | 4.4% |
| 3 or 4 Unit Apartments | 1,005 | 2.4% |
| 5 to 9 Unit Apartments | 2,261 | 5.3% |
| 10 or more Apartments | 4,181 | 9.9% |
| Mobile Home / Other | 1,400 | 3.3% |
| Total | 42,368 | 100.0% |
Housing Structures by Occupancy in Fond du Lac County
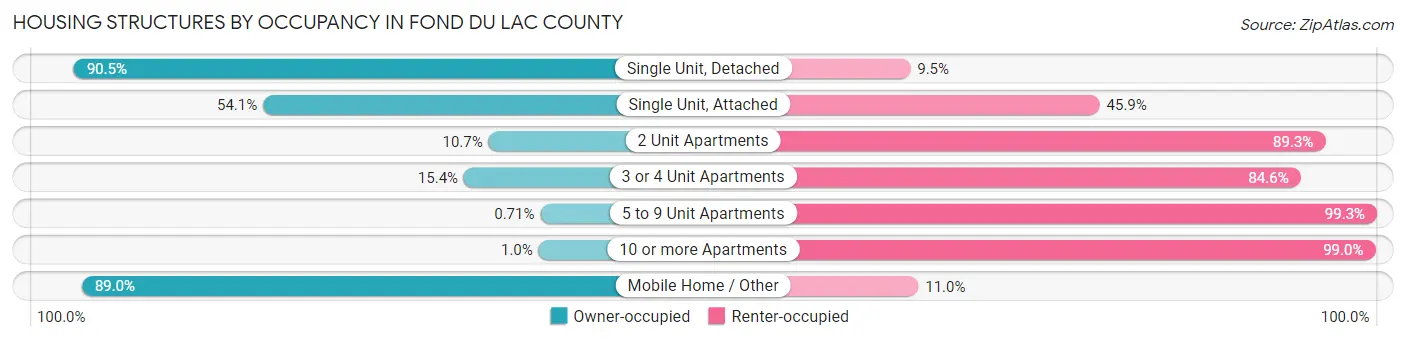
| Structure Type | Owner-occupied | Renter-occupied |
| Single Unit, Detached | 27,685 (90.5%) | 2,894 (9.5%) |
| Single Unit, Attached | 588 (54.1%) | 499 (45.9%) |
| 2 Unit Apartments | 198 (10.7%) | 1,657 (89.3%) |
| 3 or 4 Unit Apartments | 155 (15.4%) | 850 (84.6%) |
| 5 to 9 Unit Apartments | 16 (0.7%) | 2,245 (99.3%) |
| 10 or more Apartments | 43 (1.0%) | 4,138 (99.0%) |
| Mobile Home / Other | 1,246 (89.0%) | 154 (11.0%) |
| Total | 29,931 (70.7%) | 12,437 (29.3%) |
Housing Structures by Number of Rooms in Fond du Lac County
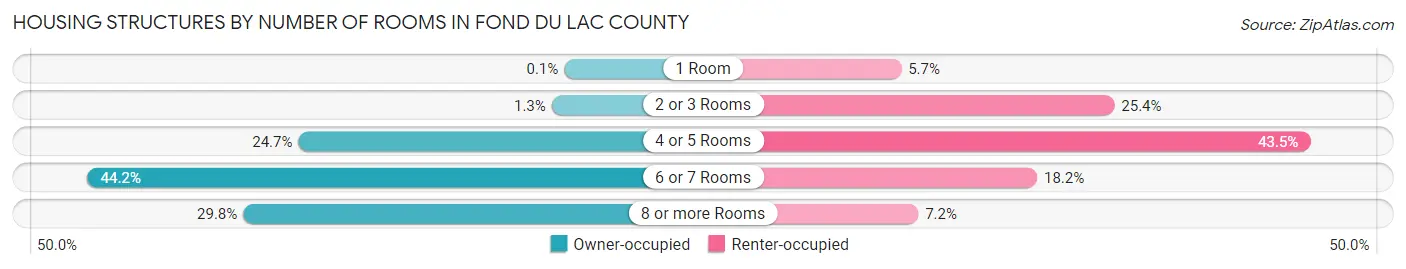
| Number of Rooms | Owner-occupied | Renter-occupied |
| 1 Room | 30 (0.1%) | 705 (5.7%) |
| 2 or 3 Rooms | 377 (1.3%) | 3,156 (25.4%) |
| 4 or 5 Rooms | 7,389 (24.7%) | 5,409 (43.5%) |
| 6 or 7 Rooms | 13,220 (44.2%) | 2,267 (18.2%) |
| 8 or more Rooms | 8,915 (29.8%) | 900 (7.2%) |
| Total | 29,931 (100.0%) | 12,437 (100.0%) |
Housing Structure by Heating Type in Fond du Lac County
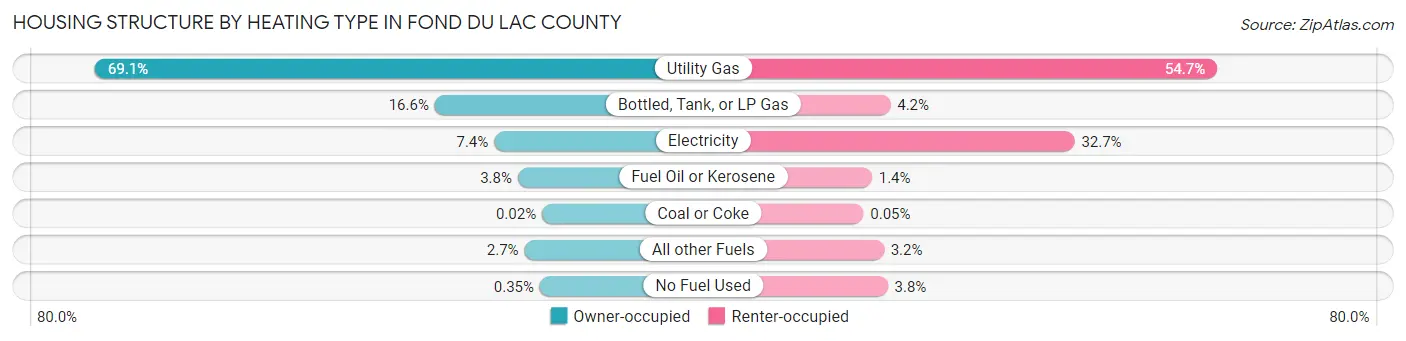
| Heating Type | Owner-occupied | Renter-occupied |
| Utility Gas | 20,690 (69.1%) | 6,805 (54.7%) |
| Bottled, Tank, or LP Gas | 4,968 (16.6%) | 524 (4.2%) |
| Electricity | 2,222 (7.4%) | 4,065 (32.7%) |
| Fuel Oil or Kerosene | 1,123 (3.7%) | 168 (1.3%) |
| Coal or Coke | 5 (0.0%) | 6 (0.1%) |
| All other Fuels | 818 (2.7%) | 397 (3.2%) |
| No Fuel Used | 105 (0.4%) | 472 (3.8%) |
| Total | 29,931 (100.0%) | 12,437 (100.0%) |
Household Vehicle Usage in Fond du Lac County
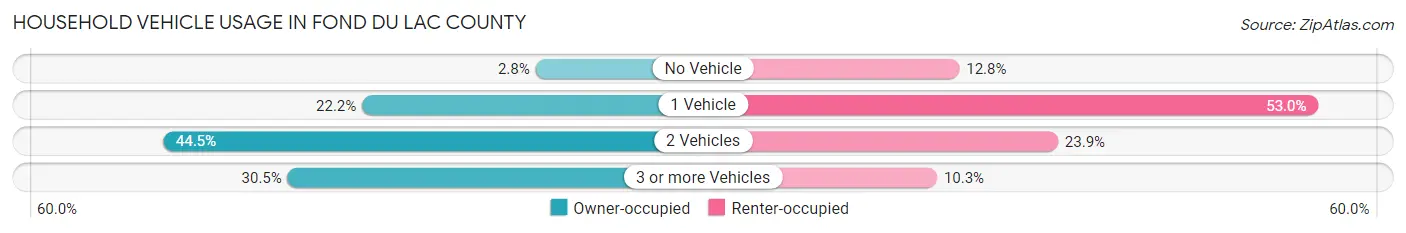
| Vehicles per Household | Owner-occupied | Renter-occupied |
| No Vehicle | 827 (2.8%) | 1,593 (12.8%) |
| 1 Vehicle | 6,641 (22.2%) | 6,594 (53.0%) |
| 2 Vehicles | 13,322 (44.5%) | 2,968 (23.9%) |
| 3 or more Vehicles | 9,141 (30.5%) | 1,282 (10.3%) |
| Total | 29,931 (100.0%) | 12,437 (100.0%) |
Real Estate & Mortgages in Fond du Lac County
Real Estate and Mortgage Overview in Fond du Lac County
| Characteristic | Without Mortgage | With Mortgage |
| Housing Units | 12,335 | 17,596 |
| Median Property Value | $192,000 | $198,400 |
| Median Household Income | $64,840 | $3,701 |
| Monthly Housing Costs | $612 | $843 |
| Real Estate Taxes | $3,286 | $105 |
Property Value by Mortgage Status in Fond du Lac County
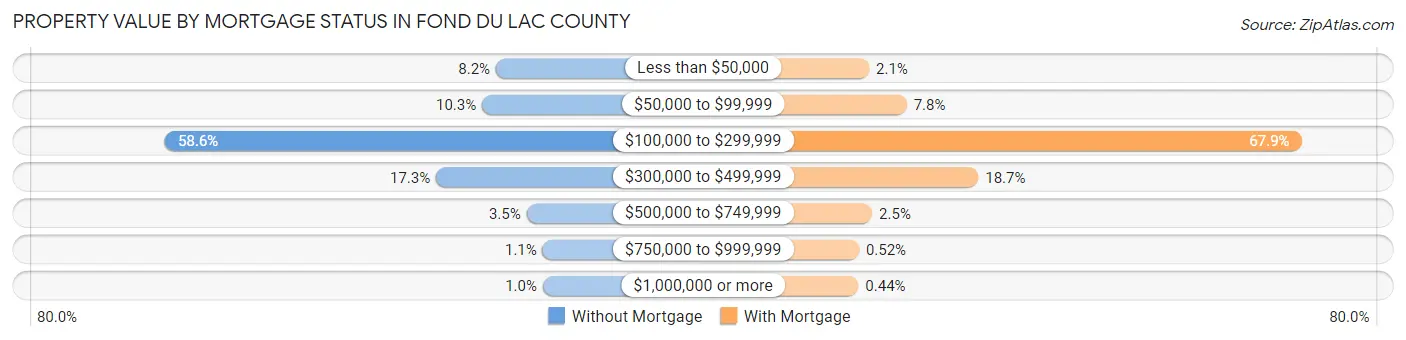
| Property Value | Without Mortgage | With Mortgage |
| Less than $50,000 | 1,009 (8.2%) | 362 (2.1%) |
| $50,000 to $99,999 | 1,271 (10.3%) | 1,373 (7.8%) |
| $100,000 to $299,999 | 7,230 (58.6%) | 11,954 (67.9%) |
| $300,000 to $499,999 | 2,134 (17.3%) | 3,292 (18.7%) |
| $500,000 to $749,999 | 433 (3.5%) | 445 (2.5%) |
| $750,000 to $999,999 | 131 (1.1%) | 92 (0.5%) |
| $1,000,000 or more | 127 (1.0%) | 78 (0.4%) |
| Total | 12,335 (100.0%) | 17,596 (100.0%) |
Household Income by Mortgage Status in Fond du Lac County
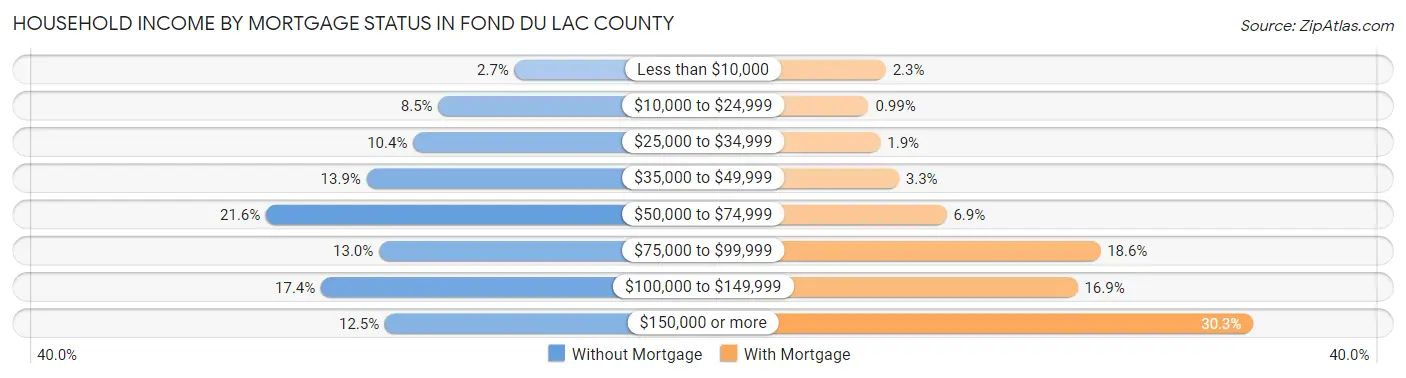
| Household Income | Without Mortgage | With Mortgage |
| Less than $10,000 | 328 (2.7%) | 405 (2.3%) |
| $10,000 to $24,999 | 1,045 (8.5%) | 175 (1.0%) |
| $25,000 to $34,999 | 1,282 (10.4%) | 332 (1.9%) |
| $35,000 to $49,999 | 1,719 (13.9%) | 581 (3.3%) |
| $50,000 to $74,999 | 2,664 (21.6%) | 1,220 (6.9%) |
| $75,000 to $99,999 | 1,602 (13.0%) | 3,280 (18.6%) |
| $100,000 to $149,999 | 2,148 (17.4%) | 2,976 (16.9%) |
| $150,000 or more | 1,547 (12.5%) | 5,331 (30.3%) |
| Total | 12,335 (100.0%) | 17,596 (100.0%) |
Property Value to Household Income Ratio in Fond du Lac County
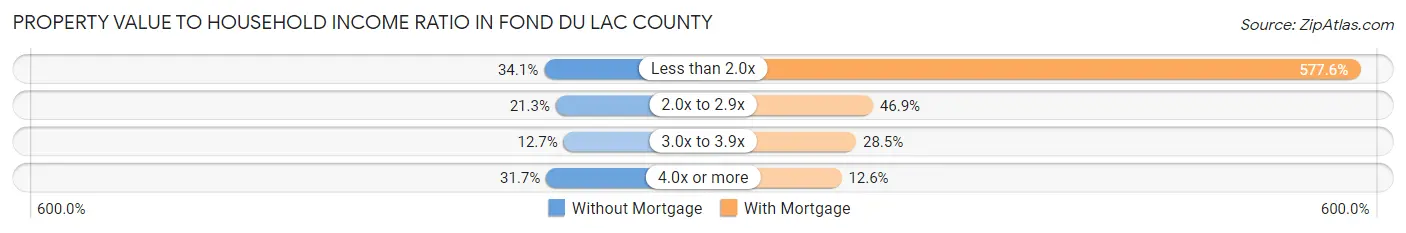
| Value-to-Income Ratio | Without Mortgage | With Mortgage |
| Less than 2.0x | 4,200 (34.1%) | 101,625 (577.6%) |
| 2.0x to 2.9x | 2,622 (21.3%) | 8,246 (46.9%) |
| 3.0x to 3.9x | 1,569 (12.7%) | 5,016 (28.5%) |
| 4.0x or more | 3,912 (31.7%) | 2,210 (12.6%) |
| Total | 12,335 (100.0%) | 17,596 (100.0%) |
Real Estate Taxes by Mortgage Status in Fond du Lac County
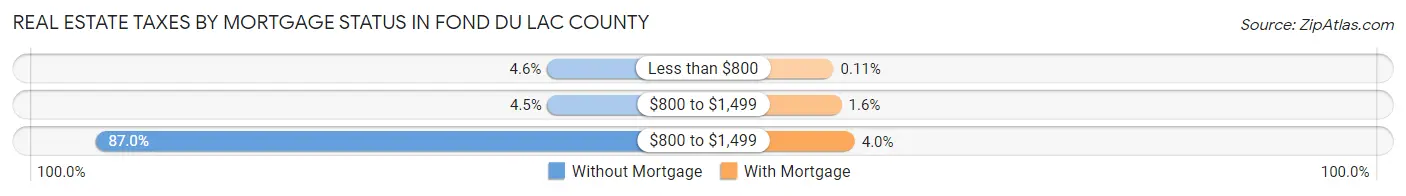
| Property Taxes | Without Mortgage | With Mortgage |
| Less than $800 | 561 (4.5%) | 20 (0.1%) |
| $800 to $1,499 | 551 (4.5%) | 274 (1.6%) |
| $800 to $1,499 | 10,735 (87.0%) | 698 (4.0%) |
| Total | 12,335 (100.0%) | 17,596 (100.0%) |
Health & Disability in Fond du Lac County
Health Insurance Coverage by Age in Fond du Lac County
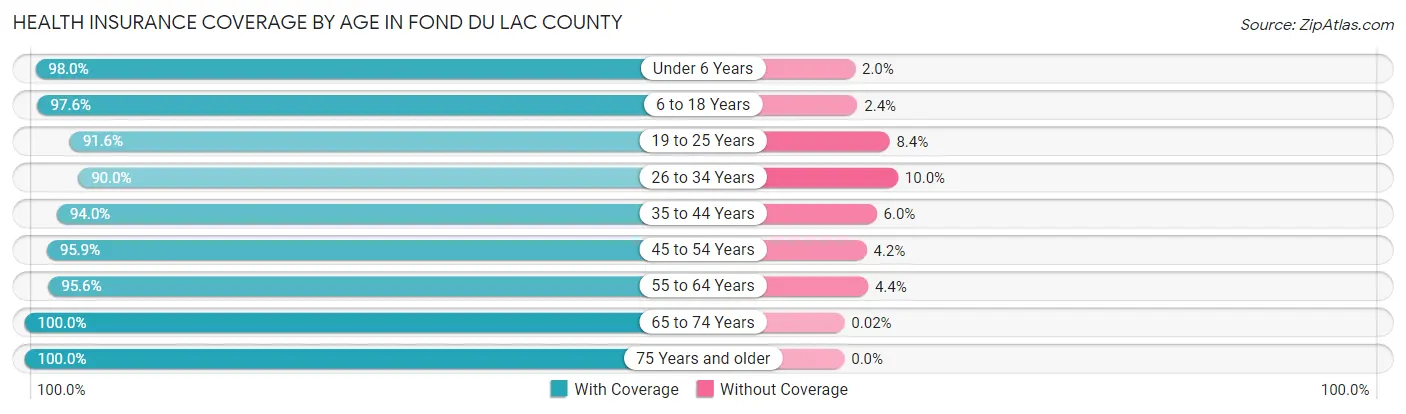
| Age Bracket | With Coverage | Without Coverage |
| Under 6 Years | 6,272 (98.0%) | 128 (2.0%) |
| 6 to 18 Years | 16,568 (97.6%) | 414 (2.4%) |
| 19 to 25 Years | 7,984 (91.6%) | 734 (8.4%) |
| 26 to 34 Years | 9,374 (90.0%) | 1,042 (10.0%) |
| 35 to 44 Years | 11,679 (94.0%) | 750 (6.0%) |
| 45 to 54 Years | 12,483 (95.9%) | 540 (4.2%) |
| 55 to 64 Years | 14,494 (95.6%) | 671 (4.4%) |
| 65 to 74 Years | 11,275 (100.0%) | 2 (0.0%) |
| 75 Years and older | 7,908 (100.0%) | 0 (0.0%) |
| Total | 98,037 (95.8%) | 4,281 (4.2%) |
Health Insurance Coverage by Citizenship Status in Fond du Lac County
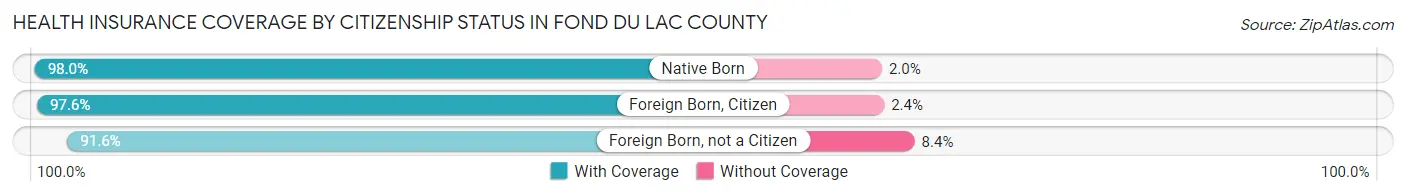
| Citizenship Status | With Coverage | Without Coverage |
| Native Born | 6,272 (98.0%) | 128 (2.0%) |
| Foreign Born, Citizen | 16,568 (97.6%) | 414 (2.4%) |
| Foreign Born, not a Citizen | 7,984 (91.6%) | 734 (8.4%) |
Health Insurance Coverage by Household Income in Fond du Lac County
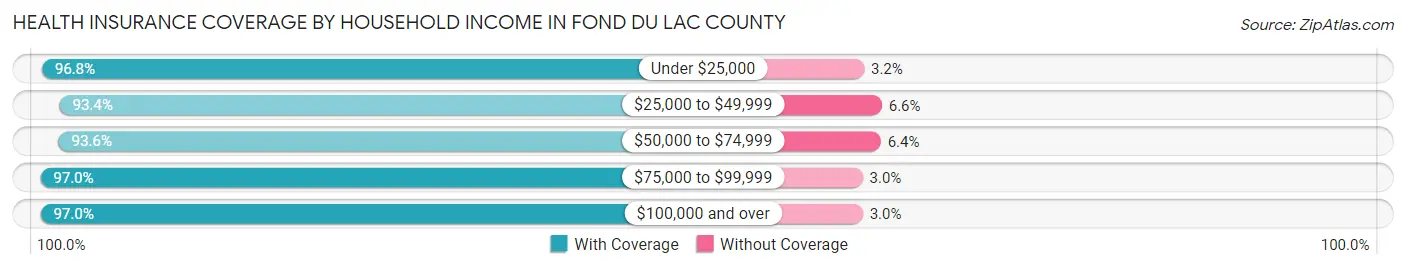
| Household Income | With Coverage | Without Coverage |
| Under $25,000 | 7,423 (96.8%) | 248 (3.2%) |
| $25,000 to $49,999 | 13,855 (93.4%) | 973 (6.6%) |
| $50,000 to $74,999 | 17,620 (93.6%) | 1,197 (6.4%) |
| $75,000 to $99,999 | 14,259 (97.0%) | 435 (3.0%) |
| $100,000 and over | 43,106 (97.0%) | 1,322 (3.0%) |
Public vs Private Health Insurance Coverage by Age in Fond du Lac County
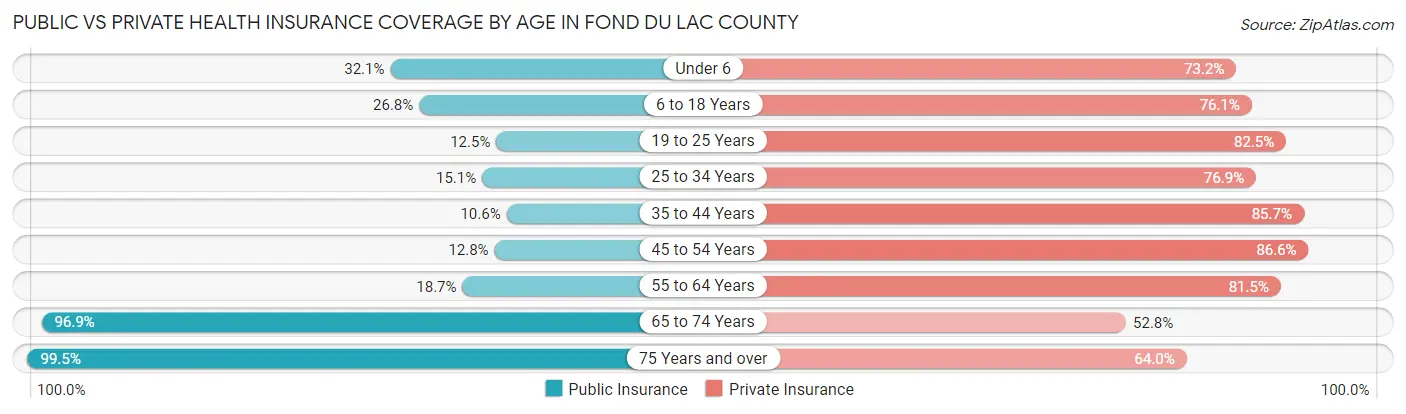
| Age Bracket | Public Insurance | Private Insurance |
| Under 6 | 2,056 (32.1%) | 4,685 (73.2%) |
| 6 to 18 Years | 4,546 (26.8%) | 12,920 (76.1%) |
| 19 to 25 Years | 1,086 (12.5%) | 7,188 (82.5%) |
| 25 to 34 Years | 1,572 (15.1%) | 8,009 (76.9%) |
| 35 to 44 Years | 1,312 (10.6%) | 10,657 (85.7%) |
| 45 to 54 Years | 1,665 (12.8%) | 11,279 (86.6%) |
| 55 to 64 Years | 2,842 (18.7%) | 12,355 (81.5%) |
| 65 to 74 Years | 10,924 (96.9%) | 5,951 (52.8%) |
| 75 Years and over | 7,865 (99.5%) | 5,061 (64.0%) |
| Total | 33,868 (33.1%) | 78,105 (76.3%) |
Disability Status by Sex by Age in Fond du Lac County
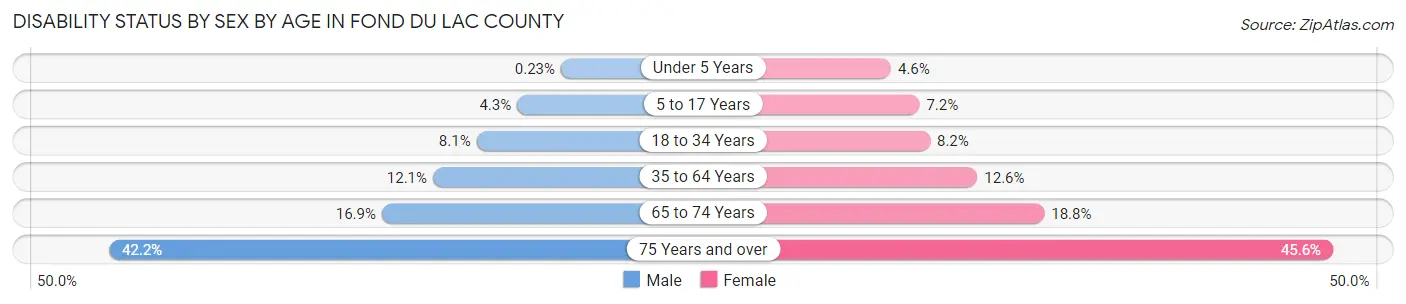
| Age Bracket | Male | Female |
| Under 5 Years | 6 (0.2%) | 120 (4.6%) |
| 5 to 17 Years | 360 (4.3%) | 601 (7.2%) |
| 18 to 34 Years | 843 (8.1%) | 826 (8.2%) |
| 35 to 64 Years | 2,552 (12.1%) | 2,459 (12.6%) |
| 65 to 74 Years | 930 (16.9%) | 1,082 (18.8%) |
| 75 Years and over | 1,328 (42.2%) | 2,169 (45.6%) |
Disability Class by Sex by Age in Fond du Lac County
Disability Class: Hearing Difficulty
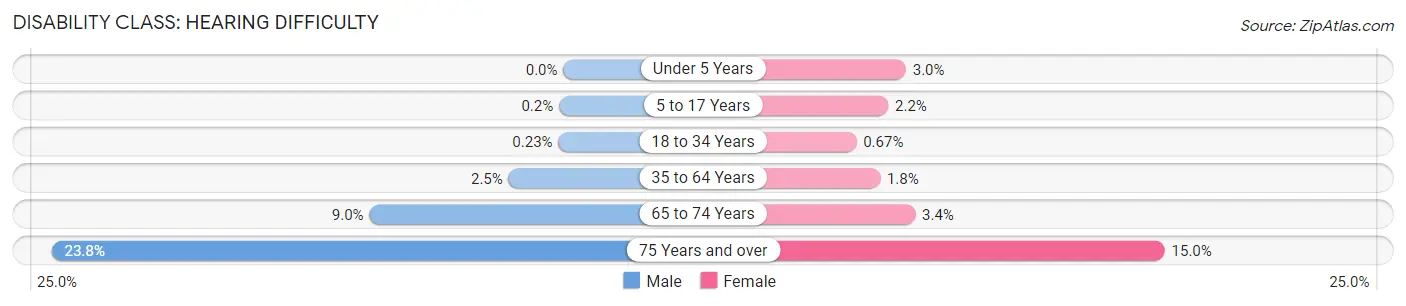
| Age Bracket | Male | Female |
| Under 5 Years | 0 (0.0%) | 78 (3.0%) |
| 5 to 17 Years | 17 (0.2%) | 179 (2.1%) |
| 18 to 34 Years | 24 (0.2%) | 68 (0.7%) |
| 35 to 64 Years | 534 (2.5%) | 347 (1.8%) |
| 65 to 74 Years | 497 (9.0%) | 196 (3.4%) |
| 75 Years and over | 748 (23.7%) | 713 (15.0%) |
Disability Class: Vision Difficulty
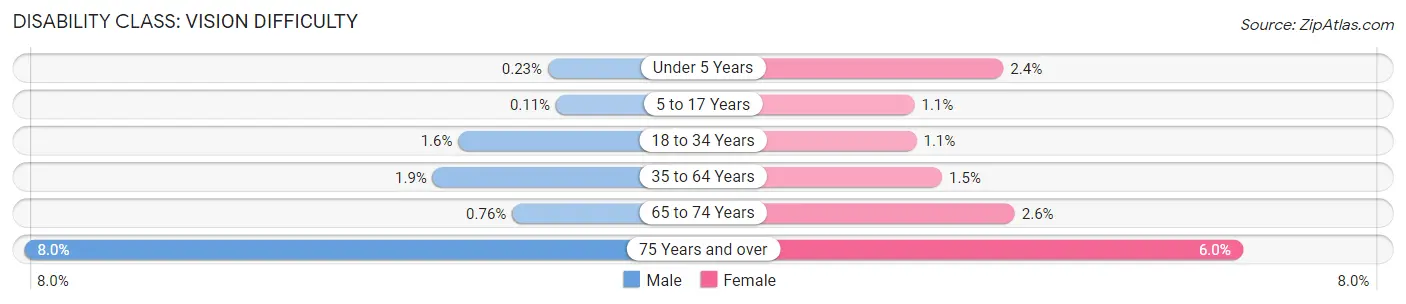
| Age Bracket | Male | Female |
| Under 5 Years | 6 (0.2%) | 63 (2.4%) |
| 5 to 17 Years | 9 (0.1%) | 90 (1.1%) |
| 18 to 34 Years | 163 (1.6%) | 112 (1.1%) |
| 35 to 64 Years | 408 (1.9%) | 291 (1.5%) |
| 65 to 74 Years | 42 (0.8%) | 148 (2.6%) |
| 75 Years and over | 252 (8.0%) | 283 (5.9%) |
Disability Class: Cognitive Difficulty
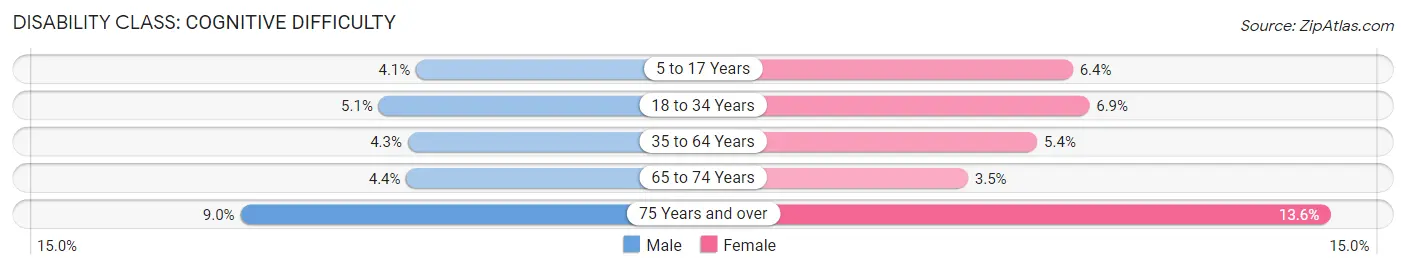
| Age Bracket | Male | Female |
| 5 to 17 Years | 343 (4.1%) | 536 (6.4%) |
| 18 to 34 Years | 538 (5.1%) | 695 (6.9%) |
| 35 to 64 Years | 912 (4.3%) | 1,064 (5.4%) |
| 65 to 74 Years | 241 (4.4%) | 202 (3.5%) |
| 75 Years and over | 283 (9.0%) | 648 (13.6%) |
Disability Class: Ambulatory Difficulty
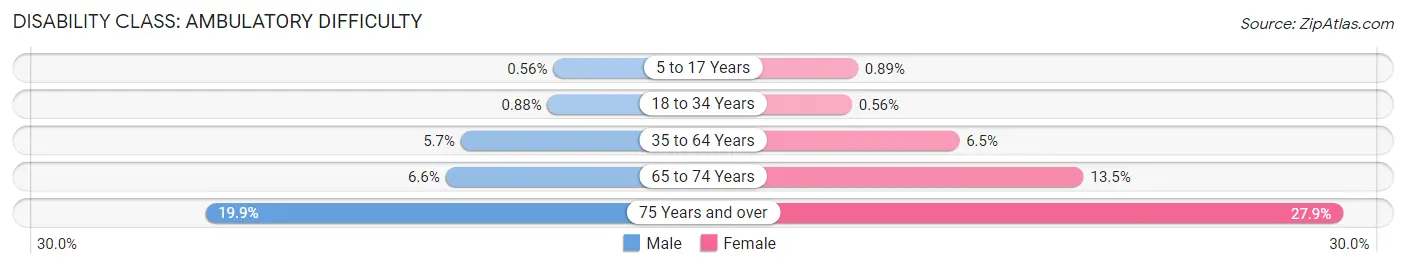
| Age Bracket | Male | Female |
| 5 to 17 Years | 47 (0.6%) | 74 (0.9%) |
| 18 to 34 Years | 92 (0.9%) | 56 (0.6%) |
| 35 to 64 Years | 1,202 (5.7%) | 1,279 (6.5%) |
| 65 to 74 Years | 362 (6.6%) | 775 (13.5%) |
| 75 Years and over | 628 (19.9%) | 1,328 (27.9%) |
Disability Class: Self-Care Difficulty
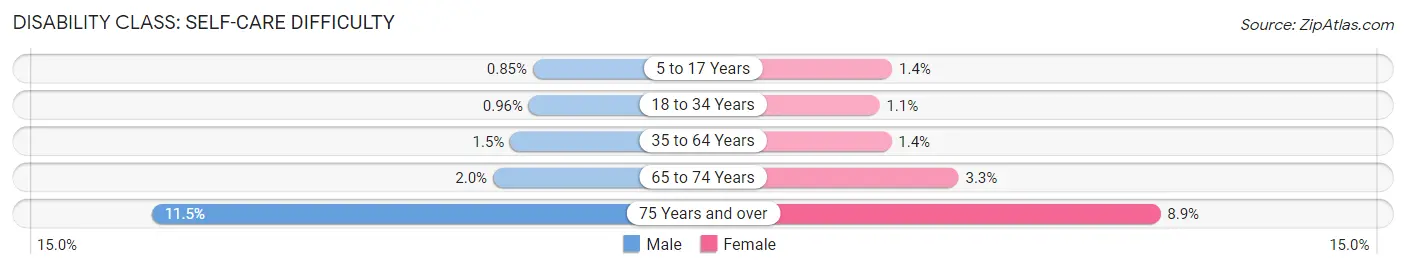
| Age Bracket | Male | Female |
| 5 to 17 Years | 71 (0.9%) | 117 (1.4%) |
| 18 to 34 Years | 100 (1.0%) | 106 (1.1%) |
| 35 to 64 Years | 312 (1.5%) | 269 (1.4%) |
| 65 to 74 Years | 108 (2.0%) | 187 (3.3%) |
| 75 Years and over | 361 (11.5%) | 422 (8.9%) |
Technology Access in Fond du Lac County
Computing Device Access in Fond du Lac County
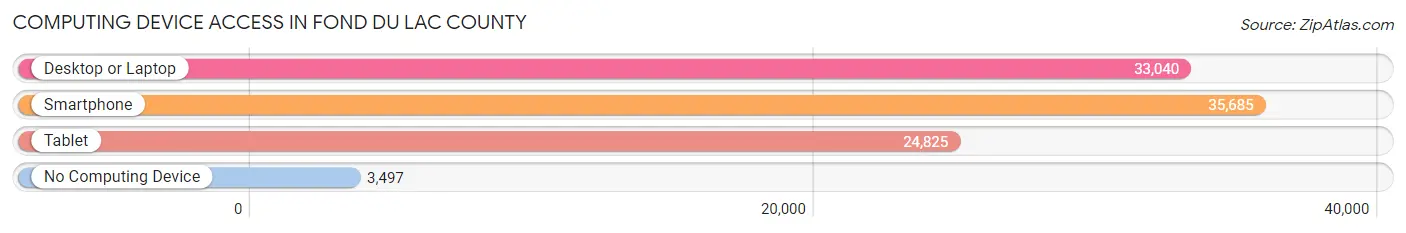
| Device Type | # Households | % Households |
| Desktop or Laptop | 33,040 | 78.0% |
| Smartphone | 35,685 | 84.2% |
| Tablet | 24,825 | 58.6% |
| No Computing Device | 3,497 | 8.3% |
| Total | 42,368 | 100.0% |
Internet Access in Fond du Lac County
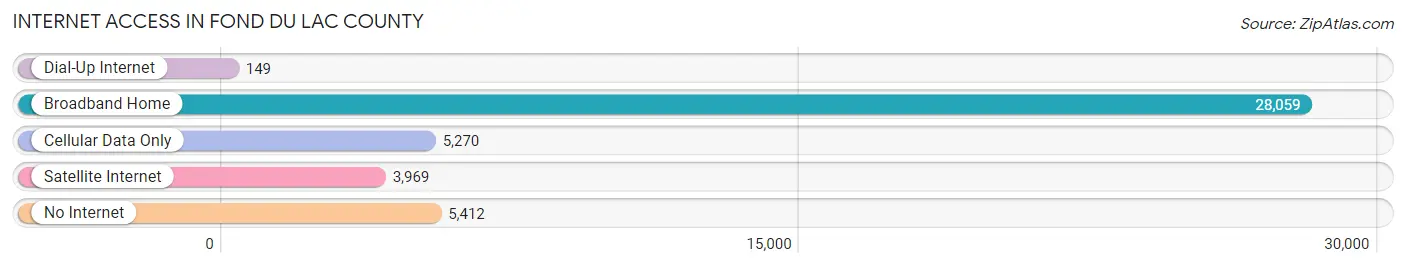
| Internet Type | # Households | % Households |
| Dial-Up Internet | 149 | 0.4% |
| Broadband Home | 28,059 | 66.2% |
| Cellular Data Only | 5,270 | 12.4% |
| Satellite Internet | 3,969 | 9.4% |
| No Internet | 5,412 | 12.8% |
| Total | 42,368 | 100.0% |
Fond du Lac County Summary
Fond du Lac County is located in the east-central part of Wisconsin, and is part of the Fox Valley region. It is bordered by Winnebago County to the north, Calumet County to the east, Sheboygan County to the south, and Washington and Dodge Counties to the west. The county seat is Fond du Lac, and the largest city is Oshkosh. The county has a total area of 576 square miles, and a population of 102,633 as of the 2010 census.
Geography
Fond du Lac County is located in the east-central part of Wisconsin, and is part of the Fox Valley region. It is bordered by Winnebago County to the north, Calumet County to the east, Sheboygan County to the south, and Washington and Dodge Counties to the west. The county has a total area of 576 square miles, and is mostly flat with some rolling hills. The highest point in the county is located in the town of Taycheedah, at an elevation of 1,039 feet. The county is drained by the Fond du Lac River, which flows through the county from north to south.
The county is home to several lakes, including Lake Winnebago, which is the largest lake in Wisconsin. Other lakes in the county include Lake Butte des Morts, Lake Poygan, and Lake Winneconne. The county also contains several parks, including Lakeside Park, Lakeside Park Beach, and Lakeside Park Zoo.
Economy
Fond du Lac County has a diverse economy, with a mix of manufacturing, agriculture, and service industries. The county is home to several large employers, including Mercury Marine, J.J. Keller & Associates, and Alliance Laundry Systems. The county is also home to several smaller businesses, including several wineries, breweries, and distilleries.
Agriculture is an important part of the county’s economy, with dairy farming being the primary agricultural activity. Other agricultural activities include beef and poultry production, as well as fruit and vegetable production.
The county is also home to several tourist attractions, including the EAA AirVenture Museum, the Oshkosh Public Museum, and the Fond du Lac County Historical Society.
Demographics
As of the 2010 census, Fond du Lac County had a population of 102,633. The racial makeup of the county was 94.2% White, 1.3% African American, 0.7% Native American, 1.3% Asian, 0.1% Pacific Islander, 1.2% from other races, and 1.2% from two or more races. Hispanic or Latino of any race were 3.3% of the population.
The median income for a household in the county was $50,945, and the median income for a family was $62,917. The per capita income for the county was $25,845. About 6.2% of families and 8.7% of the population were below the poverty line, including 11.2% of those under age 18 and 6.2% of those age 65 or over.
Fond du Lac County is home to several higher education institutions, including the University of Wisconsin-Fond du Lac, Marian University, and Moraine Park Technical College. The county is also home to several private schools, including St. Mary’s Springs Academy and Winnebago Lutheran Academy.
Common Questions
What is the Total Population of Fond du Lac County?
Total Population of Fond du Lac County is 104,027.
What is the Total Male Population of Fond du Lac County?
Total Male Population of Fond du Lac County is 51,551.
What is the Total Female Population of Fond du Lac County?
Total Female Population of Fond du Lac County is 52,476.
What is the Ratio of Males per 100 Females in Fond du Lac County?
There are 98.24 Males per 100 Females in Fond du Lac County.
What is the Ratio of Females per 100 Males in Fond du Lac County?
There are 101.79 Females per 100 Males in Fond du Lac County.
What is the Median Population Age in Fond du Lac County?
Median Population Age in Fond du Lac County is 41.9 Years.
What is the Average Family Size in Fond du Lac County
Average Family Size in Fond du Lac County is 3.0 People.
What is the Average Household Size in Fond du Lac County
Average Household Size in Fond du Lac County is 2.4 People.
What is Per Capita Income in Fond du Lac County?
Per Capita income in Fond du Lac County is $36,824.
What is the Median Family Income in Fond du Lac County?
Median Family Income in Fond du Lac County is $93,158.
What is the Median Household income in Fond du Lac County?
Median Household Income in Fond du Lac County is $70,368.
What is Income or Wage Gap in Fond du Lac County?
Income or Wage Gap in Fond du Lac County is 35.8%.
Women in Fond du Lac County earn 64.2 cents for every dollar earned by a man.
What is Family Income Deficit in Fond du Lac County?
Family Income Deficit in Fond du Lac County is $10,438.
Families that are below poverty line in Fond du Lac County earn $10,438 less on average than the poverty threshold level.
What is Inequality or Gini Index in Fond du Lac County?
Inequality or Gini Index in Fond du Lac County is 0.41.
How Large is the Labor Force in Fond du Lac County?
There are 55,223 People in the Labor Forcein in Fond du Lac County.
What is the Percentage of People in the Labor Force in Fond du Lac County?
65.1% of People are in the Labor Force in Fond du Lac County.
What is the Unemployment Rate in Fond du Lac County?
Unemployment Rate in Fond du Lac County is 3.3%.