Florence County, WI
Florence County Map
Florence County Overview
4,574
TOTAL POPULATION
2,337
MALE POPULATION
2,237
FEMALE POPULATION
104.47
MALES / 100 FEMALES
95.72
FEMALES / 100 MALES
54.1
MEDIAN AGE
2.7
AVG FAMILY SIZE
2.2
AVG HOUSEHOLD SIZE
$36,746
PER CAPITA INCOME
$71,444
AVG FAMILY INCOME
$58,049
AVG HOUSEHOLD INCOME
39.8%
WAGE / INCOME GAP [ % ]
60.2¢/ $1
WAGE / INCOME GAP [ $ ]
$10,422
FAMILY INCOME DEFICIT
0.44
INEQUALITY / GINI INDEX
2,088
LABOR FORCE [ PEOPLE ]
53.1%
PERCENT IN LABOR FORCE
6.0%
UNEMPLOYMENT RATE
Florence County Area Codes
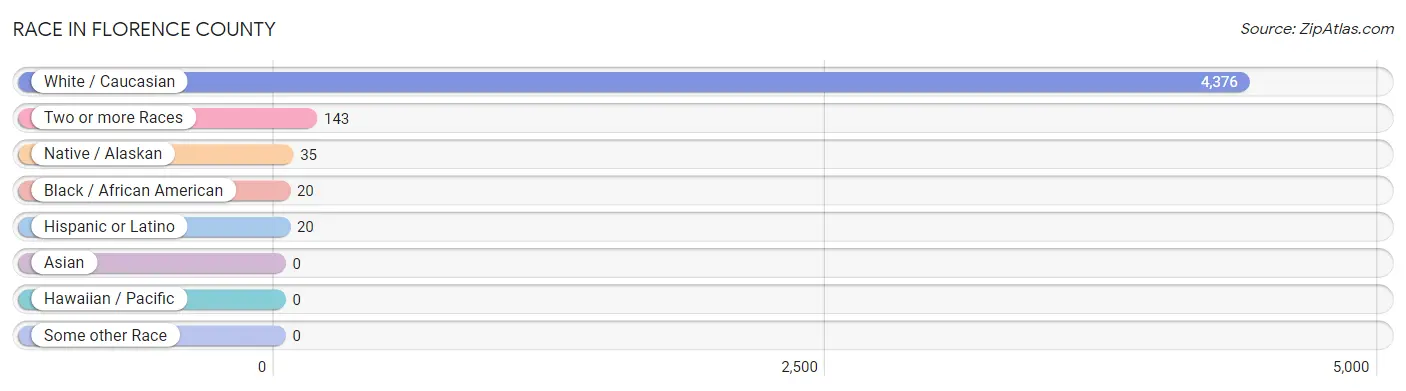
Race in Florence County
The most populous races in Florence County are White / Caucasian (4,376 | 95.7%), Two or more Races (143 | 3.1%), and Native / Alaskan (35 | 0.8%).
| Race | # Population | % Population |
| Asian | 0 | 0.0% |
| Black / African American | 20 | 0.4% |
| Hawaiian / Pacific | 0 | 0.0% |
| Hispanic or Latino | 20 | 0.4% |
| Native / Alaskan | 35 | 0.8% |
| White / Caucasian | 4,376 | 95.7% |
| Two or more Races | 143 | 3.1% |
| Some other Race | 0 | 0.0% |
| Total | 4,574 | 100.0% |
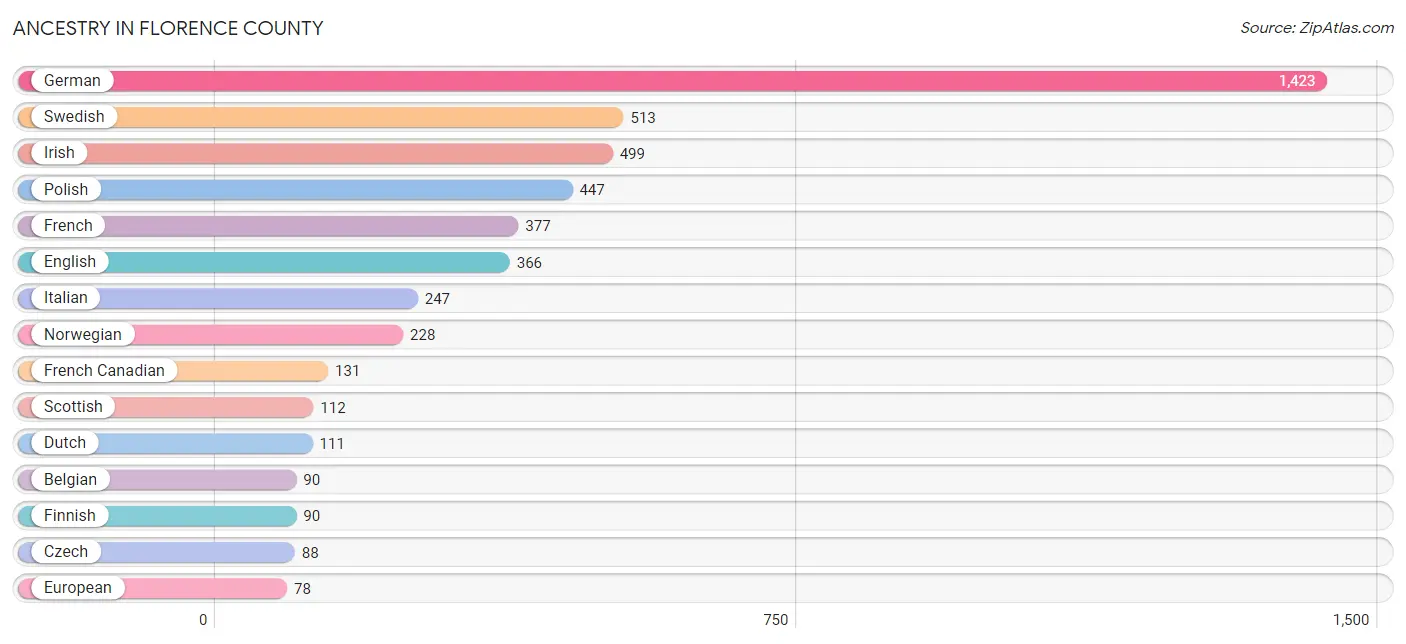
Ancestry in Florence County
The most populous ancestries reported in Florence County are German (1,423 | 31.1%), Swedish (513 | 11.2%), Irish (499 | 10.9%), Polish (447 | 9.8%), and French (377 | 8.2%), together accounting for 71.3% of all Florence County residents.
| Ancestry | # Population | % Population |
| American | 75 | 1.6% |
| Arab | 3 | 0.1% |
| Arapaho | 3 | 0.1% |
| Argentinean | 1 | 0.0% |
| Austrian | 65 | 1.4% |
| Belgian | 90 | 2.0% |
| Bhutanese | 7 | 0.2% |
| British | 16 | 0.4% |
| Bulgarian | 3 | 0.1% |
| Burmese | 3 | 0.1% |
| Croatian | 8 | 0.2% |
| Czech | 88 | 1.9% |
| Danish | 44 | 1.0% |
| Dominican | 3 | 0.1% |
| Dutch | 111 | 2.4% |
| Eastern European | 7 | 0.2% |
| English | 366 | 8.0% |
| European | 78 | 1.7% |
| Finnish | 90 | 2.0% |
| French | 377 | 8.2% |
| French Canadian | 131 | 2.9% |
| German | 1,423 | 31.1% |
| Greek | 2 | 0.0% |
| Haitian | 6 | 0.1% |
| Hungarian | 2 | 0.0% |
| Irish | 499 | 10.9% |
| Iroquois | 14 | 0.3% |
| Italian | 247 | 5.4% |
| Korean | 7 | 0.2% |
| Lithuanian | 61 | 1.3% |
| Luxembourger | 1 | 0.0% |
| Mexican | 16 | 0.4% |
| Mexican American Indian | 2 | 0.0% |
| Nigerian | 8 | 0.2% |
| Northern European | 5 | 0.1% |
| Norwegian | 228 | 5.0% |
| Ottawa | 13 | 0.3% |
| Polish | 447 | 9.8% |
| Russian | 5 | 0.1% |
| Scandinavian | 32 | 0.7% |
| Scotch-Irish | 11 | 0.2% |
| Scottish | 112 | 2.5% |
| Slavic | 2 | 0.0% |
| Slovak | 22 | 0.5% |
| Slovene | 9 | 0.2% |
| South American | 1 | 0.0% |
| Subsaharan African | 8 | 0.2% |
| Swedish | 513 | 11.2% |
| Swiss | 6 | 0.1% |
| Syrian | 3 | 0.1% |
| Ukrainian | 2 | 0.0% |
| Welsh | 41 | 0.9% | View All 52 Rows |
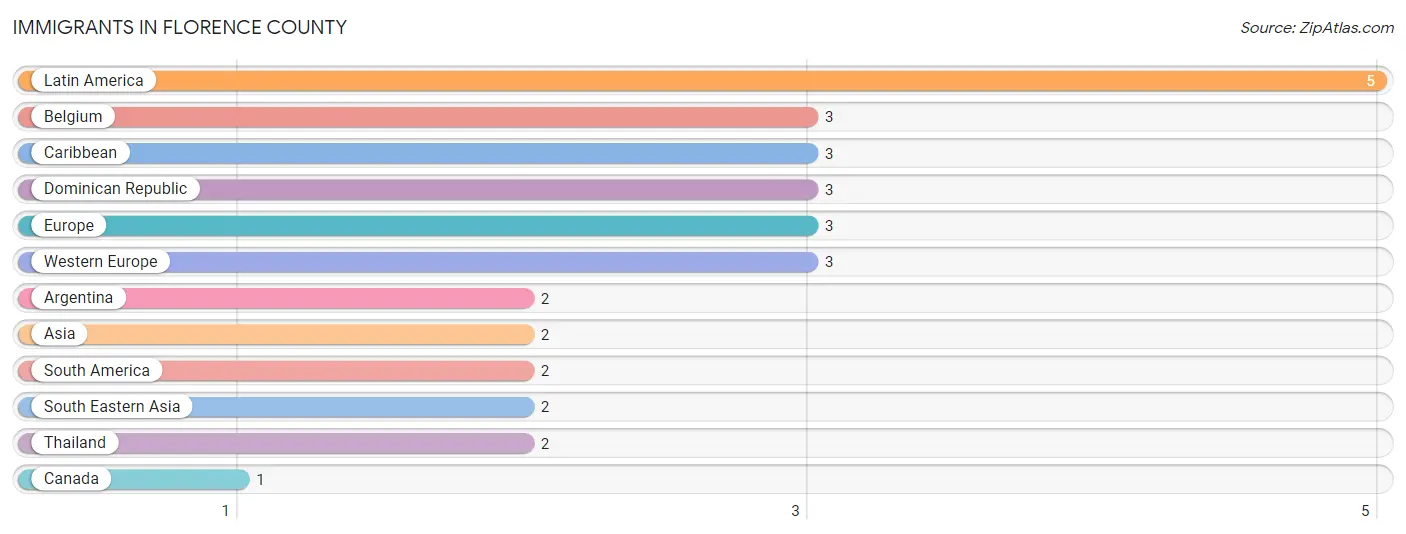
Immigrants in Florence County
The most numerous immigrant groups reported in Florence County came from Latin America (5 | 0.1%), Belgium (3 | 0.1%), Caribbean (3 | 0.1%), Dominican Republic (3 | 0.1%), and Europe (3 | 0.1%), together accounting for 0.4% of all Florence County residents.
| Immigration Origin | # Population | % Population |
| Argentina | 2 | 0.0% |
| Asia | 2 | 0.0% |
| Belgium | 3 | 0.1% |
| Canada | 1 | 0.0% |
| Caribbean | 3 | 0.1% |
| Dominican Republic | 3 | 0.1% |
| Europe | 3 | 0.1% |
| Latin America | 5 | 0.1% |
| South America | 2 | 0.0% |
| South Eastern Asia | 2 | 0.0% |
| Thailand | 2 | 0.0% |
| Western Europe | 3 | 0.1% | View All 12 Rows |
Sex and Age in Florence County
Sex and Age in Florence County
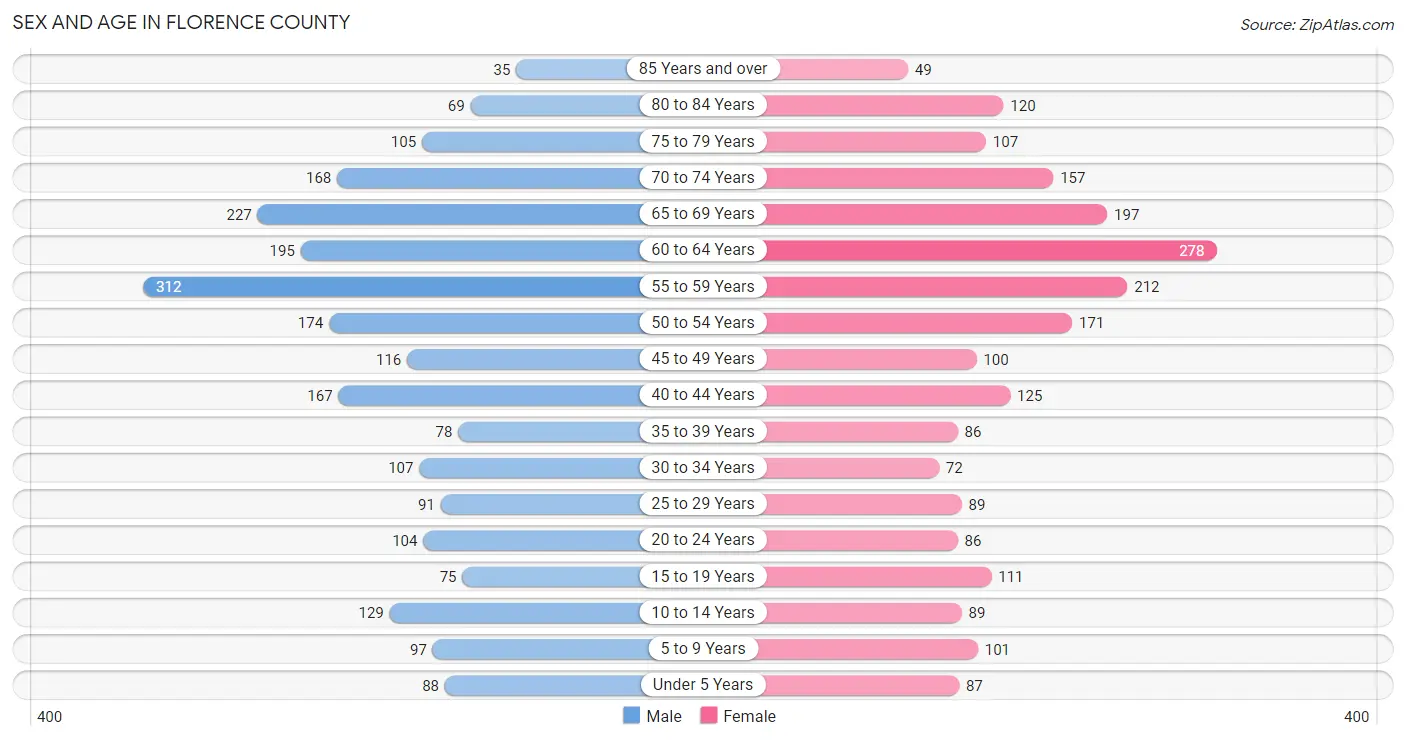
The most populous age groups in Florence County are 55 to 59 Years (312 | 13.4%) for men and 60 to 64 Years (278 | 12.4%) for women.
| Age Bracket | Male | Female |
| Under 5 Years | 88 (3.8%) | 87 (3.9%) |
| 5 to 9 Years | 97 (4.2%) | 101 (4.5%) |
| 10 to 14 Years | 129 (5.5%) | 89 (4.0%) |
| 15 to 19 Years | 75 (3.2%) | 111 (5.0%) |
| 20 to 24 Years | 104 (4.4%) | 86 (3.8%) |
| 25 to 29 Years | 91 (3.9%) | 89 (4.0%) |
| 30 to 34 Years | 107 (4.6%) | 72 (3.2%) |
| 35 to 39 Years | 78 (3.3%) | 86 (3.8%) |
| 40 to 44 Years | 167 (7.1%) | 125 (5.6%) |
| 45 to 49 Years | 116 (5.0%) | 100 (4.5%) |
| 50 to 54 Years | 174 (7.4%) | 171 (7.6%) |
| 55 to 59 Years | 312 (13.4%) | 212 (9.5%) |
| 60 to 64 Years | 195 (8.3%) | 278 (12.4%) |
| 65 to 69 Years | 227 (9.7%) | 197 (8.8%) |
| 70 to 74 Years | 168 (7.2%) | 157 (7.0%) |
| 75 to 79 Years | 105 (4.5%) | 107 (4.8%) |
| 80 to 84 Years | 69 (2.9%) | 120 (5.4%) |
| 85 Years and over | 35 (1.5%) | 49 (2.2%) |
| Total | 2,337 (100.0%) | 2,237 (100.0%) |
Families and Households in Florence County
Median Family Size in Florence County
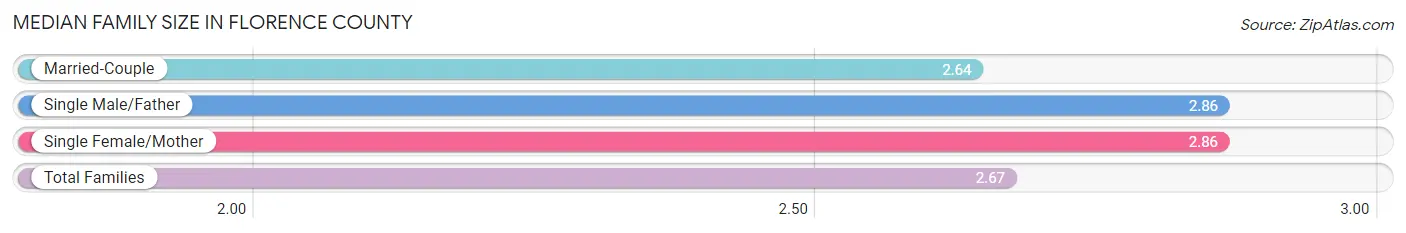
The median family size in Florence County is 2.67 persons per family, with single male/father families (111 | 8.2%) accounting for the largest median family size of 2.86 persons per family. On the other hand, married-couple families (1,142 | 84.5%) represent the smallest median family size with 2.64 persons per family.
| Family Type | # Families | Family Size |
| Married-Couple | 1,142 (84.5%) | 2.64 |
| Single Male/Father | 111 (8.2%) | 2.86 |
| Single Female/Mother | 99 (7.3%) | 2.86 |
| Total Families | 1,352 (100.0%) | 2.67 |
Median Household Size in Florence County
The median household size in Florence County is 2.17 persons per household, with single male/father households (111 | 5.3%) accounting for the largest median household size of 3.23 persons per household. non-family households (730 | 35.1%) represent the smallest median household size with 1.12 persons per household.

| Household Type | # Households | Household Size |
| Married-Couple | 1,142 (54.8%) | 2.64 |
| Single Male/Father | 111 (5.3%) | 3.23 |
| Single Female/Mother | 99 (4.8%) | 3.22 |
| Non-family | 730 (35.1%) | 1.12 |
| Total Households | 2,082 (100.0%) | 2.17 |
Household Size by Marriage Status in Florence County
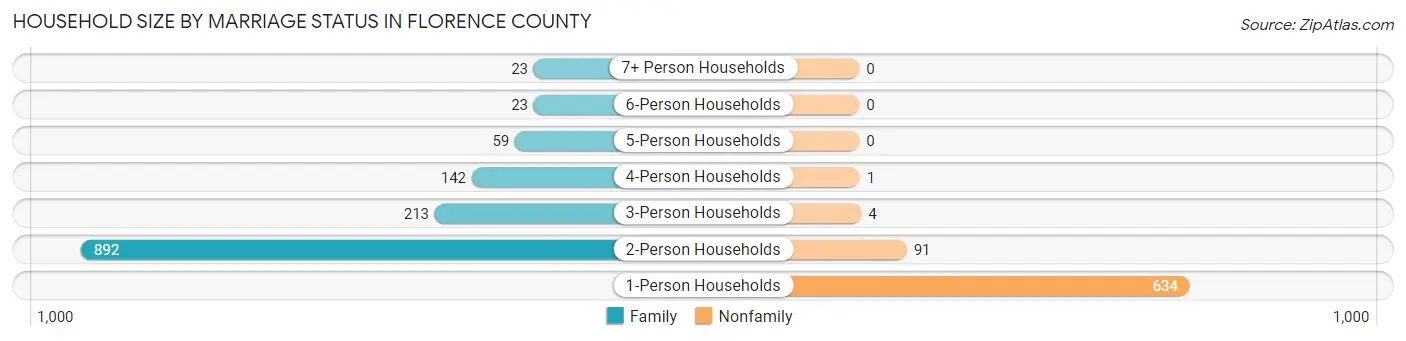
Out of a total of 2,082 households in Florence County, 1,352 (64.9%) are family households, while 730 (35.1%) are nonfamily households. The most numerous type of family households are 2-person households, comprising 892, and the most common type of nonfamily households are 1-person households, comprising 634.
| Household Size | Family Households | Nonfamily Households |
| 1-Person Households | - | 634 (30.4%) |
| 2-Person Households | 892 (42.8%) | 91 (4.4%) |
| 3-Person Households | 213 (10.2%) | 4 (0.2%) |
| 4-Person Households | 142 (6.8%) | 1 (0.1%) |
| 5-Person Households | 59 (2.8%) | 0 (0.0%) |
| 6-Person Households | 23 (1.1%) | 0 (0.0%) |
| 7+ Person Households | 23 (1.1%) | 0 (0.0%) |
| Total | 1,352 (64.9%) | 730 (35.1%) |
Female Fertility in Florence County
Fertility by Age in Florence County
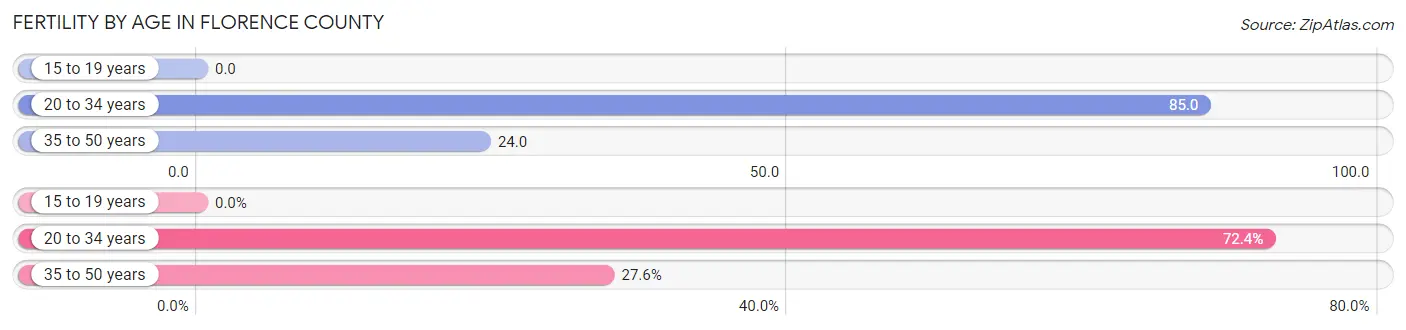
Average fertility rate in Florence County is 42.0 births per 1,000 women. Women in the age bracket of 20 to 34 years have the highest fertility rate with 85.0 births per 1,000 women. Women in the age bracket of 20 to 34 years acount for 72.4% of all women with births.
| Age Bracket | Women with Births | Births / 1,000 Women |
| 15 to 19 years | 0 (0.0%) | 0.0 |
| 20 to 34 years | 21 (72.4%) | 85.0 |
| 35 to 50 years | 8 (27.6%) | 24.0 |
| Total | 29 (100.0%) | 42.0 |
Fertility by Age by Marriage Status in Florence County
75.9% of women with births (29) in Florence County are married. The highest percentage of unmarried women with births falls into 20 to 34 years age bracket with 33.3% of them unmarried at the time of birth, while the lowest percentage of unmarried women with births belong to 35 to 50 years age bracket with 0.0% of them unmarried.
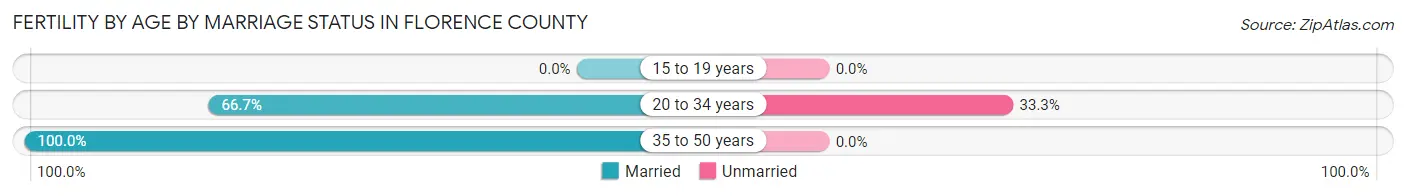
| Age Bracket | Married | Unmarried |
| 15 to 19 years | 0 (0.0%) | 0 (0.0%) |
| 20 to 34 years | 14 (66.7%) | 7 (33.3%) |
| 35 to 50 years | 8 (100.0%) | 0 (0.0%) |
| Total | 22 (75.9%) | 7 (24.1%) |
Fertility by Education in Florence County
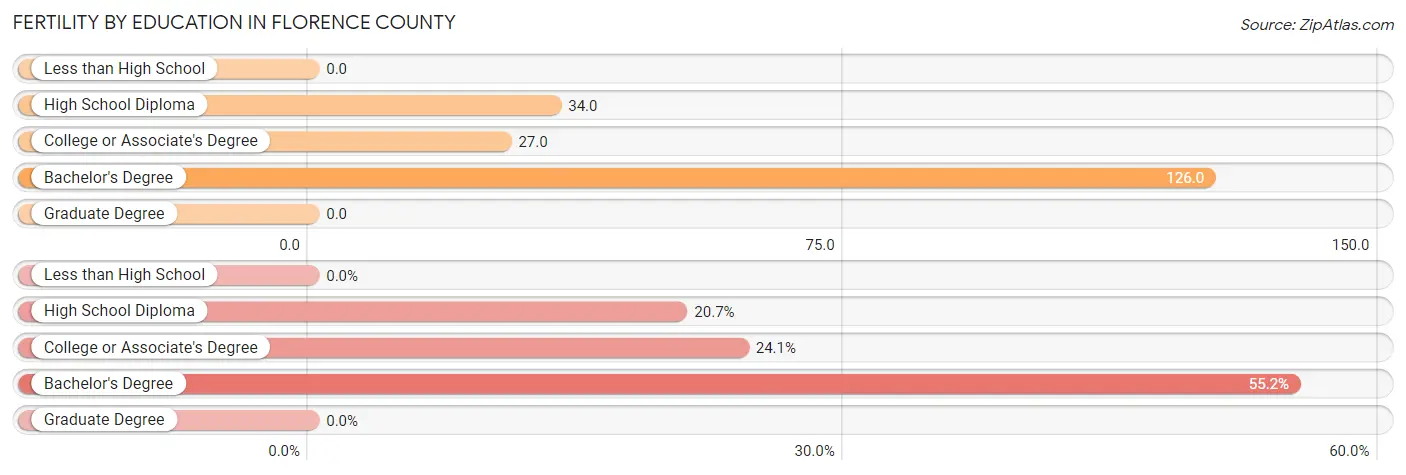
| Educational Attainment | Women with Births | Births / 1,000 Women |
| Less than High School | 0 (0.0%) | 0.0 |
| High School Diploma | 6 (20.7%) | 34.0 |
| College or Associate's Degree | 7 (24.1%) | 27.0 |
| Bachelor's Degree | 16 (55.2%) | 126.0 |
| Graduate Degree | 0 (0.0%) | 0.0 |
| Total | 29 (100.0%) | 42.0 |
Fertility by Education by Marriage Status in Florence County
24.1% of women with births in Florence County are unmarried. Women with the educational attainment of high school diploma are most likely to be married with 100.0% of them married at childbirth, while women with the educational attainment of college or associate's degree are least likely to be married with 100.0% of them unmarried at childbirth.
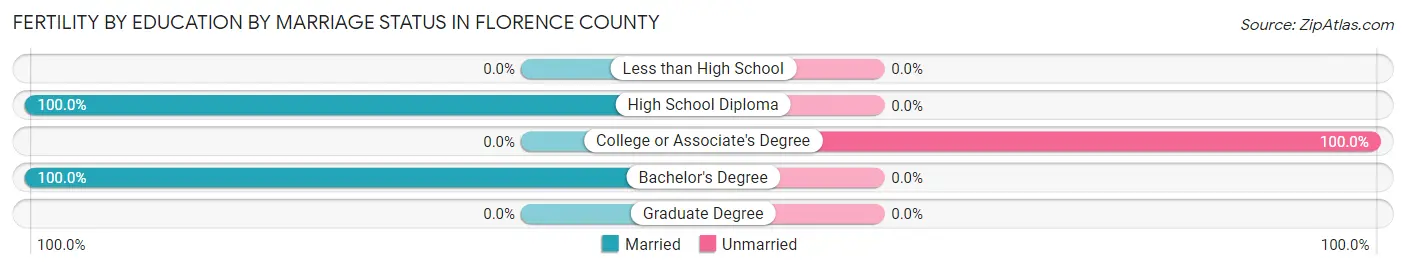
| Educational Attainment | Married | Unmarried |
| Less than High School | 0 (0.0%) | 0 (0.0%) |
| High School Diploma | 6 (100.0%) | 0 (0.0%) |
| College or Associate's Degree | 0 (0.0%) | 7 (100.0%) |
| Bachelor's Degree | 16 (100.0%) | 0 (0.0%) |
| Graduate Degree | 0 (0.0%) | 0 (0.0%) |
| Total | 22 (75.9%) | 7 (24.1%) |
Income in Florence County
Income Overview in Florence County
Per Capita Income in Florence County is $36,746, while median incomes of families and households are $71,444 and $58,049 respectively.
| Characteristic | Number | Measure |
| Per Capita Income | 4,574 | $36,746 |
| Median Family Income | 1,352 | $71,444 |
| Mean Family Income | 1,352 | $93,238 |
| Median Household Income | 2,082 | $58,049 |
| Mean Household Income | 2,082 | $75,950 |
| Income Deficit | 1,352 | $10,422 |
| Wage / Income Gap (%) | 4,574 | 39.81% |
| Wage / Income Gap ($) | 4,574 | 60.19¢ per $1 |
| Gini / Inequality Index | 4,574 | 0.44 |
Earnings by Sex in Florence County
Average Earnings in Florence County are $38,524, $48,010 for men and $28,895 for women, a difference of 39.8%.
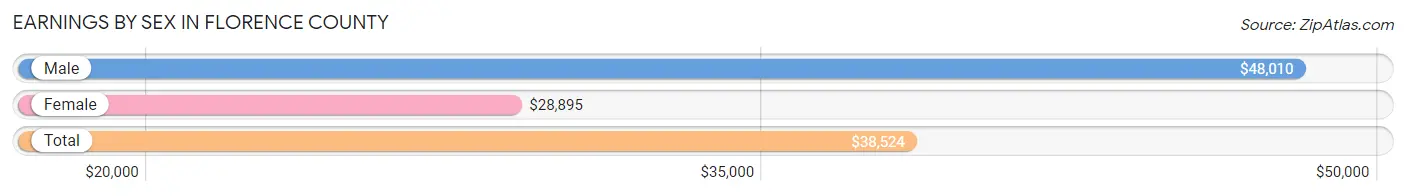
| Sex | Number | Average Earnings |
| Male | 1,255 (54.8%) | $48,010 |
| Female | 1,034 (45.2%) | $28,895 |
| Total | 2,289 (100.0%) | $38,524 |
Earnings by Sex by Income Bracket in Florence County
The most common earnings brackets in Florence County are $75,000 to $99,999 for men (163 | 13.0%) and $25,000 to $29,999 for women (112 | 10.8%).
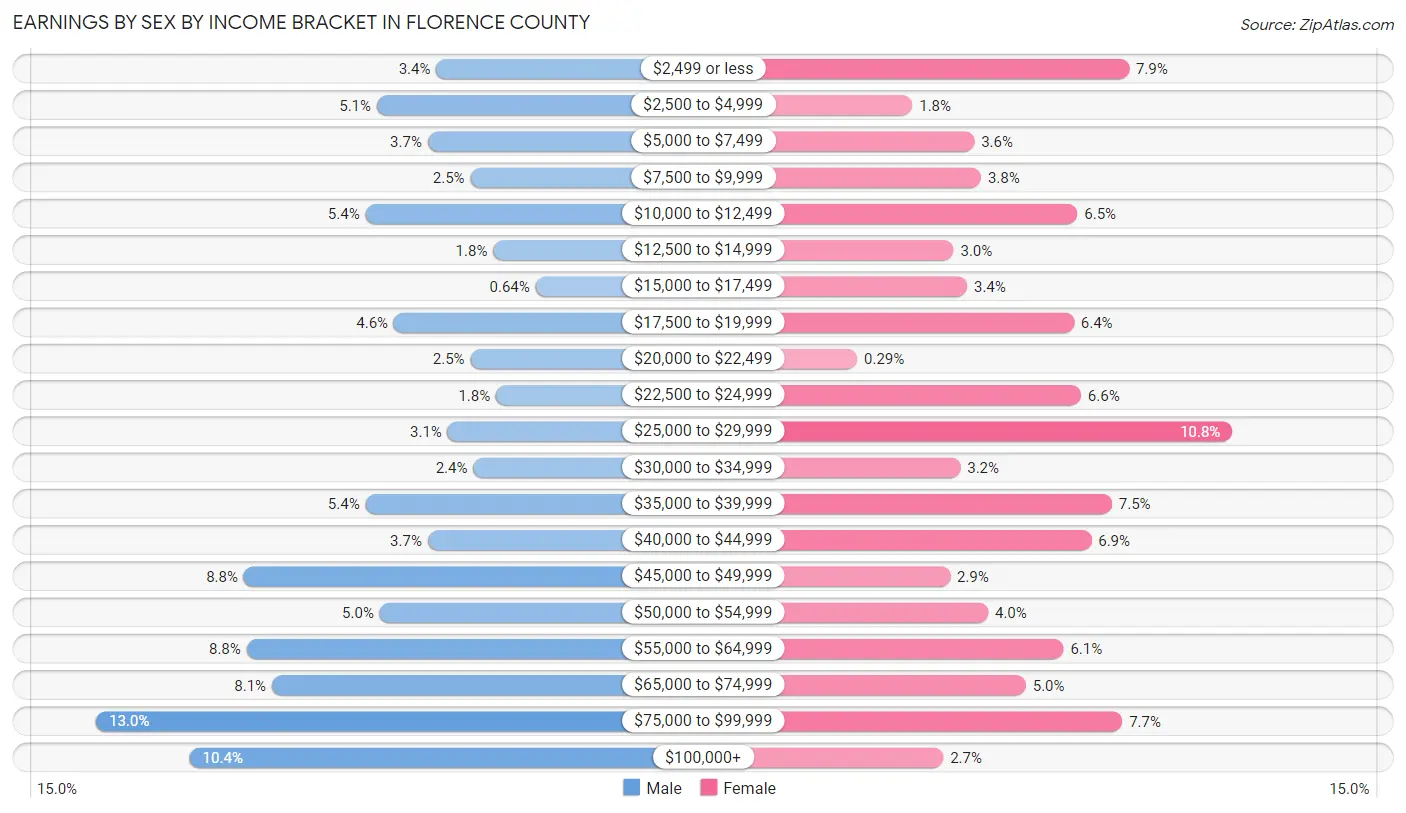
| Income | Male | Female |
| $2,499 or less | 43 (3.4%) | 82 (7.9%) |
| $2,500 to $4,999 | 64 (5.1%) | 19 (1.8%) |
| $5,000 to $7,499 | 46 (3.7%) | 37 (3.6%) |
| $7,500 to $9,999 | 31 (2.5%) | 39 (3.8%) |
| $10,000 to $12,499 | 68 (5.4%) | 67 (6.5%) |
| $12,500 to $14,999 | 23 (1.8%) | 31 (3.0%) |
| $15,000 to $17,499 | 8 (0.6%) | 35 (3.4%) |
| $17,500 to $19,999 | 58 (4.6%) | 66 (6.4%) |
| $20,000 to $22,499 | 31 (2.5%) | 3 (0.3%) |
| $22,500 to $24,999 | 22 (1.8%) | 68 (6.6%) |
| $25,000 to $29,999 | 39 (3.1%) | 112 (10.8%) |
| $30,000 to $34,999 | 30 (2.4%) | 33 (3.2%) |
| $35,000 to $39,999 | 68 (5.4%) | 77 (7.4%) |
| $40,000 to $44,999 | 46 (3.7%) | 71 (6.9%) |
| $45,000 to $49,999 | 111 (8.8%) | 30 (2.9%) |
| $50,000 to $54,999 | 63 (5.0%) | 41 (4.0%) |
| $55,000 to $64,999 | 110 (8.8%) | 63 (6.1%) |
| $65,000 to $74,999 | 101 (8.1%) | 52 (5.0%) |
| $75,000 to $99,999 | 163 (13.0%) | 80 (7.7%) |
| $100,000+ | 130 (10.4%) | 28 (2.7%) |
| Total | 1,255 (100.0%) | 1,034 (100.0%) |
Earnings by Sex by Educational Attainment in Florence County
Average earnings in Florence County are $49,484 for men and $29,474 for women, a difference of 40.4%. Men with an educational attainment of graduate degree enjoy the highest average annual earnings of $82,813, while those with high school diploma education earn the least with $39,728. Women with an educational attainment of bachelor's degree earn the most with the average annual earnings of $48,125, while those with high school diploma education have the smallest earnings of $24,476.
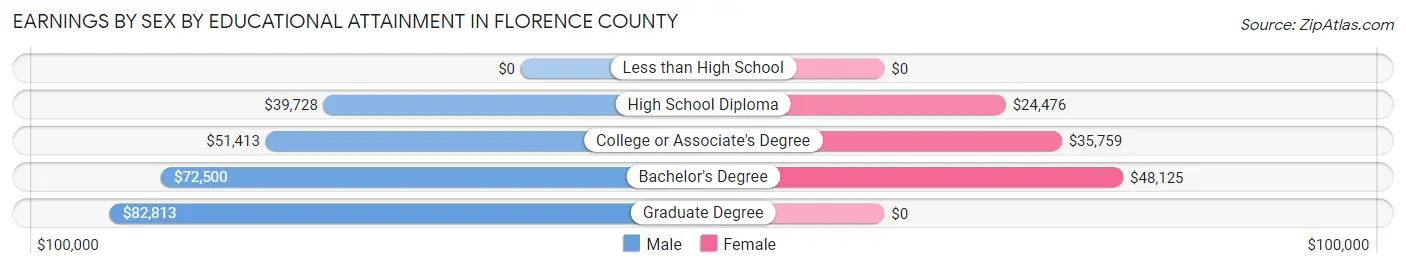
| Educational Attainment | Male Income | Female Income |
| Less than High School | - | - |
| High School Diploma | $39,728 | $24,476 |
| College or Associate's Degree | $51,413 | $35,759 |
| Bachelor's Degree | $72,500 | $48,125 |
| Graduate Degree | $82,813 | $0 |
| Total | $49,484 | $29,474 |
Family Income in Florence County
Family Income Brackets in Florence County
According to the Florence County family income data, there are 319 families falling into the $50,000 to $74,999 income range, which is the most common income bracket and makes up 23.6% of all families. Conversely, the less than $10,000 income bracket is the least frequent group with only 24 families (1.8%) belonging to this category.
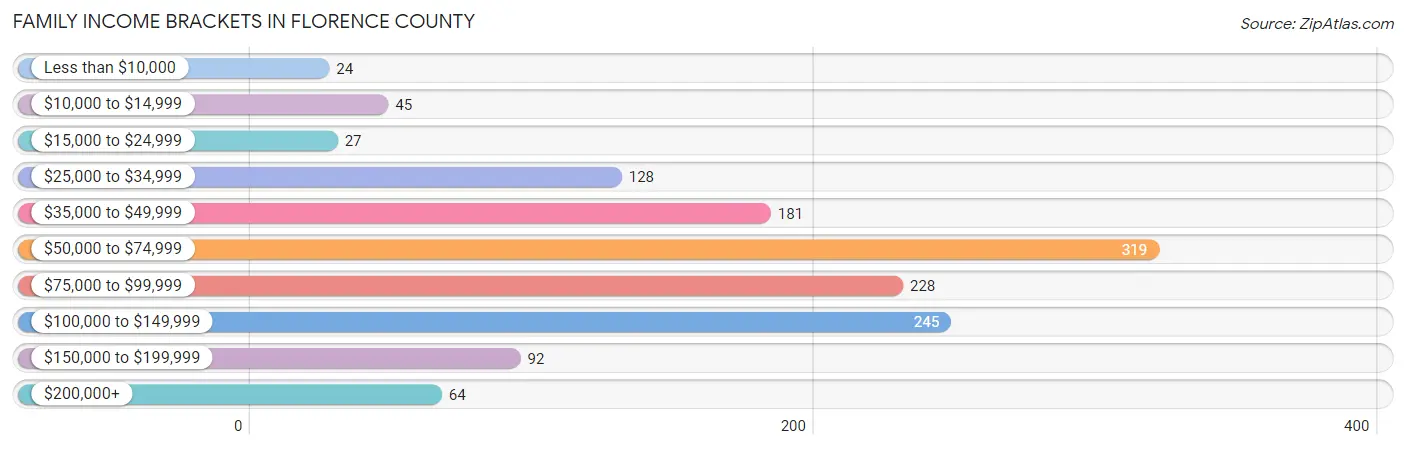
| Income Bracket | # Families | % Families |
| Less than $10,000 | 24 | 1.8% |
| $10,000 to $14,999 | 45 | 3.3% |
| $15,000 to $24,999 | 27 | 2.0% |
| $25,000 to $34,999 | 128 | 9.5% |
| $35,000 to $49,999 | 181 | 13.4% |
| $50,000 to $74,999 | 319 | 23.6% |
| $75,000 to $99,999 | 228 | 16.9% |
| $100,000 to $149,999 | 245 | 18.1% |
| $150,000 to $199,999 | 92 | 6.8% |
| $200,000+ | 64 | 4.7% |
Family Income by Famaliy Size in Florence County
6-person families (19 | 1.4%) account for the highest median family income in Florence County with $250,001 per family, while 6-person families (19 | 1.4%) have the highest median income of $41,667 per family member.
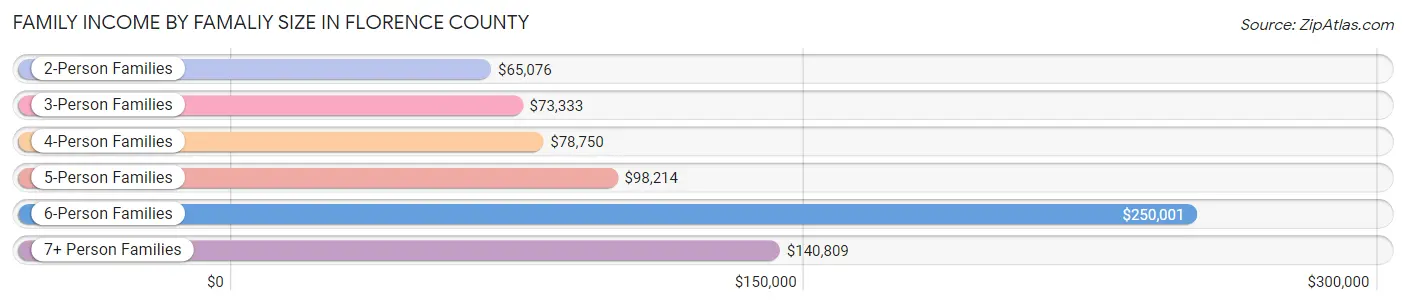
| Income Bracket | # Families | Median Income |
| 2-Person Families | 934 (69.1%) | $65,076 |
| 3-Person Families | 184 (13.6%) | $73,333 |
| 4-Person Families | 146 (10.8%) | $78,750 |
| 5-Person Families | 46 (3.4%) | $98,214 |
| 6-Person Families | 19 (1.4%) | $250,001 |
| 7+ Person Families | 23 (1.7%) | $140,809 |
| Total | 1,352 (100.0%) | $71,444 |
Family Income by Number of Earners in Florence County
The median family income in Florence County is $71,444, with families comprising 3+ earners (91) having the highest median family income of $141,080, while families with no earners (353) have the lowest median family income of $48,892, accounting for 6.7% and 26.1% of families, respectively.
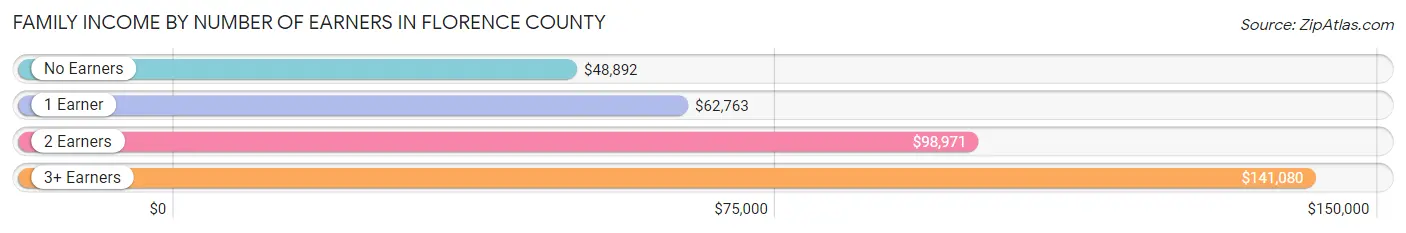
| Number of Earners | # Families | Median Income |
| No Earners | 353 (26.1%) | $48,892 |
| 1 Earner | 382 (28.2%) | $62,763 |
| 2 Earners | 526 (38.9%) | $98,971 |
| 3+ Earners | 91 (6.7%) | $141,080 |
| Total | 1,352 (100.0%) | $71,444 |
Household Income in Florence County
Household Income Brackets in Florence County
With 439 households falling in the category, the $50,000 to $74,999 income range is the most frequent in Florence County, accounting for 21.1% of all households. In contrast, only 56 households (2.7%) fall into the less than $10,000 income bracket, making it the least populous group.
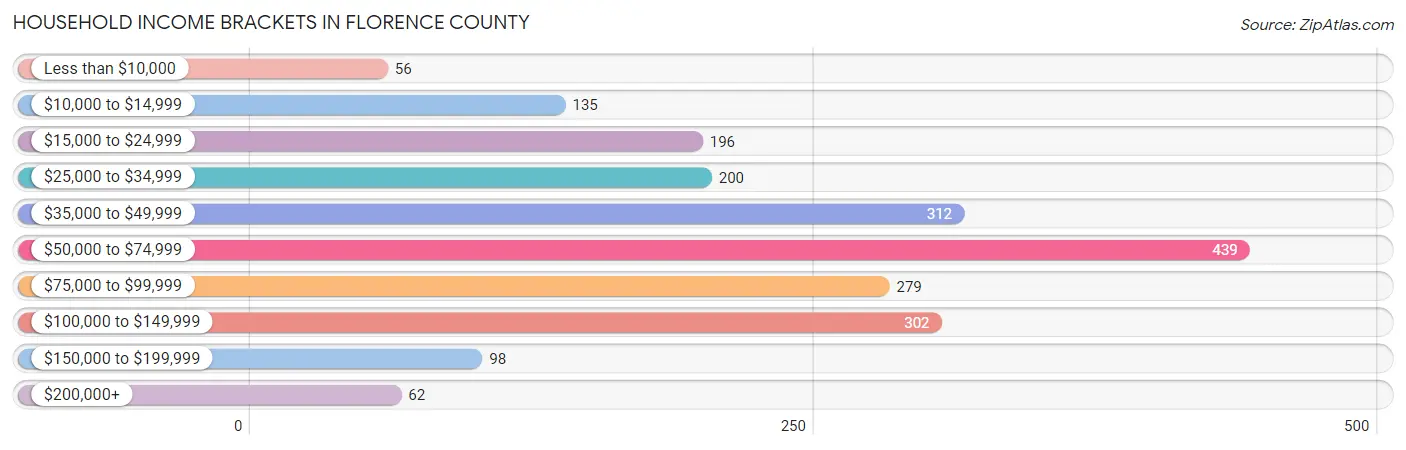
| Income Bracket | # Households | % Households |
| Less than $10,000 | 56 | 2.7% |
| $10,000 to $14,999 | 135 | 6.5% |
| $15,000 to $24,999 | 196 | 9.4% |
| $25,000 to $34,999 | 200 | 9.6% |
| $35,000 to $49,999 | 312 | 15.0% |
| $50,000 to $74,999 | 439 | 21.1% |
| $75,000 to $99,999 | 279 | 13.4% |
| $100,000 to $149,999 | 302 | 14.5% |
| $150,000 to $199,999 | 98 | 4.7% |
| $200,000+ | 62 | 3.0% |
Household Income by Householder Age in Florence County
The median household income in Florence County is $58,049, with the highest median household income of $83,750 found in the 25 to 44 years age bracket for the primary householder. A total of 344 households (16.5%) fall into this category. Meanwhile, the 65+ years age bracket for the primary householder has the lowest median household income of $49,875, with 693 households (33.3%) in this group.
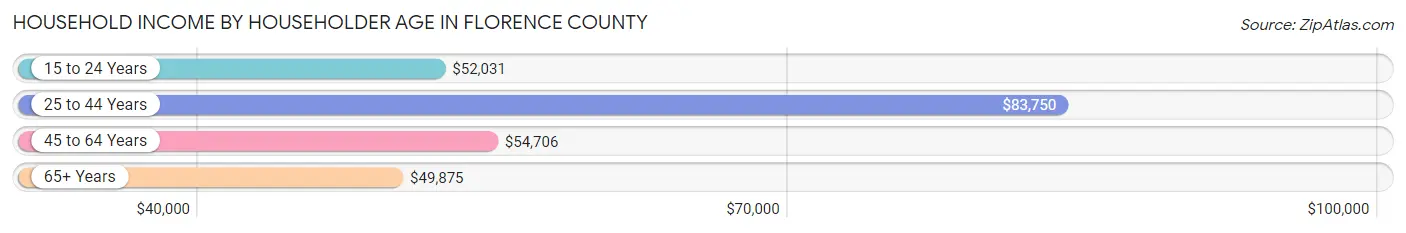
| Income Bracket | # Households | Median Income |
| 15 to 24 Years | 39 (1.9%) | $52,031 |
| 25 to 44 Years | 344 (16.5%) | $83,750 |
| 45 to 64 Years | 1,006 (48.3%) | $54,706 |
| 65+ Years | 693 (33.3%) | $49,875 |
| Total | 2,082 (100.0%) | $58,049 |
Poverty in Florence County
Income Below Poverty by Sex and Age in Florence County
With 8.6% poverty level for males and 11.1% for females among the residents of Florence County, 5 year old males and 12 to 14 year old females are the most vulnerable to poverty, with 5 males (35.7%) and 5 females (29.4%) in their respective age groups living below the poverty level.
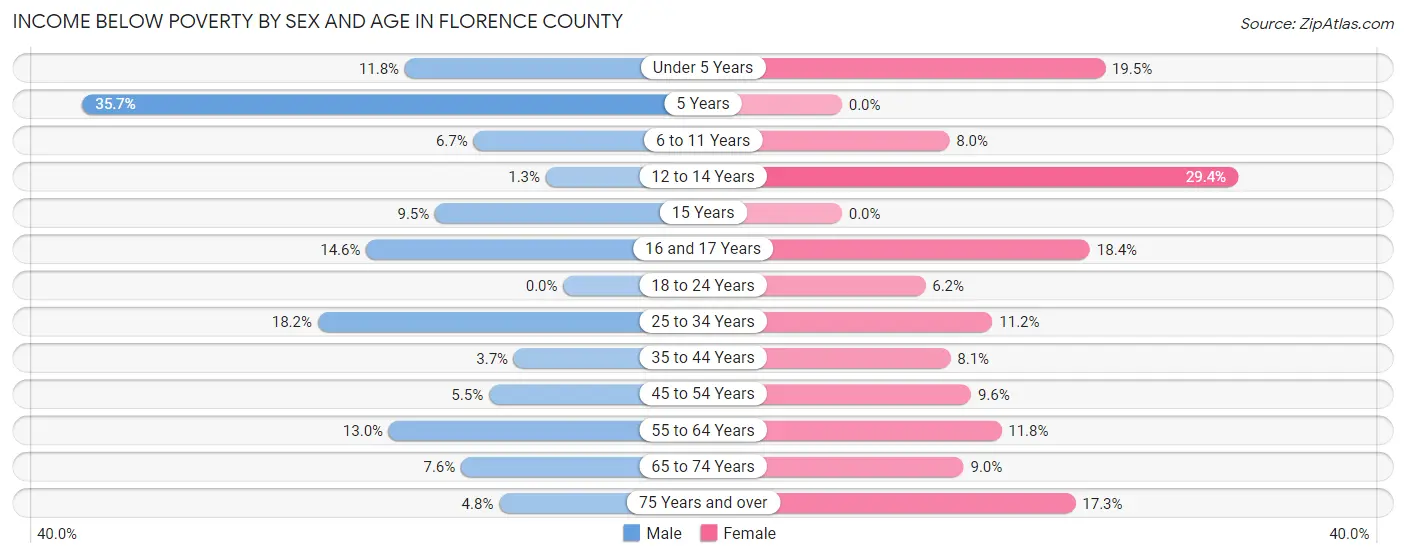
| Age Bracket | Male | Female |
| Under 5 Years | 10 (11.8%) | 17 (19.5%) |
| 5 Years | 5 (35.7%) | 0 (0.0%) |
| 6 to 11 Years | 9 (6.7%) | 13 (8.0%) |
| 12 to 14 Years | 1 (1.3%) | 5 (29.4%) |
| 15 Years | 2 (9.5%) | 0 (0.0%) |
| 16 and 17 Years | 6 (14.6%) | 7 (18.4%) |
| 18 to 24 Years | 0 (0.0%) | 8 (6.2%) |
| 25 to 34 Years | 35 (18.2%) | 18 (11.2%) |
| 35 to 44 Years | 9 (3.7%) | 17 (8.1%) |
| 45 to 54 Years | 16 (5.5%) | 26 (9.6%) |
| 55 to 64 Years | 65 (13.0%) | 58 (11.8%) |
| 65 to 74 Years | 30 (7.6%) | 32 (9.0%) |
| 75 Years and over | 9 (4.8%) | 43 (17.3%) |
| Total | 197 (8.6%) | 244 (11.1%) |
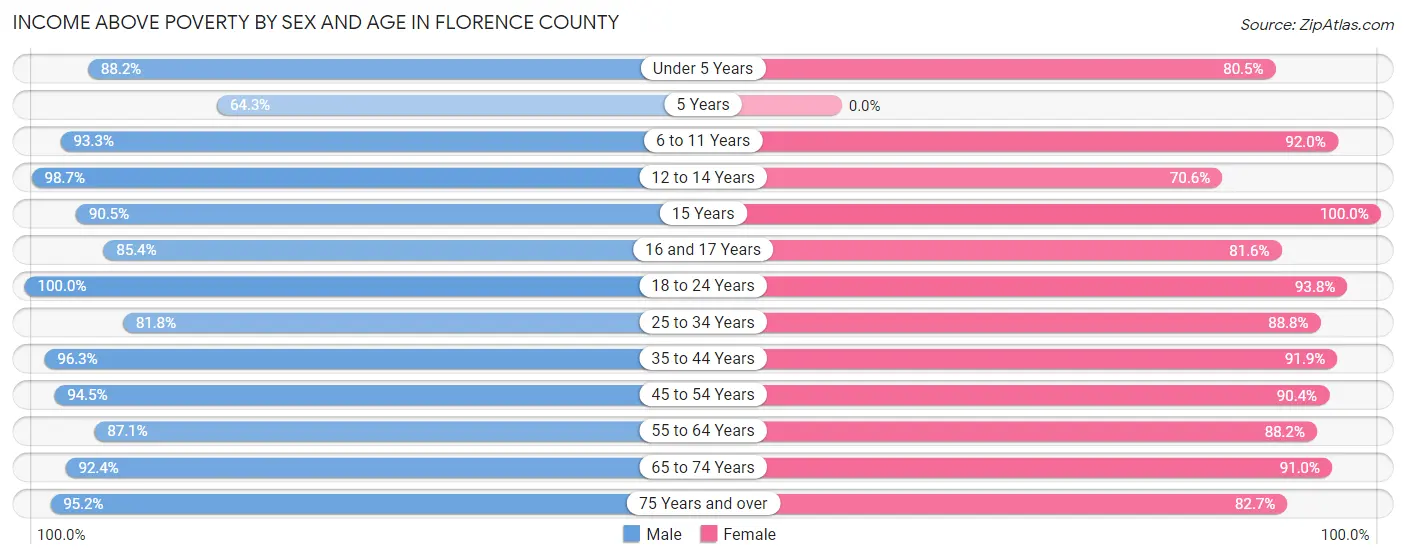
Income Above Poverty by Sex and Age in Florence County
According to the poverty statistics in Florence County, males aged 18 to 24 years and females aged 15 years are the age groups that are most secure financially, with 100.0% of males and 100.0% of females in these age groups living above the poverty line.
| Age Bracket | Male | Female |
| Under 5 Years | 75 (88.2%) | 70 (80.5%) |
| 5 Years | 9 (64.3%) | 0 (0.0%) |
| 6 to 11 Years | 126 (93.3%) | 150 (92.0%) |
| 12 to 14 Years | 76 (98.7%) | 12 (70.6%) |
| 15 Years | 19 (90.5%) | 30 (100.0%) |
| 16 and 17 Years | 35 (85.4%) | 31 (81.6%) |
| 18 to 24 Years | 117 (100.0%) | 121 (93.8%) |
| 25 to 34 Years | 157 (81.8%) | 143 (88.8%) |
| 35 to 44 Years | 236 (96.3%) | 194 (91.9%) |
| 45 to 54 Years | 274 (94.5%) | 245 (90.4%) |
| 55 to 64 Years | 437 (87.1%) | 432 (88.2%) |
| 65 to 74 Years | 365 (92.4%) | 322 (91.0%) |
| 75 Years and over | 180 (95.2%) | 205 (82.7%) |
| Total | 2,106 (91.4%) | 1,955 (88.9%) |
Income Below Poverty Among Married-Couple Families in Florence County
The poverty statistics for married-couple families in Florence County show that 4.8% or 55 of the total 1,142 families live below the poverty line. Families with 3 or 4 children have the highest poverty rate of 28.3%, comprising of 13 families. On the other hand, families with 5 or more children have the lowest poverty rate of 0.0%, which includes 0 families.

| Children | Above Poverty | Below Poverty |
| No Children | 876 (95.7%) | 39 (4.3%) |
| 1 or 2 Children | 157 (98.1%) | 3 (1.9%) |
| 3 or 4 Children | 33 (71.7%) | 13 (28.3%) |
| 5 or more Children | 21 (100.0%) | 0 (0.0%) |
| Total | 1,087 (95.2%) | 55 (4.8%) |
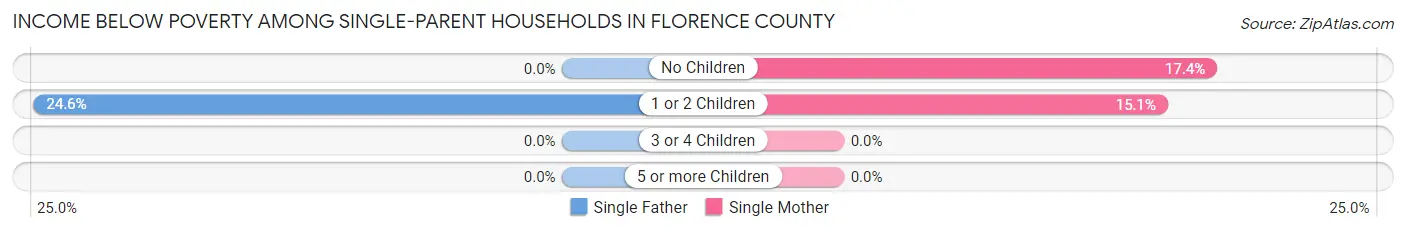
Income Below Poverty Among Single-Parent Households in Florence County
According to the poverty data in Florence County, 13.5% or 15 single-father households and 16.2% or 16 single-mother households are living below the poverty line. Among single-father households, those with 1 or 2 children have the highest poverty rate, with 15 households (24.6%) experiencing poverty. Likewise, among single-mother households, those with no children have the highest poverty rate, with 8 households (17.4%) falling below the poverty line.
| Children | Single Father | Single Mother |
| No Children | 0 (0.0%) | 8 (17.4%) |
| 1 or 2 Children | 15 (24.6%) | 8 (15.1%) |
| 3 or 4 Children | 0 (0.0%) | 0 (0.0%) |
| 5 or more Children | 0 (0.0%) | 0 (0.0%) |
| Total | 15 (13.5%) | 16 (16.2%) |
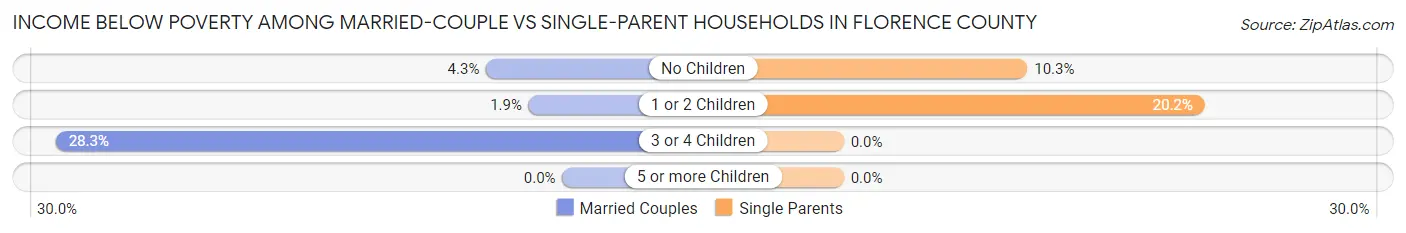
Income Below Poverty Among Married-Couple vs Single-Parent Households in Florence County
The poverty data for Florence County shows that 55 of the married-couple family households (4.8%) and 31 of the single-parent households (14.8%) are living below the poverty level. Within the married-couple family households, those with 3 or 4 children have the highest poverty rate, with 13 households (28.3%) falling below the poverty line. Among the single-parent households, those with 1 or 2 children have the highest poverty rate, with 23 household (20.2%) living below poverty.
| Children | Married-Couple Families | Single-Parent Households |
| No Children | 39 (4.3%) | 8 (10.3%) |
| 1 or 2 Children | 3 (1.9%) | 23 (20.2%) |
| 3 or 4 Children | 13 (28.3%) | 0 (0.0%) |
| 5 or more Children | 0 (0.0%) | 0 (0.0%) |
| Total | 55 (4.8%) | 31 (14.8%) |
Employment Characteristics in Florence County
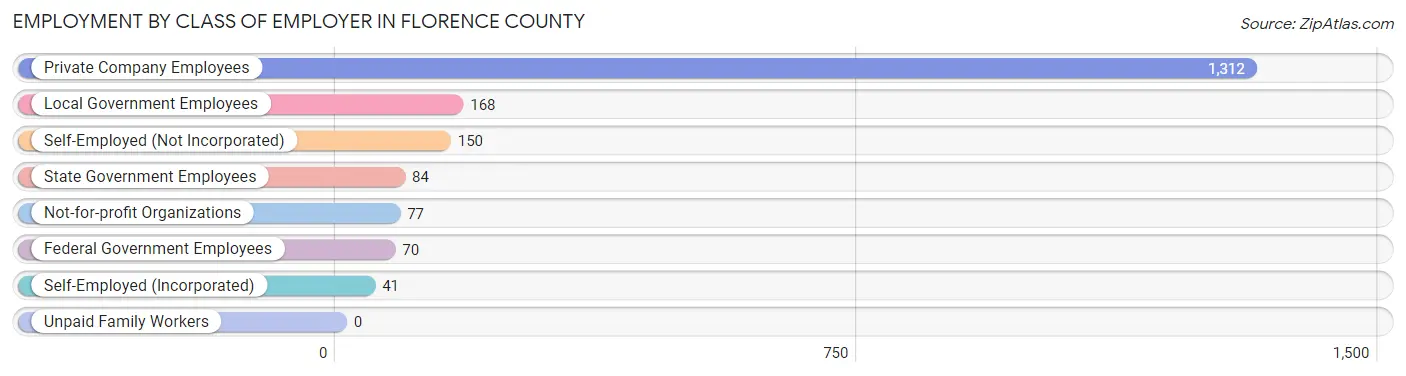
Employment by Class of Employer in Florence County
Among the 1,902 employed individuals in Florence County, private company employees (1,312 | 69.0%), local government employees (168 | 8.8%), and self-employed (not incorporated) (150 | 7.9%) make up the most common classes of employment.
| Employer Class | # Employees | % Employees |
| Private Company Employees | 1,312 | 69.0% |
| Self-Employed (Incorporated) | 41 | 2.2% |
| Self-Employed (Not Incorporated) | 150 | 7.9% |
| Not-for-profit Organizations | 77 | 4.1% |
| Local Government Employees | 168 | 8.8% |
| State Government Employees | 84 | 4.4% |
| Federal Government Employees | 70 | 3.7% |
| Unpaid Family Workers | 0 | 0.0% |
| Total | 1,902 | 100.0% |
Employment Status by Age in Florence County
According to the labor force statistics for Florence County, out of the total population over 16 years of age (3,932), 53.1% or 2,088 individuals are in the labor force, with 6.0% or 125 of them unemployed. The age group with the highest labor force participation rate is 20 to 24 years, with 95.8% or 182 individuals in the labor force. Within the labor force, the 16 to 19 years age range has the highest percentage of unemployed individuals, with 18.2% or 8 of them being unemployed.
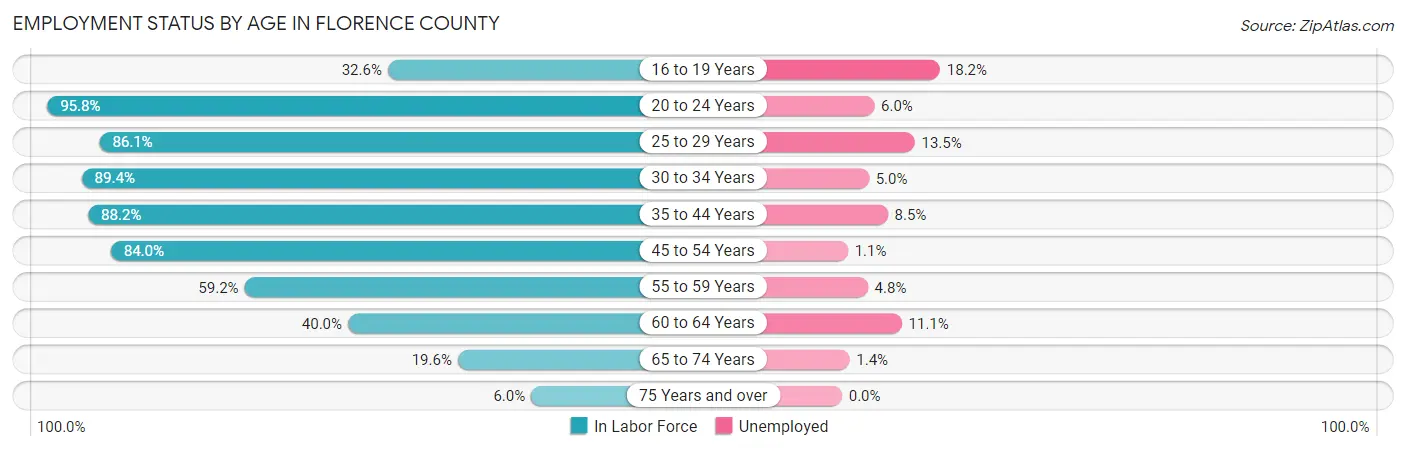
| Age Bracket | In Labor Force | Unemployed |
| 16 to 19 Years | 44 (32.6%) | 8 (18.2%) |
| 20 to 24 Years | 182 (95.8%) | 11 (6.0%) |
| 25 to 29 Years | 155 (86.1%) | 21 (13.5%) |
| 30 to 34 Years | 160 (89.4%) | 8 (5.0%) |
| 35 to 44 Years | 402 (88.2%) | 34 (8.5%) |
| 45 to 54 Years | 471 (84.0%) | 5 (1.1%) |
| 55 to 59 Years | 310 (59.2%) | 15 (4.8%) |
| 60 to 64 Years | 189 (40.0%) | 21 (11.1%) |
| 65 to 74 Years | 147 (19.6%) | 2 (1.4%) |
| 75 Years and over | 29 (6.0%) | 0 (0.0%) |
| Total | 2,088 (53.1%) | 125 (6.0%) |
Employment Status by Educational Attainment in Florence County
According to labor force statistics for Florence County, 71.1% of individuals (1,687) out of the total population between 25 and 64 years of age (2,373) are in the labor force, with 6.2% or 105 of them being unemployed. The group with the highest labor force participation rate are those with the educational attainment of college / associate degree, with 83.2% or 679 individuals in the labor force. Within the labor force, individuals with less than high school education have the highest percentage of unemployment, with 33.3% or 32 of them being unemployed.
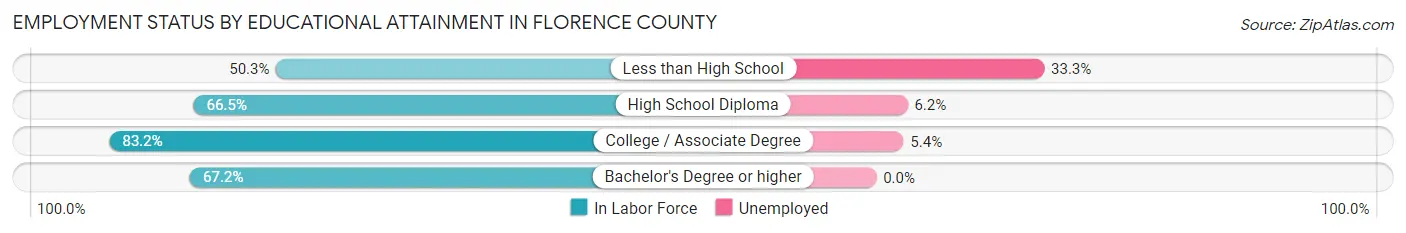
| Educational Attainment | In Labor Force | Unemployed |
| Less than High School | 96 (50.3%) | 64 (33.3%) |
| High School Diploma | 561 (66.5%) | 52 (6.2%) |
| College / Associate Degree | 679 (83.2%) | 44 (5.4%) |
| Bachelor's Degree or higher | 351 (67.2%) | 0 (0.0%) |
| Total | 1,687 (71.1%) | 147 (6.2%) |
Employment Occupations by Sex in Florence County
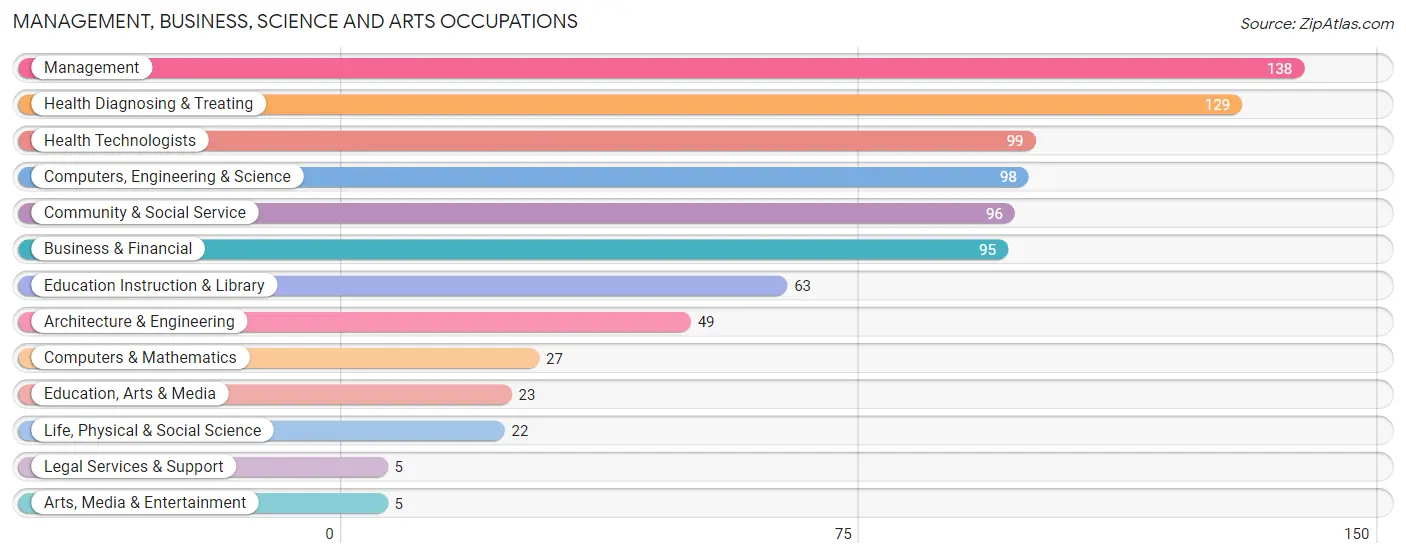
Management, Business, Science and Arts Occupations
The most common Management, Business, Science and Arts occupations in Florence County are Management (138 | 7.0%), Health Diagnosing & Treating (129 | 6.6%), Health Technologists (99 | 5.0%), Computers, Engineering & Science (98 | 5.0%), and Community & Social Service (96 | 4.9%).
Management, Business, Science and Arts Occupations by Sex
Within the Management, Business, Science and Arts occupations in Florence County, the most male-oriented occupations are Computers & Mathematics (100.0%), Legal Services & Support (100.0%), and Arts, Media & Entertainment (100.0%), while the most female-oriented occupations are Health Diagnosing & Treating (88.4%), Education Instruction & Library (85.7%), and Health Technologists (84.9%).
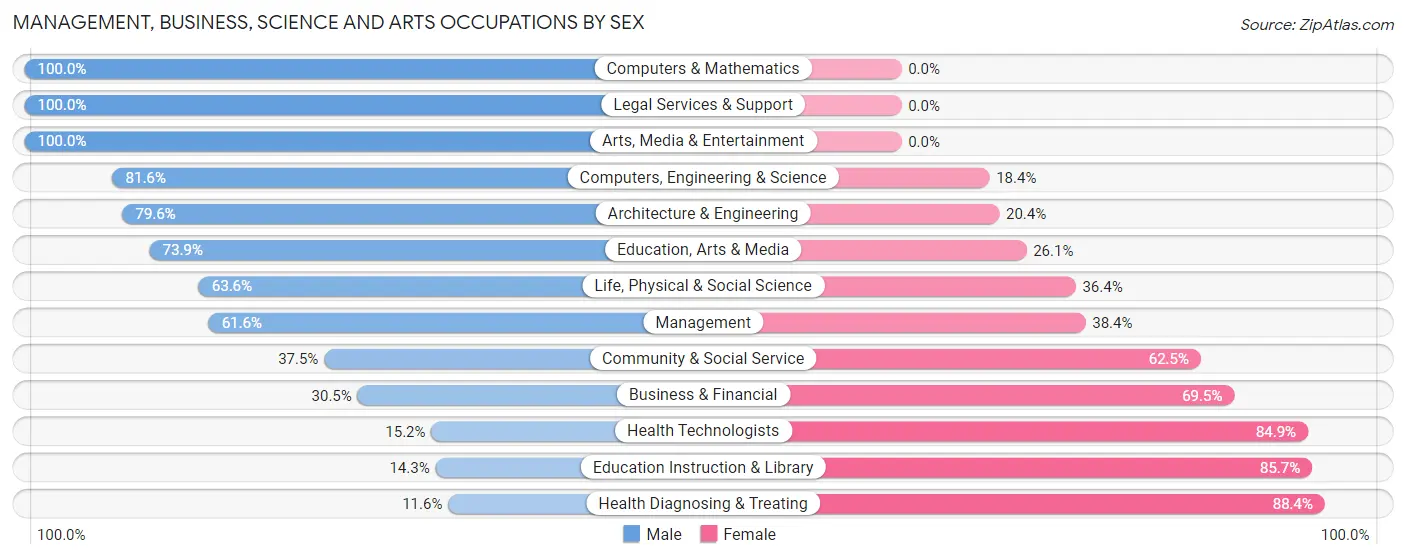
| Occupation | Male | Female |
| Management | 85 (61.6%) | 53 (38.4%) |
| Business & Financial | 29 (30.5%) | 66 (69.5%) |
| Computers, Engineering & Science | 80 (81.6%) | 18 (18.4%) |
| Computers & Mathematics | 27 (100.0%) | 0 (0.0%) |
| Architecture & Engineering | 39 (79.6%) | 10 (20.4%) |
| Life, Physical & Social Science | 14 (63.6%) | 8 (36.4%) |
| Community & Social Service | 36 (37.5%) | 60 (62.5%) |
| Education, Arts & Media | 17 (73.9%) | 6 (26.1%) |
| Legal Services & Support | 5 (100.0%) | 0 (0.0%) |
| Education Instruction & Library | 9 (14.3%) | 54 (85.7%) |
| Arts, Media & Entertainment | 5 (100.0%) | 0 (0.0%) |
| Health Diagnosing & Treating | 15 (11.6%) | 114 (88.4%) |
| Health Technologists | 15 (15.1%) | 84 (84.9%) |
| Total (Category) | 245 (44.1%) | 311 (55.9%) |
| Total (Overall) | 1,099 (56.0%) | 865 (44.0%) |
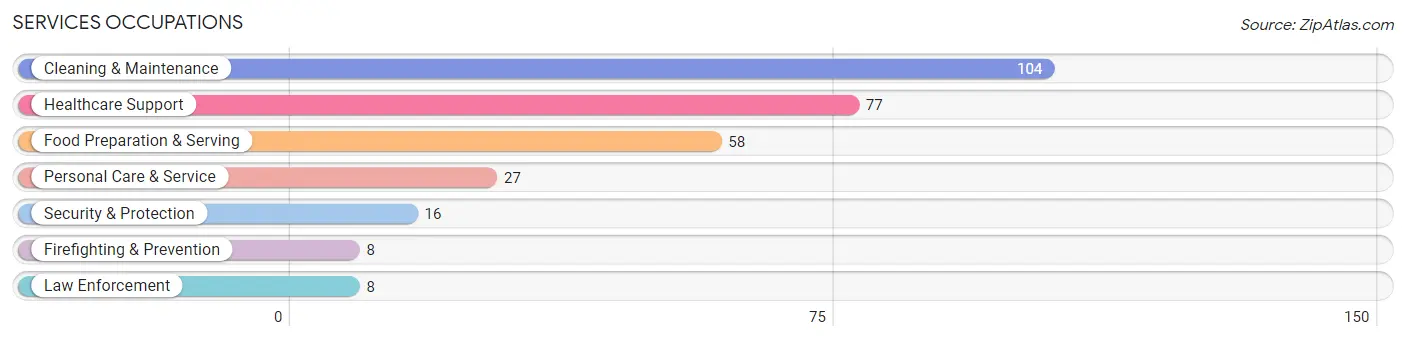
Services Occupations
The most common Services occupations in Florence County are Cleaning & Maintenance (104 | 5.3%), Healthcare Support (77 | 3.9%), Food Preparation & Serving (58 | 2.9%), Personal Care & Service (27 | 1.4%), and Security & Protection (16 | 0.8%).
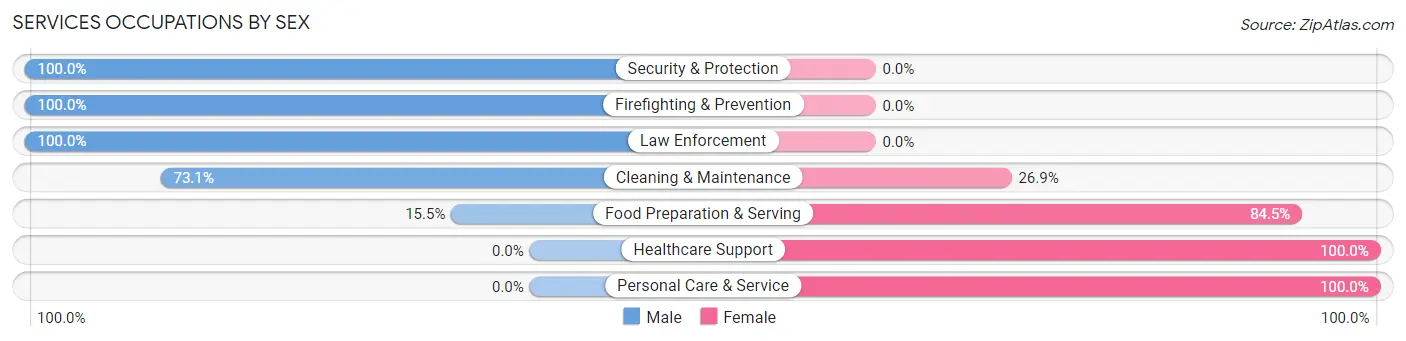
Services Occupations by Sex
Within the Services occupations in Florence County, the most male-oriented occupations are Security & Protection (100.0%), Firefighting & Prevention (100.0%), and Law Enforcement (100.0%), while the most female-oriented occupations are Healthcare Support (100.0%), Personal Care & Service (100.0%), and Food Preparation & Serving (84.5%).
| Occupation | Male | Female |
| Healthcare Support | 0 (0.0%) | 77 (100.0%) |
| Security & Protection | 16 (100.0%) | 0 (0.0%) |
| Firefighting & Prevention | 8 (100.0%) | 0 (0.0%) |
| Law Enforcement | 8 (100.0%) | 0 (0.0%) |
| Food Preparation & Serving | 9 (15.5%) | 49 (84.5%) |
| Cleaning & Maintenance | 76 (73.1%) | 28 (26.9%) |
| Personal Care & Service | 0 (0.0%) | 27 (100.0%) |
| Total (Category) | 101 (35.8%) | 181 (64.2%) |
| Total (Overall) | 1,099 (56.0%) | 865 (44.0%) |
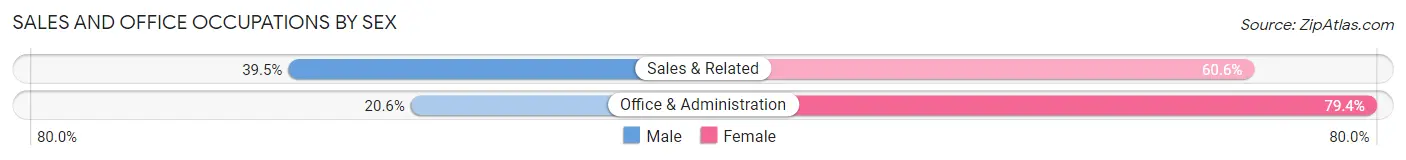
Sales and Office Occupations
The most common Sales and Office occupations in Florence County are Office & Administration (262 | 13.3%), and Sales & Related (109 | 5.6%).

Sales and Office Occupations by Sex
| Occupation | Male | Female |
| Sales & Related | 43 (39.5%) | 66 (60.6%) |
| Office & Administration | 54 (20.6%) | 208 (79.4%) |
| Total (Category) | 97 (26.2%) | 274 (73.9%) |
| Total (Overall) | 1,099 (56.0%) | 865 (44.0%) |
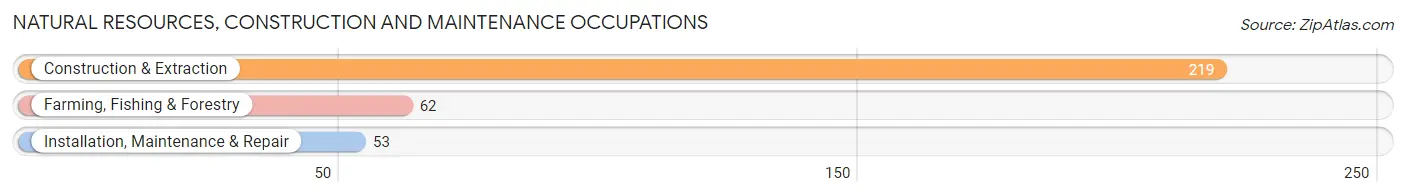
Natural Resources, Construction and Maintenance Occupations
The most common Natural Resources, Construction and Maintenance occupations in Florence County are Construction & Extraction (219 | 11.2%), Farming, Fishing & Forestry (62 | 3.2%), and Installation, Maintenance & Repair (53 | 2.7%).
Natural Resources, Construction and Maintenance Occupations by Sex

| Occupation | Male | Female |
| Farming, Fishing & Forestry | 62 (100.0%) | 0 (0.0%) |
| Construction & Extraction | 204 (93.1%) | 15 (6.9%) |
| Installation, Maintenance & Repair | 53 (100.0%) | 0 (0.0%) |
| Total (Category) | 319 (95.5%) | 15 (4.5%) |
| Total (Overall) | 1,099 (56.0%) | 865 (44.0%) |
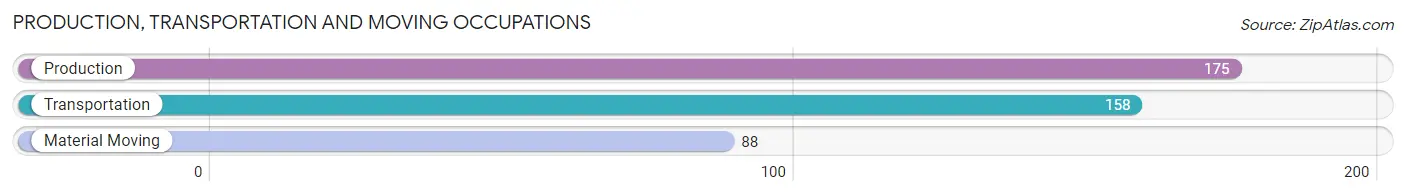
Production, Transportation and Moving Occupations
The most common Production, Transportation and Moving occupations in Florence County are Production (175 | 8.9%), Transportation (158 | 8.0%), and Material Moving (88 | 4.5%).
Production, Transportation and Moving Occupations by Sex
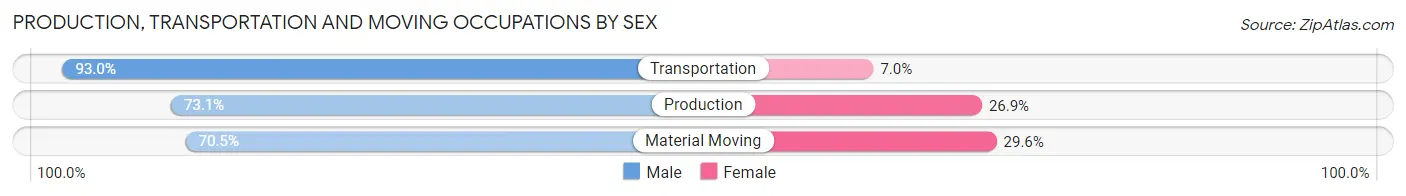
| Occupation | Male | Female |
| Production | 128 (73.1%) | 47 (26.9%) |
| Transportation | 147 (93.0%) | 11 (7.0%) |
| Material Moving | 62 (70.5%) | 26 (29.5%) |
| Total (Category) | 337 (80.0%) | 84 (20.0%) |
| Total (Overall) | 1,099 (56.0%) | 865 (44.0%) |
Employment Industries by Sex in Florence County
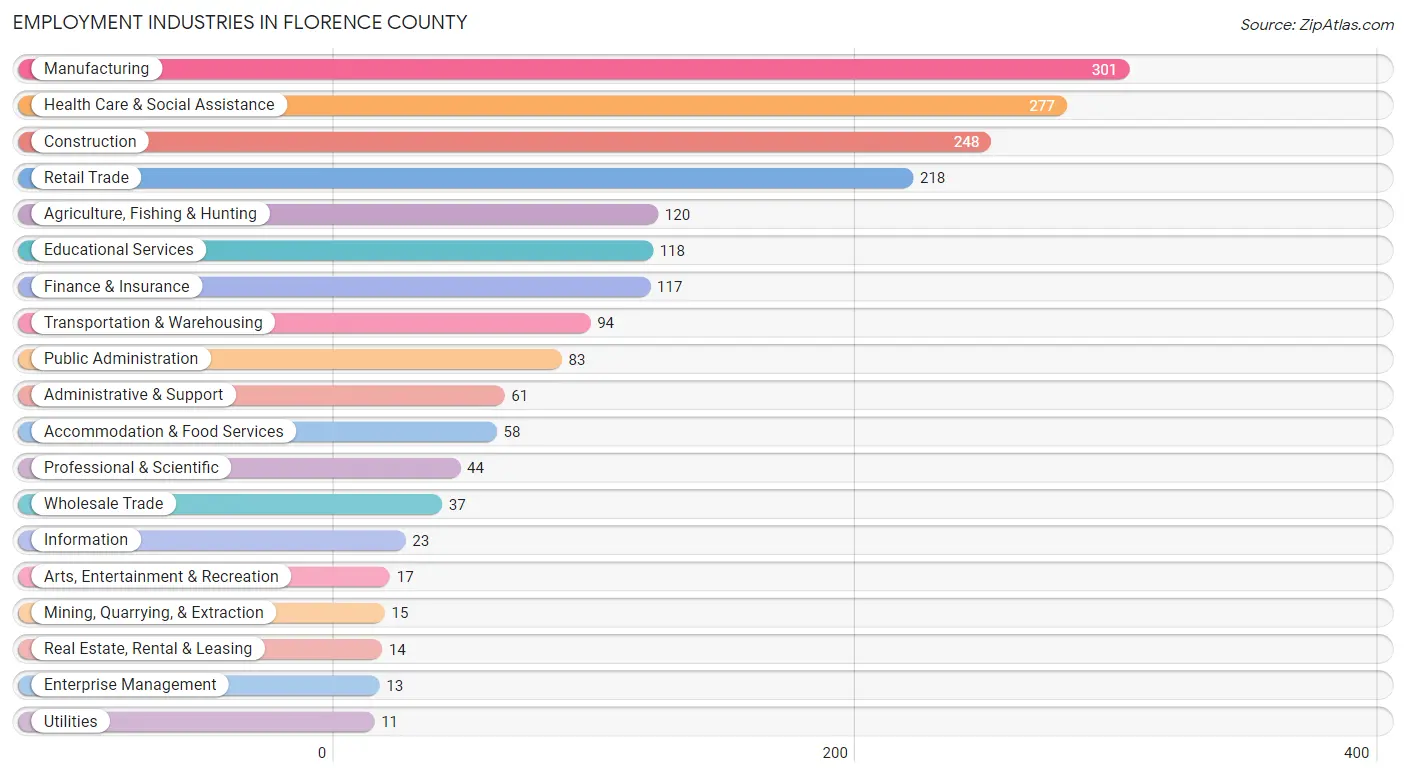
Employment Industries in Florence County
The major employment industries in Florence County include Manufacturing (301 | 15.3%), Health Care & Social Assistance (277 | 14.1%), Construction (248 | 12.6%), Retail Trade (218 | 11.1%), and Agriculture, Fishing & Hunting (120 | 6.1%).
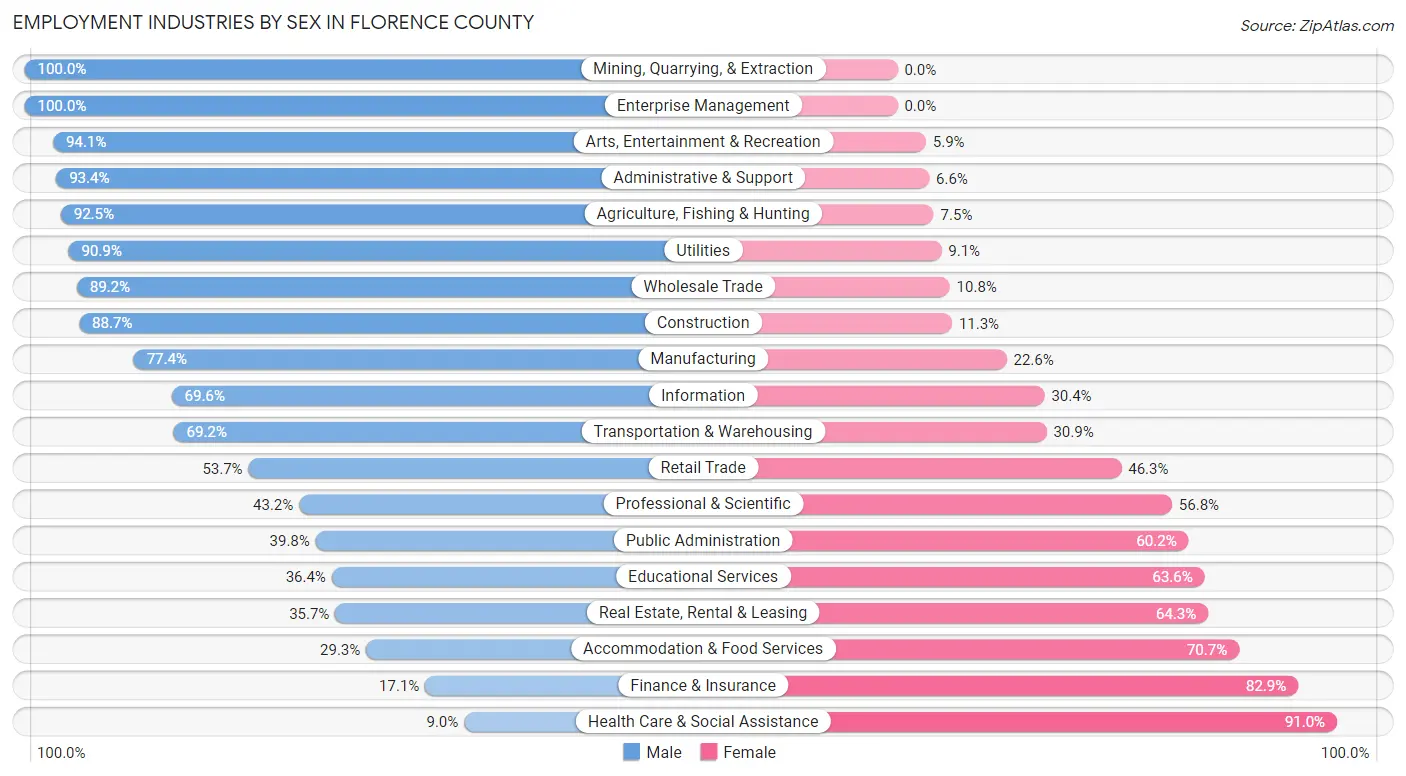
Employment Industries by Sex in Florence County
The Florence County industries that see more men than women are Mining, Quarrying, & Extraction (100.0%), Enterprise Management (100.0%), and Arts, Entertainment & Recreation (94.1%), whereas the industries that tend to have a higher number of women are Health Care & Social Assistance (91.0%), Finance & Insurance (82.9%), and Accommodation & Food Services (70.7%).
| Industry | Male | Female |
| Agriculture, Fishing & Hunting | 111 (92.5%) | 9 (7.5%) |
| Mining, Quarrying, & Extraction | 15 (100.0%) | 0 (0.0%) |
| Construction | 220 (88.7%) | 28 (11.3%) |
| Manufacturing | 233 (77.4%) | 68 (22.6%) |
| Wholesale Trade | 33 (89.2%) | 4 (10.8%) |
| Retail Trade | 117 (53.7%) | 101 (46.3%) |
| Transportation & Warehousing | 65 (69.2%) | 29 (30.8%) |
| Utilities | 10 (90.9%) | 1 (9.1%) |
| Information | 16 (69.6%) | 7 (30.4%) |
| Finance & Insurance | 20 (17.1%) | 97 (82.9%) |
| Real Estate, Rental & Leasing | 5 (35.7%) | 9 (64.3%) |
| Professional & Scientific | 19 (43.2%) | 25 (56.8%) |
| Enterprise Management | 13 (100.0%) | 0 (0.0%) |
| Administrative & Support | 57 (93.4%) | 4 (6.6%) |
| Educational Services | 43 (36.4%) | 75 (63.6%) |
| Health Care & Social Assistance | 25 (9.0%) | 252 (91.0%) |
| Arts, Entertainment & Recreation | 16 (94.1%) | 1 (5.9%) |
| Accommodation & Food Services | 17 (29.3%) | 41 (70.7%) |
| Public Administration | 33 (39.8%) | 50 (60.2%) |
| Total | 1,099 (56.0%) | 865 (44.0%) |
Education in Florence County
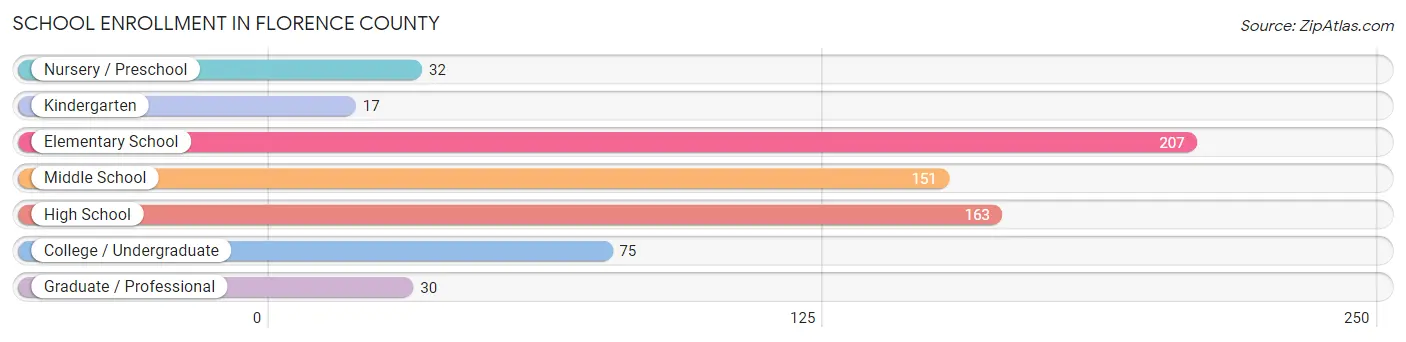
School Enrollment in Florence County
The most common levels of schooling among the 675 students in Florence County are elementary school (207 | 30.7%), high school (163 | 24.1%), and middle school (151 | 22.4%).
| School Level | # Students | % Students |
| Nursery / Preschool | 32 | 4.7% |
| Kindergarten | 17 | 2.5% |
| Elementary School | 207 | 30.7% |
| Middle School | 151 | 22.4% |
| High School | 163 | 24.1% |
| College / Undergraduate | 75 | 11.1% |
| Graduate / Professional | 30 | 4.4% |
| Total | 675 | 100.0% |
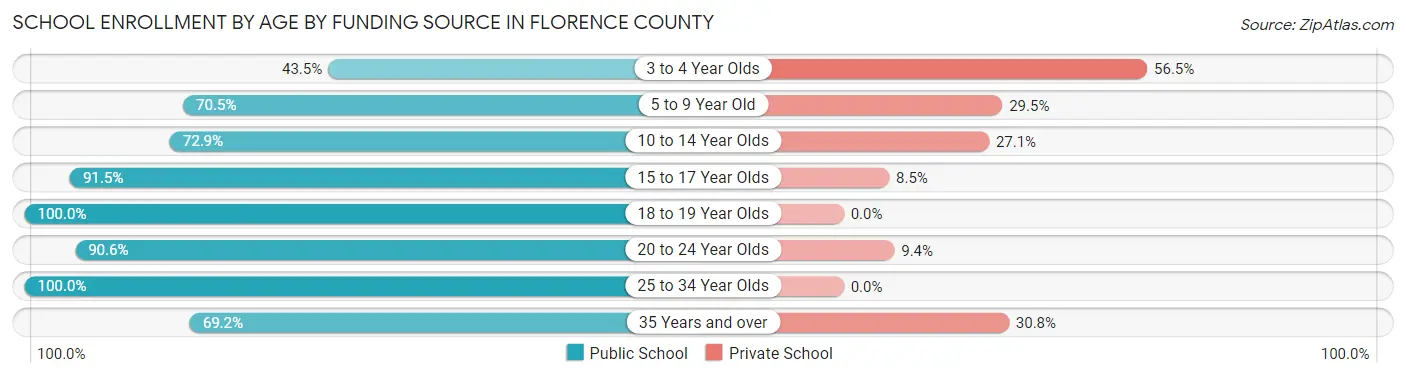
School Enrollment by Age by Funding Source in Florence County
Out of a total of 675 students who are enrolled in schools in Florence County, 153 (22.7%) attend a private institution, while the remaining 522 (77.3%) are enrolled in public schools. The age group of 3 to 4 year olds has the highest likelihood of being enrolled in private schools, with 13 (56.5% in the age bracket) enrolled. Conversely, the age group of 18 to 19 year olds has the lowest likelihood of being enrolled in a private school, with 19 (100.0% in the age bracket) attending a public institution.
| Age Bracket | Public School | Private School |
| 3 to 4 Year Olds | 10 (43.5%) | 13 (56.5%) |
| 5 to 9 Year Old | 136 (70.5%) | 57 (29.5%) |
| 10 to 14 Year Olds | 159 (72.9%) | 59 (27.1%) |
| 15 to 17 Year Olds | 119 (91.5%) | 11 (8.5%) |
| 18 to 19 Year Olds | 19 (100.0%) | 0 (0.0%) |
| 20 to 24 Year Olds | 48 (90.6%) | 5 (9.4%) |
| 25 to 34 Year Olds | 13 (100.0%) | 0 (0.0%) |
| 35 Years and over | 18 (69.2%) | 8 (30.8%) |
| Total | 522 (77.3%) | 153 (22.7%) |
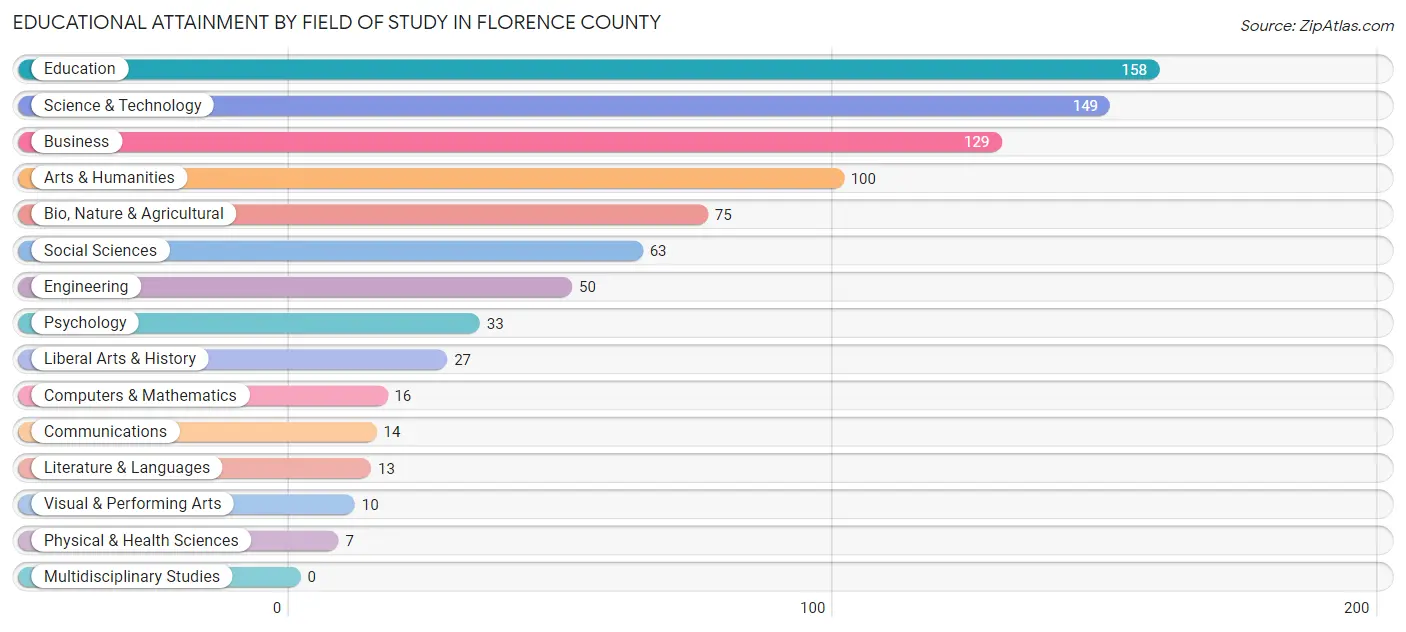
Educational Attainment by Field of Study in Florence County
Education (158 | 18.7%), science & technology (149 | 17.6%), business (129 | 15.3%), arts & humanities (100 | 11.8%), and bio, nature & agricultural (75 | 8.9%) are the most common fields of study among 844 individuals in Florence County who have obtained a bachelor's degree or higher.
| Field of Study | # Graduates | % Graduates |
| Computers & Mathematics | 16 | 1.9% |
| Bio, Nature & Agricultural | 75 | 8.9% |
| Physical & Health Sciences | 7 | 0.8% |
| Psychology | 33 | 3.9% |
| Social Sciences | 63 | 7.5% |
| Engineering | 50 | 5.9% |
| Multidisciplinary Studies | 0 | 0.0% |
| Science & Technology | 149 | 17.6% |
| Business | 129 | 15.3% |
| Education | 158 | 18.7% |
| Literature & Languages | 13 | 1.5% |
| Liberal Arts & History | 27 | 3.2% |
| Visual & Performing Arts | 10 | 1.2% |
| Communications | 14 | 1.7% |
| Arts & Humanities | 100 | 11.8% |
| Total | 844 | 100.0% |
Transportation & Commute in Florence County
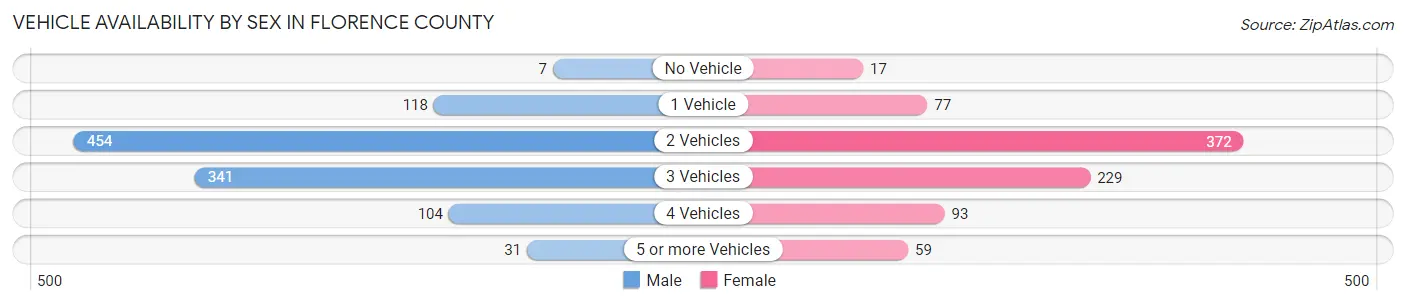
Vehicle Availability by Sex in Florence County
The most prevalent vehicle ownership categories in Florence County are males with 2 vehicles (454, accounting for 43.0%) and females with 2 vehicles (372, making up 53.6%).
| Vehicles Available | Male | Female |
| No Vehicle | 7 (0.7%) | 17 (2.0%) |
| 1 Vehicle | 118 (11.2%) | 77 (9.1%) |
| 2 Vehicles | 454 (43.0%) | 372 (43.9%) |
| 3 Vehicles | 341 (32.3%) | 229 (27.0%) |
| 4 Vehicles | 104 (9.9%) | 93 (11.0%) |
| 5 or more Vehicles | 31 (2.9%) | 59 (7.0%) |
| Total | 1,055 (100.0%) | 847 (100.0%) |
Commute Time in Florence County
The most frequently occuring commute durations in Florence County are 15 to 19 minutes (349 commuters, 20.1%), 20 to 24 minutes (291 commuters, 16.8%), and 5 to 9 minutes (256 commuters, 14.8%).
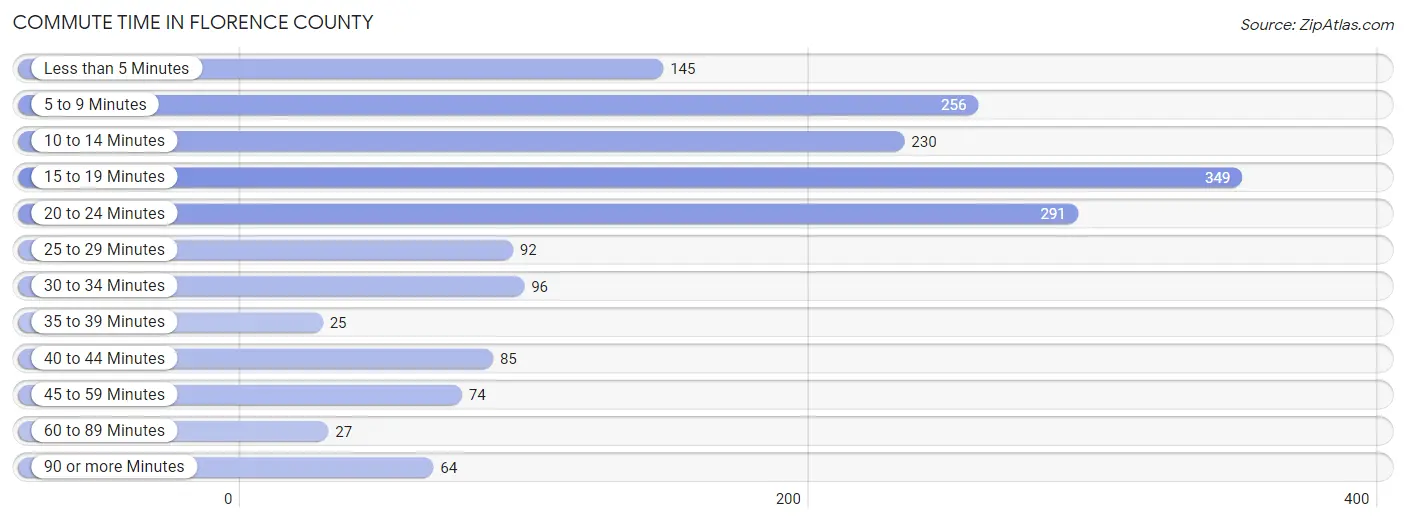
| Commute Time | # Commuters | % Commuters |
| Less than 5 Minutes | 145 | 8.4% |
| 5 to 9 Minutes | 256 | 14.8% |
| 10 to 14 Minutes | 230 | 13.3% |
| 15 to 19 Minutes | 349 | 20.1% |
| 20 to 24 Minutes | 291 | 16.8% |
| 25 to 29 Minutes | 92 | 5.3% |
| 30 to 34 Minutes | 96 | 5.5% |
| 35 to 39 Minutes | 25 | 1.4% |
| 40 to 44 Minutes | 85 | 4.9% |
| 45 to 59 Minutes | 74 | 4.3% |
| 60 to 89 Minutes | 27 | 1.6% |
| 90 or more Minutes | 64 | 3.7% |
Commute Time by Sex in Florence County
The most common commute times in Florence County are 20 to 24 minutes (195 commuters, 20.5%) for males and 15 to 19 minutes (168 commuters, 21.5%) for females.
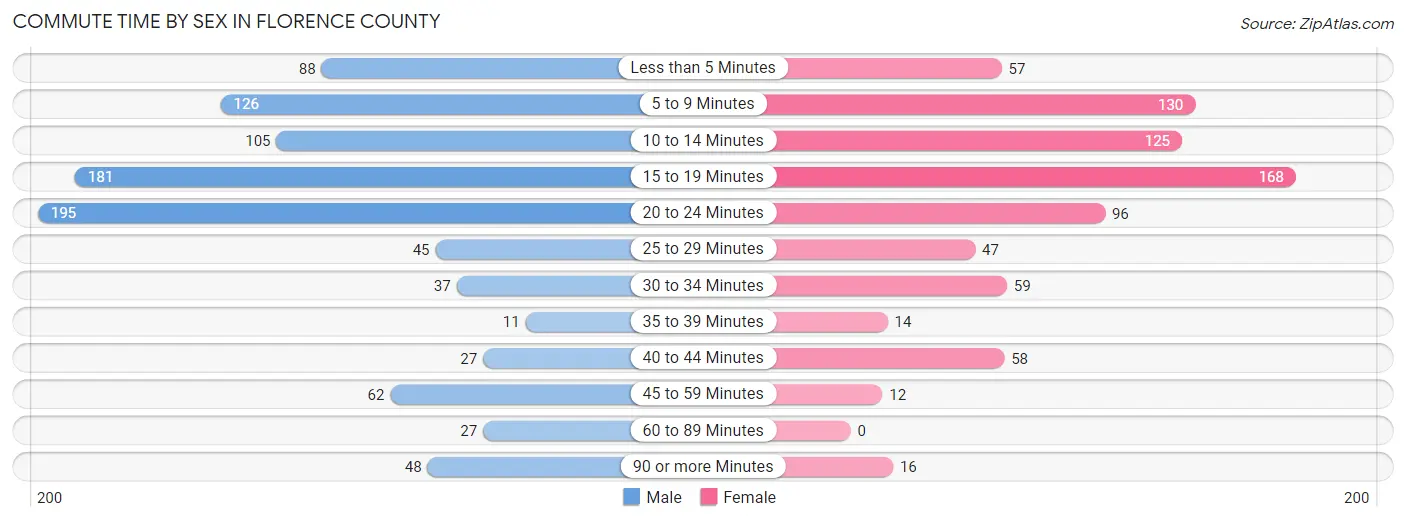
| Commute Time | Male | Female |
| Less than 5 Minutes | 88 (9.2%) | 57 (7.3%) |
| 5 to 9 Minutes | 126 (13.2%) | 130 (16.6%) |
| 10 to 14 Minutes | 105 (11.0%) | 125 (16.0%) |
| 15 to 19 Minutes | 181 (19.0%) | 168 (21.5%) |
| 20 to 24 Minutes | 195 (20.5%) | 96 (12.3%) |
| 25 to 29 Minutes | 45 (4.7%) | 47 (6.0%) |
| 30 to 34 Minutes | 37 (3.9%) | 59 (7.5%) |
| 35 to 39 Minutes | 11 (1.2%) | 14 (1.8%) |
| 40 to 44 Minutes | 27 (2.8%) | 58 (7.4%) |
| 45 to 59 Minutes | 62 (6.5%) | 12 (1.5%) |
| 60 to 89 Minutes | 27 (2.8%) | 0 (0.0%) |
| 90 or more Minutes | 48 (5.0%) | 16 (2.1%) |
Time of Departure to Work by Sex in Florence County
The most frequent times of departure to work in Florence County are 12:00 AM to 4:59 AM (123, 12.9%) for males and 7:30 AM to 7:59 AM (202, 25.8%) for females.
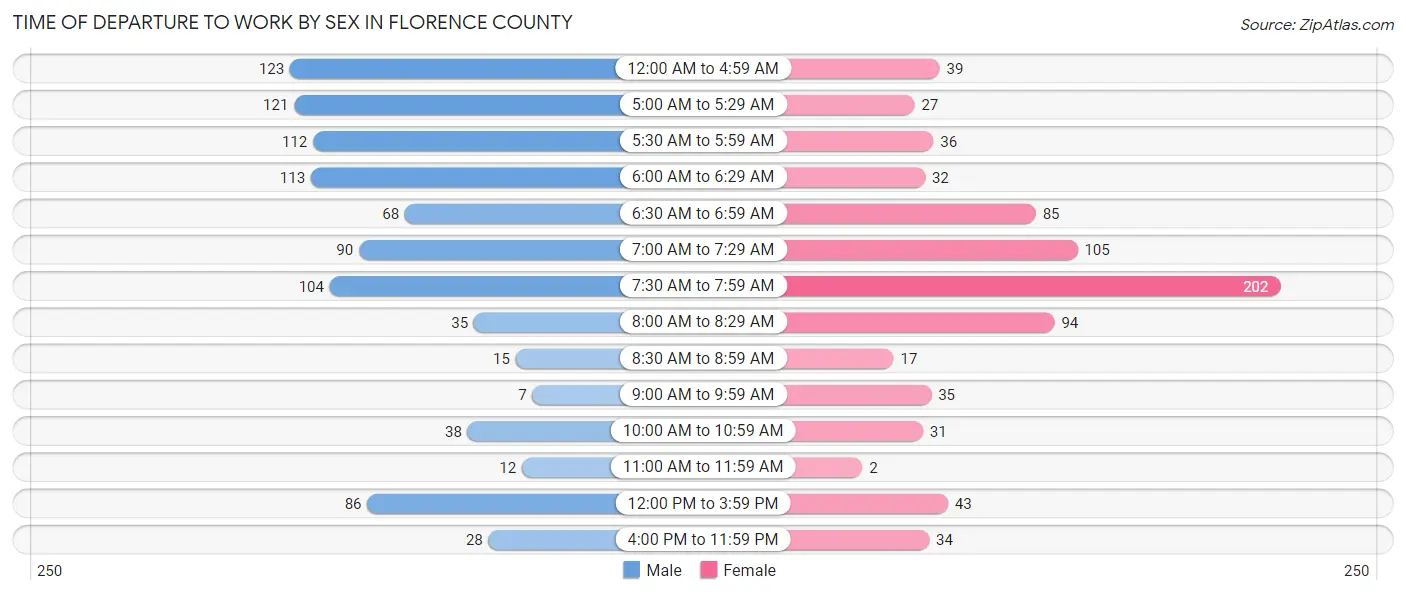
| Time of Departure | Male | Female |
| 12:00 AM to 4:59 AM | 123 (12.9%) | 39 (5.0%) |
| 5:00 AM to 5:29 AM | 121 (12.7%) | 27 (3.5%) |
| 5:30 AM to 5:59 AM | 112 (11.8%) | 36 (4.6%) |
| 6:00 AM to 6:29 AM | 113 (11.9%) | 32 (4.1%) |
| 6:30 AM to 6:59 AM | 68 (7.1%) | 85 (10.9%) |
| 7:00 AM to 7:29 AM | 90 (9.5%) | 105 (13.4%) |
| 7:30 AM to 7:59 AM | 104 (10.9%) | 202 (25.8%) |
| 8:00 AM to 8:29 AM | 35 (3.7%) | 94 (12.0%) |
| 8:30 AM to 8:59 AM | 15 (1.6%) | 17 (2.2%) |
| 9:00 AM to 9:59 AM | 7 (0.7%) | 35 (4.5%) |
| 10:00 AM to 10:59 AM | 38 (4.0%) | 31 (4.0%) |
| 11:00 AM to 11:59 AM | 12 (1.3%) | 2 (0.3%) |
| 12:00 PM to 3:59 PM | 86 (9.0%) | 43 (5.5%) |
| 4:00 PM to 11:59 PM | 28 (2.9%) | 34 (4.3%) |
| Total | 952 (100.0%) | 782 (100.0%) |
Housing Occupancy in Florence County
Occupancy by Ownership in Florence County
Of the total 2,082 dwellings in Florence County, owner-occupied units account for 1,865 (89.6%), while renter-occupied units make up 217 (10.4%).
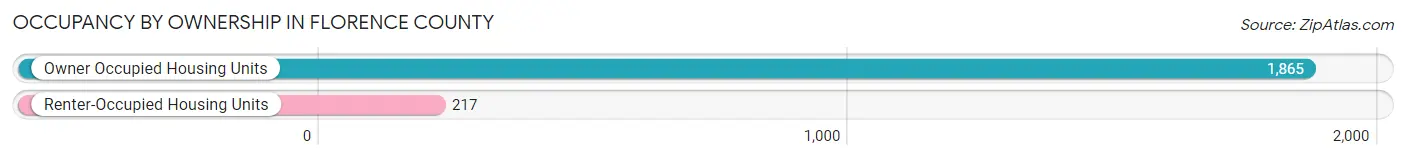
| Occupancy | # Housing Units | % Housing Units |
| Owner Occupied Housing Units | 1,865 | 89.6% |
| Renter-Occupied Housing Units | 217 | 10.4% |
| Total Occupied Housing Units | 2,082 | 100.0% |
Occupancy by Household Size in Florence County
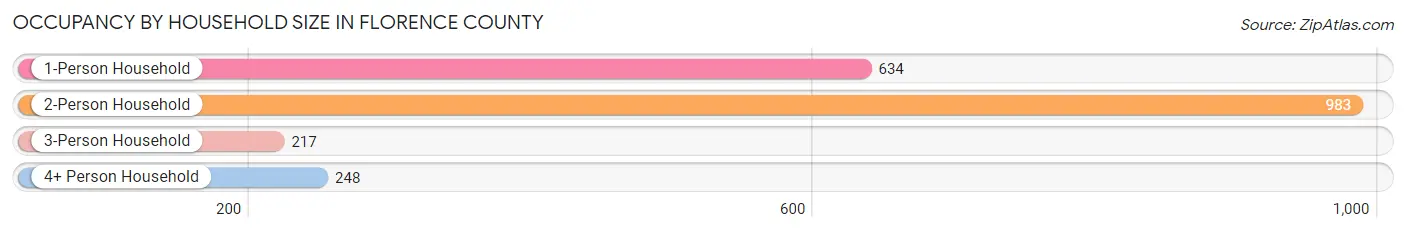
| Household Size | # Housing Units | % Housing Units |
| 1-Person Household | 634 | 30.4% |
| 2-Person Household | 983 | 47.2% |
| 3-Person Household | 217 | 10.4% |
| 4+ Person Household | 248 | 11.9% |
| Total Housing Units | 2,082 | 100.0% |
Occupancy by Ownership by Household Size in Florence County
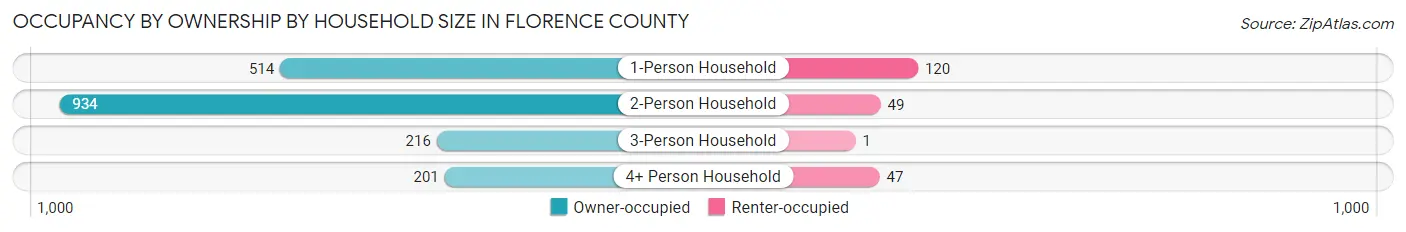
| Household Size | Owner-occupied | Renter-occupied |
| 1-Person Household | 514 (81.1%) | 120 (18.9%) |
| 2-Person Household | 934 (95.0%) | 49 (5.0%) |
| 3-Person Household | 216 (99.5%) | 1 (0.5%) |
| 4+ Person Household | 201 (81.0%) | 47 (19.0%) |
| Total Housing Units | 1,865 (89.6%) | 217 (10.4%) |
Occupancy by Educational Attainment in Florence County
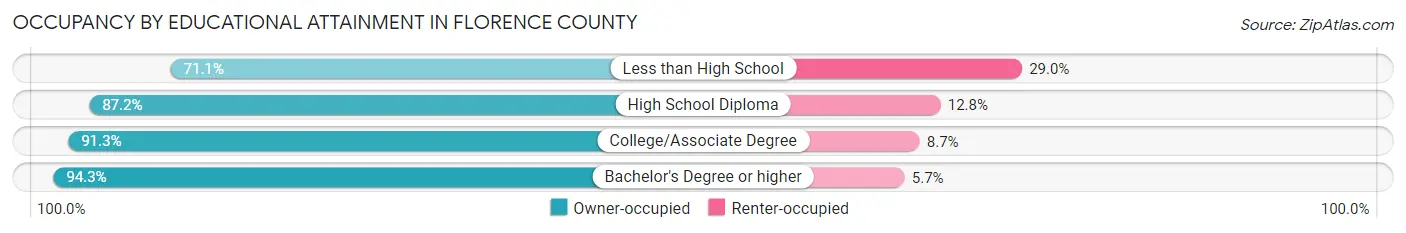
| Household Size | Owner-occupied | Renter-occupied |
| Less than High School | 81 (71.1%) | 33 (28.9%) |
| High School Diploma | 612 (87.2%) | 90 (12.8%) |
| College/Associate Degree | 675 (91.3%) | 64 (8.7%) |
| Bachelor's Degree or higher | 497 (94.3%) | 30 (5.7%) |
Occupancy by Age of Householder in Florence County
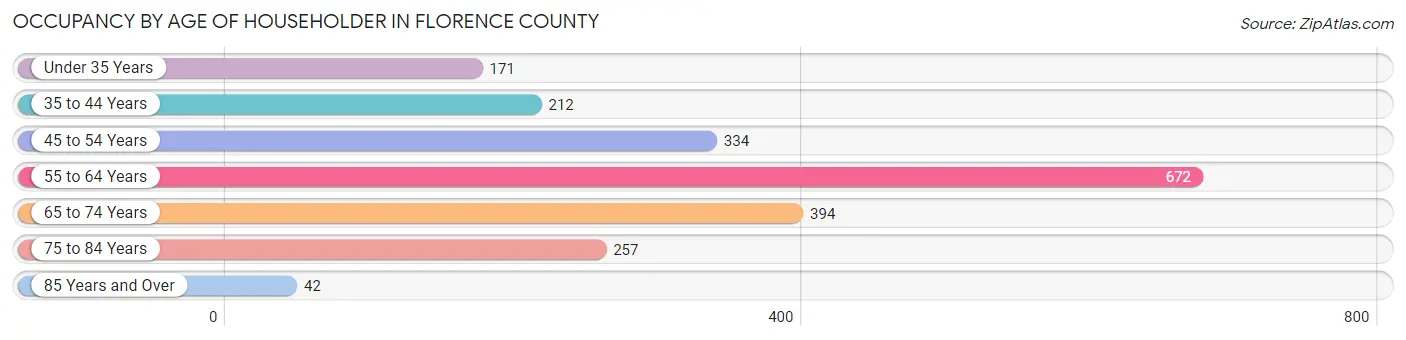
| Age Bracket | # Households | % Households |
| Under 35 Years | 171 | 8.2% |
| 35 to 44 Years | 212 | 10.2% |
| 45 to 54 Years | 334 | 16.0% |
| 55 to 64 Years | 672 | 32.3% |
| 65 to 74 Years | 394 | 18.9% |
| 75 to 84 Years | 257 | 12.3% |
| 85 Years and Over | 42 | 2.0% |
| Total | 2,082 | 100.0% |
Housing Finances in Florence County
Median Income by Occupancy in Florence County

| Occupancy Type | # Households | Median Income |
| Owner-Occupied | 1,865 (89.6%) | $60,944 |
| Renter-Occupied | 217 (10.4%) | $36,146 |
| Average | 2,082 (100.0%) | $58,049 |
Occupancy by Householder Income Bracket in Florence County
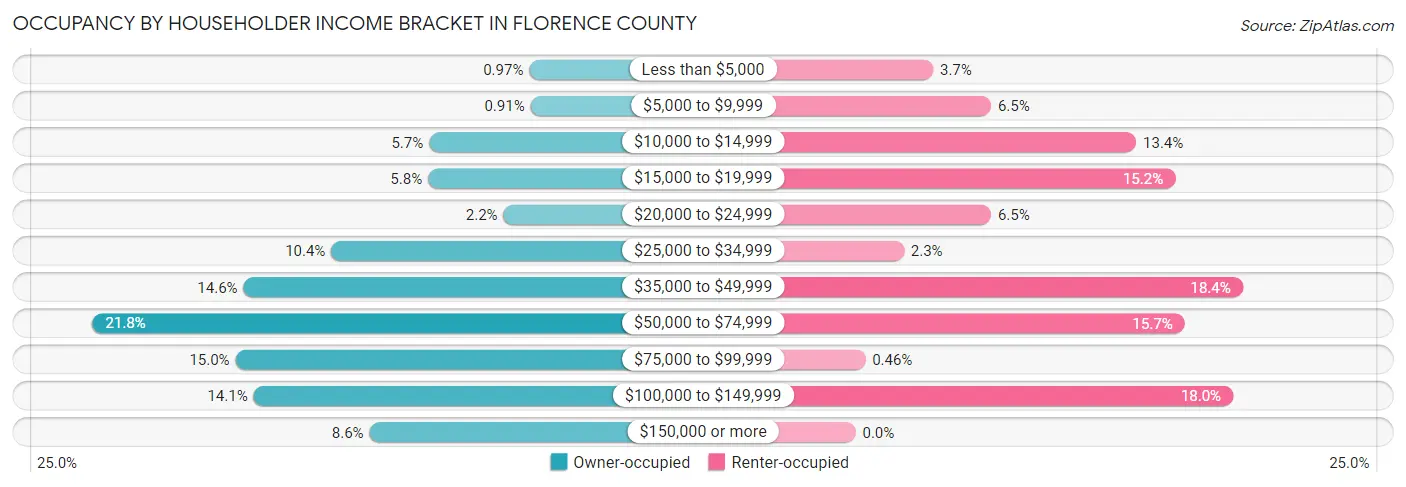
| Income Bracket | Owner-occupied | Renter-occupied |
| Less than $5,000 | 18 (1.0%) | 8 (3.7%) |
| $5,000 to $9,999 | 17 (0.9%) | 14 (6.5%) |
| $10,000 to $14,999 | 107 (5.7%) | 29 (13.4%) |
| $15,000 to $19,999 | 108 (5.8%) | 33 (15.2%) |
| $20,000 to $24,999 | 41 (2.2%) | 14 (6.5%) |
| $25,000 to $34,999 | 194 (10.4%) | 5 (2.3%) |
| $35,000 to $49,999 | 272 (14.6%) | 40 (18.4%) |
| $50,000 to $74,999 | 406 (21.8%) | 34 (15.7%) |
| $75,000 to $99,999 | 279 (15.0%) | 1 (0.5%) |
| $100,000 to $149,999 | 263 (14.1%) | 39 (18.0%) |
| $150,000 or more | 160 (8.6%) | 0 (0.0%) |
| Total | 1,865 (100.0%) | 217 (100.0%) |
Monthly Housing Cost Tiers in Florence County
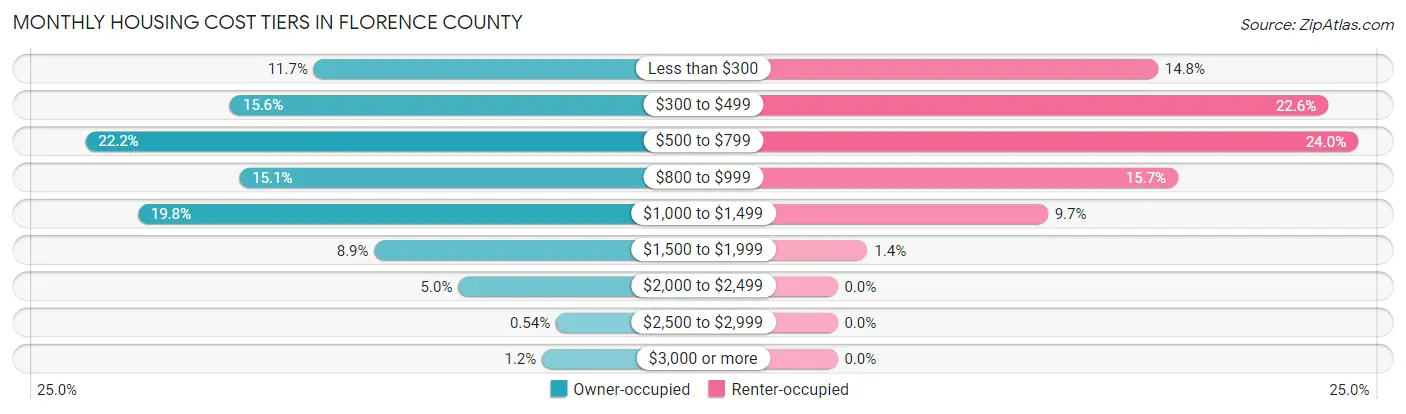
| Monthly Cost | Owner-occupied | Renter-occupied |
| Less than $300 | 218 (11.7%) | 32 (14.7%) |
| $300 to $499 | 290 (15.5%) | 49 (22.6%) |
| $500 to $799 | 414 (22.2%) | 52 (24.0%) |
| $800 to $999 | 282 (15.1%) | 34 (15.7%) |
| $1,000 to $1,499 | 369 (19.8%) | 21 (9.7%) |
| $1,500 to $1,999 | 166 (8.9%) | 3 (1.4%) |
| $2,000 to $2,499 | 94 (5.0%) | 0 (0.0%) |
| $2,500 to $2,999 | 10 (0.5%) | 0 (0.0%) |
| $3,000 or more | 22 (1.2%) | 0 (0.0%) |
| Total | 1,865 (100.0%) | 217 (100.0%) |
Physical Housing Characteristics in Florence County
Housing Structures in Florence County
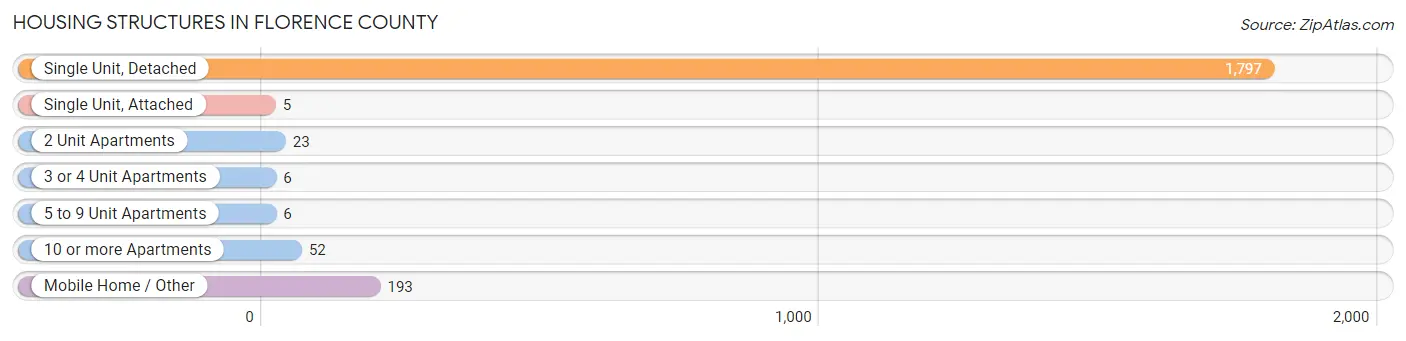
| Structure Type | # Housing Units | % Housing Units |
| Single Unit, Detached | 1,797 | 86.3% |
| Single Unit, Attached | 5 | 0.2% |
| 2 Unit Apartments | 23 | 1.1% |
| 3 or 4 Unit Apartments | 6 | 0.3% |
| 5 to 9 Unit Apartments | 6 | 0.3% |
| 10 or more Apartments | 52 | 2.5% |
| Mobile Home / Other | 193 | 9.3% |
| Total | 2,082 | 100.0% |
Housing Structures by Occupancy in Florence County
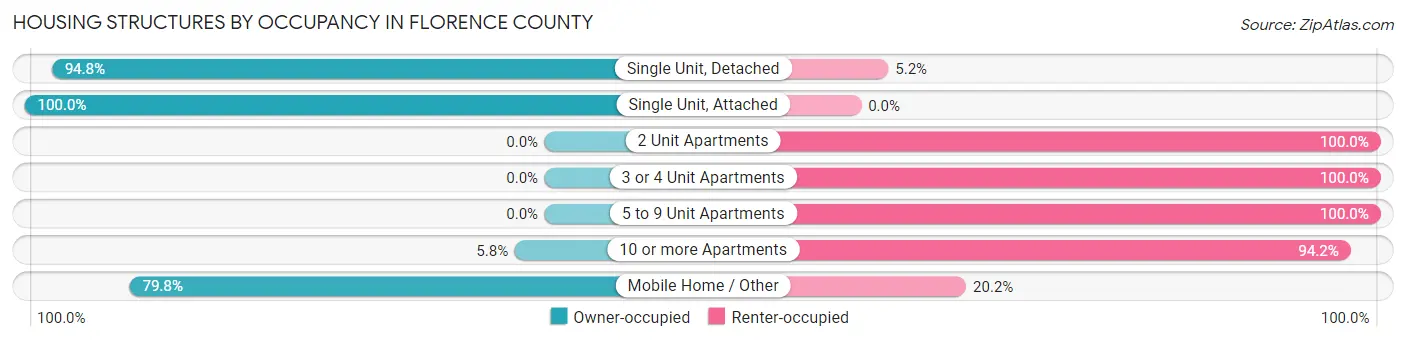
| Structure Type | Owner-occupied | Renter-occupied |
| Single Unit, Detached | 1,703 (94.8%) | 94 (5.2%) |
| Single Unit, Attached | 5 (100.0%) | 0 (0.0%) |
| 2 Unit Apartments | 0 (0.0%) | 23 (100.0%) |
| 3 or 4 Unit Apartments | 0 (0.0%) | 6 (100.0%) |
| 5 to 9 Unit Apartments | 0 (0.0%) | 6 (100.0%) |
| 10 or more Apartments | 3 (5.8%) | 49 (94.2%) |
| Mobile Home / Other | 154 (79.8%) | 39 (20.2%) |
| Total | 1,865 (89.6%) | 217 (10.4%) |
Housing Structures by Number of Rooms in Florence County
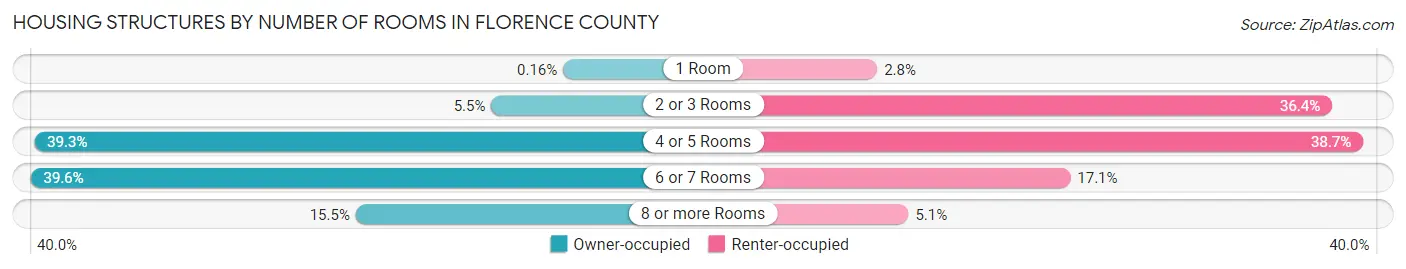
| Number of Rooms | Owner-occupied | Renter-occupied |
| 1 Room | 3 (0.2%) | 6 (2.8%) |
| 2 or 3 Rooms | 102 (5.5%) | 79 (36.4%) |
| 4 or 5 Rooms | 733 (39.3%) | 84 (38.7%) |
| 6 or 7 Rooms | 738 (39.6%) | 37 (17.1%) |
| 8 or more Rooms | 289 (15.5%) | 11 (5.1%) |
| Total | 1,865 (100.0%) | 217 (100.0%) |
Housing Structure by Heating Type in Florence County
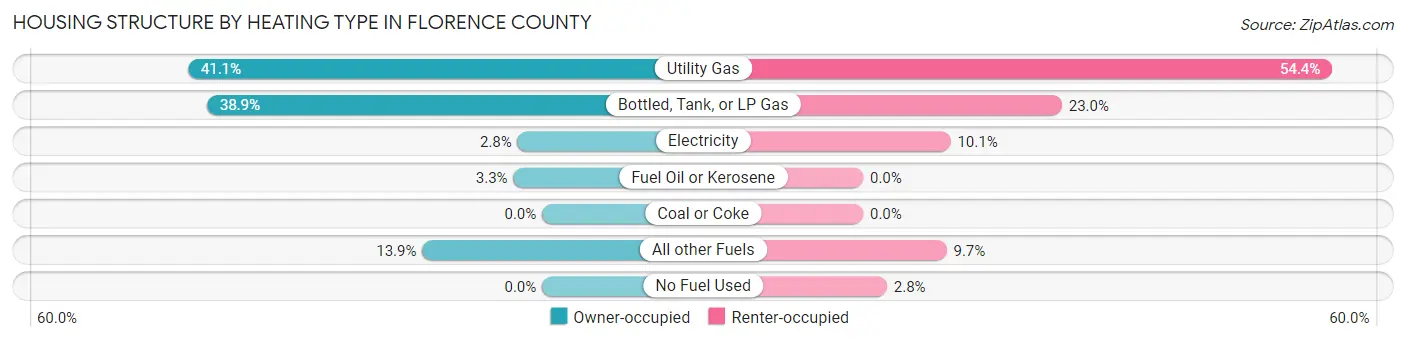
| Heating Type | Owner-occupied | Renter-occupied |
| Utility Gas | 766 (41.1%) | 118 (54.4%) |
| Bottled, Tank, or LP Gas | 725 (38.9%) | 50 (23.0%) |
| Electricity | 53 (2.8%) | 22 (10.1%) |
| Fuel Oil or Kerosene | 62 (3.3%) | 0 (0.0%) |
| Coal or Coke | 0 (0.0%) | 0 (0.0%) |
| All other Fuels | 259 (13.9%) | 21 (9.7%) |
| No Fuel Used | 0 (0.0%) | 6 (2.8%) |
| Total | 1,865 (100.0%) | 217 (100.0%) |
Household Vehicle Usage in Florence County
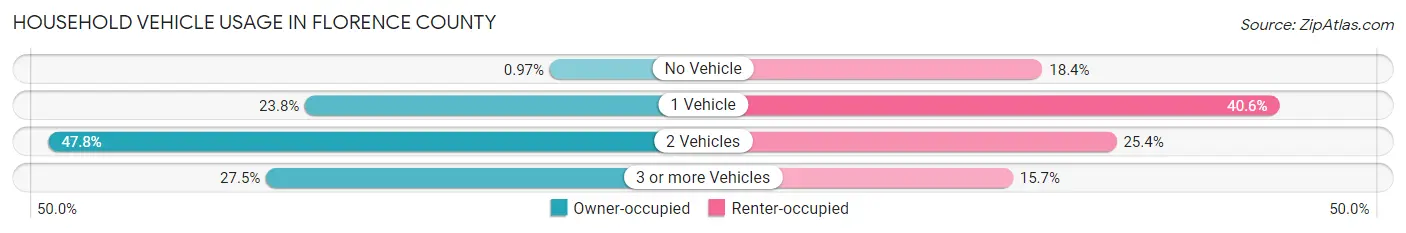
| Vehicles per Household | Owner-occupied | Renter-occupied |
| No Vehicle | 18 (1.0%) | 40 (18.4%) |
| 1 Vehicle | 444 (23.8%) | 88 (40.6%) |
| 2 Vehicles | 891 (47.8%) | 55 (25.4%) |
| 3 or more Vehicles | 512 (27.5%) | 34 (15.7%) |
| Total | 1,865 (100.0%) | 217 (100.0%) |
Real Estate & Mortgages in Florence County
Real Estate and Mortgage Overview in Florence County
| Characteristic | Without Mortgage | With Mortgage |
| Housing Units | 1,017 | 848 |
| Median Property Value | $143,800 | $167,000 |
| Median Household Income | $54,954 | $86 |
| Monthly Housing Costs | $508 | $17 |
| Real Estate Taxes | $1,982 | $16 |
Property Value by Mortgage Status in Florence County
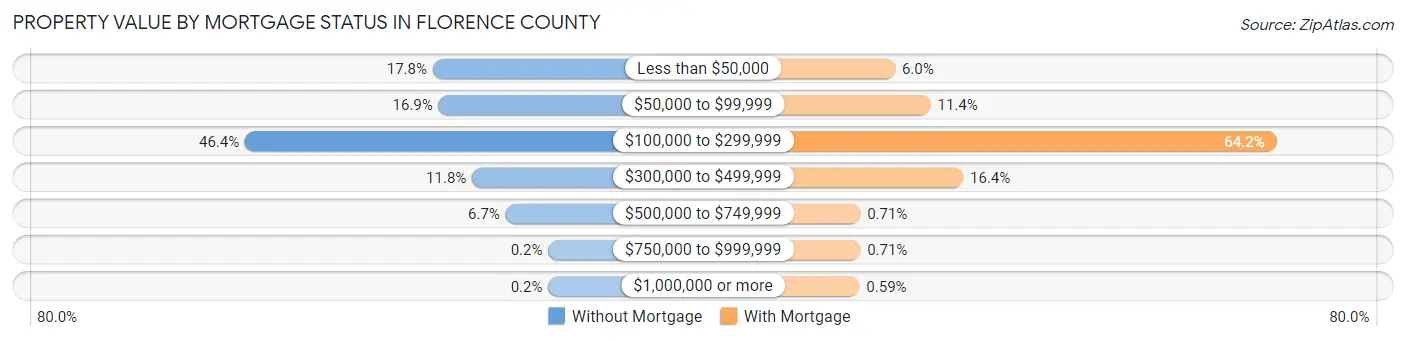
| Property Value | Without Mortgage | With Mortgage |
| Less than $50,000 | 181 (17.8%) | 51 (6.0%) |
| $50,000 to $99,999 | 172 (16.9%) | 97 (11.4%) |
| $100,000 to $299,999 | 472 (46.4%) | 544 (64.1%) |
| $300,000 to $499,999 | 120 (11.8%) | 139 (16.4%) |
| $500,000 to $749,999 | 68 (6.7%) | 6 (0.7%) |
| $750,000 to $999,999 | 2 (0.2%) | 6 (0.7%) |
| $1,000,000 or more | 2 (0.2%) | 5 (0.6%) |
| Total | 1,017 (100.0%) | 848 (100.0%) |
Household Income by Mortgage Status in Florence County
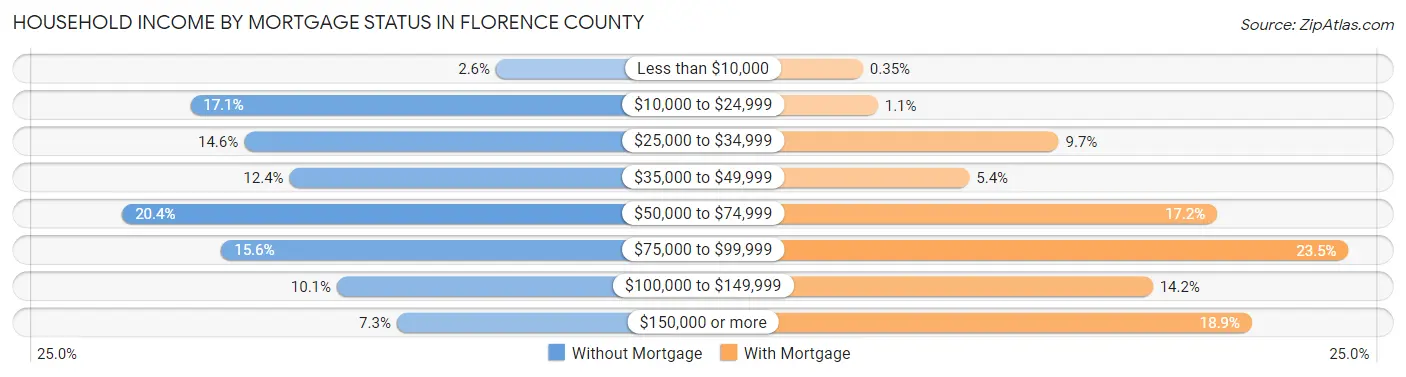
| Household Income | Without Mortgage | With Mortgage |
| Less than $10,000 | 26 (2.6%) | 3 (0.4%) |
| $10,000 to $24,999 | 174 (17.1%) | 9 (1.1%) |
| $25,000 to $34,999 | 148 (14.5%) | 82 (9.7%) |
| $35,000 to $49,999 | 126 (12.4%) | 46 (5.4%) |
| $50,000 to $74,999 | 207 (20.3%) | 146 (17.2%) |
| $75,000 to $99,999 | 159 (15.6%) | 199 (23.5%) |
| $100,000 to $149,999 | 103 (10.1%) | 120 (14.1%) |
| $150,000 or more | 74 (7.3%) | 160 (18.9%) |
| Total | 1,017 (100.0%) | 848 (100.0%) |
Property Value to Household Income Ratio in Florence County
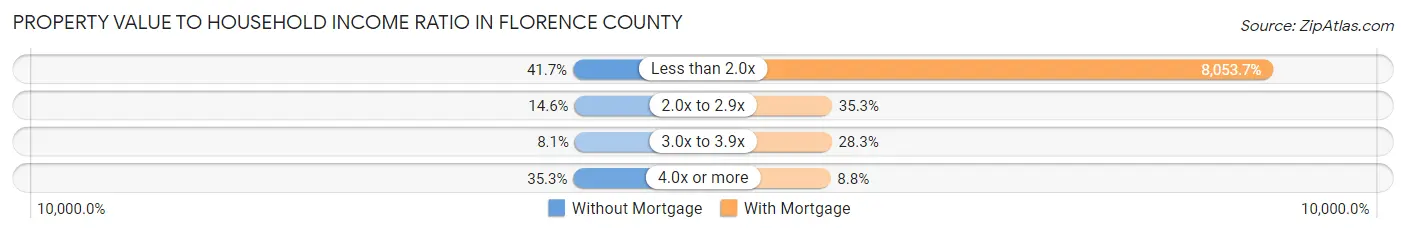
| Value-to-Income Ratio | Without Mortgage | With Mortgage |
| Less than 2.0x | 424 (41.7%) | 68,295 (8,053.7%) |
| 2.0x to 2.9x | 148 (14.5%) | 299 (35.3%) |
| 3.0x to 3.9x | 82 (8.1%) | 240 (28.3%) |
| 4.0x or more | 359 (35.3%) | 75 (8.8%) |
| Total | 1,017 (100.0%) | 848 (100.0%) |
Real Estate Taxes by Mortgage Status in Florence County
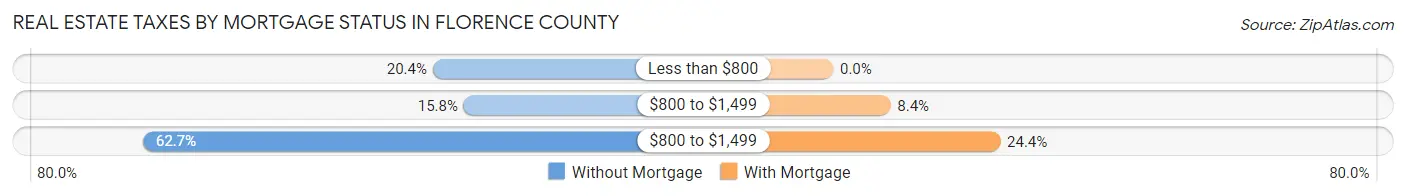
| Property Taxes | Without Mortgage | With Mortgage |
| Less than $800 | 207 (20.3%) | 0 (0.0%) |
| $800 to $1,499 | 161 (15.8%) | 71 (8.4%) |
| $800 to $1,499 | 638 (62.7%) | 207 (24.4%) |
| Total | 1,017 (100.0%) | 848 (100.0%) |
Health & Disability in Florence County
Health Insurance Coverage by Age in Florence County
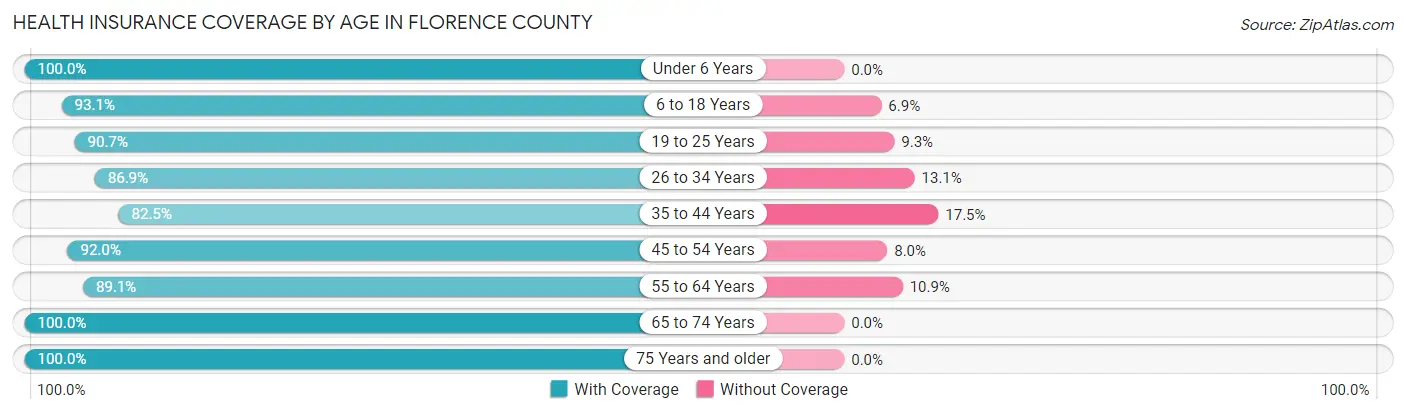
| Age Bracket | With Coverage | Without Coverage |
| Under 6 Years | 189 (100.0%) | 0 (0.0%) |
| 6 to 18 Years | 538 (93.1%) | 40 (6.9%) |
| 19 to 25 Years | 204 (90.7%) | 21 (9.3%) |
| 26 to 34 Years | 285 (86.9%) | 43 (13.1%) |
| 35 to 44 Years | 376 (82.5%) | 80 (17.5%) |
| 45 to 54 Years | 516 (92.0%) | 45 (8.0%) |
| 55 to 64 Years | 884 (89.1%) | 108 (10.9%) |
| 65 to 74 Years | 749 (100.0%) | 0 (0.0%) |
| 75 Years and older | 437 (100.0%) | 0 (0.0%) |
| Total | 4,178 (92.5%) | 337 (7.5%) |
Health Insurance Coverage by Citizenship Status in Florence County
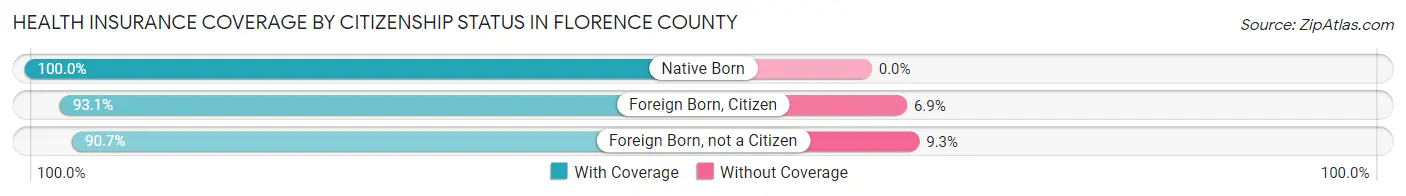
| Citizenship Status | With Coverage | Without Coverage |
| Native Born | 189 (100.0%) | 0 (0.0%) |
| Foreign Born, Citizen | 538 (93.1%) | 40 (6.9%) |
| Foreign Born, not a Citizen | 204 (90.7%) | 21 (9.3%) |
Health Insurance Coverage by Household Income in Florence County
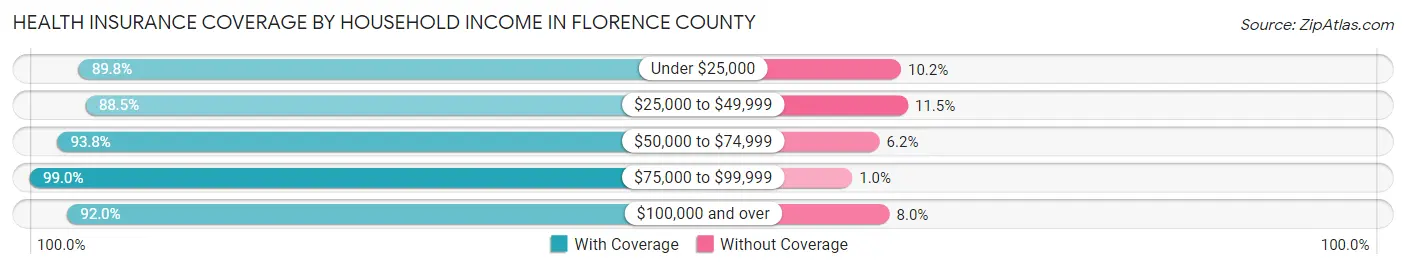
| Household Income | With Coverage | Without Coverage |
| Under $25,000 | 495 (89.8%) | 56 (10.2%) |
| $25,000 to $49,999 | 764 (88.5%) | 99 (11.5%) |
| $50,000 to $74,999 | 959 (93.8%) | 63 (6.2%) |
| $75,000 to $99,999 | 675 (99.0%) | 7 (1.0%) |
| $100,000 and over | 1,285 (92.0%) | 112 (8.0%) |
Public vs Private Health Insurance Coverage by Age in Florence County
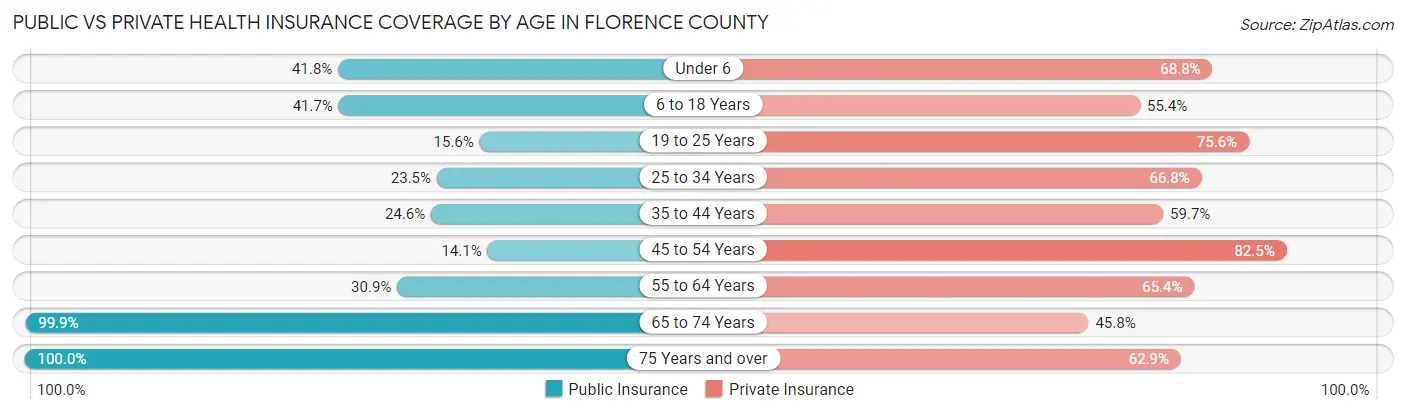
| Age Bracket | Public Insurance | Private Insurance |
| Under 6 | 79 (41.8%) | 130 (68.8%) |
| 6 to 18 Years | 241 (41.7%) | 320 (55.4%) |
| 19 to 25 Years | 35 (15.6%) | 170 (75.6%) |
| 25 to 34 Years | 77 (23.5%) | 219 (66.8%) |
| 35 to 44 Years | 112 (24.6%) | 272 (59.7%) |
| 45 to 54 Years | 79 (14.1%) | 463 (82.5%) |
| 55 to 64 Years | 306 (30.8%) | 649 (65.4%) |
| 65 to 74 Years | 748 (99.9%) | 343 (45.8%) |
| 75 Years and over | 437 (100.0%) | 275 (62.9%) |
| Total | 2,114 (46.8%) | 2,841 (62.9%) |
Disability Status by Sex by Age in Florence County
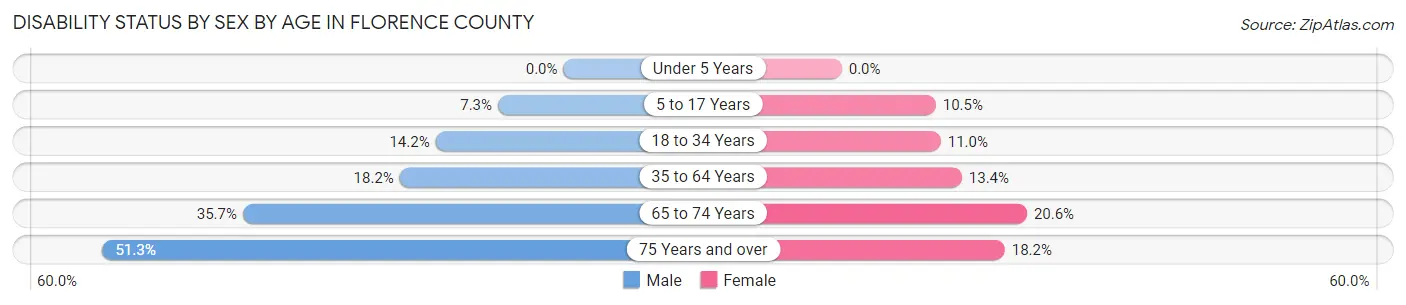
| Age Bracket | Male | Female |
| Under 5 Years | 0 (0.0%) | 0 (0.0%) |
| 5 to 17 Years | 21 (7.3%) | 27 (10.5%) |
| 18 to 34 Years | 44 (14.2%) | 32 (11.0%) |
| 35 to 64 Years | 189 (18.2%) | 130 (13.4%) |
| 65 to 74 Years | 141 (35.7%) | 73 (20.6%) |
| 75 Years and over | 97 (51.3%) | 45 (18.1%) |
Disability Class by Sex by Age in Florence County
Disability Class: Hearing Difficulty
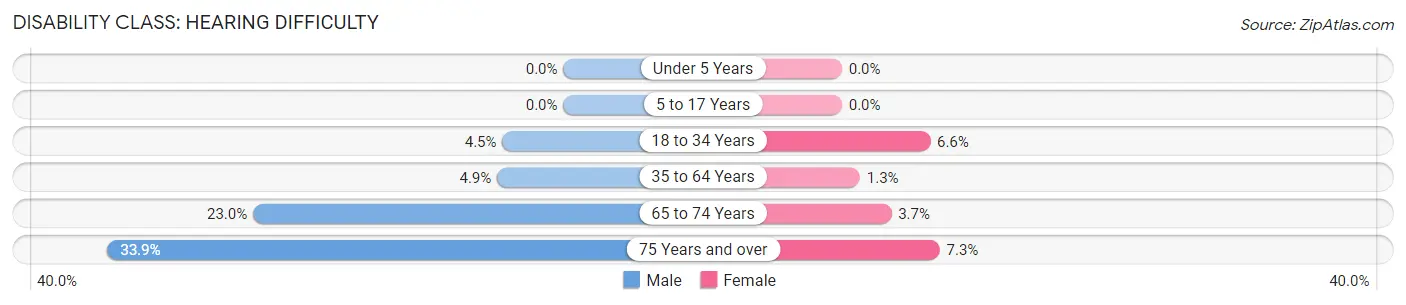
| Age Bracket | Male | Female |
| Under 5 Years | 0 (0.0%) | 0 (0.0%) |
| 5 to 17 Years | 0 (0.0%) | 0 (0.0%) |
| 18 to 34 Years | 14 (4.5%) | 19 (6.6%) |
| 35 to 64 Years | 51 (4.9%) | 13 (1.3%) |
| 65 to 74 Years | 91 (23.0%) | 13 (3.7%) |
| 75 Years and over | 64 (33.9%) | 18 (7.3%) |
Disability Class: Vision Difficulty
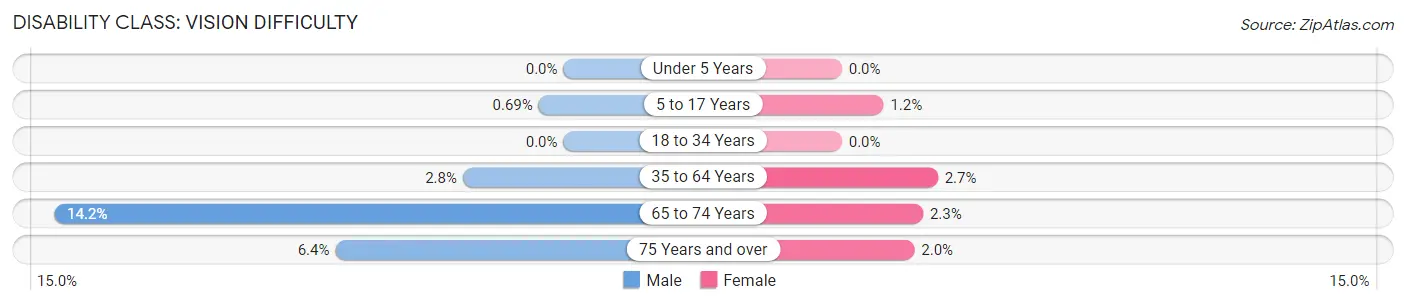
| Age Bracket | Male | Female |
| Under 5 Years | 0 (0.0%) | 0 (0.0%) |
| 5 to 17 Years | 2 (0.7%) | 3 (1.2%) |
| 18 to 34 Years | 0 (0.0%) | 0 (0.0%) |
| 35 to 64 Years | 29 (2.8%) | 26 (2.7%) |
| 65 to 74 Years | 56 (14.2%) | 8 (2.3%) |
| 75 Years and over | 12 (6.4%) | 5 (2.0%) |
Disability Class: Cognitive Difficulty
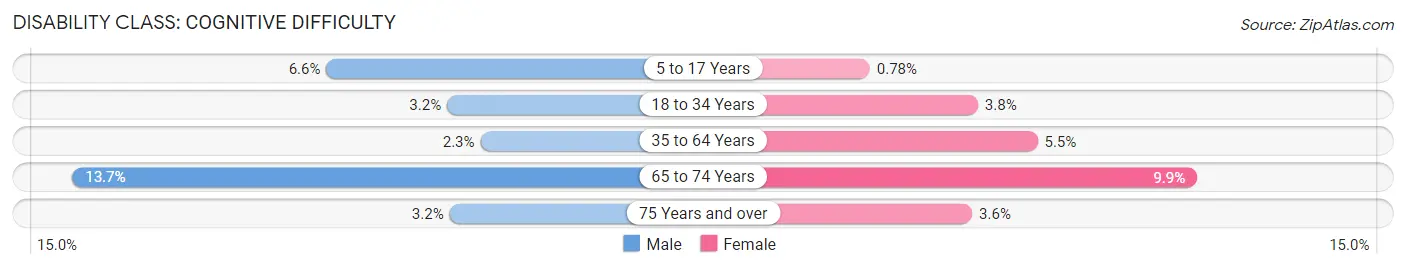
| Age Bracket | Male | Female |
| 5 to 17 Years | 19 (6.6%) | 2 (0.8%) |
| 18 to 34 Years | 10 (3.2%) | 11 (3.8%) |
| 35 to 64 Years | 24 (2.3%) | 53 (5.4%) |
| 65 to 74 Years | 54 (13.7%) | 35 (9.9%) |
| 75 Years and over | 6 (3.2%) | 9 (3.6%) |
Disability Class: Ambulatory Difficulty
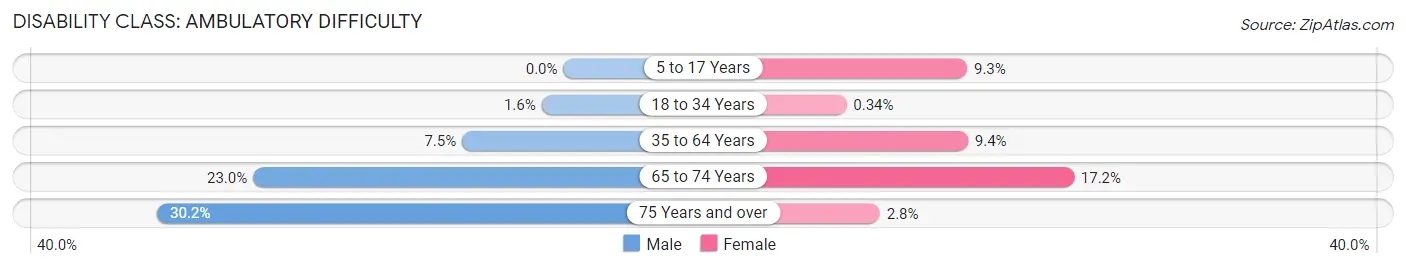
| Age Bracket | Male | Female |
| 5 to 17 Years | 0 (0.0%) | 24 (9.3%) |
| 18 to 34 Years | 5 (1.6%) | 1 (0.3%) |
| 35 to 64 Years | 78 (7.5%) | 91 (9.4%) |
| 65 to 74 Years | 91 (23.0%) | 61 (17.2%) |
| 75 Years and over | 57 (30.2%) | 7 (2.8%) |
Disability Class: Self-Care Difficulty
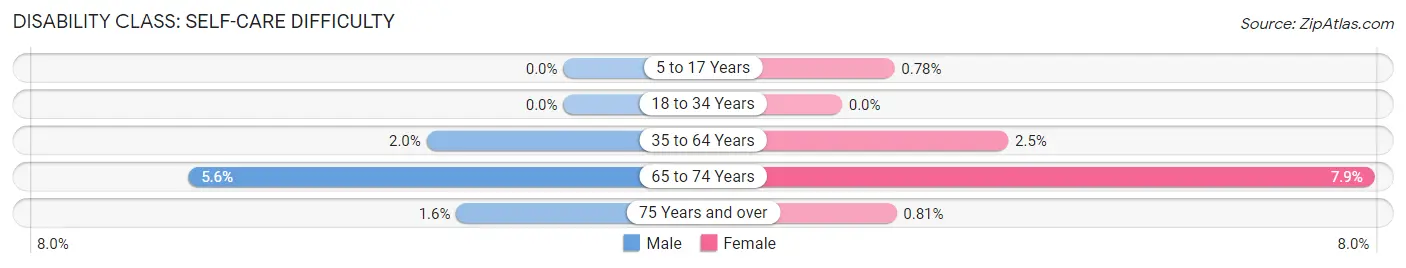
| Age Bracket | Male | Female |
| 5 to 17 Years | 0 (0.0%) | 2 (0.8%) |
| 18 to 34 Years | 0 (0.0%) | 0 (0.0%) |
| 35 to 64 Years | 21 (2.0%) | 24 (2.5%) |
| 65 to 74 Years | 22 (5.6%) | 28 (7.9%) |
| 75 Years and over | 3 (1.6%) | 2 (0.8%) |
Technology Access in Florence County
Computing Device Access in Florence County

| Device Type | # Households | % Households |
| Desktop or Laptop | 1,546 | 74.3% |
| Smartphone | 1,678 | 80.6% |
| Tablet | 1,167 | 56.0% |
| No Computing Device | 165 | 7.9% |
| Total | 2,082 | 100.0% |
Internet Access in Florence County
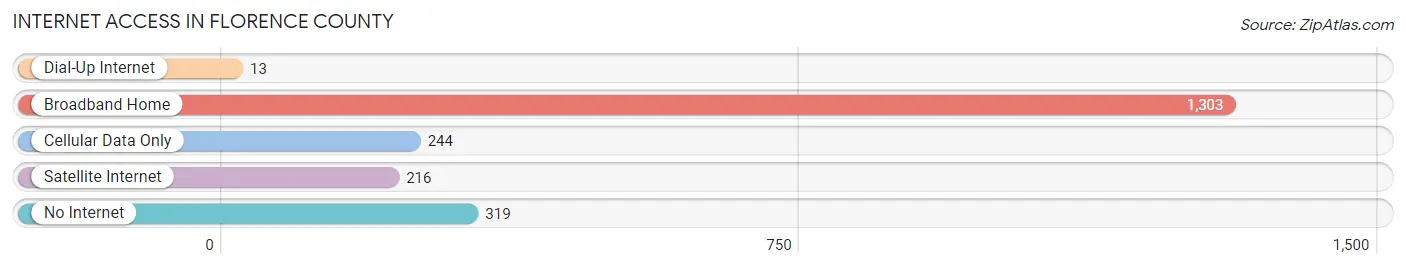
| Internet Type | # Households | % Households |
| Dial-Up Internet | 13 | 0.6% |
| Broadband Home | 1,303 | 62.6% |
| Cellular Data Only | 244 | 11.7% |
| Satellite Internet | 216 | 10.4% |
| No Internet | 319 | 15.3% |
| Total | 2,082 | 100.0% |
Florence County Summary
Florence County, Wisconsin is located in the north-central part of the state, and is bordered by Marinette County to the north, Forest County to the east, Oconto County to the south, and Langlade County to the west. The county seat is Florence, and the county has a total area of 590 square miles, of which 586 square miles is land and 4 square miles is water. As of the 2010 census, the population of Florence County was 4,423, making it the least populous county in Wisconsin.
History
Florence County was created in 1882 from parts of Marinette and Oconto counties. The county was named after Florence, the daughter of Governor William E. Smith. The first settlers in the area were lumberjacks, who arrived in the late 1800s to take advantage of the abundant timber resources. The county was largely rural until the 1950s, when the construction of the Florence Dam on the Menominee River brought an influx of people to the area.
Geography
Florence County is located in the north-central part of Wisconsin, and is bordered by Marinette County to the north, Forest County to the east, Oconto County to the south, and Langlade County to the west. The county has a total area of 590 square miles, of which 586 square miles is land and 4 square miles is water. The county is mostly forested, with the majority of the land being used for logging and recreation. The highest point in the county is the summit of the Florence Dam, which is 1,845 feet above sea level.
The Menominee River runs through the county, and is the main source of water for the area. The river is used for fishing, boating, and other recreational activities. The county also contains several lakes, including Big and Little Rice Lakes, and the Florence Flowage.
Economy
The economy of Florence County is largely based on forestry and tourism. The county is home to several logging companies, which harvest timber from the area's forests. The timber is then processed and sold to lumber mills and other wood-related industries.
Tourism is also an important part of the county's economy. The Florence Dam and the surrounding area attract visitors from all over the state and beyond. The county also has several campgrounds, resorts, and other recreational facilities.
Demographics
As of the 2010 census, the population of Florence County was 4,423, making it the least populous county in Wisconsin. The population is spread out, with the largest population centers being the towns of Florence and Fence. The racial makeup of the county is 97.3% White, 0.3% African American, 0.7% Native American, 0.2% Asian, 0.1% Pacific Islander, 0.3% from other races, and 1.2% from two or more races.
The median household income in Florence County is $37,917, and the median family income is $45,938. The per capita income is $20,845. The unemployment rate is 6.2%. The poverty rate is 11.3%.
Common Questions
What is the Total Population of Florence County?
Total Population of Florence County is 4,574.
What is the Total Male Population of Florence County?
Total Male Population of Florence County is 2,337.
What is the Total Female Population of Florence County?
Total Female Population of Florence County is 2,237.
What is the Ratio of Males per 100 Females in Florence County?
There are 104.47 Males per 100 Females in Florence County.
What is the Ratio of Females per 100 Males in Florence County?
There are 95.72 Females per 100 Males in Florence County.
What is the Median Population Age in Florence County?
Median Population Age in Florence County is 54.1 Years.
What is the Average Family Size in Florence County
Average Family Size in Florence County is 2.7 People.
What is the Average Household Size in Florence County
Average Household Size in Florence County is 2.2 People.
What is Per Capita Income in Florence County?
Per Capita income in Florence County is $36,746.
What is the Median Family Income in Florence County?
Median Family Income in Florence County is $71,444.
What is the Median Household income in Florence County?
Median Household Income in Florence County is $58,049.
What is Income or Wage Gap in Florence County?
Income or Wage Gap in Florence County is 39.8%.
Women in Florence County earn 60.2 cents for every dollar earned by a man.
What is Family Income Deficit in Florence County?
Family Income Deficit in Florence County is $10,422.
Families that are below poverty line in Florence County earn $10,422 less on average than the poverty threshold level.
What is Inequality or Gini Index in Florence County?
Inequality or Gini Index in Florence County is 0.44.
How Large is the Labor Force in Florence County?
There are 2,088 People in the Labor Forcein in Florence County.
What is the Percentage of People in the Labor Force in Florence County?
53.1% of People are in the Labor Force in Florence County.
What is the Unemployment Rate in Florence County?
Unemployment Rate in Florence County is 6.0%.