Eau Claire County, WI
Eau Claire County Map
Eau Claire County Overview
105,697
TOTAL POPULATION
52,562
MALE POPULATION
53,135
FEMALE POPULATION
98.92
MALES / 100 FEMALES
101.09
FEMALES / 100 MALES
35.5
MEDIAN AGE
3.0
AVG FAMILY SIZE
2.4
AVG HOUSEHOLD SIZE
$38,529
PER CAPITA INCOME
$98,103
AVG FAMILY INCOME
$70,127
AVG HOUSEHOLD INCOME
33.3%
WAGE / INCOME GAP [ % ]
66.7¢/ $1
WAGE / INCOME GAP [ $ ]
$10,359
FAMILY INCOME DEFICIT
0.44
INEQUALITY / GINI INDEX
59,944
LABOR FORCE [ PEOPLE ]
68.9%
PERCENT IN LABOR FORCE
3.2%
UNEMPLOYMENT RATE
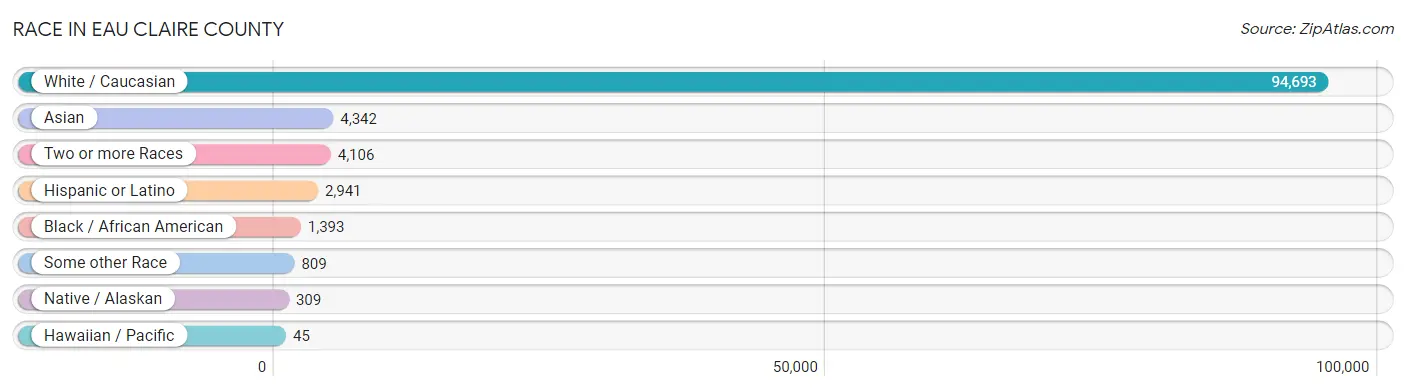
Race in Eau Claire County
The most populous races in Eau Claire County are White / Caucasian (94,693 | 89.6%), Asian (4,342 | 4.1%), and Two or more Races (4,106 | 3.9%).
| Race | # Population | % Population |
| Asian | 4,342 | 4.1% |
| Black / African American | 1,393 | 1.3% |
| Hawaiian / Pacific | 45 | 0.0% |
| Hispanic or Latino | 2,941 | 2.8% |
| Native / Alaskan | 309 | 0.3% |
| White / Caucasian | 94,693 | 89.6% |
| Two or more Races | 4,106 | 3.9% |
| Some other Race | 809 | 0.8% |
| Total | 105,697 | 100.0% |
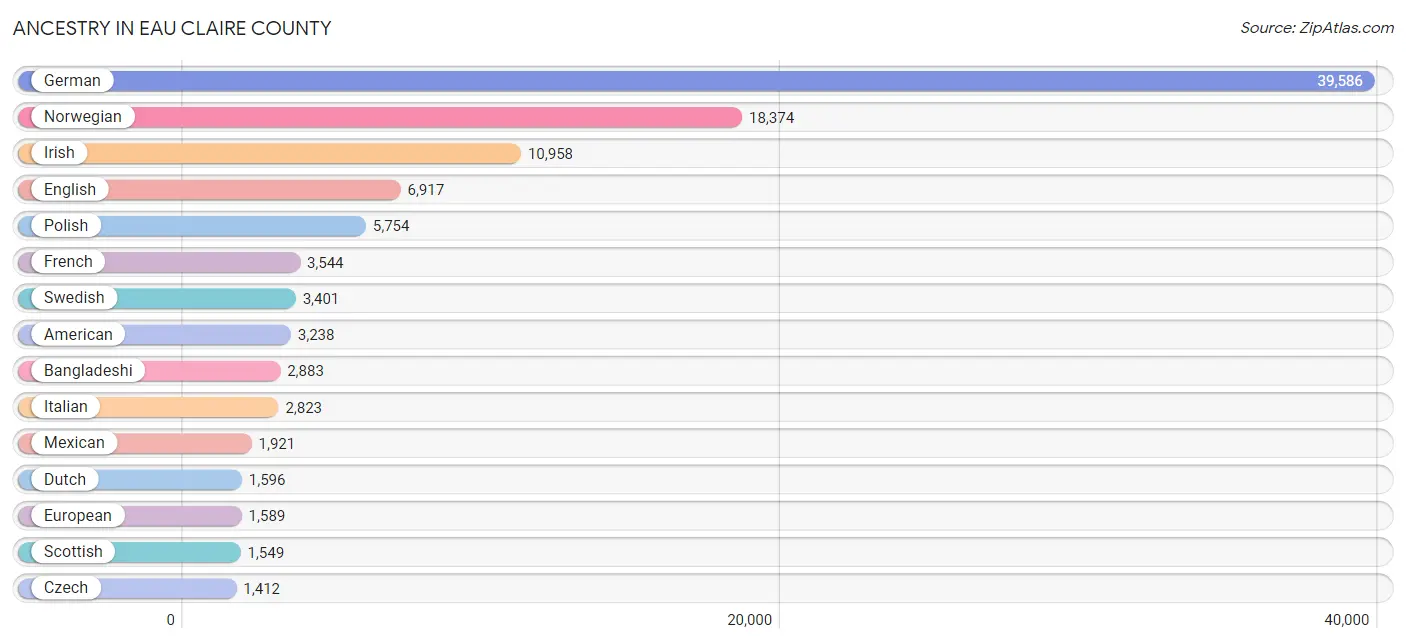
Ancestry in Eau Claire County
The most populous ancestries reported in Eau Claire County are German (39,586 | 37.4%), Norwegian (18,374 | 17.4%), Irish (10,958 | 10.4%), English (6,917 | 6.5%), and Polish (5,754 | 5.4%), together accounting for 77.2% of all Eau Claire County residents.
| Ancestry | # Population | % Population |
| Afghan | 4 | 0.0% |
| African | 42 | 0.0% |
| Albanian | 4 | 0.0% |
| Alsatian | 12 | 0.0% |
| American | 3,238 | 3.1% |
| Arab | 98 | 0.1% |
| Armenian | 61 | 0.1% |
| Australian | 35 | 0.0% |
| Austrian | 636 | 0.6% |
| Bangladeshi | 2,883 | 2.7% |
| Belgian | 243 | 0.2% |
| Bhutanese | 140 | 0.1% |
| Brazilian | 46 | 0.0% |
| British | 346 | 0.3% |
| Burmese | 368 | 0.4% |
| Canadian | 132 | 0.1% |
| Central American | 286 | 0.3% |
| Cherokee | 194 | 0.2% |
| Chippewa | 247 | 0.2% |
| Colombian | 26 | 0.0% |
| Costa Rican | 4 | 0.0% |
| Creek | 20 | 0.0% |
| Croatian | 101 | 0.1% |
| Cuban | 100 | 0.1% |
| Czech | 1,412 | 1.3% |
| Czechoslovakian | 230 | 0.2% |
| Danish | 466 | 0.4% |
| Dominican | 4 | 0.0% |
| Dutch | 1,596 | 1.5% |
| Eastern European | 128 | 0.1% |
| English | 6,917 | 6.5% |
| Ethiopian | 6 | 0.0% |
| European | 1,589 | 1.5% |
| Filipino | 16 | 0.0% |
| Finnish | 660 | 0.6% |
| French | 3,544 | 3.4% |
| French American Indian | 14 | 0.0% |
| French Canadian | 1,148 | 1.1% |
| German | 39,586 | 37.4% |
| German Russian | 4 | 0.0% |
| Greek | 216 | 0.2% |
| Guamanian / Chamorro | 11 | 0.0% |
| Guatemalan | 7 | 0.0% |
| Haitian | 5 | 0.0% |
| Honduran | 28 | 0.0% |
| Hungarian | 295 | 0.3% |
| Icelander | 115 | 0.1% |
| Indian (Asian) | 334 | 0.3% |
| Iranian | 96 | 0.1% |
| Irish | 10,958 | 10.4% |
| Iroquois | 51 | 0.1% |
| Italian | 2,823 | 2.7% |
| Jamaican | 30 | 0.0% |
| Japanese | 48 | 0.1% |
| Kenyan | 53 | 0.1% |
| Korean | 597 | 0.6% |
| Laotian | 4 | 0.0% |
| Latvian | 33 | 0.0% |
| Lebanese | 14 | 0.0% |
| Lithuanian | 280 | 0.3% |
| Luxembourger | 27 | 0.0% |
| Malaysian | 153 | 0.1% |
| Maltese | 30 | 0.0% |
| Menominee | 81 | 0.1% |
| Mexican | 1,921 | 1.8% |
| Mexican American Indian | 17 | 0.0% |
| Mongolian | 146 | 0.1% |
| Native Hawaiian | 56 | 0.1% |
| Nicaraguan | 91 | 0.1% |
| Nigerian | 17 | 0.0% |
| Northern European | 179 | 0.2% |
| Norwegian | 18,374 | 17.4% |
| Palestinian | 60 | 0.1% |
| Panamanian | 44 | 0.0% |
| Pennsylvania German | 82 | 0.1% |
| Peruvian | 19 | 0.0% |
| Polish | 5,754 | 5.4% |
| Portuguese | 250 | 0.2% |
| Puerto Rican | 312 | 0.3% |
| Romanian | 22 | 0.0% |
| Russian | 265 | 0.3% |
| Salvadoran | 112 | 0.1% |
| Scandinavian | 907 | 0.9% |
| Scotch-Irish | 365 | 0.4% |
| Scottish | 1,549 | 1.5% |
| Serbian | 16 | 0.0% |
| Sioux | 56 | 0.1% |
| Slavic | 132 | 0.1% |
| Slovak | 94 | 0.1% |
| Slovene | 61 | 0.1% |
| Somali | 24 | 0.0% |
| South American | 64 | 0.1% |
| Spaniard | 18 | 0.0% |
| Spanish | 111 | 0.1% |
| Sri Lankan | 249 | 0.2% |
| Subsaharan African | 164 | 0.2% |
| Swedish | 3,401 | 3.2% |
| Swiss | 712 | 0.7% |
| Syrian | 32 | 0.0% |
| Thai | 391 | 0.4% |
| Turkish | 42 | 0.0% |
| Ukrainian | 106 | 0.1% |
| Venezuelan | 19 | 0.0% |
| Welsh | 698 | 0.7% |
| Yugoslavian | 70 | 0.1% | View All 105 Rows |
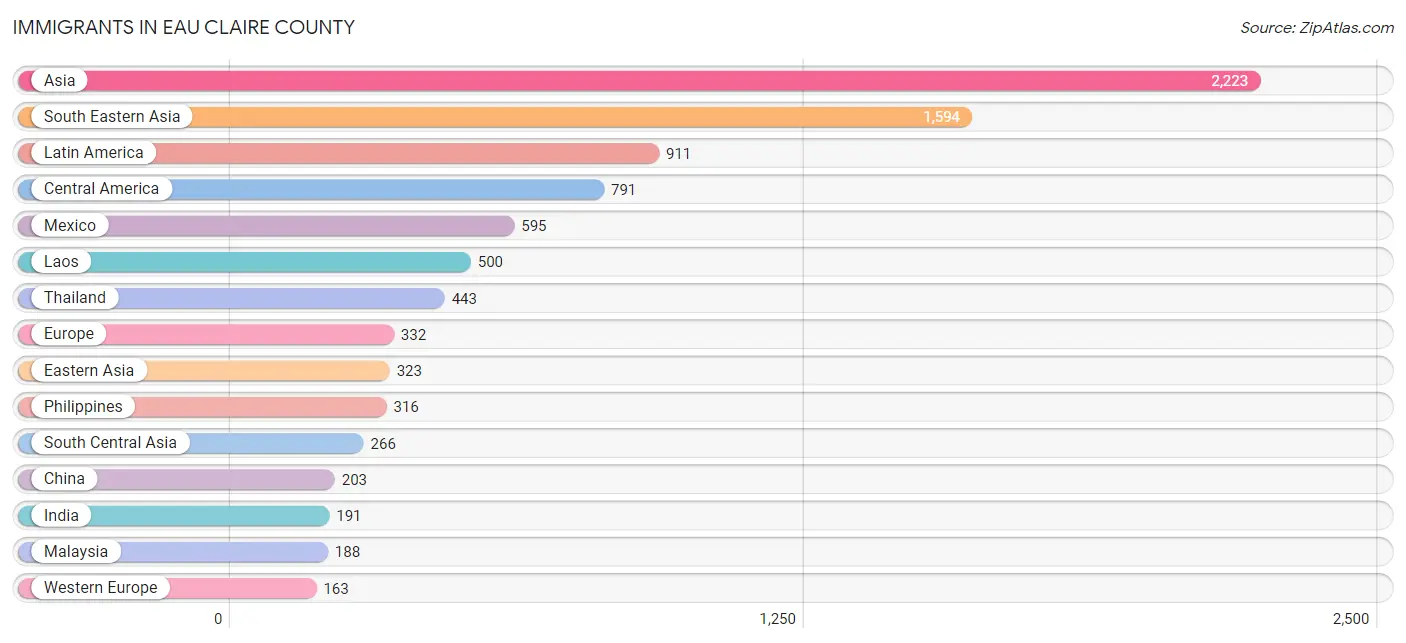
Immigrants in Eau Claire County
The most numerous immigrant groups reported in Eau Claire County came from Asia (2,223 | 2.1%), South Eastern Asia (1,594 | 1.5%), Latin America (911 | 0.9%), Central America (791 | 0.7%), and Mexico (595 | 0.6%), together accounting for 5.8% of all Eau Claire County residents.
| Immigration Origin | # Population | % Population |
| Africa | 65 | 0.1% |
| Albania | 4 | 0.0% |
| Asia | 2,223 | 2.1% |
| Bangladesh | 29 | 0.0% |
| Belarus | 1 | 0.0% |
| Belgium | 10 | 0.0% |
| Brazil | 46 | 0.0% |
| Cambodia | 48 | 0.1% |
| Canada | 115 | 0.1% |
| Caribbean | 10 | 0.0% |
| Central America | 791 | 0.7% |
| China | 203 | 0.2% |
| Colombia | 26 | 0.0% |
| Eastern Africa | 24 | 0.0% |
| Eastern Asia | 323 | 0.3% |
| Eastern Europe | 88 | 0.1% |
| El Salvador | 87 | 0.1% |
| Ethiopia | 6 | 0.0% |
| Europe | 332 | 0.3% |
| France | 13 | 0.0% |
| Germany | 140 | 0.1% |
| Greece | 28 | 0.0% |
| Guatemala | 7 | 0.0% |
| Haiti | 5 | 0.0% |
| Honduras | 20 | 0.0% |
| Hong Kong | 18 | 0.0% |
| India | 191 | 0.2% |
| Iraq | 28 | 0.0% |
| Ireland | 2 | 0.0% |
| Italy | 22 | 0.0% |
| Jamaica | 5 | 0.0% |
| Japan | 23 | 0.0% |
| Kenya | 18 | 0.0% |
| Korea | 97 | 0.1% |
| Kuwait | 12 | 0.0% |
| Laos | 500 | 0.5% |
| Latin America | 911 | 0.9% |
| Malaysia | 188 | 0.2% |
| Mexico | 595 | 0.6% |
| Nicaragua | 75 | 0.1% |
| Nigeria | 4 | 0.0% |
| Northern Europe | 31 | 0.0% |
| Pakistan | 46 | 0.0% |
| Panama | 7 | 0.0% |
| Peru | 19 | 0.0% |
| Philippines | 316 | 0.3% |
| Poland | 45 | 0.0% |
| Romania | 4 | 0.0% |
| Russia | 19 | 0.0% |
| South Africa | 37 | 0.0% |
| South America | 110 | 0.1% |
| South Central Asia | 266 | 0.3% |
| South Eastern Asia | 1,594 | 1.5% |
| Southern Europe | 50 | 0.1% |
| Taiwan | 26 | 0.0% |
| Thailand | 443 | 0.4% |
| Venezuela | 19 | 0.0% |
| Vietnam | 99 | 0.1% |
| Western Africa | 4 | 0.0% |
| Western Asia | 40 | 0.0% |
| Western Europe | 163 | 0.2% | View All 61 Rows |
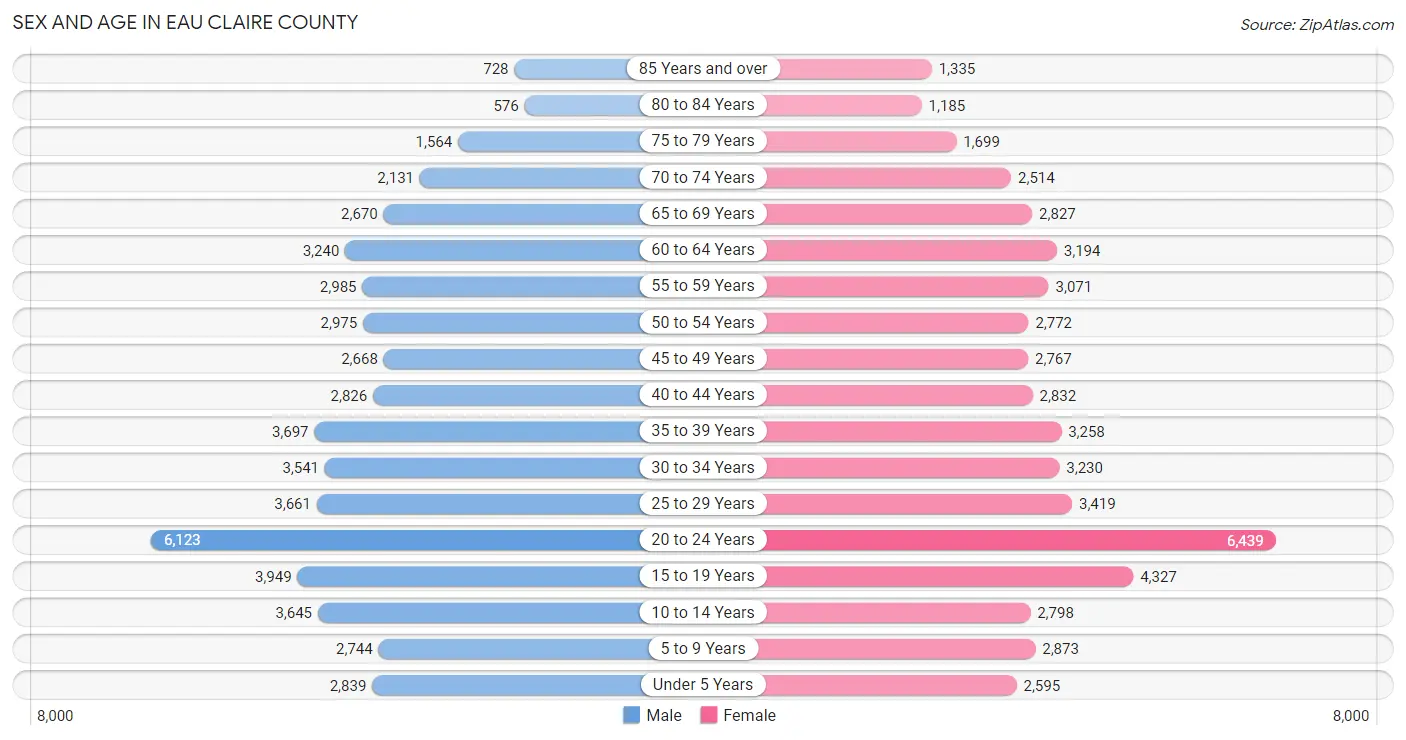
Sex and Age in Eau Claire County
Sex and Age in Eau Claire County
The most populous age groups in Eau Claire County are 20 to 24 Years (6,123 | 11.7%) for men and 20 to 24 Years (6,439 | 12.1%) for women.
| Age Bracket | Male | Female |
| Under 5 Years | 2,839 (5.4%) | 2,595 (4.9%) |
| 5 to 9 Years | 2,744 (5.2%) | 2,873 (5.4%) |
| 10 to 14 Years | 3,645 (6.9%) | 2,798 (5.3%) |
| 15 to 19 Years | 3,949 (7.5%) | 4,327 (8.1%) |
| 20 to 24 Years | 6,123 (11.7%) | 6,439 (12.1%) |
| 25 to 29 Years | 3,661 (7.0%) | 3,419 (6.4%) |
| 30 to 34 Years | 3,541 (6.7%) | 3,230 (6.1%) |
| 35 to 39 Years | 3,697 (7.0%) | 3,258 (6.1%) |
| 40 to 44 Years | 2,826 (5.4%) | 2,832 (5.3%) |
| 45 to 49 Years | 2,668 (5.1%) | 2,767 (5.2%) |
| 50 to 54 Years | 2,975 (5.7%) | 2,772 (5.2%) |
| 55 to 59 Years | 2,985 (5.7%) | 3,071 (5.8%) |
| 60 to 64 Years | 3,240 (6.2%) | 3,194 (6.0%) |
| 65 to 69 Years | 2,670 (5.1%) | 2,827 (5.3%) |
| 70 to 74 Years | 2,131 (4.1%) | 2,514 (4.7%) |
| 75 to 79 Years | 1,564 (3.0%) | 1,699 (3.2%) |
| 80 to 84 Years | 576 (1.1%) | 1,185 (2.2%) |
| 85 Years and over | 728 (1.4%) | 1,335 (2.5%) |
| Total | 52,562 (100.0%) | 53,135 (100.0%) |
Families and Households in Eau Claire County
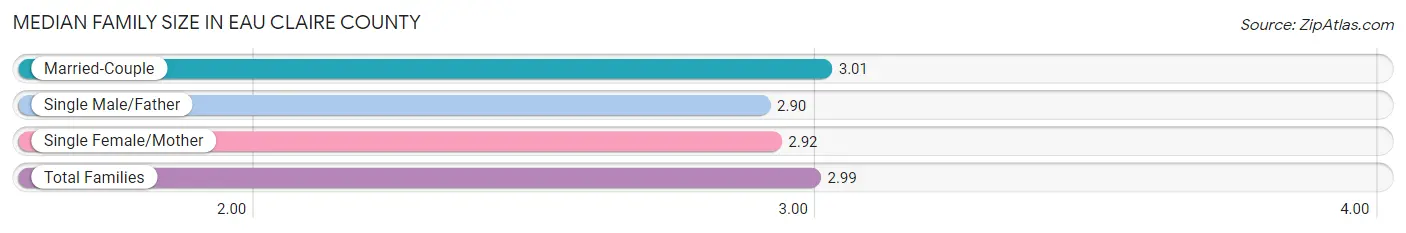
Median Family Size in Eau Claire County
The median family size in Eau Claire County is 2.99 persons per family, with married-couple families (19,693 | 80.9%) accounting for the largest median family size of 3.01 persons per family. On the other hand, single male/father families (1,886 | 7.7%) represent the smallest median family size with 2.90 persons per family.
| Family Type | # Families | Family Size |
| Married-Couple | 19,693 (80.9%) | 3.01 |
| Single Male/Father | 1,886 (7.7%) | 2.90 |
| Single Female/Mother | 2,747 (11.3%) | 2.92 |
| Total Families | 24,326 (100.0%) | 2.99 |
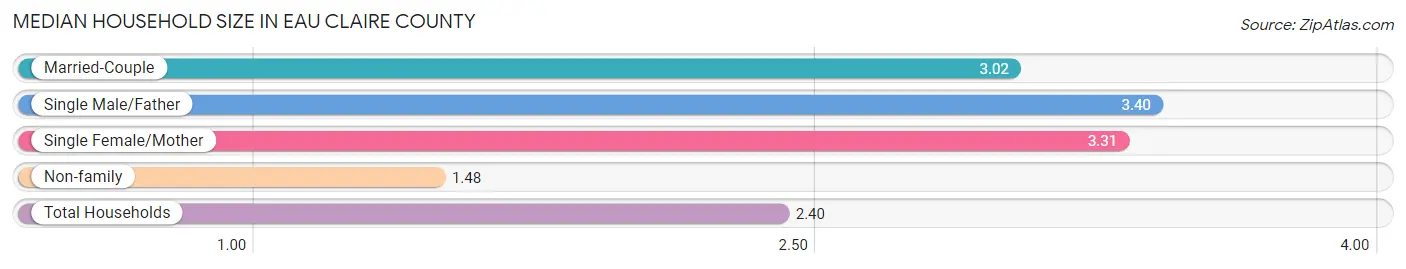
Median Household Size in Eau Claire County
The median household size in Eau Claire County is 2.40 persons per household, with single male/father households (1,886 | 4.4%) accounting for the largest median household size of 3.4 persons per household. non-family households (18,155 | 42.7%) represent the smallest median household size with 1.48 persons per household.
| Household Type | # Households | Household Size |
| Married-Couple | 19,693 (46.4%) | 3.02 |
| Single Male/Father | 1,886 (4.4%) | 3.40 |
| Single Female/Mother | 2,747 (6.5%) | 3.31 |
| Non-family | 18,155 (42.7%) | 1.48 |
| Total Households | 42,481 (100.0%) | 2.40 |
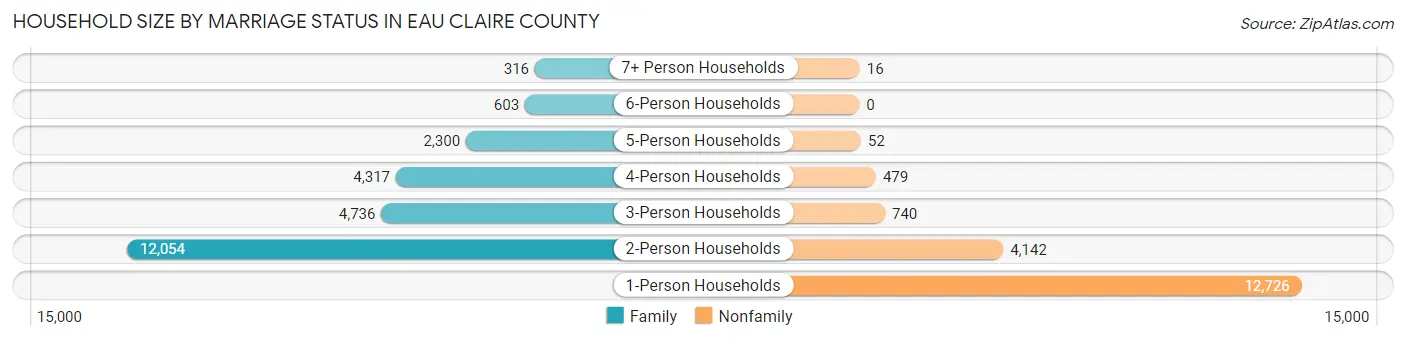
Household Size by Marriage Status in Eau Claire County
Out of a total of 42,481 households in Eau Claire County, 24,326 (57.3%) are family households, while 18,155 (42.7%) are nonfamily households. The most numerous type of family households are 2-person households, comprising 12,054, and the most common type of nonfamily households are 1-person households, comprising 12,726.
| Household Size | Family Households | Nonfamily Households |
| 1-Person Households | - | 12,726 (30.0%) |
| 2-Person Households | 12,054 (28.4%) | 4,142 (9.8%) |
| 3-Person Households | 4,736 (11.2%) | 740 (1.7%) |
| 4-Person Households | 4,317 (10.2%) | 479 (1.1%) |
| 5-Person Households | 2,300 (5.4%) | 52 (0.1%) |
| 6-Person Households | 603 (1.4%) | 0 (0.0%) |
| 7+ Person Households | 316 (0.7%) | 16 (0.0%) |
| Total | 24,326 (57.3%) | 18,155 (42.7%) |
Female Fertility in Eau Claire County
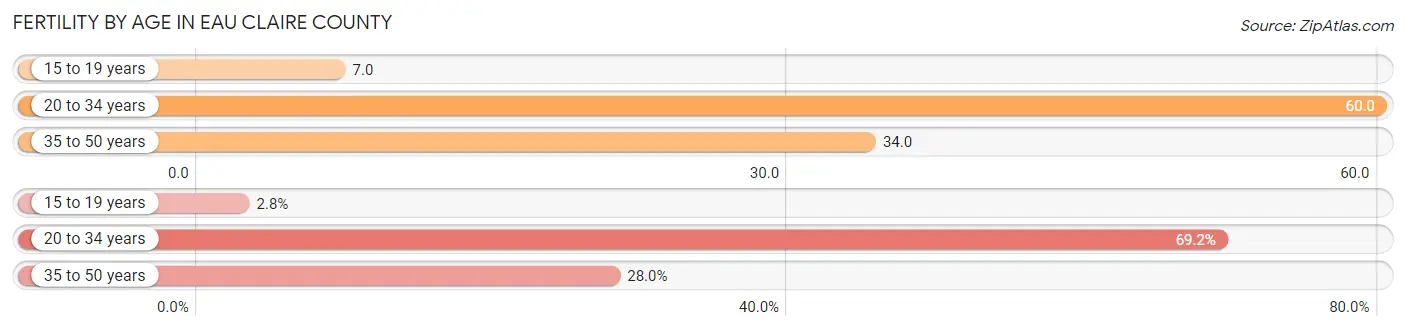
Fertility by Age in Eau Claire County
Average fertility rate in Eau Claire County is 42.0 births per 1,000 women. Women in the age bracket of 20 to 34 years have the highest fertility rate with 60.0 births per 1,000 women. Women in the age bracket of 20 to 34 years acount for 69.2% of all women with births.
| Age Bracket | Women with Births | Births / 1,000 Women |
| 15 to 19 years | 32 (2.8%) | 7.0 |
| 20 to 34 years | 784 (69.2%) | 60.0 |
| 35 to 50 years | 317 (28.0%) | 34.0 |
| Total | 1,133 (100.0%) | 42.0 |
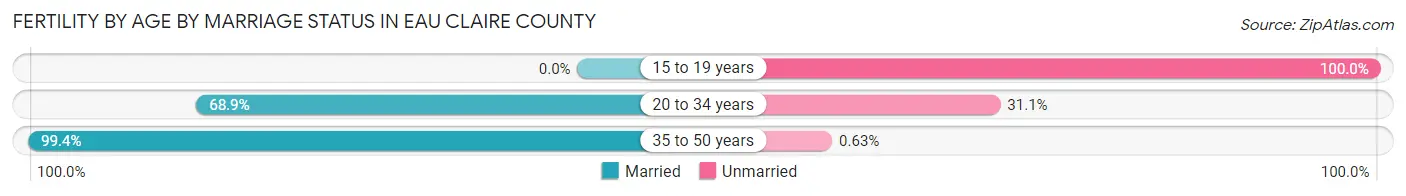
Fertility by Age by Marriage Status in Eau Claire County
75.5% of women with births (1,133) in Eau Claire County are married. The highest percentage of unmarried women with births falls into 15 to 19 years age bracket with 100.0% of them unmarried at the time of birth, while the lowest percentage of unmarried women with births belong to 35 to 50 years age bracket with 0.6% of them unmarried.
| Age Bracket | Married | Unmarried |
| 15 to 19 years | 0 (0.0%) | 32 (100.0%) |
| 20 to 34 years | 540 (68.9%) | 244 (31.1%) |
| 35 to 50 years | 315 (99.4%) | 2 (0.6%) |
| Total | 855 (75.5%) | 278 (24.5%) |
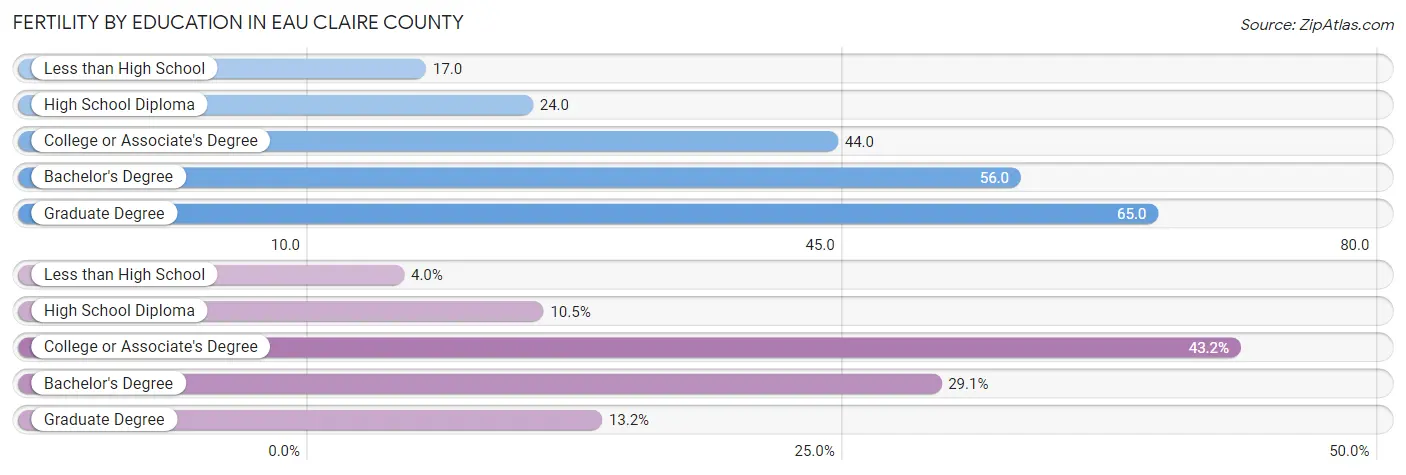
Fertility by Education in Eau Claire County
Average fertility rate in Eau Claire County is 42.0 births per 1,000 women. Women with the education attainment of graduate degree have the highest fertility rate of 65.0 births per 1,000 women, while women with the education attainment of less than high school have the lowest fertility at 17.0 births per 1,000 women. Women with the education attainment of college or associate's degree represent 43.2% of all women with births.
| Educational Attainment | Women with Births | Births / 1,000 Women |
| Less than High School | 45 (4.0%) | 17.0 |
| High School Diploma | 119 (10.5%) | 24.0 |
| College or Associate's Degree | 489 (43.2%) | 44.0 |
| Bachelor's Degree | 330 (29.1%) | 56.0 |
| Graduate Degree | 150 (13.2%) | 65.0 |
| Total | 1,133 (100.0%) | 42.0 |
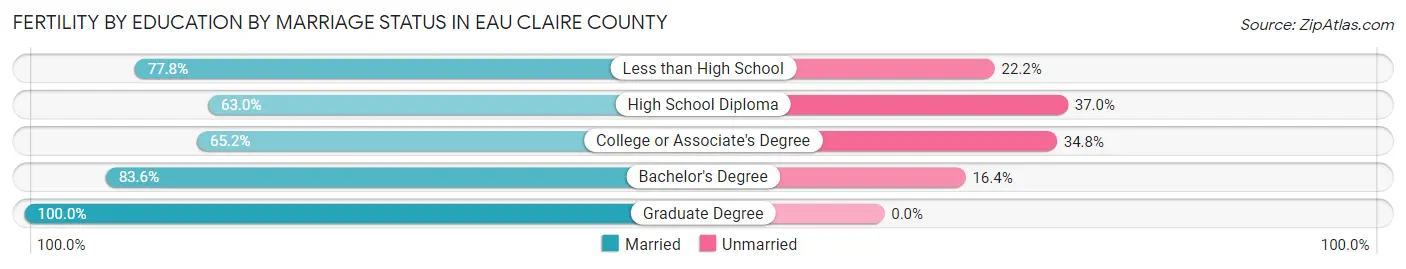
Fertility by Education by Marriage Status in Eau Claire County
24.5% of women with births in Eau Claire County are unmarried. Women with the educational attainment of graduate degree are most likely to be married with 100.0% of them married at childbirth, while women with the educational attainment of high school diploma are least likely to be married with 37.0% of them unmarried at childbirth.
| Educational Attainment | Married | Unmarried |
| Less than High School | 35 (77.8%) | 10 (22.2%) |
| High School Diploma | 75 (63.0%) | 44 (37.0%) |
| College or Associate's Degree | 319 (65.2%) | 170 (34.8%) |
| Bachelor's Degree | 276 (83.6%) | 54 (16.4%) |
| Graduate Degree | 150 (100.0%) | 0 (0.0%) |
| Total | 855 (75.5%) | 278 (24.5%) |
Income in Eau Claire County
Income Overview in Eau Claire County
Per Capita Income in Eau Claire County is $38,529, while median incomes of families and households are $98,103 and $70,127 respectively.
| Characteristic | Number | Measure |
| Per Capita Income | 105,697 | $38,529 |
| Median Family Income | 24,326 | $98,103 |
| Mean Family Income | 24,326 | $119,176 |
| Median Household Income | 42,481 | $70,127 |
| Mean Household Income | 42,481 | $92,896 |
| Income Deficit | 24,326 | $10,359 |
| Wage / Income Gap (%) | 105,697 | 33.30% |
| Wage / Income Gap ($) | 105,697 | 66.70¢ per $1 |
| Gini / Inequality Index | 105,697 | 0.44 |
Earnings by Sex in Eau Claire County
Average Earnings in Eau Claire County are $35,887, $43,817 for men and $29,227 for women, a difference of 33.3%.
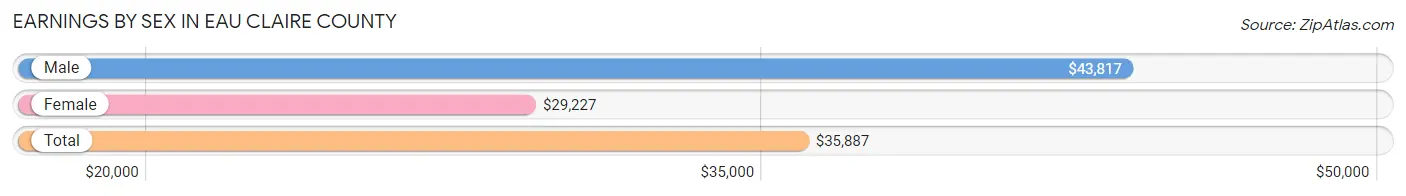
| Sex | Number | Average Earnings |
| Male | 33,605 (51.8%) | $43,817 |
| Female | 31,216 (48.2%) | $29,227 |
| Total | 64,821 (100.0%) | $35,887 |
Earnings by Sex by Income Bracket in Eau Claire County
The most common earnings brackets in Eau Claire County are $100,000+ for men (4,099 | 12.2%) and $25,000 to $29,999 for women (2,341 | 7.5%).
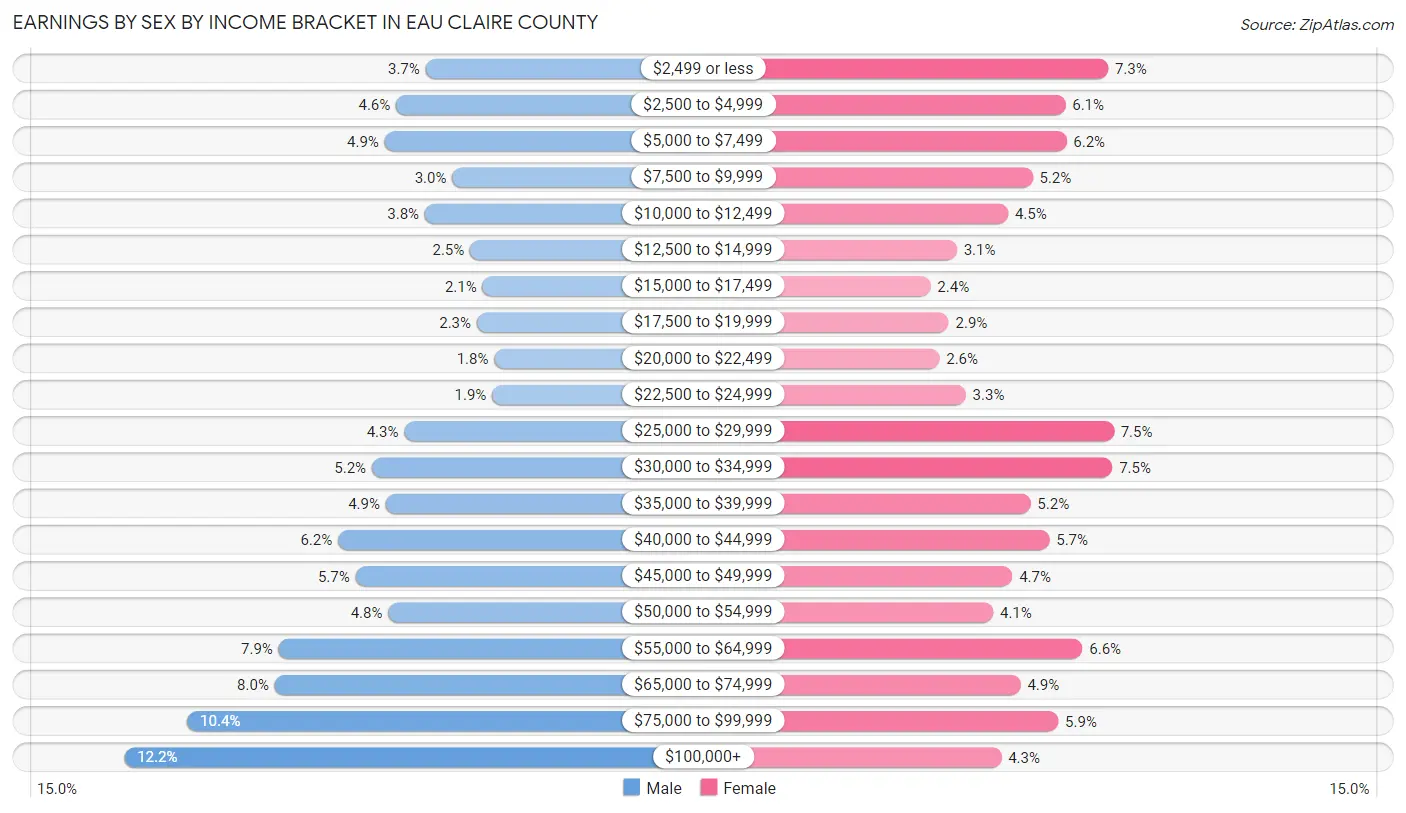
| Income | Male | Female |
| $2,499 or less | 1,253 (3.7%) | 2,290 (7.3%) |
| $2,500 to $4,999 | 1,533 (4.6%) | 1,916 (6.1%) |
| $5,000 to $7,499 | 1,639 (4.9%) | 1,925 (6.2%) |
| $7,500 to $9,999 | 1,002 (3.0%) | 1,631 (5.2%) |
| $10,000 to $12,499 | 1,259 (3.7%) | 1,414 (4.5%) |
| $12,500 to $14,999 | 833 (2.5%) | 964 (3.1%) |
| $15,000 to $17,499 | 716 (2.1%) | 735 (2.4%) |
| $17,500 to $19,999 | 770 (2.3%) | 894 (2.9%) |
| $20,000 to $22,499 | 604 (1.8%) | 813 (2.6%) |
| $22,500 to $24,999 | 626 (1.9%) | 1,044 (3.3%) |
| $25,000 to $29,999 | 1,455 (4.3%) | 2,341 (7.5%) |
| $30,000 to $34,999 | 1,762 (5.2%) | 2,329 (7.5%) |
| $35,000 to $39,999 | 1,629 (4.9%) | 1,612 (5.2%) |
| $40,000 to $44,999 | 2,081 (6.2%) | 1,777 (5.7%) |
| $45,000 to $49,999 | 1,914 (5.7%) | 1,450 (4.6%) |
| $50,000 to $54,999 | 1,606 (4.8%) | 1,282 (4.1%) |
| $55,000 to $64,999 | 2,640 (7.9%) | 2,066 (6.6%) |
| $65,000 to $74,999 | 2,678 (8.0%) | 1,523 (4.9%) |
| $75,000 to $99,999 | 3,506 (10.4%) | 1,854 (5.9%) |
| $100,000+ | 4,099 (12.2%) | 1,356 (4.3%) |
| Total | 33,605 (100.0%) | 31,216 (100.0%) |
Earnings by Sex by Educational Attainment in Eau Claire County
Average earnings in Eau Claire County are $55,166 for men and $38,859 for women, a difference of 29.6%. Men with an educational attainment of graduate degree enjoy the highest average annual earnings of $80,556, while those with less than high school education earn the least with $36,607. Women with an educational attainment of graduate degree earn the most with the average annual earnings of $63,999, while those with high school diploma education have the smallest earnings of $28,345.
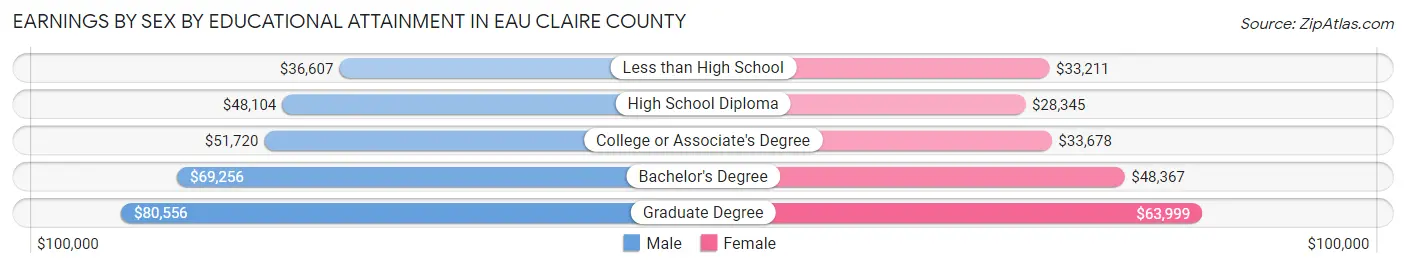
| Educational Attainment | Male Income | Female Income |
| Less than High School | $36,607 | $33,211 |
| High School Diploma | $48,104 | $28,345 |
| College or Associate's Degree | $51,720 | $33,678 |
| Bachelor's Degree | $69,256 | $48,367 |
| Graduate Degree | $80,556 | $63,999 |
| Total | $55,166 | $38,859 |
Family Income in Eau Claire County
Family Income Brackets in Eau Claire County
According to the Eau Claire County family income data, there are 6,641 families falling into the $100,000 to $149,999 income range, which is the most common income bracket and makes up 27.3% of all families. Conversely, the less than $10,000 income bracket is the least frequent group with only 316 families (1.3%) belonging to this category.
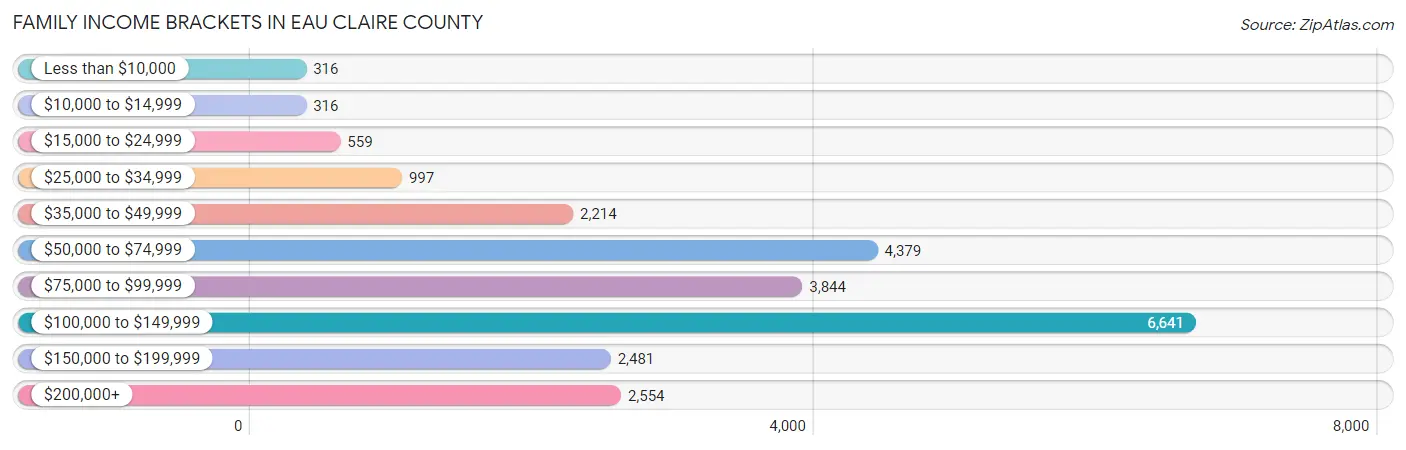
| Income Bracket | # Families | % Families |
| Less than $10,000 | 316 | 1.3% |
| $10,000 to $14,999 | 316 | 1.3% |
| $15,000 to $24,999 | 559 | 2.3% |
| $25,000 to $34,999 | 997 | 4.1% |
| $35,000 to $49,999 | 2,214 | 9.1% |
| $50,000 to $74,999 | 4,379 | 18.0% |
| $75,000 to $99,999 | 3,844 | 15.8% |
| $100,000 to $149,999 | 6,641 | 27.3% |
| $150,000 to $199,999 | 2,481 | 10.2% |
| $200,000+ | 2,554 | 10.5% |
Family Income by Famaliy Size in Eau Claire County
5-person families (1,982 | 8.2%) account for the highest median family income in Eau Claire County with $124,692 per family, while 2-person families (12,641 | 52.0%) have the highest median income of $41,429 per family member.
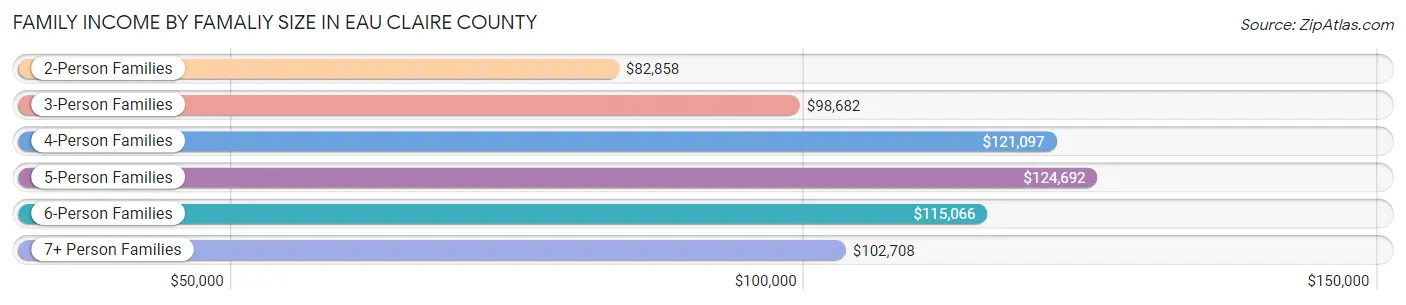
| Income Bracket | # Families | Median Income |
| 2-Person Families | 12,641 (52.0%) | $82,858 |
| 3-Person Families | 4,859 (20.0%) | $98,682 |
| 4-Person Families | 4,070 (16.7%) | $121,097 |
| 5-Person Families | 1,982 (8.2%) | $124,692 |
| 6-Person Families | 523 (2.1%) | $115,066 |
| 7+ Person Families | 251 (1.0%) | $102,708 |
| Total | 24,326 (100.0%) | $98,103 |
Family Income by Number of Earners in Eau Claire County
The median family income in Eau Claire County is $98,103, with families comprising 3+ earners (2,654) having the highest median family income of $130,313, while families with no earners (3,348) have the lowest median family income of $58,523, accounting for 10.9% and 13.8% of families, respectively.
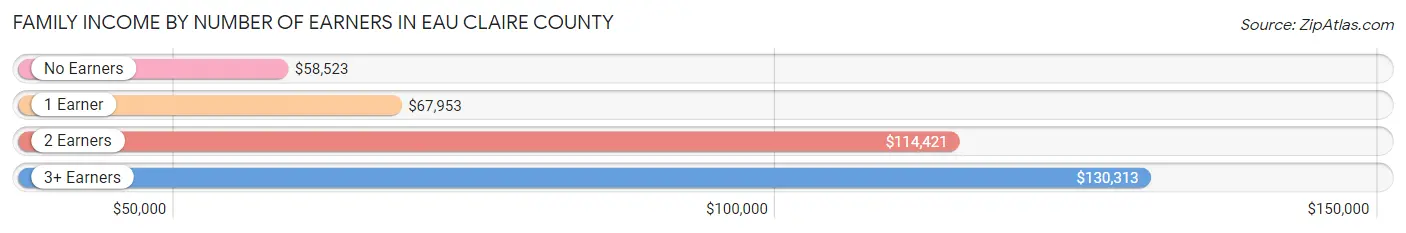
| Number of Earners | # Families | Median Income |
| No Earners | 3,348 (13.8%) | $58,523 |
| 1 Earner | 6,614 (27.2%) | $67,953 |
| 2 Earners | 11,710 (48.1%) | $114,421 |
| 3+ Earners | 2,654 (10.9%) | $130,313 |
| Total | 24,326 (100.0%) | $98,103 |
Household Income in Eau Claire County
Household Income Brackets in Eau Claire County
With 8,666 households falling in the category, the $50,000 to $74,999 income range is the most frequent in Eau Claire County, accounting for 20.4% of all households. In contrast, only 1,317 households (3.1%) fall into the $10,000 to $14,999 income bracket, making it the least populous group.
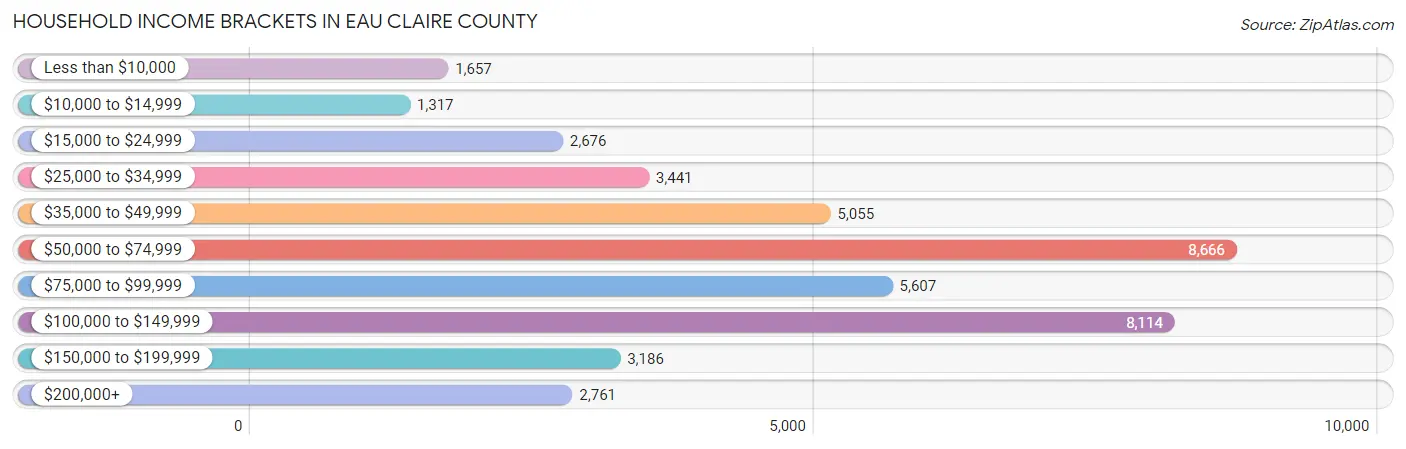
| Income Bracket | # Households | % Households |
| Less than $10,000 | 1,657 | 3.9% |
| $10,000 to $14,999 | 1,317 | 3.1% |
| $15,000 to $24,999 | 2,676 | 6.3% |
| $25,000 to $34,999 | 3,441 | 8.1% |
| $35,000 to $49,999 | 5,055 | 11.9% |
| $50,000 to $74,999 | 8,666 | 20.4% |
| $75,000 to $99,999 | 5,607 | 13.2% |
| $100,000 to $149,999 | 8,114 | 19.1% |
| $150,000 to $199,999 | 3,186 | 7.5% |
| $200,000+ | 2,761 | 6.5% |
Household Income by Householder Age in Eau Claire County
The median household income in Eau Claire County is $70,127, with the highest median household income of $88,518 found in the 45 to 64 years age bracket for the primary householder. A total of 13,475 households (31.7%) fall into this category. Meanwhile, the 15 to 24 years age bracket for the primary householder has the lowest median household income of $36,133, with 4,028 households (9.5%) in this group.
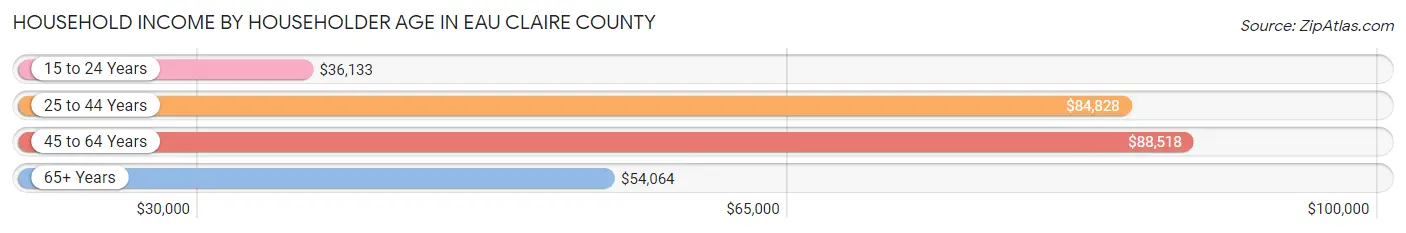
| Income Bracket | # Households | Median Income |
| 15 to 24 Years | 4,028 (9.5%) | $36,133 |
| 25 to 44 Years | 13,708 (32.3%) | $84,828 |
| 45 to 64 Years | 13,475 (31.7%) | $88,518 |
| 65+ Years | 11,270 (26.5%) | $54,064 |
| Total | 42,481 (100.0%) | $70,127 |
Poverty in Eau Claire County
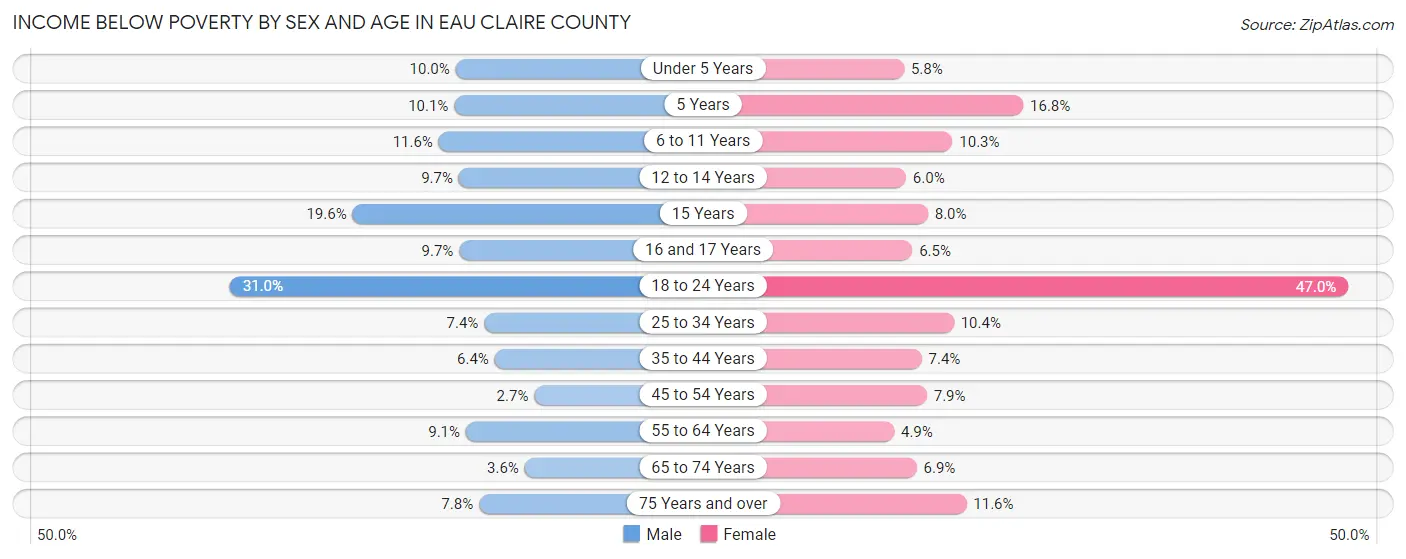
Income Below Poverty by Sex and Age in Eau Claire County
With 10.7% poverty level for males and 13.5% for females among the residents of Eau Claire County, 18 to 24 year old males and 18 to 24 year old females are the most vulnerable to poverty, with 2,237 males (30.9%) and 3,338 females (47.0%) in their respective age groups living below the poverty level.
| Age Bracket | Male | Female |
| Under 5 Years | 277 (10.0%) | 149 (5.8%) |
| 5 Years | 70 (10.1%) | 85 (16.8%) |
| 6 to 11 Years | 393 (11.6%) | 343 (10.3%) |
| 12 to 14 Years | 211 (9.7%) | 94 (5.9%) |
| 15 Years | 99 (19.6%) | 55 (8.0%) |
| 16 and 17 Years | 125 (9.7%) | 73 (6.5%) |
| 18 to 24 Years | 2,237 (30.9%) | 3,338 (47.0%) |
| 25 to 34 Years | 524 (7.3%) | 689 (10.4%) |
| 35 to 44 Years | 412 (6.4%) | 451 (7.4%) |
| 45 to 54 Years | 152 (2.7%) | 437 (7.9%) |
| 55 to 64 Years | 563 (9.0%) | 303 (4.9%) |
| 65 to 74 Years | 171 (3.6%) | 368 (6.9%) |
| 75 Years and over | 220 (7.8%) | 469 (11.6%) |
| Total | 5,454 (10.7%) | 6,854 (13.5%) |
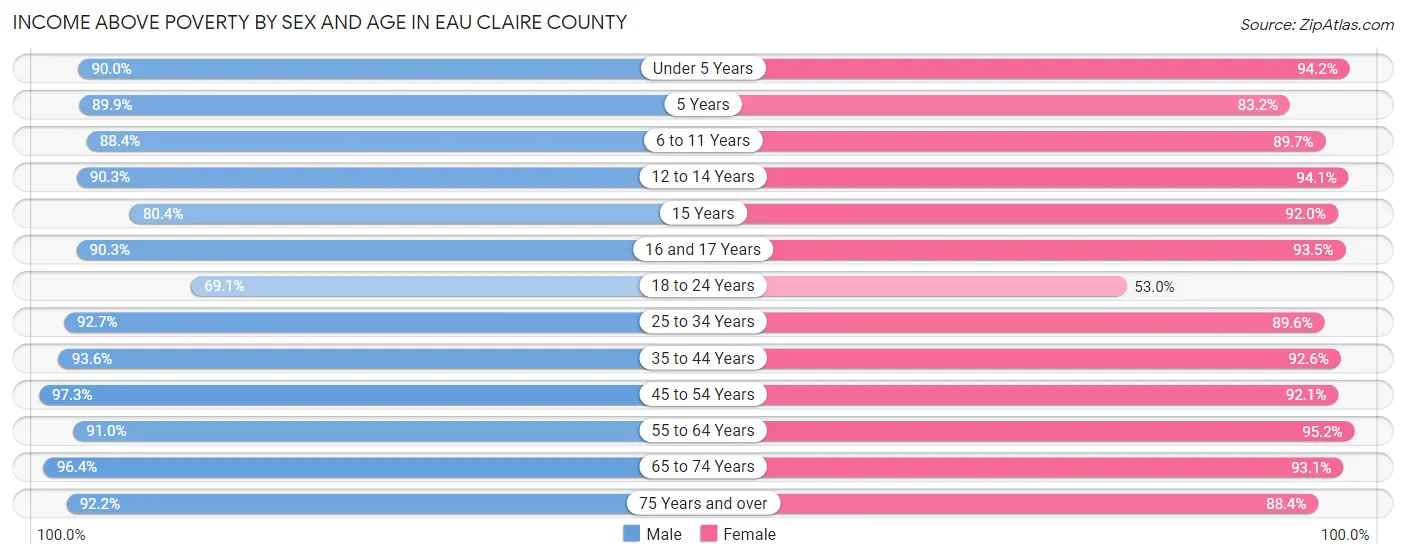
Income Above Poverty by Sex and Age in Eau Claire County
According to the poverty statistics in Eau Claire County, males aged 45 to 54 years and females aged 55 to 64 years are the age groups that are most secure financially, with 97.3% of males and 95.2% of females in these age groups living above the poverty line.
| Age Bracket | Male | Female |
| Under 5 Years | 2,494 (90.0%) | 2,433 (94.2%) |
| 5 Years | 621 (89.9%) | 420 (83.2%) |
| 6 to 11 Years | 3,005 (88.4%) | 3,001 (89.7%) |
| 12 to 14 Years | 1,964 (90.3%) | 1,487 (94.1%) |
| 15 Years | 407 (80.4%) | 634 (92.0%) |
| 16 and 17 Years | 1,168 (90.3%) | 1,043 (93.5%) |
| 18 to 24 Years | 4,991 (69.1%) | 3,765 (53.0%) |
| 25 to 34 Years | 6,608 (92.6%) | 5,945 (89.6%) |
| 35 to 44 Years | 6,053 (93.6%) | 5,632 (92.6%) |
| 45 to 54 Years | 5,468 (97.3%) | 5,102 (92.1%) |
| 55 to 64 Years | 5,659 (90.9%) | 5,945 (95.2%) |
| 65 to 74 Years | 4,589 (96.4%) | 4,933 (93.1%) |
| 75 Years and over | 2,590 (92.2%) | 3,589 (88.4%) |
| Total | 45,617 (89.3%) | 43,929 (86.5%) |
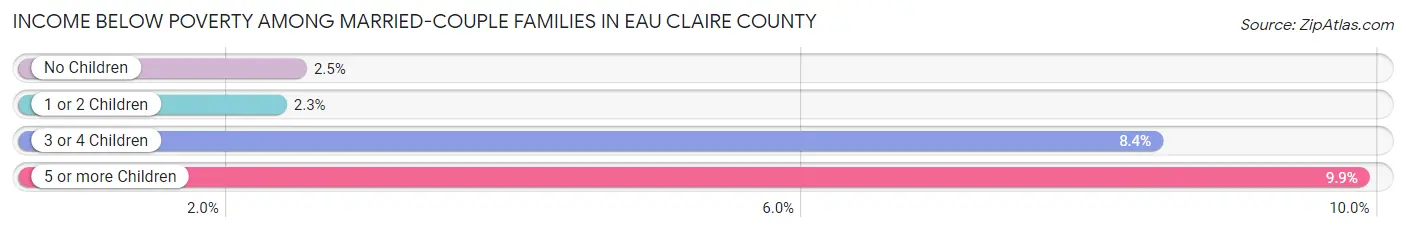
Income Below Poverty Among Married-Couple Families in Eau Claire County
The poverty statistics for married-couple families in Eau Claire County show that 3.0% or 583 of the total 19,693 families live below the poverty line. Families with 5 or more children have the highest poverty rate of 9.9%, comprising of 16 families. On the other hand, families with 1 or 2 children have the lowest poverty rate of 2.3%, which includes 140 families.
| Children | Above Poverty | Below Poverty |
| No Children | 11,738 (97.5%) | 299 (2.5%) |
| 1 or 2 Children | 5,837 (97.7%) | 140 (2.3%) |
| 3 or 4 Children | 1,389 (91.6%) | 128 (8.4%) |
| 5 or more Children | 146 (90.1%) | 16 (9.9%) |
| Total | 19,110 (97.0%) | 583 (3.0%) |
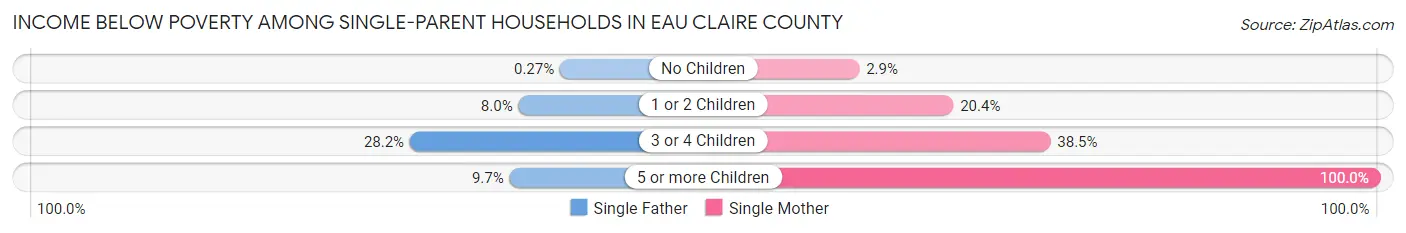
Income Below Poverty Among Single-Parent Households in Eau Claire County
According to the poverty data in Eau Claire County, 6.7% or 127 single-father households and 17.2% or 473 single-mother households are living below the poverty line. Among single-father households, those with 3 or 4 children have the highest poverty rate, with 46 households (28.2%) experiencing poverty. Likewise, among single-mother households, those with 5 or more children have the highest poverty rate, with 29 households (100.0%) falling below the poverty line.
| Children | Single Father | Single Mother |
| No Children | 2 (0.3%) | 25 (2.9%) |
| 1 or 2 Children | 73 (8.0%) | 332 (20.4%) |
| 3 or 4 Children | 46 (28.2%) | 87 (38.5%) |
| 5 or more Children | 6 (9.7%) | 29 (100.0%) |
| Total | 127 (6.7%) | 473 (17.2%) |
Income Below Poverty Among Married-Couple vs Single-Parent Households in Eau Claire County
The poverty data for Eau Claire County shows that 583 of the married-couple family households (3.0%) and 600 of the single-parent households (13.0%) are living below the poverty level. Within the married-couple family households, those with 5 or more children have the highest poverty rate, with 16 households (9.9%) falling below the poverty line. Among the single-parent households, those with 5 or more children have the highest poverty rate, with 35 household (38.5%) living below poverty.
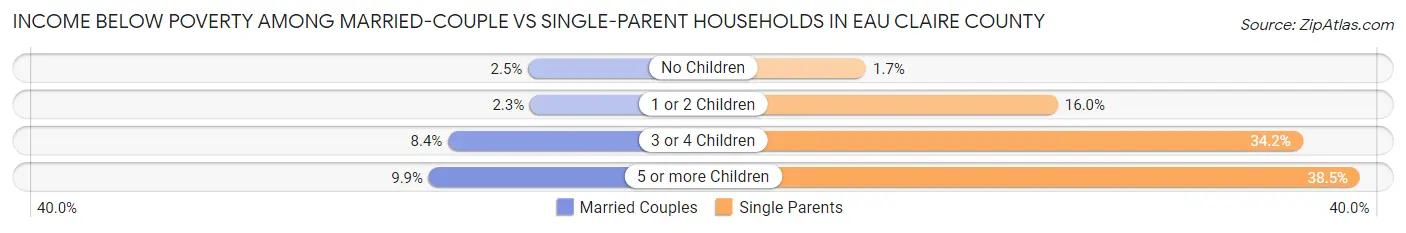
| Children | Married-Couple Families | Single-Parent Households |
| No Children | 299 (2.5%) | 27 (1.7%) |
| 1 or 2 Children | 140 (2.3%) | 405 (16.0%) |
| 3 or 4 Children | 128 (8.4%) | 133 (34.2%) |
| 5 or more Children | 16 (9.9%) | 35 (38.5%) |
| Total | 583 (3.0%) | 600 (13.0%) |
Employment Characteristics in Eau Claire County
Employment by Class of Employer in Eau Claire County
Among the 56,723 employed individuals in Eau Claire County, private company employees (38,824 | 68.4%), not-for-profit organizations (5,915 | 10.4%), and local government employees (3,943 | 7.0%) make up the most common classes of employment.
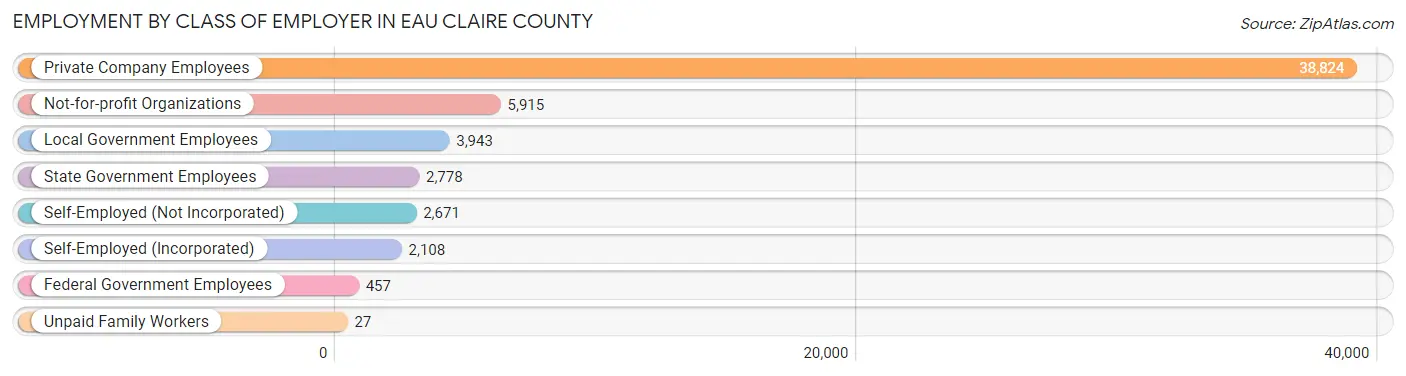
| Employer Class | # Employees | % Employees |
| Private Company Employees | 38,824 | 68.4% |
| Self-Employed (Incorporated) | 2,108 | 3.7% |
| Self-Employed (Not Incorporated) | 2,671 | 4.7% |
| Not-for-profit Organizations | 5,915 | 10.4% |
| Local Government Employees | 3,943 | 7.0% |
| State Government Employees | 2,778 | 4.9% |
| Federal Government Employees | 457 | 0.8% |
| Unpaid Family Workers | 27 | 0.1% |
| Total | 56,723 | 100.0% |
Employment Status by Age in Eau Claire County
According to the labor force statistics for Eau Claire County, out of the total population over 16 years of age (87,001), 68.9% or 59,944 individuals are in the labor force, with 3.2% or 1,918 of them unemployed. The age group with the highest labor force participation rate is 25 to 29 years, with 91.8% or 6,499 individuals in the labor force. Within the labor force, the 16 to 19 years age range has the highest percentage of unemployed individuals, with 8.9% or 357 of them being unemployed.
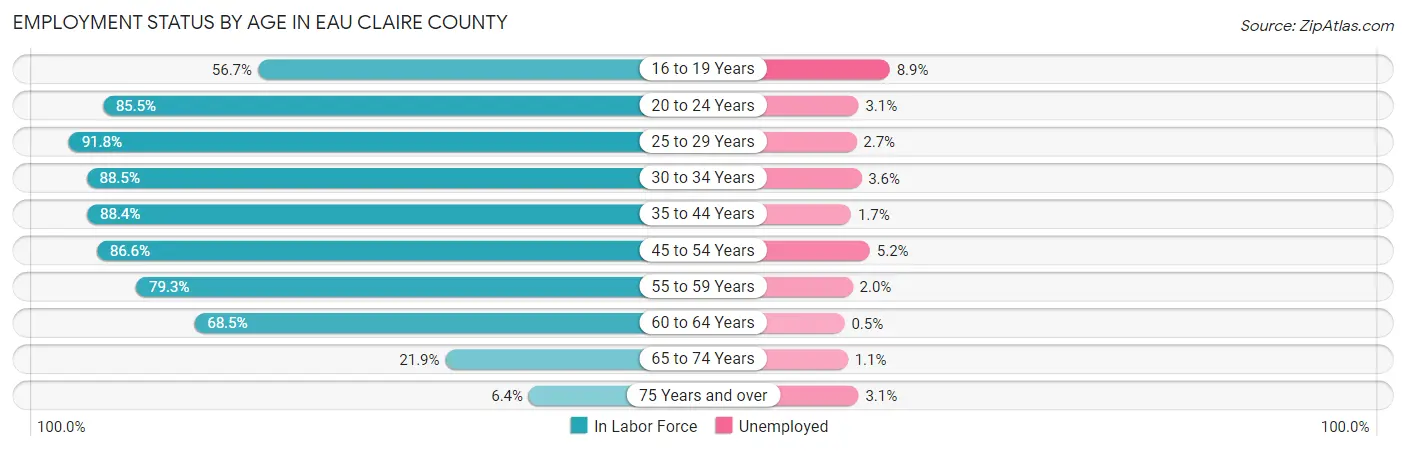
| Age Bracket | In Labor Force | Unemployed |
| 16 to 19 Years | 4,011 (56.7%) | 357 (8.9%) |
| 20 to 24 Years | 10,741 (85.5%) | 333 (3.1%) |
| 25 to 29 Years | 6,499 (91.8%) | 175 (2.7%) |
| 30 to 34 Years | 5,992 (88.5%) | 216 (3.6%) |
| 35 to 44 Years | 11,150 (88.4%) | 190 (1.7%) |
| 45 to 54 Years | 9,684 (86.6%) | 504 (5.2%) |
| 55 to 59 Years | 4,802 (79.3%) | 96 (2.0%) |
| 60 to 64 Years | 4,407 (68.5%) | 22 (0.5%) |
| 65 to 74 Years | 2,221 (21.9%) | 24 (1.1%) |
| 75 Years and over | 454 (6.4%) | 14 (3.1%) |
| Total | 59,944 (68.9%) | 1,918 (3.2%) |
Employment Status by Educational Attainment in Eau Claire County
According to labor force statistics for Eau Claire County, 84.8% of individuals (42,515) out of the total population between 25 and 64 years of age (50,136) are in the labor force, with 2.8% or 1,190 of them being unemployed. The group with the highest labor force participation rate are those with the educational attainment of bachelor's degree or higher, with 89.5% or 16,768 individuals in the labor force. Within the labor force, individuals with less than high school education have the highest percentage of unemployment, with 8.0% or 95 of them being unemployed.
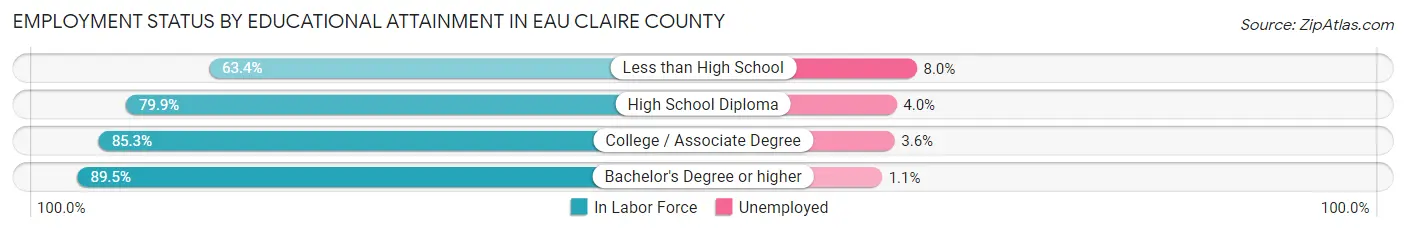
| Educational Attainment | In Labor Force | Unemployed |
| Less than High School | 1,183 (63.4%) | 149 (8.0%) |
| High School Diploma | 8,914 (79.9%) | 446 (4.0%) |
| College / Associate Degree | 15,677 (85.3%) | 662 (3.6%) |
| Bachelor's Degree or higher | 16,768 (89.5%) | 206 (1.1%) |
| Total | 42,515 (84.8%) | 1,404 (2.8%) |
Employment Occupations by Sex in Eau Claire County
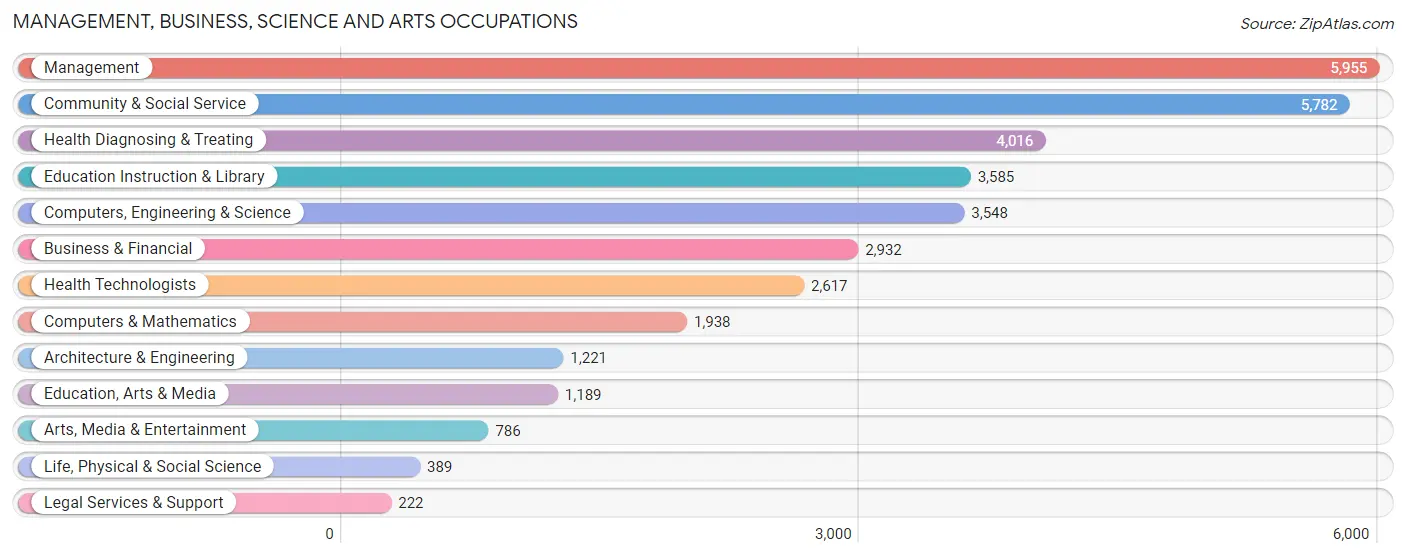
Management, Business, Science and Arts Occupations
The most common Management, Business, Science and Arts occupations in Eau Claire County are Management (5,955 | 10.3%), Community & Social Service (5,782 | 10.0%), Health Diagnosing & Treating (4,016 | 6.9%), Education Instruction & Library (3,585 | 6.2%), and Computers, Engineering & Science (3,548 | 6.1%).
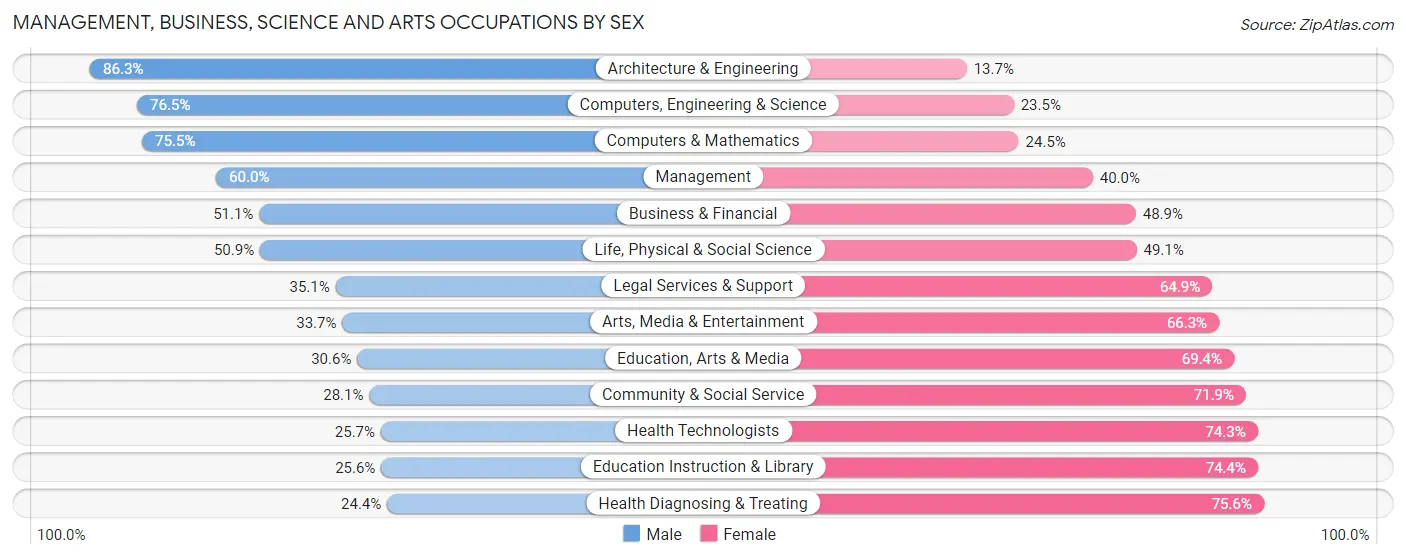
Management, Business, Science and Arts Occupations by Sex
Within the Management, Business, Science and Arts occupations in Eau Claire County, the most male-oriented occupations are Architecture & Engineering (86.3%), Computers, Engineering & Science (76.5%), and Computers & Mathematics (75.5%), while the most female-oriented occupations are Health Diagnosing & Treating (75.6%), Education Instruction & Library (74.4%), and Health Technologists (74.3%).
| Occupation | Male | Female |
| Management | 3,575 (60.0%) | 2,380 (40.0%) |
| Business & Financial | 1,497 (51.1%) | 1,435 (48.9%) |
| Computers, Engineering & Science | 2,715 (76.5%) | 833 (23.5%) |
| Computers & Mathematics | 1,463 (75.5%) | 475 (24.5%) |
| Architecture & Engineering | 1,054 (86.3%) | 167 (13.7%) |
| Life, Physical & Social Science | 198 (50.9%) | 191 (49.1%) |
| Community & Social Service | 1,625 (28.1%) | 4,157 (71.9%) |
| Education, Arts & Media | 364 (30.6%) | 825 (69.4%) |
| Legal Services & Support | 78 (35.1%) | 144 (64.9%) |
| Education Instruction & Library | 918 (25.6%) | 2,667 (74.4%) |
| Arts, Media & Entertainment | 265 (33.7%) | 521 (66.3%) |
| Health Diagnosing & Treating | 979 (24.4%) | 3,037 (75.6%) |
| Health Technologists | 672 (25.7%) | 1,945 (74.3%) |
| Total (Category) | 10,391 (46.7%) | 11,842 (53.3%) |
| Total (Overall) | 30,090 (51.9%) | 27,889 (48.1%) |
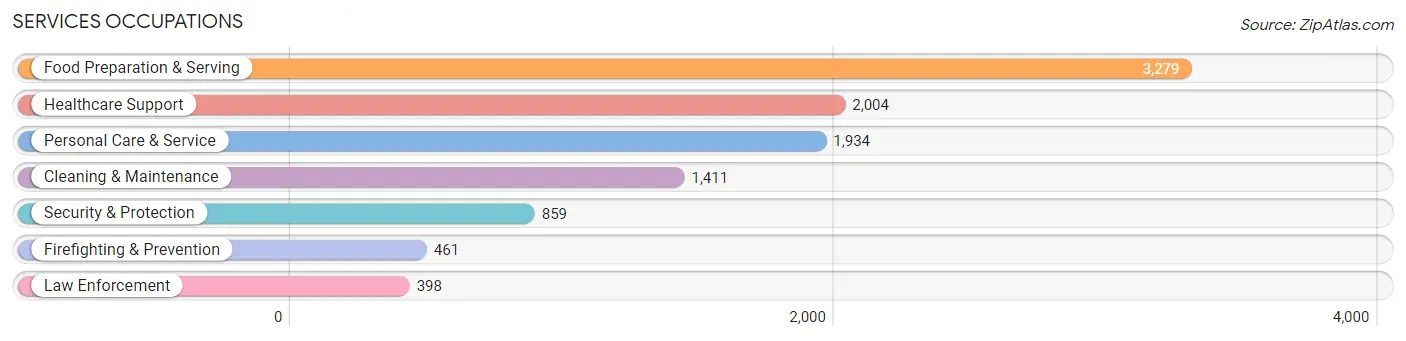
Services Occupations
The most common Services occupations in Eau Claire County are Food Preparation & Serving (3,279 | 5.7%), Healthcare Support (2,004 | 3.5%), Personal Care & Service (1,934 | 3.3%), Cleaning & Maintenance (1,411 | 2.4%), and Security & Protection (859 | 1.5%).
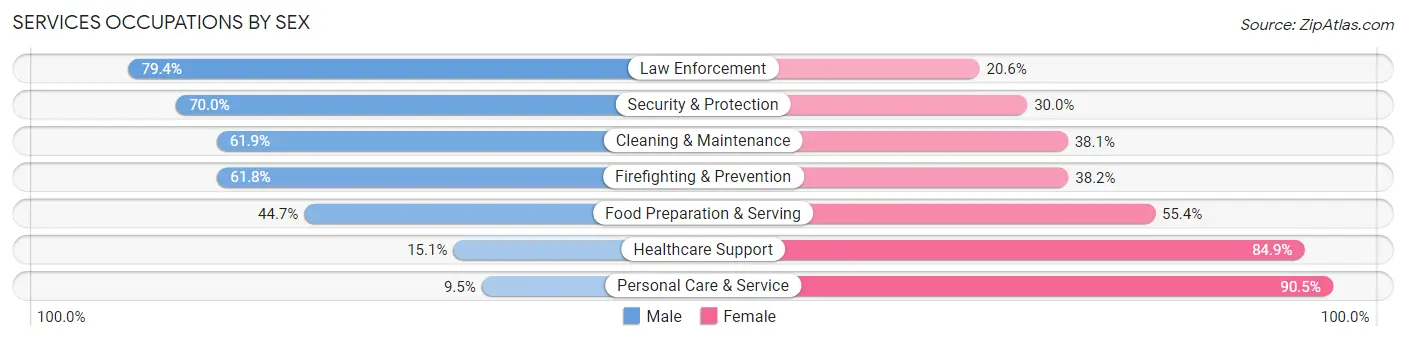
Services Occupations by Sex
Within the Services occupations in Eau Claire County, the most male-oriented occupations are Law Enforcement (79.4%), Security & Protection (70.0%), and Cleaning & Maintenance (61.9%), while the most female-oriented occupations are Personal Care & Service (90.5%), Healthcare Support (84.9%), and Food Preparation & Serving (55.3%).
| Occupation | Male | Female |
| Healthcare Support | 303 (15.1%) | 1,701 (84.9%) |
| Security & Protection | 601 (70.0%) | 258 (30.0%) |
| Firefighting & Prevention | 285 (61.8%) | 176 (38.2%) |
| Law Enforcement | 316 (79.4%) | 82 (20.6%) |
| Food Preparation & Serving | 1,464 (44.7%) | 1,815 (55.3%) |
| Cleaning & Maintenance | 874 (61.9%) | 537 (38.1%) |
| Personal Care & Service | 184 (9.5%) | 1,750 (90.5%) |
| Total (Category) | 3,426 (36.1%) | 6,061 (63.9%) |
| Total (Overall) | 30,090 (51.9%) | 27,889 (48.1%) |
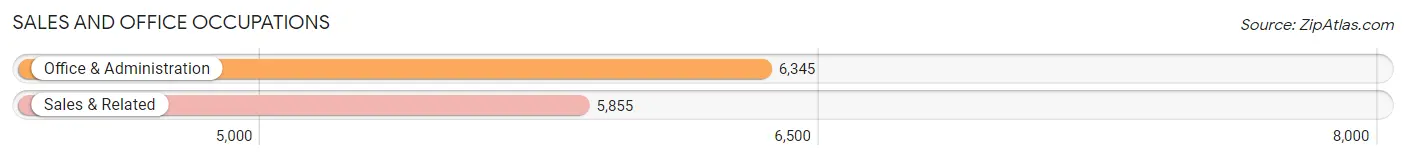
Sales and Office Occupations
The most common Sales and Office occupations in Eau Claire County are Office & Administration (6,345 | 10.9%), and Sales & Related (5,855 | 10.1%).
Sales and Office Occupations by Sex
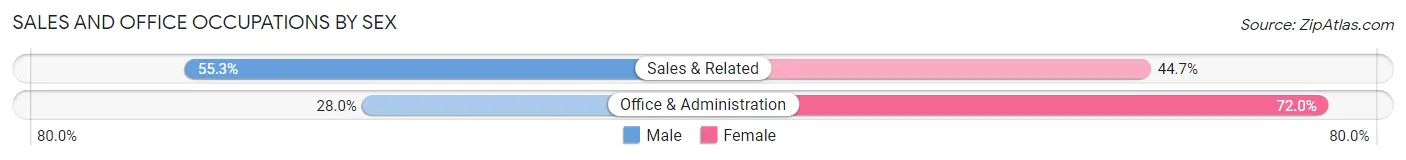
| Occupation | Male | Female |
| Sales & Related | 3,240 (55.3%) | 2,615 (44.7%) |
| Office & Administration | 1,776 (28.0%) | 4,569 (72.0%) |
| Total (Category) | 5,016 (41.1%) | 7,184 (58.9%) |
| Total (Overall) | 30,090 (51.9%) | 27,889 (48.1%) |
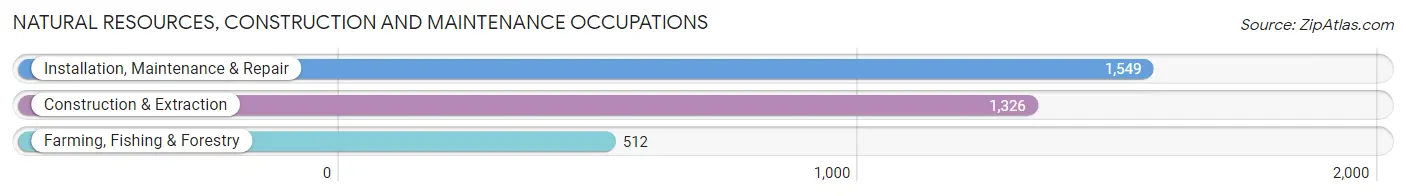
Natural Resources, Construction and Maintenance Occupations
The most common Natural Resources, Construction and Maintenance occupations in Eau Claire County are Installation, Maintenance & Repair (1,549 | 2.7%), Construction & Extraction (1,326 | 2.3%), and Farming, Fishing & Forestry (512 | 0.9%).
Natural Resources, Construction and Maintenance Occupations by Sex
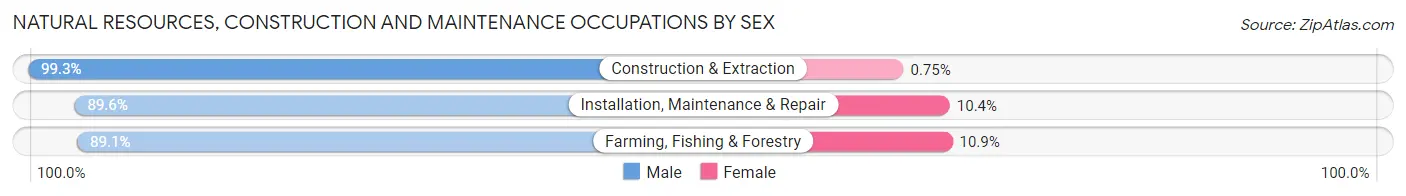
| Occupation | Male | Female |
| Farming, Fishing & Forestry | 456 (89.1%) | 56 (10.9%) |
| Construction & Extraction | 1,316 (99.3%) | 10 (0.7%) |
| Installation, Maintenance & Repair | 1,388 (89.6%) | 161 (10.4%) |
| Total (Category) | 3,160 (93.3%) | 227 (6.7%) |
| Total (Overall) | 30,090 (51.9%) | 27,889 (48.1%) |
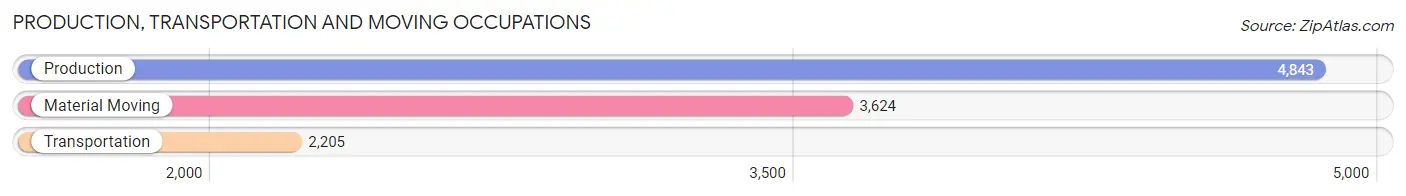
Production, Transportation and Moving Occupations
The most common Production, Transportation and Moving occupations in Eau Claire County are Production (4,843 | 8.4%), Material Moving (3,624 | 6.2%), and Transportation (2,205 | 3.8%).
Production, Transportation and Moving Occupations by Sex
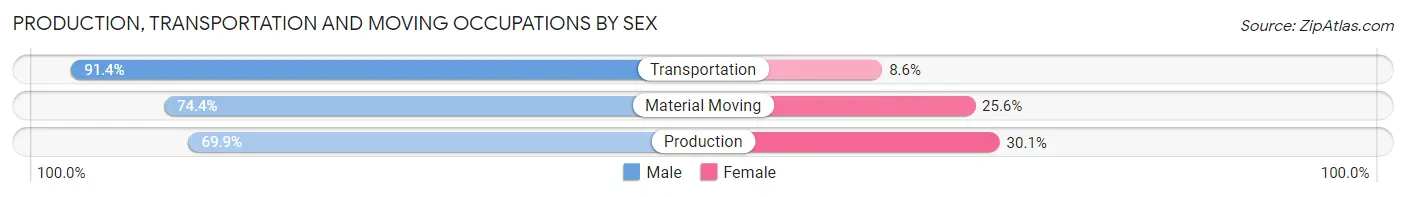
| Occupation | Male | Female |
| Production | 3,385 (69.9%) | 1,458 (30.1%) |
| Transportation | 2,016 (91.4%) | 189 (8.6%) |
| Material Moving | 2,696 (74.4%) | 928 (25.6%) |
| Total (Category) | 8,097 (75.9%) | 2,575 (24.1%) |
| Total (Overall) | 30,090 (51.9%) | 27,889 (48.1%) |
Employment Industries by Sex in Eau Claire County
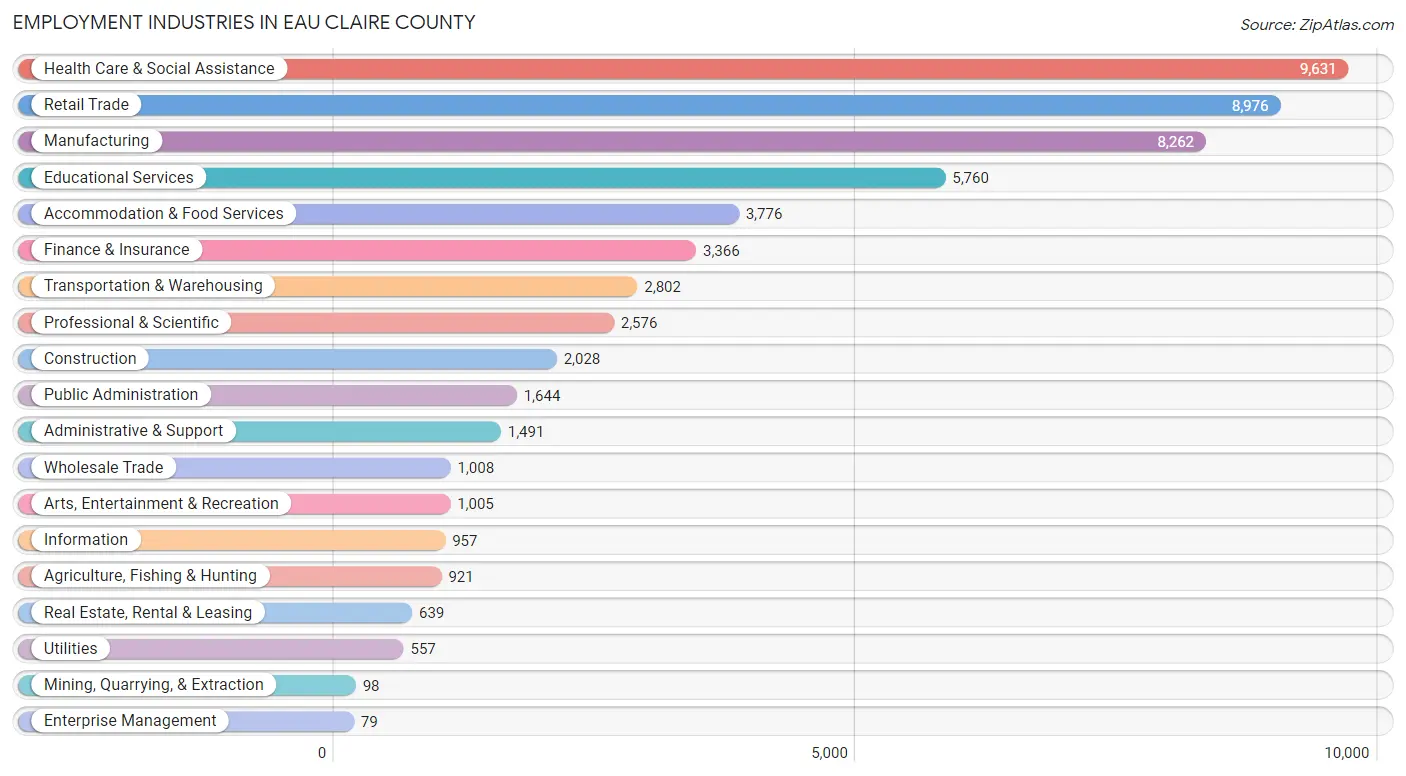
Employment Industries in Eau Claire County
The major employment industries in Eau Claire County include Health Care & Social Assistance (9,631 | 16.6%), Retail Trade (8,976 | 15.5%), Manufacturing (8,262 | 14.2%), Educational Services (5,760 | 9.9%), and Accommodation & Food Services (3,776 | 6.5%).
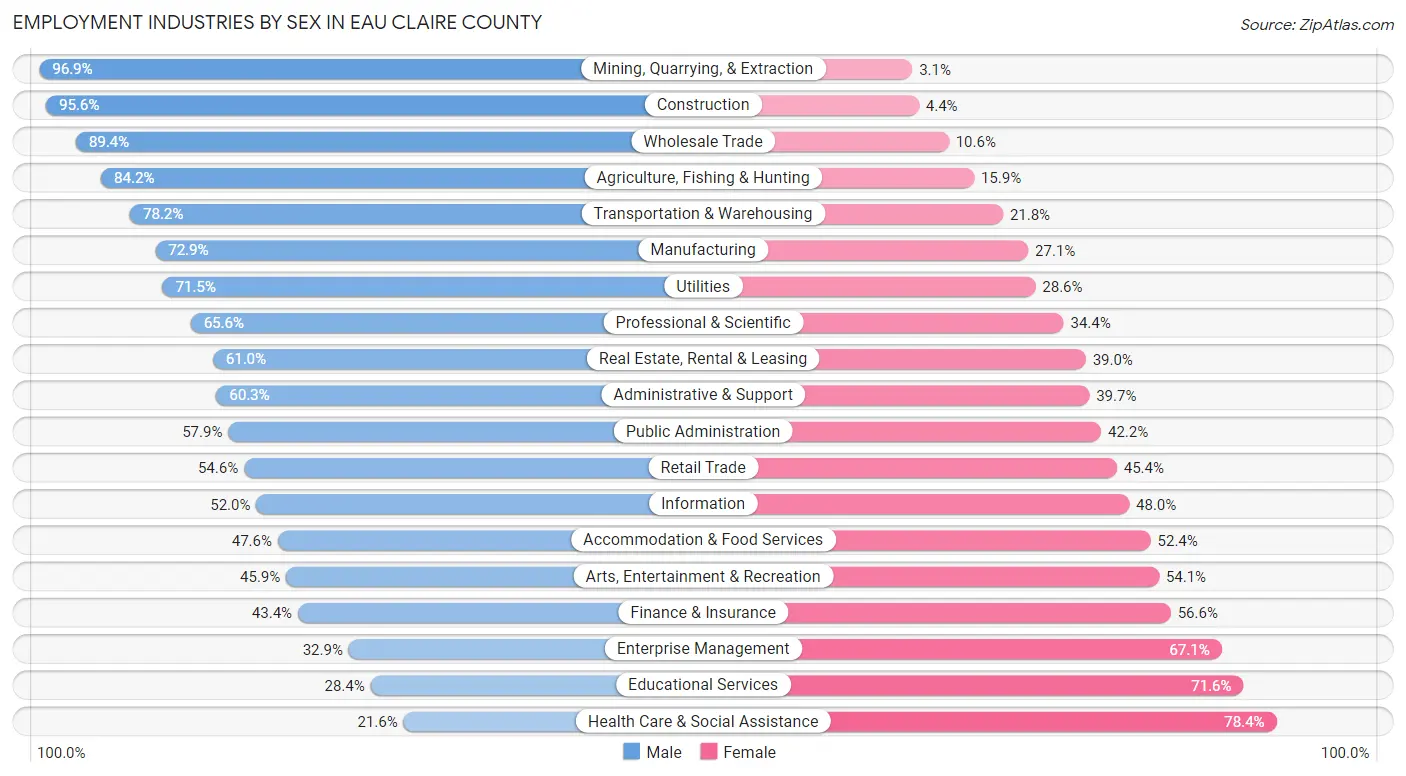
Employment Industries by Sex in Eau Claire County
The Eau Claire County industries that see more men than women are Mining, Quarrying, & Extraction (96.9%), Construction (95.6%), and Wholesale Trade (89.4%), whereas the industries that tend to have a higher number of women are Health Care & Social Assistance (78.4%), Educational Services (71.6%), and Enterprise Management (67.1%).
| Industry | Male | Female |
| Agriculture, Fishing & Hunting | 775 (84.2%) | 146 (15.9%) |
| Mining, Quarrying, & Extraction | 95 (96.9%) | 3 (3.1%) |
| Construction | 1,938 (95.6%) | 90 (4.4%) |
| Manufacturing | 6,026 (72.9%) | 2,236 (27.1%) |
| Wholesale Trade | 901 (89.4%) | 107 (10.6%) |
| Retail Trade | 4,900 (54.6%) | 4,076 (45.4%) |
| Transportation & Warehousing | 2,190 (78.2%) | 612 (21.8%) |
| Utilities | 398 (71.5%) | 159 (28.5%) |
| Information | 498 (52.0%) | 459 (48.0%) |
| Finance & Insurance | 1,462 (43.4%) | 1,904 (56.6%) |
| Real Estate, Rental & Leasing | 390 (61.0%) | 249 (39.0%) |
| Professional & Scientific | 1,690 (65.6%) | 886 (34.4%) |
| Enterprise Management | 26 (32.9%) | 53 (67.1%) |
| Administrative & Support | 899 (60.3%) | 592 (39.7%) |
| Educational Services | 1,636 (28.4%) | 4,124 (71.6%) |
| Health Care & Social Assistance | 2,076 (21.6%) | 7,555 (78.4%) |
| Arts, Entertainment & Recreation | 461 (45.9%) | 544 (54.1%) |
| Accommodation & Food Services | 1,797 (47.6%) | 1,979 (52.4%) |
| Public Administration | 951 (57.9%) | 693 (42.1%) |
| Total | 30,090 (51.9%) | 27,889 (48.1%) |
Education in Eau Claire County
School Enrollment in Eau Claire County
The most common levels of schooling among the 28,949 students in Eau Claire County are college / undergraduate (11,122 | 38.4%), middle school (5,176 | 17.9%), and high school (4,875 | 16.8%).
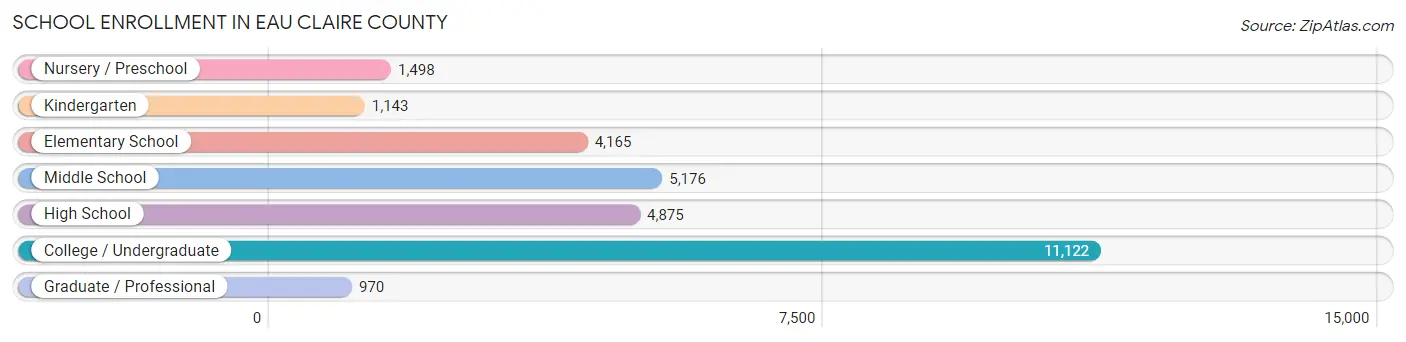
| School Level | # Students | % Students |
| Nursery / Preschool | 1,498 | 5.2% |
| Kindergarten | 1,143 | 4.0% |
| Elementary School | 4,165 | 14.4% |
| Middle School | 5,176 | 17.9% |
| High School | 4,875 | 16.8% |
| College / Undergraduate | 11,122 | 38.4% |
| Graduate / Professional | 970 | 3.4% |
| Total | 28,949 | 100.0% |
School Enrollment by Age by Funding Source in Eau Claire County
Out of a total of 28,949 students who are enrolled in schools in Eau Claire County, 2,750 (9.5%) attend a private institution, while the remaining 26,199 (90.5%) are enrolled in public schools. The age group of 3 to 4 year olds has the highest likelihood of being enrolled in private schools, with 302 (32.7% in the age bracket) enrolled. Conversely, the age group of 20 to 24 year olds has the lowest likelihood of being enrolled in a private school, with 6,431 (95.1% in the age bracket) attending a public institution.
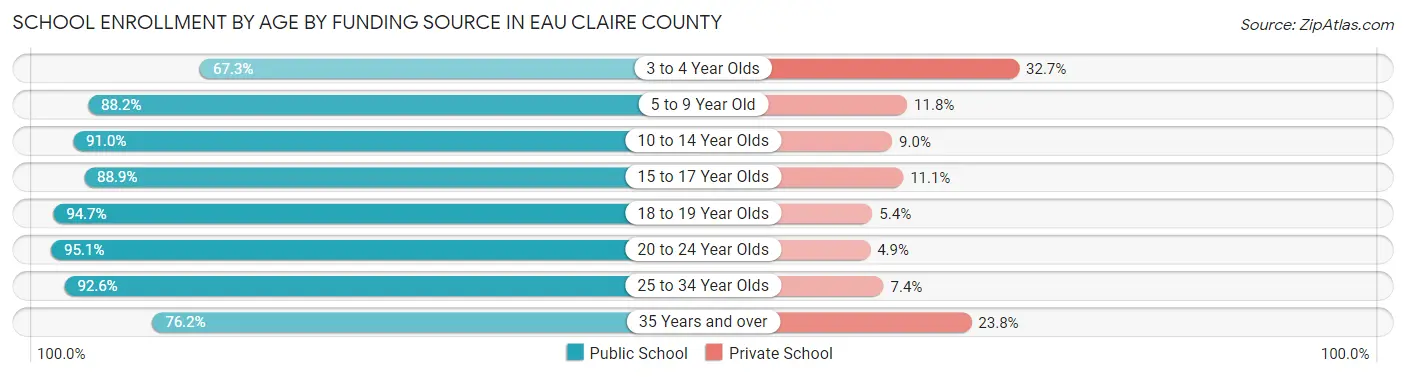
| Age Bracket | Public School | Private School |
| 3 to 4 Year Olds | 622 (67.3%) | 302 (32.7%) |
| 5 to 9 Year Old | 4,732 (88.2%) | 634 (11.8%) |
| 10 to 14 Year Olds | 5,732 (91.0%) | 569 (9.0%) |
| 15 to 17 Year Olds | 3,166 (88.9%) | 395 (11.1%) |
| 18 to 19 Year Olds | 3,572 (94.7%) | 202 (5.3%) |
| 20 to 24 Year Olds | 6,431 (95.1%) | 334 (4.9%) |
| 25 to 34 Year Olds | 1,246 (92.6%) | 100 (7.4%) |
| 35 Years and over | 695 (76.2%) | 217 (23.8%) |
| Total | 26,199 (90.5%) | 2,750 (9.5%) |
Educational Attainment by Field of Study in Eau Claire County
Business (4,929 | 18.7%), education (3,913 | 14.9%), science & technology (3,224 | 12.2%), bio, nature & agricultural (2,068 | 7.9%), and arts & humanities (1,869 | 7.1%) are the most common fields of study among 26,331 individuals in Eau Claire County who have obtained a bachelor's degree or higher.
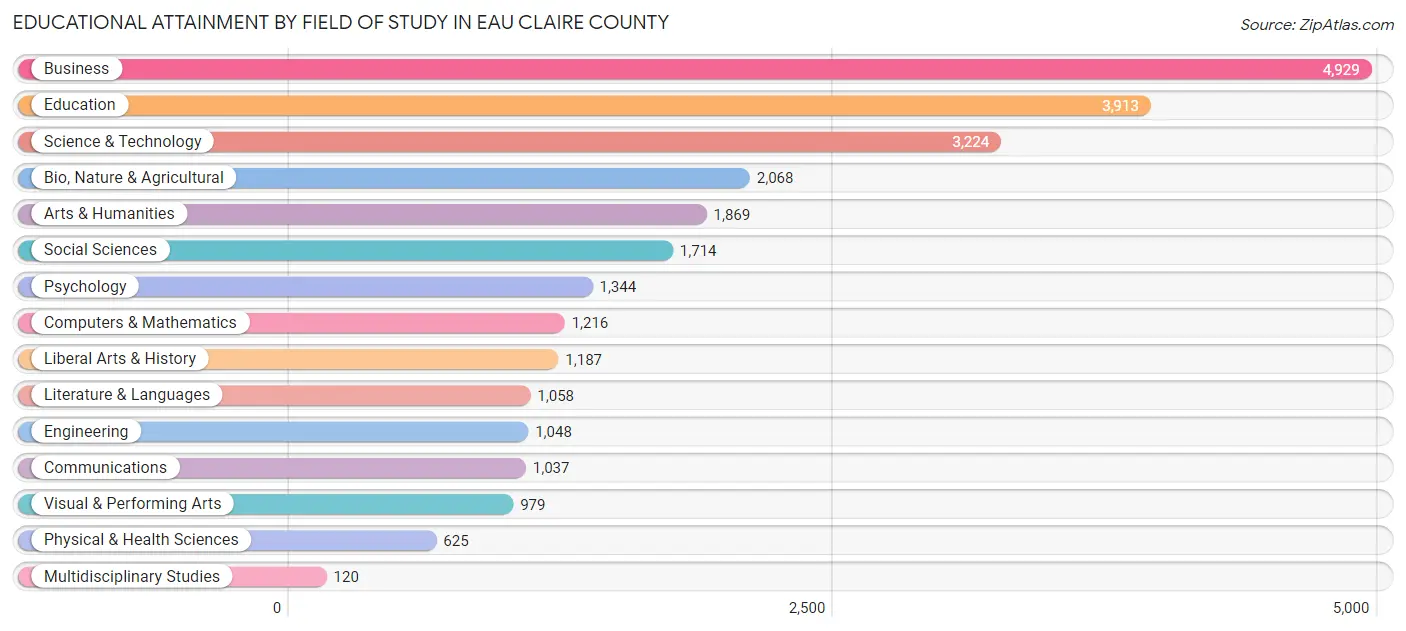
| Field of Study | # Graduates | % Graduates |
| Computers & Mathematics | 1,216 | 4.6% |
| Bio, Nature & Agricultural | 2,068 | 7.9% |
| Physical & Health Sciences | 625 | 2.4% |
| Psychology | 1,344 | 5.1% |
| Social Sciences | 1,714 | 6.5% |
| Engineering | 1,048 | 4.0% |
| Multidisciplinary Studies | 120 | 0.5% |
| Science & Technology | 3,224 | 12.2% |
| Business | 4,929 | 18.7% |
| Education | 3,913 | 14.9% |
| Literature & Languages | 1,058 | 4.0% |
| Liberal Arts & History | 1,187 | 4.5% |
| Visual & Performing Arts | 979 | 3.7% |
| Communications | 1,037 | 3.9% |
| Arts & Humanities | 1,869 | 7.1% |
| Total | 26,331 | 100.0% |
Transportation & Commute in Eau Claire County
Vehicle Availability by Sex in Eau Claire County
The most prevalent vehicle ownership categories in Eau Claire County are males with 2 vehicles (13,285, accounting for 45.6%) and females with 2 vehicles (11,704, making up 50.6%).
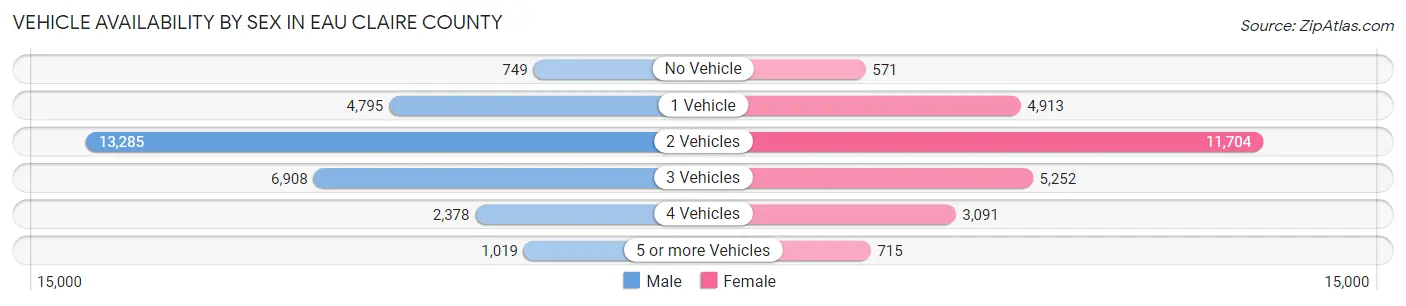
| Vehicles Available | Male | Female |
| No Vehicle | 749 (2.6%) | 571 (2.2%) |
| 1 Vehicle | 4,795 (16.5%) | 4,913 (18.7%) |
| 2 Vehicles | 13,285 (45.6%) | 11,704 (44.6%) |
| 3 Vehicles | 6,908 (23.7%) | 5,252 (20.0%) |
| 4 Vehicles | 2,378 (8.2%) | 3,091 (11.8%) |
| 5 or more Vehicles | 1,019 (3.5%) | 715 (2.7%) |
| Total | 29,134 (100.0%) | 26,246 (100.0%) |
Commute Time in Eau Claire County
The most frequently occuring commute durations in Eau Claire County are 10 to 14 minutes (13,299 commuters, 26.1%), 15 to 19 minutes (11,276 commuters, 22.1%), and 5 to 9 minutes (8,696 commuters, 17.1%).
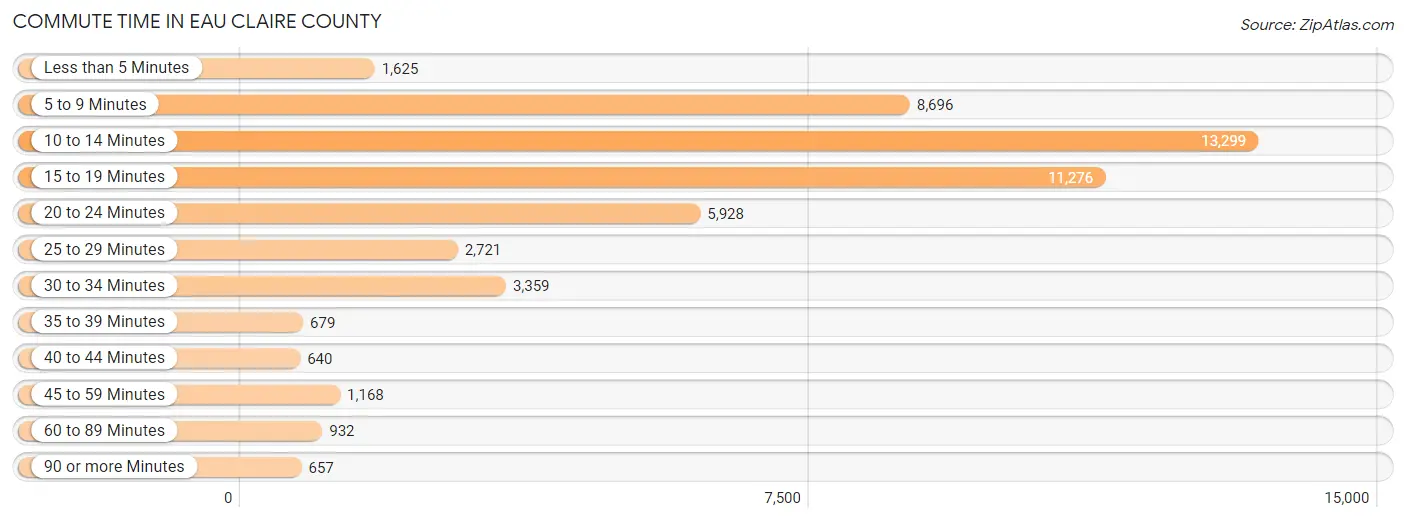
| Commute Time | # Commuters | % Commuters |
| Less than 5 Minutes | 1,625 | 3.2% |
| 5 to 9 Minutes | 8,696 | 17.1% |
| 10 to 14 Minutes | 13,299 | 26.1% |
| 15 to 19 Minutes | 11,276 | 22.1% |
| 20 to 24 Minutes | 5,928 | 11.6% |
| 25 to 29 Minutes | 2,721 | 5.3% |
| 30 to 34 Minutes | 3,359 | 6.6% |
| 35 to 39 Minutes | 679 | 1.3% |
| 40 to 44 Minutes | 640 | 1.3% |
| 45 to 59 Minutes | 1,168 | 2.3% |
| 60 to 89 Minutes | 932 | 1.8% |
| 90 or more Minutes | 657 | 1.3% |
Commute Time by Sex in Eau Claire County
The most common commute times in Eau Claire County are 10 to 14 minutes (6,368 commuters, 23.6%) for males and 10 to 14 minutes (6,931 commuters, 28.9%) for females.
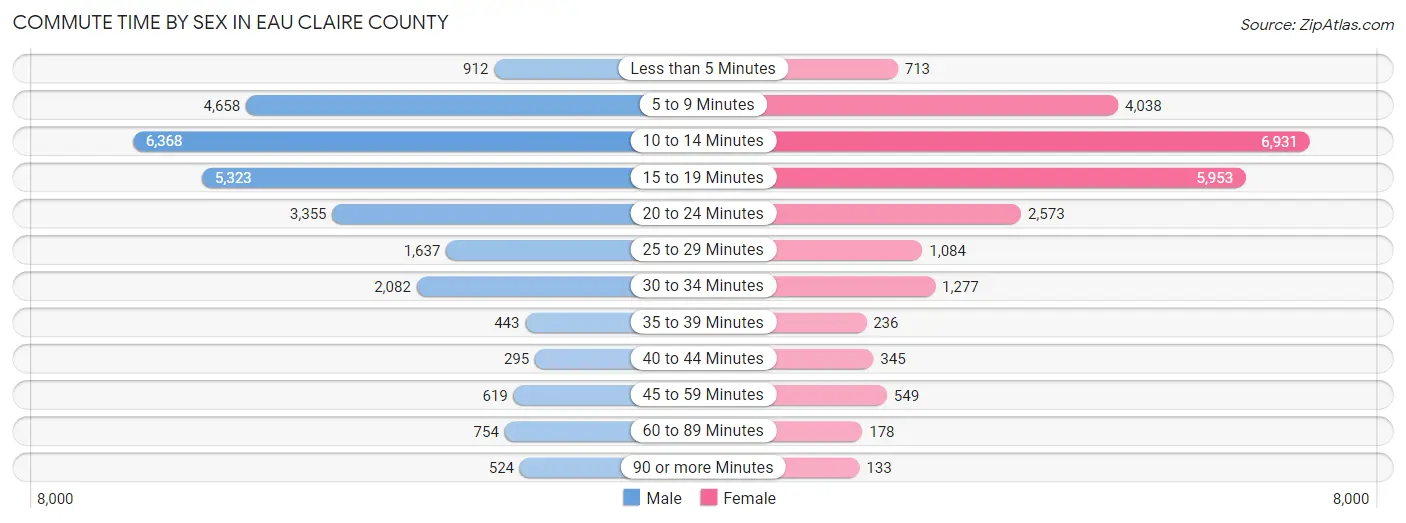
| Commute Time | Male | Female |
| Less than 5 Minutes | 912 (3.4%) | 713 (3.0%) |
| 5 to 9 Minutes | 4,658 (17.3%) | 4,038 (16.8%) |
| 10 to 14 Minutes | 6,368 (23.6%) | 6,931 (28.9%) |
| 15 to 19 Minutes | 5,323 (19.7%) | 5,953 (24.8%) |
| 20 to 24 Minutes | 3,355 (12.4%) | 2,573 (10.7%) |
| 25 to 29 Minutes | 1,637 (6.1%) | 1,084 (4.5%) |
| 30 to 34 Minutes | 2,082 (7.7%) | 1,277 (5.3%) |
| 35 to 39 Minutes | 443 (1.6%) | 236 (1.0%) |
| 40 to 44 Minutes | 295 (1.1%) | 345 (1.4%) |
| 45 to 59 Minutes | 619 (2.3%) | 549 (2.3%) |
| 60 to 89 Minutes | 754 (2.8%) | 178 (0.7%) |
| 90 or more Minutes | 524 (1.9%) | 133 (0.5%) |
Time of Departure to Work by Sex in Eau Claire County
The most frequent times of departure to work in Eau Claire County are 7:30 AM to 7:59 AM (3,600, 13.4%) for males and 7:30 AM to 7:59 AM (3,894, 16.2%) for females.
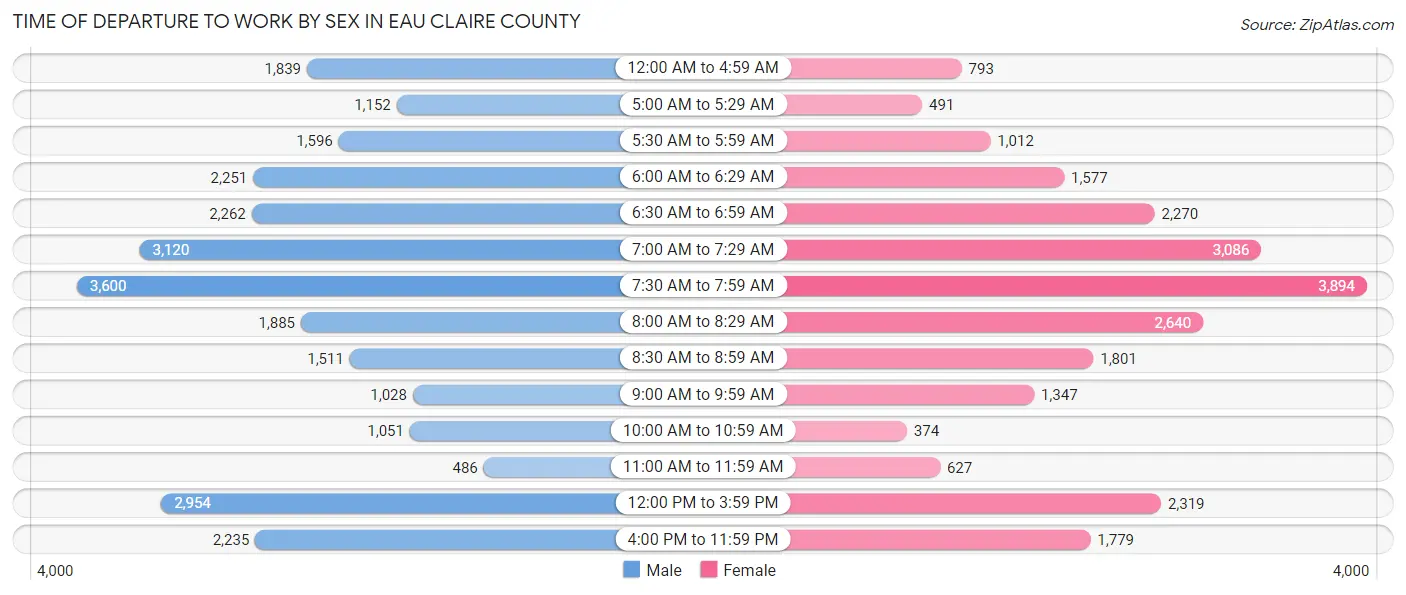
| Time of Departure | Male | Female |
| 12:00 AM to 4:59 AM | 1,839 (6.8%) | 793 (3.3%) |
| 5:00 AM to 5:29 AM | 1,152 (4.3%) | 491 (2.0%) |
| 5:30 AM to 5:59 AM | 1,596 (5.9%) | 1,012 (4.2%) |
| 6:00 AM to 6:29 AM | 2,251 (8.4%) | 1,577 (6.6%) |
| 6:30 AM to 6:59 AM | 2,262 (8.4%) | 2,270 (9.5%) |
| 7:00 AM to 7:29 AM | 3,120 (11.6%) | 3,086 (12.9%) |
| 7:30 AM to 7:59 AM | 3,600 (13.4%) | 3,894 (16.2%) |
| 8:00 AM to 8:29 AM | 1,885 (7.0%) | 2,640 (11.0%) |
| 8:30 AM to 8:59 AM | 1,511 (5.6%) | 1,801 (7.5%) |
| 9:00 AM to 9:59 AM | 1,028 (3.8%) | 1,347 (5.6%) |
| 10:00 AM to 10:59 AM | 1,051 (3.9%) | 374 (1.6%) |
| 11:00 AM to 11:59 AM | 486 (1.8%) | 627 (2.6%) |
| 12:00 PM to 3:59 PM | 2,954 (11.0%) | 2,319 (9.7%) |
| 4:00 PM to 11:59 PM | 2,235 (8.3%) | 1,779 (7.4%) |
| Total | 26,970 (100.0%) | 24,010 (100.0%) |
Housing Occupancy in Eau Claire County
Occupancy by Ownership in Eau Claire County
Of the total 42,481 dwellings in Eau Claire County, owner-occupied units account for 26,983 (63.5%), while renter-occupied units make up 15,498 (36.5%).
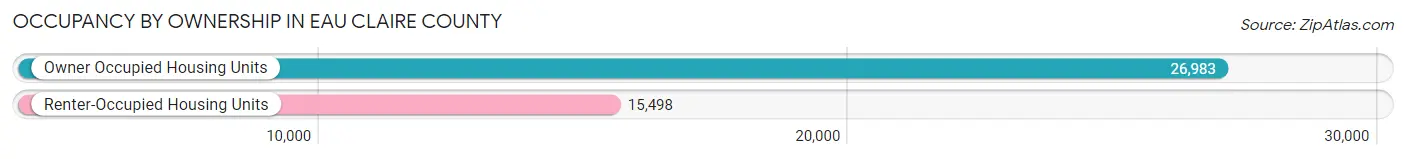
| Occupancy | # Housing Units | % Housing Units |
| Owner Occupied Housing Units | 26,983 | 63.5% |
| Renter-Occupied Housing Units | 15,498 | 36.5% |
| Total Occupied Housing Units | 42,481 | 100.0% |
Occupancy by Household Size in Eau Claire County
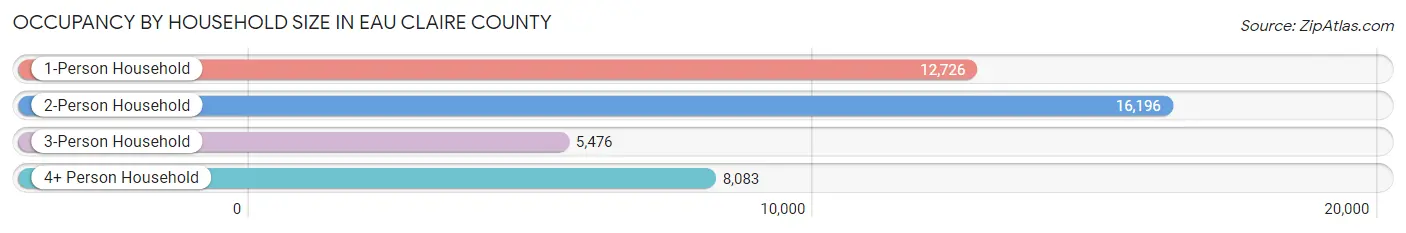
| Household Size | # Housing Units | % Housing Units |
| 1-Person Household | 12,726 | 30.0% |
| 2-Person Household | 16,196 | 38.1% |
| 3-Person Household | 5,476 | 12.9% |
| 4+ Person Household | 8,083 | 19.0% |
| Total Housing Units | 42,481 | 100.0% |
Occupancy by Ownership by Household Size in Eau Claire County
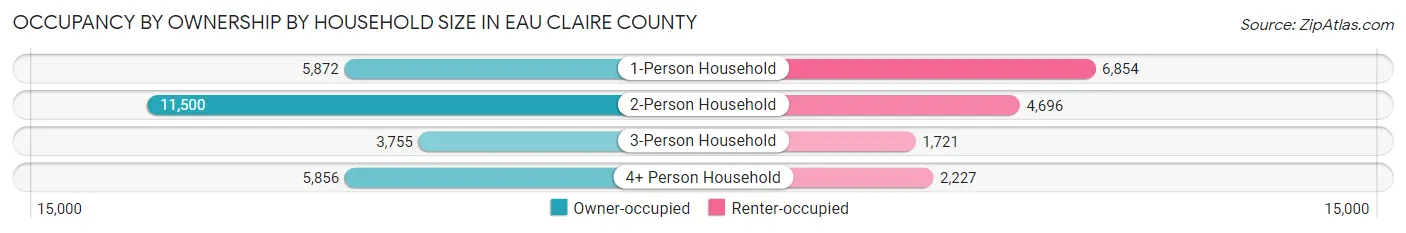
| Household Size | Owner-occupied | Renter-occupied |
| 1-Person Household | 5,872 (46.1%) | 6,854 (53.9%) |
| 2-Person Household | 11,500 (71.0%) | 4,696 (29.0%) |
| 3-Person Household | 3,755 (68.6%) | 1,721 (31.4%) |
| 4+ Person Household | 5,856 (72.5%) | 2,227 (27.6%) |
| Total Housing Units | 26,983 (63.5%) | 15,498 (36.5%) |
Occupancy by Educational Attainment in Eau Claire County
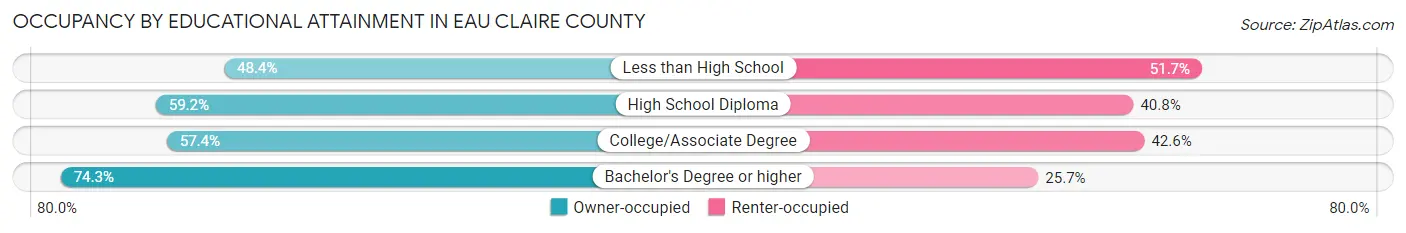
| Household Size | Owner-occupied | Renter-occupied |
| Less than High School | 661 (48.3%) | 706 (51.6%) |
| High School Diploma | 5,964 (59.2%) | 4,112 (40.8%) |
| College/Associate Degree | 9,191 (57.4%) | 6,811 (42.6%) |
| Bachelor's Degree or higher | 11,167 (74.3%) | 3,869 (25.7%) |
Occupancy by Age of Householder in Eau Claire County
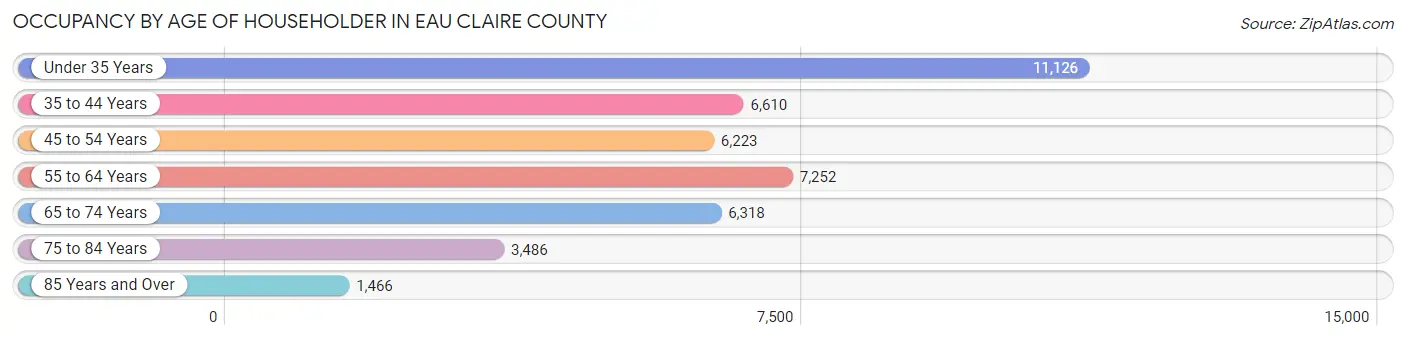
| Age Bracket | # Households | % Households |
| Under 35 Years | 11,126 | 26.2% |
| 35 to 44 Years | 6,610 | 15.6% |
| 45 to 54 Years | 6,223 | 14.6% |
| 55 to 64 Years | 7,252 | 17.1% |
| 65 to 74 Years | 6,318 | 14.9% |
| 75 to 84 Years | 3,486 | 8.2% |
| 85 Years and Over | 1,466 | 3.5% |
| Total | 42,481 | 100.0% |
Housing Finances in Eau Claire County
Median Income by Occupancy in Eau Claire County
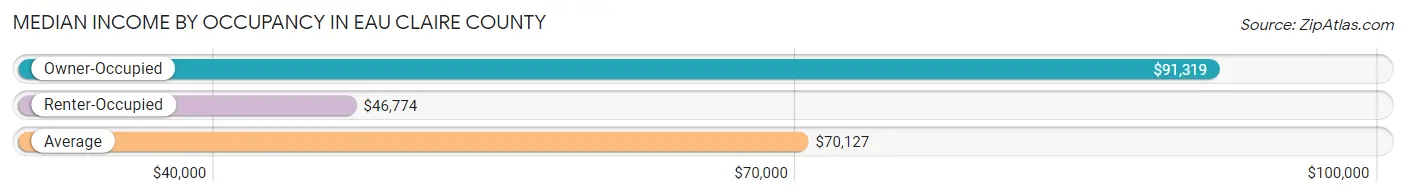
| Occupancy Type | # Households | Median Income |
| Owner-Occupied | 26,983 (63.5%) | $91,319 |
| Renter-Occupied | 15,498 (36.5%) | $46,774 |
| Average | 42,481 (100.0%) | $70,127 |
Occupancy by Householder Income Bracket in Eau Claire County
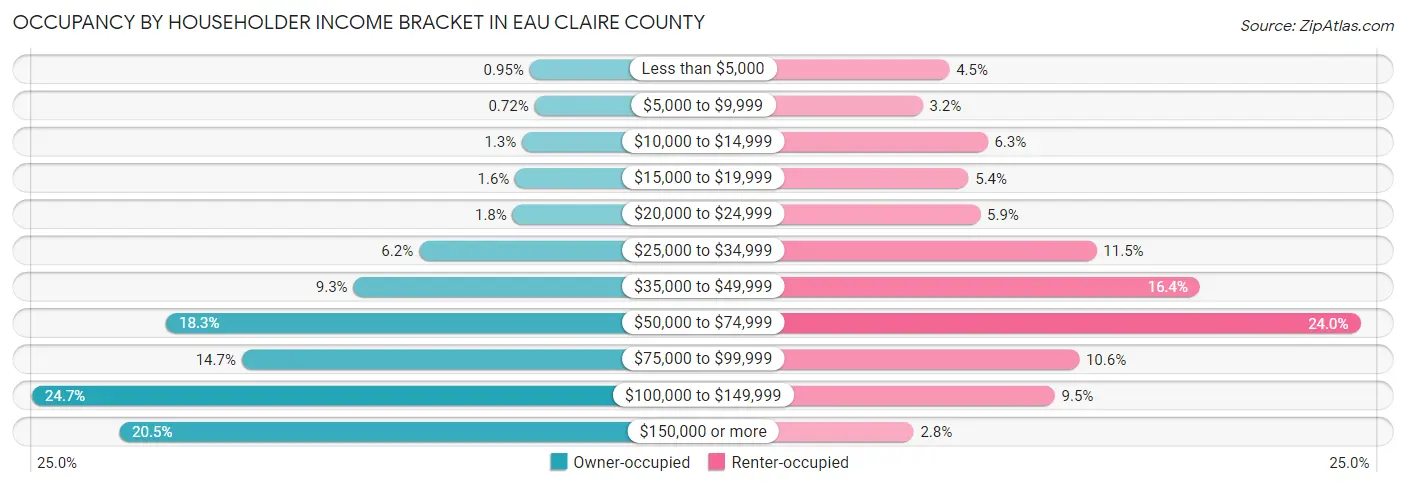
| Income Bracket | Owner-occupied | Renter-occupied |
| Less than $5,000 | 257 (0.9%) | 691 (4.5%) |
| $5,000 to $9,999 | 195 (0.7%) | 494 (3.2%) |
| $10,000 to $14,999 | 354 (1.3%) | 974 (6.3%) |
| $15,000 to $19,999 | 442 (1.6%) | 833 (5.4%) |
| $20,000 to $24,999 | 474 (1.8%) | 919 (5.9%) |
| $25,000 to $34,999 | 1,678 (6.2%) | 1,777 (11.5%) |
| $35,000 to $49,999 | 2,519 (9.3%) | 2,540 (16.4%) |
| $50,000 to $74,999 | 4,927 (18.3%) | 3,724 (24.0%) |
| $75,000 to $99,999 | 3,955 (14.7%) | 1,649 (10.6%) |
| $100,000 to $149,999 | 6,651 (24.6%) | 1,469 (9.5%) |
| $150,000 or more | 5,531 (20.5%) | 428 (2.8%) |
| Total | 26,983 (100.0%) | 15,498 (100.0%) |
Monthly Housing Cost Tiers in Eau Claire County
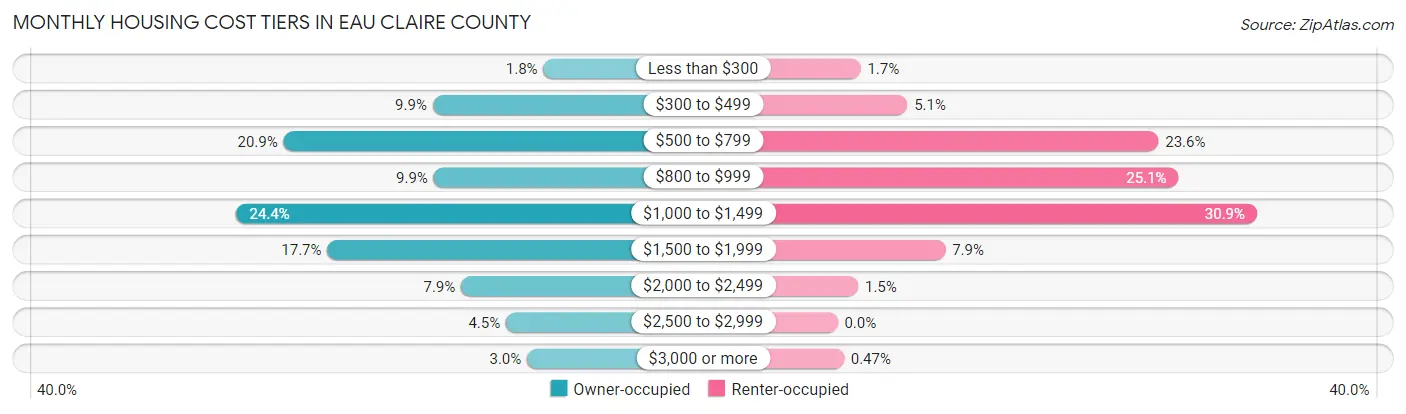
| Monthly Cost | Owner-occupied | Renter-occupied |
| Less than $300 | 482 (1.8%) | 264 (1.7%) |
| $300 to $499 | 2,681 (9.9%) | 797 (5.1%) |
| $500 to $799 | 5,647 (20.9%) | 3,662 (23.6%) |
| $800 to $999 | 2,663 (9.9%) | 3,892 (25.1%) |
| $1,000 to $1,499 | 6,583 (24.4%) | 4,787 (30.9%) |
| $1,500 to $1,999 | 4,775 (17.7%) | 1,230 (7.9%) |
| $2,000 to $2,499 | 2,119 (7.9%) | 236 (1.5%) |
| $2,500 to $2,999 | 1,225 (4.5%) | 0 (0.0%) |
| $3,000 or more | 808 (3.0%) | 73 (0.5%) |
| Total | 26,983 (100.0%) | 15,498 (100.0%) |
Physical Housing Characteristics in Eau Claire County
Housing Structures in Eau Claire County
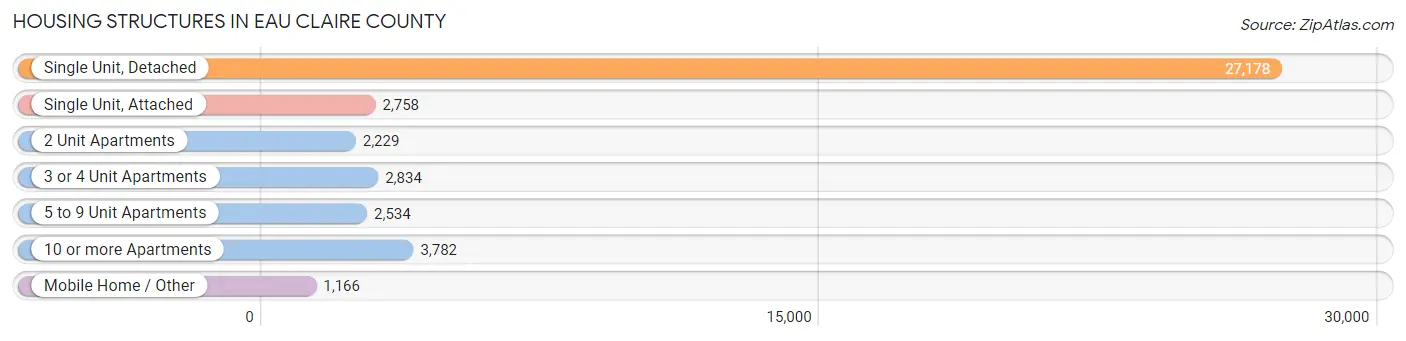
| Structure Type | # Housing Units | % Housing Units |
| Single Unit, Detached | 27,178 | 64.0% |
| Single Unit, Attached | 2,758 | 6.5% |
| 2 Unit Apartments | 2,229 | 5.2% |
| 3 or 4 Unit Apartments | 2,834 | 6.7% |
| 5 to 9 Unit Apartments | 2,534 | 6.0% |
| 10 or more Apartments | 3,782 | 8.9% |
| Mobile Home / Other | 1,166 | 2.7% |
| Total | 42,481 | 100.0% |
Housing Structures by Occupancy in Eau Claire County
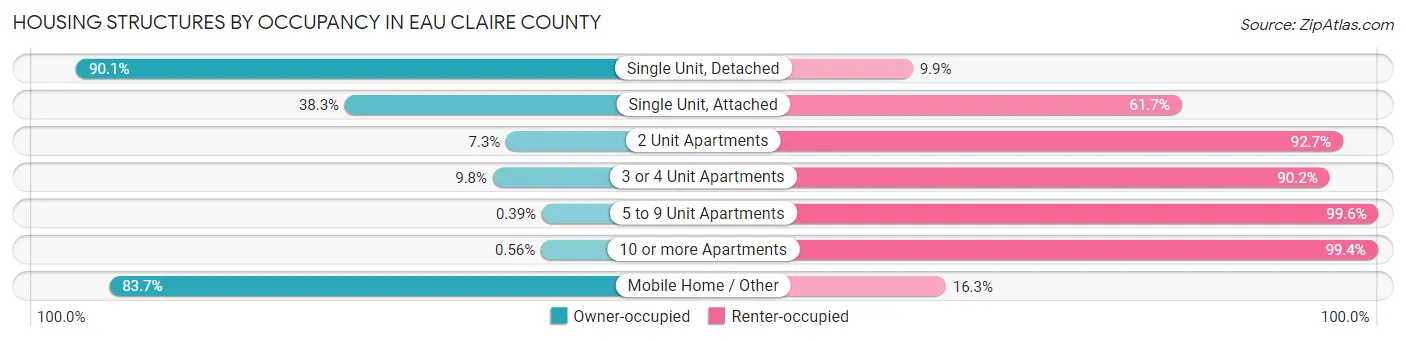
| Structure Type | Owner-occupied | Renter-occupied |
| Single Unit, Detached | 24,478 (90.1%) | 2,700 (9.9%) |
| Single Unit, Attached | 1,057 (38.3%) | 1,701 (61.7%) |
| 2 Unit Apartments | 162 (7.3%) | 2,067 (92.7%) |
| 3 or 4 Unit Apartments | 279 (9.8%) | 2,555 (90.2%) |
| 5 to 9 Unit Apartments | 10 (0.4%) | 2,524 (99.6%) |
| 10 or more Apartments | 21 (0.6%) | 3,761 (99.4%) |
| Mobile Home / Other | 976 (83.7%) | 190 (16.3%) |
| Total | 26,983 (63.5%) | 15,498 (36.5%) |
Housing Structures by Number of Rooms in Eau Claire County
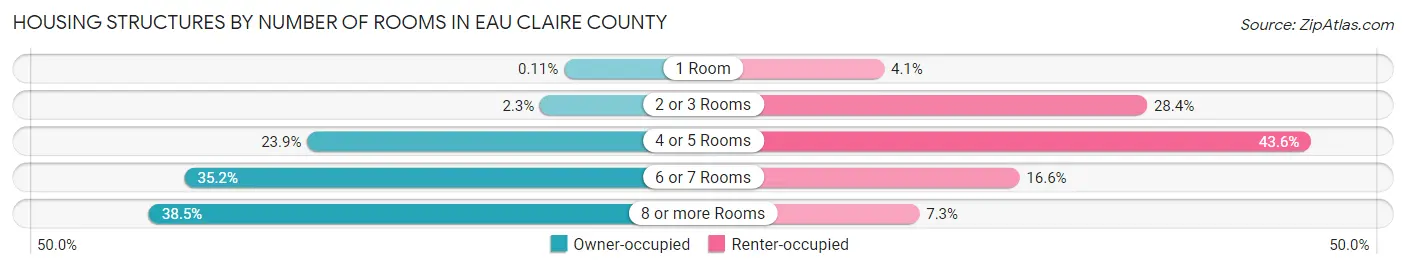
| Number of Rooms | Owner-occupied | Renter-occupied |
| 1 Room | 29 (0.1%) | 632 (4.1%) |
| 2 or 3 Rooms | 629 (2.3%) | 4,402 (28.4%) |
| 4 or 5 Rooms | 6,438 (23.9%) | 6,754 (43.6%) |
| 6 or 7 Rooms | 9,499 (35.2%) | 2,572 (16.6%) |
| 8 or more Rooms | 10,388 (38.5%) | 1,138 (7.3%) |
| Total | 26,983 (100.0%) | 15,498 (100.0%) |
Housing Structure by Heating Type in Eau Claire County
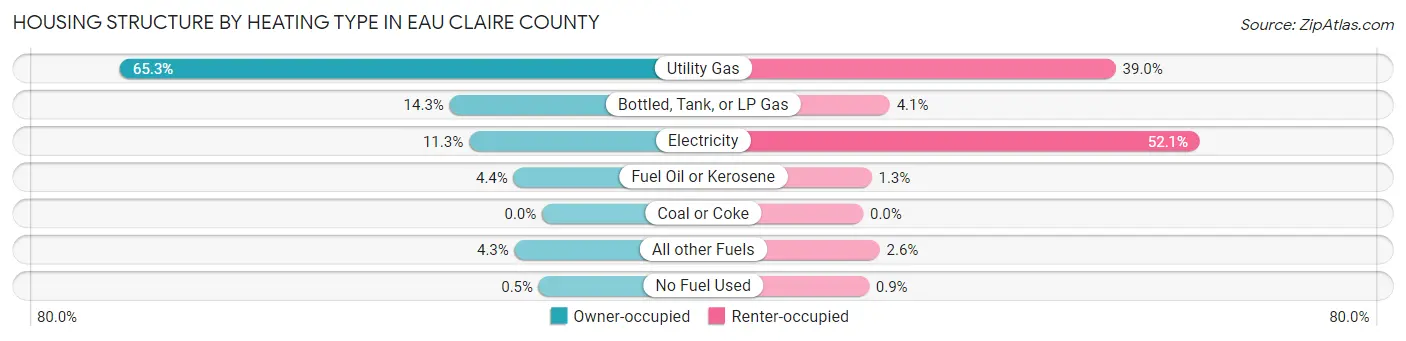
| Heating Type | Owner-occupied | Renter-occupied |
| Utility Gas | 17,610 (65.3%) | 6,050 (39.0%) |
| Bottled, Tank, or LP Gas | 3,855 (14.3%) | 640 (4.1%) |
| Electricity | 3,050 (11.3%) | 8,069 (52.1%) |
| Fuel Oil or Kerosene | 1,186 (4.4%) | 203 (1.3%) |
| Coal or Coke | 0 (0.0%) | 0 (0.0%) |
| All other Fuels | 1,146 (4.3%) | 396 (2.6%) |
| No Fuel Used | 136 (0.5%) | 140 (0.9%) |
| Total | 26,983 (100.0%) | 15,498 (100.0%) |
Household Vehicle Usage in Eau Claire County
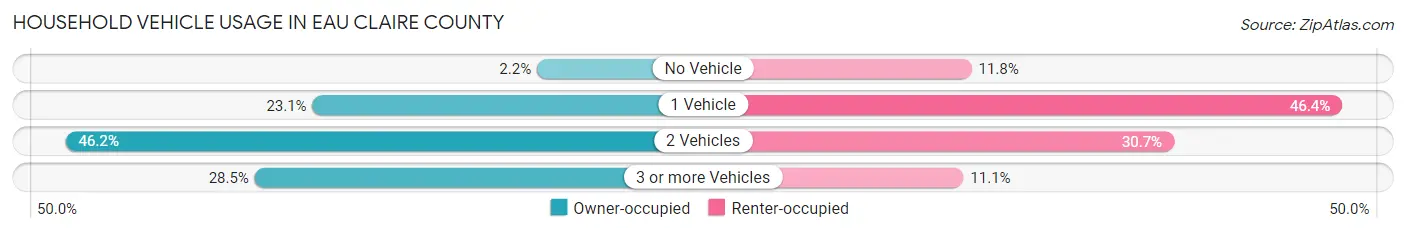
| Vehicles per Household | Owner-occupied | Renter-occupied |
| No Vehicle | 585 (2.2%) | 1,832 (11.8%) |
| 1 Vehicle | 6,242 (23.1%) | 7,193 (46.4%) |
| 2 Vehicles | 12,461 (46.2%) | 4,759 (30.7%) |
| 3 or more Vehicles | 7,695 (28.5%) | 1,714 (11.1%) |
| Total | 26,983 (100.0%) | 15,498 (100.0%) |
Real Estate & Mortgages in Eau Claire County
Real Estate and Mortgage Overview in Eau Claire County
| Characteristic | Without Mortgage | With Mortgage |
| Housing Units | 10,094 | 16,889 |
| Median Property Value | $213,900 | $233,300 |
| Median Household Income | $69,906 | $3,883 |
| Monthly Housing Costs | $592 | $802 |
| Real Estate Taxes | $3,271 | $58 |
Property Value by Mortgage Status in Eau Claire County
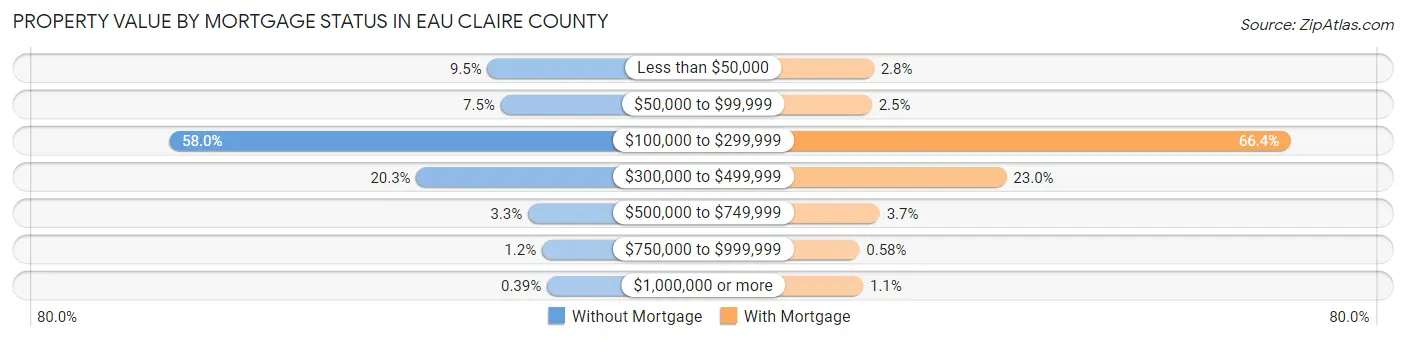
| Property Value | Without Mortgage | With Mortgage |
| Less than $50,000 | 955 (9.5%) | 468 (2.8%) |
| $50,000 to $99,999 | 753 (7.5%) | 418 (2.5%) |
| $100,000 to $299,999 | 5,851 (58.0%) | 11,207 (66.4%) |
| $300,000 to $499,999 | 2,048 (20.3%) | 3,883 (23.0%) |
| $500,000 to $749,999 | 331 (3.3%) | 623 (3.7%) |
| $750,000 to $999,999 | 117 (1.2%) | 98 (0.6%) |
| $1,000,000 or more | 39 (0.4%) | 192 (1.1%) |
| Total | 10,094 (100.0%) | 16,889 (100.0%) |
Household Income by Mortgage Status in Eau Claire County
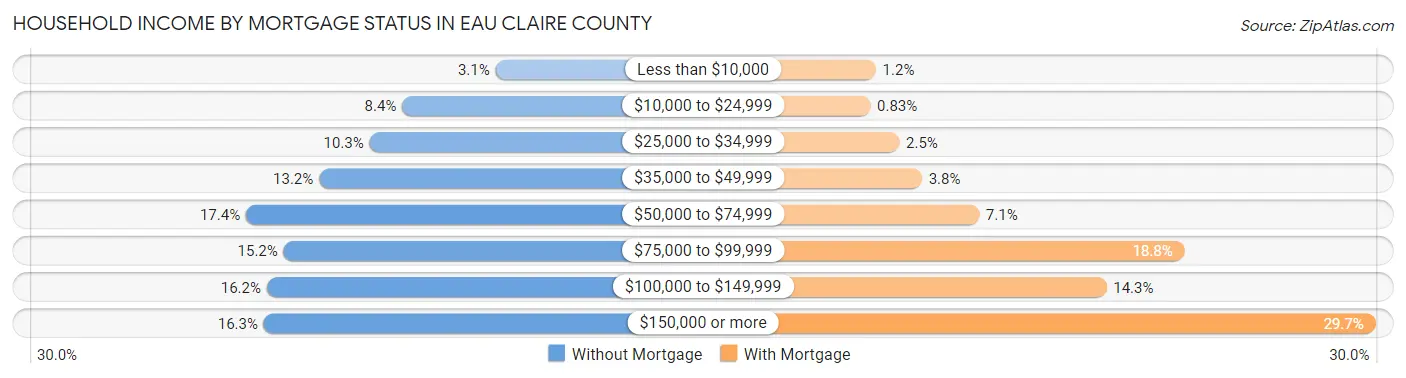
| Household Income | Without Mortgage | With Mortgage |
| Less than $10,000 | 312 (3.1%) | 194 (1.1%) |
| $10,000 to $24,999 | 850 (8.4%) | 140 (0.8%) |
| $25,000 to $34,999 | 1,039 (10.3%) | 420 (2.5%) |
| $35,000 to $49,999 | 1,329 (13.2%) | 639 (3.8%) |
| $50,000 to $74,999 | 1,751 (17.3%) | 1,190 (7.0%) |
| $75,000 to $99,999 | 1,534 (15.2%) | 3,176 (18.8%) |
| $100,000 to $149,999 | 1,631 (16.2%) | 2,421 (14.3%) |
| $150,000 or more | 1,648 (16.3%) | 5,020 (29.7%) |
| Total | 10,094 (100.0%) | 16,889 (100.0%) |
Property Value to Household Income Ratio in Eau Claire County
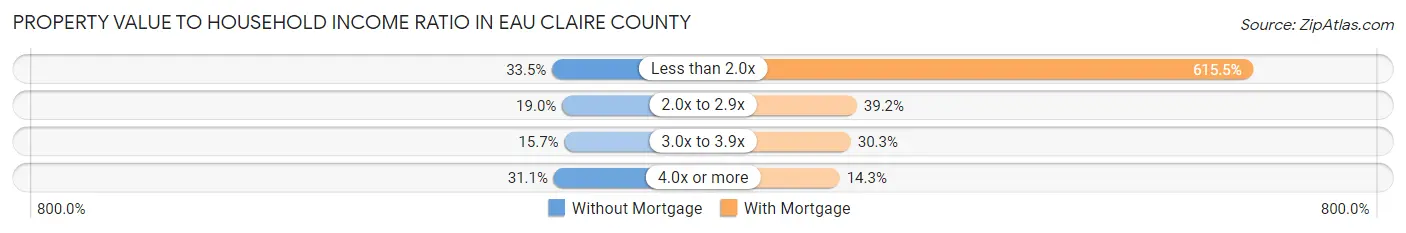
| Value-to-Income Ratio | Without Mortgage | With Mortgage |
| Less than 2.0x | 3,378 (33.5%) | 103,957 (615.5%) |
| 2.0x to 2.9x | 1,916 (19.0%) | 6,613 (39.2%) |
| 3.0x to 3.9x | 1,588 (15.7%) | 5,124 (30.3%) |
| 4.0x or more | 3,142 (31.1%) | 2,410 (14.3%) |
| Total | 10,094 (100.0%) | 16,889 (100.0%) |
Real Estate Taxes by Mortgage Status in Eau Claire County
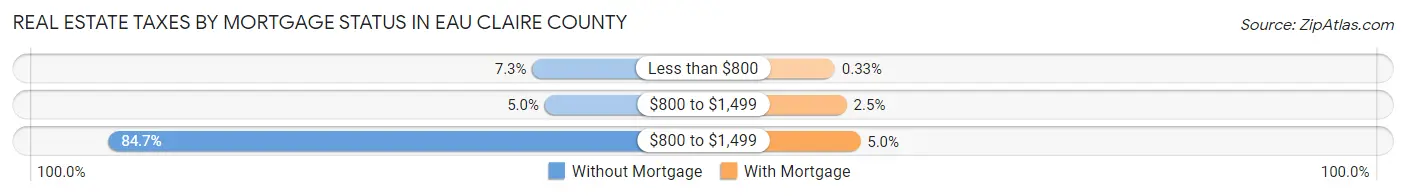
| Property Taxes | Without Mortgage | With Mortgage |
| Less than $800 | 733 (7.3%) | 56 (0.3%) |
| $800 to $1,499 | 504 (5.0%) | 421 (2.5%) |
| $800 to $1,499 | 8,551 (84.7%) | 839 (5.0%) |
| Total | 10,094 (100.0%) | 16,889 (100.0%) |
Health & Disability in Eau Claire County
Health Insurance Coverage by Age in Eau Claire County
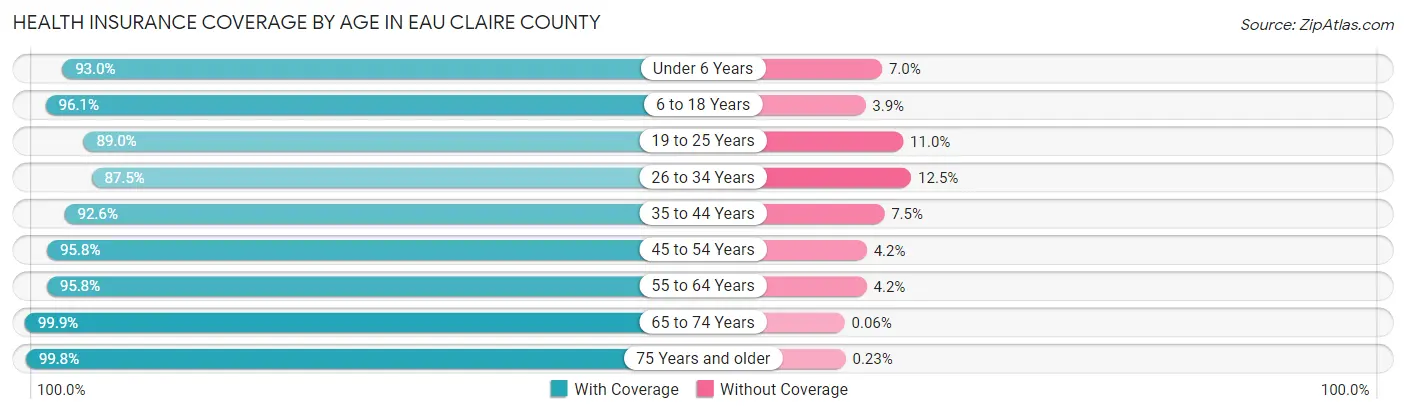
| Age Bracket | With Coverage | Without Coverage |
| Under 6 Years | 6,185 (93.0%) | 467 (7.0%) |
| 6 to 18 Years | 16,380 (96.1%) | 669 (3.9%) |
| 19 to 25 Years | 13,989 (89.0%) | 1,725 (11.0%) |
| 26 to 34 Years | 11,058 (87.5%) | 1,575 (12.5%) |
| 35 to 44 Years | 11,591 (92.5%) | 933 (7.4%) |
| 45 to 54 Years | 10,693 (95.8%) | 466 (4.2%) |
| 55 to 64 Years | 11,951 (95.8%) | 519 (4.2%) |
| 65 to 74 Years | 10,055 (99.9%) | 6 (0.1%) |
| 75 Years and older | 6,852 (99.8%) | 16 (0.2%) |
| Total | 98,754 (93.9%) | 6,376 (6.1%) |
Health Insurance Coverage by Citizenship Status in Eau Claire County
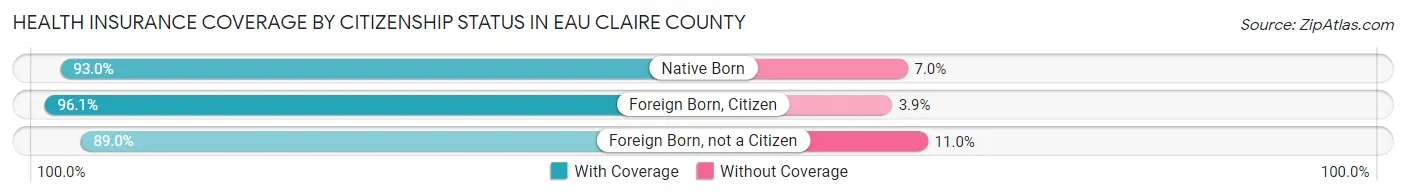
| Citizenship Status | With Coverage | Without Coverage |
| Native Born | 6,185 (93.0%) | 467 (7.0%) |
| Foreign Born, Citizen | 16,380 (96.1%) | 669 (3.9%) |
| Foreign Born, not a Citizen | 13,989 (89.0%) | 1,725 (11.0%) |
Health Insurance Coverage by Household Income in Eau Claire County
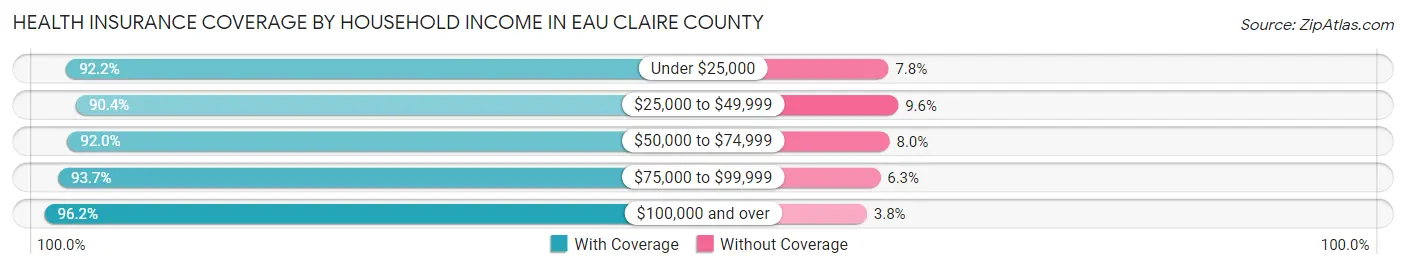
| Household Income | With Coverage | Without Coverage |
| Under $25,000 | 8,628 (92.2%) | 731 (7.8%) |
| $25,000 to $49,999 | 13,348 (90.4%) | 1,422 (9.6%) |
| $50,000 to $74,999 | 16,992 (92.0%) | 1,480 (8.0%) |
| $75,000 to $99,999 | 13,208 (93.7%) | 884 (6.3%) |
| $100,000 and over | 43,399 (96.2%) | 1,697 (3.8%) |
Public vs Private Health Insurance Coverage by Age in Eau Claire County
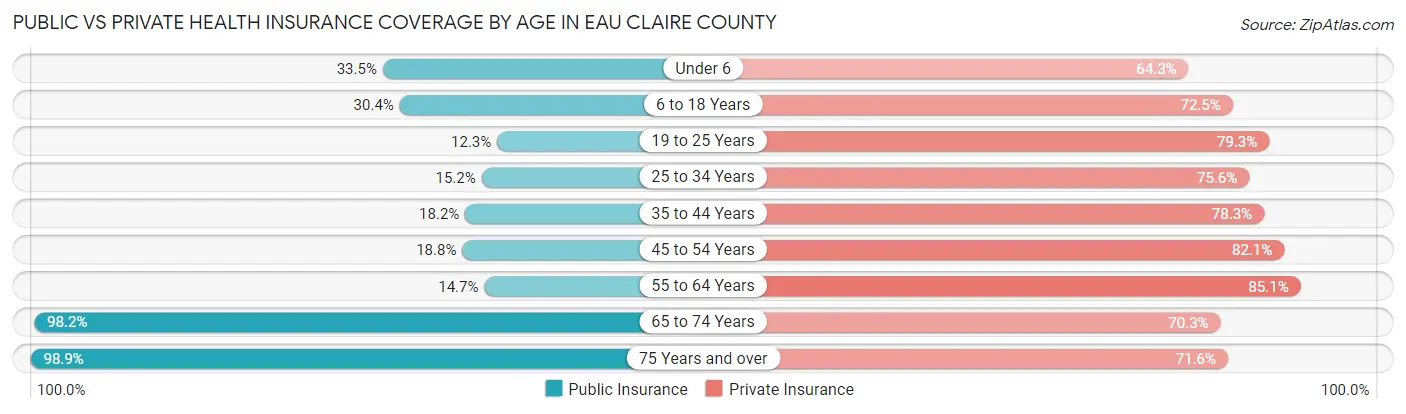
| Age Bracket | Public Insurance | Private Insurance |
| Under 6 | 2,230 (33.5%) | 4,279 (64.3%) |
| 6 to 18 Years | 5,180 (30.4%) | 12,365 (72.5%) |
| 19 to 25 Years | 1,933 (12.3%) | 12,463 (79.3%) |
| 25 to 34 Years | 1,918 (15.2%) | 9,550 (75.6%) |
| 35 to 44 Years | 2,283 (18.2%) | 9,811 (78.3%) |
| 45 to 54 Years | 2,095 (18.8%) | 9,159 (82.1%) |
| 55 to 64 Years | 1,830 (14.7%) | 10,616 (85.1%) |
| 65 to 74 Years | 9,884 (98.2%) | 7,070 (70.3%) |
| 75 Years and over | 6,793 (98.9%) | 4,920 (71.6%) |
| Total | 34,146 (32.5%) | 80,233 (76.3%) |
Disability Status by Sex by Age in Eau Claire County
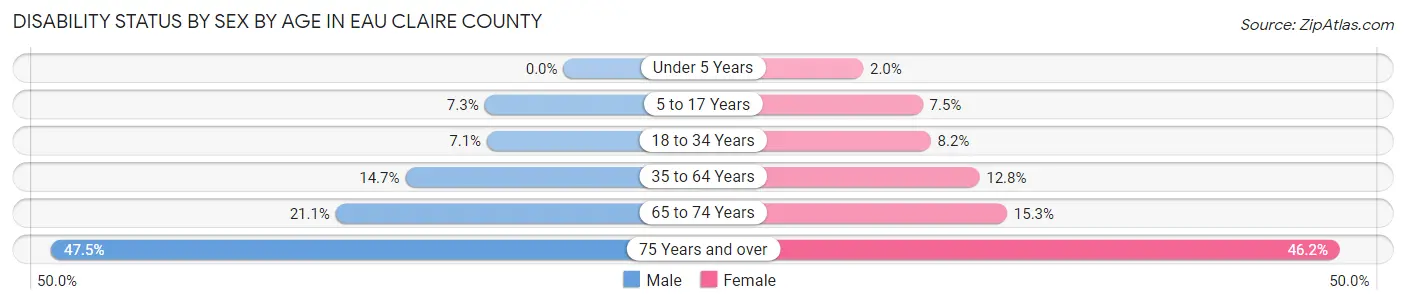
| Age Bracket | Male | Female |
| Under 5 Years | 0 (0.0%) | 51 (2.0%) |
| 5 to 17 Years | 600 (7.3%) | 561 (7.5%) |
| 18 to 34 Years | 1,090 (7.1%) | 1,282 (8.2%) |
| 35 to 64 Years | 2,682 (14.7%) | 2,280 (12.8%) |
| 65 to 74 Years | 1,006 (21.1%) | 812 (15.3%) |
| 75 Years and over | 1,336 (47.5%) | 1,875 (46.2%) |
Disability Class by Sex by Age in Eau Claire County
Disability Class: Hearing Difficulty
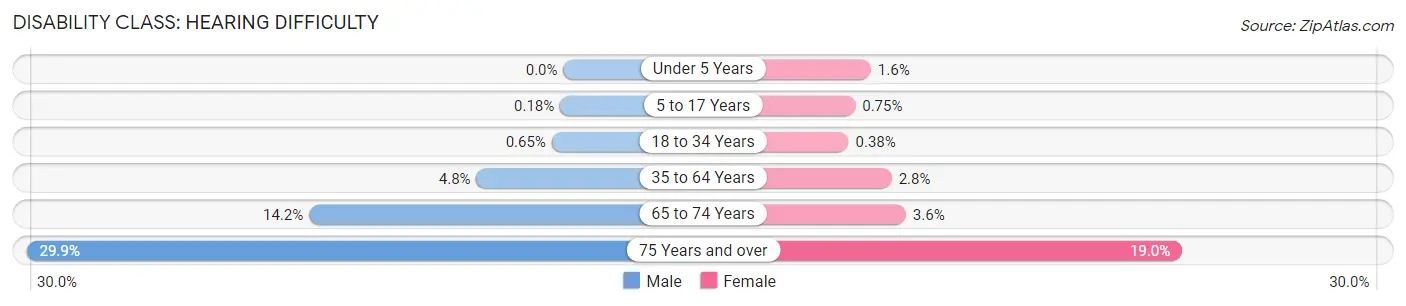
| Age Bracket | Male | Female |
| Under 5 Years | 0 (0.0%) | 42 (1.6%) |
| 5 to 17 Years | 15 (0.2%) | 56 (0.7%) |
| 18 to 34 Years | 100 (0.6%) | 59 (0.4%) |
| 35 to 64 Years | 884 (4.8%) | 496 (2.8%) |
| 65 to 74 Years | 674 (14.2%) | 189 (3.6%) |
| 75 Years and over | 840 (29.9%) | 769 (19.0%) |
Disability Class: Vision Difficulty
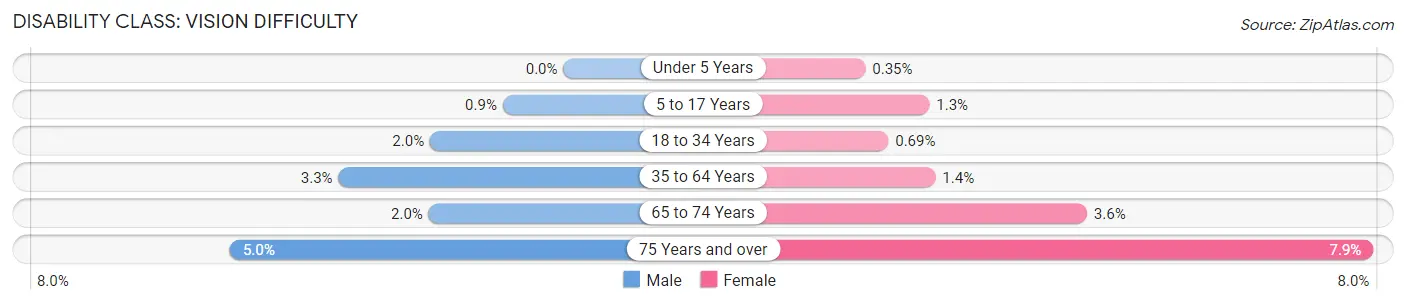
| Age Bracket | Male | Female |
| Under 5 Years | 0 (0.0%) | 9 (0.4%) |
| 5 to 17 Years | 74 (0.9%) | 97 (1.3%) |
| 18 to 34 Years | 304 (2.0%) | 108 (0.7%) |
| 35 to 64 Years | 610 (3.3%) | 249 (1.4%) |
| 65 to 74 Years | 95 (2.0%) | 193 (3.6%) |
| 75 Years and over | 139 (5.0%) | 320 (7.9%) |
Disability Class: Cognitive Difficulty
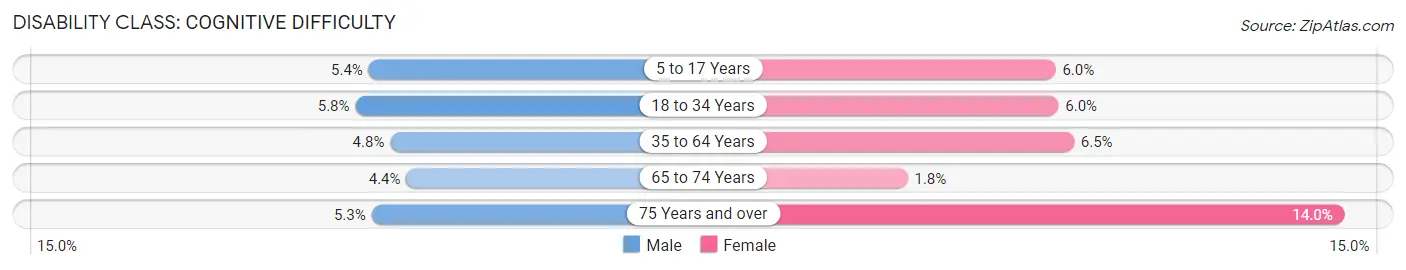
| Age Bracket | Male | Female |
| 5 to 17 Years | 444 (5.4%) | 445 (5.9%) |
| 18 to 34 Years | 890 (5.8%) | 939 (6.0%) |
| 35 to 64 Years | 882 (4.8%) | 1,155 (6.5%) |
| 65 to 74 Years | 208 (4.4%) | 97 (1.8%) |
| 75 Years and over | 150 (5.3%) | 568 (14.0%) |
Disability Class: Ambulatory Difficulty
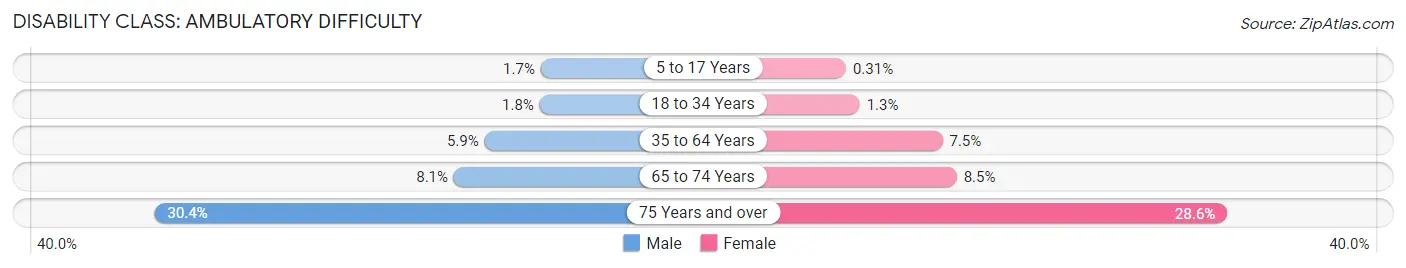
| Age Bracket | Male | Female |
| 5 to 17 Years | 138 (1.7%) | 23 (0.3%) |
| 18 to 34 Years | 271 (1.8%) | 207 (1.3%) |
| 35 to 64 Years | 1,069 (5.9%) | 1,336 (7.5%) |
| 65 to 74 Years | 387 (8.1%) | 452 (8.5%) |
| 75 Years and over | 853 (30.4%) | 1,161 (28.6%) |
Disability Class: Self-Care Difficulty
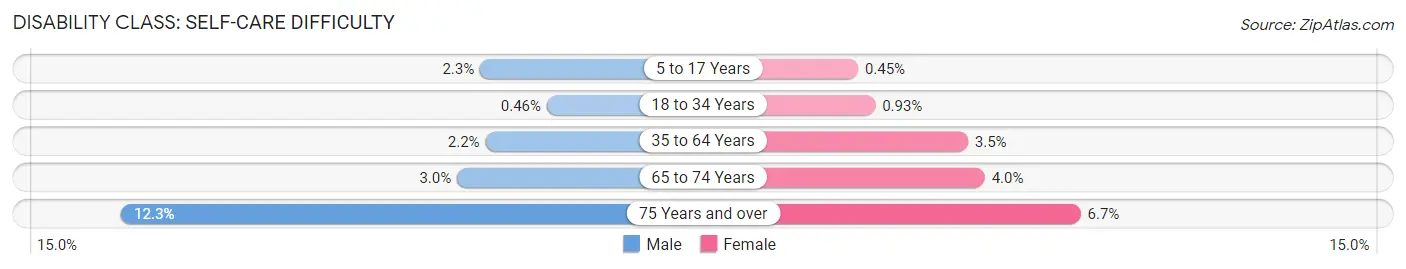
| Age Bracket | Male | Female |
| 5 to 17 Years | 190 (2.3%) | 34 (0.4%) |
| 18 to 34 Years | 70 (0.5%) | 145 (0.9%) |
| 35 to 64 Years | 397 (2.2%) | 627 (3.5%) |
| 65 to 74 Years | 141 (3.0%) | 211 (4.0%) |
| 75 Years and over | 346 (12.3%) | 270 (6.7%) |
Technology Access in Eau Claire County
Computing Device Access in Eau Claire County
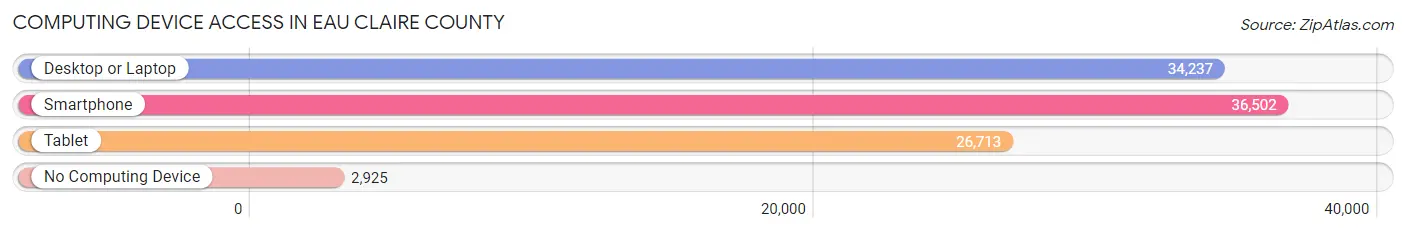
| Device Type | # Households | % Households |
| Desktop or Laptop | 34,237 | 80.6% |
| Smartphone | 36,502 | 85.9% |
| Tablet | 26,713 | 62.9% |
| No Computing Device | 2,925 | 6.9% |
| Total | 42,481 | 100.0% |
Internet Access in Eau Claire County
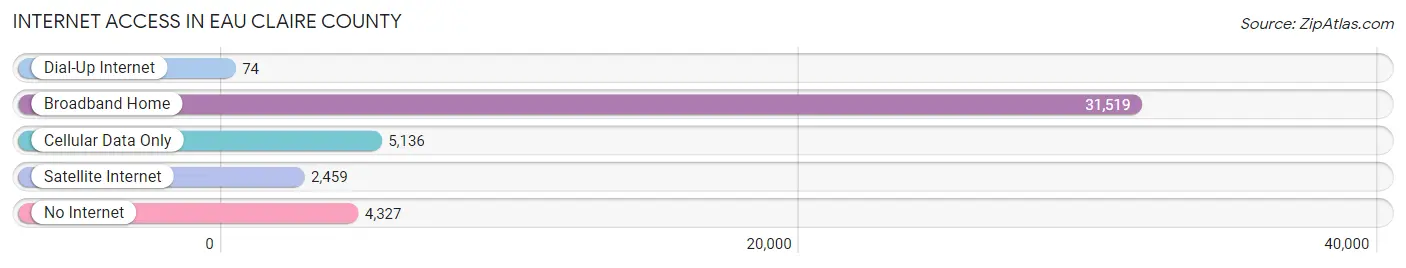
| Internet Type | # Households | % Households |
| Dial-Up Internet | 74 | 0.2% |
| Broadband Home | 31,519 | 74.2% |
| Cellular Data Only | 5,136 | 12.1% |
| Satellite Internet | 2,459 | 5.8% |
| No Internet | 4,327 | 10.2% |
| Total | 42,481 | 100.0% |
Eau Claire County Summary
Eau Claire County is located in the west-central part of Wisconsin, and is part of the Chippewa Valley region. It is bordered by Chippewa County to the north, Dunn County to the east, Trempealeau County to the south, and Buffalo and Pepin counties to the west. The county seat is Eau Claire, which is also the largest city in the county.
Geography
Eau Claire County covers an area of 817 square miles, of which 812 square miles is land and 5 square miles is water. The county is located in the western part of the state, and is part of the Chippewa Valley region. The terrain is mostly rolling hills and valleys, with the highest point being the summit of Mount Tom, at 1,845 feet. The county is drained by the Chippewa River, which flows through the county from north to south.
The county is home to several state parks and recreation areas, including the Chippewa River State Trail, the Eau Claire River State Trail, and the Old Abe State Trail. The county also contains several lakes, including Lake Altoona, Lake Eau Claire, and Lake Wissota.
History
The area that is now Eau Claire County was originally inhabited by the Ojibwe people. The first European settlers arrived in the area in the early 19th century, and the county was officially established in 1854. The county was named after the Eau Claire River, which was named by French explorers in the late 17th century.
The county was largely agricultural in the 19th century, with the main crops being wheat, oats, and potatoes. The county also had a thriving lumber industry, with several sawmills located along the Chippewa River.
In the late 19th century, the county began to industrialize, with several factories being built in Eau Claire. The city became a major center for the lumber industry, and was also home to several paper mills.
Economy
Eau Claire County has a diverse economy, with a mix of manufacturing, agriculture, and services. The county’s largest employers are the University of Wisconsin-Eau Claire, Mayo Clinic Health System, and the Eau Claire School District.
The county’s manufacturing sector is dominated by the paper and lumber industries. Other major industries include food processing, metal fabrication, and printing.
Agriculture is also an important part of the county’s economy, with the main crops being corn, soybeans, and hay. Dairy farming is also an important part of the county’s agricultural sector.
Demographics
As of the 2010 census, Eau Claire County had a population of 104,405. The population was spread out, with 24.3% under the age of 18, 11.7% from 18 to 24, 28.2% from 25 to 44, 22.2% from 45 to 64, and 13.6% who were 65 years of age or older. The median age was 35.4 years.
The racial makeup of the county was 90.2% White, 4.2% Black or African American, 0.7% Native American, 2.2% Asian, 0.2% Pacific Islander, 1.2% from other races, and 1.3% from two or more races. Hispanic or Latino of any race were 3.2% of the population.
The median income for a household in the county was $45,945, and the median income for a family was $58,945. The per capita income for the county was $24,845. About 8.2% of families and 13.2% of the population were below the poverty line, including 16.2% of those under age 18 and 6.7% of those age 65 or over.
Common Questions
What is the Total Population of Eau Claire County?
Total Population of Eau Claire County is 105,697.
What is the Total Male Population of Eau Claire County?
Total Male Population of Eau Claire County is 52,562.
What is the Total Female Population of Eau Claire County?
Total Female Population of Eau Claire County is 53,135.
What is the Ratio of Males per 100 Females in Eau Claire County?
There are 98.92 Males per 100 Females in Eau Claire County.
What is the Ratio of Females per 100 Males in Eau Claire County?
There are 101.09 Females per 100 Males in Eau Claire County.
What is the Median Population Age in Eau Claire County?
Median Population Age in Eau Claire County is 35.5 Years.
What is the Average Family Size in Eau Claire County
Average Family Size in Eau Claire County is 3.0 People.
What is the Average Household Size in Eau Claire County
Average Household Size in Eau Claire County is 2.4 People.
What is Per Capita Income in Eau Claire County?
Per Capita income in Eau Claire County is $38,529.
What is the Median Family Income in Eau Claire County?
Median Family Income in Eau Claire County is $98,103.
What is the Median Household income in Eau Claire County?
Median Household Income in Eau Claire County is $70,127.
What is Income or Wage Gap in Eau Claire County?
Income or Wage Gap in Eau Claire County is 33.3%.
Women in Eau Claire County earn 66.7 cents for every dollar earned by a man.
What is Family Income Deficit in Eau Claire County?
Family Income Deficit in Eau Claire County is $10,359.
Families that are below poverty line in Eau Claire County earn $10,359 less on average than the poverty threshold level.
What is Inequality or Gini Index in Eau Claire County?
Inequality or Gini Index in Eau Claire County is 0.44.
How Large is the Labor Force in Eau Claire County?
There are 59,944 People in the Labor Forcein in Eau Claire County.
What is the Percentage of People in the Labor Force in Eau Claire County?
68.9% of People are in the Labor Force in Eau Claire County.
What is the Unemployment Rate in Eau Claire County?
Unemployment Rate in Eau Claire County is 3.2%.