Dane County, WI
Dane County Map
Dane County Overview
559,891
TOTAL POPULATION
280,540
MALE POPULATION
279,351
FEMALE POPULATION
100.43
MALES / 100 FEMALES
99.58
FEMALES / 100 MALES
35.5
MEDIAN AGE
2.9
AVG FAMILY SIZE
2.3
AVG HOUSEHOLD SIZE
$49,280
PER CAPITA INCOME
$117,289
AVG FAMILY INCOME
$84,297
AVG HOUSEHOLD INCOME
24.3%
WAGE / INCOME GAP [ % ]
75.7¢/ $1
WAGE / INCOME GAP [ $ ]
$10,275
FAMILY INCOME DEFICIT
0.45
INEQUALITY / GINI INDEX
325,878
LABOR FORCE [ PEOPLE ]
70.7%
PERCENT IN LABOR FORCE
2.3%
UNEMPLOYMENT RATE
Dane County Area Codes
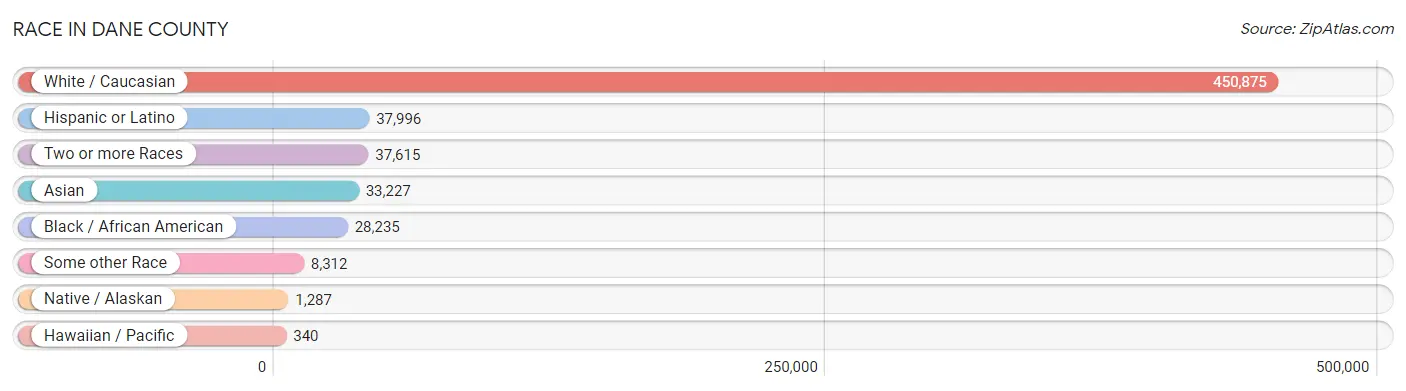
Race in Dane County
The most populous races in Dane County are White / Caucasian (450,875 | 80.5%), Hispanic or Latino (37,996 | 6.8%), and Two or more Races (37,615 | 6.7%).
| Race | # Population | % Population |
| Asian | 33,227 | 5.9% |
| Black / African American | 28,235 | 5.0% |
| Hawaiian / Pacific | 340 | 0.1% |
| Hispanic or Latino | 37,996 | 6.8% |
| Native / Alaskan | 1,287 | 0.2% |
| White / Caucasian | 450,875 | 80.5% |
| Two or more Races | 37,615 | 6.7% |
| Some other Race | 8,312 | 1.5% |
| Total | 559,891 | 100.0% |
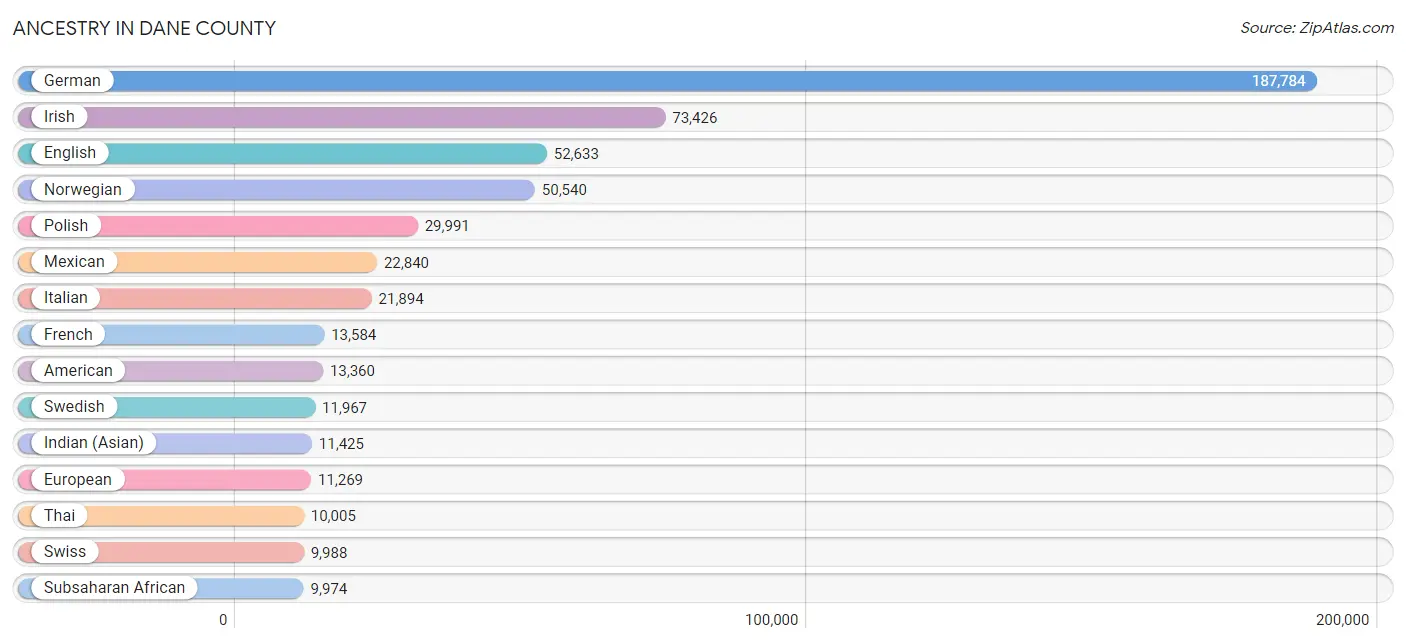
Ancestry in Dane County
The most populous ancestries reported in Dane County are German (187,784 | 33.5%), Irish (73,426 | 13.1%), English (52,633 | 9.4%), Norwegian (50,540 | 9.0%), and Polish (29,991 | 5.4%), together accounting for 70.4% of all Dane County residents.
| Ancestry | # Population | % Population |
| Afghan | 95 | 0.0% |
| African | 7,359 | 1.3% |
| Alaskan Athabascan | 1 | 0.0% |
| Albanian | 743 | 0.1% |
| Aleut | 11 | 0.0% |
| American | 13,360 | 2.4% |
| Apache | 102 | 0.0% |
| Arab | 2,230 | 0.4% |
| Argentinean | 491 | 0.1% |
| Armenian | 227 | 0.0% |
| Assyrian / Chaldean / Syriac | 8 | 0.0% |
| Australian | 127 | 0.0% |
| Austrian | 1,840 | 0.3% |
| Bahamian | 73 | 0.0% |
| Bangladeshi | 4,470 | 0.8% |
| Barbadian | 25 | 0.0% |
| Basque | 41 | 0.0% |
| Belgian | 1,678 | 0.3% |
| Belizean | 27 | 0.0% |
| Bhutanese | 2,100 | 0.4% |
| Blackfeet | 129 | 0.0% |
| Bolivian | 70 | 0.0% |
| Brazilian | 720 | 0.1% |
| British | 3,352 | 0.6% |
| Bulgarian | 168 | 0.0% |
| Burmese | 2,997 | 0.5% |
| Cajun | 20 | 0.0% |
| Cambodian | 139 | 0.0% |
| Canadian | 790 | 0.1% |
| Cape Verdean | 9 | 0.0% |
| Celtic | 60 | 0.0% |
| Central American | 2,594 | 0.5% |
| Central American Indian | 288 | 0.1% |
| Cherokee | 835 | 0.2% |
| Cheyenne | 2 | 0.0% |
| Chickasaw | 241 | 0.0% |
| Chilean | 189 | 0.0% |
| Chinese | 15 | 0.0% |
| Chippewa | 681 | 0.1% |
| Choctaw | 27 | 0.0% |
| Colombian | 1,804 | 0.3% |
| Colville | 15 | 0.0% |
| Comanche | 8 | 0.0% |
| Costa Rican | 193 | 0.0% |
| Cree | 2 | 0.0% |
| Creek | 11 | 0.0% |
| Croatian | 1,005 | 0.2% |
| Crow | 1 | 0.0% |
| Cuban | 875 | 0.2% |
| Cypriot | 6 | 0.0% |
| Czech | 6,345 | 1.1% |
| Czechoslovakian | 708 | 0.1% |
| Danish | 4,708 | 0.8% |
| Delaware | 132 | 0.0% |
| Dominican | 289 | 0.1% |
| Dutch | 9,089 | 1.6% |
| Eastern European | 2,065 | 0.4% |
| Ecuadorian | 514 | 0.1% |
| Egyptian | 579 | 0.1% |
| English | 52,633 | 9.4% |
| Estonian | 32 | 0.0% |
| Ethiopian | 105 | 0.0% |
| European | 11,269 | 2.0% |
| Fijian | 9 | 0.0% |
| Filipino | 732 | 0.1% |
| Finnish | 2,321 | 0.4% |
| French | 13,584 | 2.4% |
| French American Indian | 16 | 0.0% |
| French Canadian | 2,543 | 0.4% |
| German | 187,784 | 33.5% |
| German Russian | 77 | 0.0% |
| Ghanaian | 137 | 0.0% |
| Greek | 2,072 | 0.4% |
| Guamanian / Chamorro | 101 | 0.0% |
| Guatemalan | 527 | 0.1% |
| Guyanese | 142 | 0.0% |
| Haitian | 133 | 0.0% |
| Hmong | 40 | 0.0% |
| Honduran | 313 | 0.1% |
| Hopi | 9 | 0.0% |
| Hungarian | 2,084 | 0.4% |
| Icelander | 250 | 0.0% |
| Indian (Asian) | 11,425 | 2.0% |
| Indonesian | 68 | 0.0% |
| Inupiat | 45 | 0.0% |
| Iranian | 589 | 0.1% |
| Iraqi | 92 | 0.0% |
| Irish | 73,426 | 13.1% |
| Iroquois | 180 | 0.0% |
| Israeli | 129 | 0.0% |
| Italian | 21,894 | 3.9% |
| Jamaican | 359 | 0.1% |
| Japanese | 456 | 0.1% |
| Jordanian | 111 | 0.0% |
| Kenyan | 146 | 0.0% |
| Korean | 2,603 | 0.5% |
| Laotian | 228 | 0.0% |
| Latvian | 209 | 0.0% |
| Lebanese | 366 | 0.1% |
| Liberian | 264 | 0.1% |
| Lithuanian | 1,765 | 0.3% |
| Lumbee | 14 | 0.0% |
| Luxembourger | 563 | 0.1% |
| Macedonian | 72 | 0.0% |
| Malaysian | 982 | 0.2% |
| Maltese | 27 | 0.0% |
| Menominee | 172 | 0.0% |
| Mexican | 22,840 | 4.1% |
| Mexican American Indian | 301 | 0.1% |
| Mongolian | 95 | 0.0% |
| Moroccan | 10 | 0.0% |
| Native Hawaiian | 177 | 0.0% |
| Navajo | 120 | 0.0% |
| New Zealander | 49 | 0.0% |
| Nicaraguan | 1,239 | 0.2% |
| Nigerian | 409 | 0.1% |
| Northern European | 2,233 | 0.4% |
| Norwegian | 50,540 | 9.0% |
| Okinawan | 30 | 0.0% |
| Osage | 5 | 0.0% |
| Ottawa | 28 | 0.0% |
| Pakistani | 935 | 0.2% |
| Palestinian | 181 | 0.0% |
| Panamanian | 59 | 0.0% |
| Paraguayan | 32 | 0.0% |
| Pennsylvania German | 114 | 0.0% |
| Peruvian | 328 | 0.1% |
| Polish | 29,991 | 5.4% |
| Portuguese | 875 | 0.2% |
| Potawatomi | 63 | 0.0% |
| Pueblo | 225 | 0.0% |
| Puerto Rican | 3,646 | 0.6% |
| Romanian | 725 | 0.1% |
| Russian | 4,177 | 0.7% |
| Salvadoran | 263 | 0.1% |
| Samoan | 278 | 0.1% |
| Scandinavian | 2,966 | 0.5% |
| Scotch-Irish | 3,356 | 0.6% |
| Scottish | 9,386 | 1.7% |
| Senegalese | 168 | 0.0% |
| Serbian | 352 | 0.1% |
| Sioux | 111 | 0.0% |
| Slavic | 596 | 0.1% |
| Slovak | 1,045 | 0.2% |
| Slovene | 531 | 0.1% |
| Somali | 163 | 0.0% |
| South African | 299 | 0.1% |
| South American | 5,151 | 0.9% |
| South American Indian | 54 | 0.0% |
| Spaniard | 998 | 0.2% |
| Spanish | 685 | 0.1% |
| Sri Lankan | 1,963 | 0.4% |
| Subsaharan African | 9,974 | 1.8% |
| Sudanese | 81 | 0.0% |
| Swedish | 11,967 | 2.1% |
| Swiss | 9,988 | 1.8% |
| Syrian | 98 | 0.0% |
| Taiwanese | 16 | 0.0% |
| Thai | 10,005 | 1.8% |
| Tlingit-Haida | 8 | 0.0% |
| Trinidadian and Tobagonian | 2 | 0.0% |
| Turkish | 297 | 0.1% |
| Ukrainian | 1,472 | 0.3% |
| Uruguayan | 775 | 0.1% |
| Ute | 1 | 0.0% |
| Venezuelan | 933 | 0.2% |
| Vietnamese | 169 | 0.0% |
| Welsh | 3,864 | 0.7% |
| West Indian | 120 | 0.0% |
| Yaqui | 14 | 0.0% |
| Yugoslavian | 123 | 0.0% |
| Zimbabwean | 6 | 0.0% | View All 172 Rows |
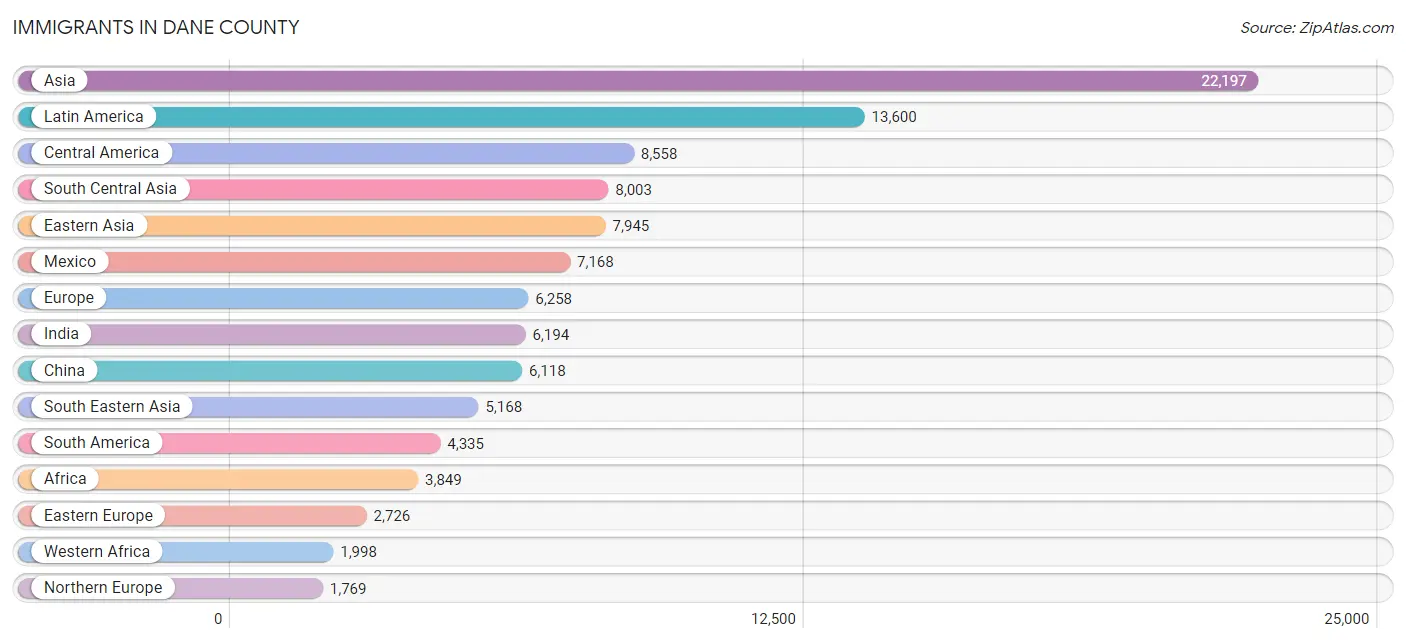
Immigrants in Dane County
The most numerous immigrant groups reported in Dane County came from Asia (22,197 | 4.0%), Latin America (13,600 | 2.4%), Central America (8,558 | 1.5%), South Central Asia (8,003 | 1.4%), and Eastern Asia (7,945 | 1.4%), together accounting for 10.8% of all Dane County residents.
| Immigration Origin | # Population | % Population |
| Afghanistan | 102 | 0.0% |
| Africa | 3,849 | 0.7% |
| Albania | 248 | 0.0% |
| Argentina | 370 | 0.1% |
| Armenia | 69 | 0.0% |
| Asia | 22,197 | 4.0% |
| Australia | 157 | 0.0% |
| Austria | 96 | 0.0% |
| Bahamas | 69 | 0.0% |
| Bangladesh | 209 | 0.0% |
| Barbados | 64 | 0.0% |
| Belarus | 125 | 0.0% |
| Belgium | 59 | 0.0% |
| Bolivia | 59 | 0.0% |
| Bosnia and Herzegovina | 33 | 0.0% |
| Brazil | 710 | 0.1% |
| Bulgaria | 76 | 0.0% |
| Cambodia | 174 | 0.0% |
| Cameroon | 264 | 0.1% |
| Canada | 1,080 | 0.2% |
| Caribbean | 707 | 0.1% |
| Central America | 8,558 | 1.5% |
| Chile | 133 | 0.0% |
| China | 6,118 | 1.1% |
| Colombia | 1,215 | 0.2% |
| Costa Rica | 33 | 0.0% |
| Cuba | 223 | 0.0% |
| Czechoslovakia | 138 | 0.0% |
| Denmark | 72 | 0.0% |
| Dominican Republic | 85 | 0.0% |
| Eastern Africa | 477 | 0.1% |
| Eastern Asia | 7,945 | 1.4% |
| Eastern Europe | 2,726 | 0.5% |
| Ecuador | 218 | 0.0% |
| Egypt | 245 | 0.0% |
| El Salvador | 137 | 0.0% |
| England | 555 | 0.1% |
| Eritrea | 8 | 0.0% |
| Ethiopia | 86 | 0.0% |
| Europe | 6,258 | 1.1% |
| France | 160 | 0.0% |
| Germany | 610 | 0.1% |
| Ghana | 107 | 0.0% |
| Greece | 110 | 0.0% |
| Guatemala | 332 | 0.1% |
| Guyana | 109 | 0.0% |
| Haiti | 97 | 0.0% |
| Honduras | 256 | 0.1% |
| Hong Kong | 150 | 0.0% |
| Hungary | 45 | 0.0% |
| India | 6,194 | 1.1% |
| Indonesia | 139 | 0.0% |
| Iran | 321 | 0.1% |
| Iraq | 98 | 0.0% |
| Ireland | 77 | 0.0% |
| Israel | 83 | 0.0% |
| Italy | 298 | 0.1% |
| Jamaica | 149 | 0.0% |
| Japan | 536 | 0.1% |
| Jordan | 141 | 0.0% |
| Kazakhstan | 11 | 0.0% |
| Kenya | 139 | 0.0% |
| Korea | 1,182 | 0.2% |
| Kuwait | 73 | 0.0% |
| Laos | 1,352 | 0.2% |
| Latin America | 13,600 | 2.4% |
| Latvia | 29 | 0.0% |
| Lebanon | 25 | 0.0% |
| Liberia | 248 | 0.0% |
| Lithuania | 8 | 0.0% |
| Malaysia | 312 | 0.1% |
| Mexico | 7,168 | 1.3% |
| Micronesia | 3 | 0.0% |
| Middle Africa | 336 | 0.1% |
| Moldova | 49 | 0.0% |
| Morocco | 92 | 0.0% |
| Nepal | 316 | 0.1% |
| Netherlands | 60 | 0.0% |
| Nicaragua | 583 | 0.1% |
| Nigeria | 195 | 0.0% |
| North Macedonia | 25 | 0.0% |
| Northern Africa | 560 | 0.1% |
| Northern Europe | 1,769 | 0.3% |
| Norway | 5 | 0.0% |
| Oceania | 212 | 0.0% |
| Pakistan | 506 | 0.1% |
| Panama | 49 | 0.0% |
| Peru | 282 | 0.1% |
| Philippines | 871 | 0.2% |
| Poland | 666 | 0.1% |
| Portugal | 16 | 0.0% |
| Romania | 152 | 0.0% |
| Russia | 647 | 0.1% |
| Saudi Arabia | 101 | 0.0% |
| Scotland | 209 | 0.0% |
| Senegal | 133 | 0.0% |
| Serbia | 15 | 0.0% |
| Sierra Leone | 140 | 0.0% |
| Singapore | 67 | 0.0% |
| Somalia | 154 | 0.0% |
| South Africa | 171 | 0.0% |
| South America | 4,335 | 0.8% |
| South Central Asia | 8,003 | 1.4% |
| South Eastern Asia | 5,168 | 0.9% |
| Southern Europe | 703 | 0.1% |
| Spain | 279 | 0.1% |
| Sri Lanka | 207 | 0.0% |
| St. Vincent and the Grenadines | 20 | 0.0% |
| Sudan | 61 | 0.0% |
| Sweden | 126 | 0.0% |
| Switzerland | 75 | 0.0% |
| Syria | 151 | 0.0% |
| Taiwan | 607 | 0.1% |
| Thailand | 1,292 | 0.2% |
| Turkey | 236 | 0.0% |
| Ukraine | 218 | 0.0% |
| Uruguay | 449 | 0.1% |
| Uzbekistan | 38 | 0.0% |
| Venezuela | 741 | 0.1% |
| Vietnam | 838 | 0.2% |
| Western Africa | 1,998 | 0.4% |
| Western Asia | 1,027 | 0.2% |
| Western Europe | 1,060 | 0.2% |
| Zaire | 72 | 0.0% |
| Zimbabwe | 30 | 0.0% | View All 125 Rows |
Sex and Age in Dane County
Sex and Age in Dane County
The most populous age groups in Dane County are 20 to 24 Years (29,579 | 10.5%) for men and 20 to 24 Years (28,892 | 10.3%) for women.
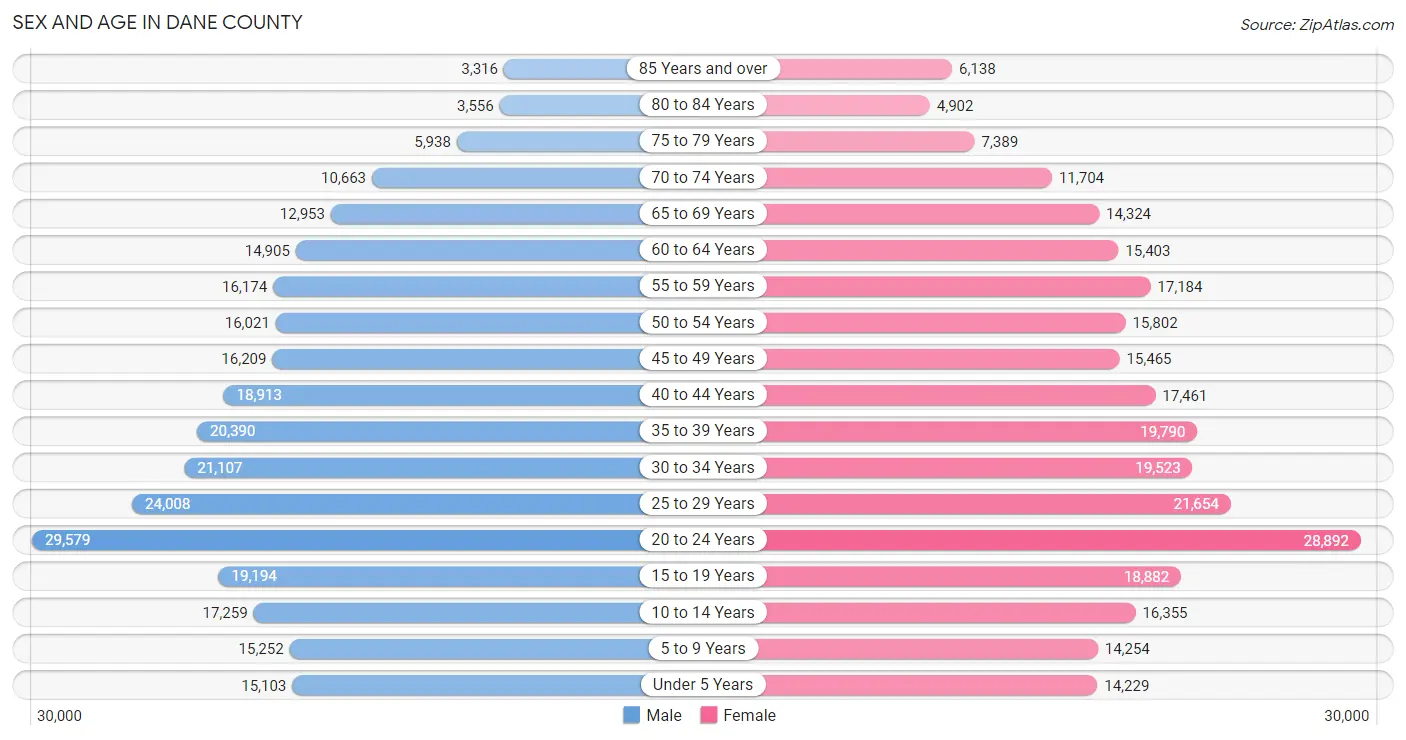
| Age Bracket | Male | Female |
| Under 5 Years | 15,103 (5.4%) | 14,229 (5.1%) |
| 5 to 9 Years | 15,252 (5.4%) | 14,254 (5.1%) |
| 10 to 14 Years | 17,259 (6.1%) | 16,355 (5.9%) |
| 15 to 19 Years | 19,194 (6.8%) | 18,882 (6.8%) |
| 20 to 24 Years | 29,579 (10.5%) | 28,892 (10.3%) |
| 25 to 29 Years | 24,008 (8.6%) | 21,654 (7.7%) |
| 30 to 34 Years | 21,107 (7.5%) | 19,523 (7.0%) |
| 35 to 39 Years | 20,390 (7.3%) | 19,790 (7.1%) |
| 40 to 44 Years | 18,913 (6.7%) | 17,461 (6.2%) |
| 45 to 49 Years | 16,209 (5.8%) | 15,465 (5.5%) |
| 50 to 54 Years | 16,021 (5.7%) | 15,802 (5.7%) |
| 55 to 59 Years | 16,174 (5.8%) | 17,184 (6.1%) |
| 60 to 64 Years | 14,905 (5.3%) | 15,403 (5.5%) |
| 65 to 69 Years | 12,953 (4.6%) | 14,324 (5.1%) |
| 70 to 74 Years | 10,663 (3.8%) | 11,704 (4.2%) |
| 75 to 79 Years | 5,938 (2.1%) | 7,389 (2.6%) |
| 80 to 84 Years | 3,556 (1.3%) | 4,902 (1.8%) |
| 85 Years and over | 3,316 (1.2%) | 6,138 (2.2%) |
| Total | 280,540 (100.0%) | 279,351 (100.0%) |
Families and Households in Dane County
Median Family Size in Dane County
The median family size in Dane County is 2.91 persons per family, with married-couple families (104,948 | 79.8%) accounting for the largest median family size of 2.96 persons per family. On the other hand, single male/father families (8,338 | 6.3%) represent the smallest median family size with 2.65 persons per family.
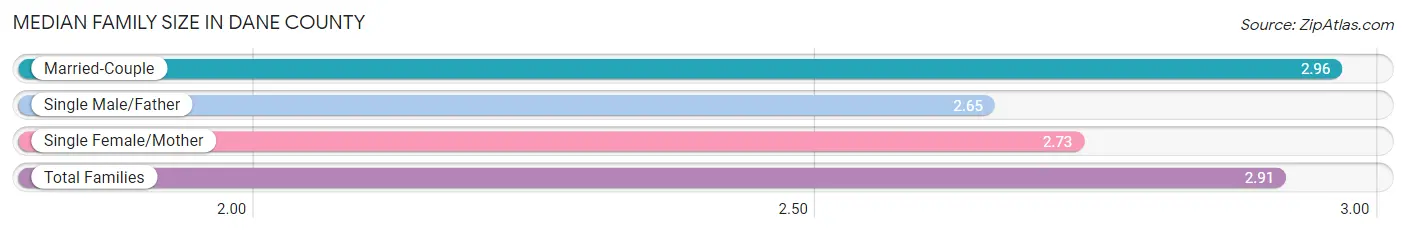
| Family Type | # Families | Family Size |
| Married-Couple | 104,948 (79.8%) | 2.96 |
| Single Male/Father | 8,338 (6.3%) | 2.65 |
| Single Female/Mother | 18,227 (13.9%) | 2.73 |
| Total Families | 131,513 (100.0%) | 2.91 |
Median Household Size in Dane County
The median household size in Dane County is 2.26 persons per household, with single male/father households (8,338 | 3.5%) accounting for the largest median household size of 3.02 persons per household. non-family households (109,286 | 45.4%) represent the smallest median household size with 1.41 persons per household.
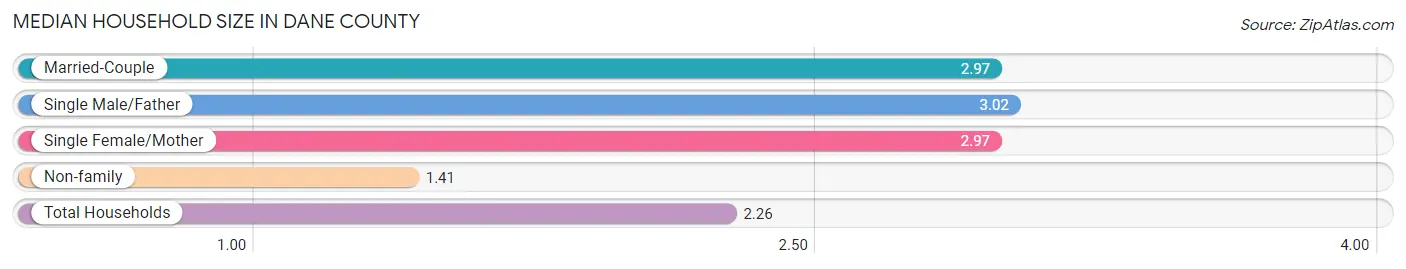
| Household Type | # Households | Household Size |
| Married-Couple | 104,948 (43.6%) | 2.97 |
| Single Male/Father | 8,338 (3.5%) | 3.02 |
| Single Female/Mother | 18,227 (7.6%) | 2.97 |
| Non-family | 109,286 (45.4%) | 1.41 |
| Total Households | 240,799 (100.0%) | 2.26 |
Household Size by Marriage Status in Dane County
Out of a total of 240,799 households in Dane County, 131,513 (54.6%) are family households, while 109,286 (45.4%) are nonfamily households. The most numerous type of family households are 2-person households, comprising 63,949, and the most common type of nonfamily households are 1-person households, comprising 78,950.
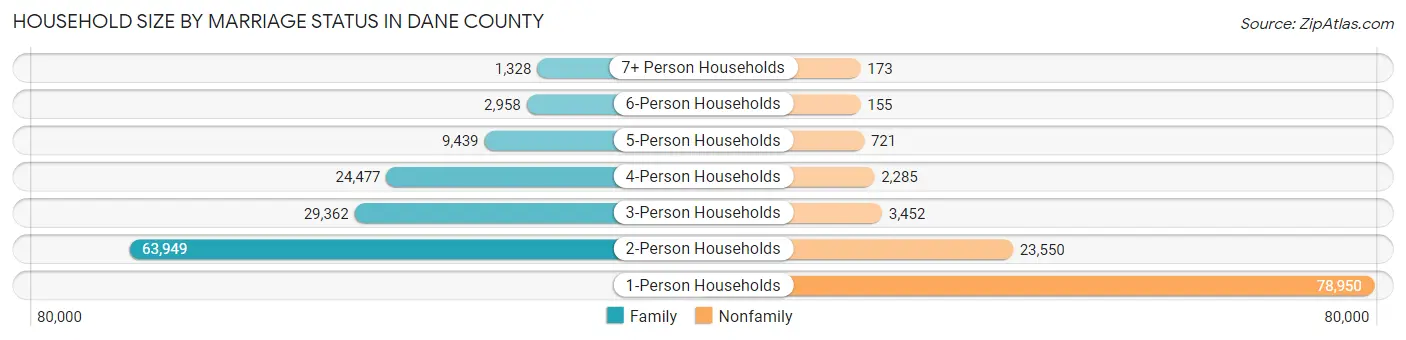
| Household Size | Family Households | Nonfamily Households |
| 1-Person Households | - | 78,950 (32.8%) |
| 2-Person Households | 63,949 (26.6%) | 23,550 (9.8%) |
| 3-Person Households | 29,362 (12.2%) | 3,452 (1.4%) |
| 4-Person Households | 24,477 (10.2%) | 2,285 (0.9%) |
| 5-Person Households | 9,439 (3.9%) | 721 (0.3%) |
| 6-Person Households | 2,958 (1.2%) | 155 (0.1%) |
| 7+ Person Households | 1,328 (0.5%) | 173 (0.1%) |
| Total | 131,513 (54.6%) | 109,286 (45.4%) |
Female Fertility in Dane County
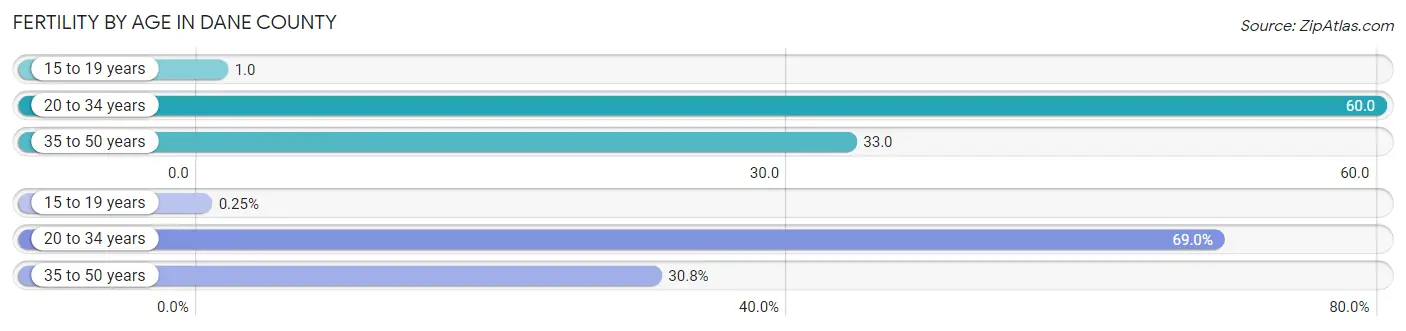
Fertility by Age in Dane County
Average fertility rate in Dane County is 42.0 births per 1,000 women. Women in the age bracket of 20 to 34 years have the highest fertility rate with 60.0 births per 1,000 women. Women in the age bracket of 20 to 34 years acount for 69.0% of all women with births.
| Age Bracket | Women with Births | Births / 1,000 Women |
| 15 to 19 years | 15 (0.3%) | 1.0 |
| 20 to 34 years | 4,184 (69.0%) | 60.0 |
| 35 to 50 years | 1,866 (30.8%) | 33.0 |
| Total | 6,065 (100.0%) | 42.0 |
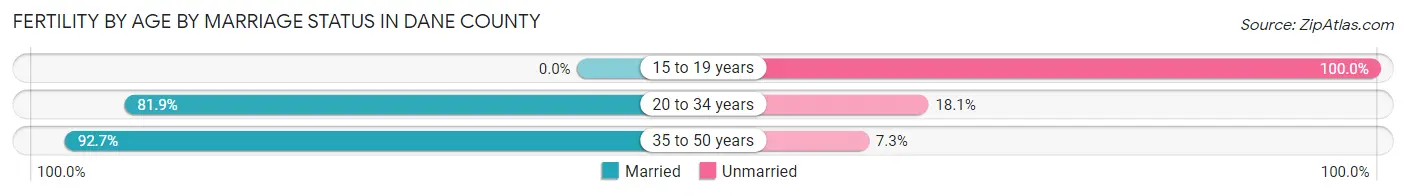
Fertility by Age by Marriage Status in Dane County
85.0% of women with births (6,065) in Dane County are married. The highest percentage of unmarried women with births falls into 15 to 19 years age bracket with 100.0% of them unmarried at the time of birth, while the lowest percentage of unmarried women with births belong to 35 to 50 years age bracket with 7.3% of them unmarried.
| Age Bracket | Married | Unmarried |
| 15 to 19 years | 0 (0.0%) | 15 (100.0%) |
| 20 to 34 years | 3,427 (81.9%) | 757 (18.1%) |
| 35 to 50 years | 1,730 (92.7%) | 136 (7.3%) |
| Total | 5,155 (85.0%) | 910 (15.0%) |
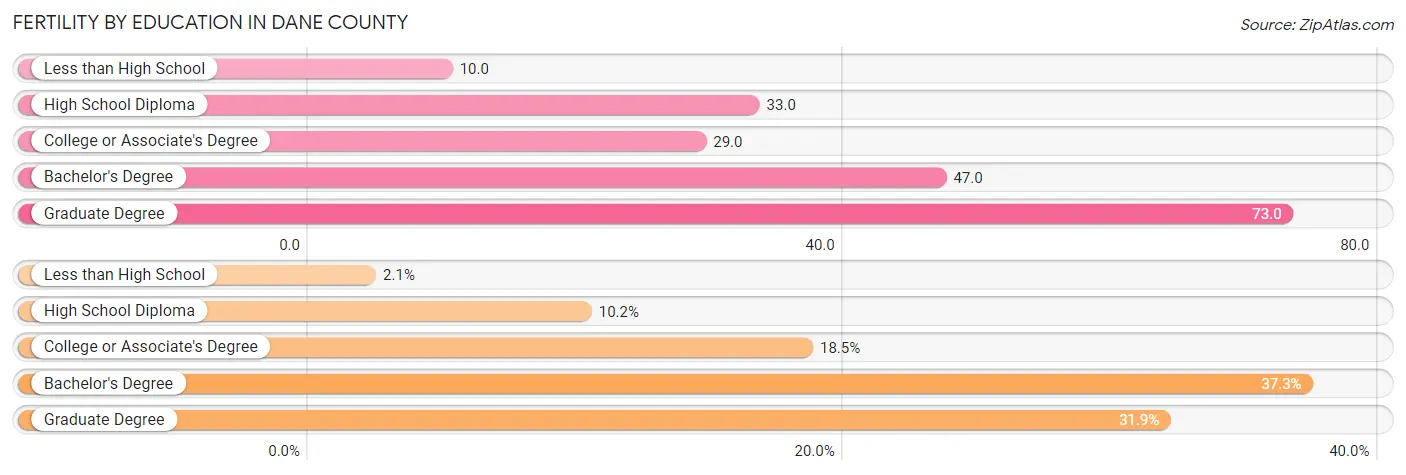
Fertility by Education in Dane County
Average fertility rate in Dane County is 42.0 births per 1,000 women. Women with the education attainment of graduate degree have the highest fertility rate of 73.0 births per 1,000 women, while women with the education attainment of less than high school have the lowest fertility at 10.0 births per 1,000 women. Women with the education attainment of bachelor's degree represent 37.2% of all women with births.
| Educational Attainment | Women with Births | Births / 1,000 Women |
| Less than High School | 129 (2.1%) | 10.0 |
| High School Diploma | 619 (10.2%) | 33.0 |
| College or Associate's Degree | 1,122 (18.5%) | 29.0 |
| Bachelor's Degree | 2,259 (37.2%) | 47.0 |
| Graduate Degree | 1,936 (31.9%) | 73.0 |
| Total | 6,065 (100.0%) | 42.0 |
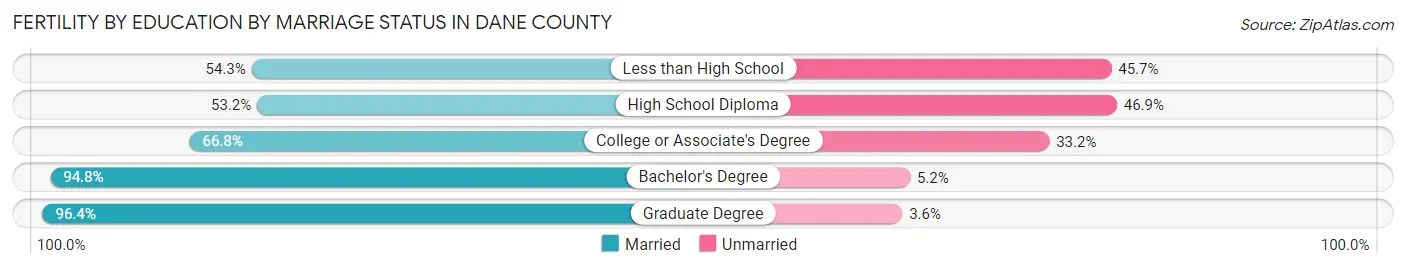
Fertility by Education by Marriage Status in Dane County
15.0% of women with births in Dane County are unmarried. Women with the educational attainment of graduate degree are most likely to be married with 96.4% of them married at childbirth, while women with the educational attainment of high school diploma are least likely to be married with 46.9% of them unmarried at childbirth.
| Educational Attainment | Married | Unmarried |
| Less than High School | 70 (54.3%) | 59 (45.7%) |
| High School Diploma | 329 (53.1%) | 290 (46.9%) |
| College or Associate's Degree | 749 (66.8%) | 373 (33.2%) |
| Bachelor's Degree | 2,142 (94.8%) | 117 (5.2%) |
| Graduate Degree | 1,866 (96.4%) | 70 (3.6%) |
| Total | 5,155 (85.0%) | 910 (15.0%) |
Income in Dane County
Income Overview in Dane County
Per Capita Income in Dane County is $49,280, while median incomes of families and households are $117,289 and $84,297 respectively.
| Characteristic | Number | Measure |
| Per Capita Income | 559,891 | $49,280 |
| Median Family Income | 131,513 | $117,289 |
| Mean Family Income | 131,513 | $146,044 |
| Median Household Income | 240,799 | $84,297 |
| Mean Household Income | 240,799 | $113,021 |
| Income Deficit | 131,513 | $10,275 |
| Wage / Income Gap (%) | 559,891 | 24.30% |
| Wage / Income Gap ($) | 559,891 | 75.70¢ per $1 |
| Gini / Inequality Index | 559,891 | 0.45 |
Earnings by Sex in Dane County
Average Earnings in Dane County are $47,426, $54,958 for men and $41,605 for women, a difference of 24.3%.
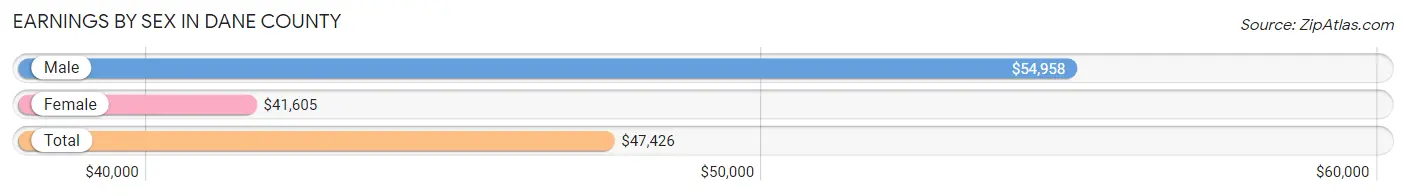
| Sex | Number | Average Earnings |
| Male | 181,648 (52.2%) | $54,958 |
| Female | 166,158 (47.8%) | $41,605 |
| Total | 347,806 (100.0%) | $47,426 |
Earnings by Sex by Income Bracket in Dane County
The most common earnings brackets in Dane County are $100,000+ for men (39,670 | 21.8%) and $100,000+ for women (18,325 | 11.0%).
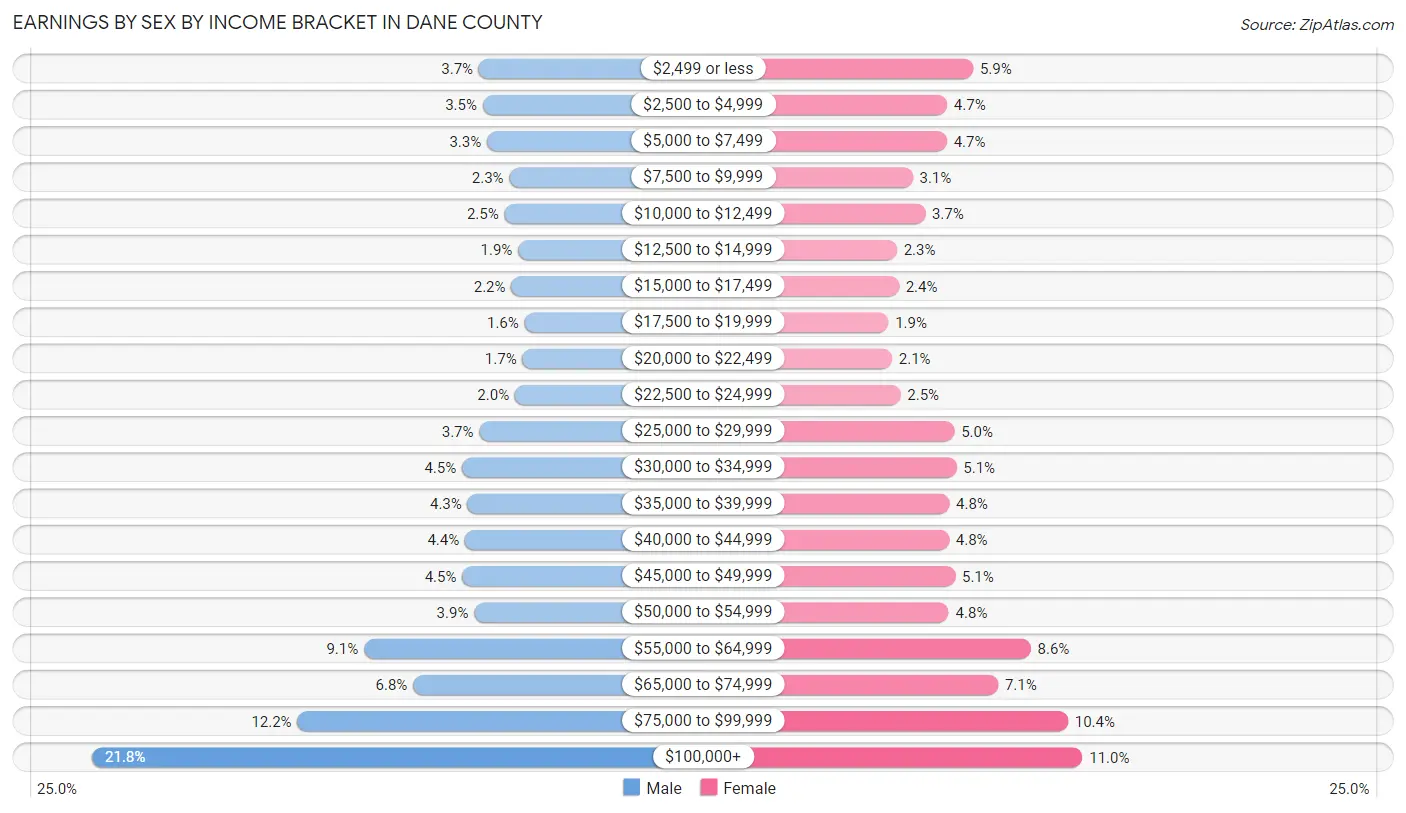
| Income | Male | Female |
| $2,499 or less | 6,766 (3.7%) | 9,826 (5.9%) |
| $2,500 to $4,999 | 6,439 (3.5%) | 7,785 (4.7%) |
| $5,000 to $7,499 | 6,066 (3.3%) | 7,778 (4.7%) |
| $7,500 to $9,999 | 4,152 (2.3%) | 5,124 (3.1%) |
| $10,000 to $12,499 | 4,575 (2.5%) | 6,085 (3.7%) |
| $12,500 to $14,999 | 3,410 (1.9%) | 3,893 (2.3%) |
| $15,000 to $17,499 | 3,997 (2.2%) | 4,045 (2.4%) |
| $17,500 to $19,999 | 2,861 (1.6%) | 3,216 (1.9%) |
| $20,000 to $22,499 | 3,044 (1.7%) | 3,498 (2.1%) |
| $22,500 to $24,999 | 3,684 (2.0%) | 4,164 (2.5%) |
| $25,000 to $29,999 | 6,722 (3.7%) | 8,355 (5.0%) |
| $30,000 to $34,999 | 8,196 (4.5%) | 8,519 (5.1%) |
| $35,000 to $39,999 | 7,722 (4.3%) | 7,963 (4.8%) |
| $40,000 to $44,999 | 7,929 (4.4%) | 7,946 (4.8%) |
| $45,000 to $49,999 | 8,166 (4.5%) | 8,432 (5.1%) |
| $50,000 to $54,999 | 7,156 (3.9%) | 7,933 (4.8%) |
| $55,000 to $64,999 | 16,534 (9.1%) | 14,308 (8.6%) |
| $65,000 to $74,999 | 12,354 (6.8%) | 11,758 (7.1%) |
| $75,000 to $99,999 | 22,205 (12.2%) | 17,205 (10.3%) |
| $100,000+ | 39,670 (21.8%) | 18,325 (11.0%) |
| Total | 181,648 (100.0%) | 166,158 (100.0%) |
Earnings by Sex by Educational Attainment in Dane County
Average earnings in Dane County are $64,089 for men and $51,403 for women, a difference of 19.8%. Men with an educational attainment of graduate degree enjoy the highest average annual earnings of $93,003, while those with less than high school education earn the least with $34,752. Women with an educational attainment of graduate degree earn the most with the average annual earnings of $69,951, while those with less than high school education have the smallest earnings of $25,751.
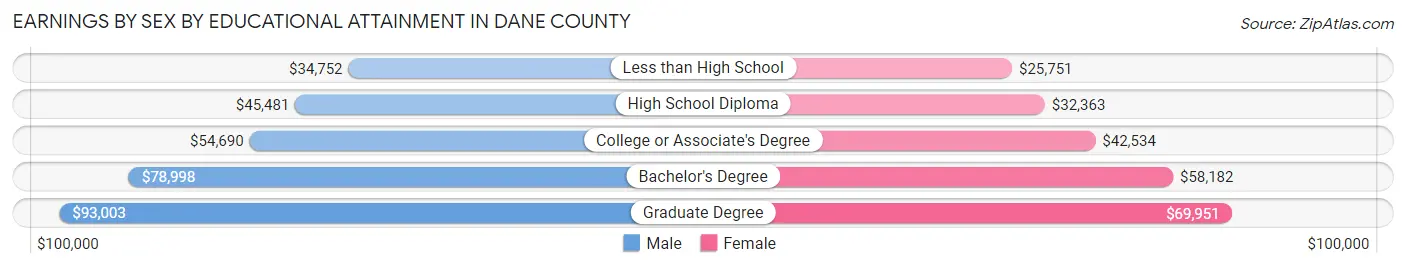
| Educational Attainment | Male Income | Female Income |
| Less than High School | $34,752 | $25,751 |
| High School Diploma | $45,481 | $32,363 |
| College or Associate's Degree | $54,690 | $42,534 |
| Bachelor's Degree | $78,998 | $58,182 |
| Graduate Degree | $93,003 | $69,951 |
| Total | $64,089 | $51,403 |
Family Income in Dane County
Family Income Brackets in Dane County
According to the Dane County family income data, there are 31,563 families falling into the $100,000 to $149,999 income range, which is the most common income bracket and makes up 24.0% of all families. Conversely, the $10,000 to $14,999 income bracket is the least frequent group with only 1,184 families (0.9%) belonging to this category.
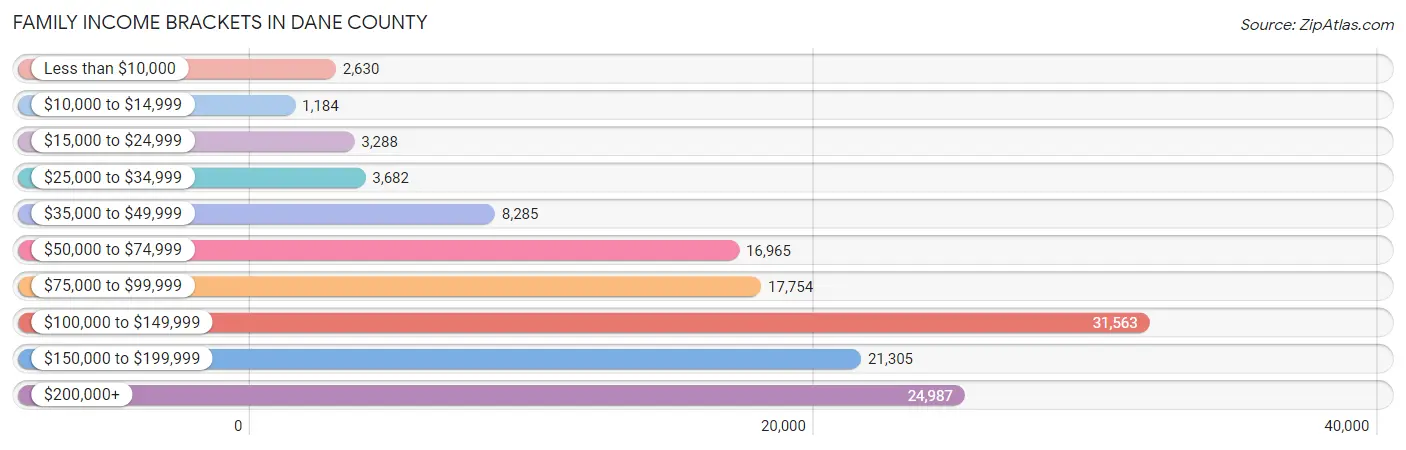
| Income Bracket | # Families | % Families |
| Less than $10,000 | 2,630 | 2.0% |
| $10,000 to $14,999 | 1,184 | 0.9% |
| $15,000 to $24,999 | 3,288 | 2.5% |
| $25,000 to $34,999 | 3,682 | 2.8% |
| $35,000 to $49,999 | 8,285 | 6.3% |
| $50,000 to $74,999 | 16,965 | 12.9% |
| $75,000 to $99,999 | 17,754 | 13.5% |
| $100,000 to $149,999 | 31,563 | 24.0% |
| $150,000 to $199,999 | 21,305 | 16.2% |
| $200,000+ | 24,987 | 19.0% |
Family Income by Famaliy Size in Dane County
4-person families (23,223 | 17.7%) account for the highest median family income in Dane County with $147,853 per family, while 2-person families (67,636 | 51.4%) have the highest median income of $51,074 per family member.
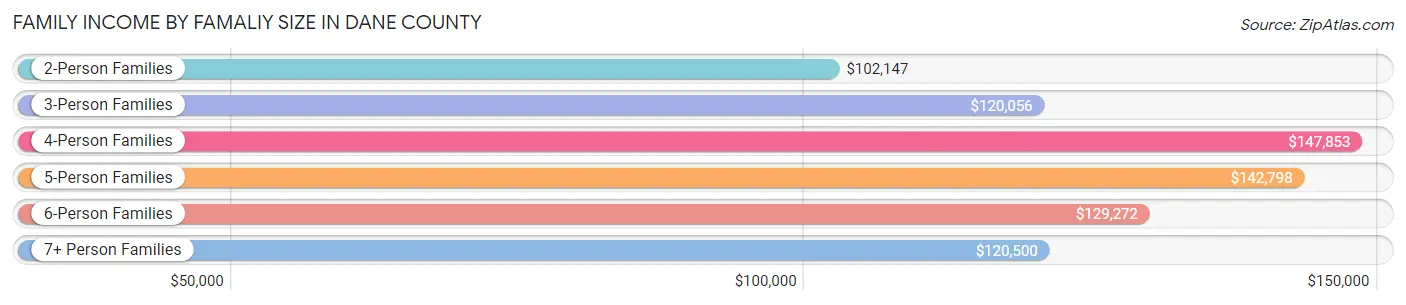
| Income Bracket | # Families | Median Income |
| 2-Person Families | 67,636 (51.4%) | $102,147 |
| 3-Person Families | 28,199 (21.4%) | $120,056 |
| 4-Person Families | 23,223 (17.7%) | $147,853 |
| 5-Person Families | 8,597 (6.5%) | $142,798 |
| 6-Person Families | 2,810 (2.1%) | $129,272 |
| 7+ Person Families | 1,048 (0.8%) | $120,500 |
| Total | 131,513 (100.0%) | $117,289 |
Family Income by Number of Earners in Dane County
The median family income in Dane County is $117,289, with families comprising 3+ earners (14,099) having the highest median family income of $163,652, while families with 1 earner (35,102) have the lowest median family income of $76,552, accounting for 10.7% and 26.7% of families, respectively.
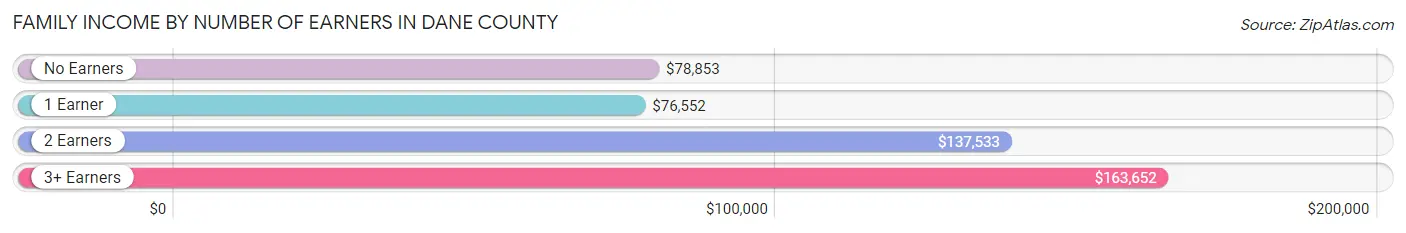
| Number of Earners | # Families | Median Income |
| No Earners | 17,201 (13.1%) | $78,853 |
| 1 Earner | 35,102 (26.7%) | $76,552 |
| 2 Earners | 65,111 (49.5%) | $137,533 |
| 3+ Earners | 14,099 (10.7%) | $163,652 |
| Total | 131,513 (100.0%) | $117,289 |
Household Income in Dane County
Household Income Brackets in Dane County
With 45,270 households falling in the category, the $100,000 to $149,999 income range is the most frequent in Dane County, accounting for 18.8% of all households. In contrast, only 5,779 households (2.4%) fall into the $10,000 to $14,999 income bracket, making it the least populous group.
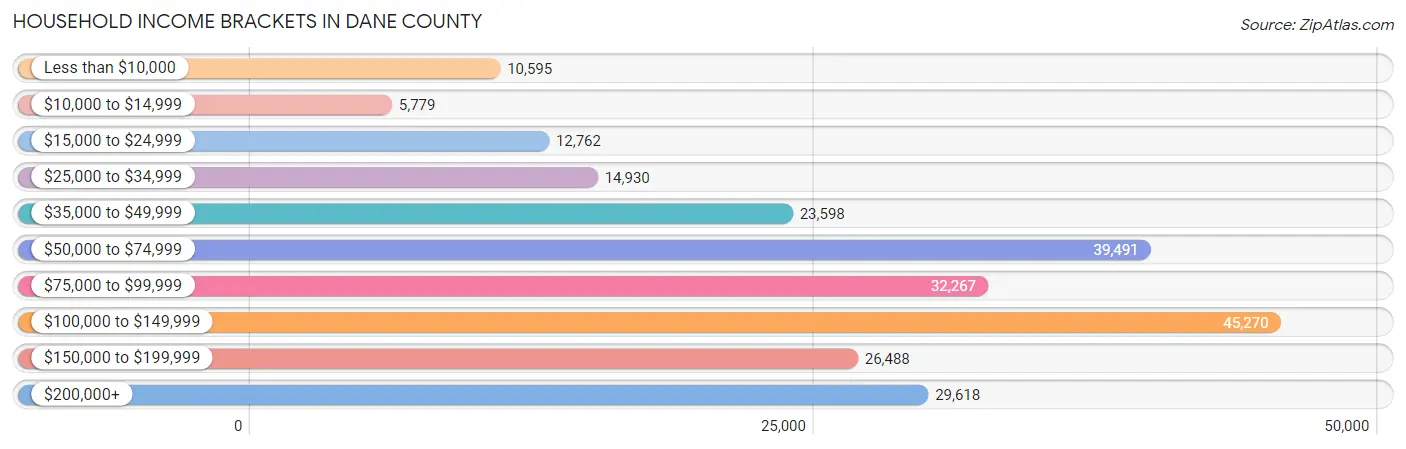
| Income Bracket | # Households | % Households |
| Less than $10,000 | 10,595 | 4.4% |
| $10,000 to $14,999 | 5,779 | 2.4% |
| $15,000 to $24,999 | 12,762 | 5.3% |
| $25,000 to $34,999 | 14,930 | 6.2% |
| $35,000 to $49,999 | 23,598 | 9.8% |
| $50,000 to $74,999 | 39,491 | 16.4% |
| $75,000 to $99,999 | 32,267 | 13.4% |
| $100,000 to $149,999 | 45,270 | 18.8% |
| $150,000 to $199,999 | 26,488 | 11.0% |
| $200,000+ | 29,618 | 12.3% |
Household Income by Householder Age in Dane County
The median household income in Dane County is $84,297, with the highest median household income of $105,762 found in the 45 to 64 years age bracket for the primary householder. A total of 75,012 households (31.1%) fall into this category. Meanwhile, the 15 to 24 years age bracket for the primary householder has the lowest median household income of $35,642, with 23,874 households (9.9%) in this group.
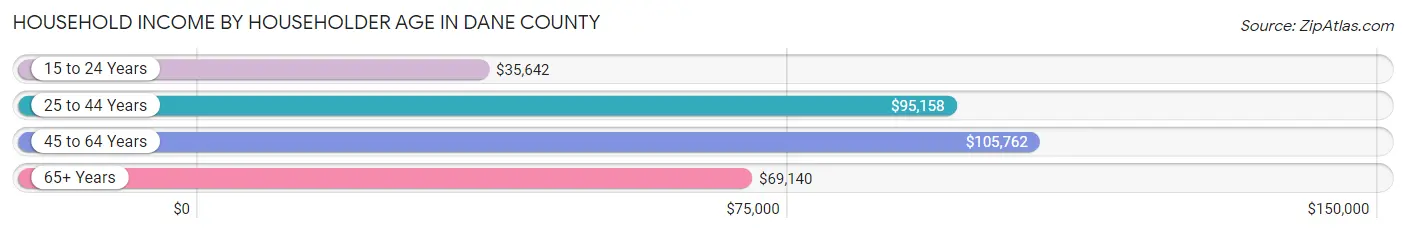
| Income Bracket | # Households | Median Income |
| 15 to 24 Years | 23,874 (9.9%) | $35,642 |
| 25 to 44 Years | 89,416 (37.1%) | $95,158 |
| 45 to 64 Years | 75,012 (31.1%) | $105,762 |
| 65+ Years | 52,497 (21.8%) | $69,140 |
| Total | 240,799 (100.0%) | $84,297 |
Poverty in Dane County
Income Below Poverty by Sex and Age in Dane County
With 10.1% poverty level for males and 11.6% for females among the residents of Dane County, 18 to 24 year old males and 18 to 24 year old females are the most vulnerable to poverty, with 12,164 males (35.1%) and 14,387 females (43.3%) in their respective age groups living below the poverty level.
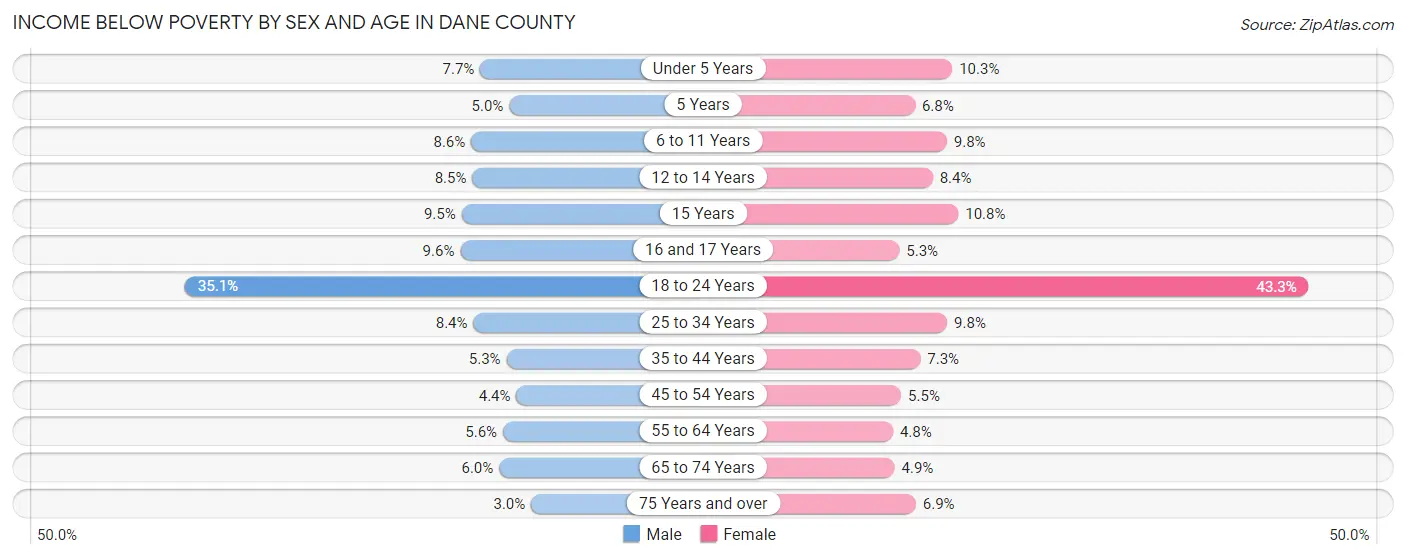
| Age Bracket | Male | Female |
| Under 5 Years | 1,162 (7.7%) | 1,453 (10.2%) |
| 5 Years | 152 (5.0%) | 203 (6.8%) |
| 6 to 11 Years | 1,589 (8.6%) | 1,760 (9.8%) |
| 12 to 14 Years | 890 (8.5%) | 794 (8.4%) |
| 15 Years | 318 (9.5%) | 339 (10.8%) |
| 16 and 17 Years | 611 (9.6%) | 324 (5.3%) |
| 18 to 24 Years | 12,164 (35.1%) | 14,387 (43.3%) |
| 25 to 34 Years | 3,719 (8.4%) | 4,025 (9.8%) |
| 35 to 44 Years | 2,052 (5.3%) | 2,714 (7.3%) |
| 45 to 54 Years | 1,392 (4.4%) | 1,719 (5.5%) |
| 55 to 64 Years | 1,722 (5.6%) | 1,541 (4.8%) |
| 65 to 74 Years | 1,395 (6.0%) | 1,265 (4.9%) |
| 75 Years and over | 377 (3.0%) | 1,220 (6.9%) |
| Total | 27,543 (10.1%) | 31,744 (11.6%) |
Income Above Poverty by Sex and Age in Dane County
According to the poverty statistics in Dane County, males aged 75 years and over and females aged 55 to 64 years are the age groups that are most secure financially, with 97.0% of males and 95.3% of females in these age groups living above the poverty line.
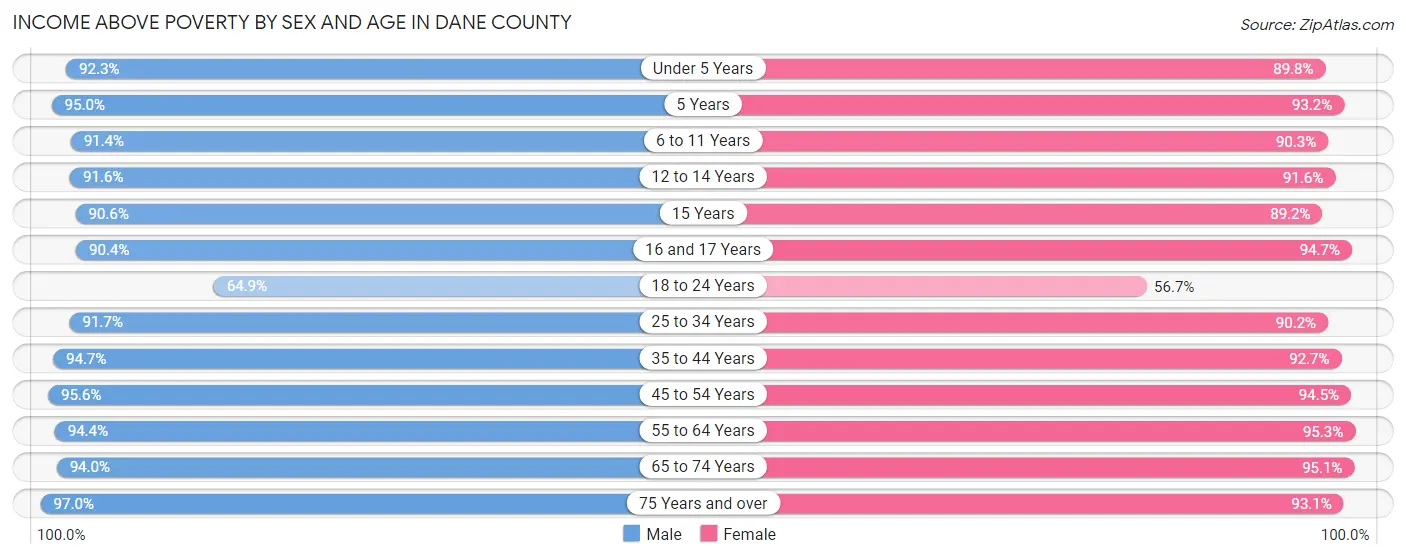
| Age Bracket | Male | Female |
| Under 5 Years | 13,882 (92.3%) | 12,721 (89.7%) |
| 5 Years | 2,870 (95.0%) | 2,788 (93.2%) |
| 6 to 11 Years | 16,980 (91.4%) | 16,298 (90.2%) |
| 12 to 14 Years | 9,647 (91.5%) | 8,618 (91.6%) |
| 15 Years | 3,048 (90.5%) | 2,798 (89.2%) |
| 16 and 17 Years | 5,771 (90.4%) | 5,741 (94.7%) |
| 18 to 24 Years | 22,470 (64.9%) | 18,821 (56.7%) |
| 25 to 34 Years | 40,842 (91.6%) | 37,128 (90.2%) |
| 35 to 44 Years | 36,834 (94.7%) | 34,492 (92.7%) |
| 45 to 54 Years | 30,536 (95.6%) | 29,458 (94.5%) |
| 55 to 64 Years | 28,960 (94.4%) | 30,898 (95.3%) |
| 65 to 74 Years | 22,016 (94.0%) | 24,575 (95.1%) |
| 75 Years and over | 12,246 (97.0%) | 16,529 (93.1%) |
| Total | 246,102 (89.9%) | 240,865 (88.4%) |
Income Below Poverty Among Married-Couple Families in Dane County
The poverty statistics for married-couple families in Dane County show that 2.1% or 2,167 of the total 104,948 families live below the poverty line. Families with 5 or more children have the highest poverty rate of 16.1%, comprising of 82 families. On the other hand, families with no children have the lowest poverty rate of 1.6%, which includes 970 families.
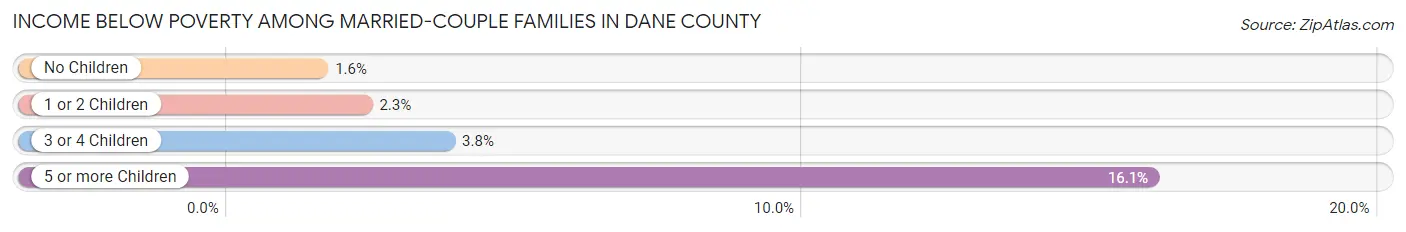
| Children | Above Poverty | Below Poverty |
| No Children | 60,663 (98.4%) | 970 (1.6%) |
| 1 or 2 Children | 34,110 (97.7%) | 817 (2.3%) |
| 3 or 4 Children | 7,579 (96.2%) | 298 (3.8%) |
| 5 or more Children | 429 (84.0%) | 82 (16.1%) |
| Total | 102,781 (97.9%) | 2,167 (2.1%) |
Income Below Poverty Among Single-Parent Households in Dane County
According to the poverty data in Dane County, 10.8% or 904 single-father households and 18.4% or 3,355 single-mother households are living below the poverty line. Among single-father households, those with 5 or more children have the highest poverty rate, with 21 households (56.8%) experiencing poverty. Likewise, among single-mother households, those with 5 or more children have the highest poverty rate, with 113 households (86.3%) falling below the poverty line.
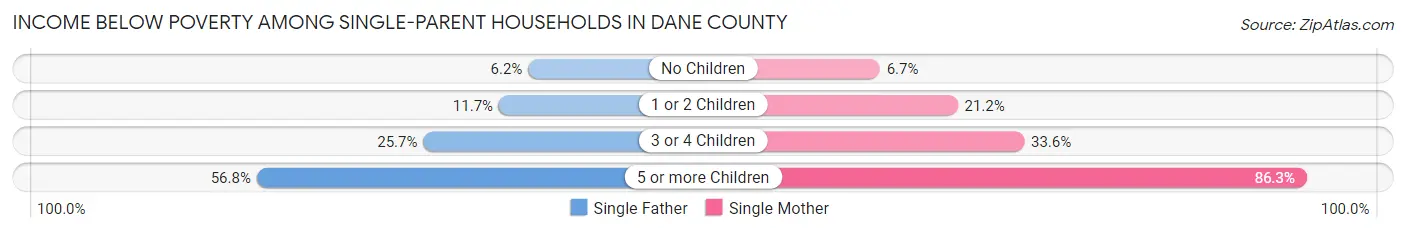
| Children | Single Father | Single Mother |
| No Children | 199 (6.2%) | 368 (6.7%) |
| 1 or 2 Children | 518 (11.7%) | 2,332 (21.2%) |
| 3 or 4 Children | 166 (25.7%) | 542 (33.6%) |
| 5 or more Children | 21 (56.8%) | 113 (86.3%) |
| Total | 904 (10.8%) | 3,355 (18.4%) |
Income Below Poverty Among Married-Couple vs Single-Parent Households in Dane County
The poverty data for Dane County shows that 2,167 of the married-couple family households (2.1%) and 4,259 of the single-parent households (16.0%) are living below the poverty level. Within the married-couple family households, those with 5 or more children have the highest poverty rate, with 82 households (16.1%) falling below the poverty line. Among the single-parent households, those with 5 or more children have the highest poverty rate, with 134 household (79.8%) living below poverty.
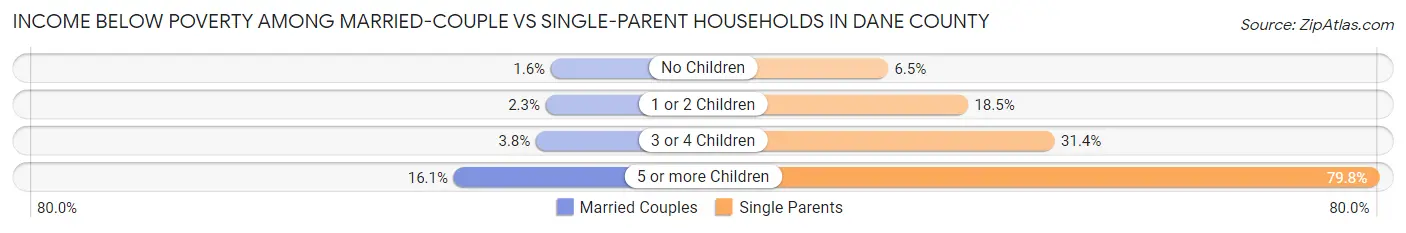
| Children | Married-Couple Families | Single-Parent Households |
| No Children | 970 (1.6%) | 567 (6.5%) |
| 1 or 2 Children | 817 (2.3%) | 2,850 (18.4%) |
| 3 or 4 Children | 298 (3.8%) | 708 (31.4%) |
| 5 or more Children | 82 (16.1%) | 134 (79.8%) |
| Total | 2,167 (2.1%) | 4,259 (16.0%) |
Employment Characteristics in Dane County
Employment by Class of Employer in Dane County
Among the 314,337 employed individuals in Dane County, private company employees (197,040 | 62.7%), state government employees (39,460 | 12.6%), and not-for-profit organizations (29,469 | 9.4%) make up the most common classes of employment.
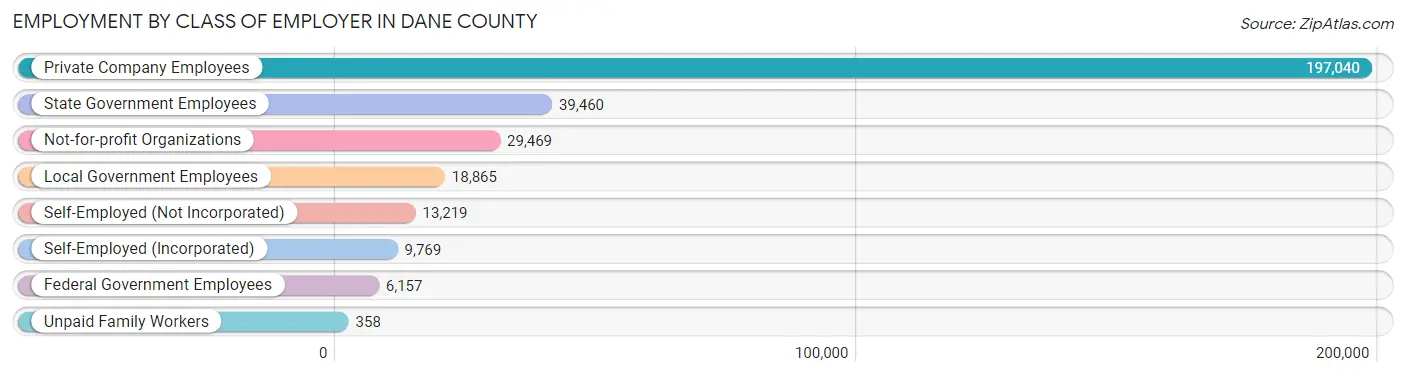
| Employer Class | # Employees | % Employees |
| Private Company Employees | 197,040 | 62.7% |
| Self-Employed (Incorporated) | 9,769 | 3.1% |
| Self-Employed (Not Incorporated) | 13,219 | 4.2% |
| Not-for-profit Organizations | 29,469 | 9.4% |
| Local Government Employees | 18,865 | 6.0% |
| State Government Employees | 39,460 | 12.6% |
| Federal Government Employees | 6,157 | 2.0% |
| Unpaid Family Workers | 358 | 0.1% |
| Total | 314,337 | 100.0% |
Employment Status by Age in Dane County
According to the labor force statistics for Dane County, out of the total population over 16 years of age (460,930), 70.7% or 325,878 individuals are in the labor force, with 2.3% or 7,495 of them unemployed. The age group with the highest labor force participation rate is 25 to 29 years, with 90.9% or 41,507 individuals in the labor force. Within the labor force, the 16 to 19 years age range has the highest percentage of unemployed individuals, with 4.8% or 742 of them being unemployed.
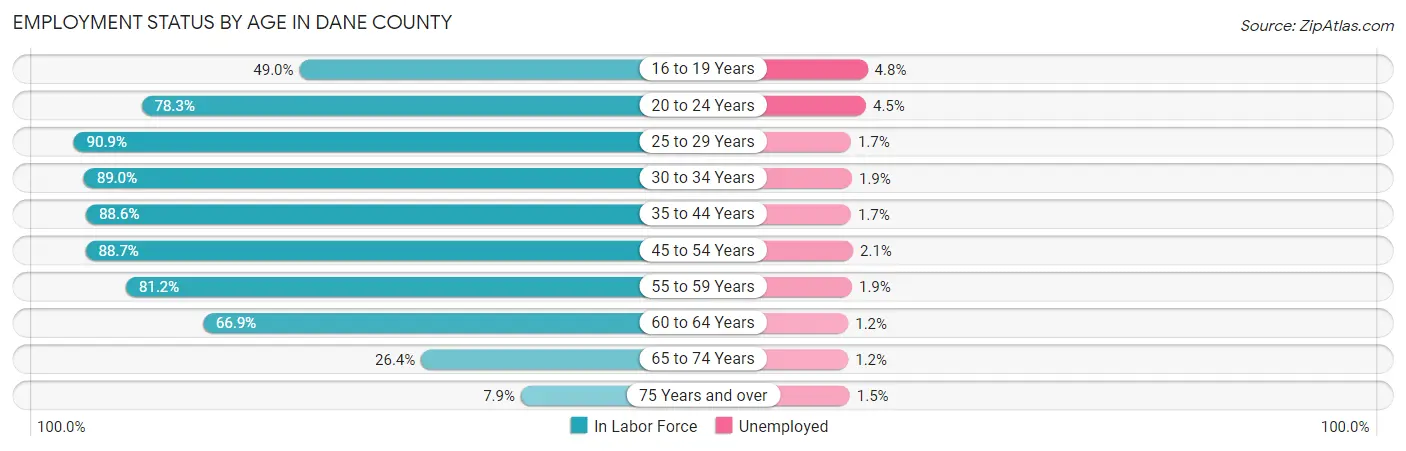
| Age Bracket | In Labor Force | Unemployed |
| 16 to 19 Years | 15,468 (49.0%) | 742 (4.8%) |
| 20 to 24 Years | 45,783 (78.3%) | 2,060 (4.5%) |
| 25 to 29 Years | 41,507 (90.9%) | 706 (1.7%) |
| 30 to 34 Years | 36,161 (89.0%) | 687 (1.9%) |
| 35 to 44 Years | 67,827 (88.6%) | 1,153 (1.7%) |
| 45 to 54 Years | 56,322 (88.7%) | 1,183 (2.1%) |
| 55 to 59 Years | 27,087 (81.2%) | 515 (1.9%) |
| 60 to 64 Years | 20,276 (66.9%) | 243 (1.2%) |
| 65 to 74 Years | 13,106 (26.4%) | 157 (1.2%) |
| 75 Years and over | 2,468 (7.9%) | 37 (1.5%) |
| Total | 325,878 (70.7%) | 7,495 (2.3%) |
Employment Status by Educational Attainment in Dane County
According to labor force statistics for Dane County, 85.9% of individuals (249,118) out of the total population between 25 and 64 years of age (290,009) are in the labor force, with 1.8% or 4,484 of them being unemployed. The group with the highest labor force participation rate are those with the educational attainment of bachelor's degree or higher, with 90.0% or 148,305 individuals in the labor force. Within the labor force, individuals with high school diploma education have the highest percentage of unemployment, with 3.1% or 1,049 of them being unemployed.
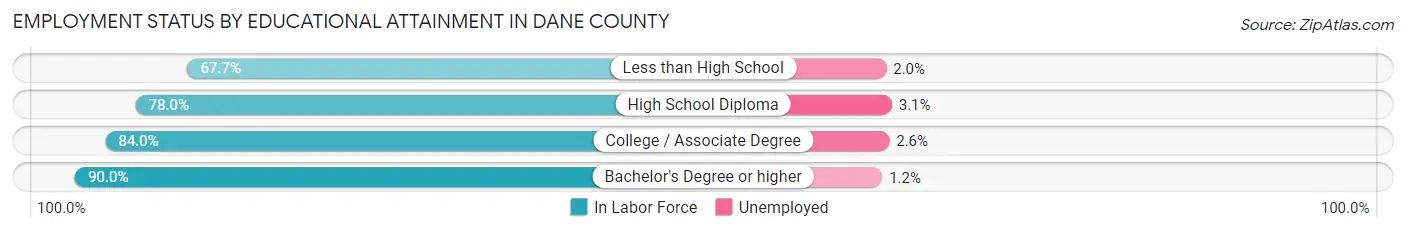
| Educational Attainment | In Labor Force | Unemployed |
| Less than High School | 7,490 (67.7%) | 221 (2.0%) |
| High School Diploma | 33,840 (78.0%) | 1,345 (3.1%) |
| College / Associate Degree | 59,454 (84.0%) | 1,840 (2.6%) |
| Bachelor's Degree or higher | 148,305 (90.0%) | 1,977 (1.2%) |
| Total | 249,118 (85.9%) | 5,220 (1.8%) |
Employment Occupations by Sex in Dane County
Management, Business, Science and Arts Occupations
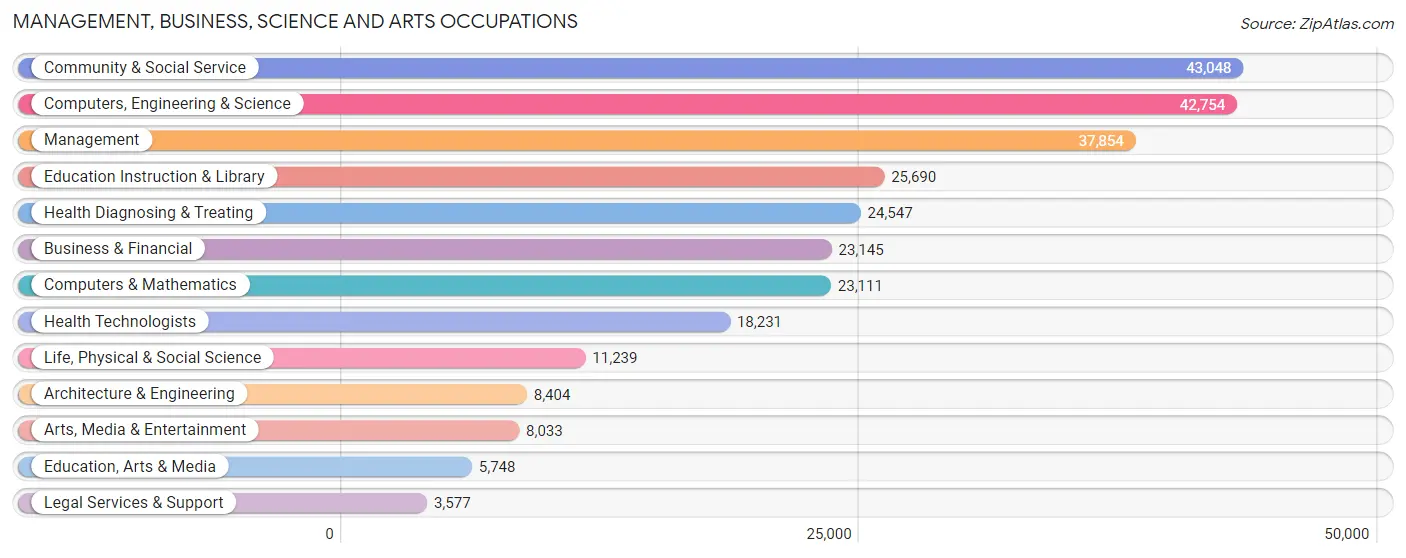
The most common Management, Business, Science and Arts occupations in Dane County are Community & Social Service (43,048 | 13.5%), Computers, Engineering & Science (42,754 | 13.5%), Management (37,854 | 11.9%), Education Instruction & Library (25,690 | 8.1%), and Health Diagnosing & Treating (24,547 | 7.7%).
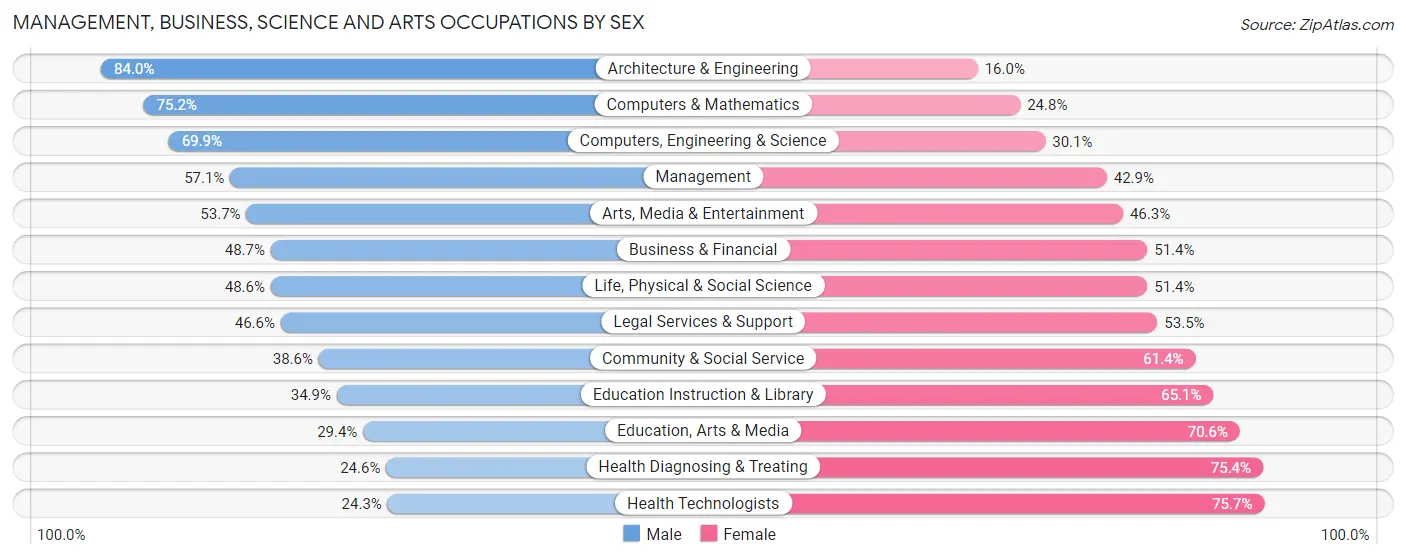
Management, Business, Science and Arts Occupations by Sex
Within the Management, Business, Science and Arts occupations in Dane County, the most male-oriented occupations are Architecture & Engineering (84.0%), Computers & Mathematics (75.2%), and Computers, Engineering & Science (69.9%), while the most female-oriented occupations are Health Technologists (75.7%), Health Diagnosing & Treating (75.4%), and Education, Arts & Media (70.6%).
| Occupation | Male | Female |
| Management | 21,620 (57.1%) | 16,234 (42.9%) |
| Business & Financial | 11,259 (48.6%) | 11,886 (51.3%) |
| Computers, Engineering & Science | 29,899 (69.9%) | 12,855 (30.1%) |
| Computers & Mathematics | 17,370 (75.2%) | 5,741 (24.8%) |
| Architecture & Engineering | 7,062 (84.0%) | 1,342 (16.0%) |
| Life, Physical & Social Science | 5,467 (48.6%) | 5,772 (51.4%) |
| Community & Social Service | 16,630 (38.6%) | 26,418 (61.4%) |
| Education, Arts & Media | 1,688 (29.4%) | 4,060 (70.6%) |
| Legal Services & Support | 1,665 (46.6%) | 1,912 (53.4%) |
| Education Instruction & Library | 8,961 (34.9%) | 16,729 (65.1%) |
| Arts, Media & Entertainment | 4,316 (53.7%) | 3,717 (46.3%) |
| Health Diagnosing & Treating | 6,029 (24.6%) | 18,518 (75.4%) |
| Health Technologists | 4,424 (24.3%) | 13,807 (75.7%) |
| Total (Category) | 85,437 (49.9%) | 85,911 (50.1%) |
| Total (Overall) | 166,167 (52.3%) | 151,714 (47.7%) |
Services Occupations
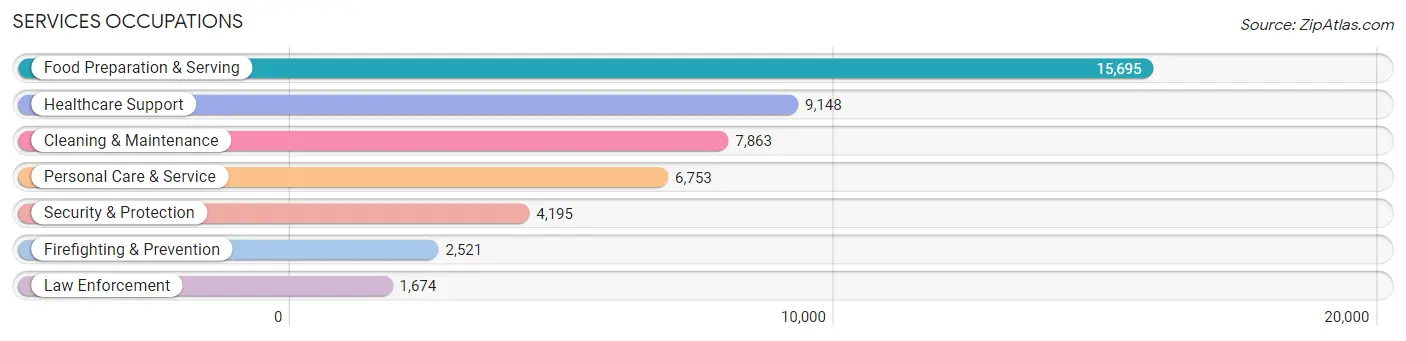
The most common Services occupations in Dane County are Food Preparation & Serving (15,695 | 4.9%), Healthcare Support (9,148 | 2.9%), Cleaning & Maintenance (7,863 | 2.5%), Personal Care & Service (6,753 | 2.1%), and Security & Protection (4,195 | 1.3%).
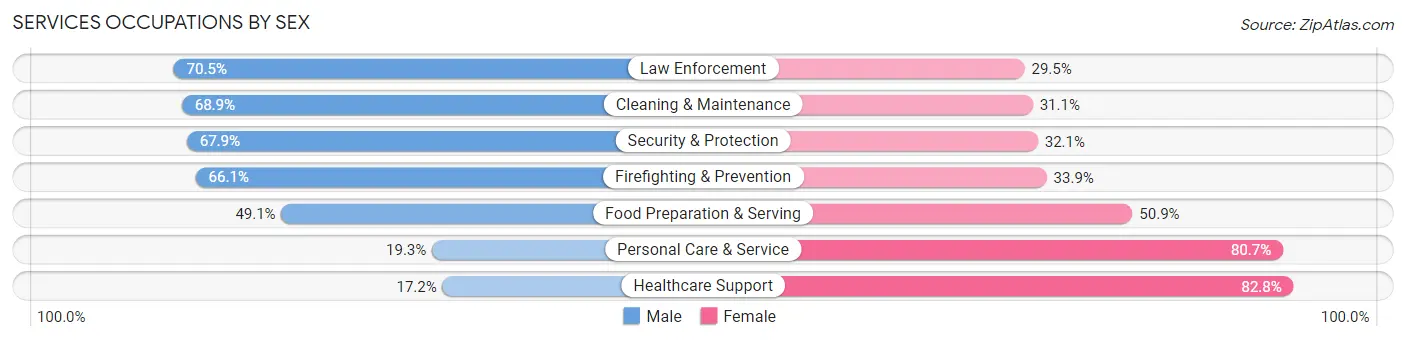
Services Occupations by Sex
Within the Services occupations in Dane County, the most male-oriented occupations are Law Enforcement (70.5%), Cleaning & Maintenance (68.9%), and Security & Protection (67.9%), while the most female-oriented occupations are Healthcare Support (82.8%), Personal Care & Service (80.7%), and Food Preparation & Serving (50.9%).
| Occupation | Male | Female |
| Healthcare Support | 1,577 (17.2%) | 7,571 (82.8%) |
| Security & Protection | 2,847 (67.9%) | 1,348 (32.1%) |
| Firefighting & Prevention | 1,667 (66.1%) | 854 (33.9%) |
| Law Enforcement | 1,180 (70.5%) | 494 (29.5%) |
| Food Preparation & Serving | 7,713 (49.1%) | 7,982 (50.9%) |
| Cleaning & Maintenance | 5,415 (68.9%) | 2,448 (31.1%) |
| Personal Care & Service | 1,304 (19.3%) | 5,449 (80.7%) |
| Total (Category) | 18,856 (43.2%) | 24,798 (56.8%) |
| Total (Overall) | 166,167 (52.3%) | 151,714 (47.7%) |
Sales and Office Occupations
The most common Sales and Office occupations in Dane County are Office & Administration (31,110 | 9.8%), and Sales & Related (24,983 | 7.9%).

Sales and Office Occupations by Sex
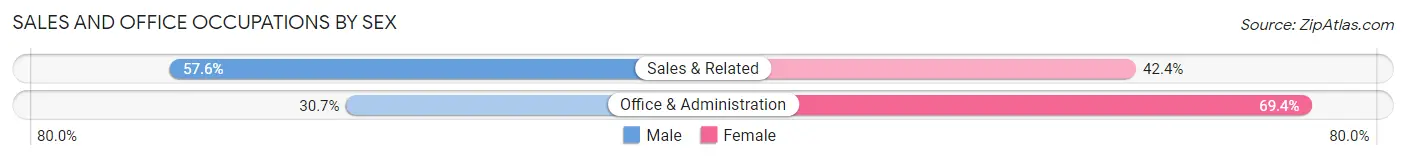
| Occupation | Male | Female |
| Sales & Related | 14,390 (57.6%) | 10,593 (42.4%) |
| Office & Administration | 9,534 (30.6%) | 21,576 (69.4%) |
| Total (Category) | 23,924 (42.6%) | 32,169 (57.4%) |
| Total (Overall) | 166,167 (52.3%) | 151,714 (47.7%) |
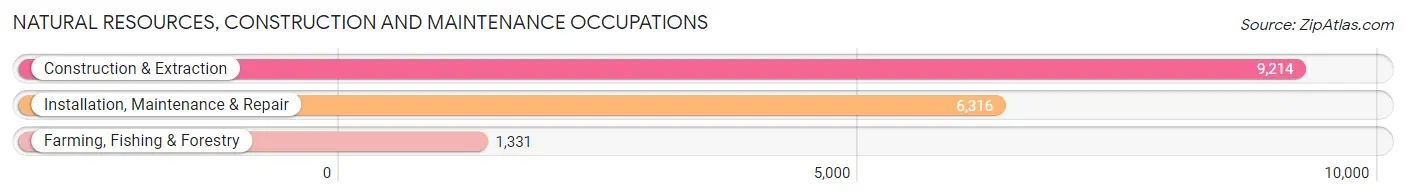
Natural Resources, Construction and Maintenance Occupations
The most common Natural Resources, Construction and Maintenance occupations in Dane County are Construction & Extraction (9,214 | 2.9%), Installation, Maintenance & Repair (6,316 | 2.0%), and Farming, Fishing & Forestry (1,331 | 0.4%).
Natural Resources, Construction and Maintenance Occupations by Sex
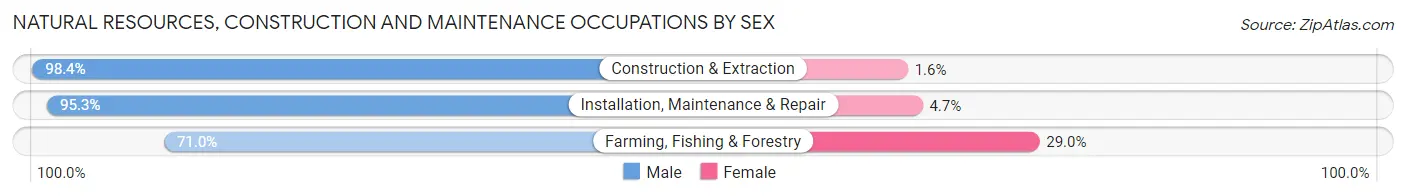
| Occupation | Male | Female |
| Farming, Fishing & Forestry | 945 (71.0%) | 386 (29.0%) |
| Construction & Extraction | 9,065 (98.4%) | 149 (1.6%) |
| Installation, Maintenance & Repair | 6,020 (95.3%) | 296 (4.7%) |
| Total (Category) | 16,030 (95.1%) | 831 (4.9%) |
| Total (Overall) | 166,167 (52.3%) | 151,714 (47.7%) |
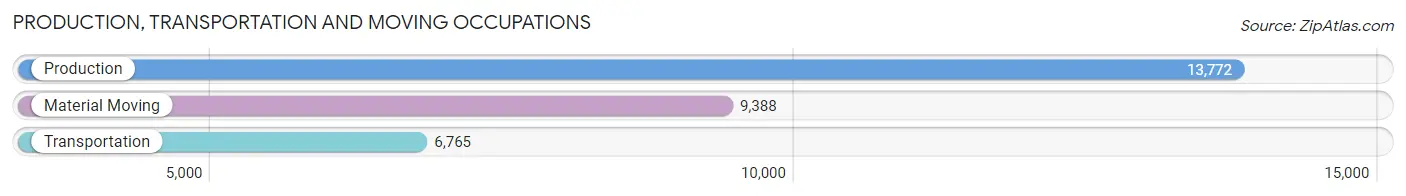
Production, Transportation and Moving Occupations
The most common Production, Transportation and Moving occupations in Dane County are Production (13,772 | 4.3%), Material Moving (9,388 | 2.9%), and Transportation (6,765 | 2.1%).
Production, Transportation and Moving Occupations by Sex
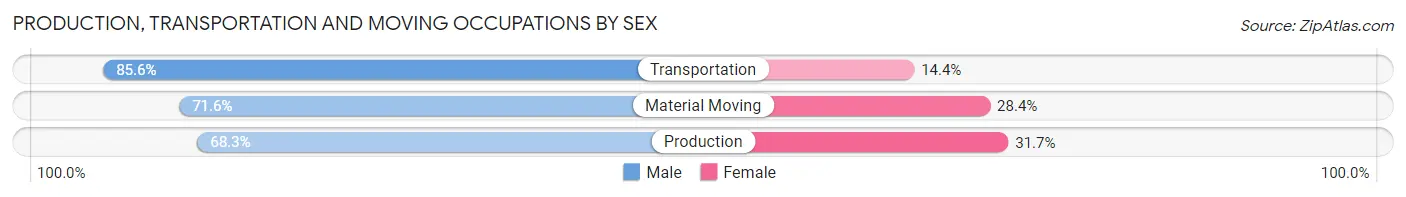
| Occupation | Male | Female |
| Production | 9,406 (68.3%) | 4,366 (31.7%) |
| Transportation | 5,789 (85.6%) | 976 (14.4%) |
| Material Moving | 6,725 (71.6%) | 2,663 (28.4%) |
| Total (Category) | 21,920 (73.3%) | 8,005 (26.8%) |
| Total (Overall) | 166,167 (52.3%) | 151,714 (47.7%) |
Employment Industries by Sex in Dane County
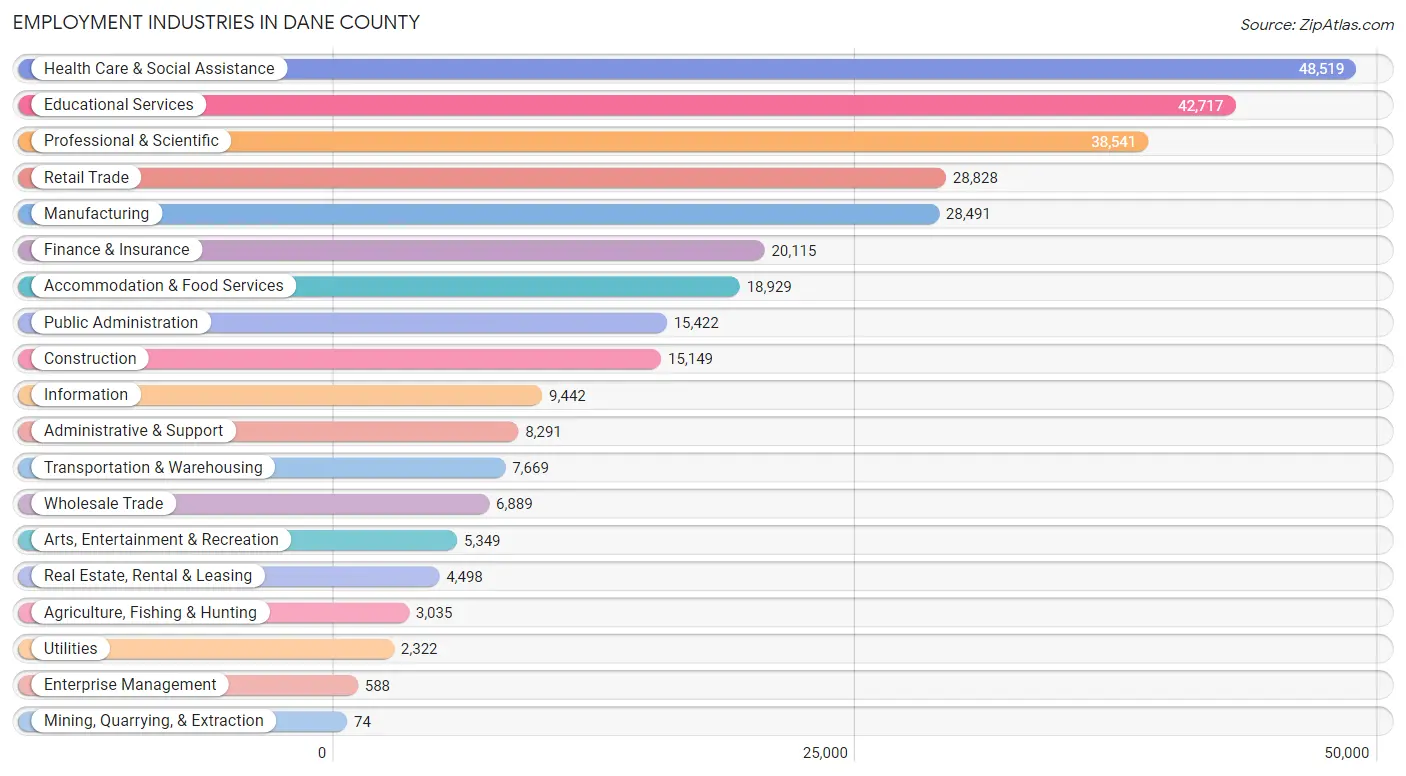
Employment Industries in Dane County
The major employment industries in Dane County include Health Care & Social Assistance (48,519 | 15.3%), Educational Services (42,717 | 13.4%), Professional & Scientific (38,541 | 12.1%), Retail Trade (28,828 | 9.1%), and Manufacturing (28,491 | 9.0%).
Employment Industries by Sex in Dane County
The Dane County industries that see more men than women are Construction (90.3%), Mining, Quarrying, & Extraction (79.7%), and Wholesale Trade (77.4%), whereas the industries that tend to have a higher number of women are Health Care & Social Assistance (75.8%), Educational Services (60.2%), and Arts, Entertainment & Recreation (52.6%).
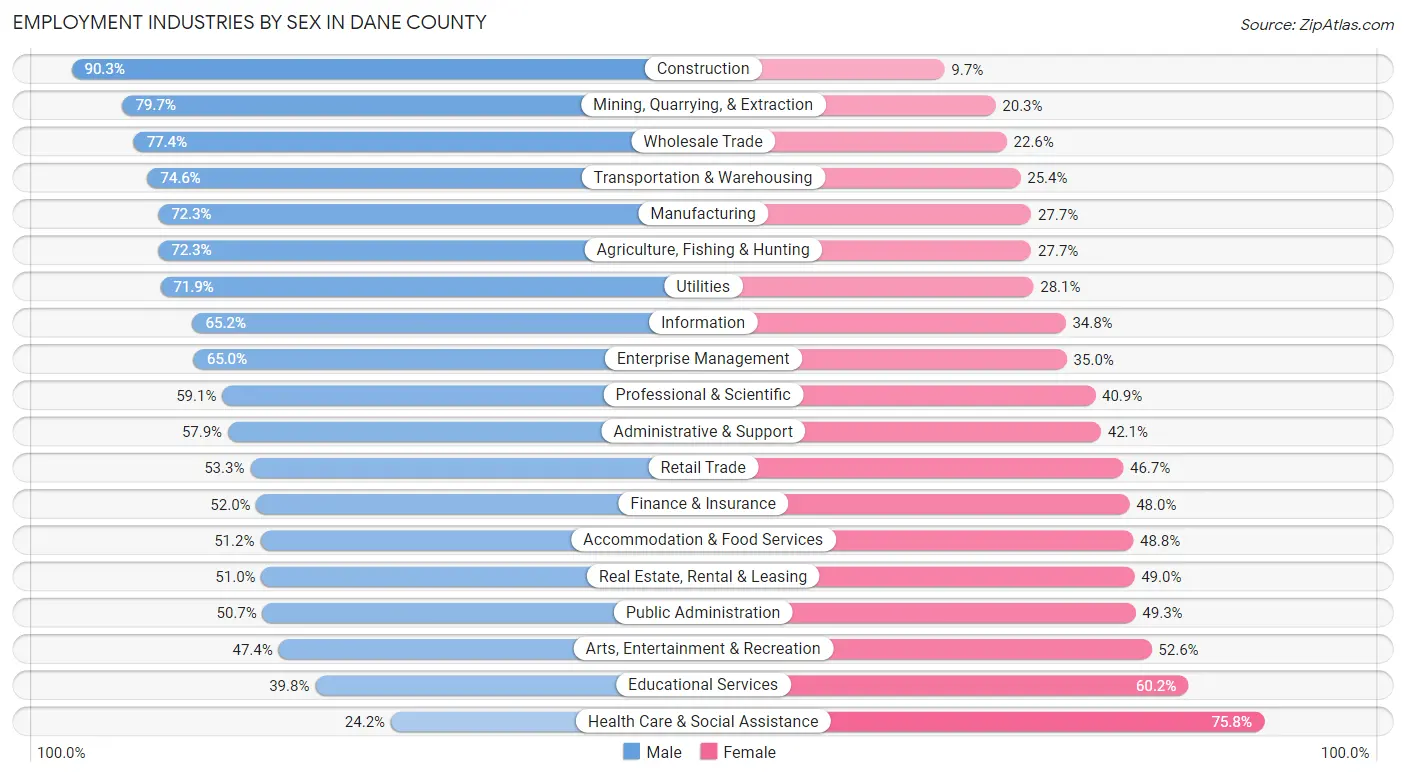
| Industry | Male | Female |
| Agriculture, Fishing & Hunting | 2,195 (72.3%) | 840 (27.7%) |
| Mining, Quarrying, & Extraction | 59 (79.7%) | 15 (20.3%) |
| Construction | 13,675 (90.3%) | 1,474 (9.7%) |
| Manufacturing | 20,610 (72.3%) | 7,881 (27.7%) |
| Wholesale Trade | 5,332 (77.4%) | 1,557 (22.6%) |
| Retail Trade | 15,365 (53.3%) | 13,463 (46.7%) |
| Transportation & Warehousing | 5,719 (74.6%) | 1,950 (25.4%) |
| Utilities | 1,669 (71.9%) | 653 (28.1%) |
| Information | 6,158 (65.2%) | 3,284 (34.8%) |
| Finance & Insurance | 10,464 (52.0%) | 9,651 (48.0%) |
| Real Estate, Rental & Leasing | 2,293 (51.0%) | 2,205 (49.0%) |
| Professional & Scientific | 22,773 (59.1%) | 15,768 (40.9%) |
| Enterprise Management | 382 (65.0%) | 206 (35.0%) |
| Administrative & Support | 4,801 (57.9%) | 3,490 (42.1%) |
| Educational Services | 17,020 (39.8%) | 25,697 (60.2%) |
| Health Care & Social Assistance | 11,731 (24.2%) | 36,788 (75.8%) |
| Arts, Entertainment & Recreation | 2,537 (47.4%) | 2,812 (52.6%) |
| Accommodation & Food Services | 9,697 (51.2%) | 9,232 (48.8%) |
| Public Administration | 7,825 (50.7%) | 7,597 (49.3%) |
| Total | 166,167 (52.3%) | 151,714 (47.7%) |
Education in Dane County
School Enrollment in Dane County
The most common levels of schooling among the 152,625 students in Dane County are college / undergraduate (47,824 | 31.3%), middle school (26,758 | 17.5%), and high school (24,529 | 16.1%).
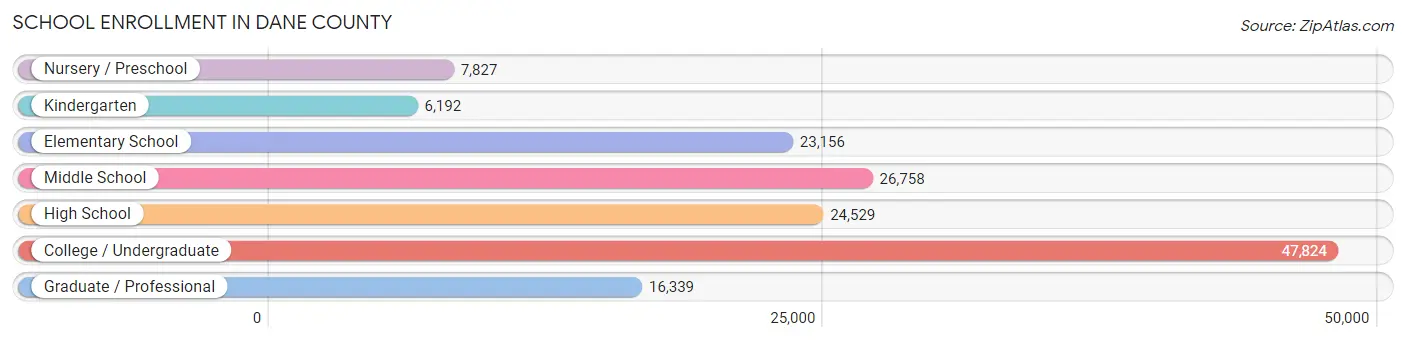
| School Level | # Students | % Students |
| Nursery / Preschool | 7,827 | 5.1% |
| Kindergarten | 6,192 | 4.1% |
| Elementary School | 23,156 | 15.2% |
| Middle School | 26,758 | 17.5% |
| High School | 24,529 | 16.1% |
| College / Undergraduate | 47,824 | 31.3% |
| Graduate / Professional | 16,339 | 10.7% |
| Total | 152,625 | 100.0% |
School Enrollment by Age by Funding Source in Dane County
Out of a total of 152,625 students who are enrolled in schools in Dane County, 15,873 (10.4%) attend a private institution, while the remaining 136,752 (89.6%) are enrolled in public schools. The age group of 3 to 4 year olds has the highest likelihood of being enrolled in private schools, with 2,544 (43.3% in the age bracket) enrolled. Conversely, the age group of 20 to 24 year olds has the lowest likelihood of being enrolled in a private school, with 30,028 (93.4% in the age bracket) attending a public institution.
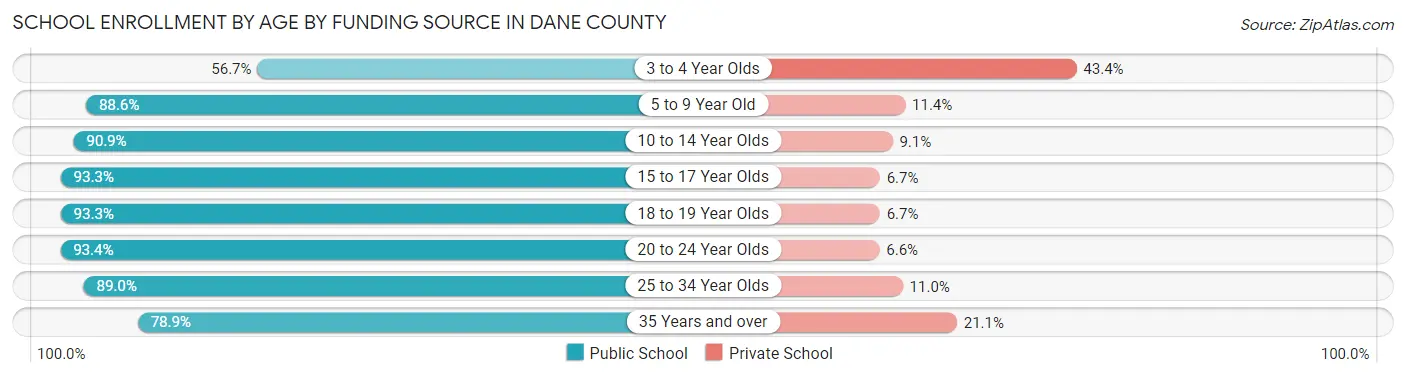
| Age Bracket | Public School | Private School |
| 3 to 4 Year Olds | 3,325 (56.7%) | 2,544 (43.3%) |
| 5 to 9 Year Old | 25,056 (88.6%) | 3,237 (11.4%) |
| 10 to 14 Year Olds | 29,918 (90.9%) | 2,993 (9.1%) |
| 15 to 17 Year Olds | 17,233 (93.3%) | 1,239 (6.7%) |
| 18 to 19 Year Olds | 15,189 (93.3%) | 1,094 (6.7%) |
| 20 to 24 Year Olds | 30,028 (93.4%) | 2,134 (6.6%) |
| 25 to 34 Year Olds | 10,838 (89.0%) | 1,338 (11.0%) |
| 35 Years and over | 5,098 (78.9%) | 1,361 (21.1%) |
| Total | 136,752 (89.6%) | 15,873 (10.4%) |
Educational Attainment by Field of Study in Dane County
Business (32,704 | 14.6%), bio, nature & agricultural (25,246 | 11.3%), education (21,258 | 9.5%), social sciences (20,823 | 9.3%), and science & technology (19,426 | 8.7%) are the most common fields of study among 223,279 individuals in Dane County who have obtained a bachelor's degree or higher.

| Field of Study | # Graduates | % Graduates |
| Computers & Mathematics | 12,759 | 5.7% |
| Bio, Nature & Agricultural | 25,246 | 11.3% |
| Physical & Health Sciences | 9,835 | 4.4% |
| Psychology | 10,710 | 4.8% |
| Social Sciences | 20,823 | 9.3% |
| Engineering | 14,886 | 6.7% |
| Multidisciplinary Studies | 2,065 | 0.9% |
| Science & Technology | 19,426 | 8.7% |
| Business | 32,704 | 14.6% |
| Education | 21,258 | 9.5% |
| Literature & Languages | 12,822 | 5.7% |
| Liberal Arts & History | 10,163 | 4.5% |
| Visual & Performing Arts | 9,783 | 4.4% |
| Communications | 9,564 | 4.3% |
| Arts & Humanities | 11,235 | 5.0% |
| Total | 223,279 | 100.0% |
Transportation & Commute in Dane County
Vehicle Availability by Sex in Dane County
The most prevalent vehicle ownership categories in Dane County are males with 2 vehicles (76,828, accounting for 47.1%) and females with 2 vehicles (69,483, making up 52.1%).
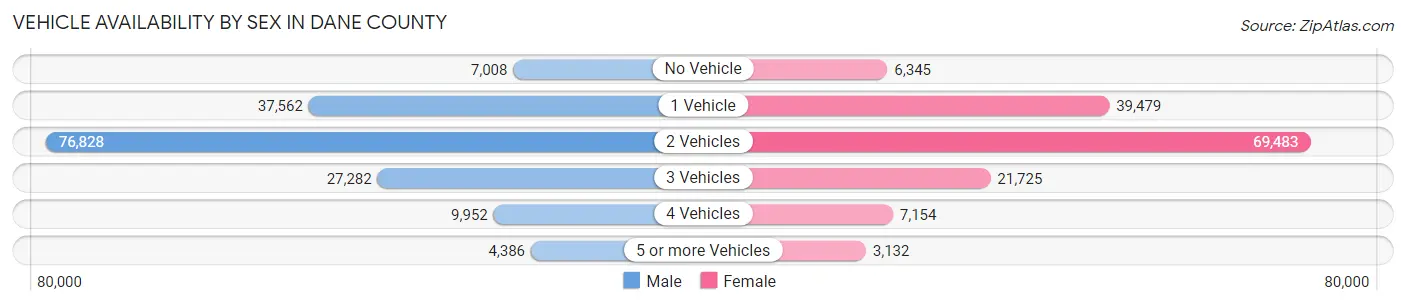
| Vehicles Available | Male | Female |
| No Vehicle | 7,008 (4.3%) | 6,345 (4.3%) |
| 1 Vehicle | 37,562 (23.0%) | 39,479 (26.8%) |
| 2 Vehicles | 76,828 (47.1%) | 69,483 (47.2%) |
| 3 Vehicles | 27,282 (16.7%) | 21,725 (14.7%) |
| 4 Vehicles | 9,952 (6.1%) | 7,154 (4.9%) |
| 5 or more Vehicles | 4,386 (2.7%) | 3,132 (2.1%) |
| Total | 163,018 (100.0%) | 147,318 (100.0%) |
Commute Time in Dane County
The most frequently occuring commute durations in Dane County are 15 to 19 minutes (49,388 commuters, 18.5%), 20 to 24 minutes (47,327 commuters, 17.7%), and 10 to 14 minutes (43,242 commuters, 16.2%).
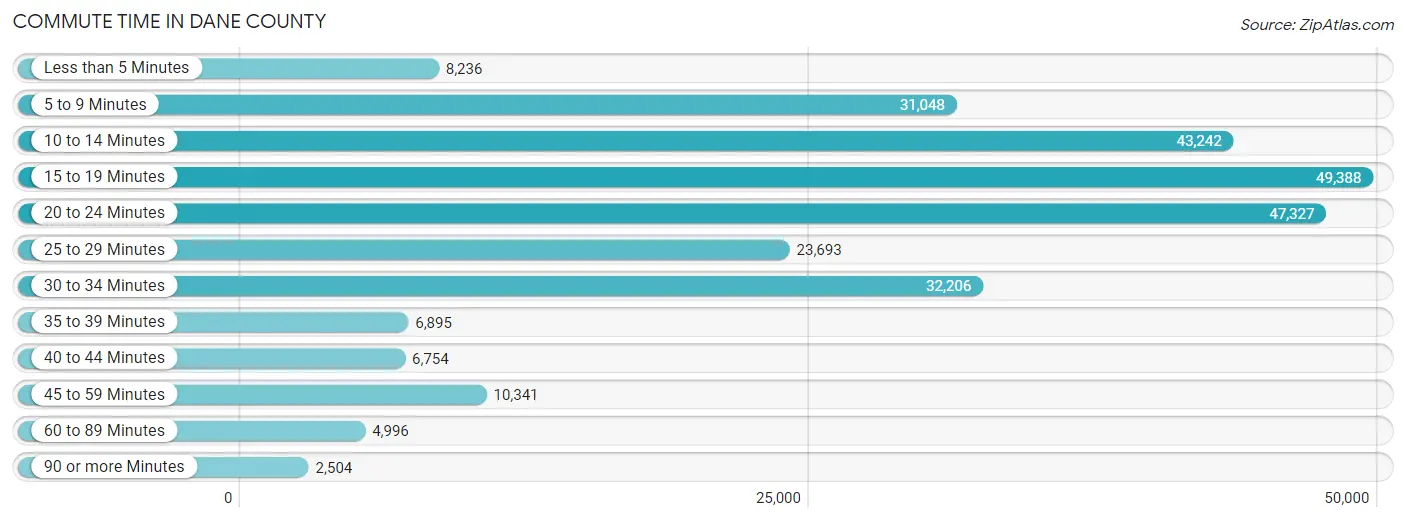
| Commute Time | # Commuters | % Commuters |
| Less than 5 Minutes | 8,236 | 3.1% |
| 5 to 9 Minutes | 31,048 | 11.6% |
| 10 to 14 Minutes | 43,242 | 16.2% |
| 15 to 19 Minutes | 49,388 | 18.5% |
| 20 to 24 Minutes | 47,327 | 17.7% |
| 25 to 29 Minutes | 23,693 | 8.9% |
| 30 to 34 Minutes | 32,206 | 12.1% |
| 35 to 39 Minutes | 6,895 | 2.6% |
| 40 to 44 Minutes | 6,754 | 2.5% |
| 45 to 59 Minutes | 10,341 | 3.9% |
| 60 to 89 Minutes | 4,996 | 1.9% |
| 90 or more Minutes | 2,504 | 0.9% |
Commute Time by Sex in Dane County
The most common commute times in Dane County are 15 to 19 minutes (26,057 commuters, 18.5%) for males and 15 to 19 minutes (23,331 commuters, 18.5%) for females.
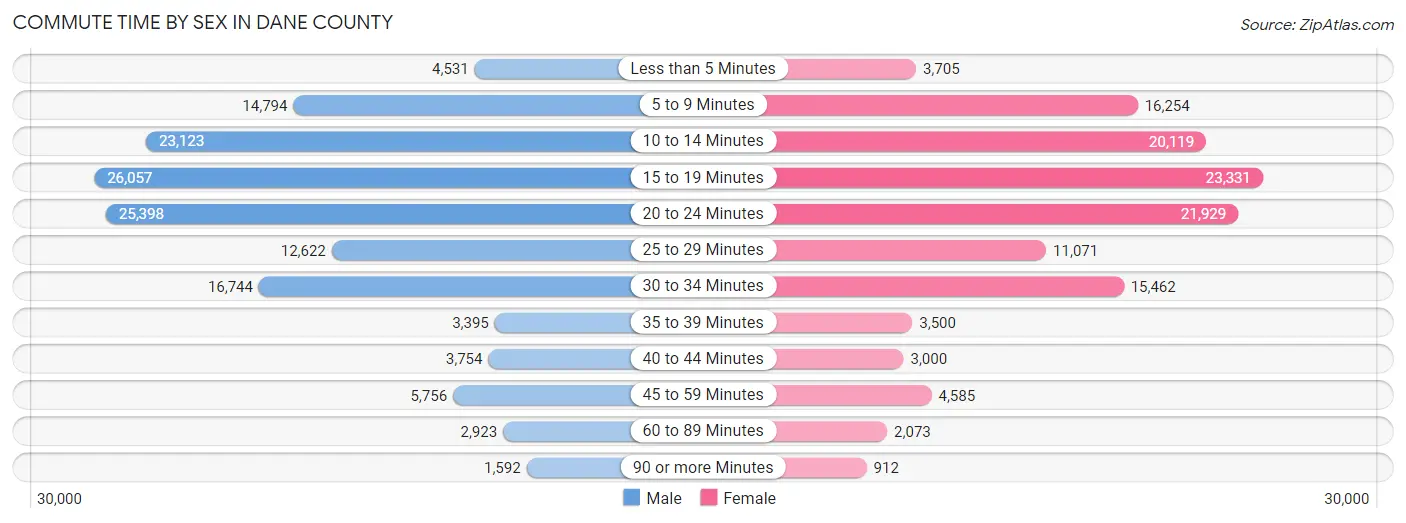
| Commute Time | Male | Female |
| Less than 5 Minutes | 4,531 (3.2%) | 3,705 (2.9%) |
| 5 to 9 Minutes | 14,794 (10.5%) | 16,254 (12.9%) |
| 10 to 14 Minutes | 23,123 (16.4%) | 20,119 (16.0%) |
| 15 to 19 Minutes | 26,057 (18.5%) | 23,331 (18.5%) |
| 20 to 24 Minutes | 25,398 (18.0%) | 21,929 (17.4%) |
| 25 to 29 Minutes | 12,622 (9.0%) | 11,071 (8.8%) |
| 30 to 34 Minutes | 16,744 (11.9%) | 15,462 (12.3%) |
| 35 to 39 Minutes | 3,395 (2.4%) | 3,500 (2.8%) |
| 40 to 44 Minutes | 3,754 (2.7%) | 3,000 (2.4%) |
| 45 to 59 Minutes | 5,756 (4.1%) | 4,585 (3.6%) |
| 60 to 89 Minutes | 2,923 (2.1%) | 2,073 (1.7%) |
| 90 or more Minutes | 1,592 (1.1%) | 912 (0.7%) |
Time of Departure to Work by Sex in Dane County
The most frequent times of departure to work in Dane County are 7:00 AM to 7:29 AM (22,076, 15.7%) for males and 7:30 AM to 7:59 AM (22,100, 17.5%) for females.
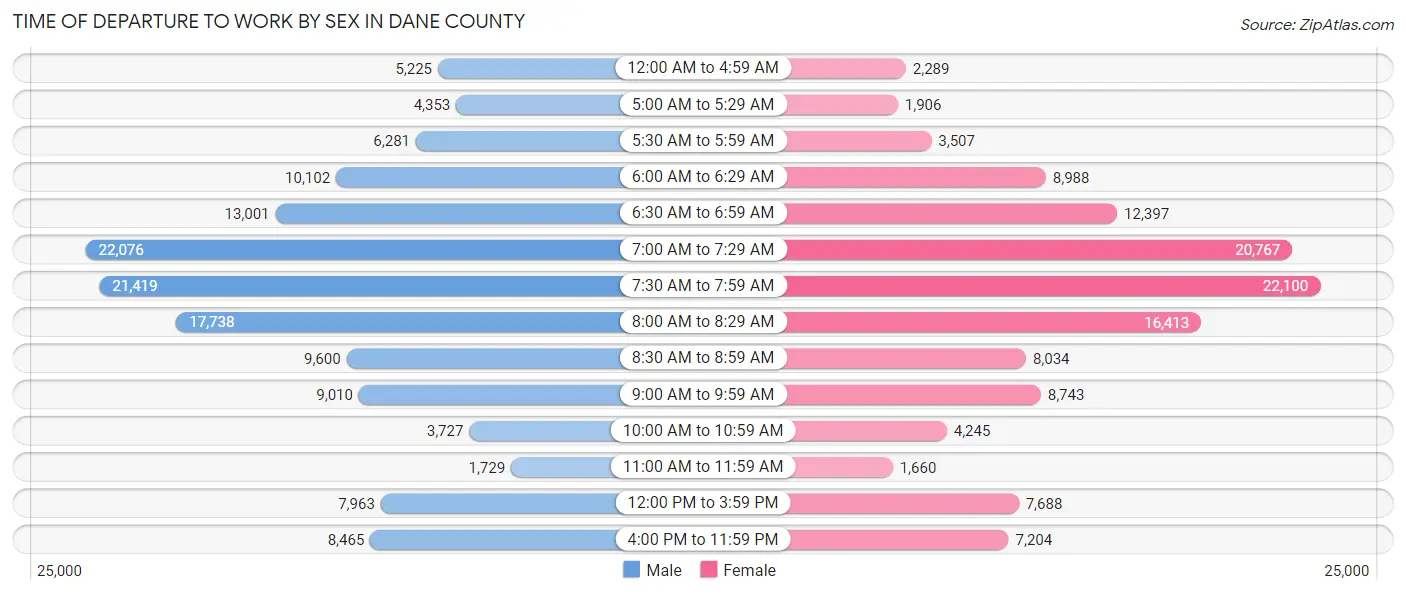
| Time of Departure | Male | Female |
| 12:00 AM to 4:59 AM | 5,225 (3.7%) | 2,289 (1.8%) |
| 5:00 AM to 5:29 AM | 4,353 (3.1%) | 1,906 (1.5%) |
| 5:30 AM to 5:59 AM | 6,281 (4.5%) | 3,507 (2.8%) |
| 6:00 AM to 6:29 AM | 10,102 (7.2%) | 8,988 (7.1%) |
| 6:30 AM to 6:59 AM | 13,001 (9.2%) | 12,397 (9.8%) |
| 7:00 AM to 7:29 AM | 22,076 (15.7%) | 20,767 (16.5%) |
| 7:30 AM to 7:59 AM | 21,419 (15.2%) | 22,100 (17.5%) |
| 8:00 AM to 8:29 AM | 17,738 (12.6%) | 16,413 (13.0%) |
| 8:30 AM to 8:59 AM | 9,600 (6.8%) | 8,034 (6.4%) |
| 9:00 AM to 9:59 AM | 9,010 (6.4%) | 8,743 (6.9%) |
| 10:00 AM to 10:59 AM | 3,727 (2.6%) | 4,245 (3.4%) |
| 11:00 AM to 11:59 AM | 1,729 (1.2%) | 1,660 (1.3%) |
| 12:00 PM to 3:59 PM | 7,963 (5.7%) | 7,688 (6.1%) |
| 4:00 PM to 11:59 PM | 8,465 (6.0%) | 7,204 (5.7%) |
| Total | 140,689 (100.0%) | 125,941 (100.0%) |
Housing Occupancy in Dane County
Occupancy by Ownership in Dane County
Of the total 240,799 dwellings in Dane County, owner-occupied units account for 139,432 (57.9%), while renter-occupied units make up 101,367 (42.1%).
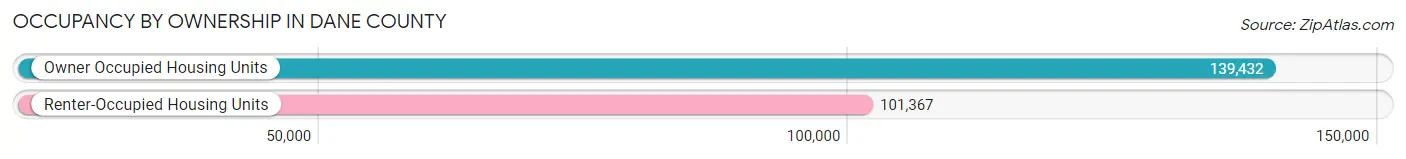
| Occupancy | # Housing Units | % Housing Units |
| Owner Occupied Housing Units | 139,432 | 57.9% |
| Renter-Occupied Housing Units | 101,367 | 42.1% |
| Total Occupied Housing Units | 240,799 | 100.0% |
Occupancy by Household Size in Dane County
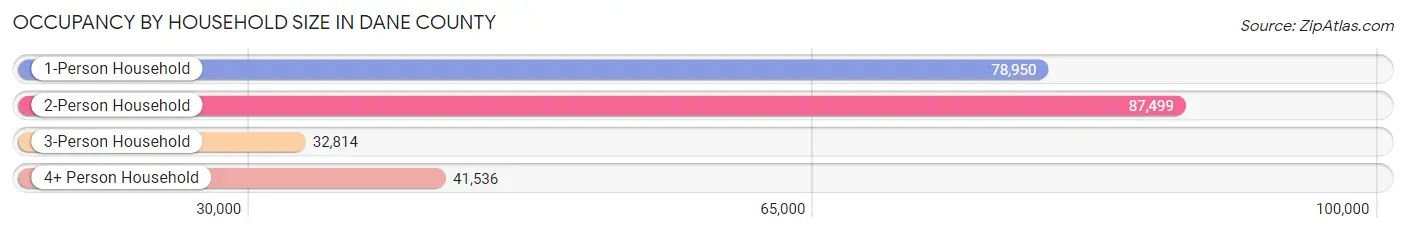
| Household Size | # Housing Units | % Housing Units |
| 1-Person Household | 78,950 | 32.8% |
| 2-Person Household | 87,499 | 36.3% |
| 3-Person Household | 32,814 | 13.6% |
| 4+ Person Household | 41,536 | 17.2% |
| Total Housing Units | 240,799 | 100.0% |
Occupancy by Ownership by Household Size in Dane County
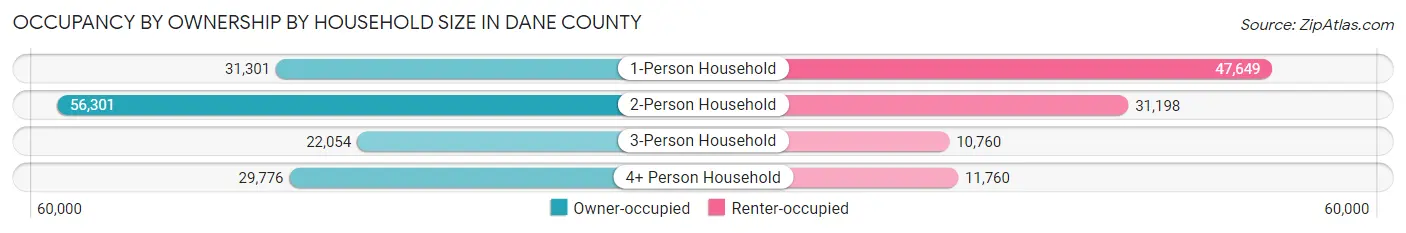
| Household Size | Owner-occupied | Renter-occupied |
| 1-Person Household | 31,301 (39.7%) | 47,649 (60.4%) |
| 2-Person Household | 56,301 (64.3%) | 31,198 (35.7%) |
| 3-Person Household | 22,054 (67.2%) | 10,760 (32.8%) |
| 4+ Person Household | 29,776 (71.7%) | 11,760 (28.3%) |
| Total Housing Units | 139,432 (57.9%) | 101,367 (42.1%) |
Occupancy by Educational Attainment in Dane County
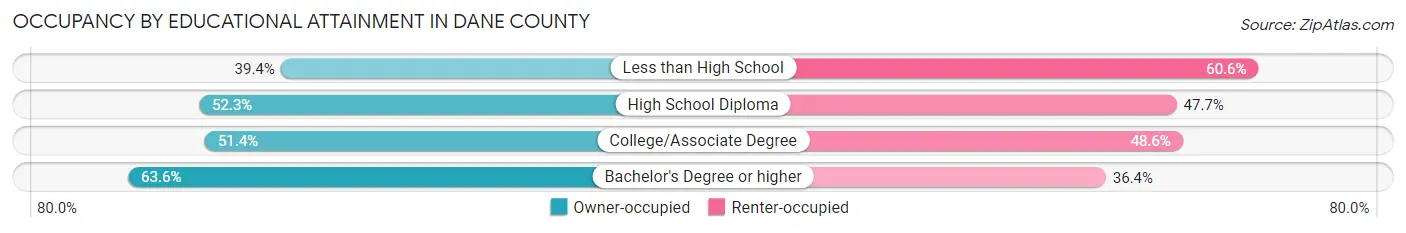
| Household Size | Owner-occupied | Renter-occupied |
| Less than High School | 2,855 (39.4%) | 4,393 (60.6%) |
| High School Diploma | 19,689 (52.3%) | 17,928 (47.7%) |
| College/Associate Degree | 32,368 (51.4%) | 30,618 (48.6%) |
| Bachelor's Degree or higher | 84,520 (63.6%) | 48,428 (36.4%) |
Occupancy by Age of Householder in Dane County
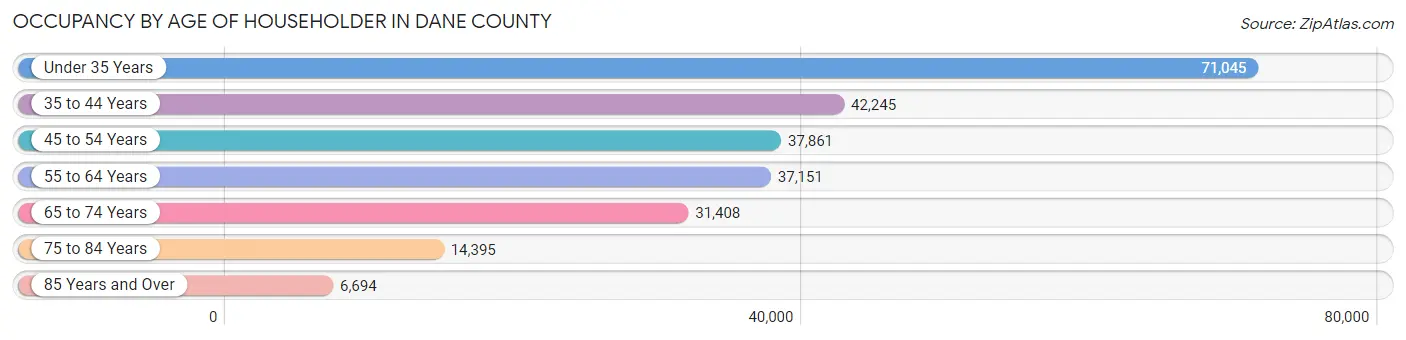
| Age Bracket | # Households | % Households |
| Under 35 Years | 71,045 | 29.5% |
| 35 to 44 Years | 42,245 | 17.5% |
| 45 to 54 Years | 37,861 | 15.7% |
| 55 to 64 Years | 37,151 | 15.4% |
| 65 to 74 Years | 31,408 | 13.0% |
| 75 to 84 Years | 14,395 | 6.0% |
| 85 Years and Over | 6,694 | 2.8% |
| Total | 240,799 | 100.0% |
Housing Finances in Dane County
Median Income by Occupancy in Dane County
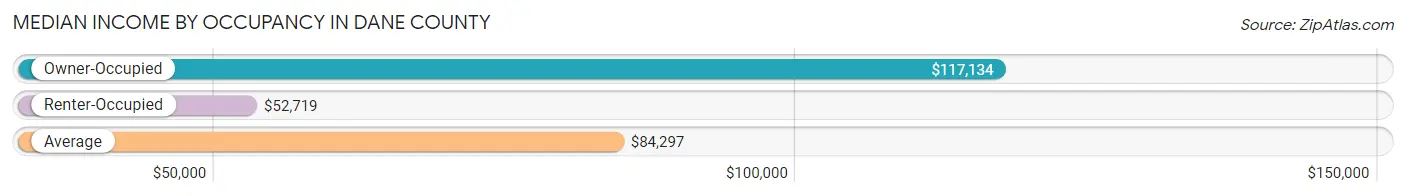
| Occupancy Type | # Households | Median Income |
| Owner-Occupied | 139,432 (57.9%) | $117,134 |
| Renter-Occupied | 101,367 (42.1%) | $52,719 |
| Average | 240,799 (100.0%) | $84,297 |
Occupancy by Householder Income Bracket in Dane County
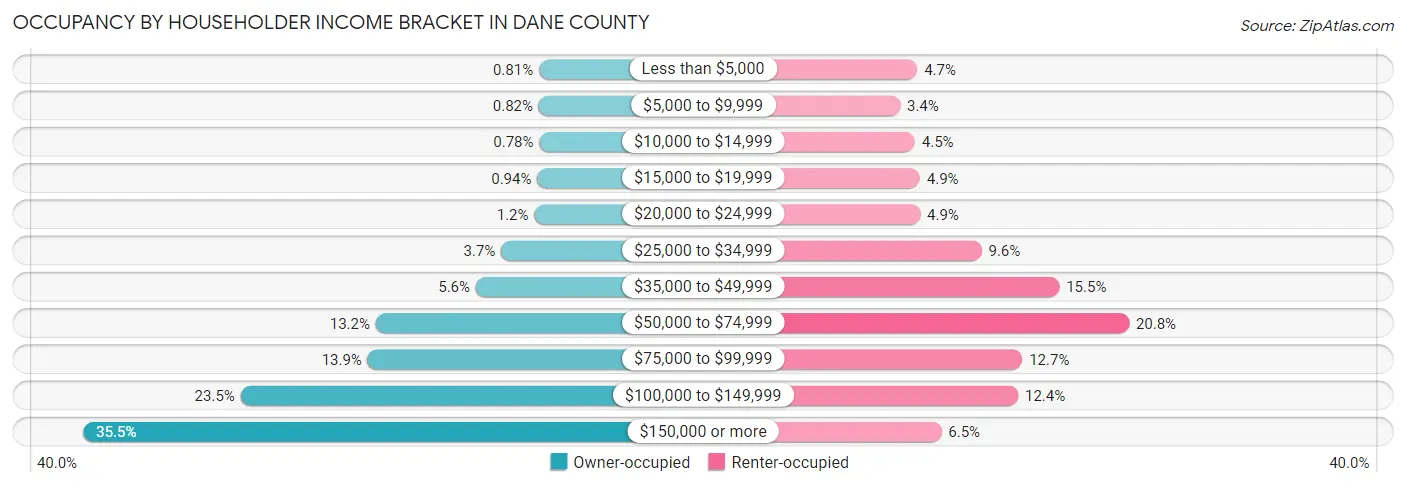
| Income Bracket | Owner-occupied | Renter-occupied |
| Less than $5,000 | 1,136 (0.8%) | 4,760 (4.7%) |
| $5,000 to $9,999 | 1,144 (0.8%) | 3,437 (3.4%) |
| $10,000 to $14,999 | 1,088 (0.8%) | 4,585 (4.5%) |
| $15,000 to $19,999 | 1,308 (0.9%) | 4,967 (4.9%) |
| $20,000 to $24,999 | 1,616 (1.2%) | 4,991 (4.9%) |
| $25,000 to $34,999 | 5,142 (3.7%) | 9,727 (9.6%) |
| $35,000 to $49,999 | 7,831 (5.6%) | 15,729 (15.5%) |
| $50,000 to $74,999 | 18,458 (13.2%) | 21,112 (20.8%) |
| $75,000 to $99,999 | 19,329 (13.9%) | 12,877 (12.7%) |
| $100,000 to $149,999 | 32,824 (23.5%) | 12,552 (12.4%) |
| $150,000 or more | 49,556 (35.5%) | 6,630 (6.5%) |
| Total | 139,432 (100.0%) | 101,367 (100.0%) |
Monthly Housing Cost Tiers in Dane County
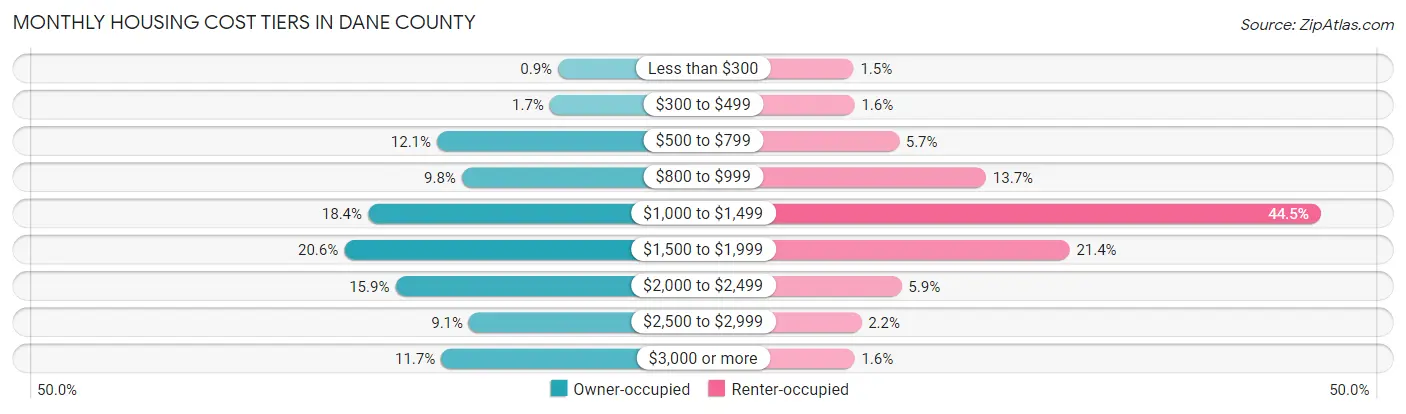
| Monthly Cost | Owner-occupied | Renter-occupied |
| Less than $300 | 1,261 (0.9%) | 1,496 (1.5%) |
| $300 to $499 | 2,311 (1.7%) | 1,589 (1.6%) |
| $500 to $799 | 16,798 (12.0%) | 5,728 (5.7%) |
| $800 to $999 | 13,606 (9.8%) | 13,855 (13.7%) |
| $1,000 to $1,499 | 25,662 (18.4%) | 45,082 (44.5%) |
| $1,500 to $1,999 | 28,705 (20.6%) | 21,649 (21.4%) |
| $2,000 to $2,499 | 22,141 (15.9%) | 5,967 (5.9%) |
| $2,500 to $2,999 | 12,693 (9.1%) | 2,217 (2.2%) |
| $3,000 or more | 16,255 (11.7%) | 1,591 (1.6%) |
| Total | 139,432 (100.0%) | 101,367 (100.0%) |
Physical Housing Characteristics in Dane County
Housing Structures in Dane County
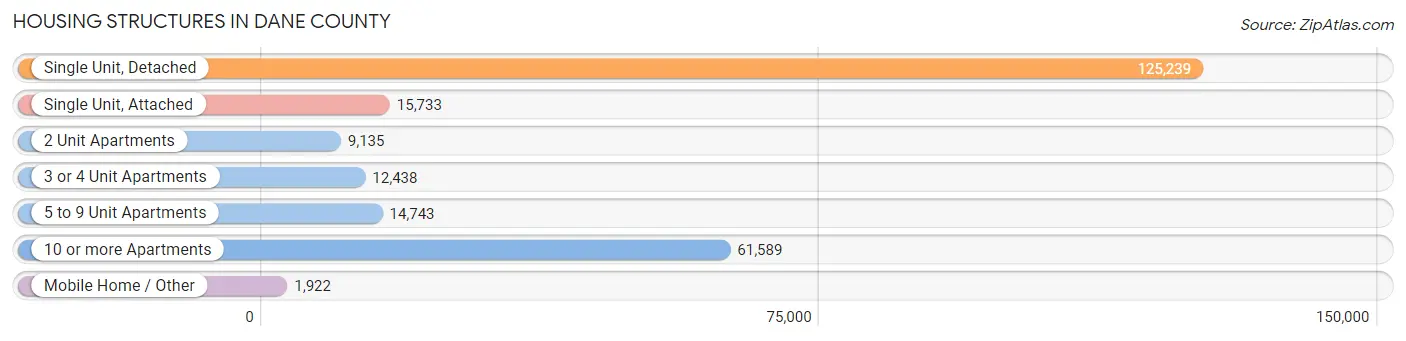
| Structure Type | # Housing Units | % Housing Units |
| Single Unit, Detached | 125,239 | 52.0% |
| Single Unit, Attached | 15,733 | 6.5% |
| 2 Unit Apartments | 9,135 | 3.8% |
| 3 or 4 Unit Apartments | 12,438 | 5.2% |
| 5 to 9 Unit Apartments | 14,743 | 6.1% |
| 10 or more Apartments | 61,589 | 25.6% |
| Mobile Home / Other | 1,922 | 0.8% |
| Total | 240,799 | 100.0% |
Housing Structures by Occupancy in Dane County
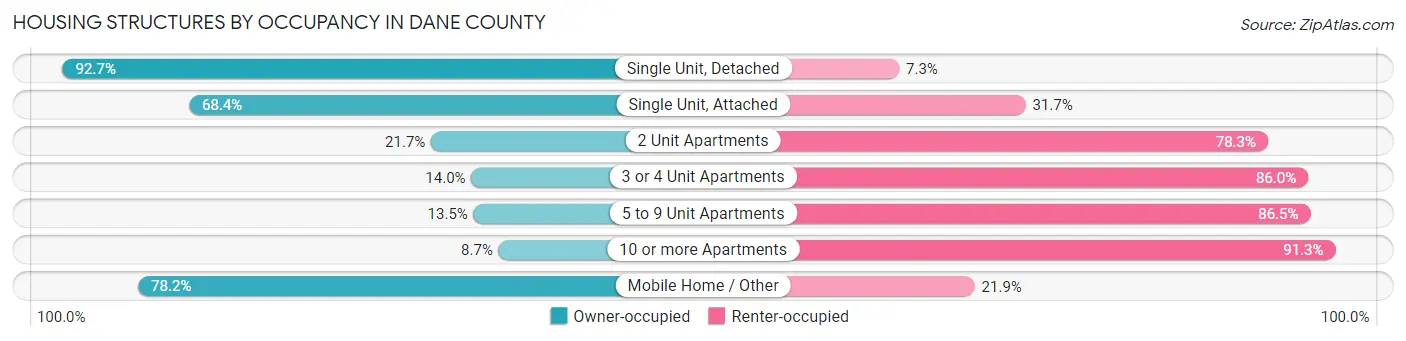
| Structure Type | Owner-occupied | Renter-occupied |
| Single Unit, Detached | 116,094 (92.7%) | 9,145 (7.3%) |
| Single Unit, Attached | 10,753 (68.3%) | 4,980 (31.7%) |
| 2 Unit Apartments | 1,984 (21.7%) | 7,151 (78.3%) |
| 3 or 4 Unit Apartments | 1,737 (14.0%) | 10,701 (86.0%) |
| 5 to 9 Unit Apartments | 1,996 (13.5%) | 12,747 (86.5%) |
| 10 or more Apartments | 5,366 (8.7%) | 56,223 (91.3%) |
| Mobile Home / Other | 1,502 (78.1%) | 420 (21.8%) |
| Total | 139,432 (57.9%) | 101,367 (42.1%) |
Housing Structures by Number of Rooms in Dane County
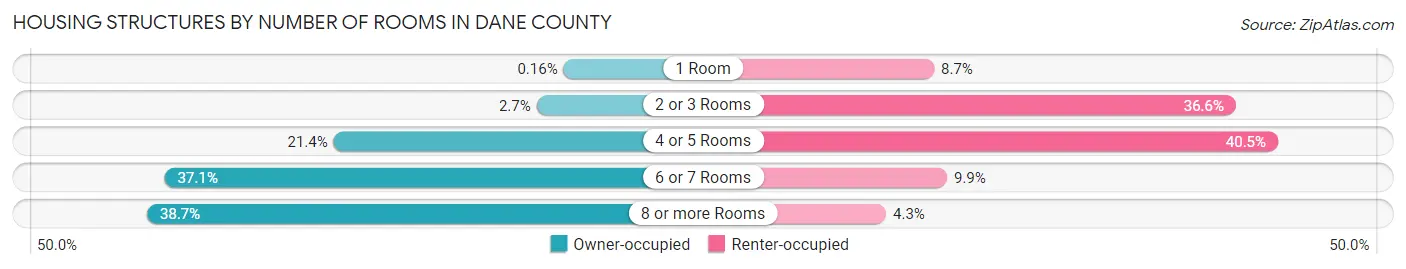
| Number of Rooms | Owner-occupied | Renter-occupied |
| 1 Room | 230 (0.2%) | 8,832 (8.7%) |
| 2 or 3 Rooms | 3,698 (2.6%) | 37,115 (36.6%) |
| 4 or 5 Rooms | 29,884 (21.4%) | 41,053 (40.5%) |
| 6 or 7 Rooms | 51,671 (37.1%) | 10,038 (9.9%) |
| 8 or more Rooms | 53,949 (38.7%) | 4,329 (4.3%) |
| Total | 139,432 (100.0%) | 101,367 (100.0%) |
Housing Structure by Heating Type in Dane County
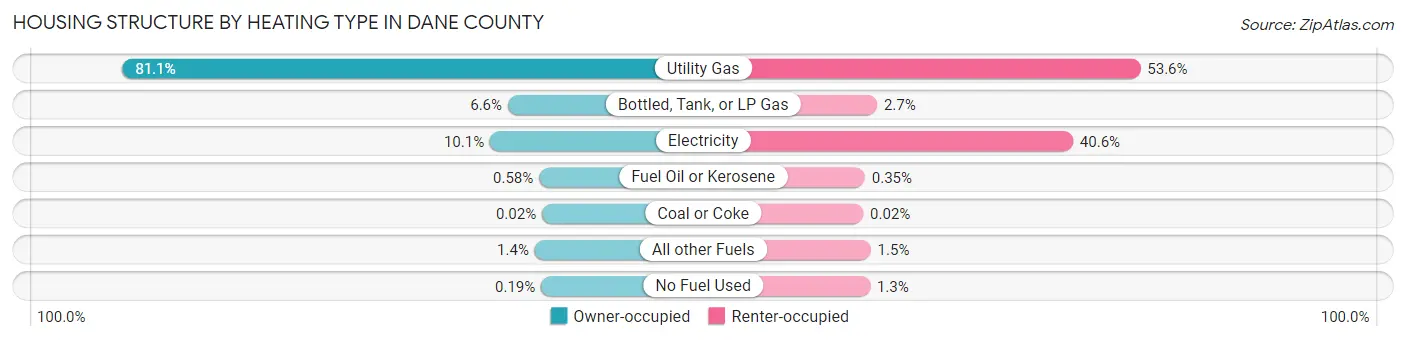
| Heating Type | Owner-occupied | Renter-occupied |
| Utility Gas | 113,102 (81.1%) | 54,324 (53.6%) |
| Bottled, Tank, or LP Gas | 9,211 (6.6%) | 2,724 (2.7%) |
| Electricity | 14,038 (10.1%) | 41,103 (40.6%) |
| Fuel Oil or Kerosene | 811 (0.6%) | 359 (0.4%) |
| Coal or Coke | 28 (0.0%) | 25 (0.0%) |
| All other Fuels | 1,980 (1.4%) | 1,487 (1.5%) |
| No Fuel Used | 262 (0.2%) | 1,345 (1.3%) |
| Total | 139,432 (100.0%) | 101,367 (100.0%) |
Household Vehicle Usage in Dane County
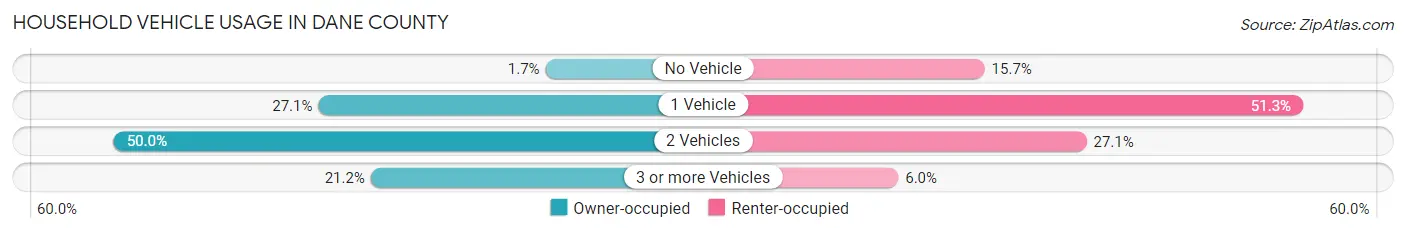
| Vehicles per Household | Owner-occupied | Renter-occupied |
| No Vehicle | 2,314 (1.7%) | 15,861 (15.7%) |
| 1 Vehicle | 37,780 (27.1%) | 52,001 (51.3%) |
| 2 Vehicles | 69,735 (50.0%) | 27,443 (27.1%) |
| 3 or more Vehicles | 29,603 (21.2%) | 6,062 (6.0%) |
| Total | 139,432 (100.0%) | 101,367 (100.0%) |
Real Estate & Mortgages in Dane County
Real Estate and Mortgage Overview in Dane County
| Characteristic | Without Mortgage | With Mortgage |
| Housing Units | 43,800 | 95,632 |
| Median Property Value | $335,600 | $345,900 |
| Median Household Income | $90,472 | $37,467 |
| Monthly Housing Costs | $848 | $15,922 |
| Real Estate Taxes | $6,074 | $720 |
Property Value by Mortgage Status in Dane County
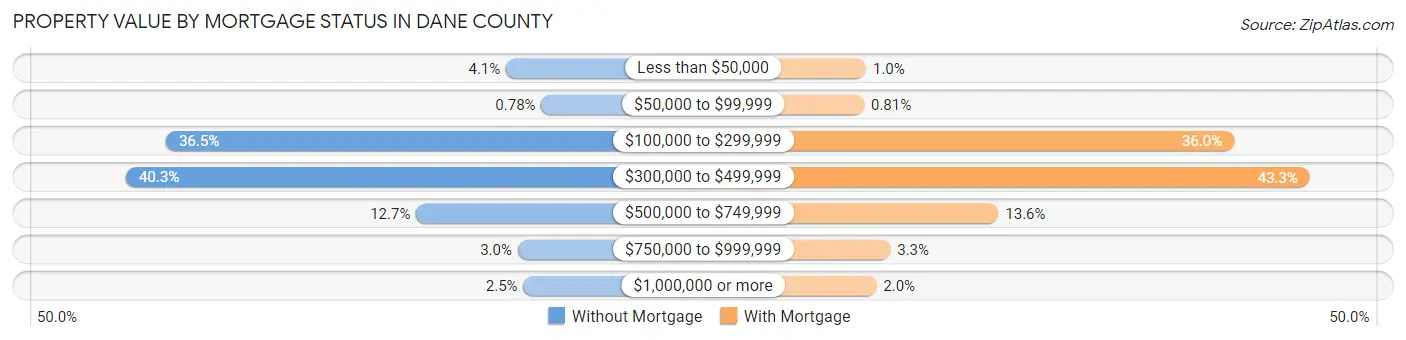
| Property Value | Without Mortgage | With Mortgage |
| Less than $50,000 | 1,813 (4.1%) | 956 (1.0%) |
| $50,000 to $99,999 | 341 (0.8%) | 771 (0.8%) |
| $100,000 to $299,999 | 15,998 (36.5%) | 34,470 (36.0%) |
| $300,000 to $499,999 | 17,667 (40.3%) | 41,369 (43.3%) |
| $500,000 to $749,999 | 5,564 (12.7%) | 13,005 (13.6%) |
| $750,000 to $999,999 | 1,328 (3.0%) | 3,167 (3.3%) |
| $1,000,000 or more | 1,089 (2.5%) | 1,894 (2.0%) |
| Total | 43,800 (100.0%) | 95,632 (100.0%) |
Household Income by Mortgage Status in Dane County
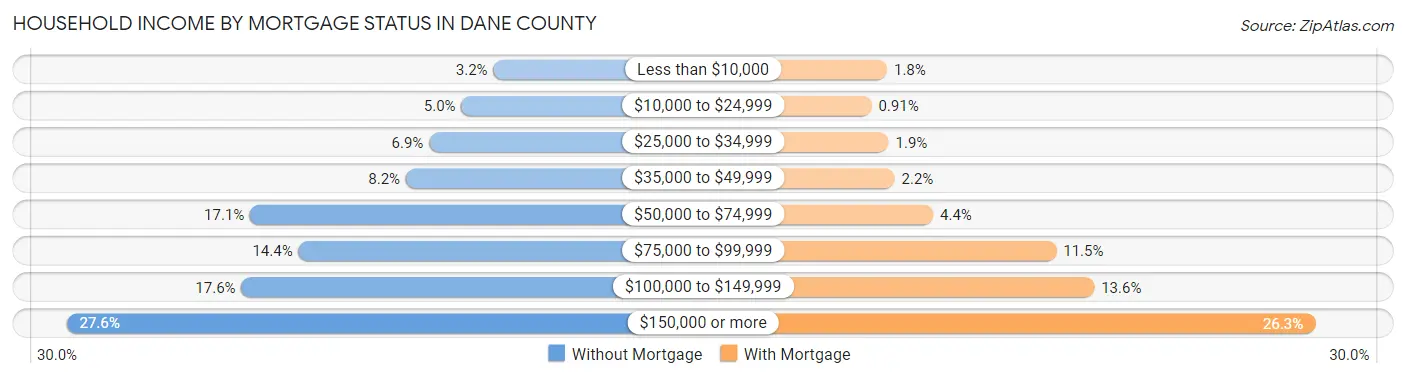
| Household Income | Without Mortgage | With Mortgage |
| Less than $10,000 | 1,407 (3.2%) | 1,723 (1.8%) |
| $10,000 to $24,999 | 2,208 (5.0%) | 873 (0.9%) |
| $25,000 to $34,999 | 3,012 (6.9%) | 1,804 (1.9%) |
| $35,000 to $49,999 | 3,594 (8.2%) | 2,130 (2.2%) |
| $50,000 to $74,999 | 7,493 (17.1%) | 4,237 (4.4%) |
| $75,000 to $99,999 | 6,285 (14.3%) | 10,965 (11.5%) |
| $100,000 to $149,999 | 7,712 (17.6%) | 13,044 (13.6%) |
| $150,000 or more | 12,089 (27.6%) | 25,112 (26.3%) |
| Total | 43,800 (100.0%) | 95,632 (100.0%) |
Property Value to Household Income Ratio in Dane County
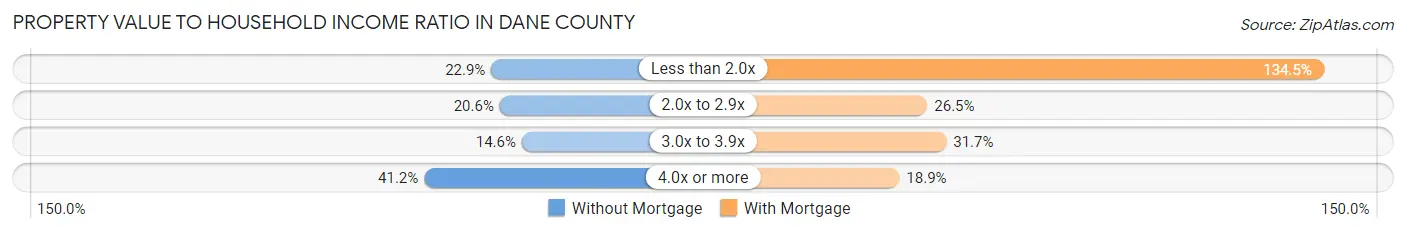
| Value-to-Income Ratio | Without Mortgage | With Mortgage |
| Less than 2.0x | 10,028 (22.9%) | 128,656 (134.5%) |
| 2.0x to 2.9x | 9,007 (20.6%) | 25,382 (26.5%) |
| 3.0x to 3.9x | 6,379 (14.6%) | 30,310 (31.7%) |
| 4.0x or more | 18,033 (41.2%) | 18,101 (18.9%) |
| Total | 43,800 (100.0%) | 95,632 (100.0%) |
Real Estate Taxes by Mortgage Status in Dane County
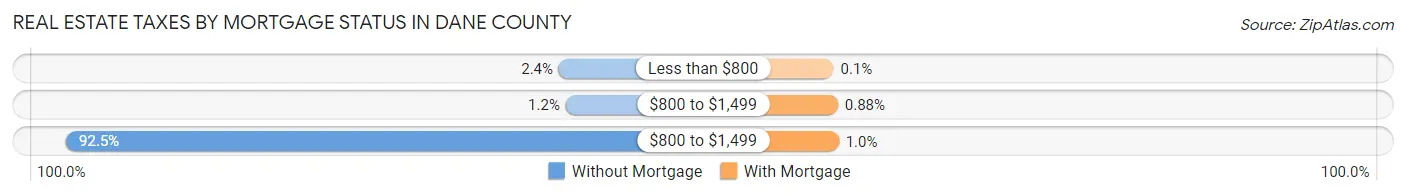
| Property Taxes | Without Mortgage | With Mortgage |
| Less than $800 | 1,061 (2.4%) | 94 (0.1%) |
| $800 to $1,499 | 506 (1.2%) | 844 (0.9%) |
| $800 to $1,499 | 40,495 (92.4%) | 993 (1.0%) |
| Total | 43,800 (100.0%) | 95,632 (100.0%) |
Health & Disability in Dane County
Health Insurance Coverage by Age in Dane County
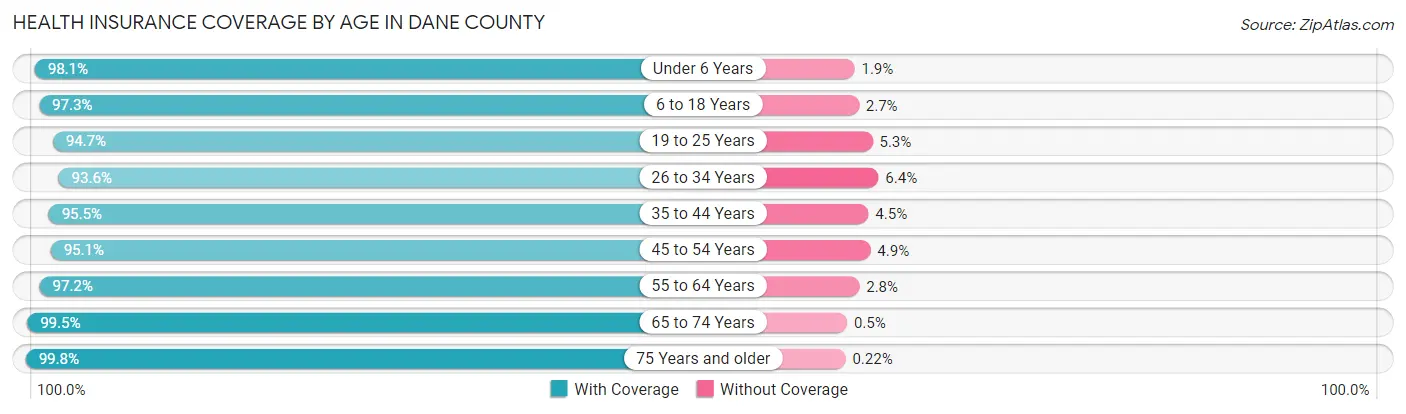
| Age Bracket | With Coverage | Without Coverage |
| Under 6 Years | 34,699 (98.1%) | 677 (1.9%) |
| 6 to 18 Years | 83,478 (97.3%) | 2,331 (2.7%) |
| 19 to 25 Years | 72,131 (94.7%) | 4,007 (5.3%) |
| 26 to 34 Years | 72,113 (93.6%) | 4,897 (6.4%) |
| 35 to 44 Years | 72,388 (95.5%) | 3,409 (4.5%) |
| 45 to 54 Years | 59,914 (95.1%) | 3,067 (4.9%) |
| 55 to 64 Years | 61,354 (97.2%) | 1,767 (2.8%) |
| 65 to 74 Years | 49,005 (99.5%) | 246 (0.5%) |
| 75 Years and older | 30,305 (99.8%) | 67 (0.2%) |
| Total | 535,387 (96.3%) | 20,468 (3.7%) |
Health Insurance Coverage by Citizenship Status in Dane County
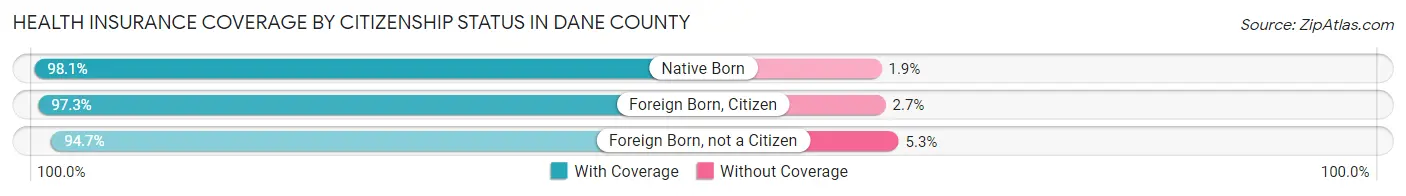
| Citizenship Status | With Coverage | Without Coverage |
| Native Born | 34,699 (98.1%) | 677 (1.9%) |
| Foreign Born, Citizen | 83,478 (97.3%) | 2,331 (2.7%) |
| Foreign Born, not a Citizen | 72,131 (94.7%) | 4,007 (5.3%) |
Health Insurance Coverage by Household Income in Dane County
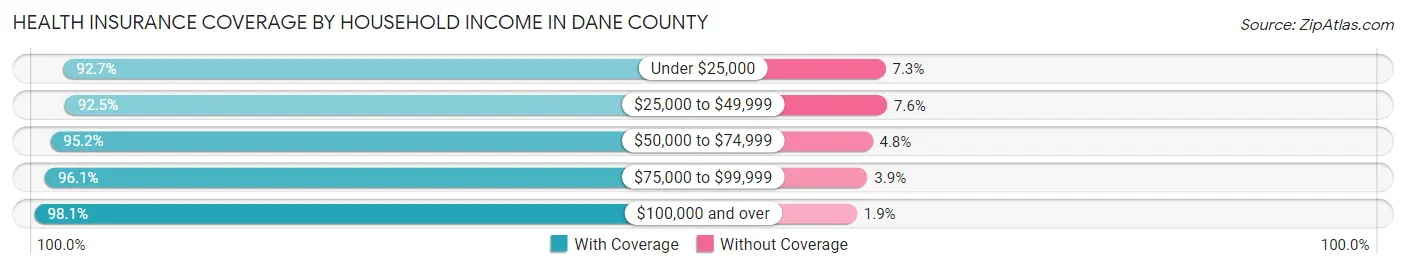
| Household Income | With Coverage | Without Coverage |
| Under $25,000 | 45,110 (92.7%) | 3,533 (7.3%) |
| $25,000 to $49,999 | 60,895 (92.4%) | 4,976 (7.5%) |
| $50,000 to $74,999 | 71,777 (95.2%) | 3,636 (4.8%) |
| $75,000 to $99,999 | 67,595 (96.1%) | 2,713 (3.9%) |
| $100,000 and over | 278,570 (98.1%) | 5,354 (1.9%) |
Public vs Private Health Insurance Coverage by Age in Dane County
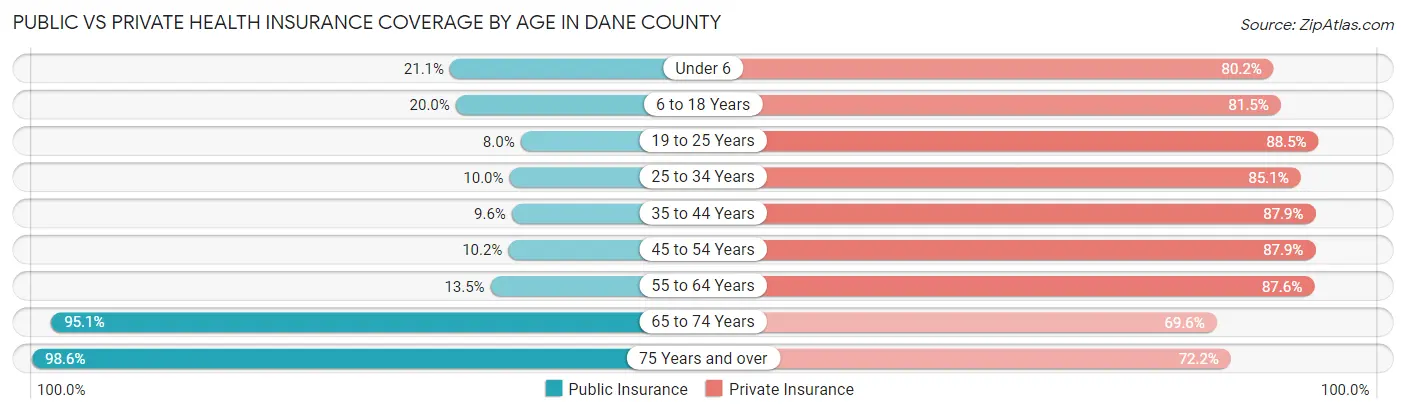
| Age Bracket | Public Insurance | Private Insurance |
| Under 6 | 7,452 (21.1%) | 28,353 (80.1%) |
| 6 to 18 Years | 17,164 (20.0%) | 69,888 (81.5%) |
| 19 to 25 Years | 6,058 (8.0%) | 67,356 (88.5%) |
| 25 to 34 Years | 7,716 (10.0%) | 65,568 (85.1%) |
| 35 to 44 Years | 7,269 (9.6%) | 66,618 (87.9%) |
| 45 to 54 Years | 6,447 (10.2%) | 55,336 (87.9%) |
| 55 to 64 Years | 8,541 (13.5%) | 55,320 (87.6%) |
| 65 to 74 Years | 46,815 (95.1%) | 34,257 (69.6%) |
| 75 Years and over | 29,951 (98.6%) | 21,923 (72.2%) |
| Total | 137,413 (24.7%) | 464,619 (83.6%) |
Disability Status by Sex by Age in Dane County
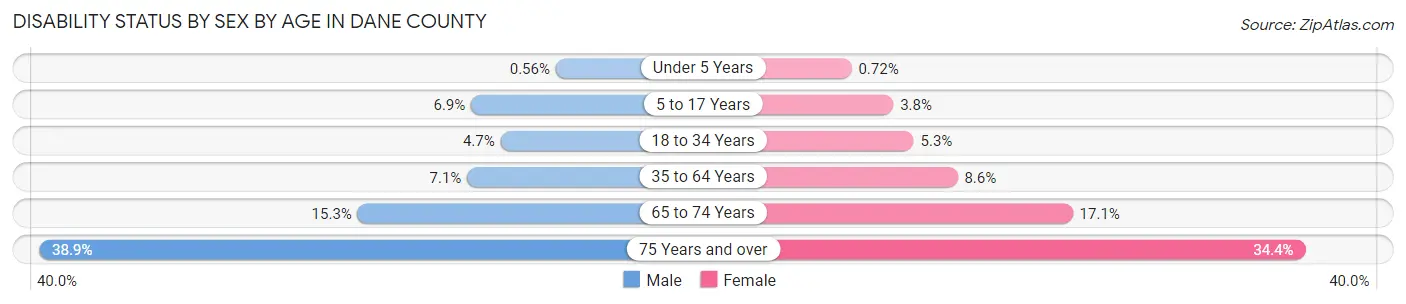
| Age Bracket | Male | Female |
| Under 5 Years | 85 (0.6%) | 103 (0.7%) |
| 5 to 17 Years | 2,900 (6.9%) | 1,524 (3.8%) |
| 18 to 34 Years | 3,878 (4.7%) | 4,239 (5.3%) |
| 35 to 64 Years | 7,226 (7.1%) | 8,652 (8.6%) |
| 65 to 74 Years | 3,575 (15.3%) | 4,429 (17.1%) |
| 75 Years and over | 4,913 (38.9%) | 6,109 (34.4%) |
Disability Class by Sex by Age in Dane County
Disability Class: Hearing Difficulty
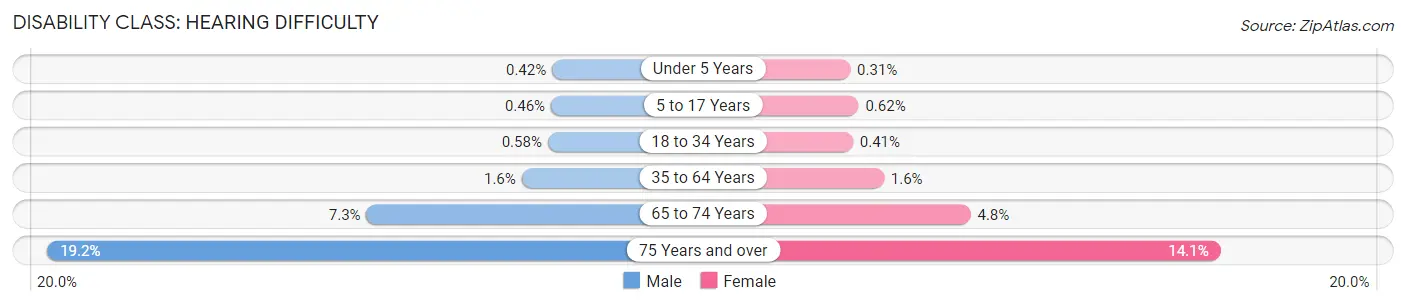
| Age Bracket | Male | Female |
| Under 5 Years | 63 (0.4%) | 44 (0.3%) |
| 5 to 17 Years | 193 (0.5%) | 249 (0.6%) |
| 18 to 34 Years | 486 (0.6%) | 330 (0.4%) |
| 35 to 64 Years | 1,573 (1.5%) | 1,569 (1.6%) |
| 65 to 74 Years | 1,712 (7.3%) | 1,235 (4.8%) |
| 75 Years and over | 2,419 (19.2%) | 2,495 (14.1%) |
Disability Class: Vision Difficulty
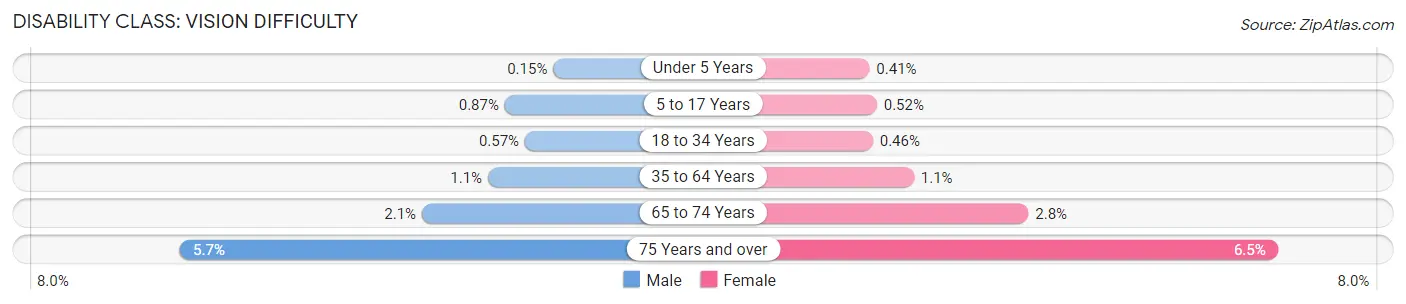
| Age Bracket | Male | Female |
| Under 5 Years | 22 (0.2%) | 59 (0.4%) |
| 5 to 17 Years | 368 (0.9%) | 208 (0.5%) |
| 18 to 34 Years | 474 (0.6%) | 367 (0.5%) |
| 35 to 64 Years | 1,134 (1.1%) | 1,073 (1.1%) |
| 65 to 74 Years | 491 (2.1%) | 715 (2.8%) |
| 75 Years and over | 718 (5.7%) | 1,149 (6.5%) |
Disability Class: Cognitive Difficulty
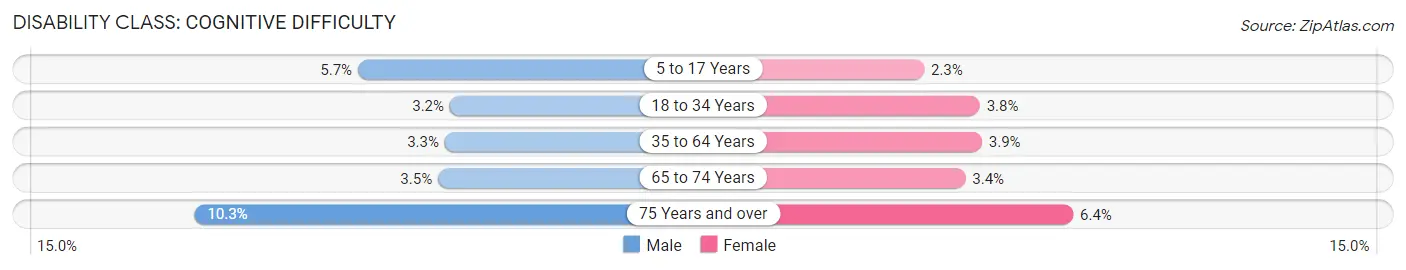
| Age Bracket | Male | Female |
| 5 to 17 Years | 2,420 (5.7%) | 912 (2.3%) |
| 18 to 34 Years | 2,625 (3.2%) | 3,055 (3.8%) |
| 35 to 64 Years | 3,339 (3.3%) | 3,928 (3.9%) |
| 65 to 74 Years | 818 (3.5%) | 890 (3.4%) |
| 75 Years and over | 1,297 (10.3%) | 1,143 (6.4%) |
Disability Class: Ambulatory Difficulty
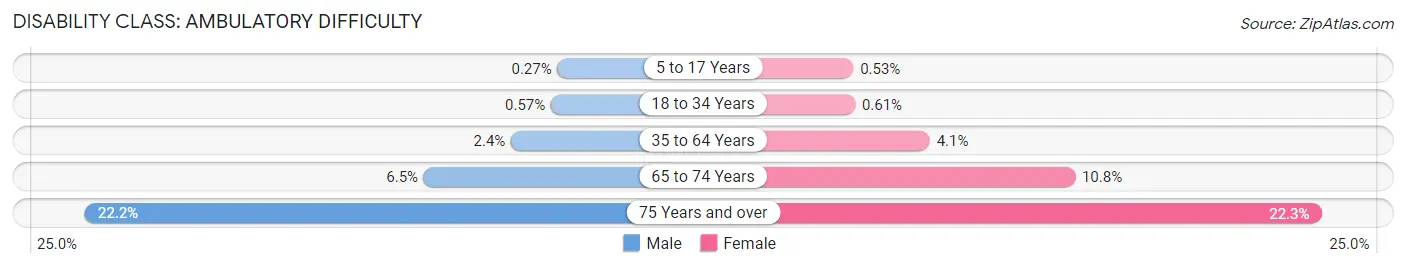
| Age Bracket | Male | Female |
| 5 to 17 Years | 116 (0.3%) | 212 (0.5%) |
| 18 to 34 Years | 477 (0.6%) | 487 (0.6%) |
| 35 to 64 Years | 2,450 (2.4%) | 4,109 (4.1%) |
| 65 to 74 Years | 1,515 (6.5%) | 2,795 (10.8%) |
| 75 Years and over | 2,802 (22.2%) | 3,949 (22.3%) |
Disability Class: Self-Care Difficulty
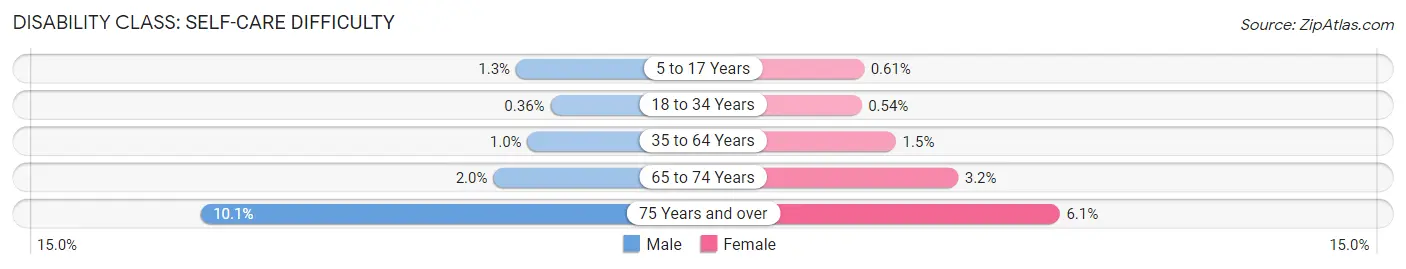
| Age Bracket | Male | Female |
| 5 to 17 Years | 560 (1.3%) | 243 (0.6%) |
| 18 to 34 Years | 301 (0.4%) | 432 (0.5%) |
| 35 to 64 Years | 1,012 (1.0%) | 1,514 (1.5%) |
| 65 to 74 Years | 456 (1.9%) | 834 (3.2%) |
| 75 Years and over | 1,276 (10.1%) | 1,075 (6.1%) |
Technology Access in Dane County
Computing Device Access in Dane County
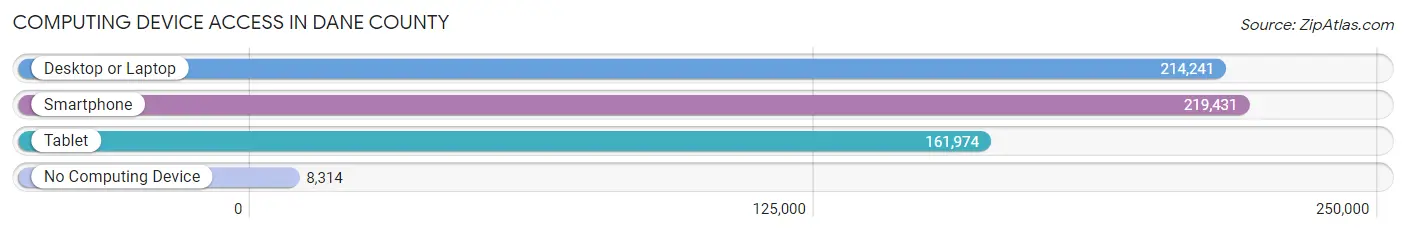
| Device Type | # Households | % Households |
| Desktop or Laptop | 214,241 | 89.0% |
| Smartphone | 219,431 | 91.1% |
| Tablet | 161,974 | 67.3% |
| No Computing Device | 8,314 | 3.5% |
| Total | 240,799 | 100.0% |
Internet Access in Dane County
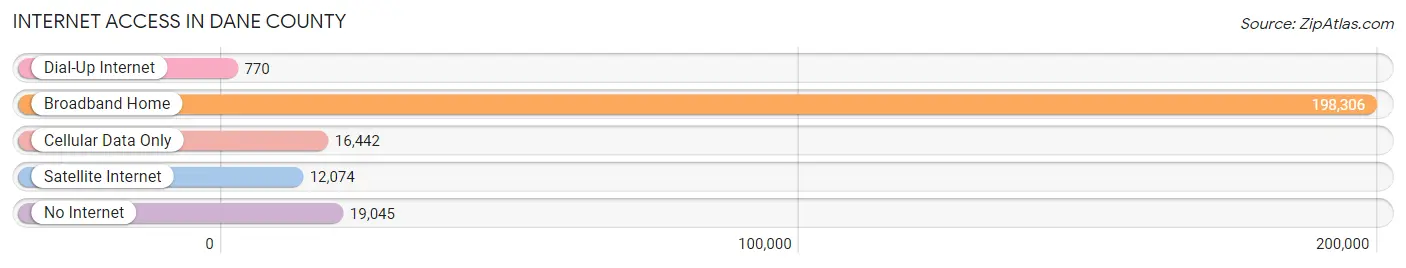
| Internet Type | # Households | % Households |
| Dial-Up Internet | 770 | 0.3% |
| Broadband Home | 198,306 | 82.4% |
| Cellular Data Only | 16,442 | 6.8% |
| Satellite Internet | 12,074 | 5.0% |
| No Internet | 19,045 | 7.9% |
| Total | 240,799 | 100.0% |
Dane County Summary
Dane County, Wisconsin is located in the south-central part of the state and is the second most populous county in the state. It is bordered by Columbia, Dodge, Jefferson, Rock, and Sauk counties. The county seat is Madison, the state capital.
History
Dane County was established in 1836 and named after Nathan Dane, a Massachusetts lawyer and politician who drafted the Northwest Ordinance of 1787. The county was originally part of the Michigan Territory and was part of the Wisconsin Territory when it was created in 1836. The county was organized in 1839 and the first county seat was located in Madison.
Geography
Dane County covers an area of 1,238 square miles and is located in the south-central part of the state. It is bordered by Columbia, Dodge, Jefferson, Rock, and Sauk counties. The county is divided into two distinct regions: the Driftless Area in the west and the Central Plain in the east. The Driftless Area is characterized by rolling hills and valleys, while the Central Plain is flatter and more open. The county is home to several lakes, including Lake Mendota, Lake Monona, and Lake Waubesa.
The county is home to several state parks, including Governor Nelson State Park, Lake Kegonsa State Park, and Devil's Lake State Park. The county is also home to several wildlife areas, including the Lower Wisconsin Riverway, the Horicon Marsh, and the Necedah National Wildlife Refuge.
Economy
Dane County has a diverse economy, with a mix of manufacturing, agriculture, and services. The county is home to several major employers, including the University of Wisconsin-Madison, Epic Systems, American Family Insurance, and the State of Wisconsin.
Agriculture is an important part of the county's economy, with dairy farming being the most important sector. Other important agricultural products include corn, soybeans, hay, and vegetables.
Manufacturing is also an important part of the county's economy, with major employers including Alliant Energy, Trek Bicycle Corporation, and Oscar Mayer.
The county is also home to several technology companies including Google Microsoft and Oracle
Demographics
As of the 2010 census, Dane County had a population of 488,073. The population is racially and ethnically diverse, with the largest racial group being white (83.3%), followed by African American (7.2%), Asian (4.2%), and Hispanic or Latino (3.7%).
The median household income in the county is $63,845, and the median family income is $77,945. The poverty rate is 8.3%, and the unemployment rate is 3.2%.
Conclusion
Dane County, Wisconsin is a diverse and vibrant county located in the south-central part of the state. It is home to several major employers, including the University of Wisconsin-Madison, Epic Systems, American Family Insurance, and the State of Wisconsin. The county has a diverse economy, with a mix of manufacturing, agriculture, and services. The population is racially and ethnically diverse, with the largest racial group being white. The median household income in the county is $63,845, and the poverty rate is 8.3%.
Common Questions
What is the Total Population of Dane County?
Total Population of Dane County is 559,891.
What is the Total Male Population of Dane County?
Total Male Population of Dane County is 280,540.
What is the Total Female Population of Dane County?
Total Female Population of Dane County is 279,351.
What is the Ratio of Males per 100 Females in Dane County?
There are 100.43 Males per 100 Females in Dane County.
What is the Ratio of Females per 100 Males in Dane County?
There are 99.58 Females per 100 Males in Dane County.
What is the Median Population Age in Dane County?
Median Population Age in Dane County is 35.5 Years.
What is the Average Family Size in Dane County
Average Family Size in Dane County is 2.9 People.
What is the Average Household Size in Dane County
Average Household Size in Dane County is 2.3 People.
What is Per Capita Income in Dane County?
Per Capita income in Dane County is $49,280.
What is the Median Family Income in Dane County?
Median Family Income in Dane County is $117,289.
What is the Median Household income in Dane County?
Median Household Income in Dane County is $84,297.
What is Income or Wage Gap in Dane County?
Income or Wage Gap in Dane County is 24.3%.
Women in Dane County earn 75.7 cents for every dollar earned by a man.
What is Family Income Deficit in Dane County?
Family Income Deficit in Dane County is $10,275.
Families that are below poverty line in Dane County earn $10,275 less on average than the poverty threshold level.
What is Inequality or Gini Index in Dane County?
Inequality or Gini Index in Dane County is 0.45.
How Large is the Labor Force in Dane County?
There are 325,878 People in the Labor Forcein in Dane County.
What is the Percentage of People in the Labor Force in Dane County?
70.7% of People are in the Labor Force in Dane County.
What is the Unemployment Rate in Dane County?
Unemployment Rate in Dane County is 2.3%.