Crawford County, WI
Crawford County Map
Crawford County Overview
16,123
TOTAL POPULATION
8,405
MALE POPULATION
7,718
FEMALE POPULATION
108.90
MALES / 100 FEMALES
91.83
FEMALES / 100 MALES
47.2
MEDIAN AGE
2.9
AVG FAMILY SIZE
2.4
AVG HOUSEHOLD SIZE
$32,129
PER CAPITA INCOME
$74,733
AVG FAMILY INCOME
$60,823
AVG HOUSEHOLD INCOME
15.4%
WAGE / INCOME GAP [ % ]
84.6¢/ $1
WAGE / INCOME GAP [ $ ]
$10,247
FAMILY INCOME DEFICIT
0.42
INEQUALITY / GINI INDEX
7,305
LABOR FORCE [ PEOPLE ]
54.6%
PERCENT IN LABOR FORCE
2.8%
UNEMPLOYMENT RATE
Crawford County Area Codes
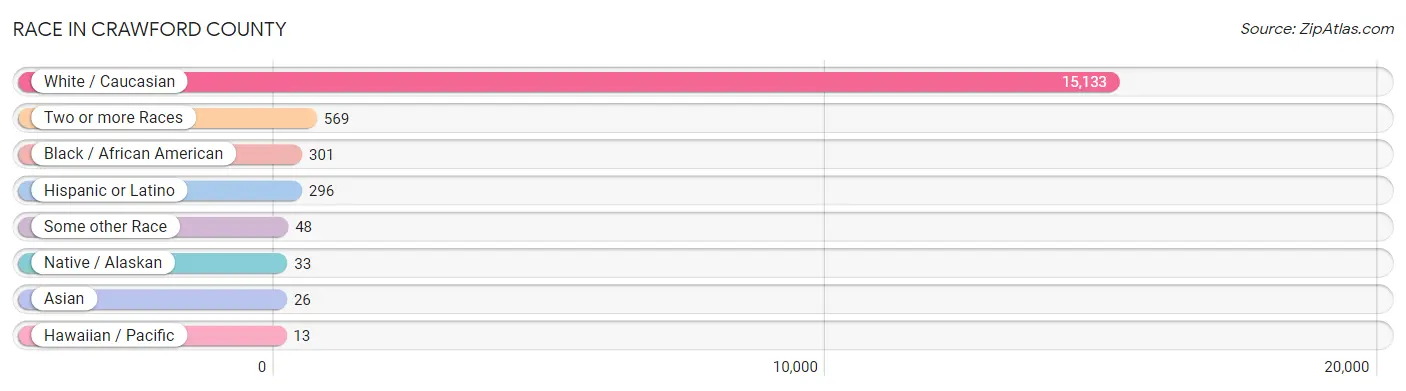
Race in Crawford County
The most populous races in Crawford County are White / Caucasian (15,133 | 93.9%), Two or more Races (569 | 3.5%), and Black / African American (301 | 1.9%).
| Race | # Population | % Population |
| Asian | 26 | 0.2% |
| Black / African American | 301 | 1.9% |
| Hawaiian / Pacific | 13 | 0.1% |
| Hispanic or Latino | 296 | 1.8% |
| Native / Alaskan | 33 | 0.2% |
| White / Caucasian | 15,133 | 93.9% |
| Two or more Races | 569 | 3.5% |
| Some other Race | 48 | 0.3% |
| Total | 16,123 | 100.0% |
Ancestry in Crawford County
The most populous ancestries reported in Crawford County are German (5,453 | 33.8%), Irish (2,537 | 15.7%), Norwegian (1,934 | 12.0%), English (1,241 | 7.7%), and Czech (640 | 4.0%), together accounting for 73.2% of all Crawford County residents.

| Ancestry | # Population | % Population |
| African | 54 | 0.3% |
| Alaska Native | 15 | 0.1% |
| Alaskan Athabascan | 2 | 0.0% |
| Albanian | 10 | 0.1% |
| American | 469 | 2.9% |
| Arab | 9 | 0.1% |
| Austrian | 50 | 0.3% |
| Belgian | 23 | 0.1% |
| Bhutanese | 12 | 0.1% |
| Blackfeet | 14 | 0.1% |
| British | 36 | 0.2% |
| Burmese | 19 | 0.1% |
| Canadian | 81 | 0.5% |
| Celtic | 6 | 0.0% |
| Central American | 30 | 0.2% |
| Cherokee | 33 | 0.2% |
| Chippewa | 72 | 0.4% |
| Choctaw | 2 | 0.0% |
| Cree | 8 | 0.1% |
| Croatian | 1 | 0.0% |
| Cuban | 71 | 0.4% |
| Czech | 640 | 4.0% |
| Czechoslovakian | 24 | 0.2% |
| Danish | 45 | 0.3% |
| Dominican | 5 | 0.0% |
| Dutch | 190 | 1.2% |
| Eastern European | 15 | 0.1% |
| Egyptian | 5 | 0.0% |
| English | 1,241 | 7.7% |
| European | 182 | 1.1% |
| Finnish | 9 | 0.1% |
| French | 568 | 3.5% |
| French American Indian | 11 | 0.1% |
| French Canadian | 175 | 1.1% |
| German | 5,453 | 33.8% |
| Greek | 20 | 0.1% |
| Guamanian / Chamorro | 1 | 0.0% |
| Haitian | 32 | 0.2% |
| Hungarian | 102 | 0.6% |
| Indian (Asian) | 17 | 0.1% |
| Inupiat | 3 | 0.0% |
| Irish | 2,537 | 15.7% |
| Italian | 325 | 2.0% |
| Korean | 22 | 0.1% |
| Lebanese | 4 | 0.0% |
| Lithuanian | 6 | 0.0% |
| Menominee | 7 | 0.0% |
| Mexican | 106 | 0.7% |
| Mexican American Indian | 4 | 0.0% |
| Native Hawaiian | 3 | 0.0% |
| Navajo | 53 | 0.3% |
| Nicaraguan | 10 | 0.1% |
| Nigerian | 19 | 0.1% |
| Northern European | 66 | 0.4% |
| Norwegian | 1,934 | 12.0% |
| Panamanian | 17 | 0.1% |
| Pennsylvania German | 122 | 0.8% |
| Polish | 535 | 3.3% |
| Portuguese | 2 | 0.0% |
| Potawatomi | 1 | 0.0% |
| Puerto Rican | 65 | 0.4% |
| Romanian | 3 | 0.0% |
| Russian | 31 | 0.2% |
| Salvadoran | 3 | 0.0% |
| Scandinavian | 85 | 0.5% |
| Scotch-Irish | 90 | 0.6% |
| Scottish | 140 | 0.9% |
| Shoshone | 1 | 0.0% |
| Sioux | 10 | 0.1% |
| Slavic | 6 | 0.0% |
| Slovak | 4 | 0.0% |
| Slovene | 2 | 0.0% |
| Spanish | 5 | 0.0% |
| Sri Lankan | 6 | 0.0% |
| Subsaharan African | 73 | 0.4% |
| Swedish | 341 | 2.1% |
| Swiss | 230 | 1.4% |
| Thai | 1 | 0.0% |
| Tlingit-Haida | 1 | 0.0% |
| Ukrainian | 37 | 0.2% |
| Welsh | 40 | 0.3% |
| Yugoslavian | 28 | 0.2% | View All 82 Rows |
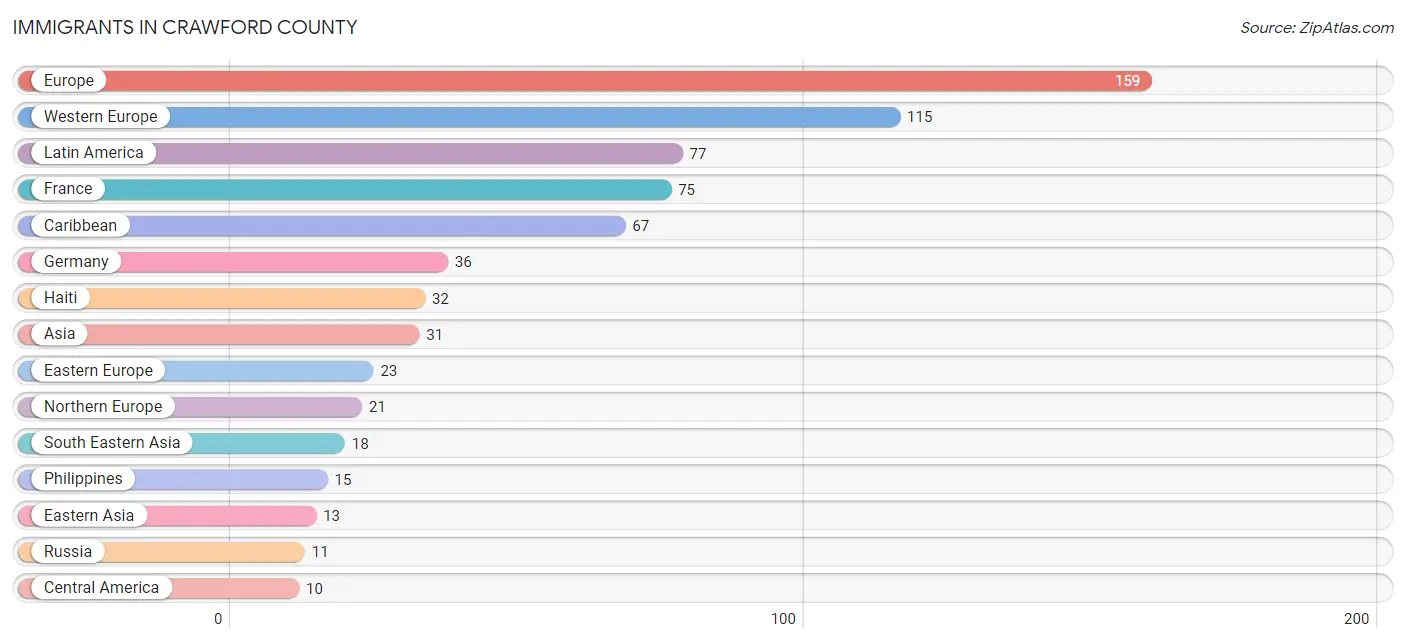
Immigrants in Crawford County
The most numerous immigrant groups reported in Crawford County came from Europe (159 | 1.0%), Western Europe (115 | 0.7%), Latin America (77 | 0.5%), France (75 | 0.5%), and Caribbean (67 | 0.4%), together accounting for 3.1% of all Crawford County residents.
| Immigration Origin | # Population | % Population |
| Africa | 9 | 0.1% |
| Asia | 31 | 0.2% |
| Canada | 6 | 0.0% |
| Caribbean | 67 | 0.4% |
| Central America | 10 | 0.1% |
| Denmark | 2 | 0.0% |
| Dominican Republic | 3 | 0.0% |
| Eastern Africa | 9 | 0.1% |
| Eastern Asia | 13 | 0.1% |
| Eastern Europe | 23 | 0.1% |
| El Salvador | 3 | 0.0% |
| England | 1 | 0.0% |
| Eritrea | 2 | 0.0% |
| Europe | 159 | 1.0% |
| France | 75 | 0.5% |
| Germany | 36 | 0.2% |
| Haiti | 32 | 0.2% |
| Ireland | 2 | 0.0% |
| Japan | 4 | 0.0% |
| Korea | 9 | 0.1% |
| Latin America | 77 | 0.5% |
| Mexico | 7 | 0.0% |
| Netherlands | 4 | 0.0% |
| North Macedonia | 10 | 0.1% |
| Northern Europe | 21 | 0.1% |
| Norway | 2 | 0.0% |
| Philippines | 15 | 0.1% |
| Romania | 2 | 0.0% |
| Russia | 11 | 0.1% |
| Somalia | 7 | 0.0% |
| South Eastern Asia | 18 | 0.1% |
| Vietnam | 3 | 0.0% |
| Western Europe | 115 | 0.7% | View All 33 Rows |
Sex and Age in Crawford County
Sex and Age in Crawford County
The most populous age groups in Crawford County are 60 to 64 Years (662 | 7.9%) for men and 55 to 59 Years (728 | 9.4%) for women.

| Age Bracket | Male | Female |
| Under 5 Years | 415 (4.9%) | 380 (4.9%) |
| 5 to 9 Years | 462 (5.5%) | 365 (4.7%) |
| 10 to 14 Years | 447 (5.3%) | 466 (6.0%) |
| 15 to 19 Years | 530 (6.3%) | 440 (5.7%) |
| 20 to 24 Years | 492 (5.9%) | 344 (4.5%) |
| 25 to 29 Years | 493 (5.9%) | 381 (4.9%) |
| 30 to 34 Years | 421 (5.0%) | 361 (4.7%) |
| 35 to 39 Years | 483 (5.8%) | 445 (5.8%) |
| 40 to 44 Years | 433 (5.1%) | 397 (5.1%) |
| 45 to 49 Years | 469 (5.6%) | 399 (5.2%) |
| 50 to 54 Years | 553 (6.6%) | 466 (6.0%) |
| 55 to 59 Years | 627 (7.5%) | 728 (9.4%) |
| 60 to 64 Years | 662 (7.9%) | 565 (7.3%) |
| 65 to 69 Years | 635 (7.6%) | 633 (8.2%) |
| 70 to 74 Years | 526 (6.3%) | 468 (6.1%) |
| 75 to 79 Years | 373 (4.4%) | 387 (5.0%) |
| 80 to 84 Years | 239 (2.8%) | 192 (2.5%) |
| 85 Years and over | 145 (1.7%) | 301 (3.9%) |
| Total | 8,405 (100.0%) | 7,718 (100.0%) |
Families and Households in Crawford County
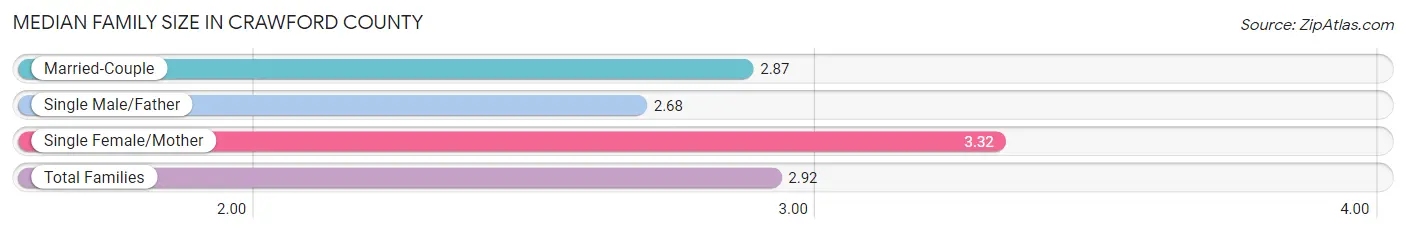
Median Family Size in Crawford County
The median family size in Crawford County is 2.92 persons per family, with single female/mother families (517 | 12.6%) accounting for the largest median family size of 3.32 persons per family. On the other hand, single male/father families (320 | 7.8%) represent the smallest median family size with 2.68 persons per family.
| Family Type | # Families | Family Size |
| Married-Couple | 3,272 (79.6%) | 2.87 |
| Single Male/Father | 320 (7.8%) | 2.68 |
| Single Female/Mother | 517 (12.6%) | 3.32 |
| Total Families | 4,109 (100.0%) | 2.92 |
Median Household Size in Crawford County
The median household size in Crawford County is 2.35 persons per household, with single female/mother households (517 | 7.9%) accounting for the largest median household size of 3.64 persons per household. non-family households (2,435 | 37.2%) represent the smallest median household size with 1.21 persons per household.
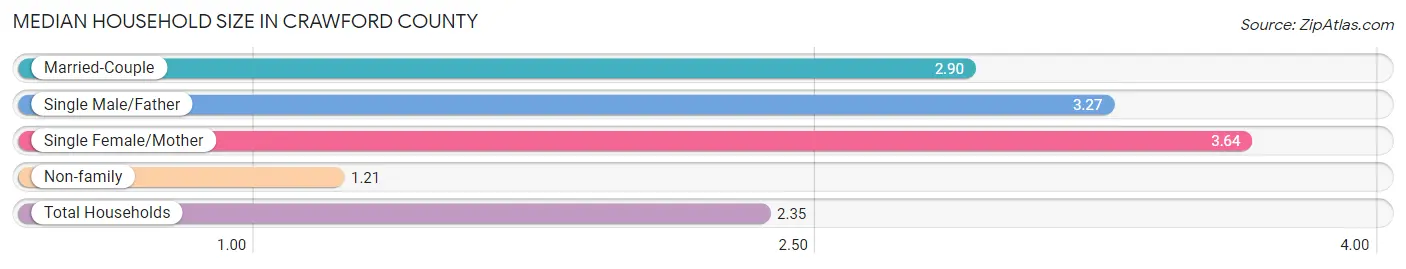
| Household Type | # Households | Household Size |
| Married-Couple | 3,272 (50.0%) | 2.90 |
| Single Male/Father | 320 (4.9%) | 3.27 |
| Single Female/Mother | 517 (7.9%) | 3.64 |
| Non-family | 2,435 (37.2%) | 1.21 |
| Total Households | 6,544 (100.0%) | 2.35 |
Household Size by Marriage Status in Crawford County
Out of a total of 6,544 households in Crawford County, 4,109 (62.8%) are family households, while 2,435 (37.2%) are nonfamily households. The most numerous type of family households are 2-person households, comprising 2,492, and the most common type of nonfamily households are 1-person households, comprising 2,053.

| Household Size | Family Households | Nonfamily Households |
| 1-Person Households | - | 2,053 (31.4%) |
| 2-Person Households | 2,492 (38.1%) | 334 (5.1%) |
| 3-Person Households | 599 (9.1%) | 6 (0.1%) |
| 4-Person Households | 484 (7.4%) | 10 (0.2%) |
| 5-Person Households | 302 (4.6%) | 32 (0.5%) |
| 6-Person Households | 158 (2.4%) | 0 (0.0%) |
| 7+ Person Households | 74 (1.1%) | 0 (0.0%) |
| Total | 4,109 (62.8%) | 2,435 (37.2%) |
Female Fertility in Crawford County
Fertility by Age in Crawford County
Average fertility rate in Crawford County is 51.0 births per 1,000 women. Women in the age bracket of 20 to 34 years have the highest fertility rate with 99.0 births per 1,000 women. Women in the age bracket of 20 to 34 years acount for 74.5% of all women with births.
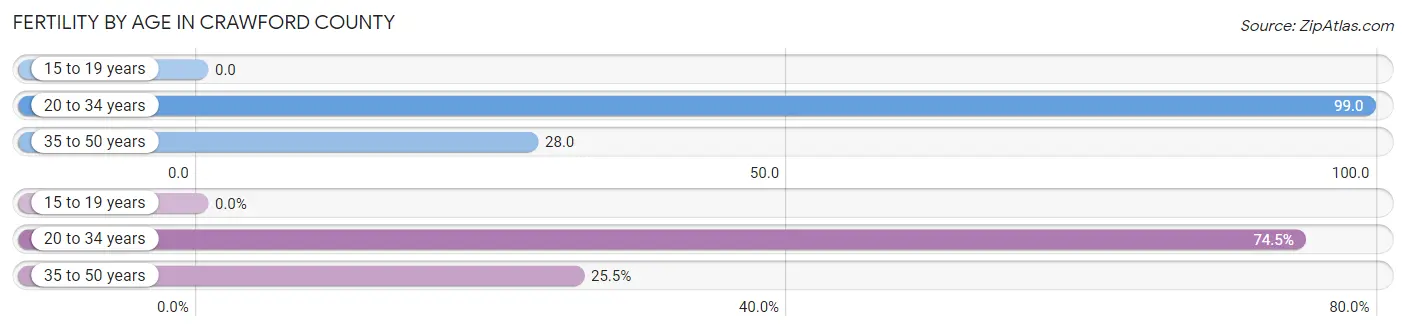
| Age Bracket | Women with Births | Births / 1,000 Women |
| 15 to 19 years | 0 (0.0%) | 0.0 |
| 20 to 34 years | 108 (74.5%) | 99.0 |
| 35 to 50 years | 37 (25.5%) | 28.0 |
| Total | 145 (100.0%) | 51.0 |
Fertility by Age by Marriage Status in Crawford County
61.4% of women with births (145) in Crawford County are married. The highest percentage of unmarried women with births falls into 20 to 34 years age bracket with 43.5% of them unmarried at the time of birth, while the lowest percentage of unmarried women with births belong to 35 to 50 years age bracket with 24.3% of them unmarried.

| Age Bracket | Married | Unmarried |
| 15 to 19 years | 0 (0.0%) | 0 (0.0%) |
| 20 to 34 years | 61 (56.5%) | 47 (43.5%) |
| 35 to 50 years | 28 (75.7%) | 9 (24.3%) |
| Total | 89 (61.4%) | 56 (38.6%) |
Fertility by Education in Crawford County
Average fertility rate in Crawford County is 51.0 births per 1,000 women. Women with the education attainment of college or associate's degree have the highest fertility rate of 65.0 births per 1,000 women, while women with the education attainment of bachelor's degree have the lowest fertility at 22.0 births per 1,000 women. Women with the education attainment of college or associate's degree represent 44.8% of all women with births.
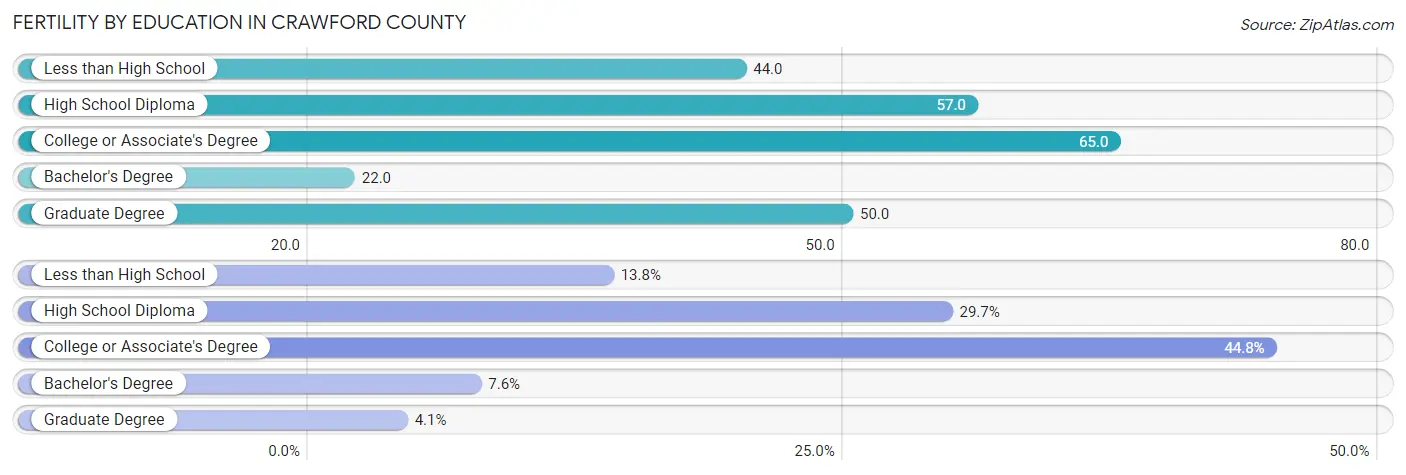
| Educational Attainment | Women with Births | Births / 1,000 Women |
| Less than High School | 20 (13.8%) | 44.0 |
| High School Diploma | 43 (29.7%) | 57.0 |
| College or Associate's Degree | 65 (44.8%) | 65.0 |
| Bachelor's Degree | 11 (7.6%) | 22.0 |
| Graduate Degree | 6 (4.1%) | 50.0 |
| Total | 145 (100.0%) | 51.0 |
Fertility by Education by Marriage Status in Crawford County
38.6% of women with births in Crawford County are unmarried. Women with the educational attainment of graduate degree are most likely to be married with 100.0% of them married at childbirth, while women with the educational attainment of college or associate's degree are least likely to be married with 55.4% of them unmarried at childbirth.

| Educational Attainment | Married | Unmarried |
| Less than High School | 17 (85.0%) | 3 (15.0%) |
| High School Diploma | 29 (67.4%) | 14 (32.6%) |
| College or Associate's Degree | 29 (44.6%) | 36 (55.4%) |
| Bachelor's Degree | 8 (72.7%) | 3 (27.3%) |
| Graduate Degree | 6 (100.0%) | 0 (0.0%) |
| Total | 89 (61.4%) | 56 (38.6%) |
Income in Crawford County
Income Overview in Crawford County
Per Capita Income in Crawford County is $32,129, while median incomes of families and households are $74,733 and $60,823 respectively.
| Characteristic | Number | Measure |
| Per Capita Income | 16,123 | $32,129 |
| Median Family Income | 4,109 | $74,733 |
| Mean Family Income | 4,109 | $88,049 |
| Median Household Income | 6,544 | $60,823 |
| Mean Household Income | 6,544 | $75,690 |
| Income Deficit | 4,109 | $10,247 |
| Wage / Income Gap (%) | 16,123 | 15.37% |
| Wage / Income Gap ($) | 16,123 | 84.63¢ per $1 |
| Gini / Inequality Index | 16,123 | 0.42 |
Earnings by Sex in Crawford County
Average Earnings in Crawford County are $37,882, $40,733 for men and $34,473 for women, a difference of 15.4%.
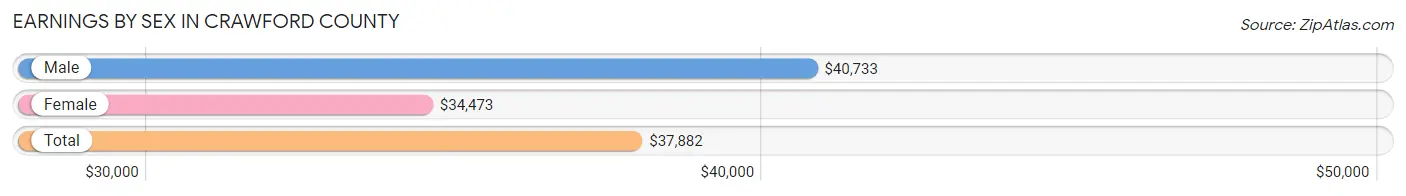
| Sex | Number | Average Earnings |
| Male | 4,416 (54.0%) | $40,733 |
| Female | 3,759 (46.0%) | $34,473 |
| Total | 8,175 (100.0%) | $37,882 |
Earnings by Sex by Income Bracket in Crawford County
The most common earnings brackets in Crawford County are $55,000 to $64,999 for men (481 | 10.9%) and $55,000 to $64,999 for women (429 | 11.4%).

| Income | Male | Female |
| $2,499 or less | 222 (5.0%) | 228 (6.1%) |
| $2,500 to $4,999 | 123 (2.8%) | 112 (3.0%) |
| $5,000 to $7,499 | 140 (3.2%) | 130 (3.5%) |
| $7,500 to $9,999 | 78 (1.8%) | 103 (2.7%) |
| $10,000 to $12,499 | 132 (3.0%) | 132 (3.5%) |
| $12,500 to $14,999 | 94 (2.1%) | 144 (3.8%) |
| $15,000 to $17,499 | 148 (3.4%) | 105 (2.8%) |
| $17,500 to $19,999 | 158 (3.6%) | 177 (4.7%) |
| $20,000 to $22,499 | 61 (1.4%) | 79 (2.1%) |
| $22,500 to $24,999 | 178 (4.0%) | 144 (3.8%) |
| $25,000 to $29,999 | 236 (5.3%) | 258 (6.9%) |
| $30,000 to $34,999 | 314 (7.1%) | 301 (8.0%) |
| $35,000 to $39,999 | 285 (6.5%) | 269 (7.2%) |
| $40,000 to $44,999 | 242 (5.5%) | 399 (10.6%) |
| $45,000 to $49,999 | 249 (5.6%) | 190 (5.1%) |
| $50,000 to $54,999 | 282 (6.4%) | 150 (4.0%) |
| $55,000 to $64,999 | 481 (10.9%) | 429 (11.4%) |
| $65,000 to $74,999 | 268 (6.1%) | 165 (4.4%) |
| $75,000 to $99,999 | 366 (8.3%) | 116 (3.1%) |
| $100,000+ | 359 (8.1%) | 128 (3.4%) |
| Total | 4,416 (100.0%) | 3,759 (100.0%) |
Earnings by Sex by Educational Attainment in Crawford County
Average earnings in Crawford County are $45,680 for men and $37,130 for women, a difference of 18.7%. Men with an educational attainment of graduate degree enjoy the highest average annual earnings of $61,429, while those with less than high school education earn the least with $29,141. Women with an educational attainment of graduate degree earn the most with the average annual earnings of $60,139, while those with high school diploma education have the smallest earnings of $32,904.
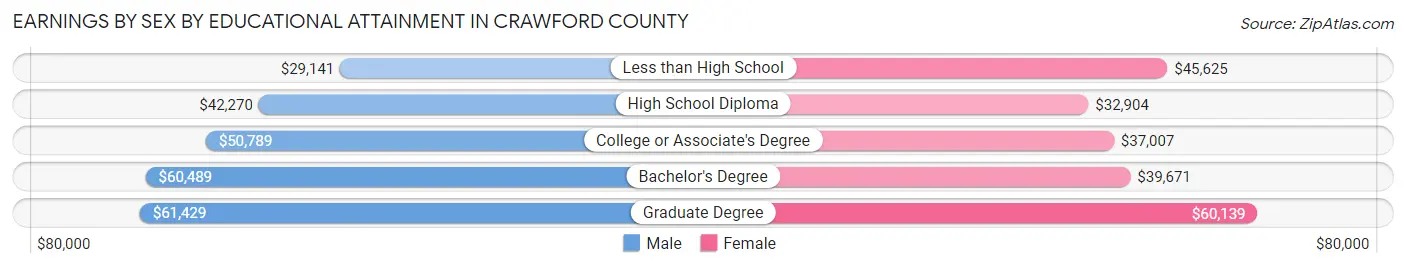
| Educational Attainment | Male Income | Female Income |
| Less than High School | $29,141 | $45,625 |
| High School Diploma | $42,270 | $32,904 |
| College or Associate's Degree | $50,789 | $37,007 |
| Bachelor's Degree | $60,489 | $39,671 |
| Graduate Degree | $61,429 | $60,139 |
| Total | $45,680 | $37,130 |
Family Income in Crawford County
Family Income Brackets in Crawford County
According to the Crawford County family income data, there are 809 families falling into the $75,000 to $99,999 income range, which is the most common income bracket and makes up 19.7% of all families. Conversely, the less than $10,000 income bracket is the least frequent group with only 70 families (1.7%) belonging to this category.
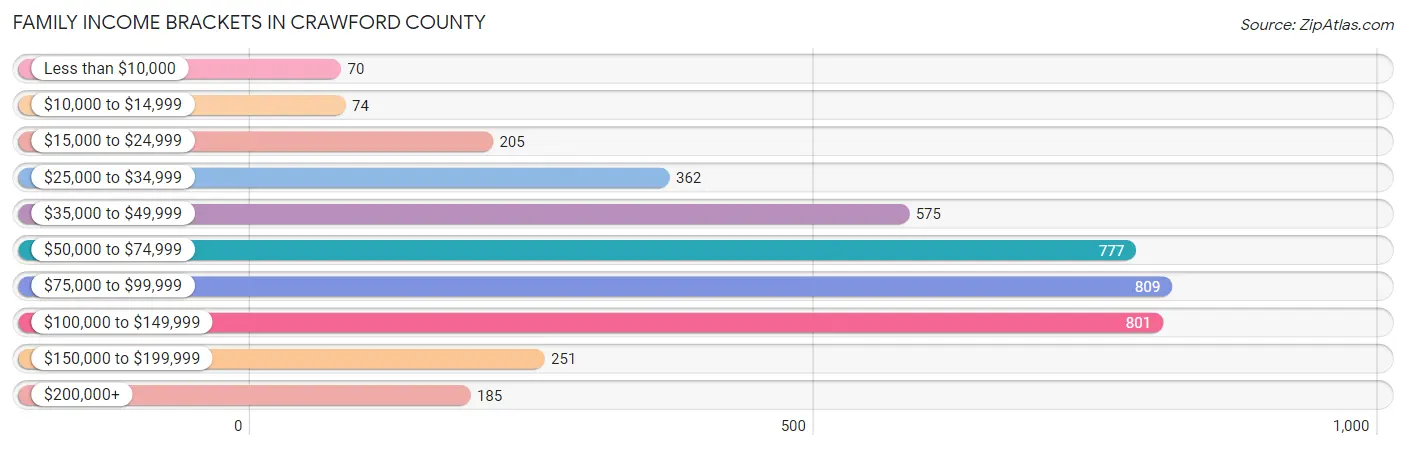
| Income Bracket | # Families | % Families |
| Less than $10,000 | 70 | 1.7% |
| $10,000 to $14,999 | 74 | 1.8% |
| $15,000 to $24,999 | 205 | 5.0% |
| $25,000 to $34,999 | 362 | 8.8% |
| $35,000 to $49,999 | 575 | 14.0% |
| $50,000 to $74,999 | 777 | 18.9% |
| $75,000 to $99,999 | 809 | 19.7% |
| $100,000 to $149,999 | 801 | 19.5% |
| $150,000 to $199,999 | 251 | 6.1% |
| $200,000+ | 185 | 4.5% |
Family Income by Famaliy Size in Crawford County
6-person families (137 | 3.3%) account for the highest median family income in Crawford County with $109,821 per family, while 2-person families (2,622 | 63.8%) have the highest median income of $34,028 per family member.

| Income Bracket | # Families | Median Income |
| 2-Person Families | 2,622 (63.8%) | $68,056 |
| 3-Person Families | 585 (14.2%) | $85,871 |
| 4-Person Families | 469 (11.4%) | $90,703 |
| 5-Person Families | 232 (5.7%) | $94,167 |
| 6-Person Families | 137 (3.3%) | $109,821 |
| 7+ Person Families | 64 (1.6%) | $82,500 |
| Total | 4,109 (100.0%) | $74,733 |
Family Income by Number of Earners in Crawford County
The median family income in Crawford County is $74,733, with families comprising 3+ earners (346) having the highest median family income of $118,333, while families with no earners (916) have the lowest median family income of $47,273, accounting for 8.4% and 22.3% of families, respectively.
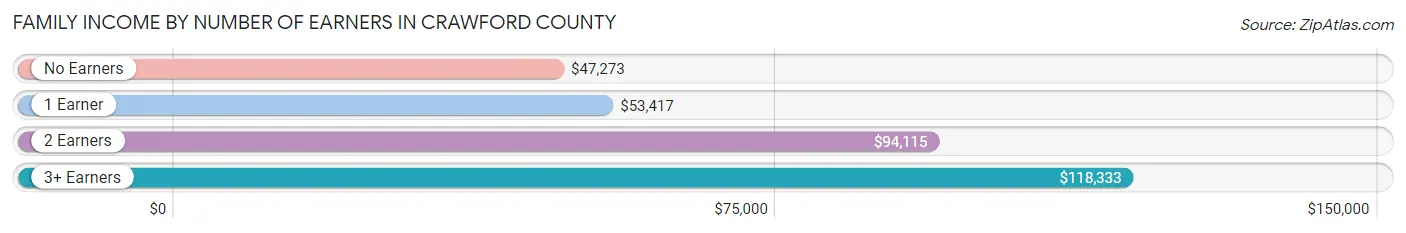
| Number of Earners | # Families | Median Income |
| No Earners | 916 (22.3%) | $47,273 |
| 1 Earner | 1,353 (32.9%) | $53,417 |
| 2 Earners | 1,494 (36.4%) | $94,115 |
| 3+ Earners | 346 (8.4%) | $118,333 |
| Total | 4,109 (100.0%) | $74,733 |
Household Income in Crawford County
Household Income Brackets in Crawford County
With 1,237 households falling in the category, the $50,000 to $74,999 income range is the most frequent in Crawford County, accounting for 18.9% of all households. In contrast, only 236 households (3.6%) fall into the $10,000 to $14,999 income bracket, making it the least populous group.
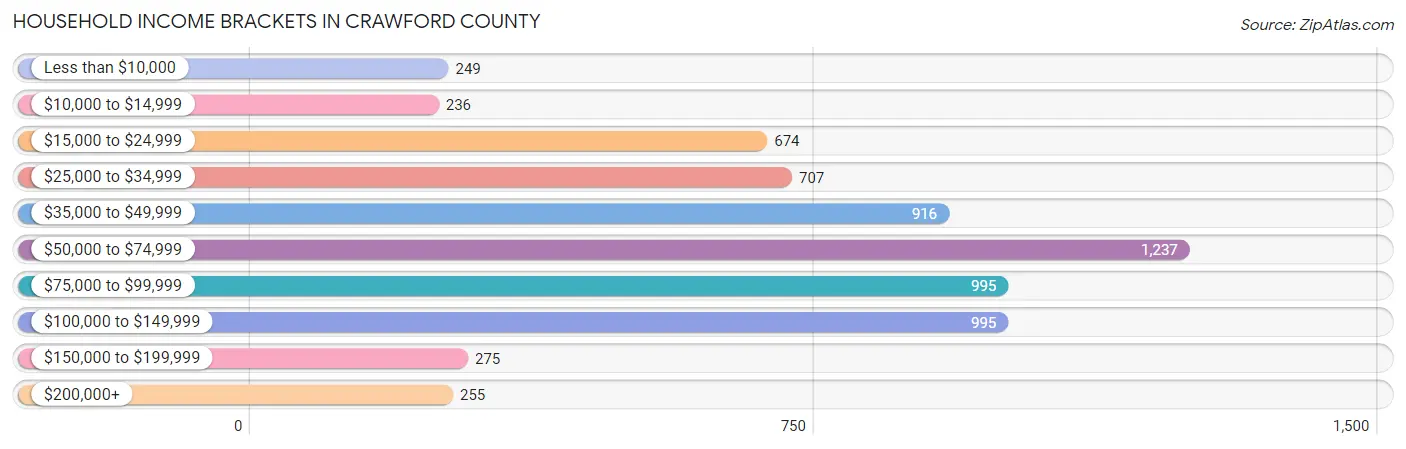
| Income Bracket | # Households | % Households |
| Less than $10,000 | 249 | 3.8% |
| $10,000 to $14,999 | 236 | 3.6% |
| $15,000 to $24,999 | 674 | 10.3% |
| $25,000 to $34,999 | 707 | 10.8% |
| $35,000 to $49,999 | 916 | 14.0% |
| $50,000 to $74,999 | 1,237 | 18.9% |
| $75,000 to $99,999 | 995 | 15.2% |
| $100,000 to $149,999 | 995 | 15.2% |
| $150,000 to $199,999 | 275 | 4.2% |
| $200,000+ | 255 | 3.9% |
Household Income by Householder Age in Crawford County
The median household income in Crawford County is $60,823, with the highest median household income of $73,700 found in the 25 to 44 years age bracket for the primary householder. A total of 1,552 households (23.7%) fall into this category. Meanwhile, the 65+ years age bracket for the primary householder has the lowest median household income of $44,716, with 2,465 households (37.7%) in this group.
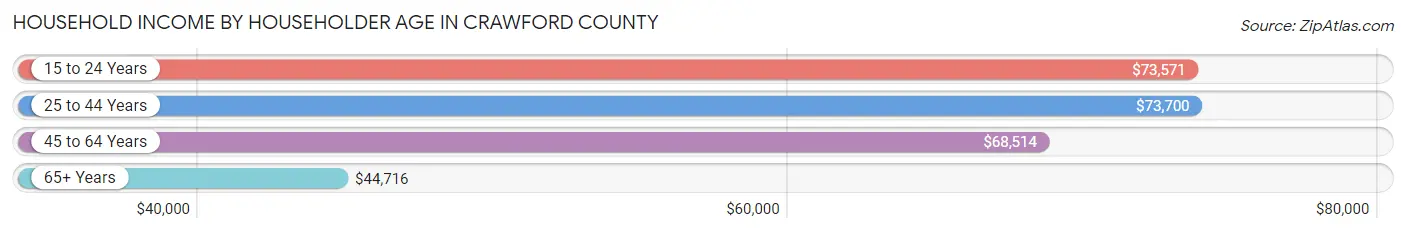
| Income Bracket | # Households | Median Income |
| 15 to 24 Years | 184 (2.8%) | $73,571 |
| 25 to 44 Years | 1,552 (23.7%) | $73,700 |
| 45 to 64 Years | 2,343 (35.8%) | $68,514 |
| 65+ Years | 2,465 (37.7%) | $44,716 |
| Total | 6,544 (100.0%) | $60,823 |
Poverty in Crawford County
Income Below Poverty by Sex and Age in Crawford County
With 11.8% poverty level for males and 12.9% for females among the residents of Crawford County, 5 year old males and under 5 year old females are the most vulnerable to poverty, with 44 males (50.0%) and 97 females (26.0%) in their respective age groups living below the poverty level.

| Age Bracket | Male | Female |
| Under 5 Years | 92 (23.1%) | 97 (26.0%) |
| 5 Years | 44 (50.0%) | 3 (2.7%) |
| 6 to 11 Years | 90 (17.9%) | 82 (18.6%) |
| 12 to 14 Years | 74 (24.7%) | 48 (18.8%) |
| 15 Years | 18 (16.1%) | 17 (19.1%) |
| 16 and 17 Years | 14 (6.3%) | 27 (13.7%) |
| 18 to 24 Years | 142 (22.8%) | 52 (10.6%) |
| 25 to 34 Years | 92 (12.2%) | 135 (18.5%) |
| 35 to 44 Years | 31 (4.0%) | 117 (13.9%) |
| 45 to 54 Years | 47 (5.1%) | 26 (3.0%) |
| 55 to 64 Years | 138 (11.2%) | 151 (11.7%) |
| 65 to 74 Years | 111 (9.6%) | 124 (11.3%) |
| 75 Years and over | 30 (4.2%) | 98 (12.3%) |
| Total | 923 (11.8%) | 977 (12.9%) |
Income Above Poverty by Sex and Age in Crawford County
According to the poverty statistics in Crawford County, males aged 35 to 44 years and females aged 5 years are the age groups that are most secure financially, with 96.0% of males and 97.3% of females in these age groups living above the poverty line.
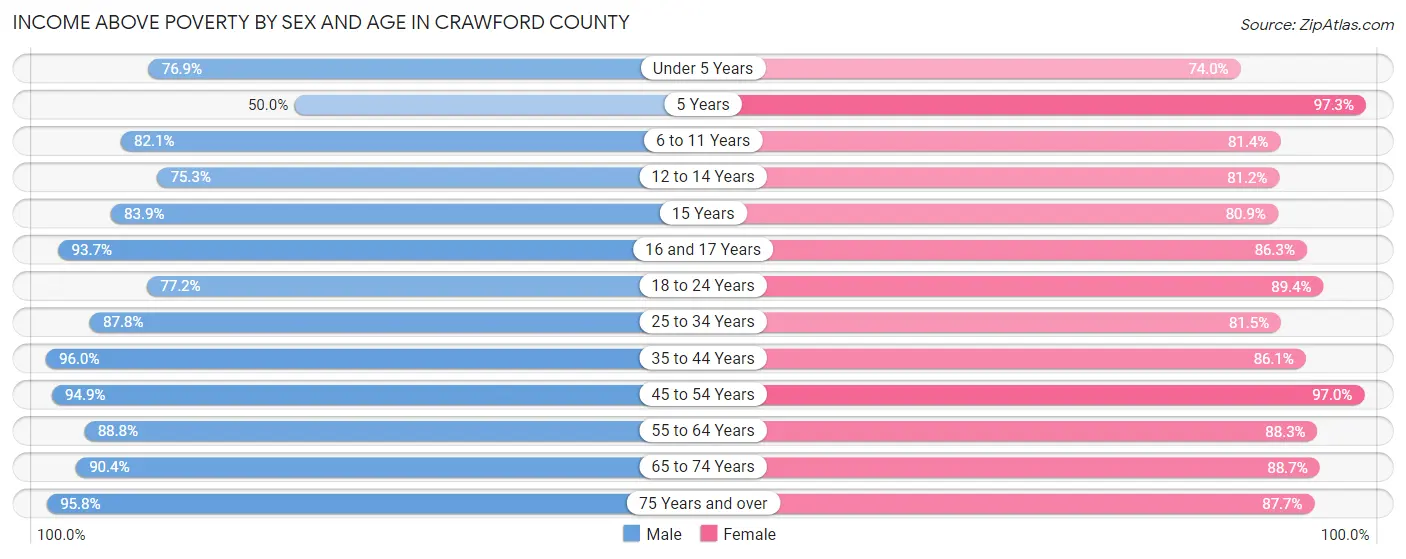
| Age Bracket | Male | Female |
| Under 5 Years | 307 (76.9%) | 276 (74.0%) |
| 5 Years | 44 (50.0%) | 107 (97.3%) |
| 6 to 11 Years | 412 (82.1%) | 358 (81.4%) |
| 12 to 14 Years | 226 (75.3%) | 207 (81.2%) |
| 15 Years | 94 (83.9%) | 72 (80.9%) |
| 16 and 17 Years | 207 (93.7%) | 170 (86.3%) |
| 18 to 24 Years | 481 (77.2%) | 438 (89.4%) |
| 25 to 34 Years | 664 (87.8%) | 596 (81.5%) |
| 35 to 44 Years | 746 (96.0%) | 725 (86.1%) |
| 45 to 54 Years | 871 (94.9%) | 828 (97.0%) |
| 55 to 64 Years | 1,097 (88.8%) | 1,136 (88.3%) |
| 65 to 74 Years | 1,046 (90.4%) | 970 (88.7%) |
| 75 Years and over | 682 (95.8%) | 699 (87.7%) |
| Total | 6,877 (88.2%) | 6,582 (87.1%) |
Income Below Poverty Among Married-Couple Families in Crawford County
The poverty statistics for married-couple families in Crawford County show that 5.5% or 180 of the total 3,272 families live below the poverty line. Families with 5 or more children have the highest poverty rate of 27.5%, comprising of 11 families. On the other hand, families with 1 or 2 children have the lowest poverty rate of 2.8%, which includes 16 families.
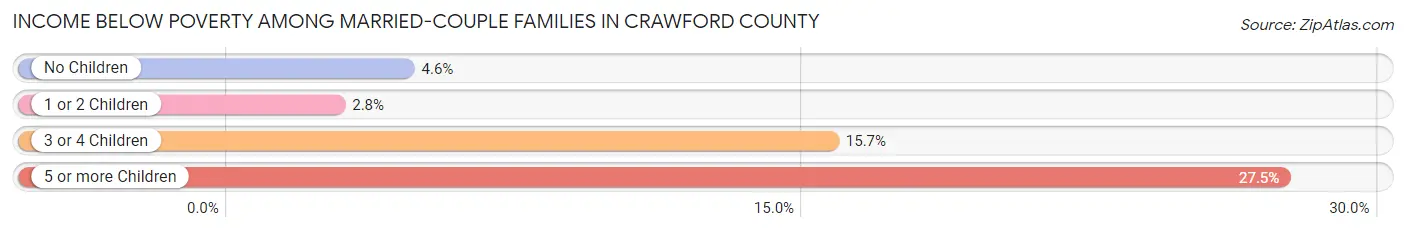
| Children | Above Poverty | Below Poverty |
| No Children | 2,276 (95.4%) | 110 (4.6%) |
| 1 or 2 Children | 556 (97.2%) | 16 (2.8%) |
| 3 or 4 Children | 231 (84.3%) | 43 (15.7%) |
| 5 or more Children | 29 (72.5%) | 11 (27.5%) |
| Total | 3,092 (94.5%) | 180 (5.5%) |
Income Below Poverty Among Single-Parent Households in Crawford County
According to the poverty data in Crawford County, 7.5% or 24 single-father households and 20.1% or 104 single-mother households are living below the poverty line. Among single-father households, those with 1 or 2 children have the highest poverty rate, with 17 households (8.7%) experiencing poverty. Likewise, among single-mother households, those with 5 or more children have the highest poverty rate, with 2 households (100.0%) falling below the poverty line.
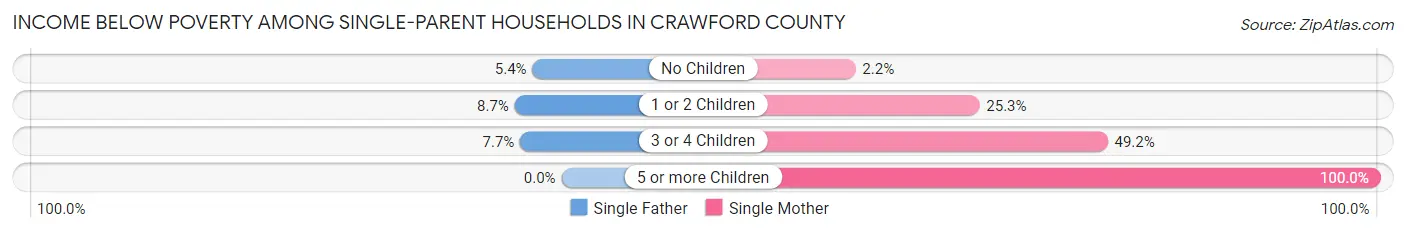
| Children | Single Father | Single Mother |
| No Children | 6 (5.4%) | 4 (2.2%) |
| 1 or 2 Children | 17 (8.7%) | 69 (25.3%) |
| 3 or 4 Children | 1 (7.7%) | 29 (49.1%) |
| 5 or more Children | 0 (0.0%) | 2 (100.0%) |
| Total | 24 (7.5%) | 104 (20.1%) |
Income Below Poverty Among Married-Couple vs Single-Parent Households in Crawford County
The poverty data for Crawford County shows that 180 of the married-couple family households (5.5%) and 128 of the single-parent households (15.3%) are living below the poverty level. Within the married-couple family households, those with 5 or more children have the highest poverty rate, with 11 households (27.5%) falling below the poverty line. Among the single-parent households, those with 5 or more children have the highest poverty rate, with 2 household (66.7%) living below poverty.
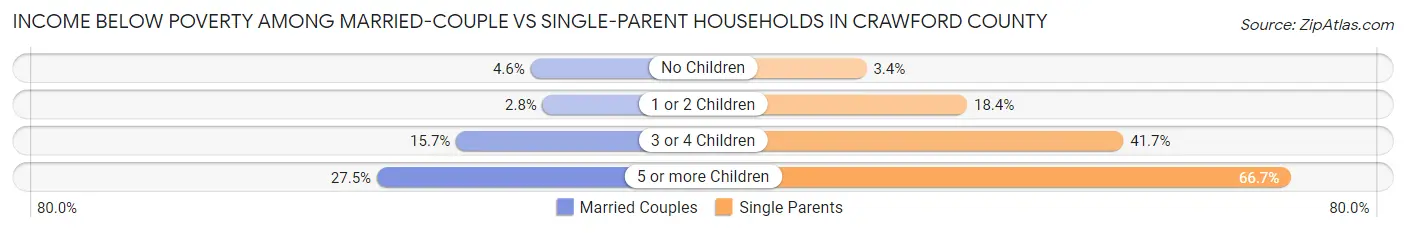
| Children | Married-Couple Families | Single-Parent Households |
| No Children | 110 (4.6%) | 10 (3.4%) |
| 1 or 2 Children | 16 (2.8%) | 86 (18.4%) |
| 3 or 4 Children | 43 (15.7%) | 30 (41.7%) |
| 5 or more Children | 11 (27.5%) | 2 (66.7%) |
| Total | 180 (5.5%) | 128 (15.3%) |
Employment Characteristics in Crawford County
Employment by Class of Employer in Crawford County
Among the 7,013 employed individuals in Crawford County, private company employees (4,842 | 69.0%), self-employed (not incorporated) (605 | 8.6%), and local government employees (537 | 7.7%) make up the most common classes of employment.
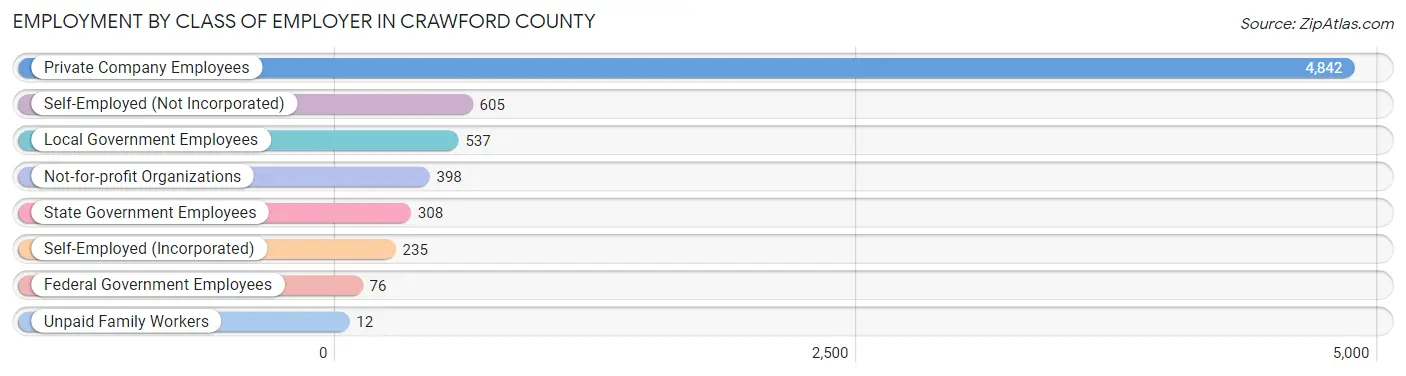
| Employer Class | # Employees | % Employees |
| Private Company Employees | 4,842 | 69.0% |
| Self-Employed (Incorporated) | 235 | 3.4% |
| Self-Employed (Not Incorporated) | 605 | 8.6% |
| Not-for-profit Organizations | 398 | 5.7% |
| Local Government Employees | 537 | 7.7% |
| State Government Employees | 308 | 4.4% |
| Federal Government Employees | 76 | 1.1% |
| Unpaid Family Workers | 12 | 0.2% |
| Total | 7,013 | 100.0% |
Employment Status by Age in Crawford County
According to the labor force statistics for Crawford County, out of the total population over 16 years of age (13,380), 54.6% or 7,305 individuals are in the labor force, with 2.8% or 205 of them unemployed. The age group with the highest labor force participation rate is 45 to 54 years, with 82.4% or 1,555 individuals in the labor force. Within the labor force, the 75 years and over age range has the highest percentage of unemployed individuals, with 20.8% or 36 of them being unemployed.

| Age Bracket | In Labor Force | Unemployed |
| 16 to 19 Years | 257 (33.7%) | 16 (6.2%) |
| 20 to 24 Years | 633 (75.7%) | 24 (3.8%) |
| 25 to 29 Years | 616 (70.5%) | 20 (3.3%) |
| 30 to 34 Years | 583 (74.6%) | 11 (1.9%) |
| 35 to 44 Years | 1,378 (78.4%) | 43 (3.1%) |
| 45 to 54 Years | 1,555 (82.4%) | 23 (1.5%) |
| 55 to 59 Years | 920 (67.9%) | 8 (0.9%) |
| 60 to 64 Years | 670 (54.6%) | 10 (1.5%) |
| 65 to 74 Years | 518 (22.9%) | 10 (1.9%) |
| 75 Years and over | 174 (10.6%) | 36 (20.8%) |
| Total | 7,305 (54.6%) | 205 (2.8%) |
Employment Status by Educational Attainment in Crawford County
According to labor force statistics for Crawford County, 72.6% of individuals (5,723) out of the total population between 25 and 64 years of age (7,883) are in the labor force, with 2.0% or 114 of them being unemployed. The group with the highest labor force participation rate are those with the educational attainment of bachelor's degree or higher, with 83.9% or 1,177 individuals in the labor force. Within the labor force, individuals with less than high school education have the highest percentage of unemployment, with 9.0% or 26 of them being unemployed.

| Educational Attainment | In Labor Force | Unemployed |
| Less than High School | 289 (47.6%) | 55 (9.0%) |
| High School Diploma | 2,082 (69.6%) | 60 (2.0%) |
| College / Associate Degree | 2,175 (75.5%) | 43 (1.5%) |
| Bachelor's Degree or higher | 1,177 (83.9%) | 20 (1.4%) |
| Total | 5,723 (72.6%) | 158 (2.0%) |
Employment Occupations by Sex in Crawford County
Management, Business, Science and Arts Occupations
The most common Management, Business, Science and Arts occupations in Crawford County are Management (641 | 9.0%), Community & Social Service (454 | 6.4%), Health Diagnosing & Treating (382 | 5.4%), Business & Financial (304 | 4.3%), and Education Instruction & Library (288 | 4.1%).

Management, Business, Science and Arts Occupations by Sex
Within the Management, Business, Science and Arts occupations in Crawford County, the most male-oriented occupations are Architecture & Engineering (82.3%), Computers, Engineering & Science (67.3%), and Management (66.0%), while the most female-oriented occupations are Life, Physical & Social Science (95.0%), Health Technologists (84.6%), and Education, Arts & Media (84.5%).
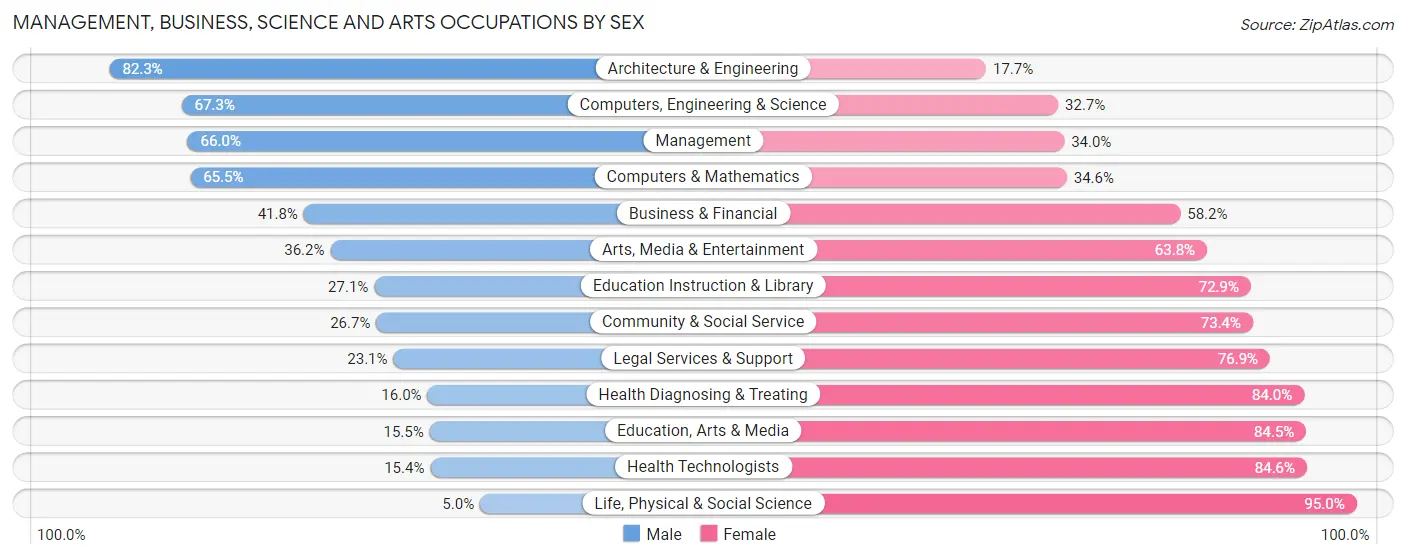
| Occupation | Male | Female |
| Management | 423 (66.0%) | 218 (34.0%) |
| Business & Financial | 127 (41.8%) | 177 (58.2%) |
| Computers, Engineering & Science | 152 (67.3%) | 74 (32.7%) |
| Computers & Mathematics | 72 (65.4%) | 38 (34.5%) |
| Architecture & Engineering | 79 (82.3%) | 17 (17.7%) |
| Life, Physical & Social Science | 1 (5.0%) | 19 (95.0%) |
| Community & Social Service | 121 (26.7%) | 333 (73.4%) |
| Education, Arts & Media | 9 (15.5%) | 49 (84.5%) |
| Legal Services & Support | 9 (23.1%) | 30 (76.9%) |
| Education Instruction & Library | 78 (27.1%) | 210 (72.9%) |
| Arts, Media & Entertainment | 25 (36.2%) | 44 (63.8%) |
| Health Diagnosing & Treating | 61 (16.0%) | 321 (84.0%) |
| Health Technologists | 38 (15.4%) | 209 (84.6%) |
| Total (Category) | 884 (44.1%) | 1,123 (55.9%) |
| Total (Overall) | 3,867 (54.6%) | 3,220 (45.4%) |
Services Occupations
The most common Services occupations in Crawford County are Food Preparation & Serving (329 | 4.6%), Healthcare Support (301 | 4.3%), Cleaning & Maintenance (264 | 3.7%), Security & Protection (161 | 2.3%), and Law Enforcement (131 | 1.8%).
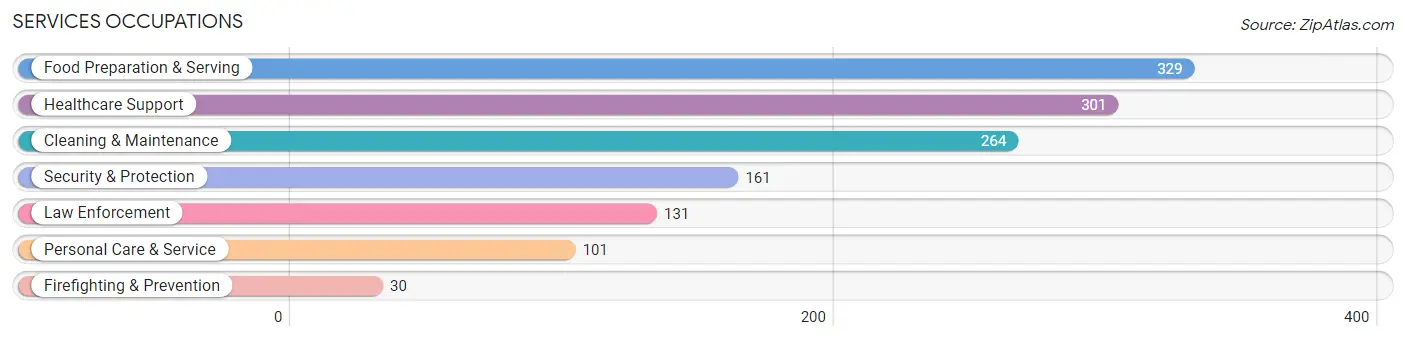
Services Occupations by Sex
Within the Services occupations in Crawford County, the most male-oriented occupations are Law Enforcement (93.9%), Security & Protection (90.7%), and Firefighting & Prevention (76.7%), while the most female-oriented occupations are Personal Care & Service (81.2%), Healthcare Support (73.1%), and Food Preparation & Serving (67.2%).

| Occupation | Male | Female |
| Healthcare Support | 81 (26.9%) | 220 (73.1%) |
| Security & Protection | 146 (90.7%) | 15 (9.3%) |
| Firefighting & Prevention | 23 (76.7%) | 7 (23.3%) |
| Law Enforcement | 123 (93.9%) | 8 (6.1%) |
| Food Preparation & Serving | 108 (32.8%) | 221 (67.2%) |
| Cleaning & Maintenance | 118 (44.7%) | 146 (55.3%) |
| Personal Care & Service | 19 (18.8%) | 82 (81.2%) |
| Total (Category) | 472 (40.8%) | 684 (59.2%) |
| Total (Overall) | 3,867 (54.6%) | 3,220 (45.4%) |
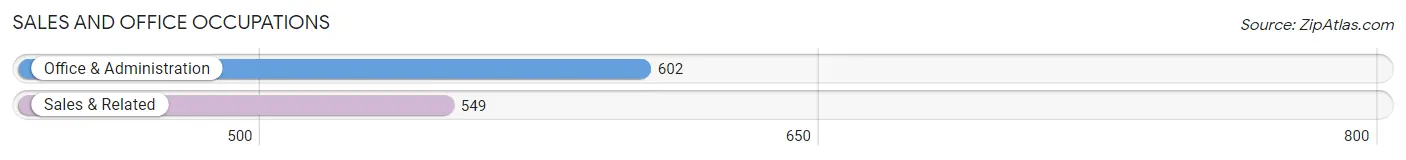
Sales and Office Occupations
The most common Sales and Office occupations in Crawford County are Office & Administration (602 | 8.5%), and Sales & Related (549 | 7.7%).
Sales and Office Occupations by Sex
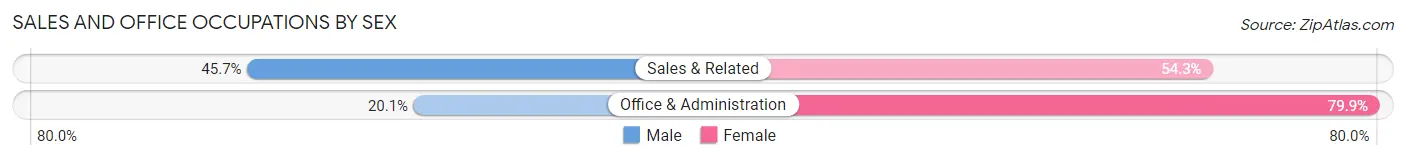
| Occupation | Male | Female |
| Sales & Related | 251 (45.7%) | 298 (54.3%) |
| Office & Administration | 121 (20.1%) | 481 (79.9%) |
| Total (Category) | 372 (32.3%) | 779 (67.7%) |
| Total (Overall) | 3,867 (54.6%) | 3,220 (45.4%) |
Natural Resources, Construction and Maintenance Occupations
The most common Natural Resources, Construction and Maintenance occupations in Crawford County are Construction & Extraction (468 | 6.6%), Installation, Maintenance & Repair (327 | 4.6%), and Farming, Fishing & Forestry (194 | 2.7%).

Natural Resources, Construction and Maintenance Occupations by Sex
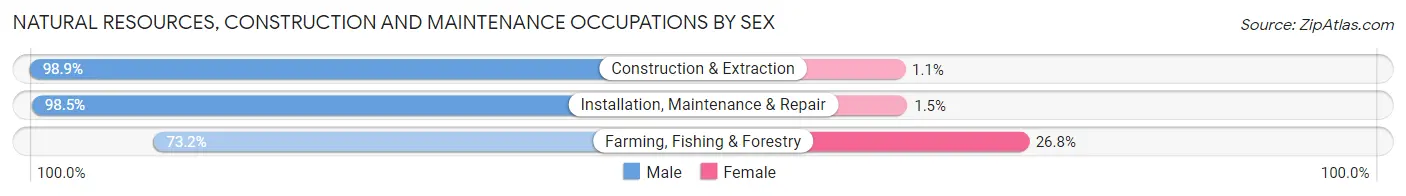
| Occupation | Male | Female |
| Farming, Fishing & Forestry | 142 (73.2%) | 52 (26.8%) |
| Construction & Extraction | 463 (98.9%) | 5 (1.1%) |
| Installation, Maintenance & Repair | 322 (98.5%) | 5 (1.5%) |
| Total (Category) | 927 (93.7%) | 62 (6.3%) |
| Total (Overall) | 3,867 (54.6%) | 3,220 (45.4%) |
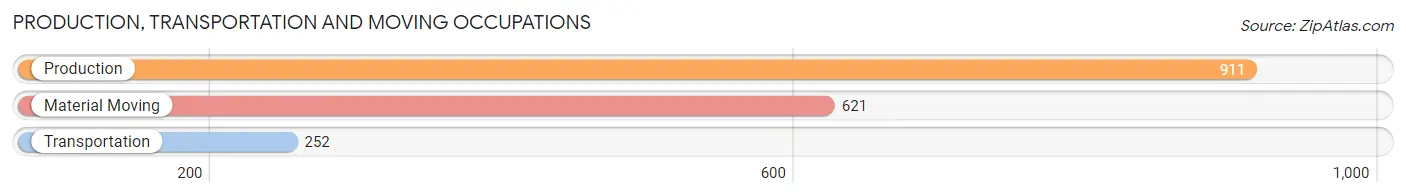
Production, Transportation and Moving Occupations
The most common Production, Transportation and Moving occupations in Crawford County are Production (911 | 12.9%), Material Moving (621 | 8.8%), and Transportation (252 | 3.6%).
Production, Transportation and Moving Occupations by Sex
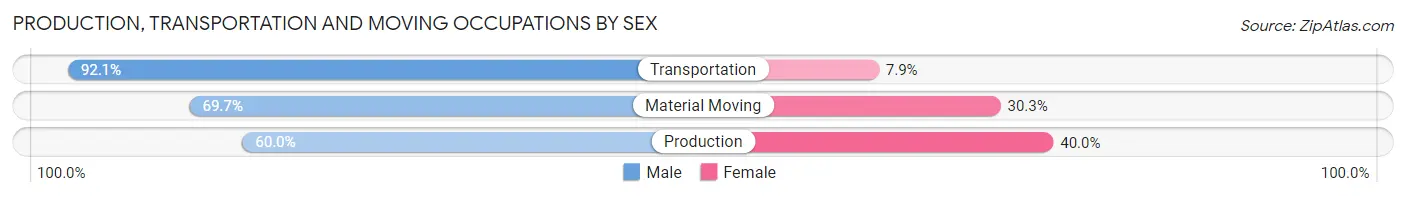
| Occupation | Male | Female |
| Production | 547 (60.0%) | 364 (40.0%) |
| Transportation | 232 (92.1%) | 20 (7.9%) |
| Material Moving | 433 (69.7%) | 188 (30.3%) |
| Total (Category) | 1,212 (67.9%) | 572 (32.1%) |
| Total (Overall) | 3,867 (54.6%) | 3,220 (45.4%) |
Employment Industries by Sex in Crawford County
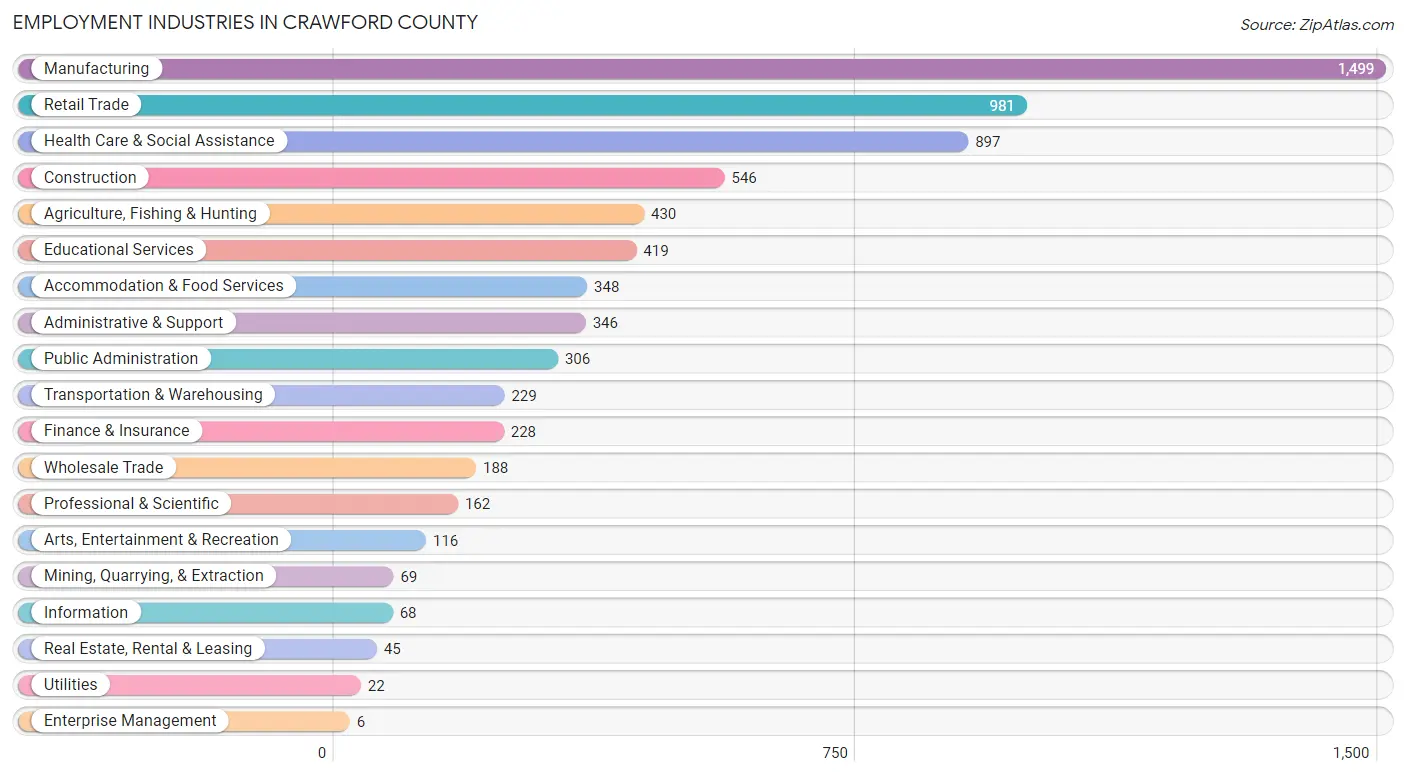
Employment Industries in Crawford County
The major employment industries in Crawford County include Manufacturing (1,499 | 21.1%), Retail Trade (981 | 13.8%), Health Care & Social Assistance (897 | 12.7%), Construction (546 | 7.7%), and Agriculture, Fishing & Hunting (430 | 6.1%).
Employment Industries by Sex in Crawford County
The Crawford County industries that see more men than women are Construction (91.8%), Utilities (90.9%), and Agriculture, Fishing & Hunting (75.6%), whereas the industries that tend to have a higher number of women are Enterprise Management (100.0%), Health Care & Social Assistance (77.9%), and Educational Services (69.9%).

| Industry | Male | Female |
| Agriculture, Fishing & Hunting | 325 (75.6%) | 105 (24.4%) |
| Mining, Quarrying, & Extraction | 47 (68.1%) | 22 (31.9%) |
| Construction | 501 (91.8%) | 45 (8.2%) |
| Manufacturing | 1,019 (68.0%) | 480 (32.0%) |
| Wholesale Trade | 139 (73.9%) | 49 (26.1%) |
| Retail Trade | 448 (45.7%) | 533 (54.3%) |
| Transportation & Warehousing | 164 (71.6%) | 65 (28.4%) |
| Utilities | 20 (90.9%) | 2 (9.1%) |
| Information | 51 (75.0%) | 17 (25.0%) |
| Finance & Insurance | 88 (38.6%) | 140 (61.4%) |
| Real Estate, Rental & Leasing | 33 (73.3%) | 12 (26.7%) |
| Professional & Scientific | 49 (30.2%) | 113 (69.8%) |
| Enterprise Management | 0 (0.0%) | 6 (100.0%) |
| Administrative & Support | 208 (60.1%) | 138 (39.9%) |
| Educational Services | 126 (30.1%) | 293 (69.9%) |
| Health Care & Social Assistance | 198 (22.1%) | 699 (77.9%) |
| Arts, Entertainment & Recreation | 48 (41.4%) | 68 (58.6%) |
| Accommodation & Food Services | 122 (35.1%) | 226 (64.9%) |
| Public Administration | 174 (56.9%) | 132 (43.1%) |
| Total | 3,867 (54.6%) | 3,220 (45.4%) |
Education in Crawford County
School Enrollment in Crawford County
The most common levels of schooling among the 2,886 students in Crawford County are high school (810 | 28.1%), middle school (707 | 24.5%), and elementary school (597 | 20.7%).

| School Level | # Students | % Students |
| Nursery / Preschool | 216 | 7.5% |
| Kindergarten | 108 | 3.7% |
| Elementary School | 597 | 20.7% |
| Middle School | 707 | 24.5% |
| High School | 810 | 28.1% |
| College / Undergraduate | 408 | 14.1% |
| Graduate / Professional | 40 | 1.4% |
| Total | 2,886 | 100.0% |
School Enrollment by Age by Funding Source in Crawford County
Out of a total of 2,886 students who are enrolled in schools in Crawford County, 358 (12.4%) attend a private institution, while the remaining 2,528 (87.6%) are enrolled in public schools. The age group of 20 to 24 year olds has the highest likelihood of being enrolled in private schools, with 32 (24.8% in the age bracket) enrolled. Conversely, the age group of 15 to 17 year olds has the lowest likelihood of being enrolled in a private school, with 542 (93.6% in the age bracket) attending a public institution.
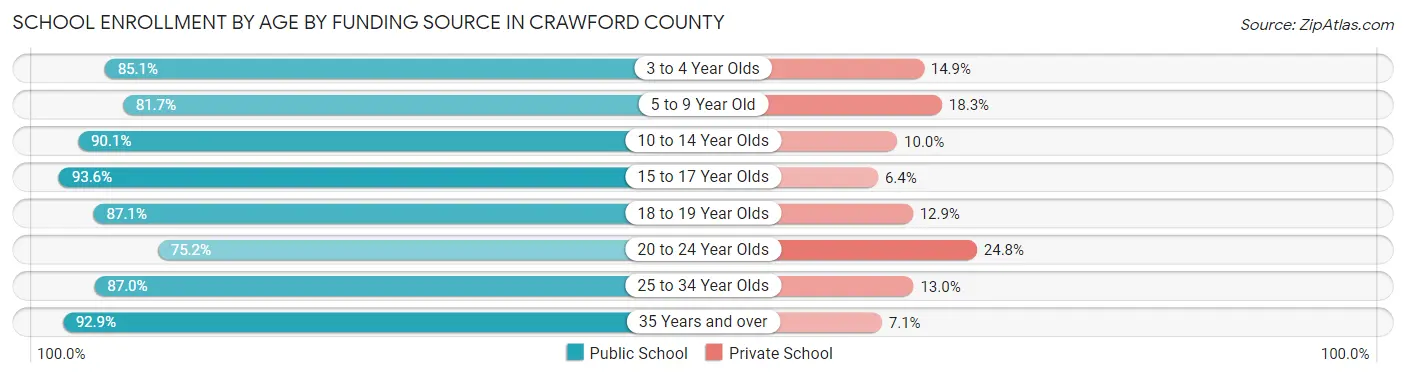
| Age Bracket | Public School | Private School |
| 3 to 4 Year Olds | 114 (85.1%) | 20 (14.9%) |
| 5 to 9 Year Old | 607 (81.7%) | 136 (18.3%) |
| 10 to 14 Year Olds | 715 (90.0%) | 79 (10.0%) |
| 15 to 17 Year Olds | 542 (93.6%) | 37 (6.4%) |
| 18 to 19 Year Olds | 183 (87.1%) | 27 (12.9%) |
| 20 to 24 Year Olds | 97 (75.2%) | 32 (24.8%) |
| 25 to 34 Year Olds | 87 (87.0%) | 13 (13.0%) |
| 35 Years and over | 183 (92.9%) | 14 (7.1%) |
| Total | 2,528 (87.6%) | 358 (12.4%) |
Educational Attainment by Field of Study in Crawford County
Education (448 | 19.9%), science & technology (338 | 15.0%), business (325 | 14.4%), bio, nature & agricultural (204 | 9.0%), and arts & humanities (181 | 8.0%) are the most common fields of study among 2,253 individuals in Crawford County who have obtained a bachelor's degree or higher.
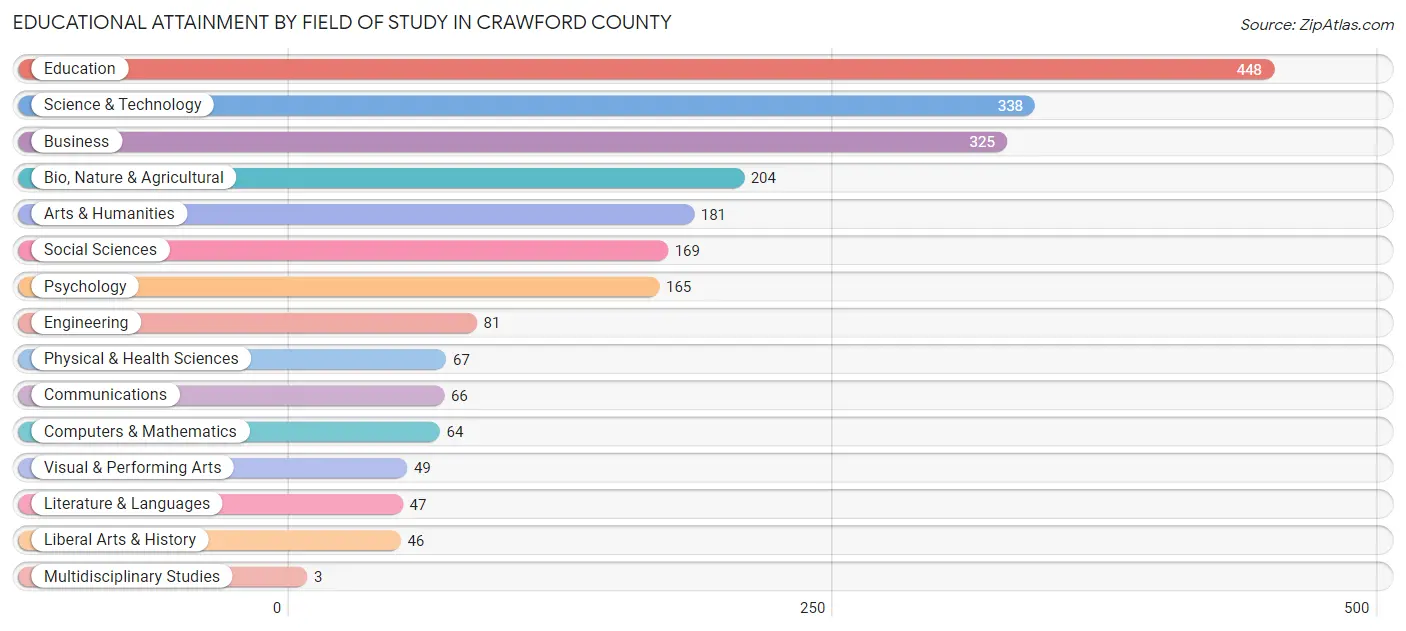
| Field of Study | # Graduates | % Graduates |
| Computers & Mathematics | 64 | 2.8% |
| Bio, Nature & Agricultural | 204 | 9.0% |
| Physical & Health Sciences | 67 | 3.0% |
| Psychology | 165 | 7.3% |
| Social Sciences | 169 | 7.5% |
| Engineering | 81 | 3.6% |
| Multidisciplinary Studies | 3 | 0.1% |
| Science & Technology | 338 | 15.0% |
| Business | 325 | 14.4% |
| Education | 448 | 19.9% |
| Literature & Languages | 47 | 2.1% |
| Liberal Arts & History | 46 | 2.0% |
| Visual & Performing Arts | 49 | 2.2% |
| Communications | 66 | 2.9% |
| Arts & Humanities | 181 | 8.0% |
| Total | 2,253 | 100.0% |
Transportation & Commute in Crawford County
Vehicle Availability by Sex in Crawford County
The most prevalent vehicle ownership categories in Crawford County are males with 2 vehicles (1,633, accounting for 42.6%) and females with 2 vehicles (1,356, making up 51.6%).
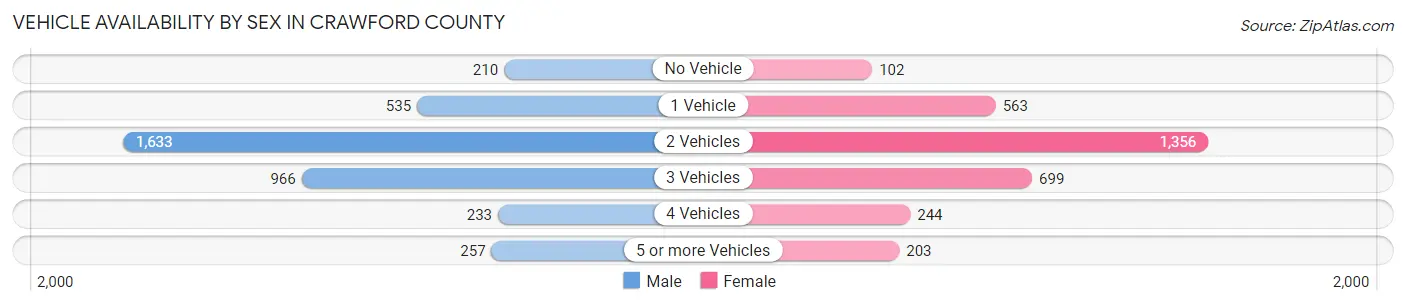
| Vehicles Available | Male | Female |
| No Vehicle | 210 (5.5%) | 102 (3.2%) |
| 1 Vehicle | 535 (14.0%) | 563 (17.8%) |
| 2 Vehicles | 1,633 (42.6%) | 1,356 (42.8%) |
| 3 Vehicles | 966 (25.2%) | 699 (22.1%) |
| 4 Vehicles | 233 (6.1%) | 244 (7.7%) |
| 5 or more Vehicles | 257 (6.7%) | 203 (6.4%) |
| Total | 3,834 (100.0%) | 3,167 (100.0%) |
Commute Time in Crawford County
The most frequently occuring commute durations in Crawford County are 5 to 9 minutes (1,411 commuters, 21.3%), 10 to 14 minutes (1,013 commuters, 15.3%), and less than 5 minutes (747 commuters, 11.3%).

| Commute Time | # Commuters | % Commuters |
| Less than 5 Minutes | 747 | 11.3% |
| 5 to 9 Minutes | 1,411 | 21.3% |
| 10 to 14 Minutes | 1,013 | 15.3% |
| 15 to 19 Minutes | 703 | 10.6% |
| 20 to 24 Minutes | 645 | 9.7% |
| 25 to 29 Minutes | 271 | 4.1% |
| 30 to 34 Minutes | 510 | 7.7% |
| 35 to 39 Minutes | 268 | 4.0% |
| 40 to 44 Minutes | 171 | 2.6% |
| 45 to 59 Minutes | 312 | 4.7% |
| 60 to 89 Minutes | 375 | 5.7% |
| 90 or more Minutes | 208 | 3.1% |
Commute Time by Sex in Crawford County
The most common commute times in Crawford County are 5 to 9 minutes (718 commuters, 19.8%) for males and 5 to 9 minutes (693 commuters, 23.0%) for females.
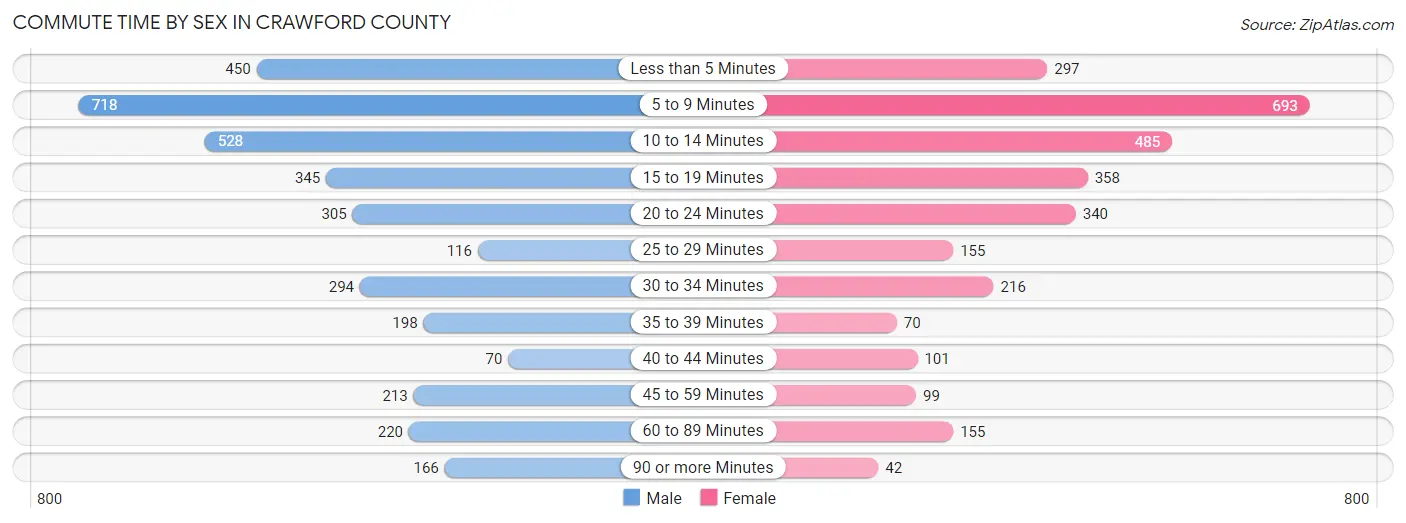
| Commute Time | Male | Female |
| Less than 5 Minutes | 450 (12.4%) | 297 (9.9%) |
| 5 to 9 Minutes | 718 (19.8%) | 693 (23.0%) |
| 10 to 14 Minutes | 528 (14.6%) | 485 (16.1%) |
| 15 to 19 Minutes | 345 (9.5%) | 358 (11.9%) |
| 20 to 24 Minutes | 305 (8.4%) | 340 (11.3%) |
| 25 to 29 Minutes | 116 (3.2%) | 155 (5.1%) |
| 30 to 34 Minutes | 294 (8.1%) | 216 (7.2%) |
| 35 to 39 Minutes | 198 (5.5%) | 70 (2.3%) |
| 40 to 44 Minutes | 70 (1.9%) | 101 (3.4%) |
| 45 to 59 Minutes | 213 (5.9%) | 99 (3.3%) |
| 60 to 89 Minutes | 220 (6.1%) | 155 (5.1%) |
| 90 or more Minutes | 166 (4.6%) | 42 (1.4%) |
Time of Departure to Work by Sex in Crawford County
The most frequent times of departure to work in Crawford County are 7:00 AM to 7:29 AM (447, 12.3%) for males and 7:30 AM to 7:59 AM (539, 17.9%) for females.

| Time of Departure | Male | Female |
| 12:00 AM to 4:59 AM | 330 (9.1%) | 200 (6.6%) |
| 5:00 AM to 5:29 AM | 304 (8.4%) | 228 (7.6%) |
| 5:30 AM to 5:59 AM | 437 (12.1%) | 233 (7.7%) |
| 6:00 AM to 6:29 AM | 320 (8.8%) | 138 (4.6%) |
| 6:30 AM to 6:59 AM | 268 (7.4%) | 269 (8.9%) |
| 7:00 AM to 7:29 AM | 447 (12.3%) | 387 (12.9%) |
| 7:30 AM to 7:59 AM | 402 (11.1%) | 539 (17.9%) |
| 8:00 AM to 8:29 AM | 233 (6.4%) | 212 (7.0%) |
| 8:30 AM to 8:59 AM | 118 (3.3%) | 177 (5.9%) |
| 9:00 AM to 9:59 AM | 85 (2.4%) | 110 (3.6%) |
| 10:00 AM to 10:59 AM | 49 (1.3%) | 39 (1.3%) |
| 11:00 AM to 11:59 AM | 10 (0.3%) | 54 (1.8%) |
| 12:00 PM to 3:59 PM | 298 (8.2%) | 232 (7.7%) |
| 4:00 PM to 11:59 PM | 322 (8.9%) | 193 (6.4%) |
| Total | 3,623 (100.0%) | 3,011 (100.0%) |
Housing Occupancy in Crawford County
Occupancy by Ownership in Crawford County
Of the total 6,544 dwellings in Crawford County, owner-occupied units account for 4,885 (74.7%), while renter-occupied units make up 1,659 (25.4%).
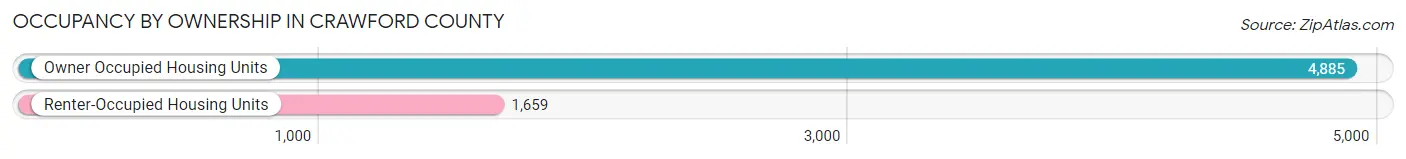
| Occupancy | # Housing Units | % Housing Units |
| Owner Occupied Housing Units | 4,885 | 74.7% |
| Renter-Occupied Housing Units | 1,659 | 25.4% |
| Total Occupied Housing Units | 6,544 | 100.0% |
Occupancy by Household Size in Crawford County
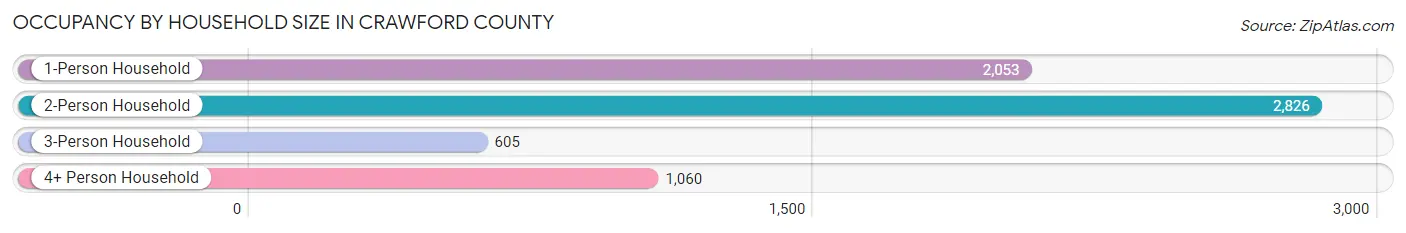
| Household Size | # Housing Units | % Housing Units |
| 1-Person Household | 2,053 | 31.4% |
| 2-Person Household | 2,826 | 43.2% |
| 3-Person Household | 605 | 9.2% |
| 4+ Person Household | 1,060 | 16.2% |
| Total Housing Units | 6,544 | 100.0% |
Occupancy by Ownership by Household Size in Crawford County
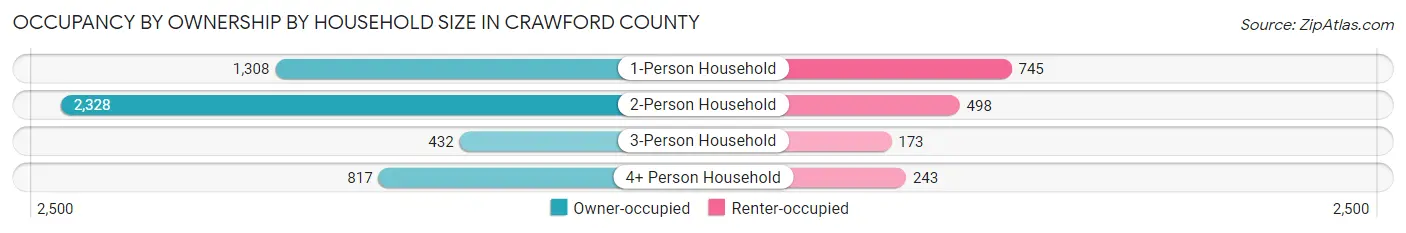
| Household Size | Owner-occupied | Renter-occupied |
| 1-Person Household | 1,308 (63.7%) | 745 (36.3%) |
| 2-Person Household | 2,328 (82.4%) | 498 (17.6%) |
| 3-Person Household | 432 (71.4%) | 173 (28.6%) |
| 4+ Person Household | 817 (77.1%) | 243 (22.9%) |
| Total Housing Units | 4,885 (74.7%) | 1,659 (25.4%) |
Occupancy by Educational Attainment in Crawford County
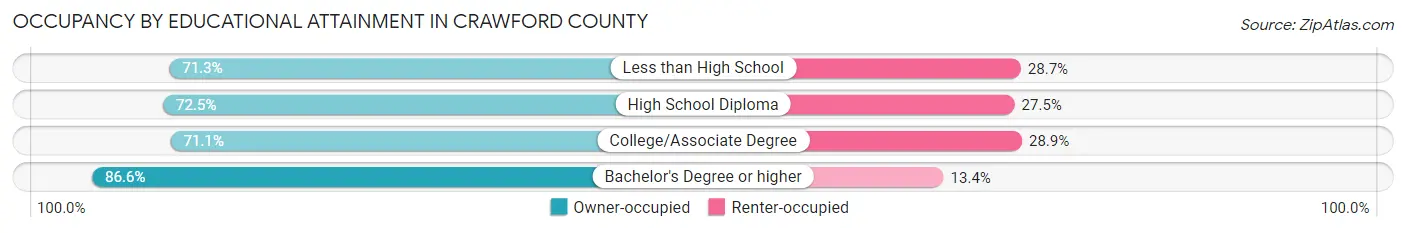
| Household Size | Owner-occupied | Renter-occupied |
| Less than High School | 328 (71.3%) | 132 (28.7%) |
| High School Diploma | 1,981 (72.5%) | 750 (27.5%) |
| College/Associate Degree | 1,501 (71.1%) | 611 (28.9%) |
| Bachelor's Degree or higher | 1,075 (86.6%) | 166 (13.4%) |
Occupancy by Age of Householder in Crawford County

| Age Bracket | # Households | % Households |
| Under 35 Years | 925 | 14.1% |
| 35 to 44 Years | 811 | 12.4% |
| 45 to 54 Years | 1,017 | 15.5% |
| 55 to 64 Years | 1,326 | 20.3% |
| 65 to 74 Years | 1,450 | 22.2% |
| 75 to 84 Years | 761 | 11.6% |
| 85 Years and Over | 254 | 3.9% |
| Total | 6,544 | 100.0% |
Housing Finances in Crawford County
Median Income by Occupancy in Crawford County
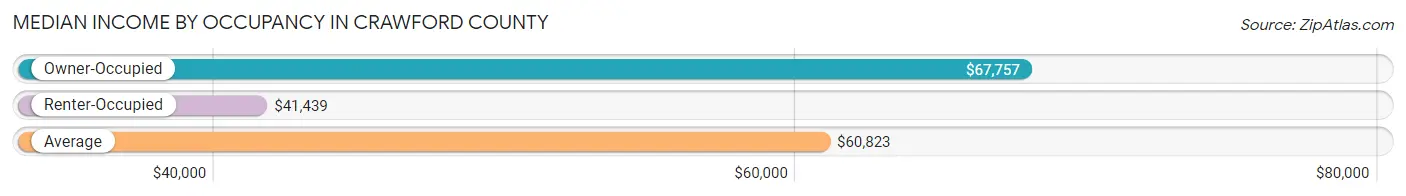
| Occupancy Type | # Households | Median Income |
| Owner-Occupied | 4,885 (74.7%) | $67,757 |
| Renter-Occupied | 1,659 (25.4%) | $41,439 |
| Average | 6,544 (100.0%) | $60,823 |
Occupancy by Householder Income Bracket in Crawford County
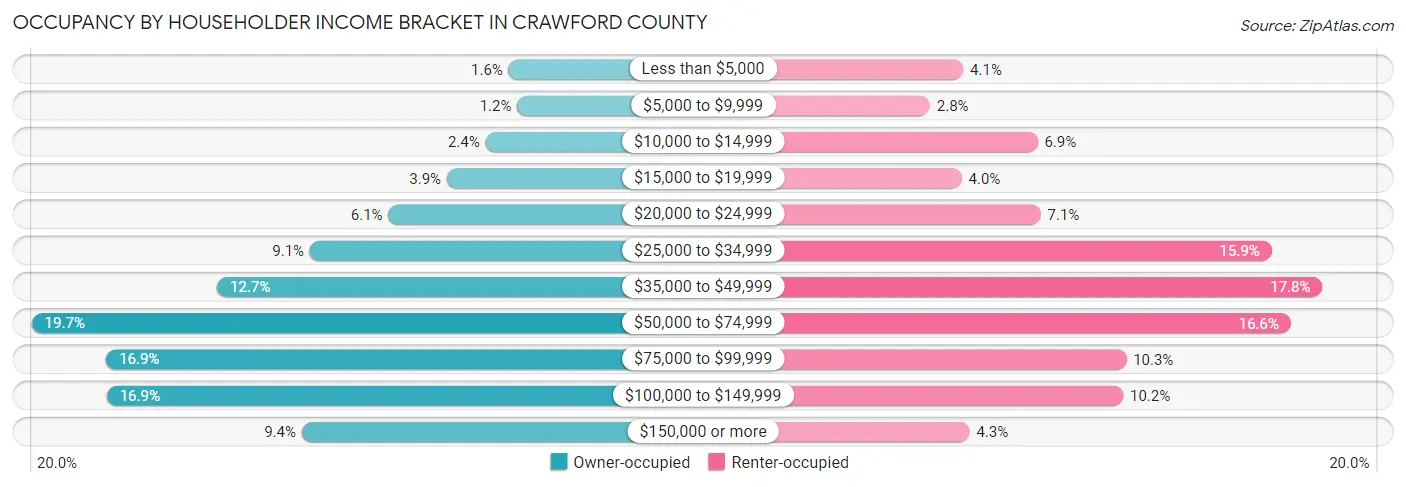
| Income Bracket | Owner-occupied | Renter-occupied |
| Less than $5,000 | 76 (1.6%) | 68 (4.1%) |
| $5,000 to $9,999 | 60 (1.2%) | 47 (2.8%) |
| $10,000 to $14,999 | 119 (2.4%) | 115 (6.9%) |
| $15,000 to $19,999 | 191 (3.9%) | 67 (4.0%) |
| $20,000 to $24,999 | 300 (6.1%) | 117 (7.0%) |
| $25,000 to $34,999 | 446 (9.1%) | 263 (15.9%) |
| $35,000 to $49,999 | 619 (12.7%) | 295 (17.8%) |
| $50,000 to $74,999 | 964 (19.7%) | 275 (16.6%) |
| $75,000 to $99,999 | 825 (16.9%) | 171 (10.3%) |
| $100,000 to $149,999 | 824 (16.9%) | 169 (10.2%) |
| $150,000 or more | 461 (9.4%) | 72 (4.3%) |
| Total | 4,885 (100.0%) | 1,659 (100.0%) |
Monthly Housing Cost Tiers in Crawford County
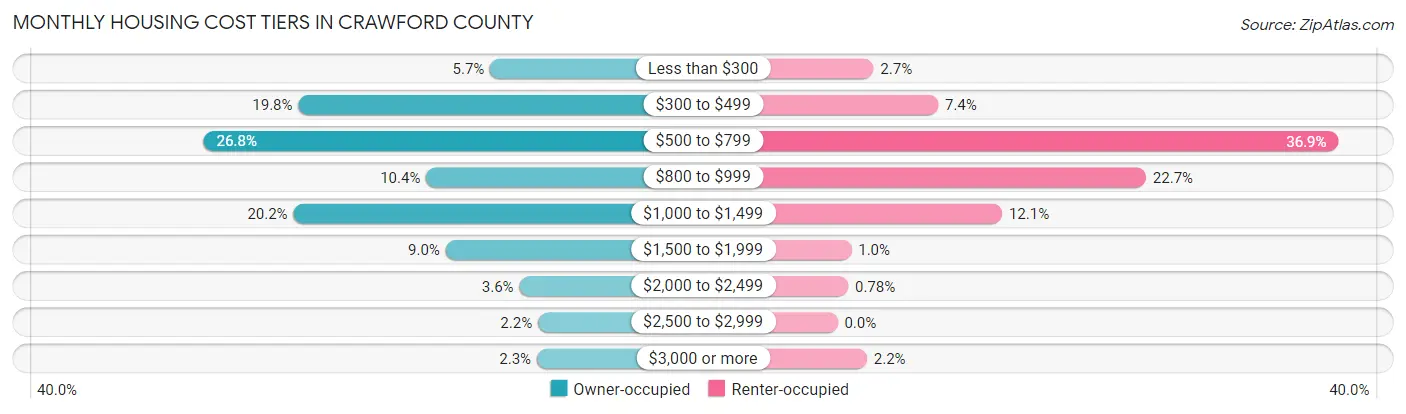
| Monthly Cost | Owner-occupied | Renter-occupied |
| Less than $300 | 279 (5.7%) | 44 (2.6%) |
| $300 to $499 | 969 (19.8%) | 123 (7.4%) |
| $500 to $799 | 1,310 (26.8%) | 612 (36.9%) |
| $800 to $999 | 509 (10.4%) | 377 (22.7%) |
| $1,000 to $1,499 | 987 (20.2%) | 201 (12.1%) |
| $1,500 to $1,999 | 439 (9.0%) | 17 (1.0%) |
| $2,000 to $2,499 | 174 (3.6%) | 13 (0.8%) |
| $2,500 to $2,999 | 107 (2.2%) | 0 (0.0%) |
| $3,000 or more | 111 (2.3%) | 36 (2.2%) |
| Total | 4,885 (100.0%) | 1,659 (100.0%) |
Physical Housing Characteristics in Crawford County
Housing Structures in Crawford County
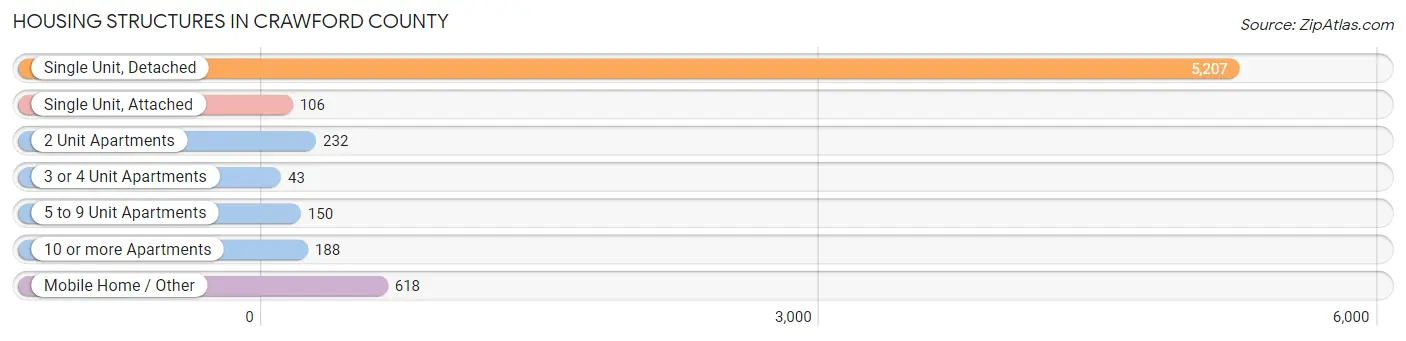
| Structure Type | # Housing Units | % Housing Units |
| Single Unit, Detached | 5,207 | 79.6% |
| Single Unit, Attached | 106 | 1.6% |
| 2 Unit Apartments | 232 | 3.5% |
| 3 or 4 Unit Apartments | 43 | 0.7% |
| 5 to 9 Unit Apartments | 150 | 2.3% |
| 10 or more Apartments | 188 | 2.9% |
| Mobile Home / Other | 618 | 9.4% |
| Total | 6,544 | 100.0% |
Housing Structures by Occupancy in Crawford County

| Structure Type | Owner-occupied | Renter-occupied |
| Single Unit, Detached | 4,400 (84.5%) | 807 (15.5%) |
| Single Unit, Attached | 52 (49.1%) | 54 (50.9%) |
| 2 Unit Apartments | 15 (6.5%) | 217 (93.5%) |
| 3 or 4 Unit Apartments | 0 (0.0%) | 43 (100.0%) |
| 5 to 9 Unit Apartments | 0 (0.0%) | 150 (100.0%) |
| 10 or more Apartments | 5 (2.7%) | 183 (97.3%) |
| Mobile Home / Other | 413 (66.8%) | 205 (33.2%) |
| Total | 4,885 (74.7%) | 1,659 (25.4%) |
Housing Structures by Number of Rooms in Crawford County
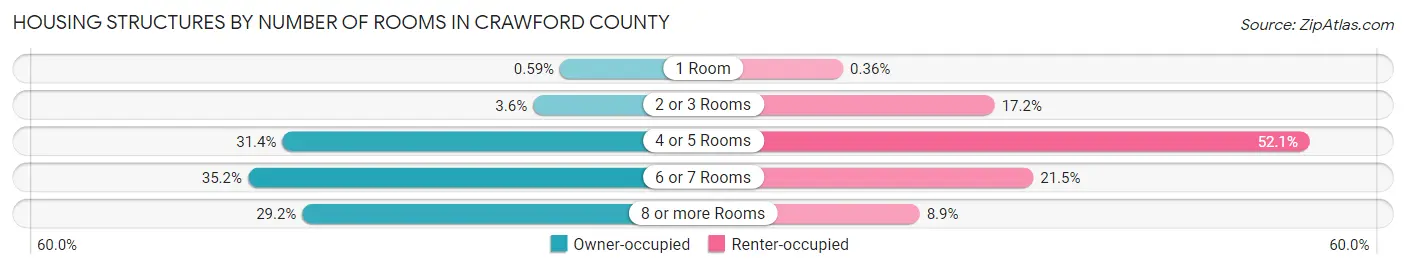
| Number of Rooms | Owner-occupied | Renter-occupied |
| 1 Room | 29 (0.6%) | 6 (0.4%) |
| 2 or 3 Rooms | 175 (3.6%) | 285 (17.2%) |
| 4 or 5 Rooms | 1,534 (31.4%) | 865 (52.1%) |
| 6 or 7 Rooms | 1,721 (35.2%) | 356 (21.5%) |
| 8 or more Rooms | 1,426 (29.2%) | 147 (8.9%) |
| Total | 4,885 (100.0%) | 1,659 (100.0%) |
Housing Structure by Heating Type in Crawford County
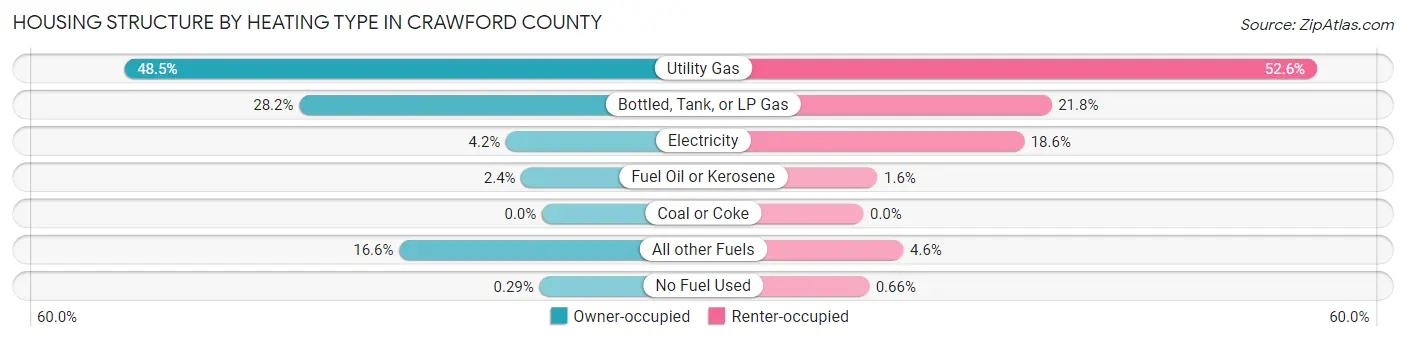
| Heating Type | Owner-occupied | Renter-occupied |
| Utility Gas | 2,367 (48.4%) | 873 (52.6%) |
| Bottled, Tank, or LP Gas | 1,375 (28.1%) | 362 (21.8%) |
| Electricity | 203 (4.2%) | 309 (18.6%) |
| Fuel Oil or Kerosene | 117 (2.4%) | 27 (1.6%) |
| Coal or Coke | 0 (0.0%) | 0 (0.0%) |
| All other Fuels | 809 (16.6%) | 77 (4.6%) |
| No Fuel Used | 14 (0.3%) | 11 (0.7%) |
| Total | 4,885 (100.0%) | 1,659 (100.0%) |
Household Vehicle Usage in Crawford County
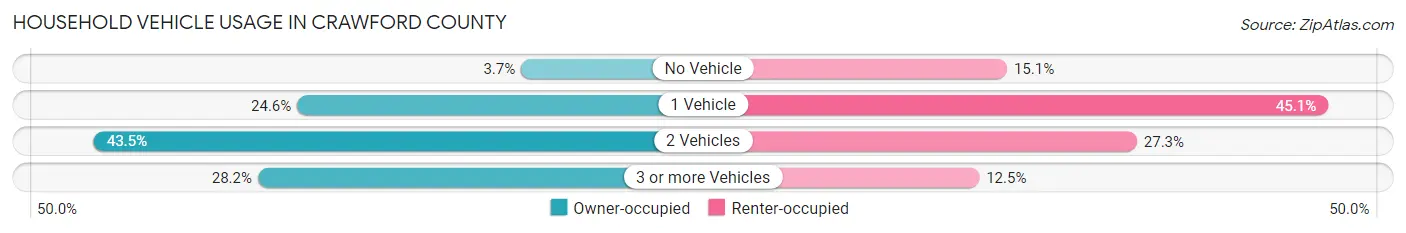
| Vehicles per Household | Owner-occupied | Renter-occupied |
| No Vehicle | 179 (3.7%) | 251 (15.1%) |
| 1 Vehicle | 1,200 (24.6%) | 748 (45.1%) |
| 2 Vehicles | 2,127 (43.5%) | 452 (27.3%) |
| 3 or more Vehicles | 1,379 (28.2%) | 208 (12.5%) |
| Total | 4,885 (100.0%) | 1,659 (100.0%) |
Real Estate & Mortgages in Crawford County
Real Estate and Mortgage Overview in Crawford County
| Characteristic | Without Mortgage | With Mortgage |
| Housing Units | 2,615 | 2,270 |
| Median Property Value | $155,800 | $164,800 |
| Median Household Income | $54,806 | $269 |
| Monthly Housing Costs | $517 | $102 |
| Real Estate Taxes | $2,755 | $6 |
Property Value by Mortgage Status in Crawford County
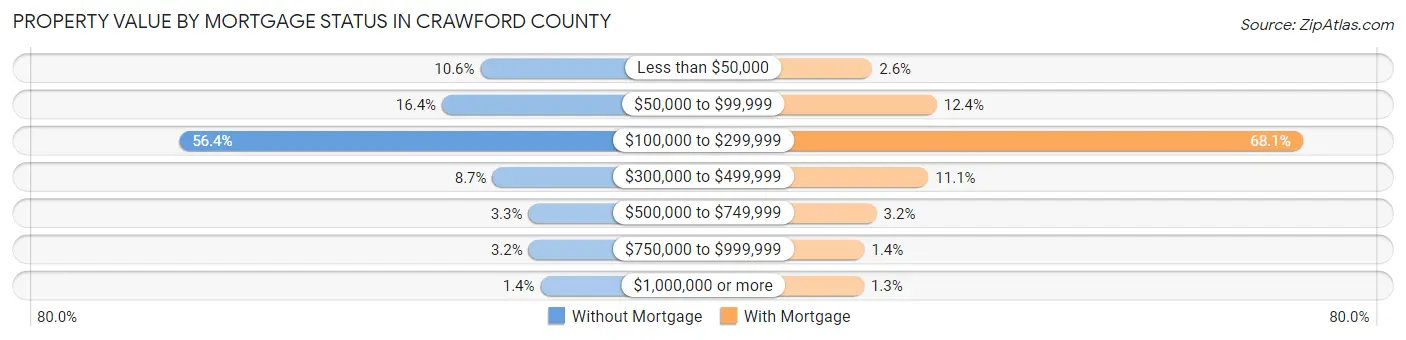
| Property Value | Without Mortgage | With Mortgage |
| Less than $50,000 | 276 (10.5%) | 58 (2.6%) |
| $50,000 to $99,999 | 429 (16.4%) | 281 (12.4%) |
| $100,000 to $299,999 | 1,476 (56.4%) | 1,546 (68.1%) |
| $300,000 to $499,999 | 228 (8.7%) | 252 (11.1%) |
| $500,000 to $749,999 | 85 (3.3%) | 73 (3.2%) |
| $750,000 to $999,999 | 84 (3.2%) | 31 (1.4%) |
| $1,000,000 or more | 37 (1.4%) | 29 (1.3%) |
| Total | 2,615 (100.0%) | 2,270 (100.0%) |
Household Income by Mortgage Status in Crawford County

| Household Income | Without Mortgage | With Mortgage |
| Less than $10,000 | 97 (3.7%) | 32 (1.4%) |
| $10,000 to $24,999 | 456 (17.4%) | 39 (1.7%) |
| $25,000 to $34,999 | 287 (11.0%) | 154 (6.8%) |
| $35,000 to $49,999 | 389 (14.9%) | 159 (7.0%) |
| $50,000 to $74,999 | 503 (19.2%) | 230 (10.1%) |
| $75,000 to $99,999 | 388 (14.8%) | 461 (20.3%) |
| $100,000 to $149,999 | 303 (11.6%) | 437 (19.3%) |
| $150,000 or more | 192 (7.3%) | 521 (23.0%) |
| Total | 2,615 (100.0%) | 2,270 (100.0%) |
Property Value to Household Income Ratio in Crawford County
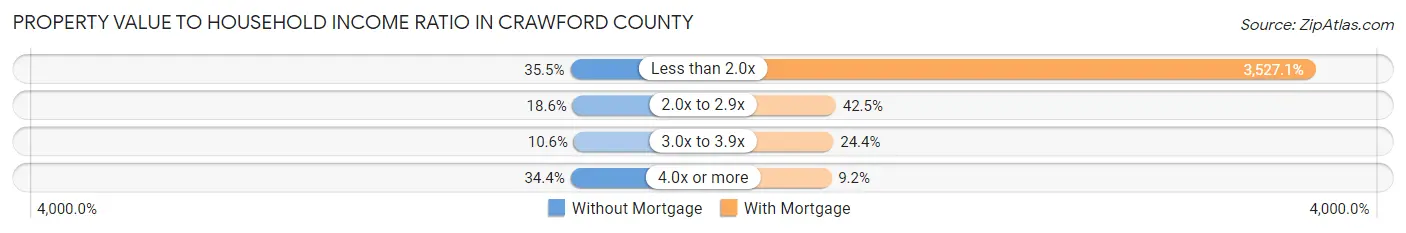
| Value-to-Income Ratio | Without Mortgage | With Mortgage |
| Less than 2.0x | 929 (35.5%) | 80,064 (3,527.0%) |
| 2.0x to 2.9x | 486 (18.6%) | 965 (42.5%) |
| 3.0x to 3.9x | 278 (10.6%) | 553 (24.4%) |
| 4.0x or more | 899 (34.4%) | 208 (9.2%) |
| Total | 2,615 (100.0%) | 2,270 (100.0%) |
Real Estate Taxes by Mortgage Status in Crawford County
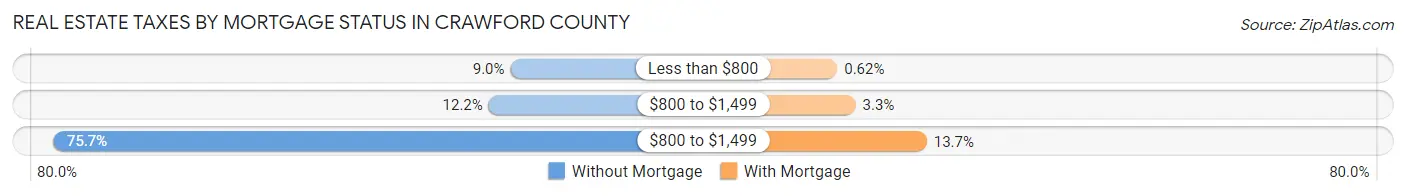
| Property Taxes | Without Mortgage | With Mortgage |
| Less than $800 | 236 (9.0%) | 14 (0.6%) |
| $800 to $1,499 | 319 (12.2%) | 75 (3.3%) |
| $800 to $1,499 | 1,980 (75.7%) | 311 (13.7%) |
| Total | 2,615 (100.0%) | 2,270 (100.0%) |
Health & Disability in Crawford County
Health Insurance Coverage by Age in Crawford County

| Age Bracket | With Coverage | Without Coverage |
| Under 6 Years | 942 (94.9%) | 51 (5.1%) |
| 6 to 18 Years | 2,201 (92.2%) | 187 (7.8%) |
| 19 to 25 Years | 824 (82.7%) | 173 (17.3%) |
| 26 to 34 Years | 1,157 (84.9%) | 206 (15.1%) |
| 35 to 44 Years | 1,414 (87.4%) | 204 (12.6%) |
| 45 to 54 Years | 1,598 (90.2%) | 174 (9.8%) |
| 55 to 64 Years | 2,282 (90.5%) | 240 (9.5%) |
| 65 to 74 Years | 2,251 (100.0%) | 0 (0.0%) |
| 75 Years and older | 1,506 (99.8%) | 3 (0.2%) |
| Total | 14,175 (92.0%) | 1,238 (8.0%) |
Health Insurance Coverage by Citizenship Status in Crawford County

| Citizenship Status | With Coverage | Without Coverage |
| Native Born | 942 (94.9%) | 51 (5.1%) |
| Foreign Born, Citizen | 2,201 (92.2%) | 187 (7.8%) |
| Foreign Born, not a Citizen | 824 (82.7%) | 173 (17.3%) |
Health Insurance Coverage by Household Income in Crawford County
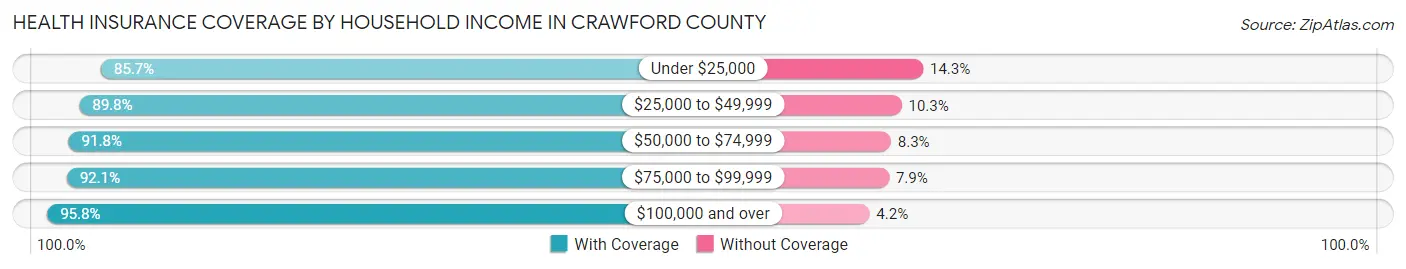
| Household Income | With Coverage | Without Coverage |
| Under $25,000 | 1,511 (85.7%) | 252 (14.3%) |
| $25,000 to $49,999 | 2,882 (89.7%) | 329 (10.2%) |
| $50,000 to $74,999 | 2,536 (91.7%) | 228 (8.3%) |
| $75,000 to $99,999 | 2,554 (92.1%) | 219 (7.9%) |
| $100,000 and over | 4,628 (95.8%) | 205 (4.2%) |
Public vs Private Health Insurance Coverage by Age in Crawford County
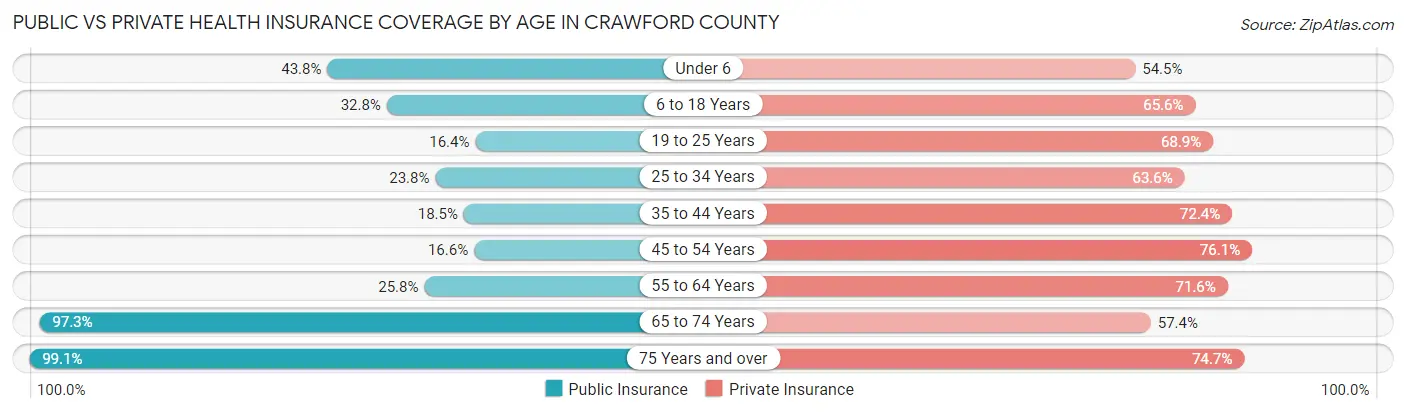
| Age Bracket | Public Insurance | Private Insurance |
| Under 6 | 435 (43.8%) | 541 (54.5%) |
| 6 to 18 Years | 783 (32.8%) | 1,567 (65.6%) |
| 19 to 25 Years | 163 (16.4%) | 687 (68.9%) |
| 25 to 34 Years | 324 (23.8%) | 867 (63.6%) |
| 35 to 44 Years | 299 (18.5%) | 1,172 (72.4%) |
| 45 to 54 Years | 294 (16.6%) | 1,349 (76.1%) |
| 55 to 64 Years | 651 (25.8%) | 1,806 (71.6%) |
| 65 to 74 Years | 2,189 (97.3%) | 1,291 (57.4%) |
| 75 Years and over | 1,496 (99.1%) | 1,127 (74.7%) |
| Total | 6,634 (43.0%) | 10,407 (67.5%) |
Disability Status by Sex by Age in Crawford County
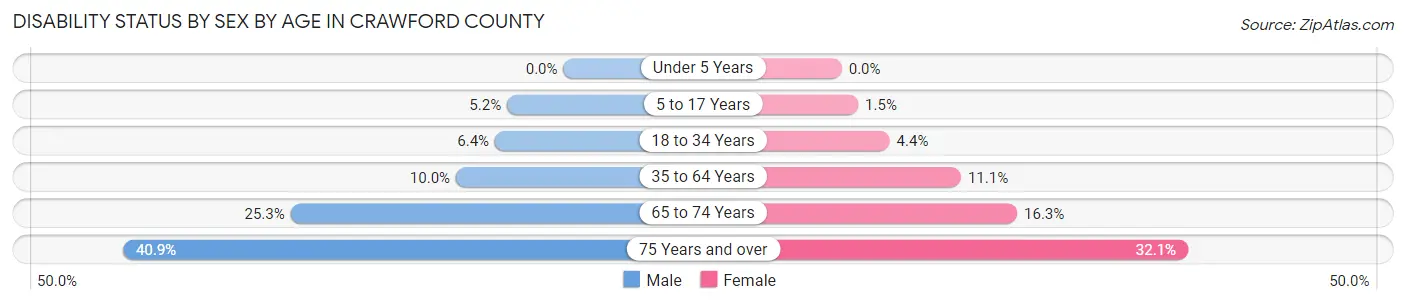
| Age Bracket | Male | Female |
| Under 5 Years | 0 (0.0%) | 0 (0.0%) |
| 5 to 17 Years | 65 (5.2%) | 17 (1.5%) |
| 18 to 34 Years | 87 (6.4%) | 54 (4.4%) |
| 35 to 64 Years | 292 (10.0%) | 330 (11.1%) |
| 65 to 74 Years | 293 (25.3%) | 178 (16.3%) |
| 75 Years and over | 291 (40.9%) | 256 (32.1%) |
Disability Class by Sex by Age in Crawford County
Disability Class: Hearing Difficulty
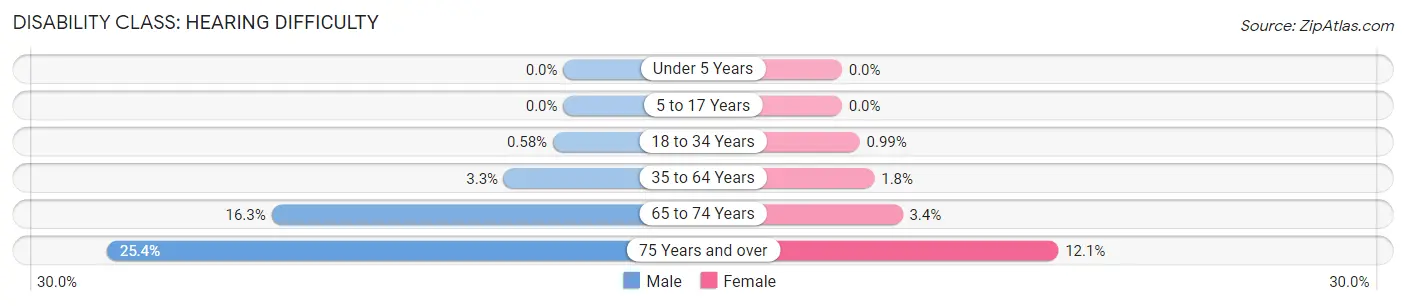
| Age Bracket | Male | Female |
| Under 5 Years | 0 (0.0%) | 0 (0.0%) |
| 5 to 17 Years | 0 (0.0%) | 0 (0.0%) |
| 18 to 34 Years | 8 (0.6%) | 12 (1.0%) |
| 35 to 64 Years | 97 (3.3%) | 54 (1.8%) |
| 65 to 74 Years | 188 (16.3%) | 37 (3.4%) |
| 75 Years and over | 181 (25.4%) | 96 (12.0%) |
Disability Class: Vision Difficulty

| Age Bracket | Male | Female |
| Under 5 Years | 0 (0.0%) | 0 (0.0%) |
| 5 to 17 Years | 8 (0.6%) | 0 (0.0%) |
| 18 to 34 Years | 9 (0.7%) | 4 (0.3%) |
| 35 to 64 Years | 31 (1.1%) | 68 (2.3%) |
| 65 to 74 Years | 64 (5.5%) | 11 (1.0%) |
| 75 Years and over | 25 (3.5%) | 46 (5.8%) |
Disability Class: Cognitive Difficulty
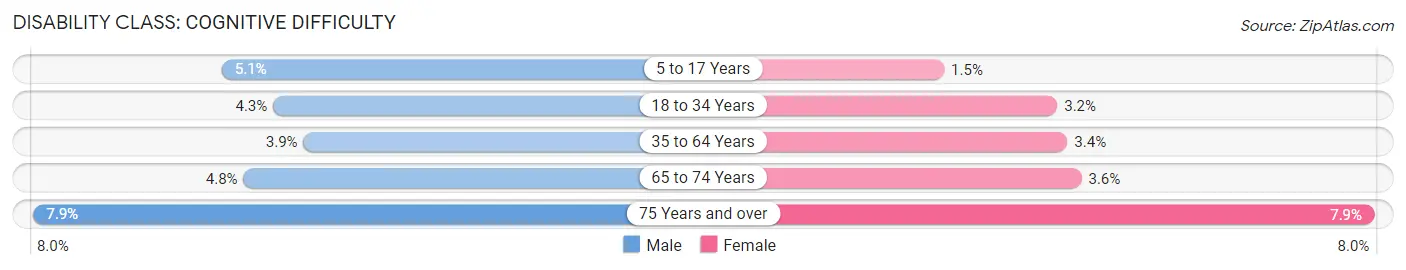
| Age Bracket | Male | Female |
| 5 to 17 Years | 63 (5.1%) | 17 (1.5%) |
| 18 to 34 Years | 59 (4.3%) | 39 (3.2%) |
| 35 to 64 Years | 113 (3.9%) | 100 (3.4%) |
| 65 to 74 Years | 55 (4.8%) | 39 (3.6%) |
| 75 Years and over | 56 (7.9%) | 63 (7.9%) |
Disability Class: Ambulatory Difficulty
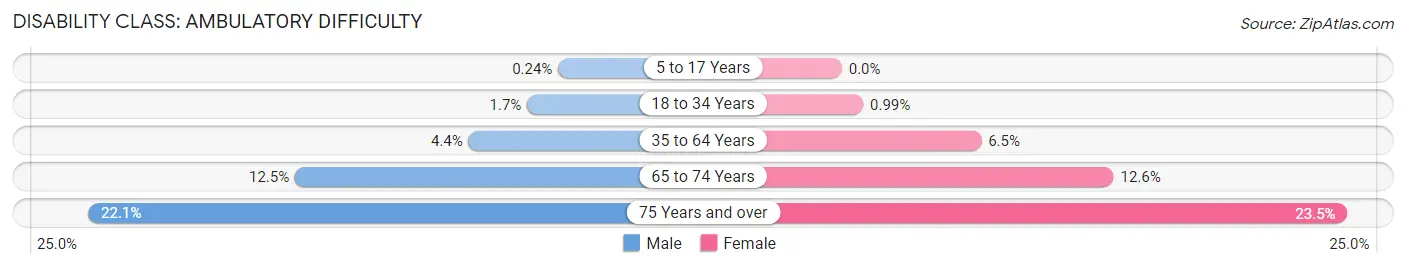
| Age Bracket | Male | Female |
| 5 to 17 Years | 3 (0.2%) | 0 (0.0%) |
| 18 to 34 Years | 23 (1.7%) | 12 (1.0%) |
| 35 to 64 Years | 129 (4.4%) | 193 (6.5%) |
| 65 to 74 Years | 144 (12.4%) | 138 (12.6%) |
| 75 Years and over | 157 (22.1%) | 187 (23.5%) |
Disability Class: Self-Care Difficulty

| Age Bracket | Male | Female |
| 5 to 17 Years | 21 (1.7%) | 0 (0.0%) |
| 18 to 34 Years | 12 (0.9%) | 0 (0.0%) |
| 35 to 64 Years | 58 (2.0%) | 42 (1.4%) |
| 65 to 74 Years | 17 (1.5%) | 45 (4.1%) |
| 75 Years and over | 77 (10.8%) | 61 (7.6%) |
Technology Access in Crawford County
Computing Device Access in Crawford County

| Device Type | # Households | % Households |
| Desktop or Laptop | 4,775 | 73.0% |
| Smartphone | 4,910 | 75.0% |
| Tablet | 3,158 | 48.3% |
| No Computing Device | 815 | 12.4% |
| Total | 6,544 | 100.0% |
Internet Access in Crawford County
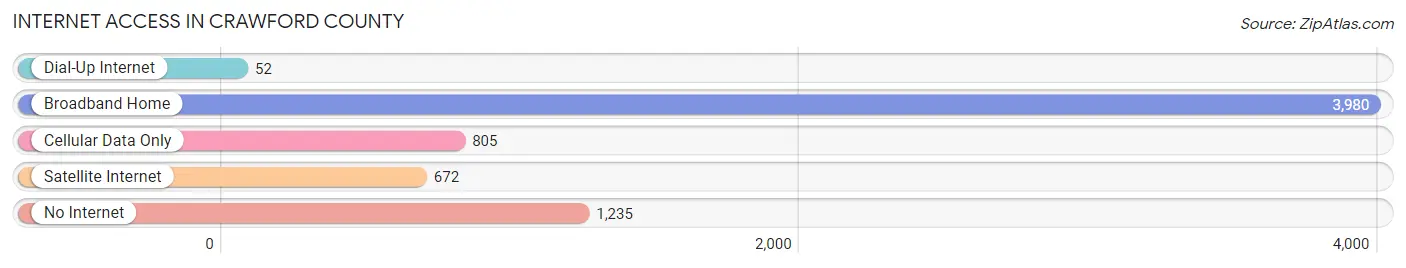
| Internet Type | # Households | % Households |
| Dial-Up Internet | 52 | 0.8% |
| Broadband Home | 3,980 | 60.8% |
| Cellular Data Only | 805 | 12.3% |
| Satellite Internet | 672 | 10.3% |
| No Internet | 1,235 | 18.9% |
| Total | 6,544 | 100.0% |
Crawford County Summary
Crawford County, Wisconsin is located in the southwestern corner of the state, bordered by the Mississippi River to the west and the Wisconsin River to the east. The county seat is Prairie du Chien, and the county is home to a population of 16,644 people, according to the 2010 census.
History
Crawford County was established in 1818, and was named after William H. Crawford, who was the Secretary of War under President James Madison. The county was originally part of the Michigan Territory, and was part of the Wisconsin Territory when it was created in 1836. The county was officially organized in 1839.
The first settlers in the area were French fur traders, who established trading posts in the area in the late 1700s. The first permanent settlers arrived in the early 1800s, and the county was officially organized in 1839.
The county was home to several Native American tribes, including the Ho-Chunk, Menominee, and Ojibwe. The Ho-Chunk were the first to be removed from the area, in 1837, followed by the Menominee in 1848 and the Ojibwe in 1854.
Geography
Crawford County is located in the southwestern corner of Wisconsin, bordered by the Mississippi River to the west and the Wisconsin River to the east. The county covers an area of 845 square miles, and is home to a population of 16,644 people, according to the 2010 census.
The county is mostly rural, with the majority of the population living in small towns and villages. The largest city in the county is Prairie du Chien, which is the county seat. Other cities in the county include Gays Mills, Soldiers Grove, and Seneca.
The county is home to several state parks, including Wyalusing State Park, Perrot State Park, and the Kickapoo Valley Reserve. The county is also home to the Mississippi River, which is a popular destination for fishing, boating, and other recreational activities.
Economy
Crawford County is largely rural, and the economy is largely based on agriculture. The county is home to several dairy farms, as well as beef and poultry farms. The county is also home to several wineries, and is a popular destination for wine tours.
The county is also home to several manufacturing companies, including a paper mill in Prairie du Chien, a cheese factory in Gays Mills, and a furniture factory in Seneca. The county is also home to several tourist attractions, including the Wyalusing State Park, the Kickapoo Valley Reserve, and the Mississippi River.
Demographics
According to the 2010 census, Crawford County has a population of 16,644 people. The population is largely white (96.3%), with small percentages of African American (1.2%), Native American (0.7%), Asian (0.3%), and other races (1.5%).
The median household income in the county is $45,845, and the median age is 44.7 years. The county is home to a large number of veterans, with 8.3% of the population having served in the military.
Conclusion
Crawford County, Wisconsin is a rural county located in the southwestern corner of the state. The county is home to a population of 16,644 people, and is largely agricultural, with a strong manufacturing sector. The county is home to several state parks, and is a popular destination for fishing, boating, and other recreational activities.
Common Questions
What is the Total Population of Crawford County?
Total Population of Crawford County is 16,123.
What is the Total Male Population of Crawford County?
Total Male Population of Crawford County is 8,405.
What is the Total Female Population of Crawford County?
Total Female Population of Crawford County is 7,718.
What is the Ratio of Males per 100 Females in Crawford County?
There are 108.90 Males per 100 Females in Crawford County.
What is the Ratio of Females per 100 Males in Crawford County?
There are 91.83 Females per 100 Males in Crawford County.
What is the Median Population Age in Crawford County?
Median Population Age in Crawford County is 47.2 Years.
What is the Average Family Size in Crawford County
Average Family Size in Crawford County is 2.9 People.
What is the Average Household Size in Crawford County
Average Household Size in Crawford County is 2.4 People.
What is Per Capita Income in Crawford County?
Per Capita income in Crawford County is $32,129.
What is the Median Family Income in Crawford County?
Median Family Income in Crawford County is $74,733.
What is the Median Household income in Crawford County?
Median Household Income in Crawford County is $60,823.
What is Income or Wage Gap in Crawford County?
Income or Wage Gap in Crawford County is 15.4%.
Women in Crawford County earn 84.6 cents for every dollar earned by a man.
What is Family Income Deficit in Crawford County?
Family Income Deficit in Crawford County is $10,247.
Families that are below poverty line in Crawford County earn $10,247 less on average than the poverty threshold level.
What is Inequality or Gini Index in Crawford County?
Inequality or Gini Index in Crawford County is 0.42.
How Large is the Labor Force in Crawford County?
There are 7,305 People in the Labor Forcein in Crawford County.
What is the Percentage of People in the Labor Force in Crawford County?
54.6% of People are in the Labor Force in Crawford County.
What is the Unemployment Rate in Crawford County?
Unemployment Rate in Crawford County is 2.8%.