Chippewa County, WI
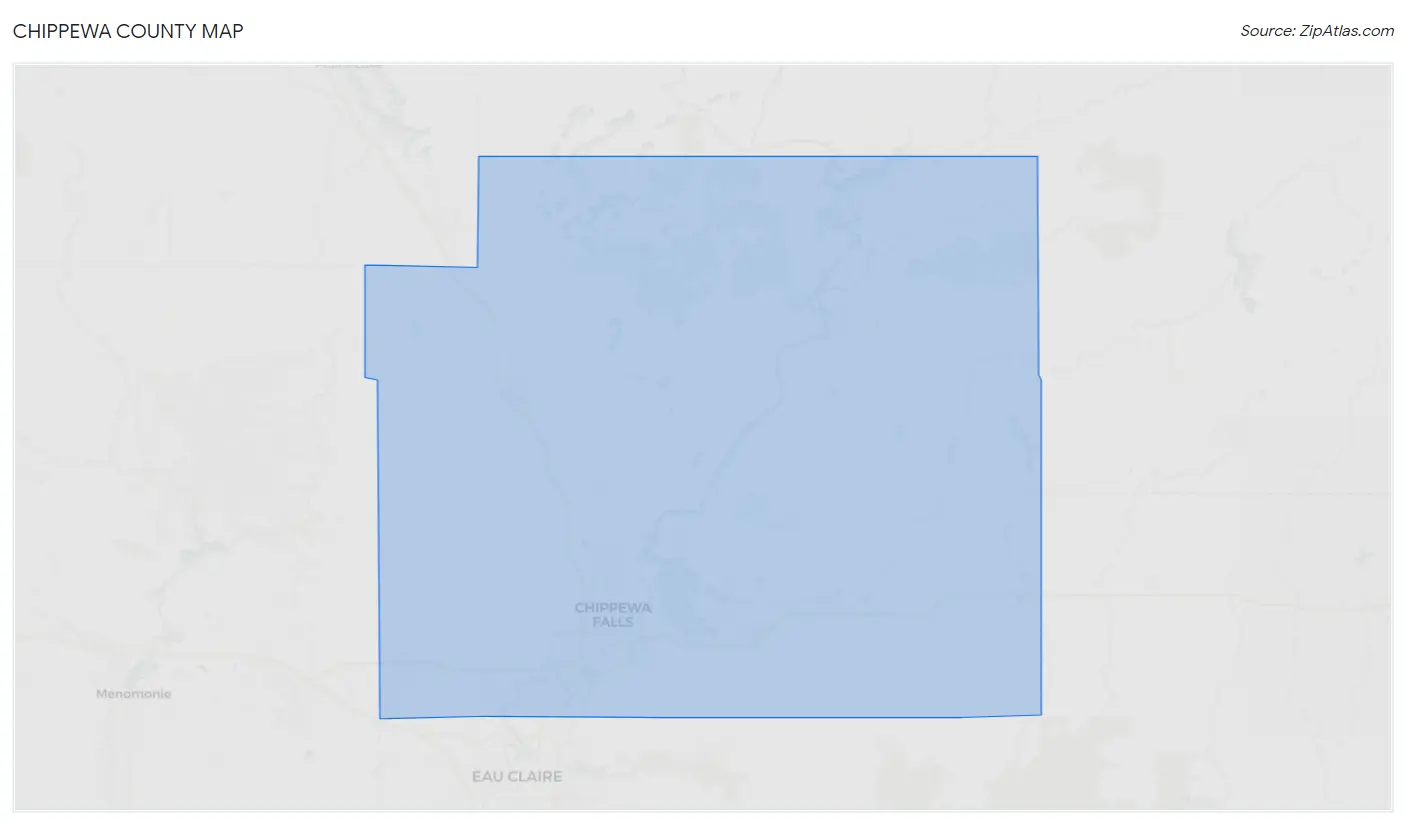
Chippewa County Map
Chippewa County Overview
66,254
TOTAL POPULATION
34,577
MALE POPULATION
31,677
FEMALE POPULATION
109.15
MALES / 100 FEMALES
91.61
FEMALES / 100 MALES
41.4
MEDIAN AGE
3.0
AVG FAMILY SIZE
2.4
AVG HOUSEHOLD SIZE
$36,180
PER CAPITA INCOME
$86,600
AVG FAMILY INCOME
$69,815
AVG HOUSEHOLD INCOME
28.1%
WAGE / INCOME GAP [ % ]
71.9¢/ $1
WAGE / INCOME GAP [ $ ]
$11,216
FAMILY INCOME DEFICIT
0.42
INEQUALITY / GINI INDEX
34,120
LABOR FORCE [ PEOPLE ]
63.7%
PERCENT IN LABOR FORCE
3.0%
UNEMPLOYMENT RATE
Race in Chippewa County
The most populous races in Chippewa County are White / Caucasian (62,057 | 93.7%), Two or more Races (1,859 | 2.8%), and Hispanic or Latino (1,257 | 1.9%).

| Race | # Population | % Population |
| Asian | 940 | 1.4% |
| Black / African American | 1,011 | 1.5% |
| Hawaiian / Pacific | 1 | 0.0% |
| Hispanic or Latino | 1,257 | 1.9% |
| Native / Alaskan | 210 | 0.3% |
| White / Caucasian | 62,057 | 93.7% |
| Two or more Races | 1,859 | 2.8% |
| Some other Race | 176 | 0.3% |
| Total | 66,254 | 100.0% |
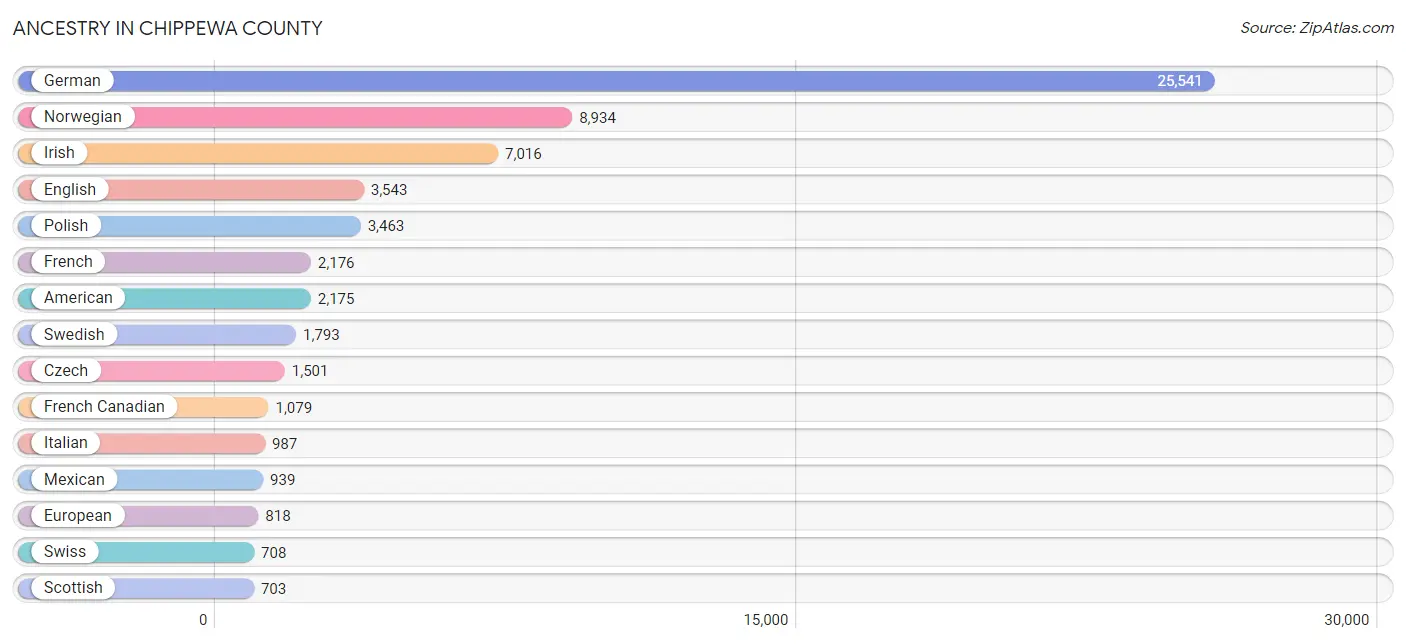
Ancestry in Chippewa County
The most populous ancestries reported in Chippewa County are German (25,541 | 38.6%), Norwegian (8,934 | 13.5%), Irish (7,016 | 10.6%), English (3,543 | 5.3%), and Polish (3,463 | 5.2%), together accounting for 73.2% of all Chippewa County residents.
| Ancestry | # Population | % Population |
| African | 90 | 0.1% |
| Alaska Native | 28 | 0.0% |
| Albanian | 9 | 0.0% |
| Aleut | 11 | 0.0% |
| American | 2,175 | 3.3% |
| Arab | 3 | 0.0% |
| Armenian | 13 | 0.0% |
| Australian | 2 | 0.0% |
| Austrian | 206 | 0.3% |
| Bangladeshi | 603 | 0.9% |
| Belgian | 179 | 0.3% |
| Bhutanese | 38 | 0.1% |
| Blackfeet | 17 | 0.0% |
| Brazilian | 58 | 0.1% |
| British | 123 | 0.2% |
| Bulgarian | 39 | 0.1% |
| Burmese | 68 | 0.1% |
| Canadian | 227 | 0.3% |
| Central American | 18 | 0.0% |
| Cherokee | 40 | 0.1% |
| Cheyenne | 2 | 0.0% |
| Chippewa | 141 | 0.2% |
| Costa Rican | 3 | 0.0% |
| Cree | 2 | 0.0% |
| Croatian | 49 | 0.1% |
| Cuban | 48 | 0.1% |
| Czech | 1,501 | 2.3% |
| Czechoslovakian | 55 | 0.1% |
| Danish | 468 | 0.7% |
| Dutch | 686 | 1.0% |
| Eastern European | 104 | 0.2% |
| English | 3,543 | 5.3% |
| Ethiopian | 8 | 0.0% |
| European | 818 | 1.2% |
| Finnish | 176 | 0.3% |
| French | 2,176 | 3.3% |
| French American Indian | 10 | 0.0% |
| French Canadian | 1,079 | 1.6% |
| German | 25,541 | 38.6% |
| Greek | 164 | 0.3% |
| Guatemalan | 15 | 0.0% |
| Hungarian | 78 | 0.1% |
| Indian (Asian) | 153 | 0.2% |
| Inupiat | 20 | 0.0% |
| Irish | 7,016 | 10.6% |
| Iroquois | 7 | 0.0% |
| Italian | 987 | 1.5% |
| Jamaican | 10 | 0.0% |
| Kiowa | 2 | 0.0% |
| Korean | 266 | 0.4% |
| Laotian | 64 | 0.1% |
| Latvian | 43 | 0.1% |
| Lithuanian | 208 | 0.3% |
| Lumbee | 4 | 0.0% |
| Luxembourger | 48 | 0.1% |
| Malaysian | 3 | 0.0% |
| Menominee | 30 | 0.1% |
| Mexican | 939 | 1.4% |
| Mexican American Indian | 1 | 0.0% |
| Mongolian | 35 | 0.1% |
| Navajo | 5 | 0.0% |
| Nigerian | 170 | 0.3% |
| Northern European | 28 | 0.0% |
| Norwegian | 8,934 | 13.5% |
| Pakistani | 7 | 0.0% |
| Palestinian | 1 | 0.0% |
| Pennsylvania German | 112 | 0.2% |
| Polish | 3,463 | 5.2% |
| Portuguese | 12 | 0.0% |
| Puerto Rican | 124 | 0.2% |
| Romanian | 18 | 0.0% |
| Russian | 199 | 0.3% |
| Scandinavian | 326 | 0.5% |
| Scotch-Irish | 243 | 0.4% |
| Scottish | 703 | 1.1% |
| Serbian | 72 | 0.1% |
| Sioux | 71 | 0.1% |
| Slavic | 17 | 0.0% |
| Slovak | 114 | 0.2% |
| Slovene | 27 | 0.0% |
| South American | 25 | 0.0% |
| Spaniard | 11 | 0.0% |
| Spanish | 3 | 0.0% |
| Sri Lankan | 37 | 0.1% |
| Subsaharan African | 280 | 0.4% |
| Swedish | 1,793 | 2.7% |
| Swiss | 708 | 1.1% |
| Thai | 110 | 0.2% |
| Tongan | 3 | 0.0% |
| Ukrainian | 116 | 0.2% |
| Uruguayan | 21 | 0.0% |
| Venezuelan | 4 | 0.0% |
| Welsh | 276 | 0.4% |
| Yugoslavian | 18 | 0.0% | View All 94 Rows |
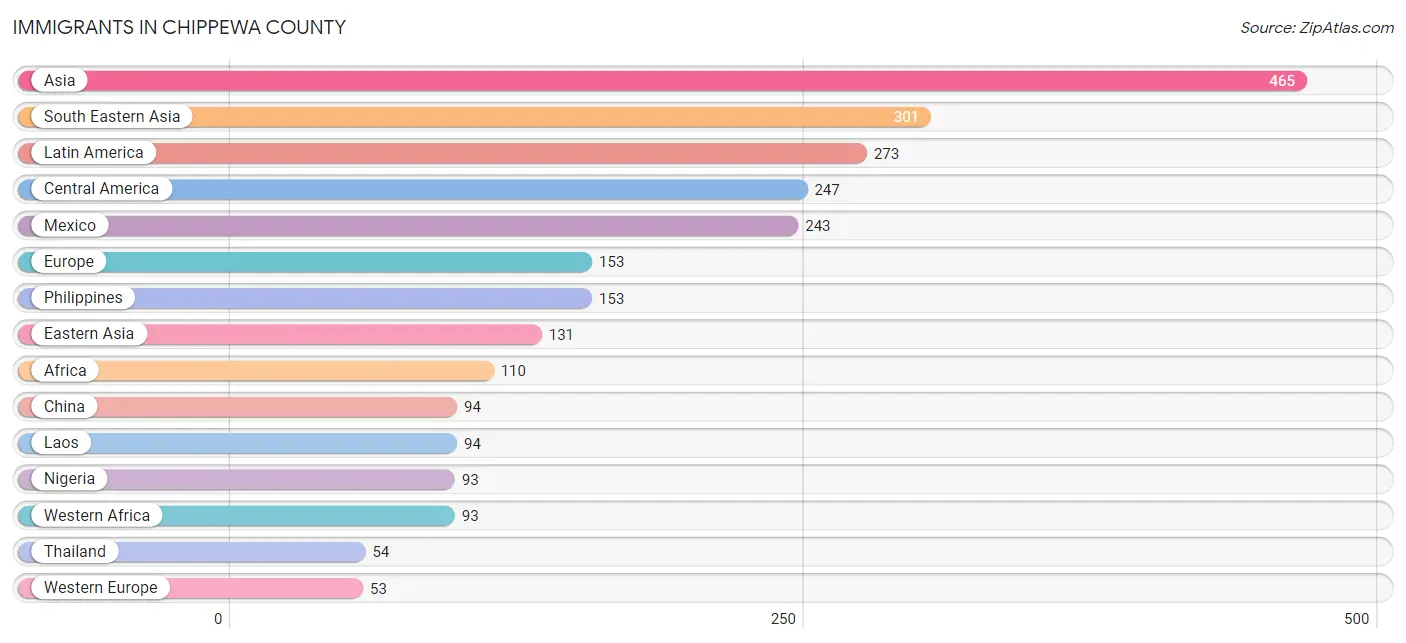
Immigrants in Chippewa County
The most numerous immigrant groups reported in Chippewa County came from Asia (465 | 0.7%), South Eastern Asia (301 | 0.4%), Latin America (273 | 0.4%), Central America (247 | 0.4%), and Mexico (243 | 0.4%), together accounting for 2.3% of all Chippewa County residents.
| Immigration Origin | # Population | % Population |
| Africa | 110 | 0.2% |
| Asia | 465 | 0.7% |
| Belgium | 1 | 0.0% |
| Brazil | 26 | 0.0% |
| Canada | 48 | 0.1% |
| Central America | 247 | 0.4% |
| China | 94 | 0.1% |
| Costa Rica | 3 | 0.0% |
| Eastern Africa | 17 | 0.0% |
| Eastern Asia | 131 | 0.2% |
| Eastern Europe | 50 | 0.1% |
| England | 2 | 0.0% |
| Ethiopia | 6 | 0.0% |
| Europe | 153 | 0.2% |
| Germany | 46 | 0.1% |
| Greece | 25 | 0.0% |
| Honduras | 1 | 0.0% |
| India | 27 | 0.0% |
| Ireland | 3 | 0.0% |
| Kazakhstan | 6 | 0.0% |
| Korea | 37 | 0.1% |
| Laos | 94 | 0.1% |
| Latin America | 273 | 0.4% |
| Mexico | 243 | 0.4% |
| Netherlands | 6 | 0.0% |
| Nigeria | 93 | 0.1% |
| North Macedonia | 5 | 0.0% |
| Northern Europe | 25 | 0.0% |
| Philippines | 153 | 0.2% |
| Poland | 2 | 0.0% |
| Romania | 11 | 0.0% |
| Russia | 21 | 0.0% |
| Scotland | 3 | 0.0% |
| South America | 26 | 0.0% |
| South Central Asia | 33 | 0.1% |
| South Eastern Asia | 301 | 0.4% |
| Southern Europe | 25 | 0.0% |
| Thailand | 54 | 0.1% |
| Ukraine | 9 | 0.0% |
| Western Africa | 93 | 0.1% |
| Western Europe | 53 | 0.1% | View All 41 Rows |
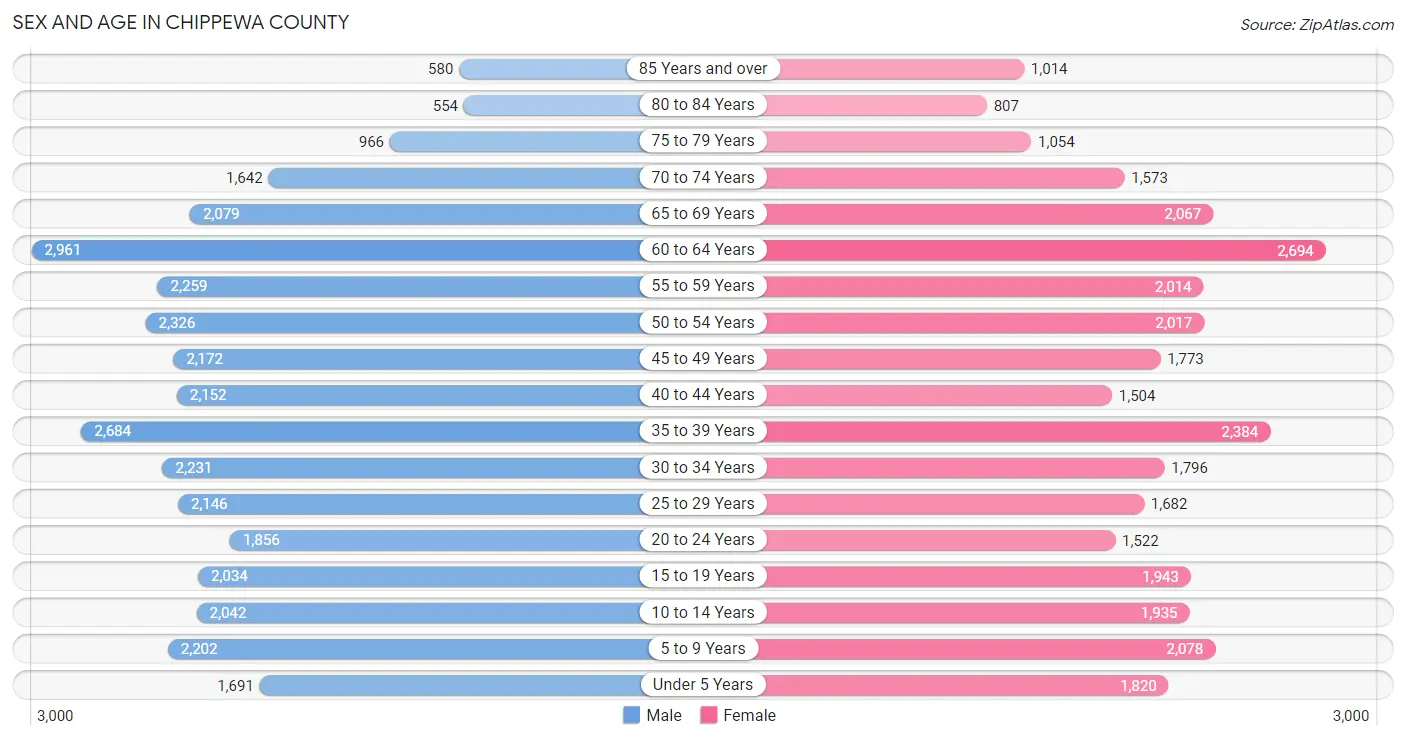
Sex and Age in Chippewa County
Sex and Age in Chippewa County
The most populous age groups in Chippewa County are 60 to 64 Years (2,961 | 8.6%) for men and 60 to 64 Years (2,694 | 8.5%) for women.
| Age Bracket | Male | Female |
| Under 5 Years | 1,691 (4.9%) | 1,820 (5.8%) |
| 5 to 9 Years | 2,202 (6.4%) | 2,078 (6.6%) |
| 10 to 14 Years | 2,042 (5.9%) | 1,935 (6.1%) |
| 15 to 19 Years | 2,034 (5.9%) | 1,943 (6.1%) |
| 20 to 24 Years | 1,856 (5.4%) | 1,522 (4.8%) |
| 25 to 29 Years | 2,146 (6.2%) | 1,682 (5.3%) |
| 30 to 34 Years | 2,231 (6.5%) | 1,796 (5.7%) |
| 35 to 39 Years | 2,684 (7.8%) | 2,384 (7.5%) |
| 40 to 44 Years | 2,152 (6.2%) | 1,504 (4.8%) |
| 45 to 49 Years | 2,172 (6.3%) | 1,773 (5.6%) |
| 50 to 54 Years | 2,326 (6.7%) | 2,017 (6.4%) |
| 55 to 59 Years | 2,259 (6.5%) | 2,014 (6.4%) |
| 60 to 64 Years | 2,961 (8.6%) | 2,694 (8.5%) |
| 65 to 69 Years | 2,079 (6.0%) | 2,067 (6.5%) |
| 70 to 74 Years | 1,642 (4.8%) | 1,573 (5.0%) |
| 75 to 79 Years | 966 (2.8%) | 1,054 (3.3%) |
| 80 to 84 Years | 554 (1.6%) | 807 (2.5%) |
| 85 Years and over | 580 (1.7%) | 1,014 (3.2%) |
| Total | 34,577 (100.0%) | 31,677 (100.0%) |
Families and Households in Chippewa County
Median Family Size in Chippewa County
The median family size in Chippewa County is 2.99 persons per family, with married-couple families (13,576 | 81.1%) accounting for the largest median family size of 3.01 persons per family. On the other hand, single male/father families (1,025 | 6.1%) represent the smallest median family size with 2.89 persons per family.
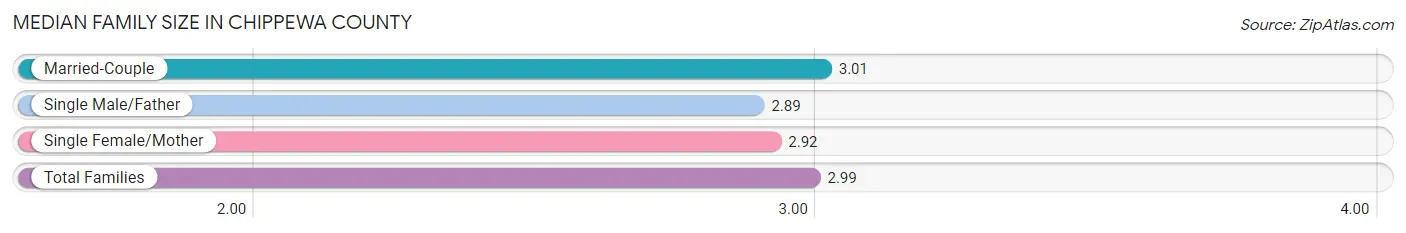
| Family Type | # Families | Family Size |
| Married-Couple | 13,576 (81.1%) | 3.01 |
| Single Male/Father | 1,025 (6.1%) | 2.89 |
| Single Female/Mother | 2,131 (12.7%) | 2.92 |
| Total Families | 16,732 (100.0%) | 2.99 |
Median Household Size in Chippewa County
The median household size in Chippewa County is 2.41 persons per household, with single female/mother households (2,131 | 8.1%) accounting for the largest median household size of 3.37 persons per household. non-family households (9,594 | 36.4%) represent the smallest median household size with 1.23 persons per household.
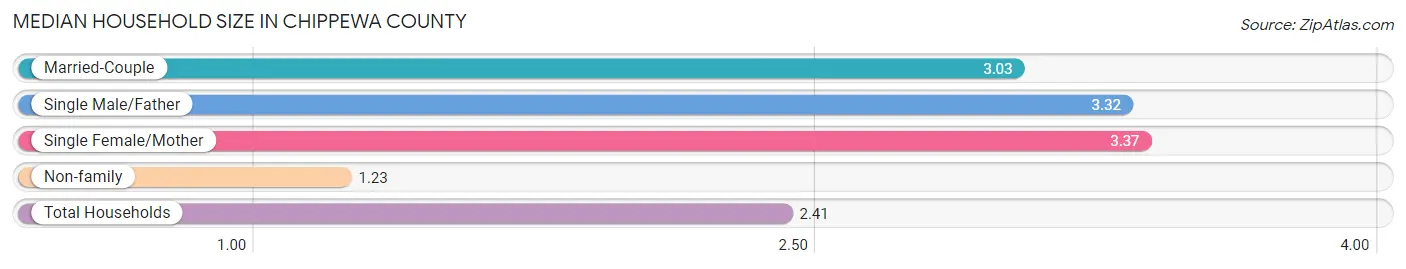
| Household Type | # Households | Household Size |
| Married-Couple | 13,576 (51.6%) | 3.03 |
| Single Male/Father | 1,025 (3.9%) | 3.32 |
| Single Female/Mother | 2,131 (8.1%) | 3.37 |
| Non-family | 9,594 (36.4%) | 1.23 |
| Total Households | 26,326 (100.0%) | 2.41 |
Household Size by Marriage Status in Chippewa County
Out of a total of 26,326 households in Chippewa County, 16,732 (63.6%) are family households, while 9,594 (36.4%) are nonfamily households. The most numerous type of family households are 2-person households, comprising 8,340, and the most common type of nonfamily households are 1-person households, comprising 7,743.
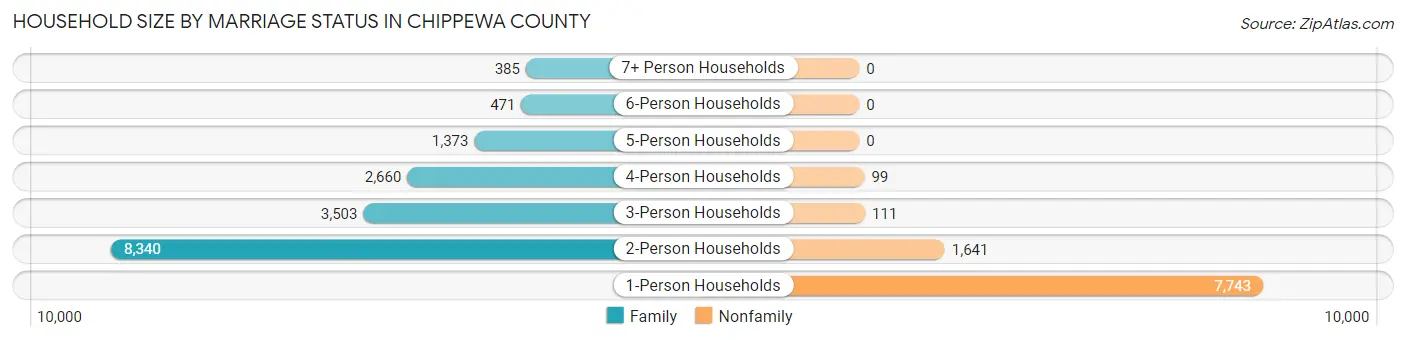
| Household Size | Family Households | Nonfamily Households |
| 1-Person Households | - | 7,743 (29.4%) |
| 2-Person Households | 8,340 (31.7%) | 1,641 (6.2%) |
| 3-Person Households | 3,503 (13.3%) | 111 (0.4%) |
| 4-Person Households | 2,660 (10.1%) | 99 (0.4%) |
| 5-Person Households | 1,373 (5.2%) | 0 (0.0%) |
| 6-Person Households | 471 (1.8%) | 0 (0.0%) |
| 7+ Person Households | 385 (1.5%) | 0 (0.0%) |
| Total | 16,732 (63.6%) | 9,594 (36.4%) |
Female Fertility in Chippewa County
Fertility by Age in Chippewa County
Average fertility rate in Chippewa County is 62.0 births per 1,000 women. Women in the age bracket of 20 to 34 years have the highest fertility rate with 112.0 births per 1,000 women. Women in the age bracket of 20 to 34 years acount for 70.0% of all women with births.
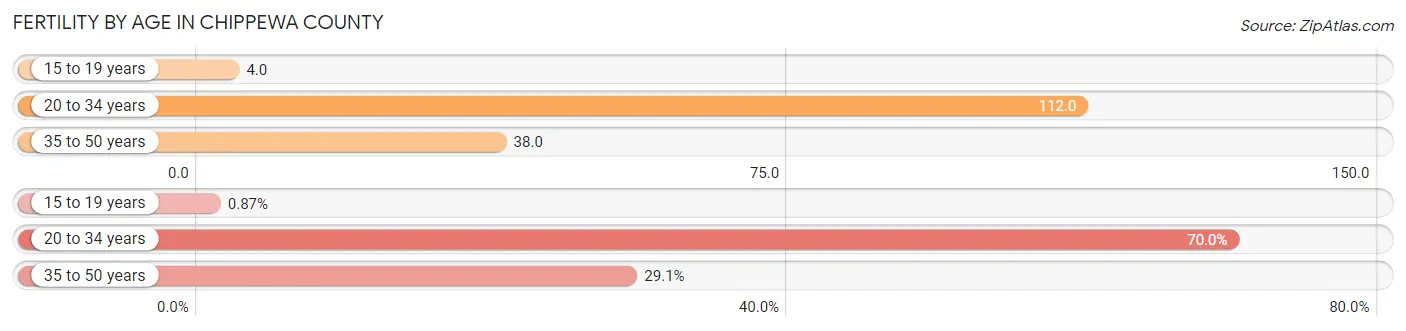
| Age Bracket | Women with Births | Births / 1,000 Women |
| 15 to 19 years | 7 (0.9%) | 4.0 |
| 20 to 34 years | 562 (70.0%) | 112.0 |
| 35 to 50 years | 234 (29.1%) | 38.0 |
| Total | 803 (100.0%) | 62.0 |
Fertility by Age by Marriage Status in Chippewa County
84.9% of women with births (803) in Chippewa County are married. The highest percentage of unmarried women with births falls into 15 to 19 years age bracket with 100.0% of them unmarried at the time of birth, while the lowest percentage of unmarried women with births belong to 35 to 50 years age bracket with 4.7% of them unmarried.
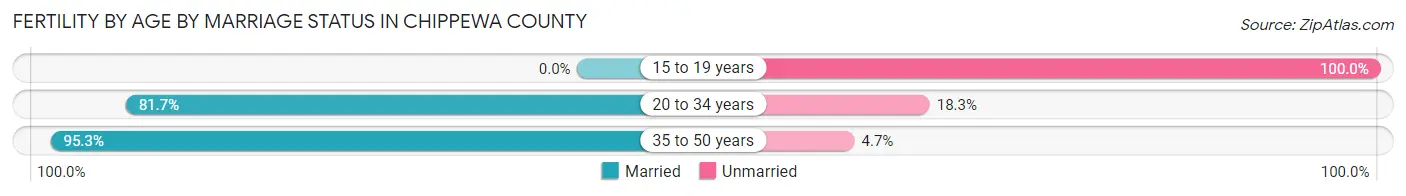
| Age Bracket | Married | Unmarried |
| 15 to 19 years | 0 (0.0%) | 7 (100.0%) |
| 20 to 34 years | 459 (81.7%) | 103 (18.3%) |
| 35 to 50 years | 223 (95.3%) | 11 (4.7%) |
| Total | 682 (84.9%) | 121 (15.1%) |
Fertility by Education in Chippewa County
Average fertility rate in Chippewa County is 62.0 births per 1,000 women. Women with the education attainment of bachelor's degree have the highest fertility rate of 125.0 births per 1,000 women, while women with the education attainment of less than high school have the lowest fertility at 32.0 births per 1,000 women. Women with the education attainment of bachelor's degree represent 40.4% of all women with births.
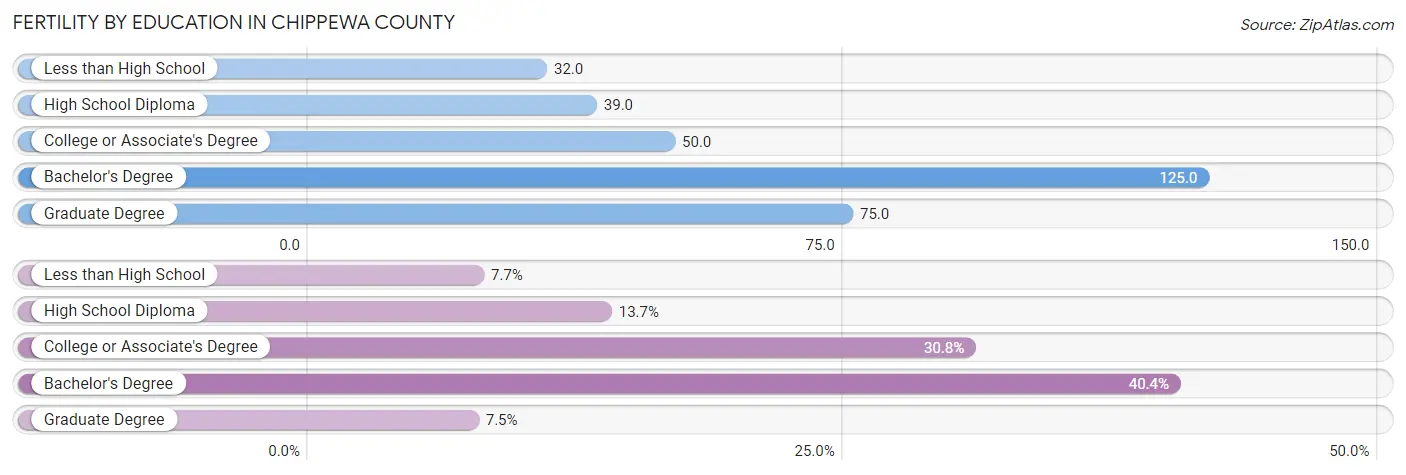
| Educational Attainment | Women with Births | Births / 1,000 Women |
| Less than High School | 62 (7.7%) | 32.0 |
| High School Diploma | 110 (13.7%) | 39.0 |
| College or Associate's Degree | 247 (30.8%) | 50.0 |
| Bachelor's Degree | 324 (40.4%) | 125.0 |
| Graduate Degree | 60 (7.5%) | 75.0 |
| Total | 803 (100.0%) | 62.0 |
Fertility by Education by Marriage Status in Chippewa County
15.1% of women with births in Chippewa County are unmarried. Women with the educational attainment of graduate degree are most likely to be married with 100.0% of them married at childbirth, while women with the educational attainment of less than high school are least likely to be married with 48.4% of them unmarried at childbirth.
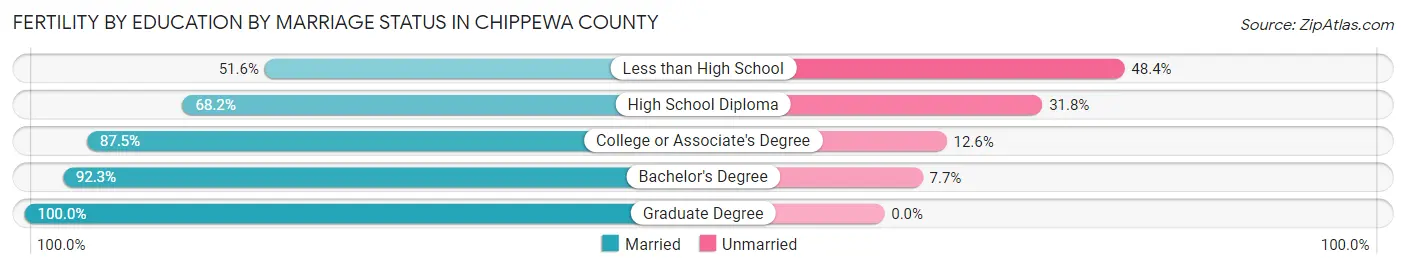
| Educational Attainment | Married | Unmarried |
| Less than High School | 32 (51.6%) | 30 (48.4%) |
| High School Diploma | 75 (68.2%) | 35 (31.8%) |
| College or Associate's Degree | 216 (87.5%) | 31 (12.6%) |
| Bachelor's Degree | 299 (92.3%) | 25 (7.7%) |
| Graduate Degree | 60 (100.0%) | 0 (0.0%) |
| Total | 682 (84.9%) | 121 (15.1%) |
Income in Chippewa County
Income Overview in Chippewa County
Per Capita Income in Chippewa County is $36,180, while median incomes of families and households are $86,600 and $69,815 respectively.
| Characteristic | Number | Measure |
| Per Capita Income | 66,254 | $36,180 |
| Median Family Income | 16,732 | $86,600 |
| Mean Family Income | 16,732 | $104,230 |
| Median Household Income | 26,326 | $69,815 |
| Mean Household Income | 26,326 | $88,362 |
| Income Deficit | 16,732 | $11,216 |
| Wage / Income Gap (%) | 66,254 | 28.10% |
| Wage / Income Gap ($) | 66,254 | 71.90¢ per $1 |
| Gini / Inequality Index | 66,254 | 0.42 |
Earnings by Sex in Chippewa County
Average Earnings in Chippewa County are $40,049, $47,427 for men and $34,101 for women, a difference of 28.1%.
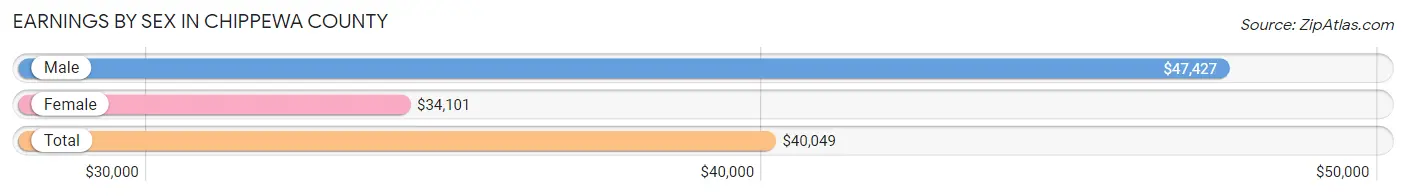
| Sex | Number | Average Earnings |
| Male | 20,089 (55.1%) | $47,427 |
| Female | 16,386 (44.9%) | $34,101 |
| Total | 36,475 (100.0%) | $40,049 |
Earnings by Sex by Income Bracket in Chippewa County
The most common earnings brackets in Chippewa County are $75,000 to $99,999 for men (2,528 | 12.6%) and $30,000 to $34,999 for women (1,414 | 8.6%).
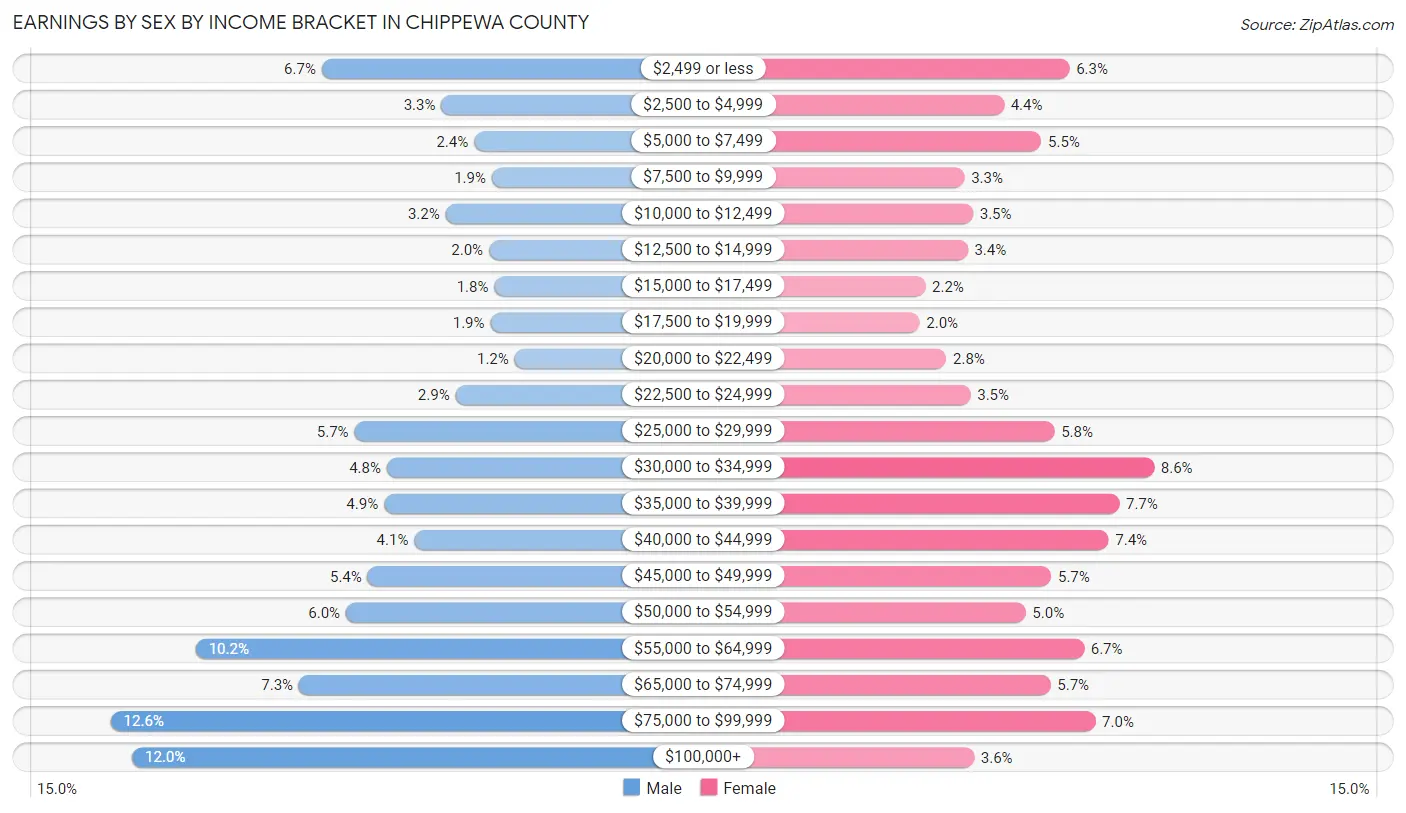
| Income | Male | Female |
| $2,499 or less | 1,335 (6.7%) | 1,024 (6.2%) |
| $2,500 to $4,999 | 660 (3.3%) | 722 (4.4%) |
| $5,000 to $7,499 | 476 (2.4%) | 894 (5.5%) |
| $7,500 to $9,999 | 375 (1.9%) | 541 (3.3%) |
| $10,000 to $12,499 | 636 (3.2%) | 580 (3.5%) |
| $12,500 to $14,999 | 391 (1.9%) | 556 (3.4%) |
| $15,000 to $17,499 | 361 (1.8%) | 360 (2.2%) |
| $17,500 to $19,999 | 384 (1.9%) | 335 (2.0%) |
| $20,000 to $22,499 | 248 (1.2%) | 457 (2.8%) |
| $22,500 to $24,999 | 581 (2.9%) | 569 (3.5%) |
| $25,000 to $29,999 | 1,152 (5.7%) | 956 (5.8%) |
| $30,000 to $34,999 | 969 (4.8%) | 1,414 (8.6%) |
| $35,000 to $39,999 | 985 (4.9%) | 1,253 (7.6%) |
| $40,000 to $44,999 | 813 (4.1%) | 1,204 (7.3%) |
| $45,000 to $49,999 | 1,076 (5.4%) | 941 (5.7%) |
| $50,000 to $54,999 | 1,200 (6.0%) | 823 (5.0%) |
| $55,000 to $64,999 | 2,048 (10.2%) | 1,091 (6.7%) |
| $65,000 to $74,999 | 1,464 (7.3%) | 937 (5.7%) |
| $75,000 to $99,999 | 2,528 (12.6%) | 1,144 (7.0%) |
| $100,000+ | 2,407 (12.0%) | 585 (3.6%) |
| Total | 20,089 (100.0%) | 16,386 (100.0%) |
Earnings by Sex by Educational Attainment in Chippewa County
Average earnings in Chippewa County are $53,202 for men and $38,440 for women, a difference of 27.8%. Men with an educational attainment of graduate degree enjoy the highest average annual earnings of $77,185, while those with less than high school education earn the least with $40,096. Women with an educational attainment of graduate degree earn the most with the average annual earnings of $66,058, while those with less than high school education have the smallest earnings of $24,646.
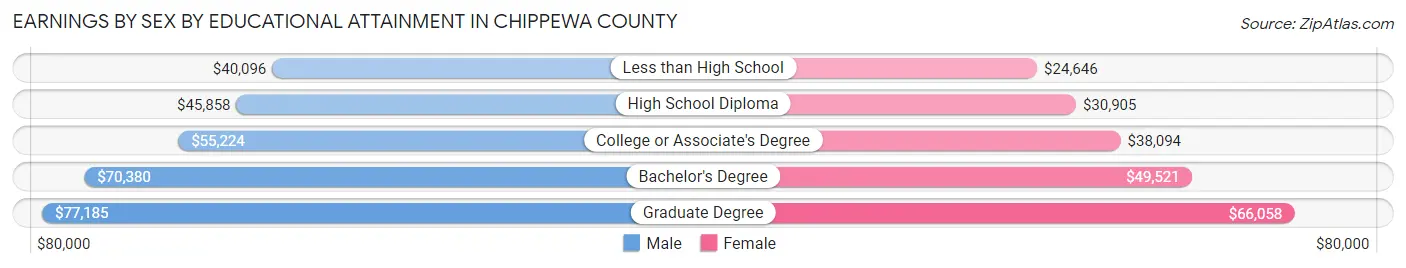
| Educational Attainment | Male Income | Female Income |
| Less than High School | $40,096 | $24,646 |
| High School Diploma | $45,858 | $30,905 |
| College or Associate's Degree | $55,224 | $38,094 |
| Bachelor's Degree | $70,380 | $49,521 |
| Graduate Degree | $77,185 | $66,058 |
| Total | $53,202 | $38,440 |
Family Income in Chippewa County
Family Income Brackets in Chippewa County
According to the Chippewa County family income data, there are 3,999 families falling into the $100,000 to $149,999 income range, which is the most common income bracket and makes up 23.9% of all families. Conversely, the $10,000 to $14,999 income bracket is the least frequent group with only 268 families (1.6%) belonging to this category.
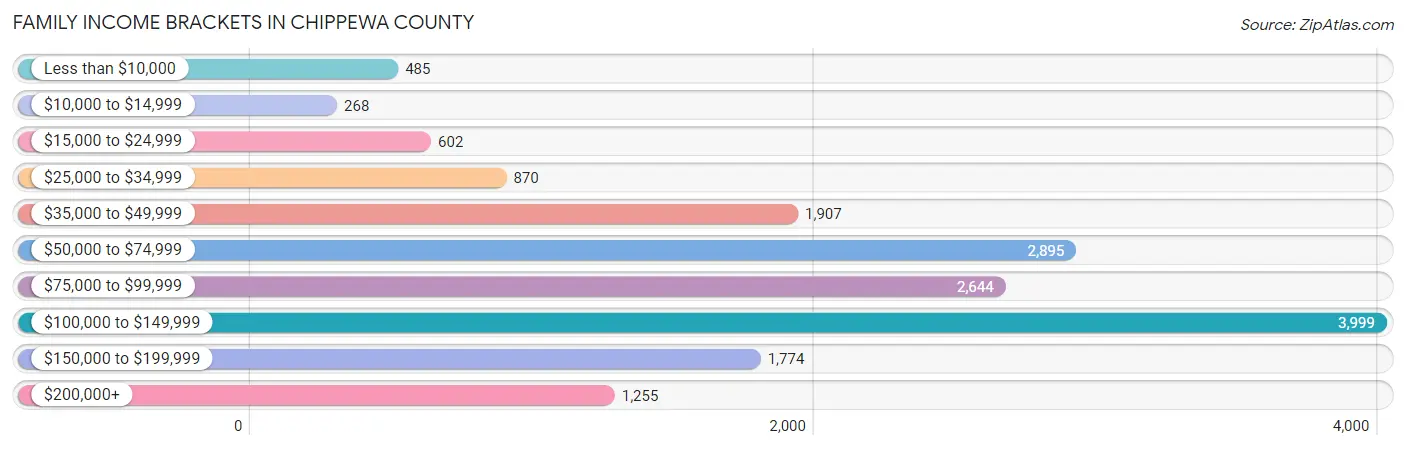
| Income Bracket | # Families | % Families |
| Less than $10,000 | 485 | 2.9% |
| $10,000 to $14,999 | 268 | 1.6% |
| $15,000 to $24,999 | 602 | 3.6% |
| $25,000 to $34,999 | 870 | 5.2% |
| $35,000 to $49,999 | 1,907 | 11.4% |
| $50,000 to $74,999 | 2,895 | 17.3% |
| $75,000 to $99,999 | 2,644 | 15.8% |
| $100,000 to $149,999 | 3,999 | 23.9% |
| $150,000 to $199,999 | 1,774 | 10.6% |
| $200,000+ | 1,255 | 7.5% |
Family Income by Famaliy Size in Chippewa County
6-person families (431 | 2.6%) account for the highest median family income in Chippewa County with $116,406 per family, while 2-person families (9,053 | 54.1%) have the highest median income of $37,198 per family member.
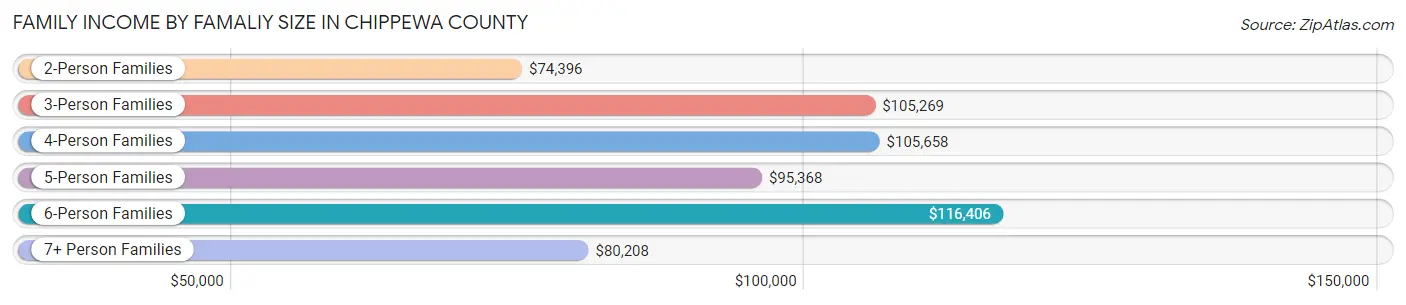
| Income Bracket | # Families | Median Income |
| 2-Person Families | 9,053 (54.1%) | $74,396 |
| 3-Person Families | 3,131 (18.7%) | $105,269 |
| 4-Person Families | 2,588 (15.5%) | $105,658 |
| 5-Person Families | 1,184 (7.1%) | $95,368 |
| 6-Person Families | 431 (2.6%) | $116,406 |
| 7+ Person Families | 345 (2.1%) | $80,208 |
| Total | 16,732 (100.0%) | $86,600 |
Family Income by Number of Earners in Chippewa County
The median family income in Chippewa County is $86,600, with families comprising 3+ earners (1,802) having the highest median family income of $136,378, while families with no earners (2,737) have the lowest median family income of $59,554, accounting for 10.8% and 16.4% of families, respectively.
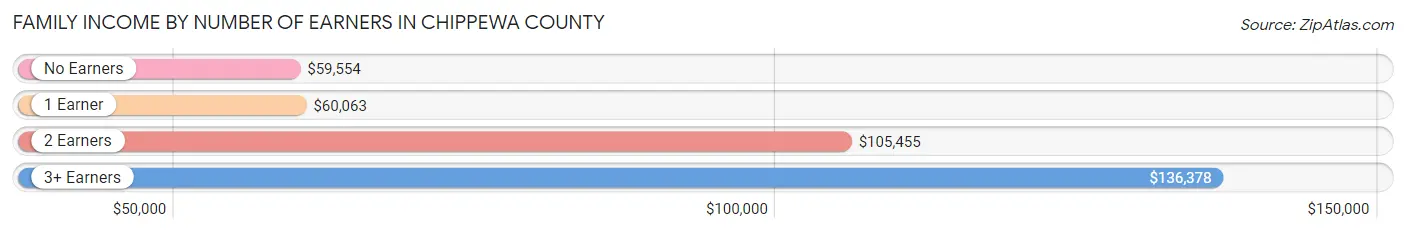
| Number of Earners | # Families | Median Income |
| No Earners | 2,737 (16.4%) | $59,554 |
| 1 Earner | 4,403 (26.3%) | $60,063 |
| 2 Earners | 7,790 (46.6%) | $105,455 |
| 3+ Earners | 1,802 (10.8%) | $136,378 |
| Total | 16,732 (100.0%) | $86,600 |
Household Income in Chippewa County
Household Income Brackets in Chippewa County
With 5,028 households falling in the category, the $50,000 to $74,999 income range is the most frequent in Chippewa County, accounting for 19.1% of all households. In contrast, only 790 households (3.0%) fall into the less than $10,000 income bracket, making it the least populous group.
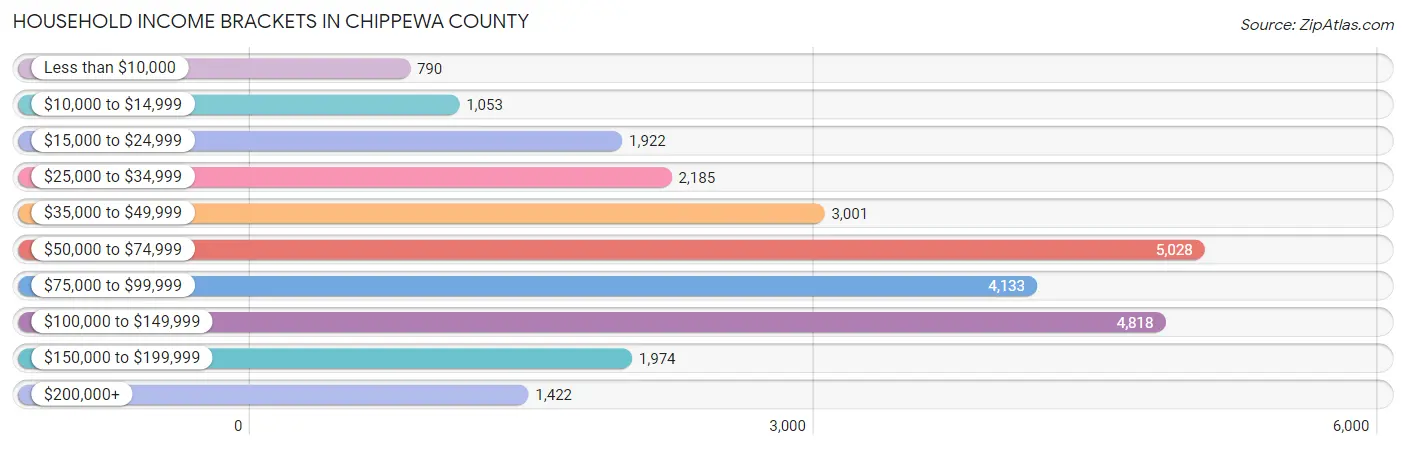
| Income Bracket | # Households | % Households |
| Less than $10,000 | 790 | 3.0% |
| $10,000 to $14,999 | 1,053 | 4.0% |
| $15,000 to $24,999 | 1,922 | 7.3% |
| $25,000 to $34,999 | 2,185 | 8.3% |
| $35,000 to $49,999 | 3,001 | 11.4% |
| $50,000 to $74,999 | 5,028 | 19.1% |
| $75,000 to $99,999 | 4,133 | 15.7% |
| $100,000 to $149,999 | 4,818 | 18.3% |
| $150,000 to $199,999 | 1,974 | 7.5% |
| $200,000+ | 1,422 | 5.4% |
Household Income by Householder Age in Chippewa County
The median household income in Chippewa County is $69,815, with the highest median household income of $85,712 found in the 45 to 64 years age bracket for the primary householder. A total of 9,926 households (37.7%) fall into this category. Meanwhile, the 65+ years age bracket for the primary householder has the lowest median household income of $48,343, with 7,830 households (29.7%) in this group.
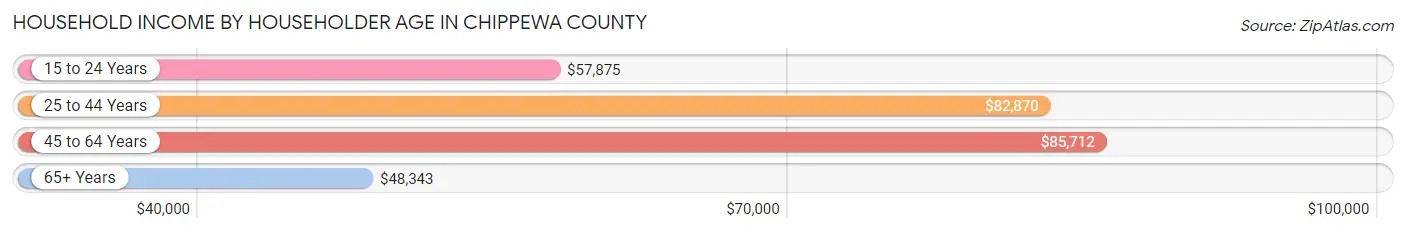
| Income Bracket | # Households | Median Income |
| 15 to 24 Years | 923 (3.5%) | $57,875 |
| 25 to 44 Years | 7,647 (29.0%) | $82,870 |
| 45 to 64 Years | 9,926 (37.7%) | $85,712 |
| 65+ Years | 7,830 (29.7%) | $48,343 |
| Total | 26,326 (100.0%) | $69,815 |
Poverty in Chippewa County
Income Below Poverty by Sex and Age in Chippewa County
With 8.0% poverty level for males and 12.0% for females among the residents of Chippewa County, 16 and 17 year old males and under 5 year old females are the most vulnerable to poverty, with 132 males (14.8%) and 377 females (20.9%) in their respective age groups living below the poverty level.
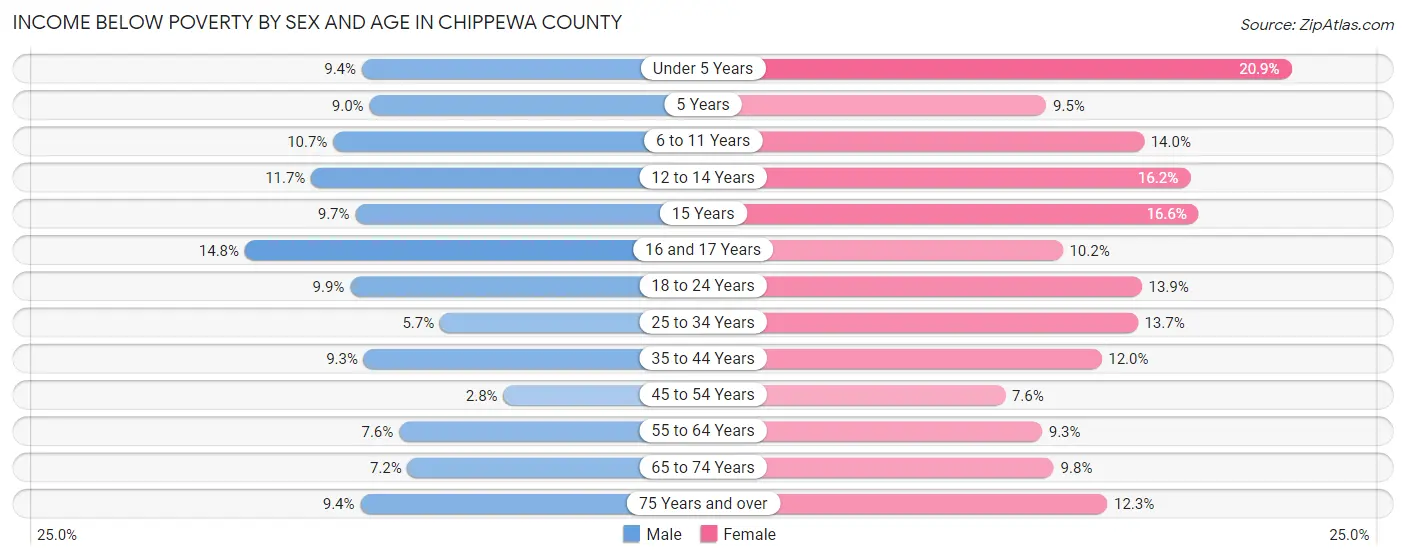
| Age Bracket | Male | Female |
| Under 5 Years | 151 (9.3%) | 377 (20.9%) |
| 5 Years | 27 (9.0%) | 33 (9.5%) |
| 6 to 11 Years | 284 (10.7%) | 373 (14.0%) |
| 12 to 14 Years | 139 (11.7%) | 148 (16.2%) |
| 15 Years | 44 (9.7%) | 77 (16.6%) |
| 16 and 17 Years | 132 (14.8%) | 80 (10.2%) |
| 18 to 24 Years | 239 (9.9%) | 308 (13.9%) |
| 25 to 34 Years | 214 (5.7%) | 477 (13.7%) |
| 35 to 44 Years | 388 (9.3%) | 467 (12.0%) |
| 45 to 54 Years | 116 (2.8%) | 287 (7.6%) |
| 55 to 64 Years | 371 (7.6%) | 437 (9.3%) |
| 65 to 74 Years | 266 (7.2%) | 349 (9.8%) |
| 75 Years and over | 197 (9.4%) | 337 (12.3%) |
| Total | 2,568 (8.0%) | 3,750 (12.0%) |
Income Above Poverty by Sex and Age in Chippewa County
According to the poverty statistics in Chippewa County, males aged 45 to 54 years and females aged 45 to 54 years are the age groups that are most secure financially, with 97.2% of males and 92.4% of females in these age groups living above the poverty line.
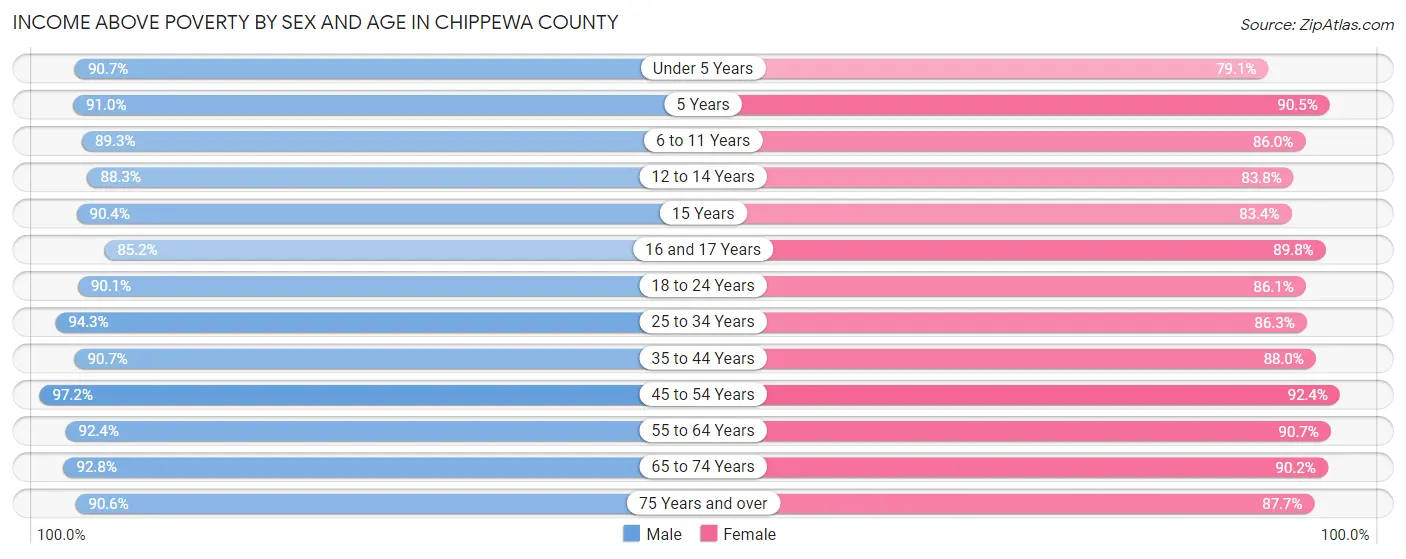
| Age Bracket | Male | Female |
| Under 5 Years | 1,464 (90.6%) | 1,430 (79.1%) |
| 5 Years | 273 (91.0%) | 315 (90.5%) |
| 6 to 11 Years | 2,375 (89.3%) | 2,289 (86.0%) |
| 12 to 14 Years | 1,049 (88.3%) | 768 (83.8%) |
| 15 Years | 412 (90.3%) | 388 (83.4%) |
| 16 and 17 Years | 761 (85.2%) | 701 (89.8%) |
| 18 to 24 Years | 2,178 (90.1%) | 1,907 (86.1%) |
| 25 to 34 Years | 3,528 (94.3%) | 3,000 (86.3%) |
| 35 to 44 Years | 3,802 (90.7%) | 3,411 (88.0%) |
| 45 to 54 Years | 4,059 (97.2%) | 3,503 (92.4%) |
| 55 to 64 Years | 4,499 (92.4%) | 4,271 (90.7%) |
| 65 to 74 Years | 3,412 (92.8%) | 3,200 (90.2%) |
| 75 Years and over | 1,895 (90.6%) | 2,401 (87.7%) |
| Total | 29,707 (92.0%) | 27,584 (88.0%) |
Income Below Poverty Among Married-Couple Families in Chippewa County
The poverty statistics for married-couple families in Chippewa County show that 5.0% or 682 of the total 13,576 families live below the poverty line. Families with 5 or more children have the highest poverty rate of 24.9%, comprising of 64 families. On the other hand, families with 1 or 2 children have the lowest poverty rate of 3.0%, which includes 113 families.
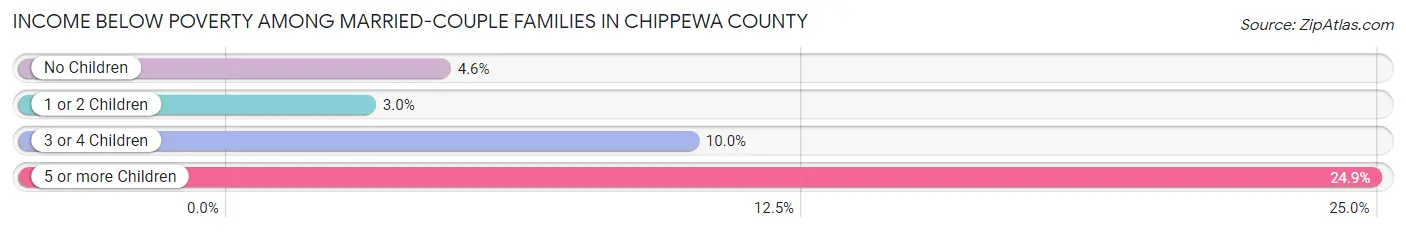
| Children | Above Poverty | Below Poverty |
| No Children | 7,996 (95.4%) | 388 (4.6%) |
| 1 or 2 Children | 3,656 (97.0%) | 113 (3.0%) |
| 3 or 4 Children | 1,049 (90.0%) | 117 (10.0%) |
| 5 or more Children | 193 (75.1%) | 64 (24.9%) |
| Total | 12,894 (95.0%) | 682 (5.0%) |
Income Below Poverty Among Single-Parent Households in Chippewa County
According to the poverty data in Chippewa County, 4.0% or 41 single-father households and 21.7% or 463 single-mother households are living below the poverty line. Among single-father households, those with 3 or 4 children have the highest poverty rate, with 14 households (17.1%) experiencing poverty. Likewise, among single-mother households, those with 3 or 4 children have the highest poverty rate, with 125 households (53.9%) falling below the poverty line.
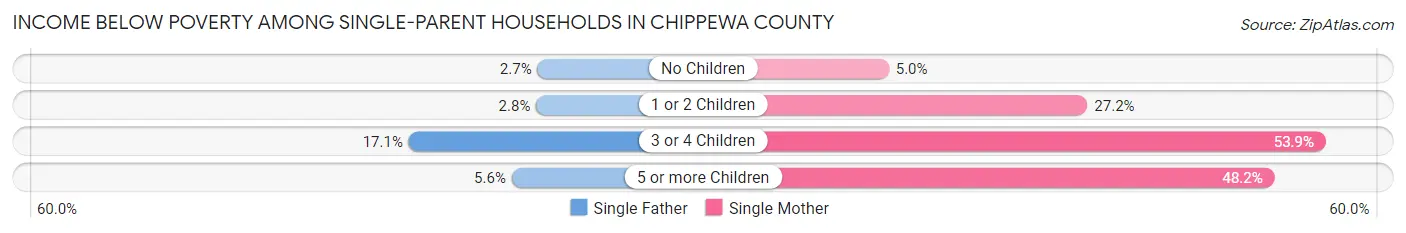
| Children | Single Father | Single Mother |
| No Children | 11 (2.7%) | 42 (5.0%) |
| 1 or 2 Children | 14 (2.8%) | 283 (27.2%) |
| 3 or 4 Children | 14 (17.1%) | 125 (53.9%) |
| 5 or more Children | 2 (5.6%) | 13 (48.1%) |
| Total | 41 (4.0%) | 463 (21.7%) |
Income Below Poverty Among Married-Couple vs Single-Parent Households in Chippewa County
The poverty data for Chippewa County shows that 682 of the married-couple family households (5.0%) and 504 of the single-parent households (16.0%) are living below the poverty level. Within the married-couple family households, those with 5 or more children have the highest poverty rate, with 64 households (24.9%) falling below the poverty line. Among the single-parent households, those with 3 or 4 children have the highest poverty rate, with 139 household (44.3%) living below poverty.
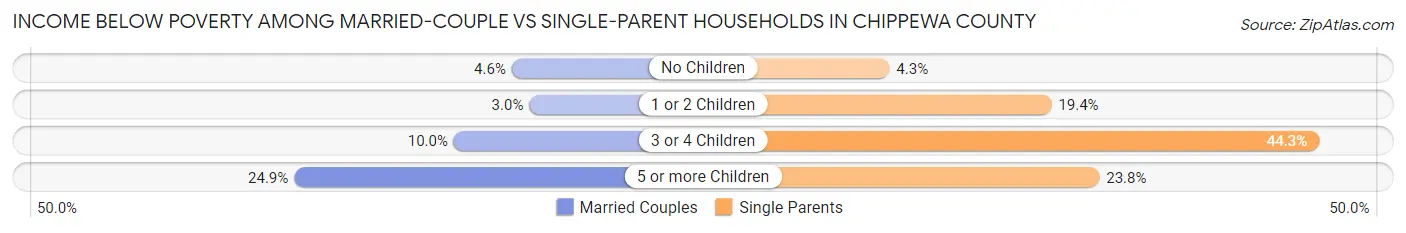
| Children | Married-Couple Families | Single-Parent Households |
| No Children | 388 (4.6%) | 53 (4.3%) |
| 1 or 2 Children | 113 (3.0%) | 297 (19.4%) |
| 3 or 4 Children | 117 (10.0%) | 139 (44.3%) |
| 5 or more Children | 64 (24.9%) | 15 (23.8%) |
| Total | 682 (5.0%) | 504 (16.0%) |
Employment Characteristics in Chippewa County
Employment by Class of Employer in Chippewa County
Among the 32,569 employed individuals in Chippewa County, private company employees (21,960 | 67.4%), not-for-profit organizations (3,029 | 9.3%), and local government employees (2,295 | 7.0%) make up the most common classes of employment.
| Employer Class | # Employees | % Employees |
| Private Company Employees | 21,960 | 67.4% |
| Self-Employed (Incorporated) | 1,532 | 4.7% |
| Self-Employed (Not Incorporated) | 2,216 | 6.8% |
| Not-for-profit Organizations | 3,029 | 9.3% |
| Local Government Employees | 2,295 | 7.0% |
| State Government Employees | 969 | 3.0% |
| Federal Government Employees | 438 | 1.3% |
| Unpaid Family Workers | 130 | 0.4% |
| Total | 32,569 | 100.0% |
Employment Status by Age in Chippewa County
According to the labor force statistics for Chippewa County, out of the total population over 16 years of age (53,564), 63.7% or 34,120 individuals are in the labor force, with 3.0% or 1,024 of them unemployed. The age group with the highest labor force participation rate is 45 to 54 years, with 87.9% or 7,285 individuals in the labor force. Within the labor force, the 16 to 19 years age range has the highest percentage of unemployed individuals, with 9.7% or 178 of them being unemployed.
| Age Bracket | In Labor Force | Unemployed |
| 16 to 19 Years | 1,833 (60.0%) | 178 (9.7%) |
| 20 to 24 Years | 2,935 (86.9%) | 252 (8.6%) |
| 25 to 29 Years | 3,089 (80.7%) | 96 (3.1%) |
| 30 to 34 Years | 3,359 (83.4%) | 34 (1.0%) |
| 35 to 44 Years | 7,180 (82.3%) | 115 (1.6%) |
| 45 to 54 Years | 7,285 (87.9%) | 51 (0.7%) |
| 55 to 59 Years | 3,307 (77.4%) | 86 (2.6%) |
| 60 to 64 Years | 3,076 (54.4%) | 188 (6.1%) |
| 65 to 74 Years | 1,921 (26.1%) | 33 (1.7%) |
| 75 Years and over | 129 (2.6%) | 0 (0.0%) |
| Total | 34,120 (63.7%) | 1,024 (3.0%) |
Employment Status by Educational Attainment in Chippewa County
According to labor force statistics for Chippewa County, 78.4% of individuals (27,279) out of the total population between 25 and 64 years of age (34,795) are in the labor force, with 2.1% or 573 of them being unemployed. The group with the highest labor force participation rate are those with the educational attainment of bachelor's degree or higher, with 87.8% or 7,531 individuals in the labor force. Within the labor force, individuals with less than high school education have the highest percentage of unemployment, with 3.1% or 45 of them being unemployed.
| Educational Attainment | In Labor Force | Unemployed |
| Less than High School | 1,437 (58.5%) | 76 (3.1%) |
| High School Diploma | 7,481 (70.5%) | 276 (2.6%) |
| College / Associate Degree | 10,835 (82.4%) | 289 (2.2%) |
| Bachelor's Degree or higher | 7,531 (87.8%) | 94 (1.1%) |
| Total | 27,279 (78.4%) | 731 (2.1%) |
Employment Occupations by Sex in Chippewa County
Management, Business, Science and Arts Occupations
The most common Management, Business, Science and Arts occupations in Chippewa County are Management (3,485 | 10.5%), Community & Social Service (2,982 | 9.0%), Education Instruction & Library (1,864 | 5.6%), Health Diagnosing & Treating (1,825 | 5.5%), and Business & Financial (1,523 | 4.6%).
Management, Business, Science and Arts Occupations by Sex
Within the Management, Business, Science and Arts occupations in Chippewa County, the most male-oriented occupations are Architecture & Engineering (83.8%), Computers, Engineering & Science (76.6%), and Computers & Mathematics (70.8%), while the most female-oriented occupations are Health Diagnosing & Treating (82.3%), Health Technologists (81.1%), and Education, Arts & Media (71.0%).
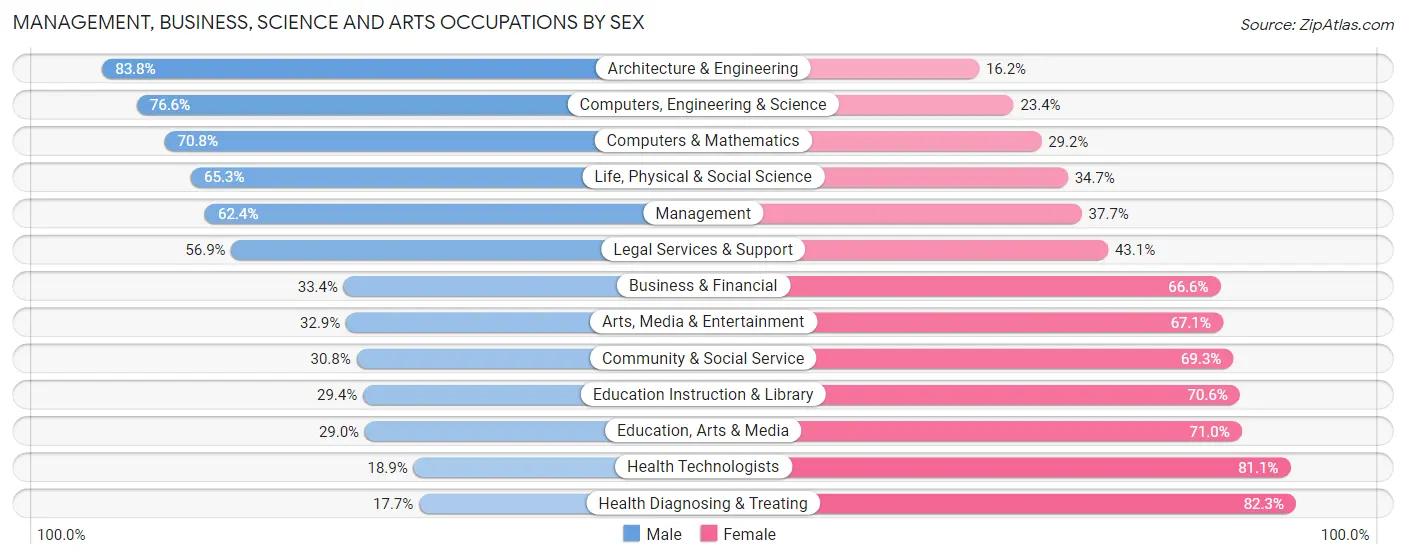
| Occupation | Male | Female |
| Management | 2,173 (62.4%) | 1,312 (37.7%) |
| Business & Financial | 509 (33.4%) | 1,014 (66.6%) |
| Computers, Engineering & Science | 1,089 (76.6%) | 333 (23.4%) |
| Computers & Mathematics | 366 (70.8%) | 151 (29.2%) |
| Architecture & Engineering | 599 (83.8%) | 116 (16.2%) |
| Life, Physical & Social Science | 124 (65.3%) | 66 (34.7%) |
| Community & Social Service | 917 (30.7%) | 2,065 (69.3%) |
| Education, Arts & Media | 174 (29.0%) | 426 (71.0%) |
| Legal Services & Support | 58 (56.9%) | 44 (43.1%) |
| Education Instruction & Library | 548 (29.4%) | 1,316 (70.6%) |
| Arts, Media & Entertainment | 137 (32.9%) | 279 (67.1%) |
| Health Diagnosing & Treating | 323 (17.7%) | 1,502 (82.3%) |
| Health Technologists | 221 (18.9%) | 951 (81.1%) |
| Total (Category) | 5,011 (44.6%) | 6,226 (55.4%) |
| Total (Overall) | 17,801 (53.9%) | 15,251 (46.1%) |
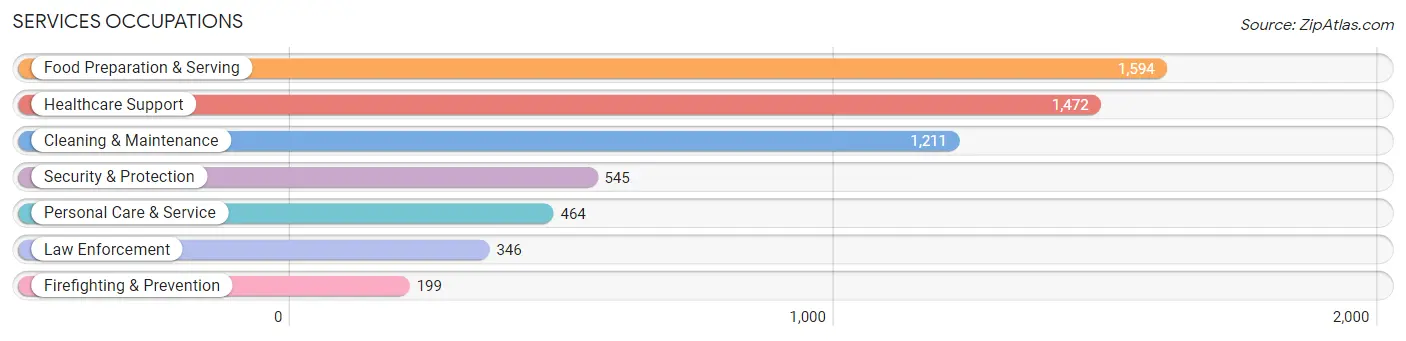
Services Occupations
The most common Services occupations in Chippewa County are Food Preparation & Serving (1,594 | 4.8%), Healthcare Support (1,472 | 4.4%), Cleaning & Maintenance (1,211 | 3.7%), Security & Protection (545 | 1.7%), and Personal Care & Service (464 | 1.4%).
Services Occupations by Sex
Within the Services occupations in Chippewa County, the most male-oriented occupations are Law Enforcement (85.0%), Security & Protection (70.6%), and Cleaning & Maintenance (61.9%), while the most female-oriented occupations are Healthcare Support (91.3%), Personal Care & Service (89.7%), and Food Preparation & Serving (58.5%).
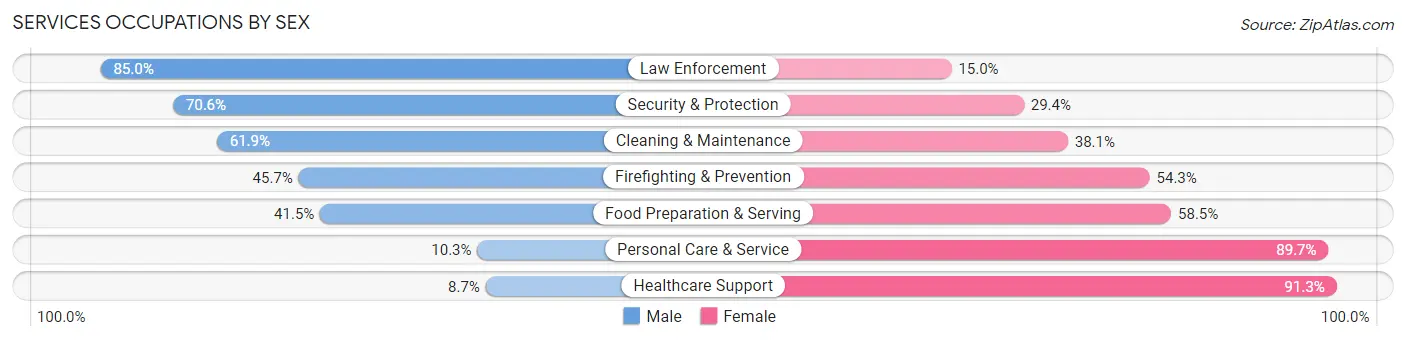
| Occupation | Male | Female |
| Healthcare Support | 128 (8.7%) | 1,344 (91.3%) |
| Security & Protection | 385 (70.6%) | 160 (29.4%) |
| Firefighting & Prevention | 91 (45.7%) | 108 (54.3%) |
| Law Enforcement | 294 (85.0%) | 52 (15.0%) |
| Food Preparation & Serving | 661 (41.5%) | 933 (58.5%) |
| Cleaning & Maintenance | 750 (61.9%) | 461 (38.1%) |
| Personal Care & Service | 48 (10.3%) | 416 (89.7%) |
| Total (Category) | 1,972 (37.3%) | 3,314 (62.7%) |
| Total (Overall) | 17,801 (53.9%) | 15,251 (46.1%) |
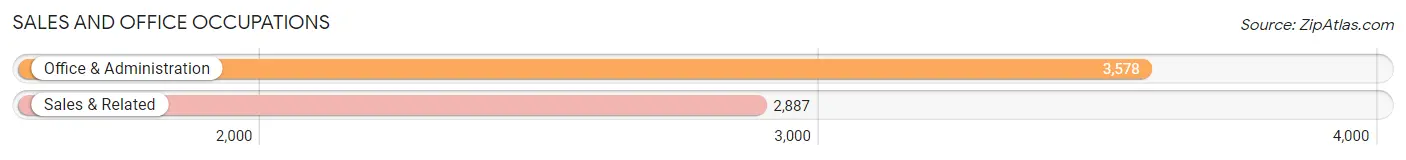
Sales and Office Occupations
The most common Sales and Office occupations in Chippewa County are Office & Administration (3,578 | 10.8%), and Sales & Related (2,887 | 8.7%).
Sales and Office Occupations by Sex
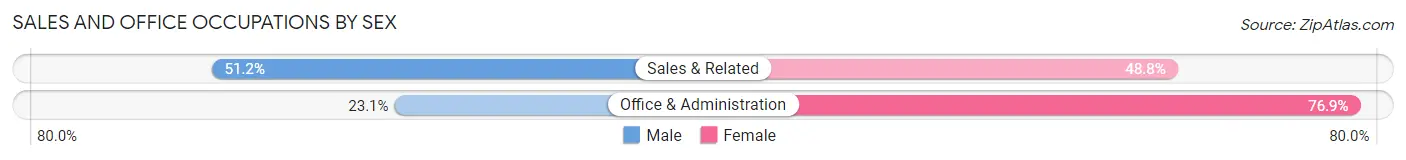
| Occupation | Male | Female |
| Sales & Related | 1,479 (51.2%) | 1,408 (48.8%) |
| Office & Administration | 827 (23.1%) | 2,751 (76.9%) |
| Total (Category) | 2,306 (35.7%) | 4,159 (64.3%) |
| Total (Overall) | 17,801 (53.9%) | 15,251 (46.1%) |
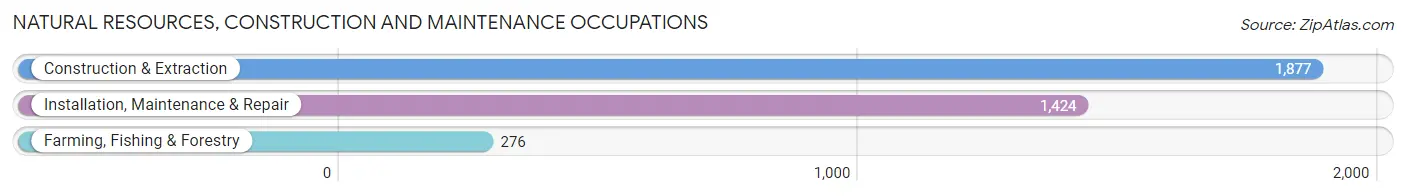
Natural Resources, Construction and Maintenance Occupations
The most common Natural Resources, Construction and Maintenance occupations in Chippewa County are Construction & Extraction (1,877 | 5.7%), Installation, Maintenance & Repair (1,424 | 4.3%), and Farming, Fishing & Forestry (276 | 0.8%).
Natural Resources, Construction and Maintenance Occupations by Sex
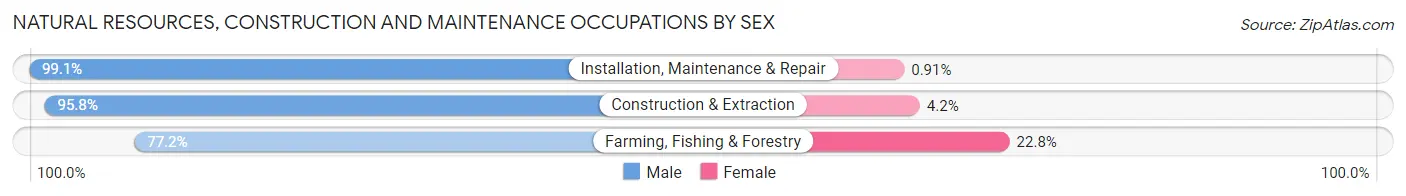
| Occupation | Male | Female |
| Farming, Fishing & Forestry | 213 (77.2%) | 63 (22.8%) |
| Construction & Extraction | 1,799 (95.8%) | 78 (4.2%) |
| Installation, Maintenance & Repair | 1,411 (99.1%) | 13 (0.9%) |
| Total (Category) | 3,423 (95.7%) | 154 (4.3%) |
| Total (Overall) | 17,801 (53.9%) | 15,251 (46.1%) |
Production, Transportation and Moving Occupations
The most common Production, Transportation and Moving occupations in Chippewa County are Production (3,178 | 9.6%), Material Moving (1,818 | 5.5%), and Transportation (1,491 | 4.5%).
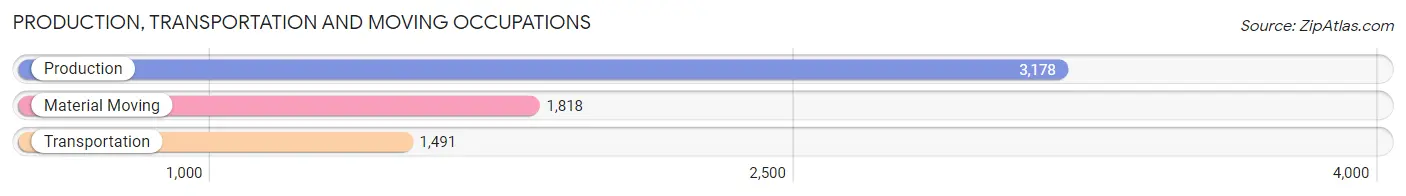
Production, Transportation and Moving Occupations by Sex
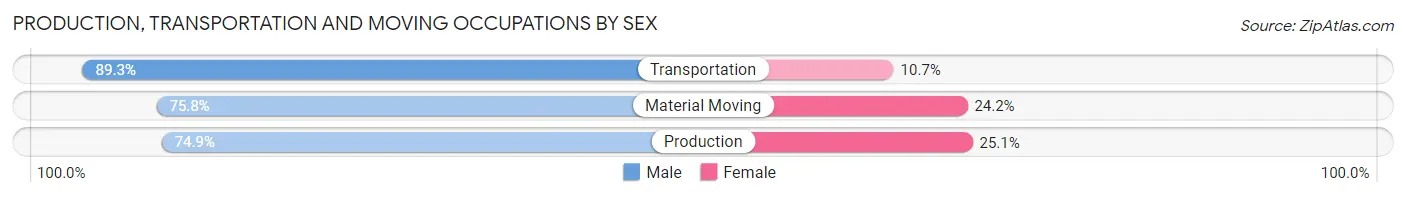
| Occupation | Male | Female |
| Production | 2,379 (74.9%) | 799 (25.1%) |
| Transportation | 1,332 (89.3%) | 159 (10.7%) |
| Material Moving | 1,378 (75.8%) | 440 (24.2%) |
| Total (Category) | 5,089 (78.4%) | 1,398 (21.5%) |
| Total (Overall) | 17,801 (53.9%) | 15,251 (46.1%) |
Employment Industries by Sex in Chippewa County
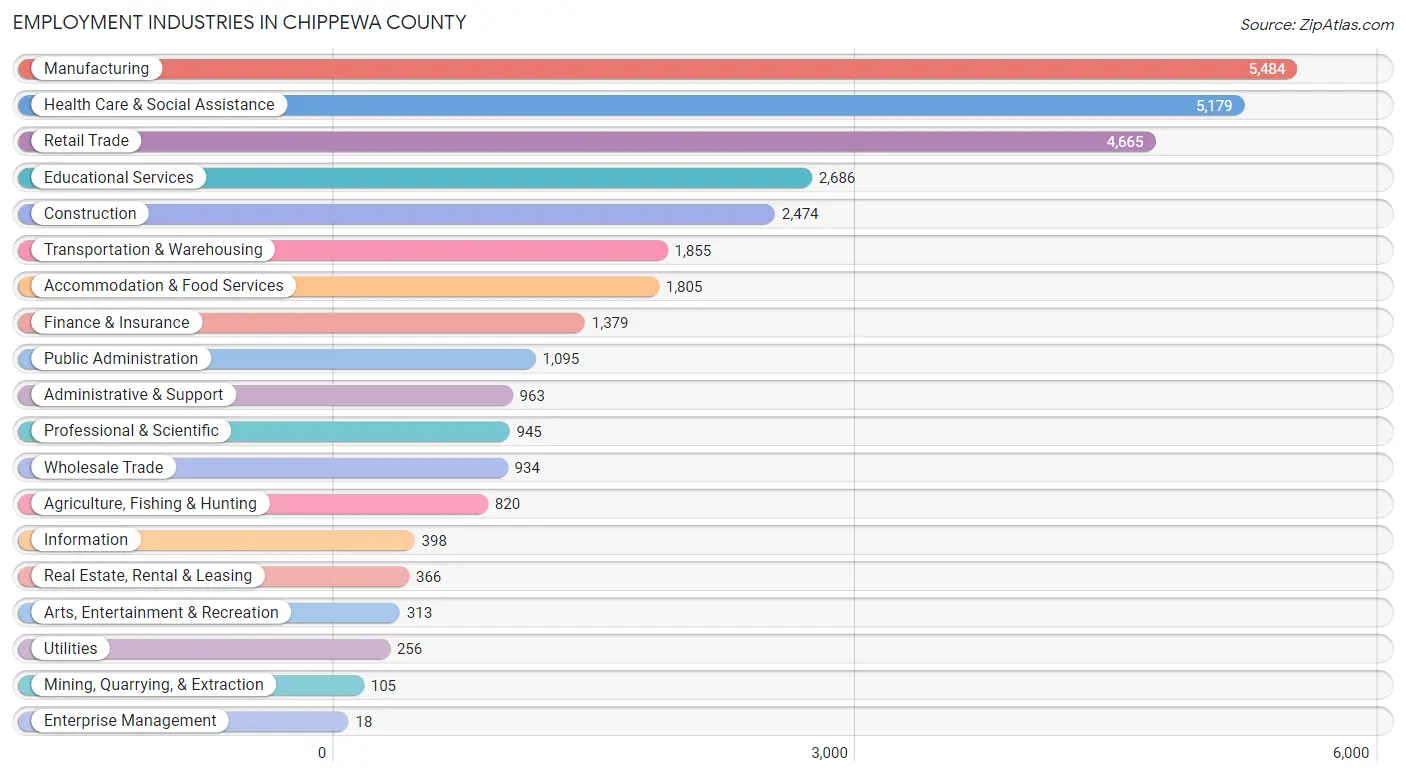
Employment Industries in Chippewa County
The major employment industries in Chippewa County include Manufacturing (5,484 | 16.6%), Health Care & Social Assistance (5,179 | 15.7%), Retail Trade (4,665 | 14.1%), Educational Services (2,686 | 8.1%), and Construction (2,474 | 7.5%).
Employment Industries by Sex in Chippewa County
The Chippewa County industries that see more men than women are Construction (94.2%), Mining, Quarrying, & Extraction (88.6%), and Agriculture, Fishing & Hunting (84.8%), whereas the industries that tend to have a higher number of women are Health Care & Social Assistance (82.8%), Real Estate, Rental & Leasing (73.8%), and Finance & Insurance (71.7%).
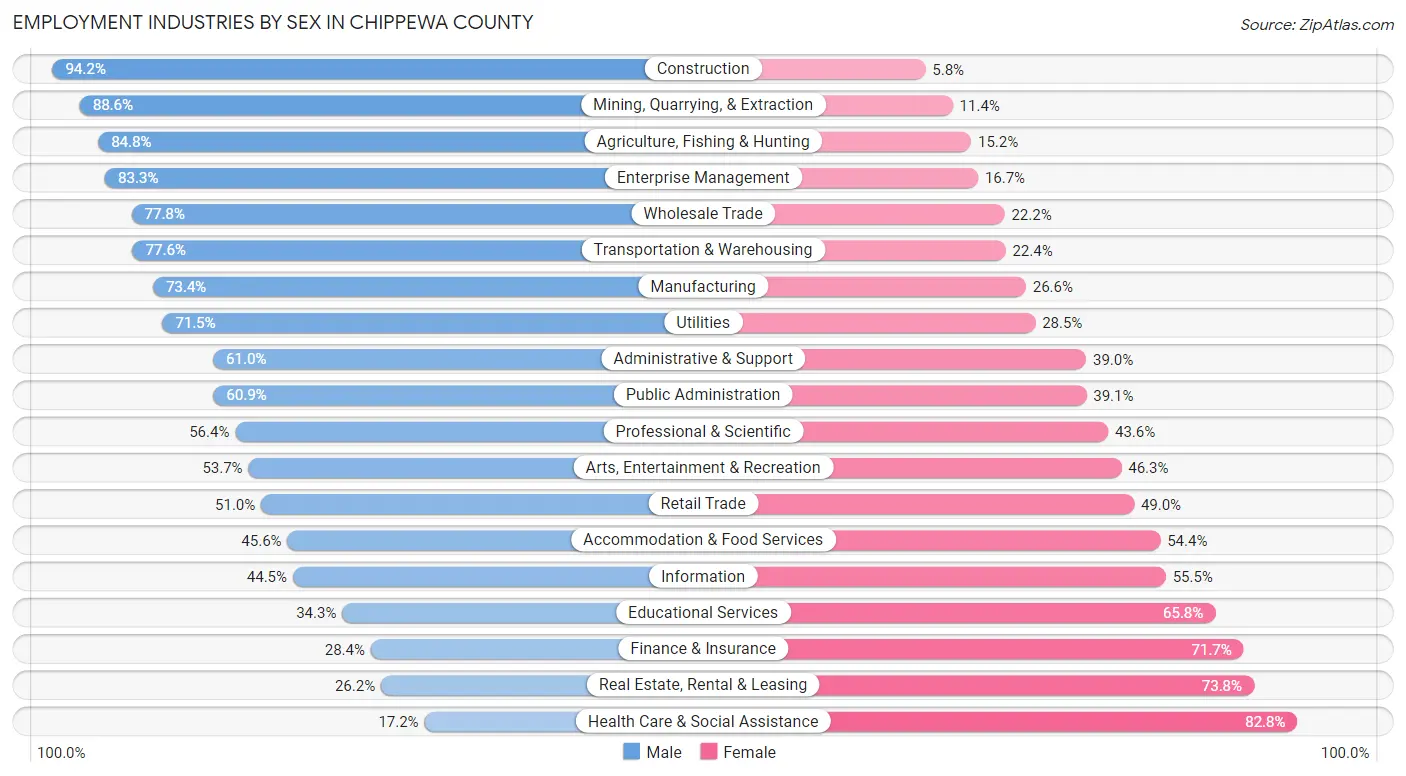
| Industry | Male | Female |
| Agriculture, Fishing & Hunting | 695 (84.8%) | 125 (15.2%) |
| Mining, Quarrying, & Extraction | 93 (88.6%) | 12 (11.4%) |
| Construction | 2,331 (94.2%) | 143 (5.8%) |
| Manufacturing | 4,027 (73.4%) | 1,457 (26.6%) |
| Wholesale Trade | 727 (77.8%) | 207 (22.2%) |
| Retail Trade | 2,381 (51.0%) | 2,284 (49.0%) |
| Transportation & Warehousing | 1,440 (77.6%) | 415 (22.4%) |
| Utilities | 183 (71.5%) | 73 (28.5%) |
| Information | 177 (44.5%) | 221 (55.5%) |
| Finance & Insurance | 391 (28.3%) | 988 (71.7%) |
| Real Estate, Rental & Leasing | 96 (26.2%) | 270 (73.8%) |
| Professional & Scientific | 533 (56.4%) | 412 (43.6%) |
| Enterprise Management | 15 (83.3%) | 3 (16.7%) |
| Administrative & Support | 587 (61.0%) | 376 (39.0%) |
| Educational Services | 920 (34.3%) | 1,766 (65.7%) |
| Health Care & Social Assistance | 893 (17.2%) | 4,286 (82.8%) |
| Arts, Entertainment & Recreation | 168 (53.7%) | 145 (46.3%) |
| Accommodation & Food Services | 823 (45.6%) | 982 (54.4%) |
| Public Administration | 667 (60.9%) | 428 (39.1%) |
| Total | 17,801 (53.9%) | 15,251 (46.1%) |
Education in Chippewa County
School Enrollment in Chippewa County
The most common levels of schooling among the 14,567 students in Chippewa County are elementary school (3,576 | 24.5%), middle school (3,254 | 22.3%), and high school (3,210 | 22.0%).
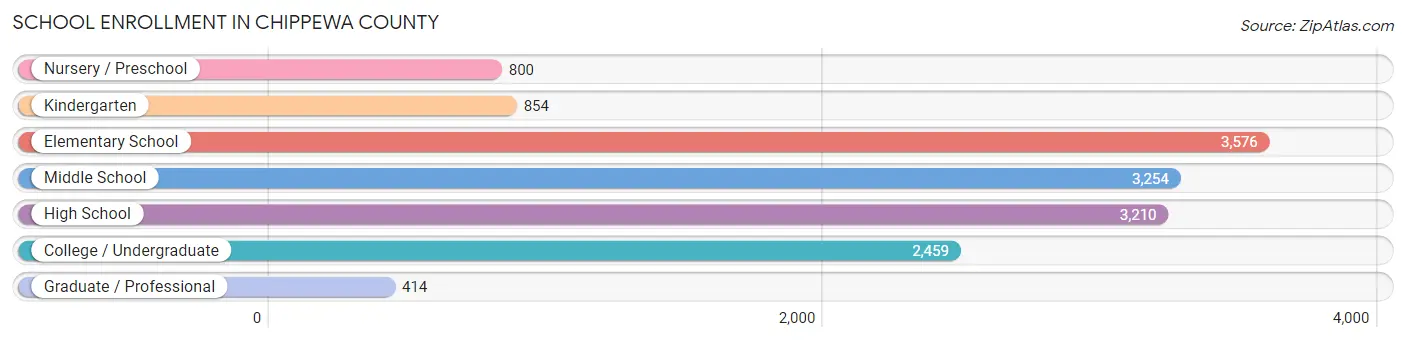
| School Level | # Students | % Students |
| Nursery / Preschool | 800 | 5.5% |
| Kindergarten | 854 | 5.9% |
| Elementary School | 3,576 | 24.5% |
| Middle School | 3,254 | 22.3% |
| High School | 3,210 | 22.0% |
| College / Undergraduate | 2,459 | 16.9% |
| Graduate / Professional | 414 | 2.8% |
| Total | 14,567 | 100.0% |
School Enrollment by Age by Funding Source in Chippewa County
Out of a total of 14,567 students who are enrolled in schools in Chippewa County, 1,981 (13.6%) attend a private institution, while the remaining 12,586 (86.4%) are enrolled in public schools. The age group of 35 years and over has the highest likelihood of being enrolled in private schools, with 187 (22.4% in the age bracket) enrolled. Conversely, the age group of 20 to 24 year olds has the lowest likelihood of being enrolled in a private school, with 837 (98.7% in the age bracket) attending a public institution.
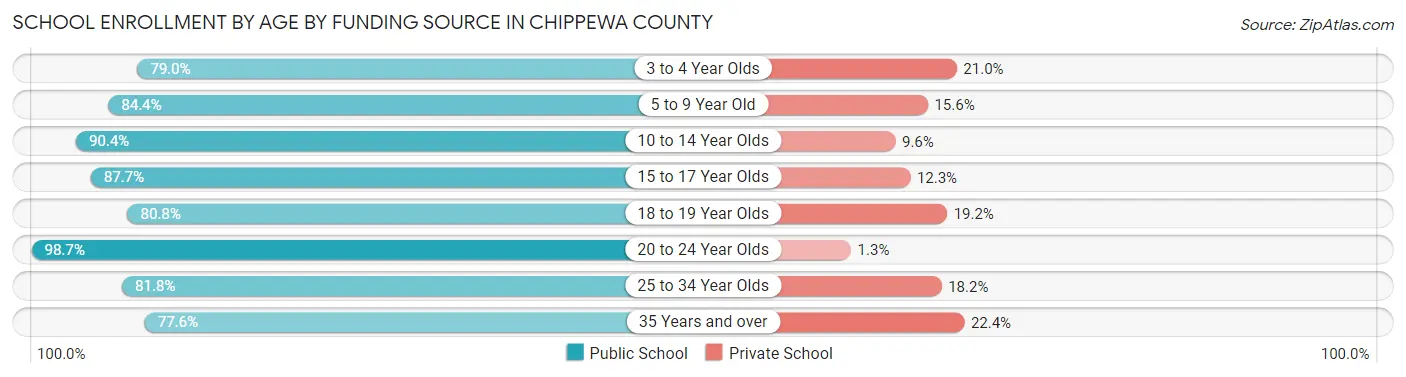
| Age Bracket | Public School | Private School |
| 3 to 4 Year Olds | 504 (79.0%) | 134 (21.0%) |
| 5 to 9 Year Old | 3,481 (84.4%) | 644 (15.6%) |
| 10 to 14 Year Olds | 3,468 (90.4%) | 367 (9.6%) |
| 15 to 17 Year Olds | 2,180 (87.7%) | 307 (12.3%) |
| 18 to 19 Year Olds | 720 (80.8%) | 171 (19.2%) |
| 20 to 24 Year Olds | 837 (98.7%) | 11 (1.3%) |
| 25 to 34 Year Olds | 743 (81.8%) | 165 (18.2%) |
| 35 Years and over | 648 (77.6%) | 187 (22.4%) |
| Total | 12,586 (86.4%) | 1,981 (13.6%) |
Educational Attainment by Field of Study in Chippewa County
Business (2,748 | 23.4%), education (1,953 | 16.7%), science & technology (1,754 | 14.9%), arts & humanities (896 | 7.6%), and bio, nature & agricultural (847 | 7.2%) are the most common fields of study among 11,729 individuals in Chippewa County who have obtained a bachelor's degree or higher.
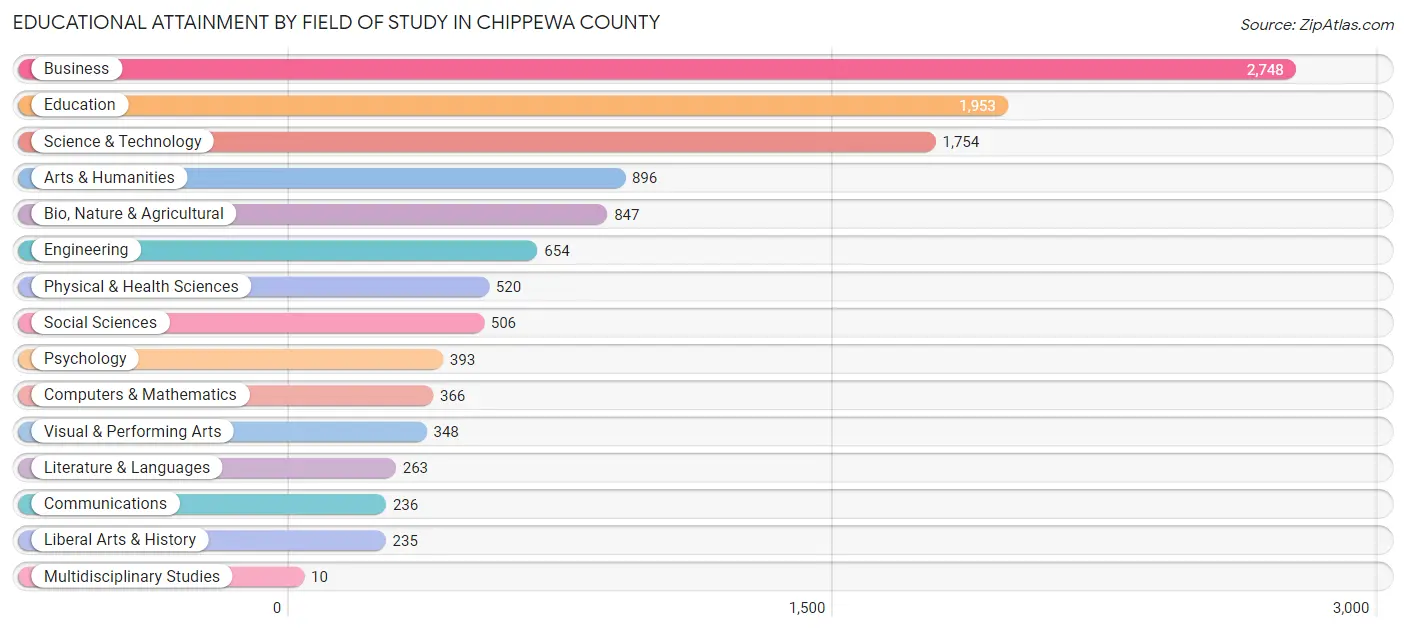
| Field of Study | # Graduates | % Graduates |
| Computers & Mathematics | 366 | 3.1% |
| Bio, Nature & Agricultural | 847 | 7.2% |
| Physical & Health Sciences | 520 | 4.4% |
| Psychology | 393 | 3.4% |
| Social Sciences | 506 | 4.3% |
| Engineering | 654 | 5.6% |
| Multidisciplinary Studies | 10 | 0.1% |
| Science & Technology | 1,754 | 14.9% |
| Business | 2,748 | 23.4% |
| Education | 1,953 | 16.7% |
| Literature & Languages | 263 | 2.2% |
| Liberal Arts & History | 235 | 2.0% |
| Visual & Performing Arts | 348 | 3.0% |
| Communications | 236 | 2.0% |
| Arts & Humanities | 896 | 7.6% |
| Total | 11,729 | 100.0% |
Transportation & Commute in Chippewa County
Vehicle Availability by Sex in Chippewa County
The most prevalent vehicle ownership categories in Chippewa County are males with 2 vehicles (7,133, accounting for 40.9%) and females with 2 vehicles (6,280, making up 47.4%).
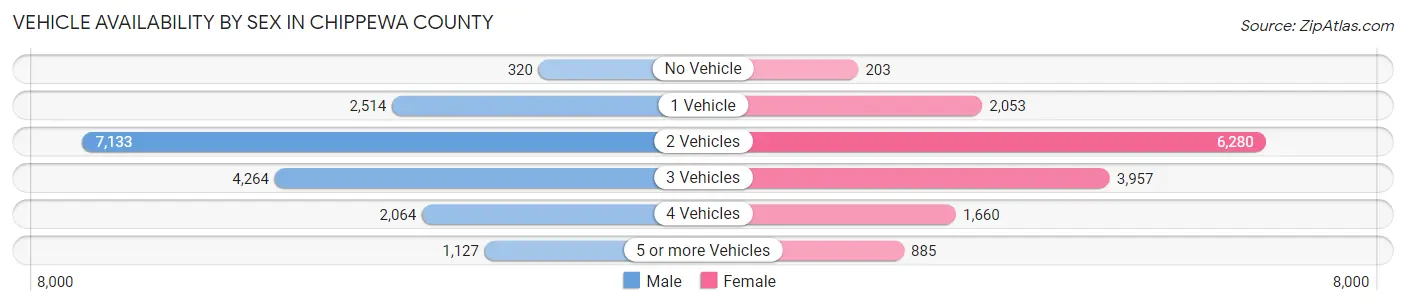
| Vehicles Available | Male | Female |
| No Vehicle | 320 (1.8%) | 203 (1.3%) |
| 1 Vehicle | 2,514 (14.4%) | 2,053 (13.7%) |
| 2 Vehicles | 7,133 (40.9%) | 6,280 (41.8%) |
| 3 Vehicles | 4,264 (24.5%) | 3,957 (26.3%) |
| 4 Vehicles | 2,064 (11.8%) | 1,660 (11.0%) |
| 5 or more Vehicles | 1,127 (6.5%) | 885 (5.9%) |
| Total | 17,422 (100.0%) | 15,038 (100.0%) |
Commute Time in Chippewa County
The most frequently occuring commute durations in Chippewa County are 15 to 19 minutes (4,971 commuters, 16.9%), 20 to 24 minutes (4,703 commuters, 15.9%), and 10 to 14 minutes (4,199 commuters, 14.2%).
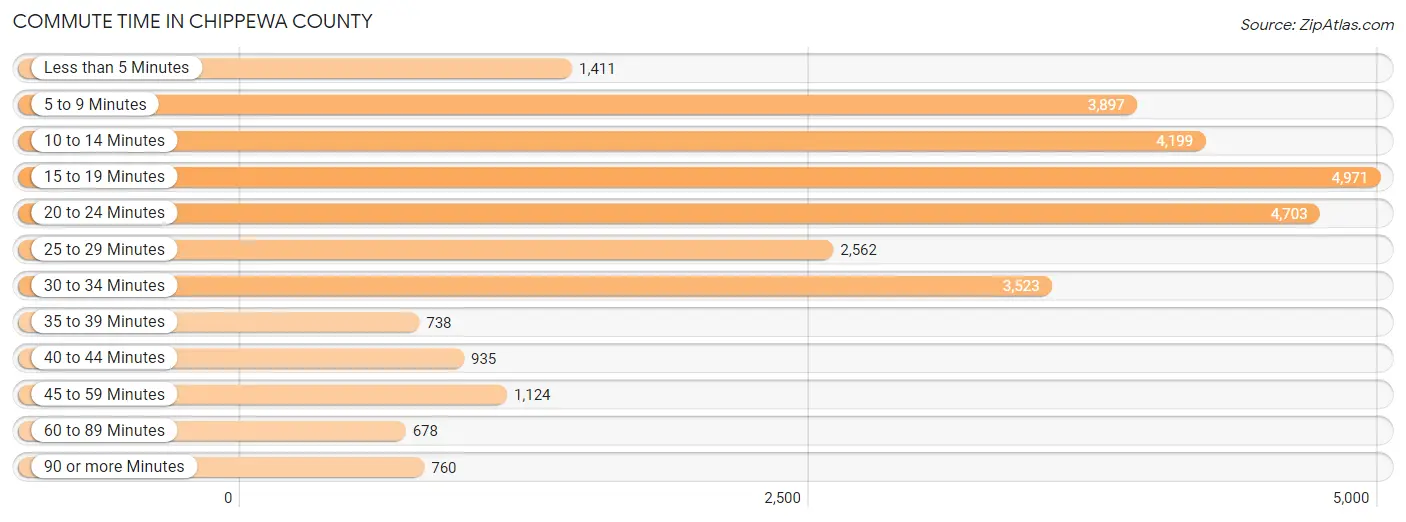
| Commute Time | # Commuters | % Commuters |
| Less than 5 Minutes | 1,411 | 4.8% |
| 5 to 9 Minutes | 3,897 | 13.2% |
| 10 to 14 Minutes | 4,199 | 14.2% |
| 15 to 19 Minutes | 4,971 | 16.9% |
| 20 to 24 Minutes | 4,703 | 15.9% |
| 25 to 29 Minutes | 2,562 | 8.7% |
| 30 to 34 Minutes | 3,523 | 11.9% |
| 35 to 39 Minutes | 738 | 2.5% |
| 40 to 44 Minutes | 935 | 3.2% |
| 45 to 59 Minutes | 1,124 | 3.8% |
| 60 to 89 Minutes | 678 | 2.3% |
| 90 or more Minutes | 760 | 2.6% |
Commute Time by Sex in Chippewa County
The most common commute times in Chippewa County are 15 to 19 minutes (2,576 commuters, 15.9%) for males and 15 to 19 minutes (2,395 commuters, 17.9%) for females.
| Commute Time | Male | Female |
| Less than 5 Minutes | 716 (4.4%) | 695 (5.2%) |
| 5 to 9 Minutes | 2,212 (13.7%) | 1,685 (12.6%) |
| 10 to 14 Minutes | 2,251 (13.9%) | 1,948 (14.6%) |
| 15 to 19 Minutes | 2,576 (15.9%) | 2,395 (17.9%) |
| 20 to 24 Minutes | 2,487 (15.4%) | 2,216 (16.6%) |
| 25 to 29 Minutes | 1,271 (7.9%) | 1,291 (9.7%) |
| 30 to 34 Minutes | 1,999 (12.4%) | 1,524 (11.4%) |
| 35 to 39 Minutes | 381 (2.4%) | 357 (2.7%) |
| 40 to 44 Minutes | 519 (3.2%) | 416 (3.1%) |
| 45 to 59 Minutes | 719 (4.4%) | 405 (3.0%) |
| 60 to 89 Minutes | 420 (2.6%) | 258 (1.9%) |
| 90 or more Minutes | 610 (3.8%) | 150 (1.1%) |
Time of Departure to Work by Sex in Chippewa County
The most frequent times of departure to work in Chippewa County are 6:30 AM to 6:59 AM (2,143, 13.3%) for males and 7:00 AM to 7:29 AM (2,313, 17.3%) for females.
| Time of Departure | Male | Female |
| 12:00 AM to 4:59 AM | 1,713 (10.6%) | 784 (5.9%) |
| 5:00 AM to 5:29 AM | 1,128 (7.0%) | 434 (3.3%) |
| 5:30 AM to 5:59 AM | 1,447 (8.9%) | 536 (4.0%) |
| 6:00 AM to 6:29 AM | 1,705 (10.5%) | 874 (6.6%) |
| 6:30 AM to 6:59 AM | 2,143 (13.3%) | 1,625 (12.2%) |
| 7:00 AM to 7:29 AM | 2,086 (12.9%) | 2,313 (17.3%) |
| 7:30 AM to 7:59 AM | 1,561 (9.7%) | 2,123 (15.9%) |
| 8:00 AM to 8:29 AM | 869 (5.4%) | 1,063 (8.0%) |
| 8:30 AM to 8:59 AM | 270 (1.7%) | 825 (6.2%) |
| 9:00 AM to 9:59 AM | 482 (3.0%) | 666 (5.0%) |
| 10:00 AM to 10:59 AM | 274 (1.7%) | 216 (1.6%) |
| 11:00 AM to 11:59 AM | 181 (1.1%) | 55 (0.4%) |
| 12:00 PM to 3:59 PM | 1,190 (7.4%) | 1,067 (8.0%) |
| 4:00 PM to 11:59 PM | 1,112 (6.9%) | 759 (5.7%) |
| Total | 16,161 (100.0%) | 13,340 (100.0%) |
Housing Occupancy in Chippewa County
Occupancy by Ownership in Chippewa County
Of the total 26,326 dwellings in Chippewa County, owner-occupied units account for 19,429 (73.8%), while renter-occupied units make up 6,897 (26.2%).
| Occupancy | # Housing Units | % Housing Units |
| Owner Occupied Housing Units | 19,429 | 73.8% |
| Renter-Occupied Housing Units | 6,897 | 26.2% |
| Total Occupied Housing Units | 26,326 | 100.0% |
Occupancy by Household Size in Chippewa County
| Household Size | # Housing Units | % Housing Units |
| 1-Person Household | 7,743 | 29.4% |
| 2-Person Household | 9,981 | 37.9% |
| 3-Person Household | 3,614 | 13.7% |
| 4+ Person Household | 4,988 | 19.0% |
| Total Housing Units | 26,326 | 100.0% |
Occupancy by Ownership by Household Size in Chippewa County
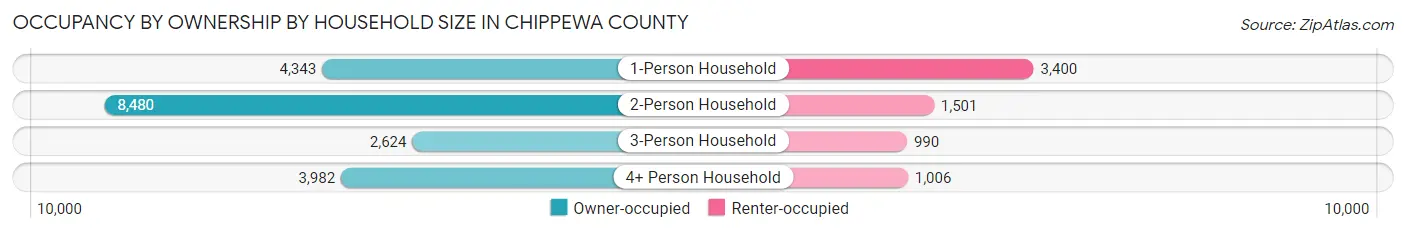
| Household Size | Owner-occupied | Renter-occupied |
| 1-Person Household | 4,343 (56.1%) | 3,400 (43.9%) |
| 2-Person Household | 8,480 (85.0%) | 1,501 (15.0%) |
| 3-Person Household | 2,624 (72.6%) | 990 (27.4%) |
| 4+ Person Household | 3,982 (79.8%) | 1,006 (20.2%) |
| Total Housing Units | 19,429 (73.8%) | 6,897 (26.2%) |
Occupancy by Educational Attainment in Chippewa County
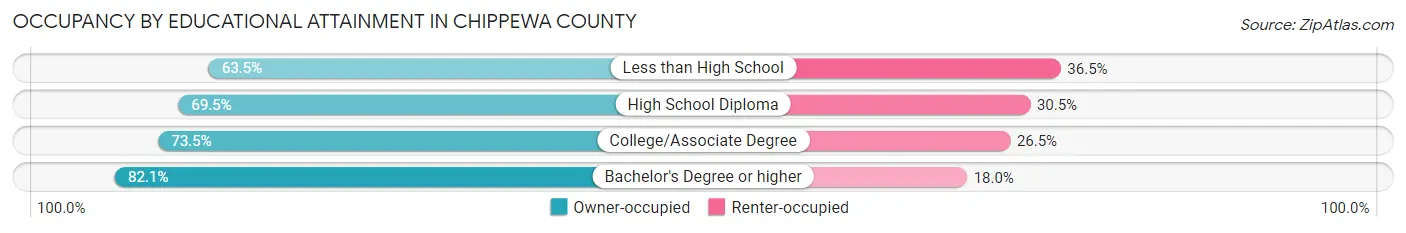
| Household Size | Owner-occupied | Renter-occupied |
| Less than High School | 1,027 (63.5%) | 591 (36.5%) |
| High School Diploma | 5,730 (69.5%) | 2,514 (30.5%) |
| College/Associate Degree | 7,172 (73.5%) | 2,589 (26.5%) |
| Bachelor's Degree or higher | 5,500 (82.1%) | 1,203 (17.9%) |
Occupancy by Age of Householder in Chippewa County
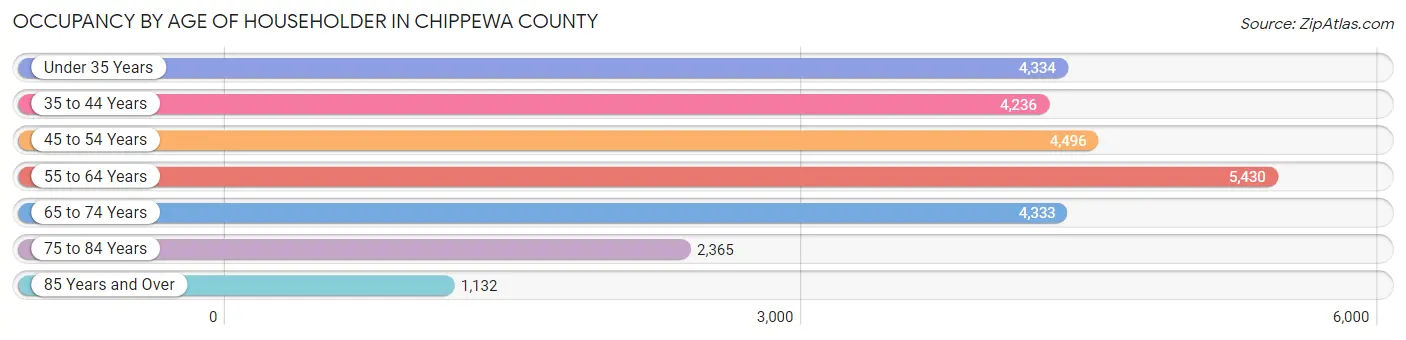
| Age Bracket | # Households | % Households |
| Under 35 Years | 4,334 | 16.5% |
| 35 to 44 Years | 4,236 | 16.1% |
| 45 to 54 Years | 4,496 | 17.1% |
| 55 to 64 Years | 5,430 | 20.6% |
| 65 to 74 Years | 4,333 | 16.5% |
| 75 to 84 Years | 2,365 | 9.0% |
| 85 Years and Over | 1,132 | 4.3% |
| Total | 26,326 | 100.0% |
Housing Finances in Chippewa County
Median Income by Occupancy in Chippewa County
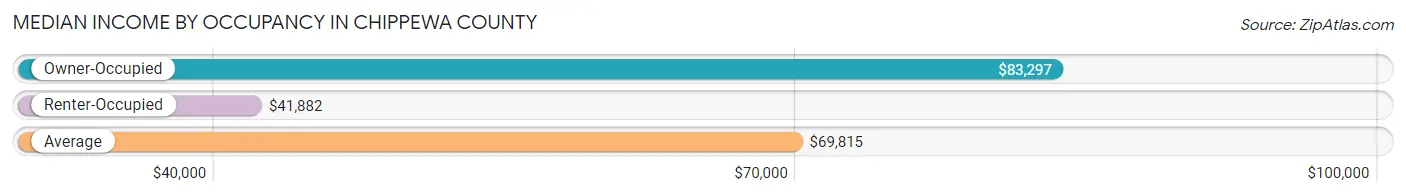
| Occupancy Type | # Households | Median Income |
| Owner-Occupied | 19,429 (73.8%) | $83,297 |
| Renter-Occupied | 6,897 (26.2%) | $41,882 |
| Average | 26,326 (100.0%) | $69,815 |
Occupancy by Householder Income Bracket in Chippewa County
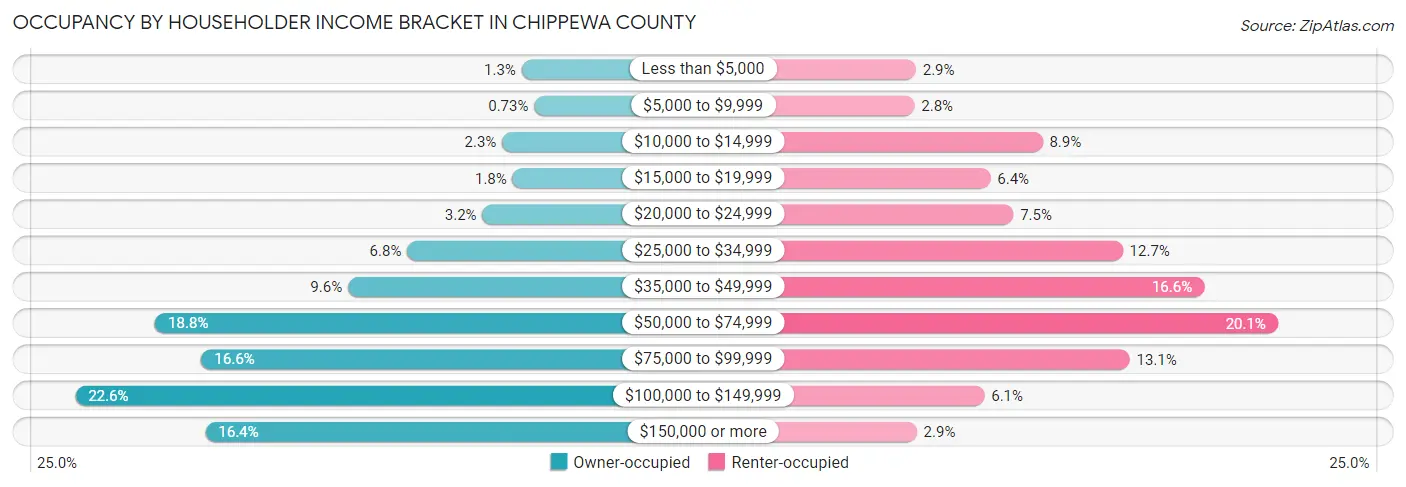
| Income Bracket | Owner-occupied | Renter-occupied |
| Less than $5,000 | 258 (1.3%) | 198 (2.9%) |
| $5,000 to $9,999 | 141 (0.7%) | 193 (2.8%) |
| $10,000 to $14,999 | 439 (2.3%) | 614 (8.9%) |
| $15,000 to $19,999 | 342 (1.8%) | 443 (6.4%) |
| $20,000 to $24,999 | 621 (3.2%) | 518 (7.5%) |
| $25,000 to $34,999 | 1,317 (6.8%) | 877 (12.7%) |
| $35,000 to $49,999 | 1,865 (9.6%) | 1,144 (16.6%) |
| $50,000 to $74,999 | 3,651 (18.8%) | 1,386 (20.1%) |
| $75,000 to $99,999 | 3,221 (16.6%) | 900 (13.1%) |
| $100,000 to $149,999 | 4,389 (22.6%) | 423 (6.1%) |
| $150,000 or more | 3,185 (16.4%) | 201 (2.9%) |
| Total | 19,429 (100.0%) | 6,897 (100.0%) |
Monthly Housing Cost Tiers in Chippewa County
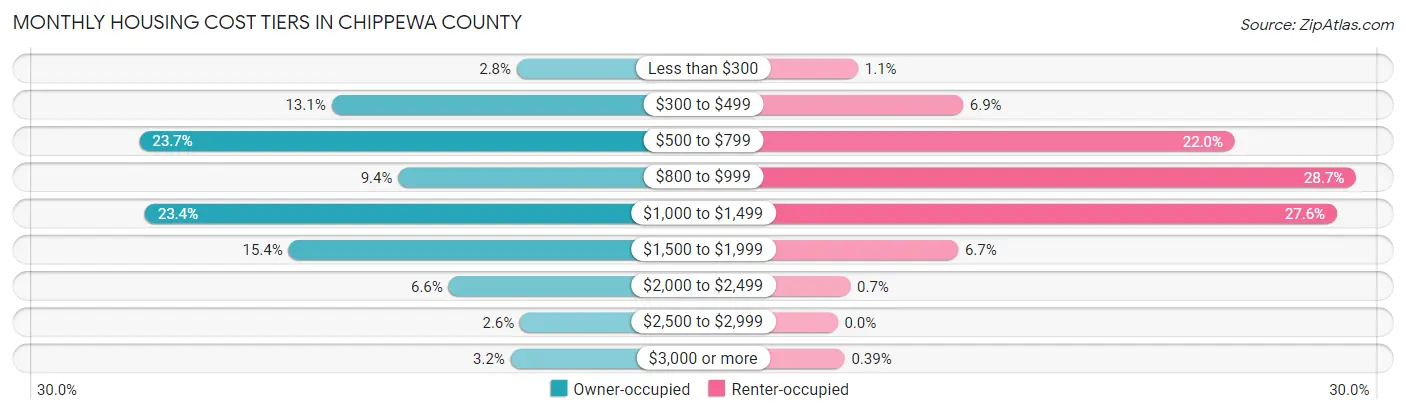
| Monthly Cost | Owner-occupied | Renter-occupied |
| Less than $300 | 545 (2.8%) | 78 (1.1%) |
| $300 to $499 | 2,535 (13.1%) | 478 (6.9%) |
| $500 to $799 | 4,596 (23.7%) | 1,514 (22.0%) |
| $800 to $999 | 1,819 (9.4%) | 1,976 (28.6%) |
| $1,000 to $1,499 | 4,538 (23.4%) | 1,903 (27.6%) |
| $1,500 to $1,999 | 2,995 (15.4%) | 459 (6.7%) |
| $2,000 to $2,499 | 1,278 (6.6%) | 48 (0.7%) |
| $2,500 to $2,999 | 511 (2.6%) | 0 (0.0%) |
| $3,000 or more | 612 (3.2%) | 27 (0.4%) |
| Total | 19,429 (100.0%) | 6,897 (100.0%) |
Physical Housing Characteristics in Chippewa County
Housing Structures in Chippewa County
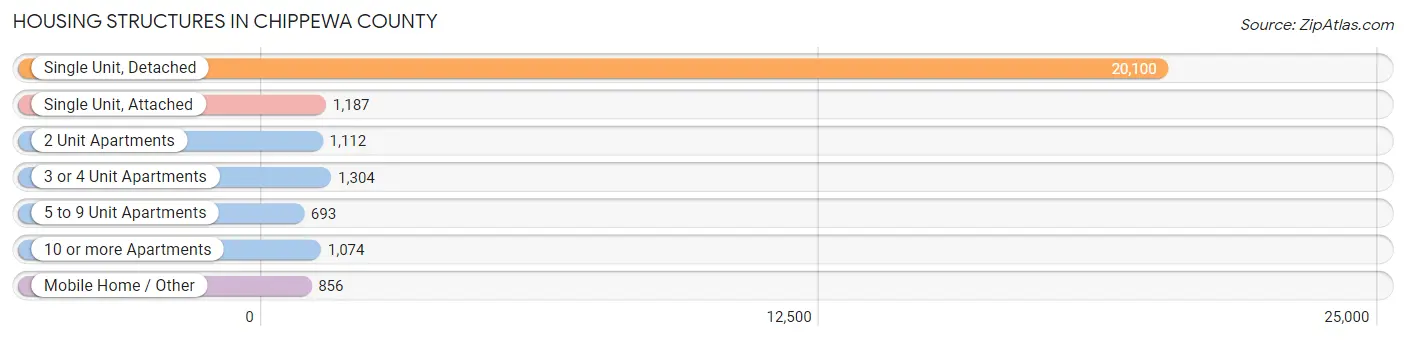
| Structure Type | # Housing Units | % Housing Units |
| Single Unit, Detached | 20,100 | 76.3% |
| Single Unit, Attached | 1,187 | 4.5% |
| 2 Unit Apartments | 1,112 | 4.2% |
| 3 or 4 Unit Apartments | 1,304 | 5.0% |
| 5 to 9 Unit Apartments | 693 | 2.6% |
| 10 or more Apartments | 1,074 | 4.1% |
| Mobile Home / Other | 856 | 3.3% |
| Total | 26,326 | 100.0% |
Housing Structures by Occupancy in Chippewa County
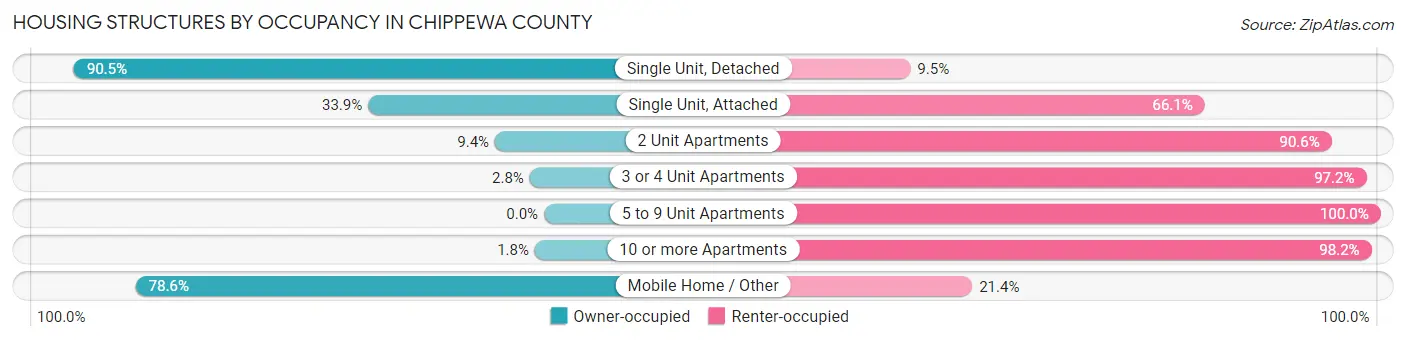
| Structure Type | Owner-occupied | Renter-occupied |
| Single Unit, Detached | 18,194 (90.5%) | 1,906 (9.5%) |
| Single Unit, Attached | 402 (33.9%) | 785 (66.1%) |
| 2 Unit Apartments | 105 (9.4%) | 1,007 (90.6%) |
| 3 or 4 Unit Apartments | 36 (2.8%) | 1,268 (97.2%) |
| 5 to 9 Unit Apartments | 0 (0.0%) | 693 (100.0%) |
| 10 or more Apartments | 19 (1.8%) | 1,055 (98.2%) |
| Mobile Home / Other | 673 (78.6%) | 183 (21.4%) |
| Total | 19,429 (73.8%) | 6,897 (26.2%) |
Housing Structures by Number of Rooms in Chippewa County
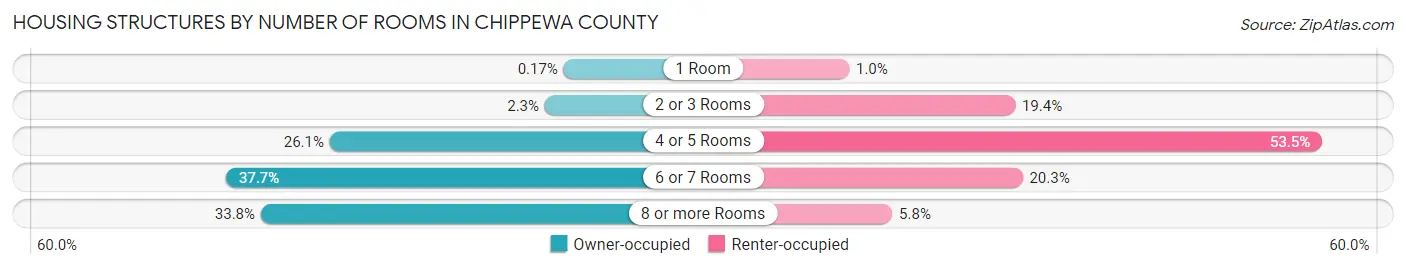
| Number of Rooms | Owner-occupied | Renter-occupied |
| 1 Room | 34 (0.2%) | 70 (1.0%) |
| 2 or 3 Rooms | 439 (2.3%) | 1,340 (19.4%) |
| 4 or 5 Rooms | 5,076 (26.1%) | 3,690 (53.5%) |
| 6 or 7 Rooms | 7,317 (37.7%) | 1,397 (20.3%) |
| 8 or more Rooms | 6,563 (33.8%) | 400 (5.8%) |
| Total | 19,429 (100.0%) | 6,897 (100.0%) |
Housing Structure by Heating Type in Chippewa County
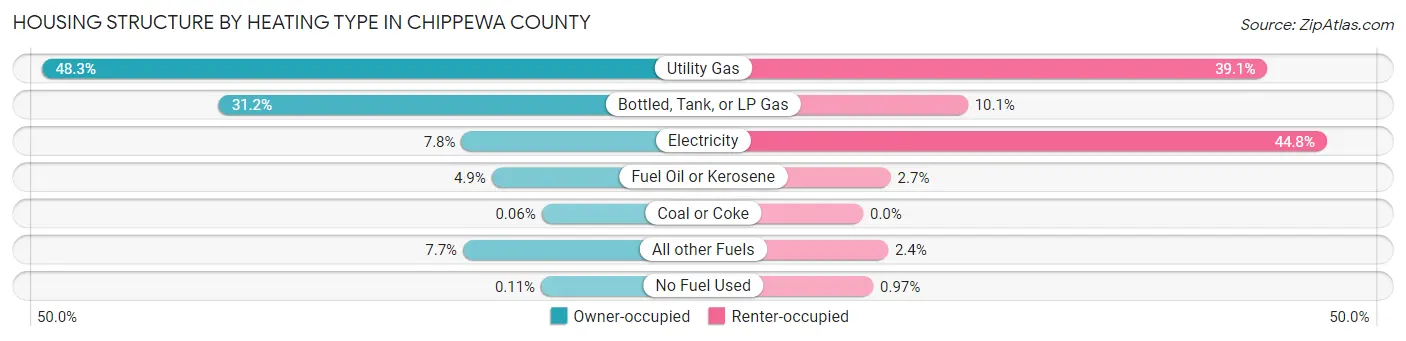
| Heating Type | Owner-occupied | Renter-occupied |
| Utility Gas | 9,379 (48.3%) | 2,693 (39.1%) |
| Bottled, Tank, or LP Gas | 6,067 (31.2%) | 697 (10.1%) |
| Electricity | 1,515 (7.8%) | 3,090 (44.8%) |
| Fuel Oil or Kerosene | 949 (4.9%) | 184 (2.7%) |
| Coal or Coke | 12 (0.1%) | 0 (0.0%) |
| All other Fuels | 1,486 (7.6%) | 166 (2.4%) |
| No Fuel Used | 21 (0.1%) | 67 (1.0%) |
| Total | 19,429 (100.0%) | 6,897 (100.0%) |
Household Vehicle Usage in Chippewa County
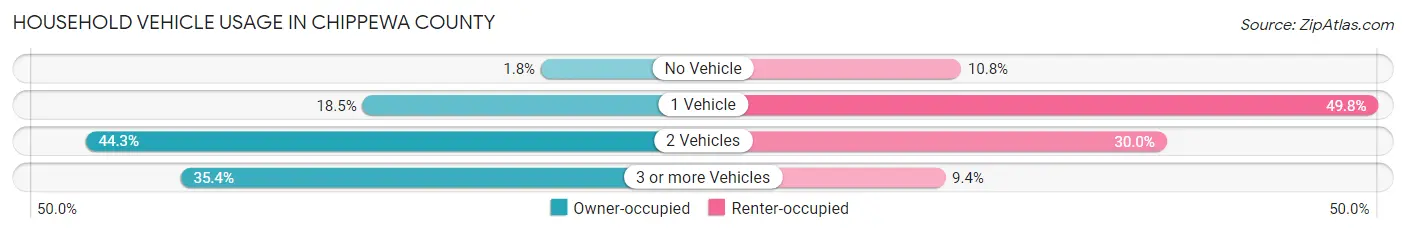
| Vehicles per Household | Owner-occupied | Renter-occupied |
| No Vehicle | 350 (1.8%) | 747 (10.8%) |
| 1 Vehicle | 3,587 (18.5%) | 3,434 (49.8%) |
| 2 Vehicles | 8,607 (44.3%) | 2,071 (30.0%) |
| 3 or more Vehicles | 6,885 (35.4%) | 645 (9.3%) |
| Total | 19,429 (100.0%) | 6,897 (100.0%) |
Real Estate & Mortgages in Chippewa County
Real Estate and Mortgage Overview in Chippewa County
| Characteristic | Without Mortgage | With Mortgage |
| Housing Units | 8,362 | 11,067 |
| Median Property Value | $204,900 | $221,300 |
| Median Household Income | $67,125 | $2,008 |
| Monthly Housing Costs | $565 | $591 |
| Real Estate Taxes | $2,665 | $54 |
Property Value by Mortgage Status in Chippewa County
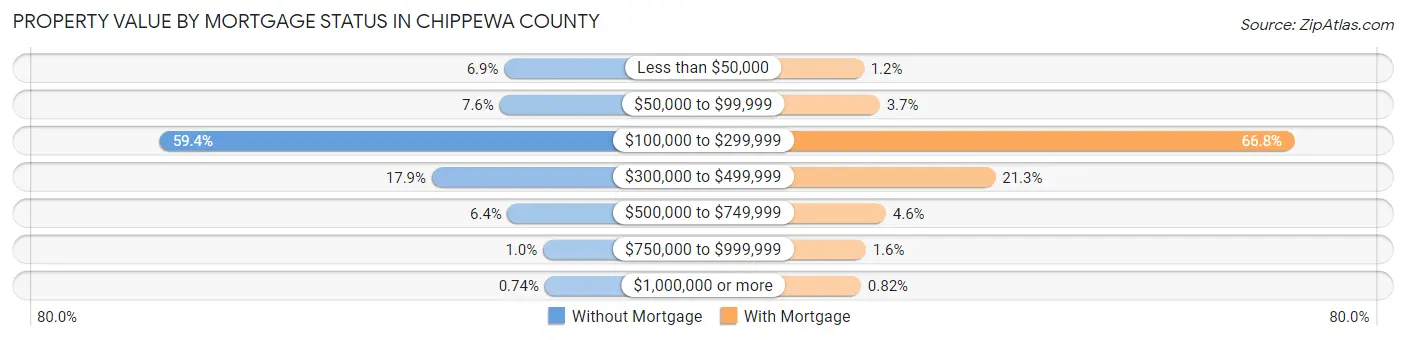
| Property Value | Without Mortgage | With Mortgage |
| Less than $50,000 | 577 (6.9%) | 137 (1.2%) |
| $50,000 to $99,999 | 637 (7.6%) | 408 (3.7%) |
| $100,000 to $299,999 | 4,968 (59.4%) | 7,392 (66.8%) |
| $300,000 to $499,999 | 1,500 (17.9%) | 2,356 (21.3%) |
| $500,000 to $749,999 | 534 (6.4%) | 511 (4.6%) |
| $750,000 to $999,999 | 84 (1.0%) | 172 (1.5%) |
| $1,000,000 or more | 62 (0.7%) | 91 (0.8%) |
| Total | 8,362 (100.0%) | 11,067 (100.0%) |
Household Income by Mortgage Status in Chippewa County
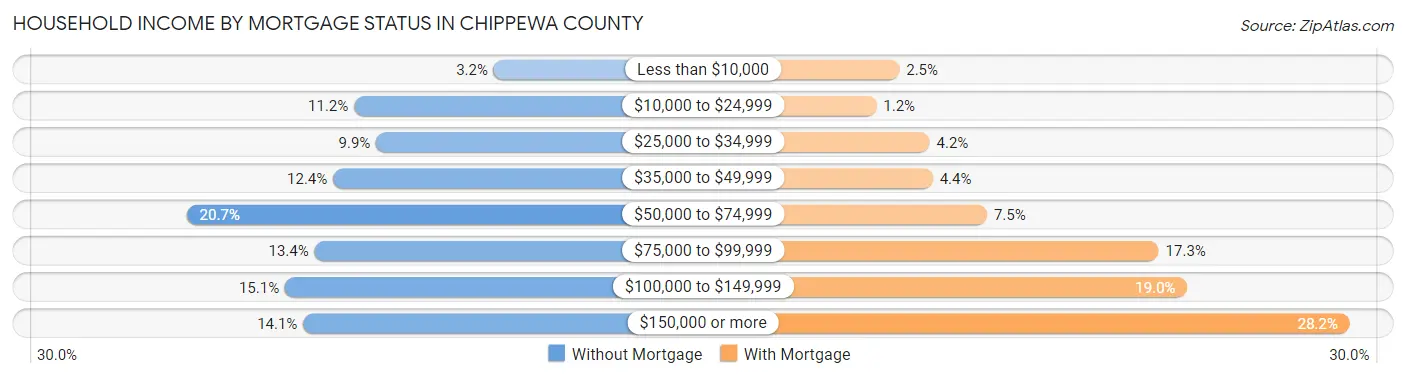
| Household Income | Without Mortgage | With Mortgage |
| Less than $10,000 | 267 (3.2%) | 277 (2.5%) |
| $10,000 to $24,999 | 934 (11.2%) | 132 (1.2%) |
| $25,000 to $34,999 | 829 (9.9%) | 468 (4.2%) |
| $35,000 to $49,999 | 1,034 (12.4%) | 488 (4.4%) |
| $50,000 to $74,999 | 1,734 (20.7%) | 831 (7.5%) |
| $75,000 to $99,999 | 1,123 (13.4%) | 1,917 (17.3%) |
| $100,000 to $149,999 | 1,264 (15.1%) | 2,098 (19.0%) |
| $150,000 or more | 1,177 (14.1%) | 3,125 (28.2%) |
| Total | 8,362 (100.0%) | 11,067 (100.0%) |
Property Value to Household Income Ratio in Chippewa County
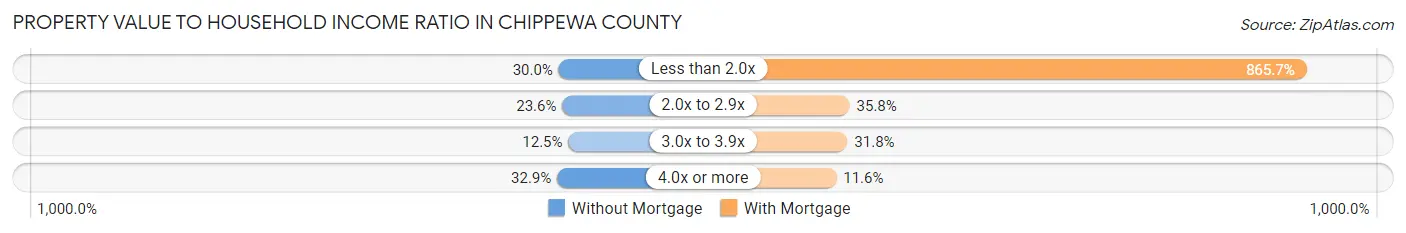
| Value-to-Income Ratio | Without Mortgage | With Mortgage |
| Less than 2.0x | 2,507 (30.0%) | 95,808 (865.7%) |
| 2.0x to 2.9x | 1,969 (23.5%) | 3,958 (35.8%) |
| 3.0x to 3.9x | 1,044 (12.5%) | 3,515 (31.8%) |
| 4.0x or more | 2,747 (32.9%) | 1,286 (11.6%) |
| Total | 8,362 (100.0%) | 11,067 (100.0%) |
Real Estate Taxes by Mortgage Status in Chippewa County
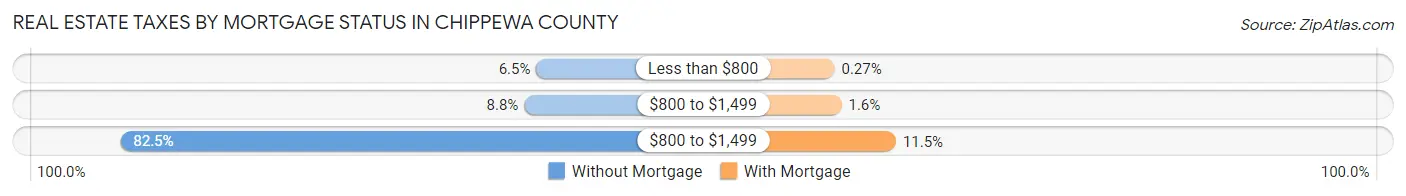
| Property Taxes | Without Mortgage | With Mortgage |
| Less than $800 | 547 (6.5%) | 30 (0.3%) |
| $800 to $1,499 | 732 (8.7%) | 172 (1.5%) |
| $800 to $1,499 | 6,899 (82.5%) | 1,272 (11.5%) |
| Total | 8,362 (100.0%) | 11,067 (100.0%) |
Health & Disability in Chippewa County
Health Insurance Coverage by Age in Chippewa County
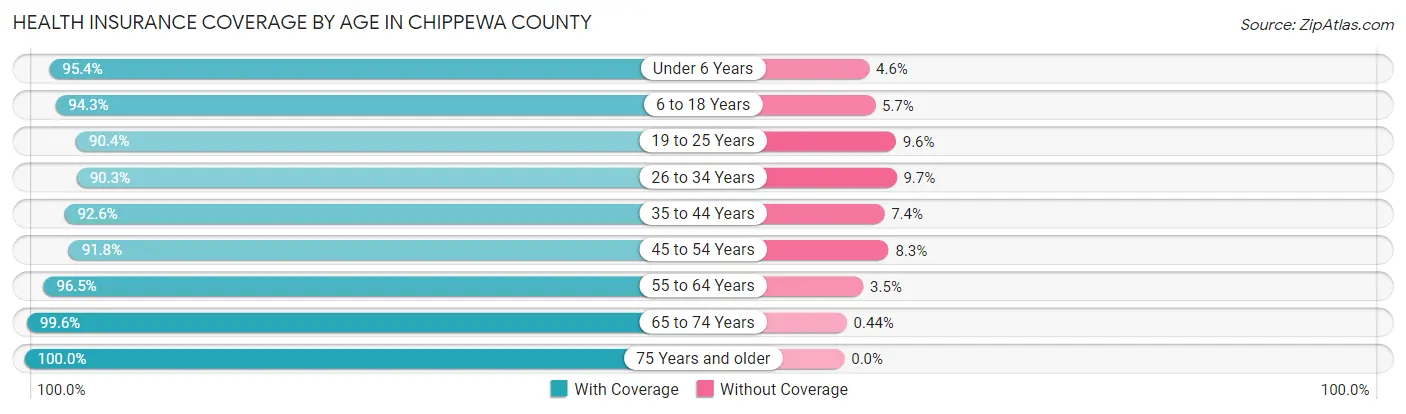
| Age Bracket | With Coverage | Without Coverage |
| Under 6 Years | 3,982 (95.4%) | 193 (4.6%) |
| 6 to 18 Years | 10,372 (94.3%) | 631 (5.7%) |
| 19 to 25 Years | 3,954 (90.4%) | 420 (9.6%) |
| 26 to 34 Years | 5,983 (90.3%) | 645 (9.7%) |
| 35 to 44 Years | 7,468 (92.6%) | 600 (7.4%) |
| 45 to 54 Years | 7,308 (91.7%) | 657 (8.3%) |
| 55 to 64 Years | 9,241 (96.5%) | 337 (3.5%) |
| 65 to 74 Years | 7,195 (99.6%) | 32 (0.4%) |
| 75 Years and older | 4,830 (100.0%) | 0 (0.0%) |
| Total | 60,333 (94.5%) | 3,515 (5.5%) |
Health Insurance Coverage by Citizenship Status in Chippewa County
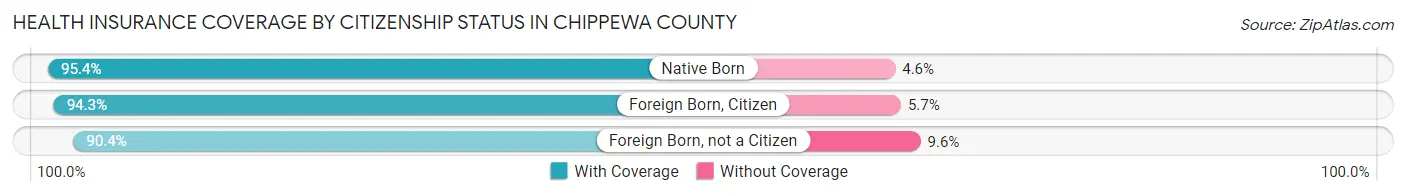
| Citizenship Status | With Coverage | Without Coverage |
| Native Born | 3,982 (95.4%) | 193 (4.6%) |
| Foreign Born, Citizen | 10,372 (94.3%) | 631 (5.7%) |
| Foreign Born, not a Citizen | 3,954 (90.4%) | 420 (9.6%) |
Health Insurance Coverage by Household Income in Chippewa County
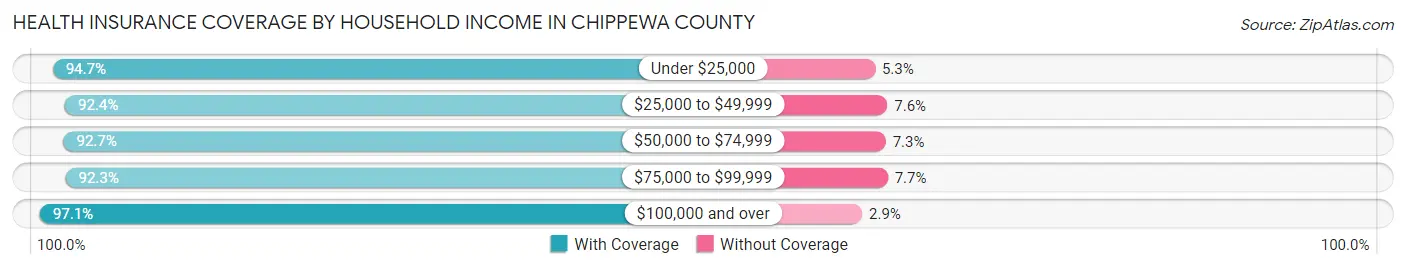
| Household Income | With Coverage | Without Coverage |
| Under $25,000 | 5,754 (94.7%) | 321 (5.3%) |
| $25,000 to $49,999 | 9,683 (92.4%) | 795 (7.6%) |
| $50,000 to $74,999 | 10,073 (92.7%) | 793 (7.3%) |
| $75,000 to $99,999 | 10,337 (92.3%) | 859 (7.7%) |
| $100,000 and over | 24,105 (97.1%) | 712 (2.9%) |
Public vs Private Health Insurance Coverage by Age in Chippewa County
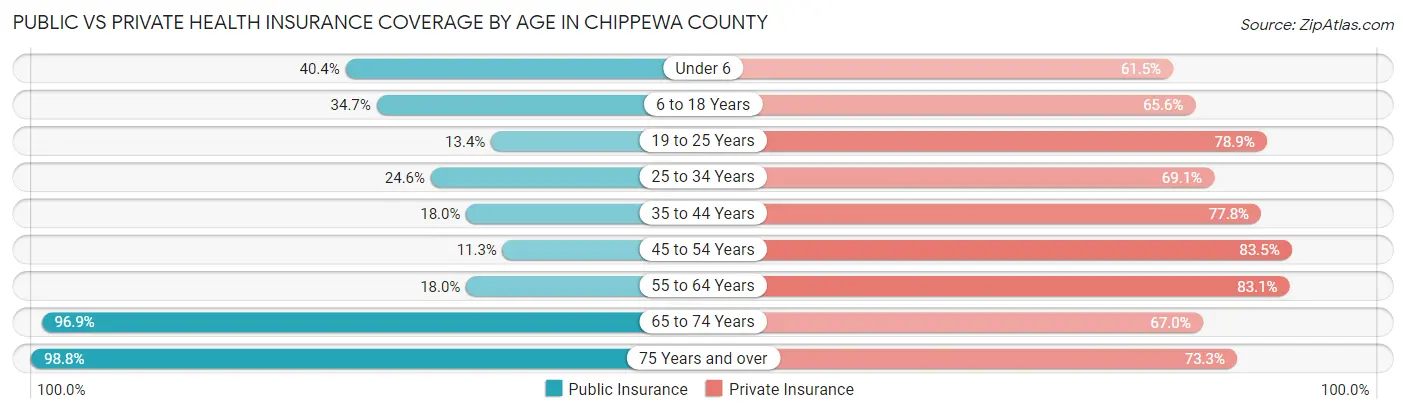
| Age Bracket | Public Insurance | Private Insurance |
| Under 6 | 1,688 (40.4%) | 2,566 (61.5%) |
| 6 to 18 Years | 3,814 (34.7%) | 7,217 (65.6%) |
| 19 to 25 Years | 586 (13.4%) | 3,449 (78.8%) |
| 25 to 34 Years | 1,630 (24.6%) | 4,577 (69.1%) |
| 35 to 44 Years | 1,453 (18.0%) | 6,276 (77.8%) |
| 45 to 54 Years | 897 (11.3%) | 6,648 (83.5%) |
| 55 to 64 Years | 1,727 (18.0%) | 7,957 (83.1%) |
| 65 to 74 Years | 7,001 (96.9%) | 4,839 (67.0%) |
| 75 Years and over | 4,772 (98.8%) | 3,541 (73.3%) |
| Total | 23,568 (36.9%) | 47,070 (73.7%) |
Disability Status by Sex by Age in Chippewa County
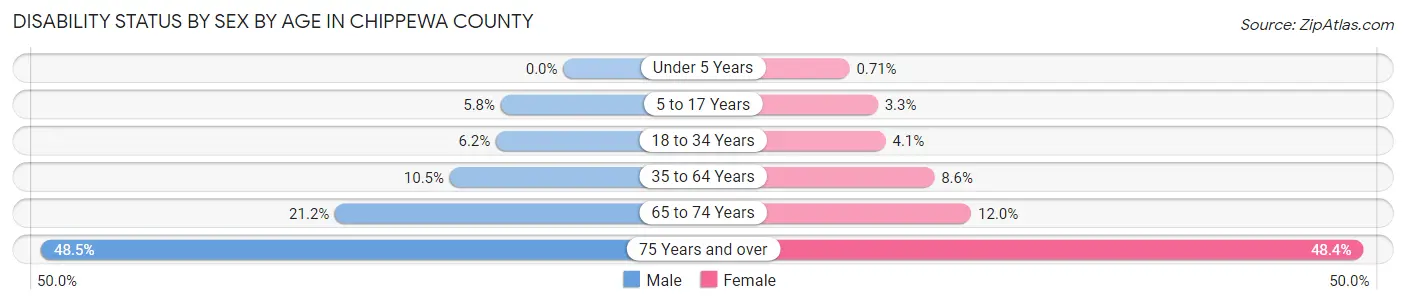
| Age Bracket | Male | Female |
| Under 5 Years | 0 (0.0%) | 13 (0.7%) |
| 5 to 17 Years | 324 (5.8%) | 175 (3.3%) |
| 18 to 34 Years | 384 (6.2%) | 230 (4.1%) |
| 35 to 64 Years | 1,394 (10.5%) | 1,062 (8.6%) |
| 65 to 74 Years | 779 (21.2%) | 426 (12.0%) |
| 75 Years and over | 1,014 (48.5%) | 1,325 (48.4%) |
Disability Class by Sex by Age in Chippewa County
Disability Class: Hearing Difficulty
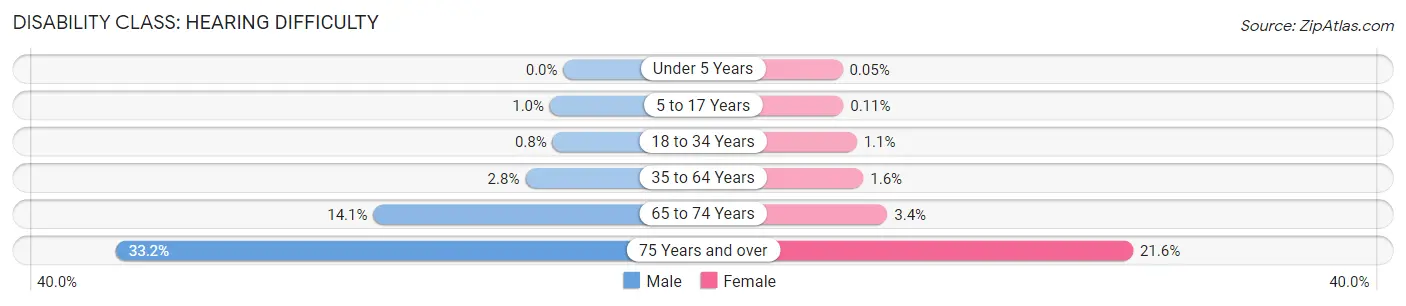
| Age Bracket | Male | Female |
| Under 5 Years | 0 (0.0%) | 1 (0.1%) |
| 5 to 17 Years | 56 (1.0%) | 6 (0.1%) |
| 18 to 34 Years | 49 (0.8%) | 63 (1.1%) |
| 35 to 64 Years | 375 (2.8%) | 198 (1.6%) |
| 65 to 74 Years | 519 (14.1%) | 120 (3.4%) |
| 75 Years and over | 695 (33.2%) | 592 (21.6%) |
Disability Class: Vision Difficulty

| Age Bracket | Male | Female |
| Under 5 Years | 0 (0.0%) | 12 (0.7%) |
| 5 to 17 Years | 31 (0.5%) | 32 (0.6%) |
| 18 to 34 Years | 24 (0.4%) | 28 (0.5%) |
| 35 to 64 Years | 184 (1.4%) | 80 (0.6%) |
| 65 to 74 Years | 114 (3.1%) | 28 (0.8%) |
| 75 Years and over | 152 (7.3%) | 165 (6.0%) |
Disability Class: Cognitive Difficulty
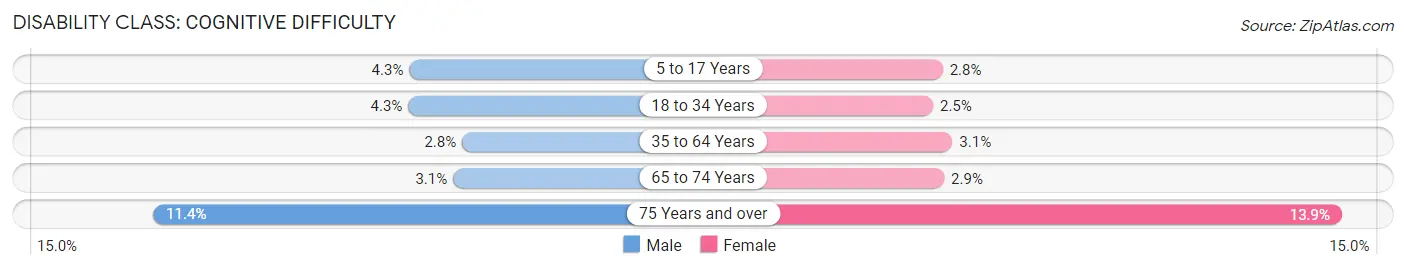
| Age Bracket | Male | Female |
| 5 to 17 Years | 240 (4.3%) | 148 (2.8%) |
| 18 to 34 Years | 266 (4.3%) | 144 (2.5%) |
| 35 to 64 Years | 373 (2.8%) | 381 (3.1%) |
| 65 to 74 Years | 113 (3.1%) | 101 (2.9%) |
| 75 Years and over | 239 (11.4%) | 381 (13.9%) |
Disability Class: Ambulatory Difficulty
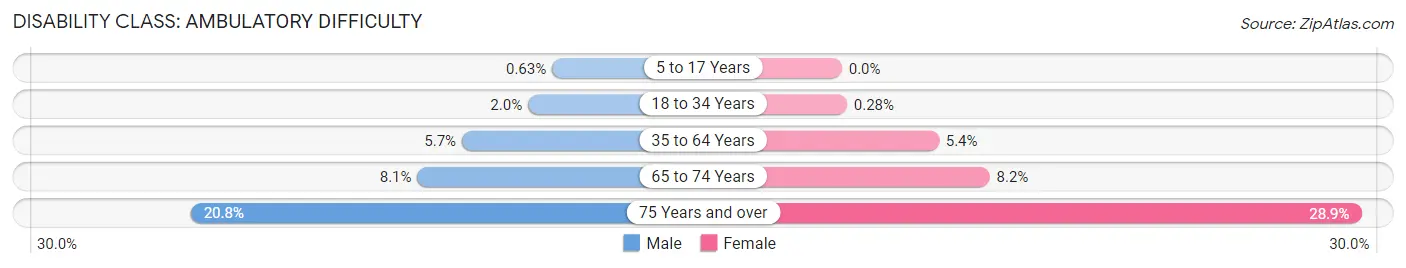
| Age Bracket | Male | Female |
| 5 to 17 Years | 35 (0.6%) | 0 (0.0%) |
| 18 to 34 Years | 121 (2.0%) | 16 (0.3%) |
| 35 to 64 Years | 748 (5.7%) | 668 (5.4%) |
| 65 to 74 Years | 299 (8.1%) | 292 (8.2%) |
| 75 Years and over | 434 (20.7%) | 792 (28.9%) |
Disability Class: Self-Care Difficulty
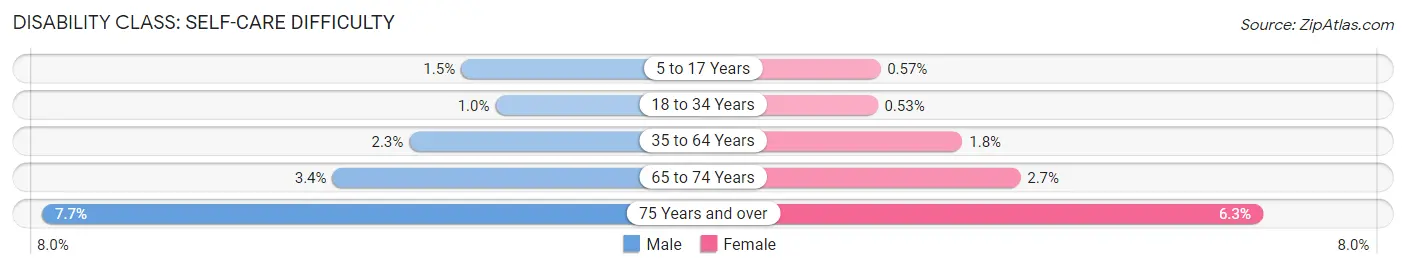
| Age Bracket | Male | Female |
| 5 to 17 Years | 85 (1.5%) | 30 (0.6%) |
| 18 to 34 Years | 62 (1.0%) | 30 (0.5%) |
| 35 to 64 Years | 303 (2.3%) | 221 (1.8%) |
| 65 to 74 Years | 126 (3.4%) | 94 (2.6%) |
| 75 Years and over | 162 (7.7%) | 171 (6.2%) |
Technology Access in Chippewa County
Computing Device Access in Chippewa County
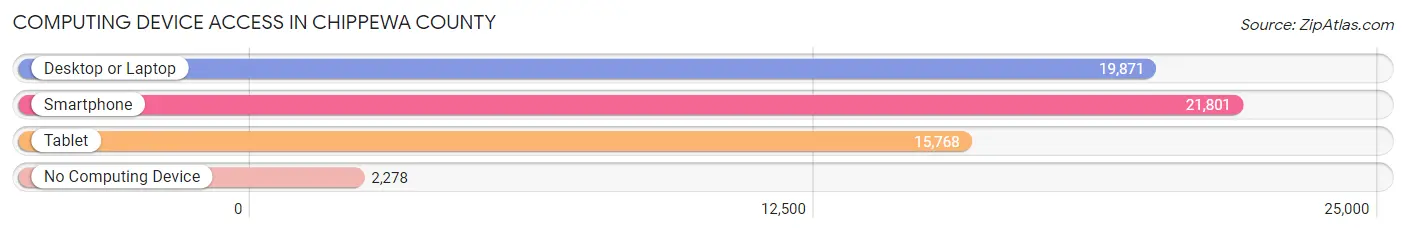
| Device Type | # Households | % Households |
| Desktop or Laptop | 19,871 | 75.5% |
| Smartphone | 21,801 | 82.8% |
| Tablet | 15,768 | 59.9% |
| No Computing Device | 2,278 | 8.6% |
| Total | 26,326 | 100.0% |
Internet Access in Chippewa County
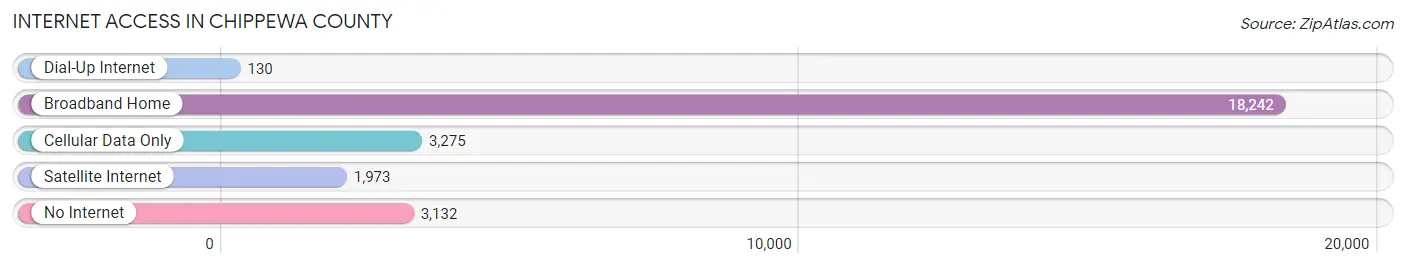
| Internet Type | # Households | % Households |
| Dial-Up Internet | 130 | 0.5% |
| Broadband Home | 18,242 | 69.3% |
| Cellular Data Only | 3,275 | 12.4% |
| Satellite Internet | 1,973 | 7.5% |
| No Internet | 3,132 | 11.9% |
| Total | 26,326 | 100.0% |
Chippewa County Summary
Chippewa County is located in the west-central part of Wisconsin, and is bordered by Barron, Dunn, Eau Claire, Rusk, and Sawyer Counties. The county seat is Chippewa Falls, and the county is named after the Chippewa River, which flows through the county. The county has a total area of 1,093 square miles, and a population of 62,415 as of the 2010 census.
History
The area that is now Chippewa County was originally inhabited by the Ojibwe people, who were part of the Algonquian-speaking people. The Ojibwe were the first to settle in the area, and they were joined by French fur traders in the late 17th century. The area was part of the Northwest Territory until 1836, when it became part of the Wisconsin Territory. Chippewa County was officially established in 1845, and was named after the Chippewa River.
The county was largely rural until the late 19th century, when the lumber industry began to boom. The lumber industry was the main source of employment in the county until the early 20th century, when the dairy industry began to take over. The county also saw an influx of immigrants from Europe, particularly from Germany and Scandinavia.
Geography
Chippewa County is located in the west-central part of Wisconsin, and is bordered by Barron, Dunn, Eau Claire, Rusk, and Sawyer Counties. The county has a total area of 1,093 square miles, and is mostly covered by forests and wetlands. The Chippewa River flows through the county, and is the main source of water for the area. The county also has several lakes, including Lake Wissota, Lake Holcombe, and Lake Wissota.
Economy
The economy of Chippewa County is largely based on agriculture and manufacturing. The county is home to several large dairy farms, and is also a major producer of corn, soybeans, and hay. The county also has several manufacturing plants, including a paper mill, a cheese factory, and a canning factory. The county is also home to several tourist attractions, including the Chippewa County Historical Society Museum and the Chippewa County Fairgrounds.
Demographics
As of the 2010 census, the population of Chippewa County was 62,415. The population is largely white (94.3%), with small percentages of African American (2.2%), Native American (1.2%), Asian (0.7%), and Hispanic or Latino (1.3%) residents. The median household income in the county is $45,945, and the median age is 41.7 years. The county has a higher-than-average poverty rate, with 13.3% of the population living below the poverty line.
Common Questions
What is the Total Population of Chippewa County?
Total Population of Chippewa County is 66,254.
What is the Total Male Population of Chippewa County?
Total Male Population of Chippewa County is 34,577.
What is the Total Female Population of Chippewa County?
Total Female Population of Chippewa County is 31,677.
What is the Ratio of Males per 100 Females in Chippewa County?
There are 109.15 Males per 100 Females in Chippewa County.
What is the Ratio of Females per 100 Males in Chippewa County?
There are 91.61 Females per 100 Males in Chippewa County.
What is the Median Population Age in Chippewa County?
Median Population Age in Chippewa County is 41.4 Years.
What is the Average Family Size in Chippewa County
Average Family Size in Chippewa County is 3.0 People.
What is the Average Household Size in Chippewa County
Average Household Size in Chippewa County is 2.4 People.
What is Per Capita Income in Chippewa County?
Per Capita income in Chippewa County is $36,180.
What is the Median Family Income in Chippewa County?
Median Family Income in Chippewa County is $86,600.
What is the Median Household income in Chippewa County?
Median Household Income in Chippewa County is $69,815.
What is Income or Wage Gap in Chippewa County?
Income or Wage Gap in Chippewa County is 28.1%.
Women in Chippewa County earn 71.9 cents for every dollar earned by a man.
What is Family Income Deficit in Chippewa County?
Family Income Deficit in Chippewa County is $11,216.
Families that are below poverty line in Chippewa County earn $11,216 less on average than the poverty threshold level.
What is Inequality or Gini Index in Chippewa County?
Inequality or Gini Index in Chippewa County is 0.42.
How Large is the Labor Force in Chippewa County?
There are 34,120 People in the Labor Forcein in Chippewa County.
What is the Percentage of People in the Labor Force in Chippewa County?
63.7% of People are in the Labor Force in Chippewa County.
What is the Unemployment Rate in Chippewa County?
Unemployment Rate in Chippewa County is 3.0%.