Calumet County, WI
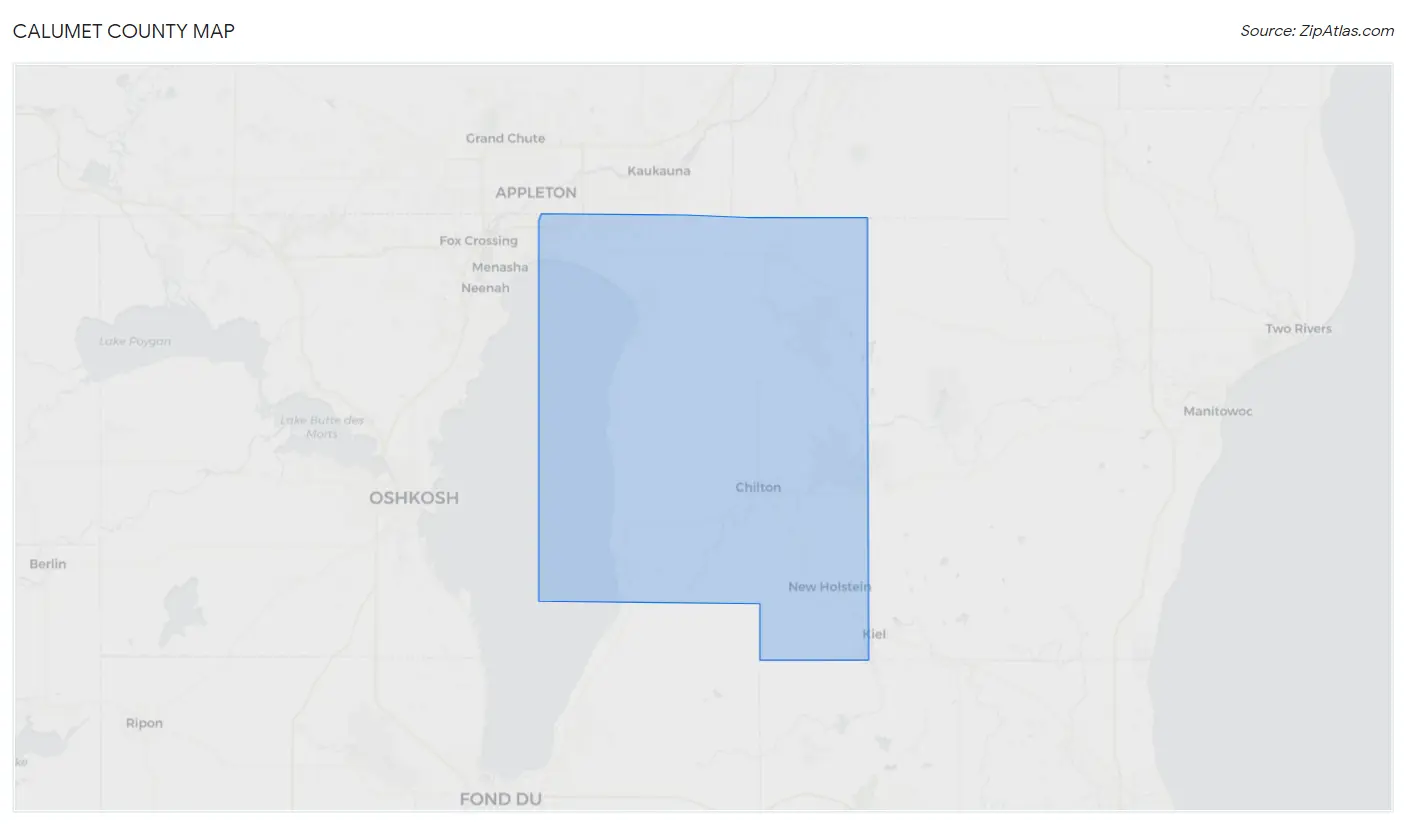
Calumet County Map
Calumet County Overview
52,361
TOTAL POPULATION
26,565
MALE POPULATION
25,796
FEMALE POPULATION
102.98
MALES / 100 FEMALES
97.11
FEMALES / 100 MALES
41.7
MEDIAN AGE
3.0
AVG FAMILY SIZE
2.5
AVG HOUSEHOLD SIZE
$42,110
PER CAPITA INCOME
$103,656
AVG FAMILY INCOME
$84,151
AVG HOUSEHOLD INCOME
30.0%
WAGE / INCOME GAP [ % ]
70.0¢/ $1
WAGE / INCOME GAP [ $ ]
$7,369
FAMILY INCOME DEFICIT
0.41
INEQUALITY / GINI INDEX
29,641
LABOR FORCE [ PEOPLE ]
70.6%
PERCENT IN LABOR FORCE
2.3%
UNEMPLOYMENT RATE
Calumet County Area Codes
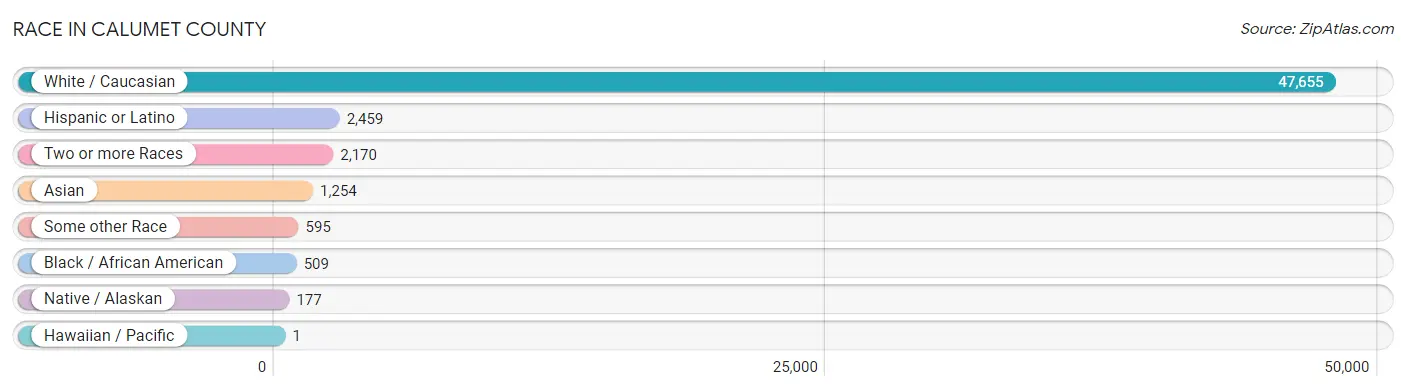
Race in Calumet County
The most populous races in Calumet County are White / Caucasian (47,655 | 91.0%), Hispanic or Latino (2,459 | 4.7%), and Two or more Races (2,170 | 4.1%).
| Race | # Population | % Population |
| Asian | 1,254 | 2.4% |
| Black / African American | 509 | 1.0% |
| Hawaiian / Pacific | 1 | 0.0% |
| Hispanic or Latino | 2,459 | 4.7% |
| Native / Alaskan | 177 | 0.3% |
| White / Caucasian | 47,655 | 91.0% |
| Two or more Races | 2,170 | 4.1% |
| Some other Race | 595 | 1.1% |
| Total | 52,361 | 100.0% |
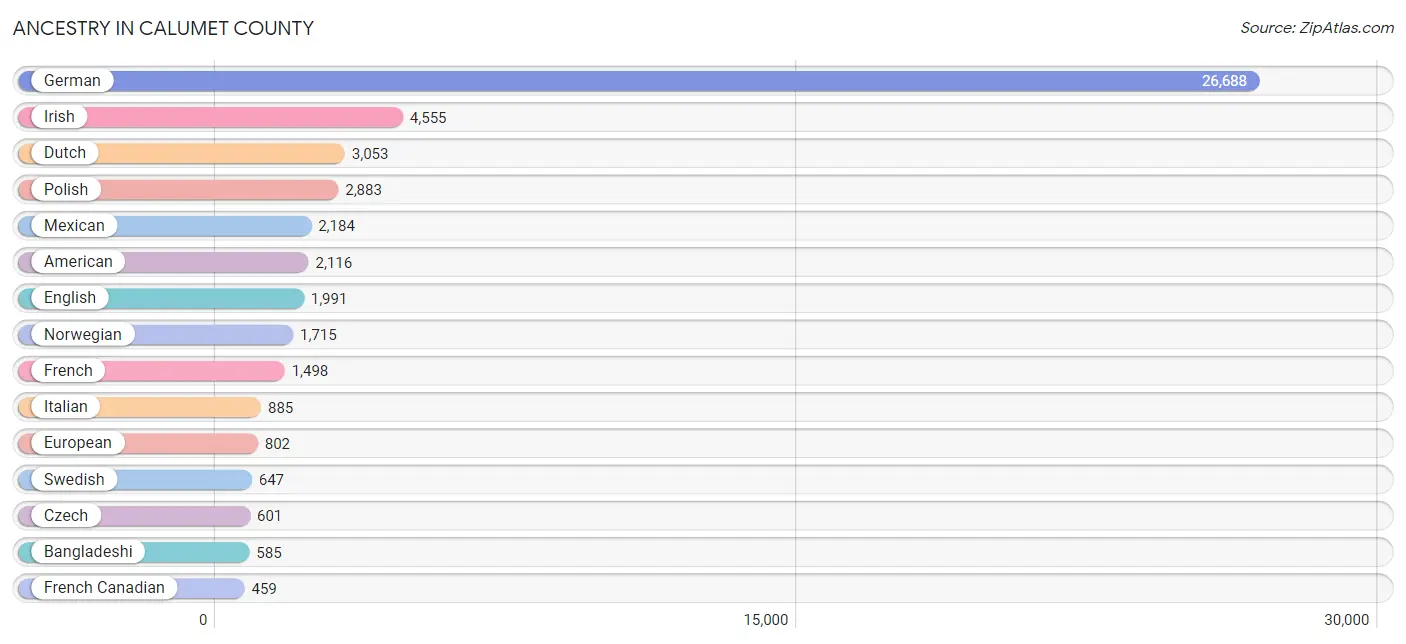
Ancestry in Calumet County
The most populous ancestries reported in Calumet County are German (26,688 | 51.0%), Irish (4,555 | 8.7%), Dutch (3,053 | 5.8%), Polish (2,883 | 5.5%), and Mexican (2,184 | 4.2%), together accounting for 75.2% of all Calumet County residents.
| Ancestry | # Population | % Population |
| African | 3 | 0.0% |
| Albanian | 3 | 0.0% |
| American | 2,116 | 4.0% |
| Arab | 25 | 0.1% |
| Arapaho | 3 | 0.0% |
| Argentinean | 4 | 0.0% |
| Armenian | 8 | 0.0% |
| Austrian | 188 | 0.4% |
| Bangladeshi | 585 | 1.1% |
| Belgian | 373 | 0.7% |
| Bhutanese | 155 | 0.3% |
| Brazilian | 34 | 0.1% |
| British | 61 | 0.1% |
| Burmese | 96 | 0.2% |
| Canadian | 99 | 0.2% |
| Celtic | 7 | 0.0% |
| Central American | 86 | 0.2% |
| Central American Indian | 5 | 0.0% |
| Cherokee | 37 | 0.1% |
| Chippewa | 40 | 0.1% |
| Costa Rican | 17 | 0.0% |
| Croatian | 124 | 0.2% |
| Cuban | 31 | 0.1% |
| Czech | 601 | 1.1% |
| Czechoslovakian | 39 | 0.1% |
| Danish | 268 | 0.5% |
| Dutch | 3,053 | 5.8% |
| Eastern European | 102 | 0.2% |
| Ecuadorian | 18 | 0.0% |
| English | 1,991 | 3.8% |
| Ethiopian | 14 | 0.0% |
| European | 802 | 1.5% |
| Finnish | 202 | 0.4% |
| French | 1,498 | 2.9% |
| French Canadian | 459 | 0.9% |
| German | 26,688 | 51.0% |
| Greek | 61 | 0.1% |
| Guatemalan | 69 | 0.1% |
| Haitian | 16 | 0.0% |
| Hungarian | 178 | 0.3% |
| Indian (Asian) | 57 | 0.1% |
| Irish | 4,555 | 8.7% |
| Iroquois | 94 | 0.2% |
| Italian | 885 | 1.7% |
| Japanese | 7 | 0.0% |
| Korean | 56 | 0.1% |
| Latvian | 7 | 0.0% |
| Lebanese | 19 | 0.0% |
| Lithuanian | 25 | 0.1% |
| Luxembourger | 24 | 0.1% |
| Macedonian | 11 | 0.0% |
| Malaysian | 75 | 0.1% |
| Menominee | 21 | 0.0% |
| Mexican | 2,184 | 4.2% |
| Mexican American Indian | 8 | 0.0% |
| Native Hawaiian | 36 | 0.1% |
| Navajo | 12 | 0.0% |
| Northern European | 66 | 0.1% |
| Norwegian | 1,715 | 3.3% |
| Polish | 2,883 | 5.5% |
| Portuguese | 6 | 0.0% |
| Puerto Rican | 47 | 0.1% |
| Russian | 389 | 0.7% |
| Scandinavian | 367 | 0.7% |
| Scotch-Irish | 74 | 0.1% |
| Scottish | 271 | 0.5% |
| Shoshone | 2 | 0.0% |
| Sioux | 3 | 0.0% |
| Slavic | 25 | 0.1% |
| Slovak | 5 | 0.0% |
| Slovene | 20 | 0.0% |
| South American | 22 | 0.0% |
| South American Indian | 10 | 0.0% |
| Spaniard | 8 | 0.0% |
| Spanish | 64 | 0.1% |
| Sri Lankan | 172 | 0.3% |
| Subsaharan African | 17 | 0.0% |
| Swedish | 647 | 1.2% |
| Swiss | 184 | 0.4% |
| Syrian | 6 | 0.0% |
| Thai | 259 | 0.5% |
| Ukrainian | 19 | 0.0% |
| Welsh | 72 | 0.1% |
| West Indian | 3 | 0.0% |
| Yugoslavian | 4 | 0.0% | View All 85 Rows |
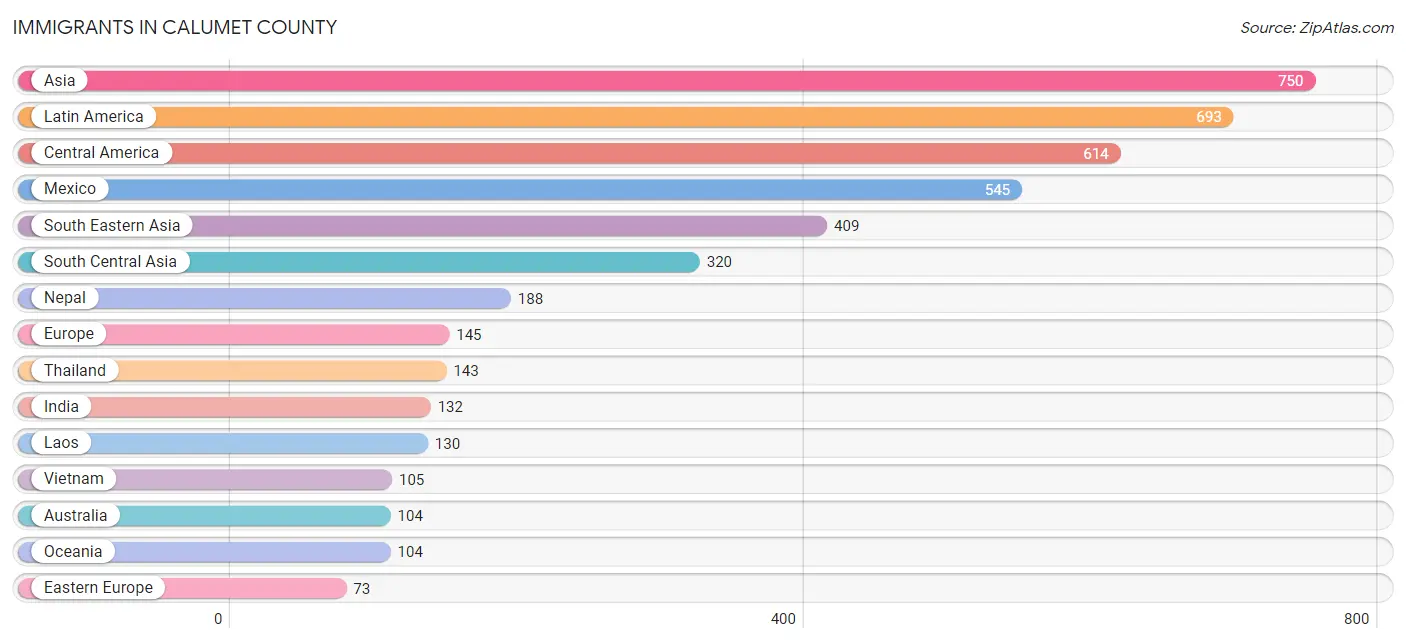
Immigrants in Calumet County
The most numerous immigrant groups reported in Calumet County came from Asia (750 | 1.4%), Latin America (693 | 1.3%), Central America (614 | 1.2%), Mexico (545 | 1.0%), and South Eastern Asia (409 | 0.8%), together accounting for 5.7% of all Calumet County residents.
| Immigration Origin | # Population | % Population |
| Africa | 14 | 0.0% |
| Albania | 3 | 0.0% |
| Argentina | 4 | 0.0% |
| Asia | 750 | 1.4% |
| Australia | 104 | 0.2% |
| Austria | 1 | 0.0% |
| Brazil | 35 | 0.1% |
| Canada | 33 | 0.1% |
| Caribbean | 18 | 0.0% |
| Central America | 614 | 1.2% |
| Chile | 4 | 0.0% |
| China | 3 | 0.0% |
| Costa Rica | 17 | 0.0% |
| Cuba | 2 | 0.0% |
| Czechoslovakia | 8 | 0.0% |
| Eastern Africa | 14 | 0.0% |
| Eastern Asia | 21 | 0.0% |
| Eastern Europe | 73 | 0.1% |
| Ecuador | 18 | 0.0% |
| England | 9 | 0.0% |
| Ethiopia | 14 | 0.0% |
| Europe | 145 | 0.3% |
| France | 14 | 0.0% |
| Germany | 24 | 0.1% |
| Guatemala | 38 | 0.1% |
| Haiti | 16 | 0.0% |
| India | 132 | 0.3% |
| Italy | 9 | 0.0% |
| Korea | 18 | 0.0% |
| Laos | 130 | 0.3% |
| Latin America | 693 | 1.3% |
| Mexico | 545 | 1.0% |
| Nepal | 188 | 0.4% |
| Netherlands | 3 | 0.0% |
| Nicaragua | 14 | 0.0% |
| North Macedonia | 4 | 0.0% |
| Northern Europe | 21 | 0.0% |
| Oceania | 104 | 0.2% |
| Philippines | 31 | 0.1% |
| Poland | 10 | 0.0% |
| Russia | 43 | 0.1% |
| Scotland | 2 | 0.0% |
| South America | 61 | 0.1% |
| South Central Asia | 320 | 0.6% |
| South Eastern Asia | 409 | 0.8% |
| Southern Europe | 9 | 0.0% |
| Thailand | 143 | 0.3% |
| Ukraine | 5 | 0.0% |
| Vietnam | 105 | 0.2% |
| Western Europe | 42 | 0.1% | View All 50 Rows |
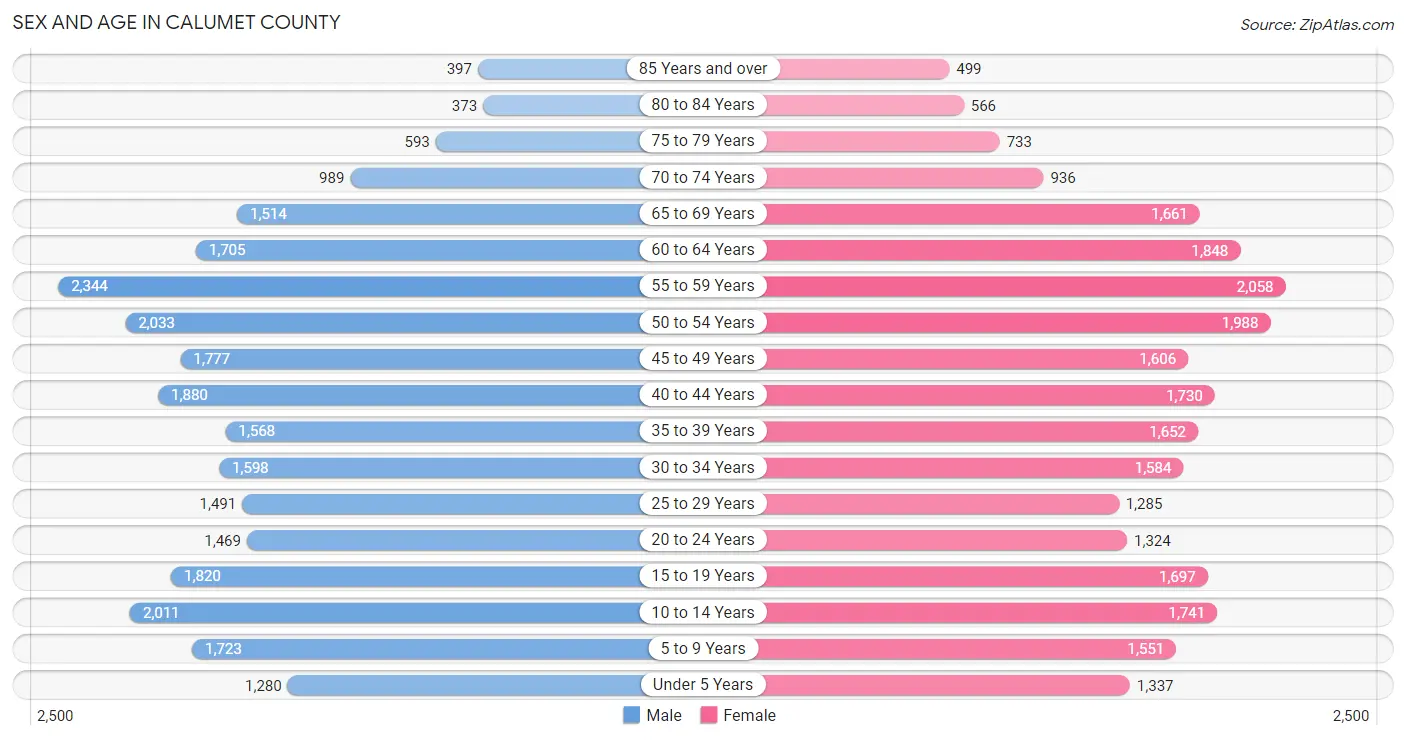
Sex and Age in Calumet County
Sex and Age in Calumet County
The most populous age groups in Calumet County are 55 to 59 Years (2,344 | 8.8%) for men and 55 to 59 Years (2,058 | 8.0%) for women.
| Age Bracket | Male | Female |
| Under 5 Years | 1,280 (4.8%) | 1,337 (5.2%) |
| 5 to 9 Years | 1,723 (6.5%) | 1,551 (6.0%) |
| 10 to 14 Years | 2,011 (7.6%) | 1,741 (6.8%) |
| 15 to 19 Years | 1,820 (6.9%) | 1,697 (6.6%) |
| 20 to 24 Years | 1,469 (5.5%) | 1,324 (5.1%) |
| 25 to 29 Years | 1,491 (5.6%) | 1,285 (5.0%) |
| 30 to 34 Years | 1,598 (6.0%) | 1,584 (6.1%) |
| 35 to 39 Years | 1,568 (5.9%) | 1,652 (6.4%) |
| 40 to 44 Years | 1,880 (7.1%) | 1,730 (6.7%) |
| 45 to 49 Years | 1,777 (6.7%) | 1,606 (6.2%) |
| 50 to 54 Years | 2,033 (7.6%) | 1,988 (7.7%) |
| 55 to 59 Years | 2,344 (8.8%) | 2,058 (8.0%) |
| 60 to 64 Years | 1,705 (6.4%) | 1,848 (7.2%) |
| 65 to 69 Years | 1,514 (5.7%) | 1,661 (6.4%) |
| 70 to 74 Years | 989 (3.7%) | 936 (3.6%) |
| 75 to 79 Years | 593 (2.2%) | 733 (2.8%) |
| 80 to 84 Years | 373 (1.4%) | 566 (2.2%) |
| 85 Years and over | 397 (1.5%) | 499 (1.9%) |
| Total | 26,565 (100.0%) | 25,796 (100.0%) |
Families and Households in Calumet County
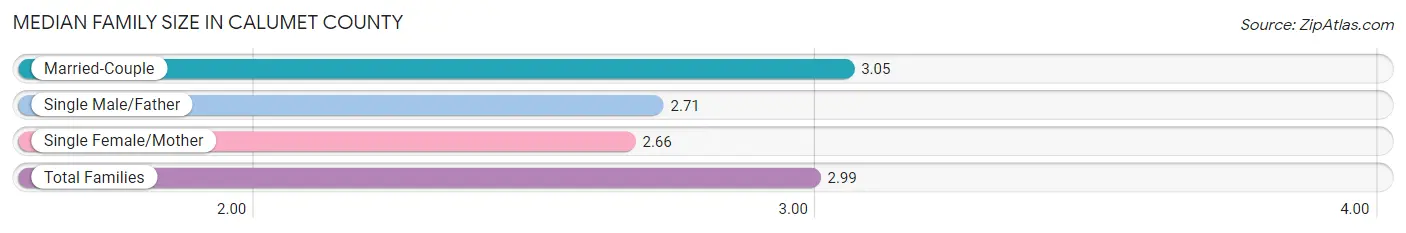
Median Family Size in Calumet County
The median family size in Calumet County is 2.99 persons per family, with married-couple families (12,474 | 83.8%) accounting for the largest median family size of 3.05 persons per family. On the other hand, single female/mother families (1,443 | 9.7%) represent the smallest median family size with 2.66 persons per family.
| Family Type | # Families | Family Size |
| Married-Couple | 12,474 (83.8%) | 3.05 |
| Single Male/Father | 961 (6.5%) | 2.71 |
| Single Female/Mother | 1,443 (9.7%) | 2.66 |
| Total Families | 14,878 (100.0%) | 2.99 |
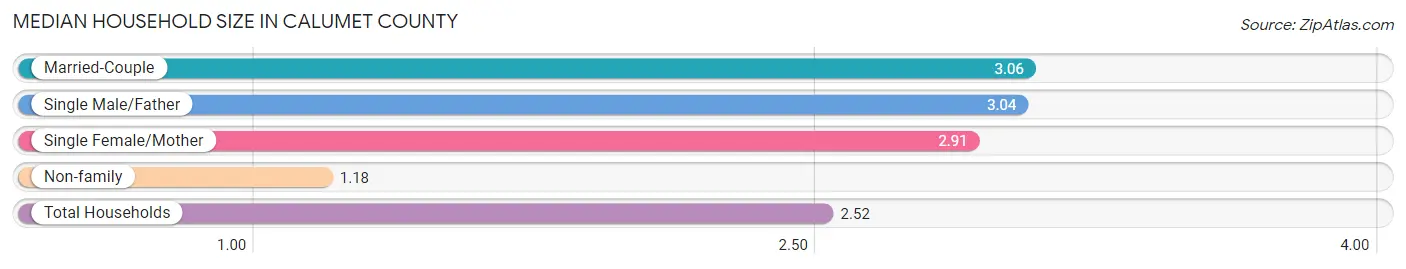
Median Household Size in Calumet County
The median household size in Calumet County is 2.52 persons per household, with married-couple households (12,474 | 60.2%) accounting for the largest median household size of 3.06 persons per household. non-family households (5,834 | 28.2%) represent the smallest median household size with 1.18 persons per household.
| Household Type | # Households | Household Size |
| Married-Couple | 12,474 (60.2%) | 3.06 |
| Single Male/Father | 961 (4.6%) | 3.04 |
| Single Female/Mother | 1,443 (7.0%) | 2.91 |
| Non-family | 5,834 (28.2%) | 1.18 |
| Total Households | 20,712 (100.0%) | 2.52 |
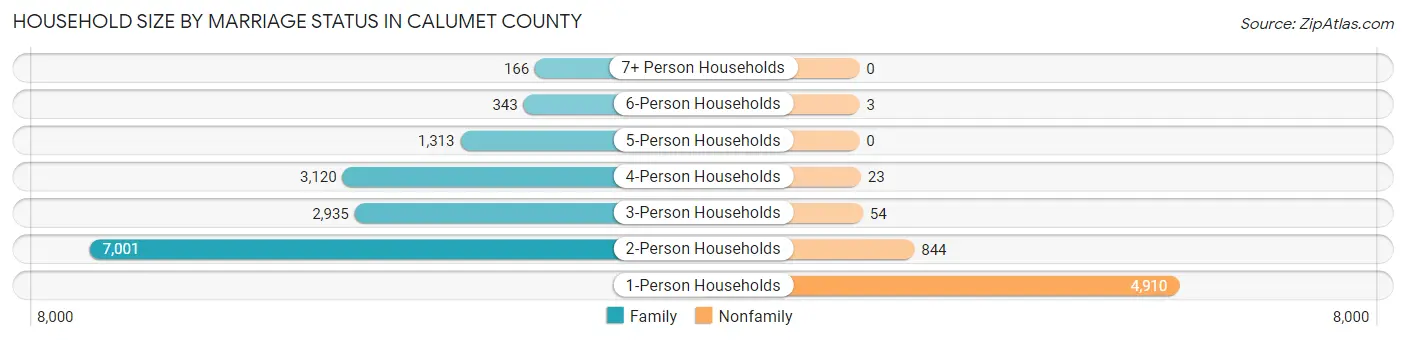
Household Size by Marriage Status in Calumet County
Out of a total of 20,712 households in Calumet County, 14,878 (71.8%) are family households, while 5,834 (28.2%) are nonfamily households. The most numerous type of family households are 2-person households, comprising 7,001, and the most common type of nonfamily households are 1-person households, comprising 4,910.
| Household Size | Family Households | Nonfamily Households |
| 1-Person Households | - | 4,910 (23.7%) |
| 2-Person Households | 7,001 (33.8%) | 844 (4.1%) |
| 3-Person Households | 2,935 (14.2%) | 54 (0.3%) |
| 4-Person Households | 3,120 (15.1%) | 23 (0.1%) |
| 5-Person Households | 1,313 (6.3%) | 0 (0.0%) |
| 6-Person Households | 343 (1.7%) | 3 (0.0%) |
| 7+ Person Households | 166 (0.8%) | 0 (0.0%) |
| Total | 14,878 (71.8%) | 5,834 (28.2%) |
Female Fertility in Calumet County
Fertility by Age in Calumet County
Average fertility rate in Calumet County is 53.0 births per 1,000 women. Women in the age bracket of 20 to 34 years have the highest fertility rate with 119.0 births per 1,000 women. Women in the age bracket of 20 to 34 years acount for 83.1% of all women with births.
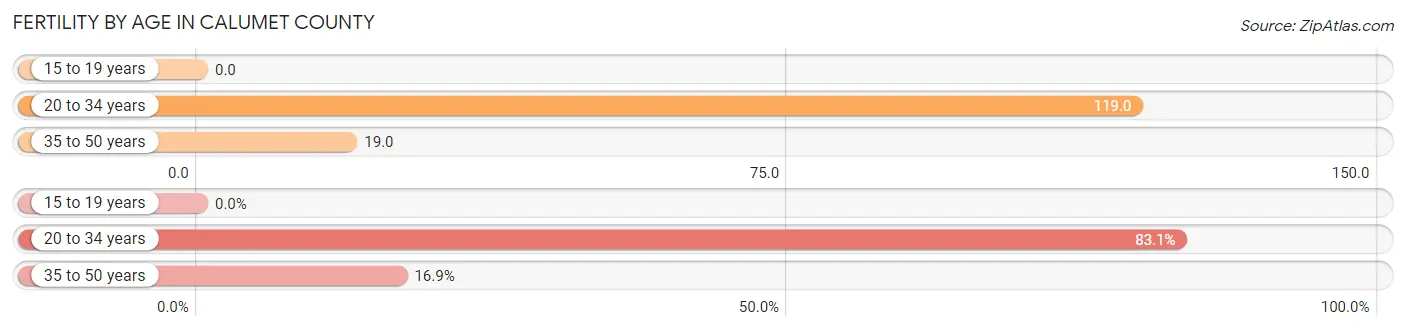
| Age Bracket | Women with Births | Births / 1,000 Women |
| 15 to 19 years | 0 (0.0%) | 0.0 |
| 20 to 34 years | 501 (83.1%) | 119.0 |
| 35 to 50 years | 102 (16.9%) | 19.0 |
| Total | 603 (100.0%) | 53.0 |
Fertility by Age by Marriage Status in Calumet County
93.7% of women with births (603) in Calumet County are married. The highest percentage of unmarried women with births falls into 20 to 34 years age bracket with 7.6% of them unmarried at the time of birth, while the lowest percentage of unmarried women with births belong to 35 to 50 years age bracket with 0.0% of them unmarried.
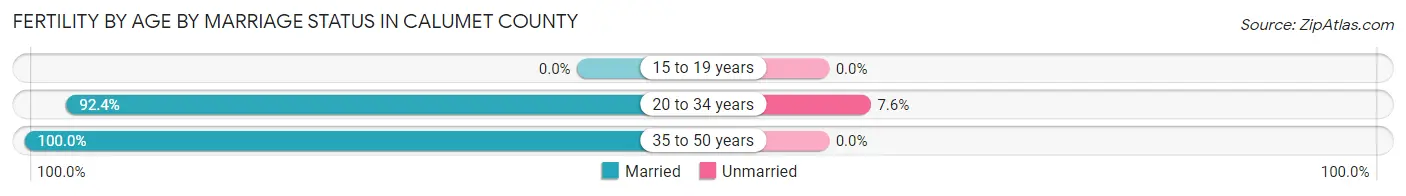
| Age Bracket | Married | Unmarried |
| 15 to 19 years | 0 (0.0%) | 0 (0.0%) |
| 20 to 34 years | 463 (92.4%) | 38 (7.6%) |
| 35 to 50 years | 102 (100.0%) | 0 (0.0%) |
| Total | 565 (93.7%) | 38 (6.3%) |
Fertility by Education in Calumet County
Average fertility rate in Calumet County is 53.0 births per 1,000 women. Women with the education attainment of bachelor's degree have the highest fertility rate of 75.0 births per 1,000 women, while women with the education attainment of less than high school have the lowest fertility at 6.0 births per 1,000 women. Women with the education attainment of bachelor's degree represent 41.1% of all women with births.
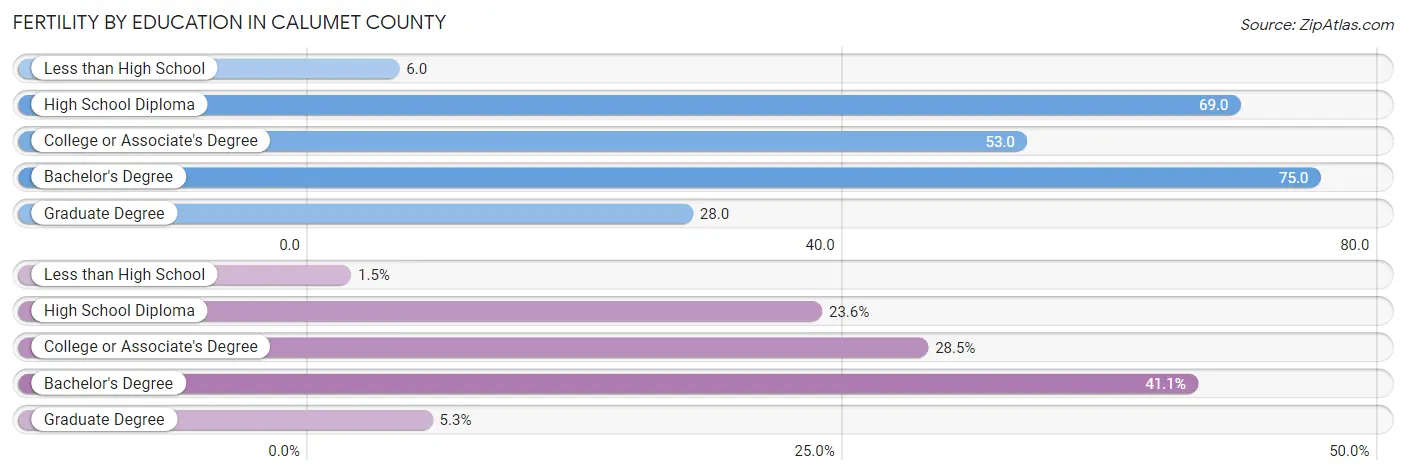
| Educational Attainment | Women with Births | Births / 1,000 Women |
| Less than High School | 9 (1.5%) | 6.0 |
| High School Diploma | 142 (23.5%) | 69.0 |
| College or Associate's Degree | 172 (28.5%) | 53.0 |
| Bachelor's Degree | 248 (41.1%) | 75.0 |
| Graduate Degree | 32 (5.3%) | 28.0 |
| Total | 603 (100.0%) | 53.0 |
Fertility by Education by Marriage Status in Calumet County
6.3% of women with births in Calumet County are unmarried. Women with the educational attainment of graduate degree are most likely to be married with 100.0% of them married at childbirth, while women with the educational attainment of less than high school are least likely to be married with 33.3% of them unmarried at childbirth.
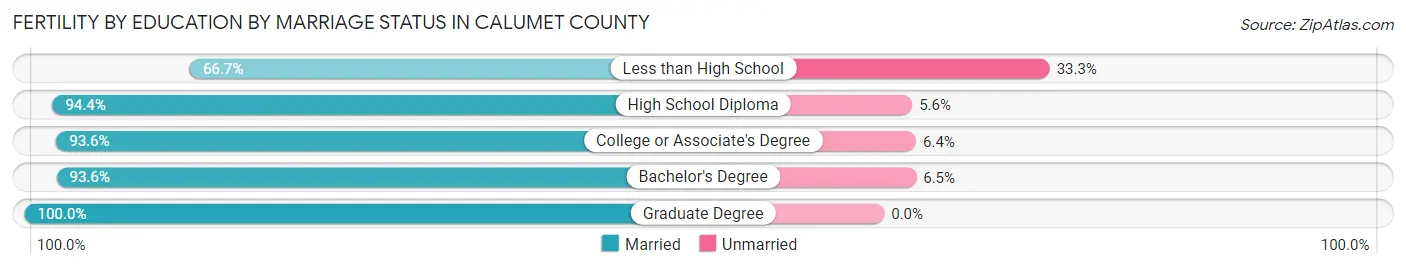
| Educational Attainment | Married | Unmarried |
| Less than High School | 6 (66.7%) | 3 (33.3%) |
| High School Diploma | 134 (94.4%) | 8 (5.6%) |
| College or Associate's Degree | 161 (93.6%) | 11 (6.4%) |
| Bachelor's Degree | 232 (93.5%) | 16 (6.5%) |
| Graduate Degree | 32 (100.0%) | 0 (0.0%) |
| Total | 565 (93.7%) | 38 (6.3%) |
Income in Calumet County
Income Overview in Calumet County
Per Capita Income in Calumet County is $42,110, while median incomes of families and households are $103,656 and $84,151 respectively.
| Characteristic | Number | Measure |
| Per Capita Income | 52,361 | $42,110 |
| Median Family Income | 14,878 | $103,656 |
| Mean Family Income | 14,878 | $121,271 |
| Median Household Income | 20,712 | $84,151 |
| Mean Household Income | 20,712 | $103,701 |
| Income Deficit | 14,878 | $7,369 |
| Wage / Income Gap (%) | 52,361 | 29.97% |
| Wage / Income Gap ($) | 52,361 | 70.03¢ per $1 |
| Gini / Inequality Index | 52,361 | 0.41 |
Earnings by Sex in Calumet County
Average Earnings in Calumet County are $48,507, $56,896 for men and $39,847 for women, a difference of 30.0%.
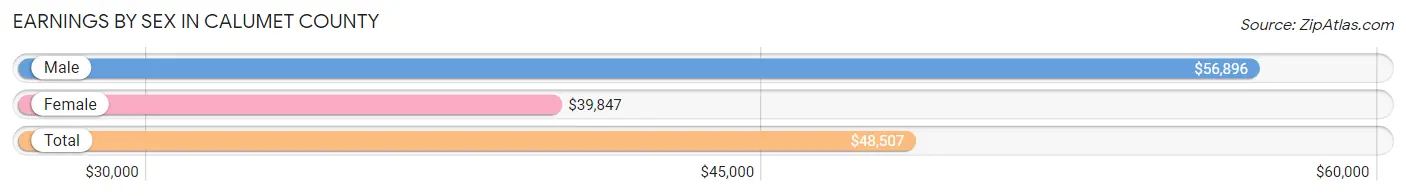
| Sex | Number | Average Earnings |
| Male | 16,635 (53.1%) | $56,896 |
| Female | 14,686 (46.9%) | $39,847 |
| Total | 31,321 (100.0%) | $48,507 |
Earnings by Sex by Income Bracket in Calumet County
The most common earnings brackets in Calumet County are $100,000+ for men (2,665 | 16.0%) and $55,000 to $64,999 for women (1,449 | 9.9%).
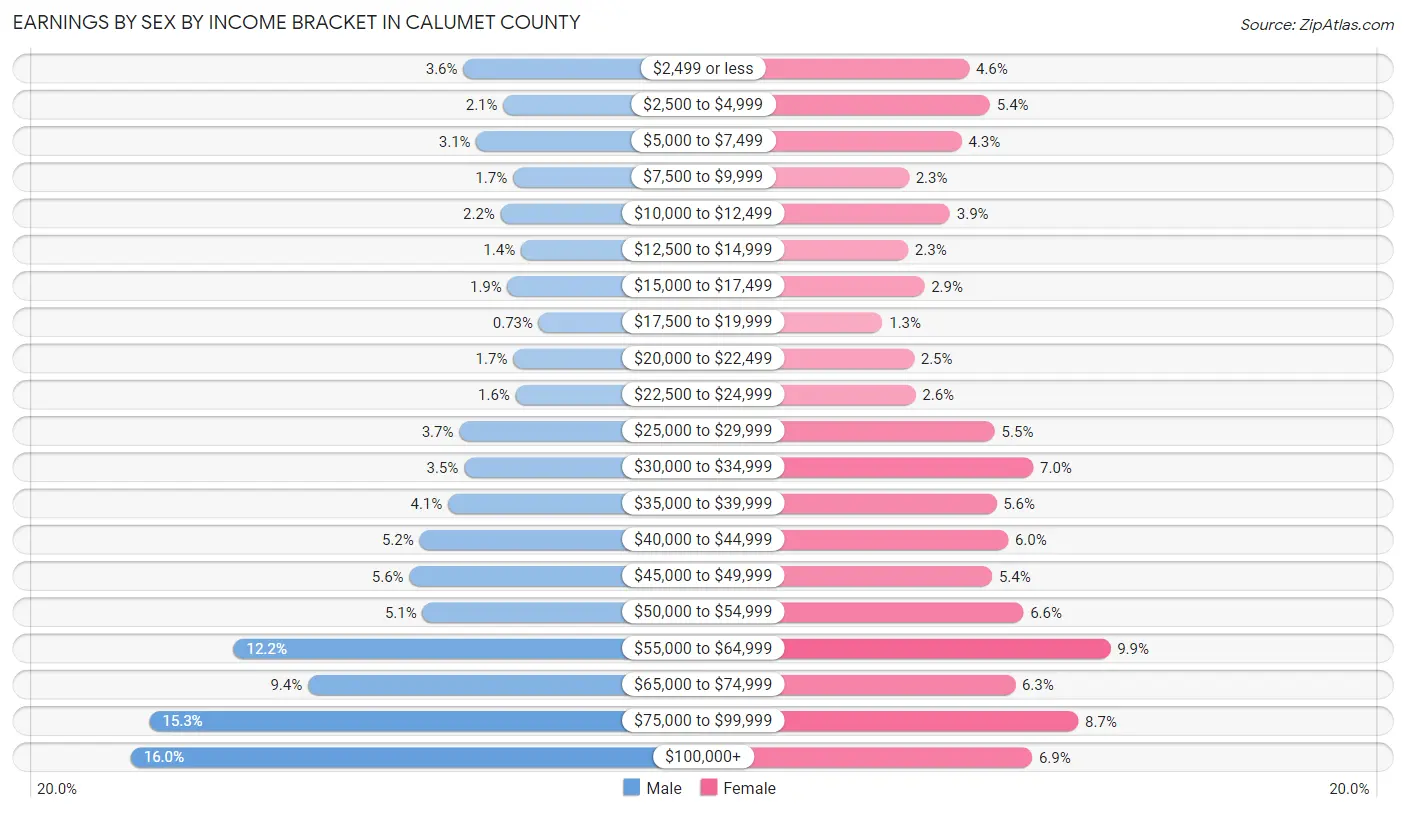
| Income | Male | Female |
| $2,499 or less | 593 (3.6%) | 672 (4.6%) |
| $2,500 to $4,999 | 342 (2.1%) | 787 (5.4%) |
| $5,000 to $7,499 | 511 (3.1%) | 632 (4.3%) |
| $7,500 to $9,999 | 283 (1.7%) | 341 (2.3%) |
| $10,000 to $12,499 | 359 (2.2%) | 567 (3.9%) |
| $12,500 to $14,999 | 233 (1.4%) | 336 (2.3%) |
| $15,000 to $17,499 | 316 (1.9%) | 426 (2.9%) |
| $17,500 to $19,999 | 122 (0.7%) | 195 (1.3%) |
| $20,000 to $22,499 | 281 (1.7%) | 368 (2.5%) |
| $22,500 to $24,999 | 266 (1.6%) | 378 (2.6%) |
| $25,000 to $29,999 | 617 (3.7%) | 813 (5.5%) |
| $30,000 to $34,999 | 587 (3.5%) | 1,025 (7.0%) |
| $35,000 to $39,999 | 687 (4.1%) | 823 (5.6%) |
| $40,000 to $44,999 | 865 (5.2%) | 887 (6.0%) |
| $45,000 to $49,999 | 928 (5.6%) | 799 (5.4%) |
| $50,000 to $54,999 | 846 (5.1%) | 971 (6.6%) |
| $55,000 to $64,999 | 2,025 (12.2%) | 1,449 (9.9%) |
| $65,000 to $74,999 | 1,560 (9.4%) | 925 (6.3%) |
| $75,000 to $99,999 | 2,549 (15.3%) | 1,273 (8.7%) |
| $100,000+ | 2,665 (16.0%) | 1,019 (6.9%) |
| Total | 16,635 (100.0%) | 14,686 (100.0%) |
Earnings by Sex by Educational Attainment in Calumet County
Average earnings in Calumet County are $63,003 for men and $45,751 for women, a difference of 27.4%. Men with an educational attainment of graduate degree enjoy the highest average annual earnings of $83,519, while those with less than high school education earn the least with $44,073. Women with an educational attainment of graduate degree earn the most with the average annual earnings of $73,873, while those with less than high school education have the smallest earnings of $32,762.
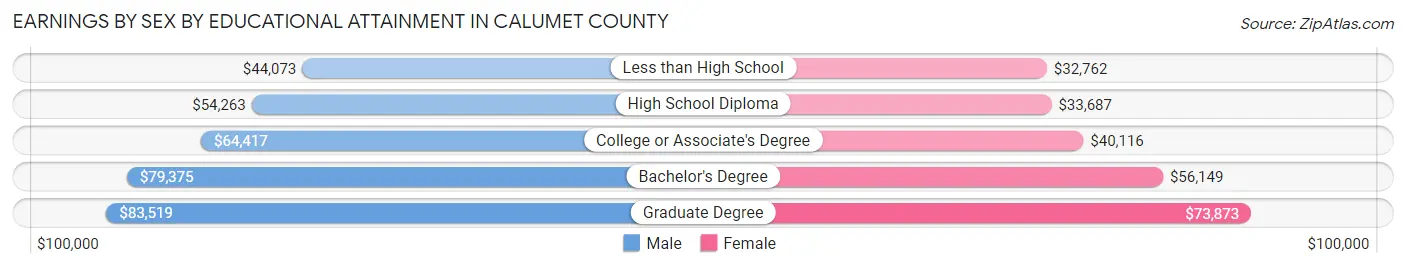
| Educational Attainment | Male Income | Female Income |
| Less than High School | $44,073 | $32,762 |
| High School Diploma | $54,263 | $33,687 |
| College or Associate's Degree | $64,417 | $40,116 |
| Bachelor's Degree | $79,375 | $56,149 |
| Graduate Degree | $83,519 | $73,873 |
| Total | $63,003 | $45,751 |
Family Income in Calumet County
Family Income Brackets in Calumet County
According to the Calumet County family income data, there are 4,315 families falling into the $100,000 to $149,999 income range, which is the most common income bracket and makes up 29.0% of all families. Conversely, the $10,000 to $14,999 income bracket is the least frequent group with only 134 families (0.9%) belonging to this category.
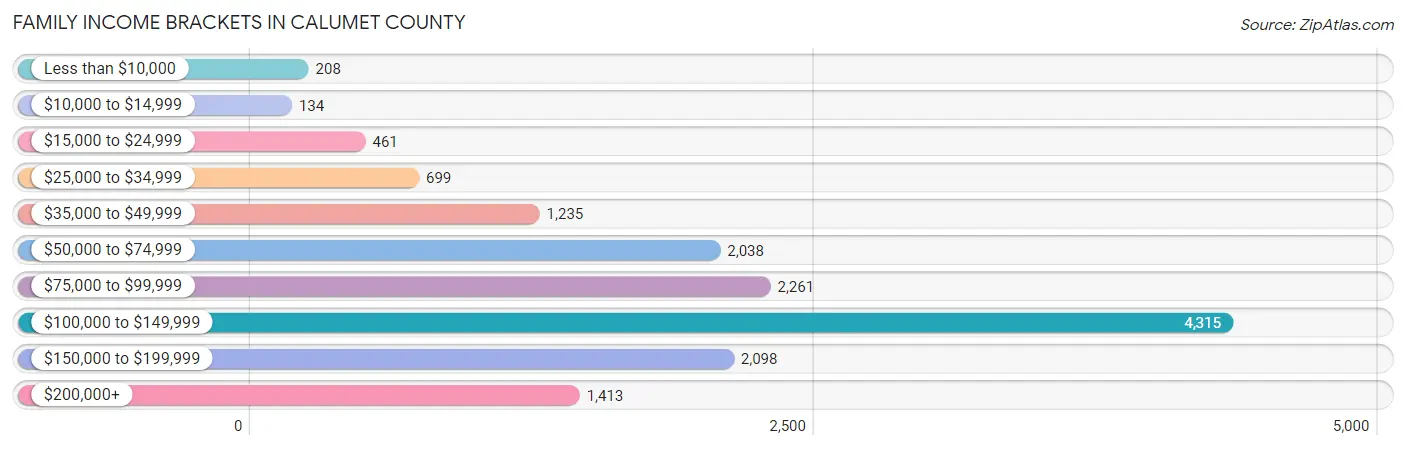
| Income Bracket | # Families | % Families |
| Less than $10,000 | 208 | 1.4% |
| $10,000 to $14,999 | 134 | 0.9% |
| $15,000 to $24,999 | 461 | 3.1% |
| $25,000 to $34,999 | 699 | 4.7% |
| $35,000 to $49,999 | 1,235 | 8.3% |
| $50,000 to $74,999 | 2,038 | 13.7% |
| $75,000 to $99,999 | 2,261 | 15.2% |
| $100,000 to $149,999 | 4,315 | 29.0% |
| $150,000 to $199,999 | 2,098 | 14.1% |
| $200,000+ | 1,413 | 9.5% |
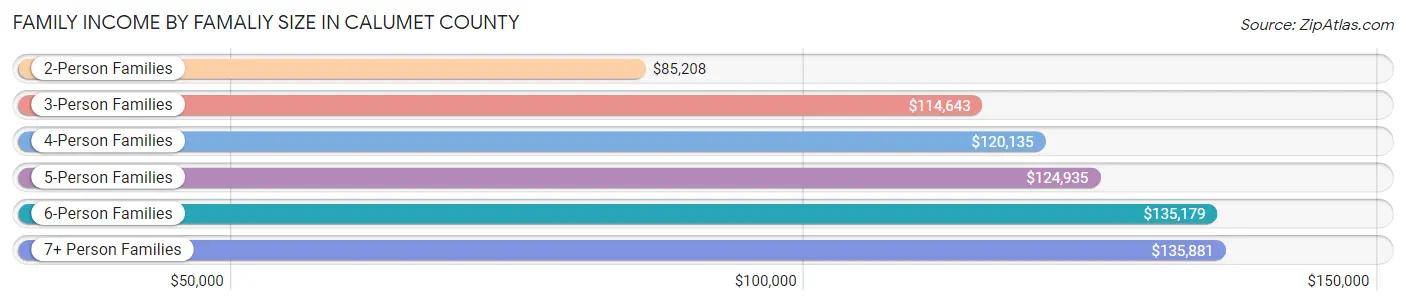
Family Income by Famaliy Size in Calumet County
7+ person families (149 | 1.0%) account for the highest median family income in Calumet County with $135,881 per family, while 2-person families (7,317 | 49.2%) have the highest median income of $42,604 per family member.
| Income Bracket | # Families | Median Income |
| 2-Person Families | 7,317 (49.2%) | $85,208 |
| 3-Person Families | 2,872 (19.3%) | $114,643 |
| 4-Person Families | 3,035 (20.4%) | $120,135 |
| 5-Person Families | 1,174 (7.9%) | $124,935 |
| 6-Person Families | 331 (2.2%) | $135,179 |
| 7+ Person Families | 149 (1.0%) | $135,881 |
| Total | 14,878 (100.0%) | $103,656 |
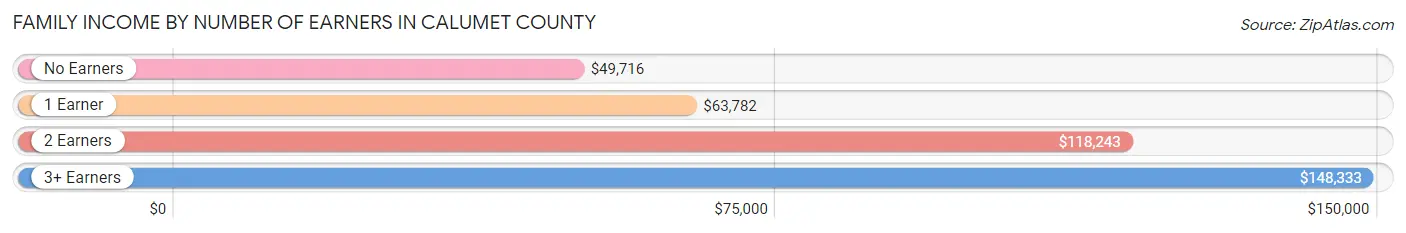
Family Income by Number of Earners in Calumet County
The median family income in Calumet County is $103,656, with families comprising 3+ earners (2,302) having the highest median family income of $148,333, while families with no earners (2,013) have the lowest median family income of $49,716, accounting for 15.5% and 13.5% of families, respectively.
| Number of Earners | # Families | Median Income |
| No Earners | 2,013 (13.5%) | $49,716 |
| 1 Earner | 3,369 (22.6%) | $63,782 |
| 2 Earners | 7,194 (48.3%) | $118,243 |
| 3+ Earners | 2,302 (15.5%) | $148,333 |
| Total | 14,878 (100.0%) | $103,656 |
Household Income in Calumet County
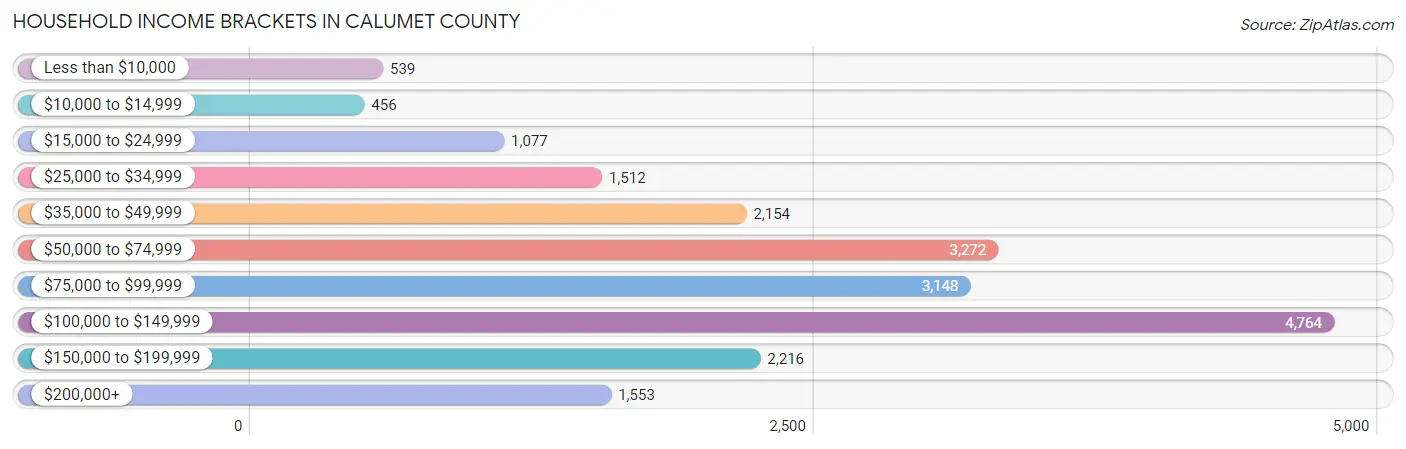
Household Income Brackets in Calumet County
With 4,764 households falling in the category, the $100,000 to $149,999 income range is the most frequent in Calumet County, accounting for 23.0% of all households. In contrast, only 456 households (2.2%) fall into the $10,000 to $14,999 income bracket, making it the least populous group.
| Income Bracket | # Households | % Households |
| Less than $10,000 | 539 | 2.6% |
| $10,000 to $14,999 | 456 | 2.2% |
| $15,000 to $24,999 | 1,077 | 5.2% |
| $25,000 to $34,999 | 1,512 | 7.3% |
| $35,000 to $49,999 | 2,154 | 10.4% |
| $50,000 to $74,999 | 3,272 | 15.8% |
| $75,000 to $99,999 | 3,148 | 15.2% |
| $100,000 to $149,999 | 4,764 | 23.0% |
| $150,000 to $199,999 | 2,216 | 10.7% |
| $200,000+ | 1,553 | 7.5% |
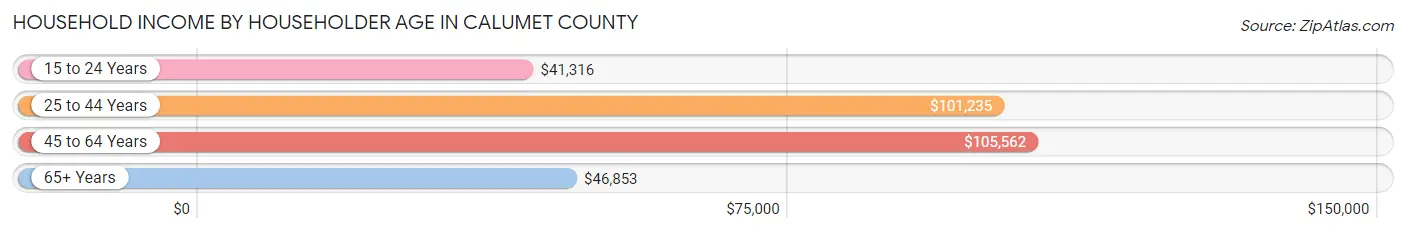
Household Income by Householder Age in Calumet County
The median household income in Calumet County is $84,151, with the highest median household income of $105,562 found in the 45 to 64 years age bracket for the primary householder. A total of 8,455 households (40.8%) fall into this category. Meanwhile, the 15 to 24 years age bracket for the primary householder has the lowest median household income of $41,316, with 528 households (2.5%) in this group.
| Income Bracket | # Households | Median Income |
| 15 to 24 Years | 528 (2.5%) | $41,316 |
| 25 to 44 Years | 6,356 (30.7%) | $101,235 |
| 45 to 64 Years | 8,455 (40.8%) | $105,562 |
| 65+ Years | 5,373 (25.9%) | $46,853 |
| Total | 20,712 (100.0%) | $84,151 |
Poverty in Calumet County
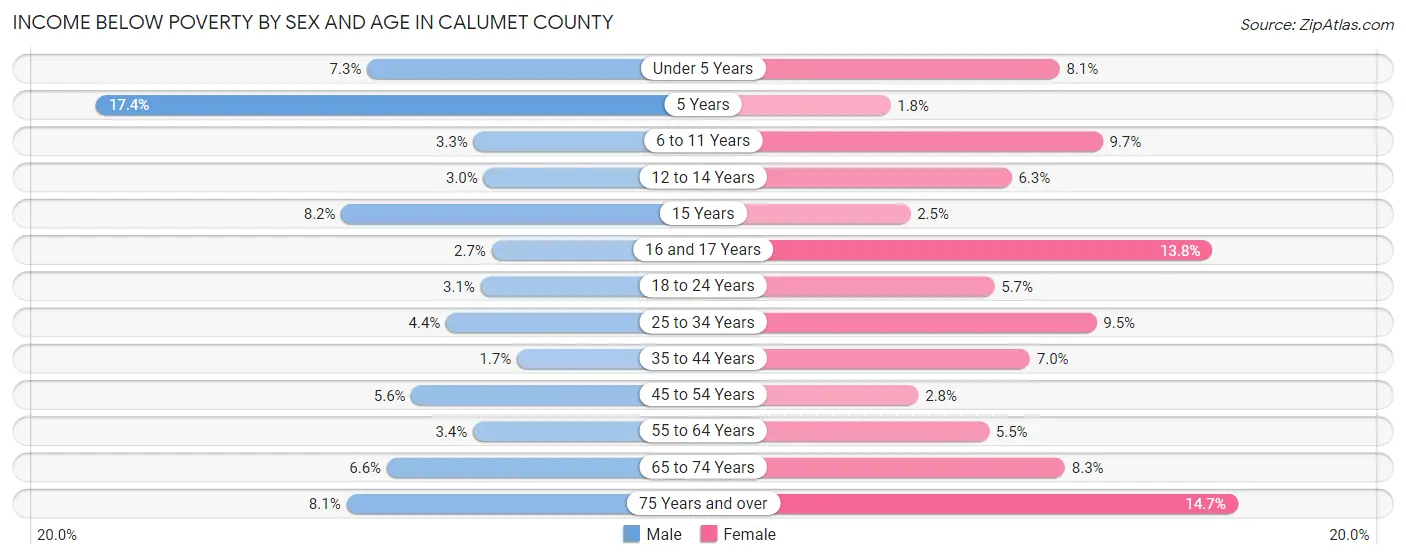
Income Below Poverty by Sex and Age in Calumet County
With 4.4% poverty level for males and 7.3% for females among the residents of Calumet County, 5 year old males and 75 year old and over females are the most vulnerable to poverty, with 38 males (17.3%) and 262 females (14.7%) in their respective age groups living below the poverty level.
| Age Bracket | Male | Female |
| Under 5 Years | 93 (7.3%) | 108 (8.1%) |
| 5 Years | 38 (17.3%) | 6 (1.8%) |
| 6 to 11 Years | 75 (3.3%) | 179 (9.7%) |
| 12 to 14 Years | 36 (3.0%) | 68 (6.3%) |
| 15 Years | 31 (8.2%) | 9 (2.5%) |
| 16 and 17 Years | 22 (2.7%) | 106 (13.8%) |
| 18 to 24 Years | 64 (3.1%) | 107 (5.7%) |
| 25 to 34 Years | 134 (4.3%) | 271 (9.5%) |
| 35 to 44 Years | 59 (1.7%) | 236 (7.0%) |
| 45 to 54 Years | 215 (5.6%) | 102 (2.8%) |
| 55 to 64 Years | 135 (3.4%) | 213 (5.5%) |
| 65 to 74 Years | 164 (6.6%) | 212 (8.3%) |
| 75 Years and over | 107 (8.1%) | 262 (14.7%) |
| Total | 1,173 (4.4%) | 1,879 (7.3%) |
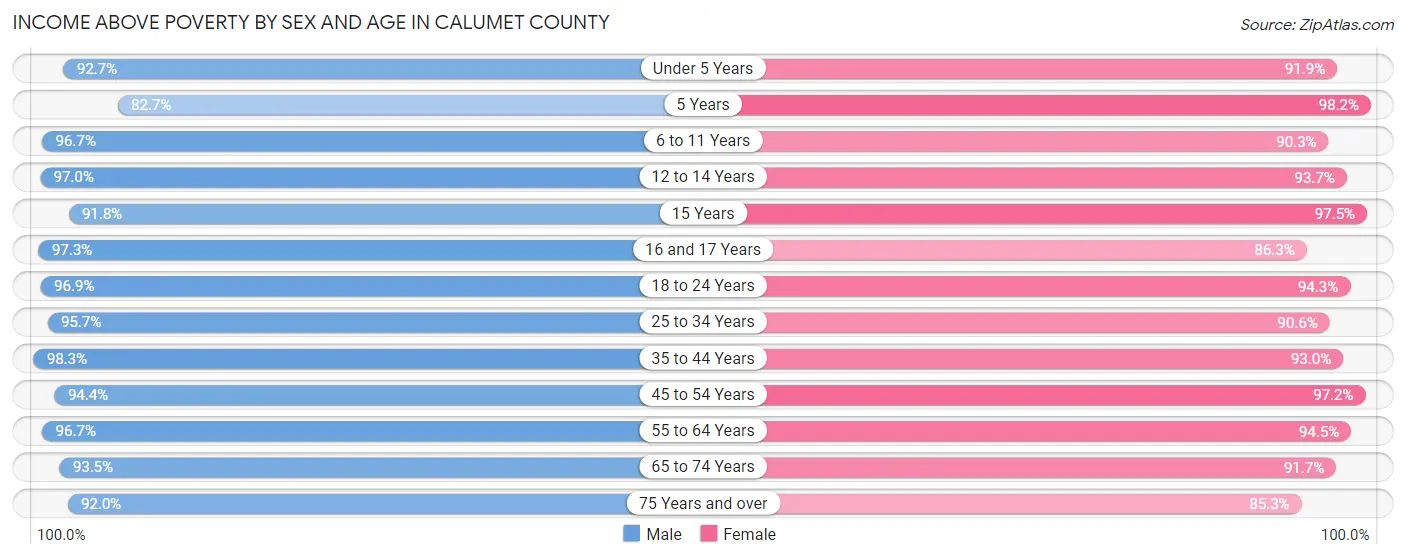
Income Above Poverty by Sex and Age in Calumet County
According to the poverty statistics in Calumet County, males aged 35 to 44 years and females aged 5 years are the age groups that are most secure financially, with 98.3% of males and 98.2% of females in these age groups living above the poverty line.
| Age Bracket | Male | Female |
| Under 5 Years | 1,185 (92.7%) | 1,229 (91.9%) |
| 5 Years | 181 (82.7%) | 327 (98.2%) |
| 6 to 11 Years | 2,180 (96.7%) | 1,670 (90.3%) |
| 12 to 14 Years | 1,179 (97.0%) | 1,012 (93.7%) |
| 15 Years | 345 (91.8%) | 346 (97.5%) |
| 16 and 17 Years | 804 (97.3%) | 665 (86.3%) |
| 18 to 24 Years | 2,021 (96.9%) | 1,785 (94.3%) |
| 25 to 34 Years | 2,947 (95.7%) | 2,597 (90.5%) |
| 35 to 44 Years | 3,373 (98.3%) | 3,146 (93.0%) |
| 45 to 54 Years | 3,595 (94.4%) | 3,492 (97.2%) |
| 55 to 64 Years | 3,900 (96.7%) | 3,687 (94.5%) |
| 65 to 74 Years | 2,338 (93.4%) | 2,347 (91.7%) |
| 75 Years and over | 1,222 (91.9%) | 1,521 (85.3%) |
| Total | 25,270 (95.6%) | 23,824 (92.7%) |
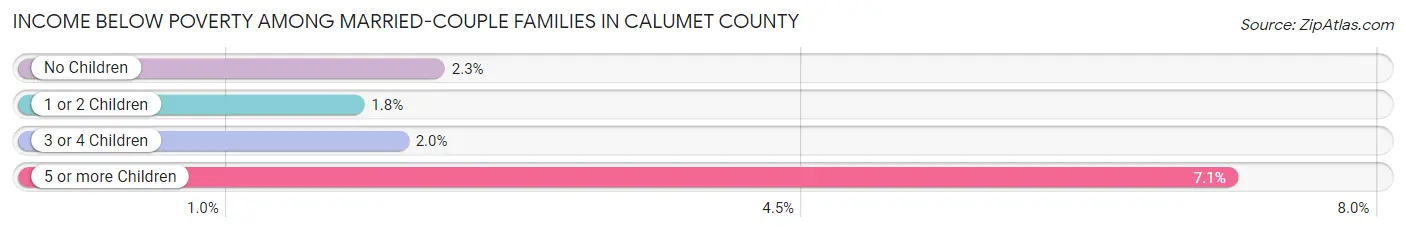
Income Below Poverty Among Married-Couple Families in Calumet County
The poverty statistics for married-couple families in Calumet County show that 2.1% or 267 of the total 12,474 families live below the poverty line. Families with 5 or more children have the highest poverty rate of 7.1%, comprising of 9 families. On the other hand, families with 1 or 2 children have the lowest poverty rate of 1.8%, which includes 66 families.
| Children | Above Poverty | Below Poverty |
| No Children | 7,322 (97.7%) | 169 (2.3%) |
| 1 or 2 Children | 3,663 (98.2%) | 66 (1.8%) |
| 3 or 4 Children | 1,104 (98.0%) | 23 (2.0%) |
| 5 or more Children | 118 (92.9%) | 9 (7.1%) |
| Total | 12,207 (97.9%) | 267 (2.1%) |
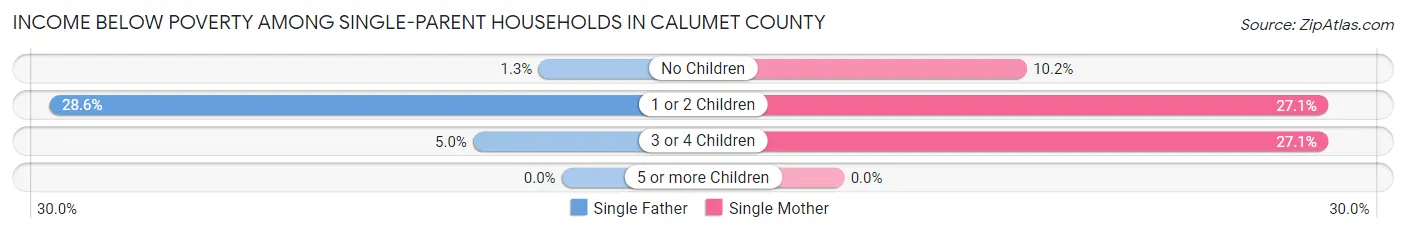
Income Below Poverty Among Single-Parent Households in Calumet County
According to the poverty data in Calumet County, 14.7% or 141 single-father households and 22.4% or 323 single-mother households are living below the poverty line. Among single-father households, those with 1 or 2 children have the highest poverty rate, with 130 households (28.6%) experiencing poverty. Likewise, among single-mother households, those with 3 or 4 children have the highest poverty rate, with 58 households (27.1%) falling below the poverty line.
| Children | Single Father | Single Mother |
| No Children | 5 (1.3%) | 41 (10.2%) |
| 1 or 2 Children | 130 (28.6%) | 224 (27.1%) |
| 3 or 4 Children | 6 (5.0%) | 58 (27.1%) |
| 5 or more Children | 0 (0.0%) | 0 (0.0%) |
| Total | 141 (14.7%) | 323 (22.4%) |
Income Below Poverty Among Married-Couple vs Single-Parent Households in Calumet County
The poverty data for Calumet County shows that 267 of the married-couple family households (2.1%) and 464 of the single-parent households (19.3%) are living below the poverty level. Within the married-couple family households, those with 5 or more children have the highest poverty rate, with 9 households (7.1%) falling below the poverty line. Among the single-parent households, those with 1 or 2 children have the highest poverty rate, with 354 household (27.6%) living below poverty.
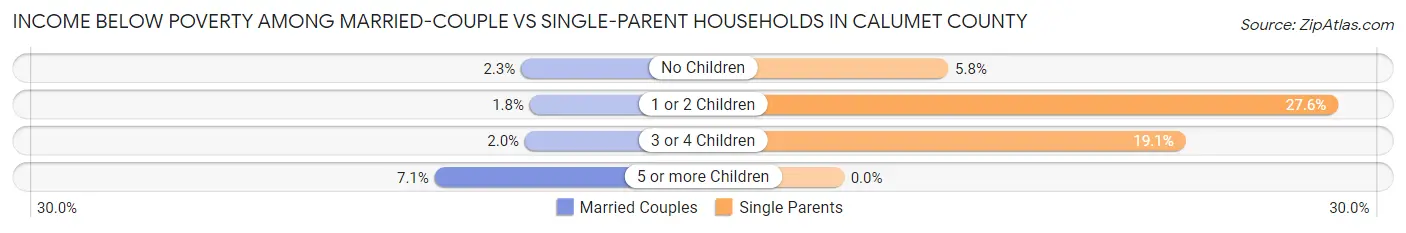
| Children | Married-Couple Families | Single-Parent Households |
| No Children | 169 (2.3%) | 46 (5.8%) |
| 1 or 2 Children | 66 (1.8%) | 354 (27.6%) |
| 3 or 4 Children | 23 (2.0%) | 64 (19.1%) |
| 5 or more Children | 9 (7.1%) | 0 (0.0%) |
| Total | 267 (2.1%) | 464 (19.3%) |
Employment Characteristics in Calumet County
Employment by Class of Employer in Calumet County
Among the 28,601 employed individuals in Calumet County, private company employees (20,918 | 73.1%), not-for-profit organizations (2,789 | 9.8%), and local government employees (2,025 | 7.1%) make up the most common classes of employment.

| Employer Class | # Employees | % Employees |
| Private Company Employees | 20,918 | 73.1% |
| Self-Employed (Incorporated) | 848 | 3.0% |
| Self-Employed (Not Incorporated) | 1,069 | 3.7% |
| Not-for-profit Organizations | 2,789 | 9.8% |
| Local Government Employees | 2,025 | 7.1% |
| State Government Employees | 699 | 2.4% |
| Federal Government Employees | 231 | 0.8% |
| Unpaid Family Workers | 22 | 0.1% |
| Total | 28,601 | 100.0% |
Employment Status by Age in Calumet County
According to the labor force statistics for Calumet County, out of the total population over 16 years of age (41,984), 70.6% or 29,641 individuals are in the labor force, with 2.3% or 682 of them unemployed. The age group with the highest labor force participation rate is 25 to 29 years, with 91.9% or 2,551 individuals in the labor force. Within the labor force, the 16 to 19 years age range has the highest percentage of unemployed individuals, with 8.9% or 169 of them being unemployed.
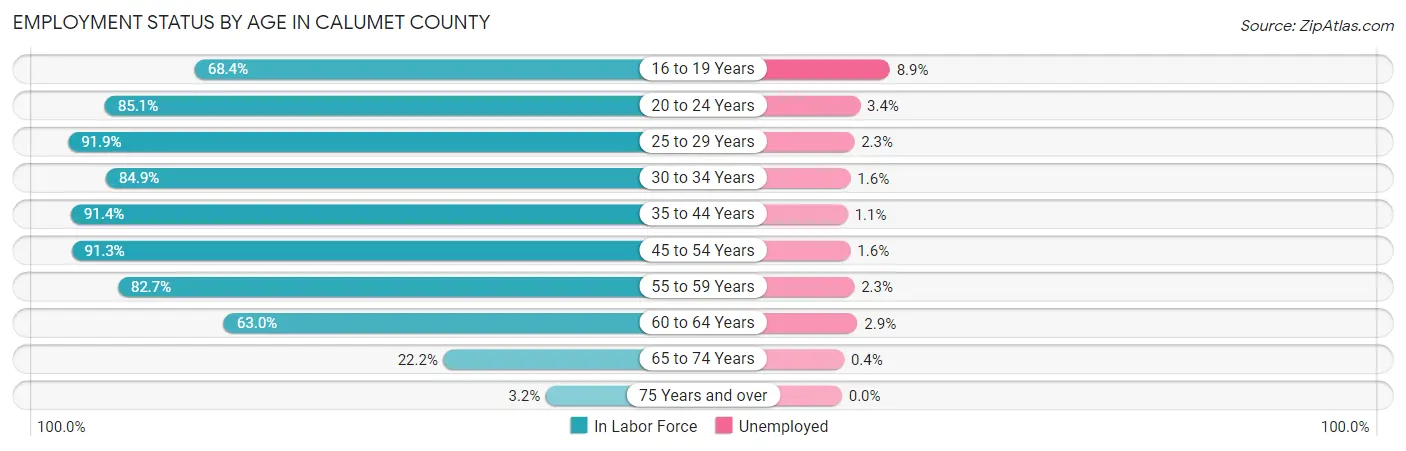
| Age Bracket | In Labor Force | Unemployed |
| 16 to 19 Years | 1,904 (68.4%) | 169 (8.9%) |
| 20 to 24 Years | 2,377 (85.1%) | 81 (3.4%) |
| 25 to 29 Years | 2,551 (91.9%) | 59 (2.3%) |
| 30 to 34 Years | 2,702 (84.9%) | 43 (1.6%) |
| 35 to 44 Years | 6,243 (91.4%) | 69 (1.1%) |
| 45 to 54 Years | 6,760 (91.3%) | 108 (1.6%) |
| 55 to 59 Years | 3,640 (82.7%) | 84 (2.3%) |
| 60 to 64 Years | 2,238 (63.0%) | 65 (2.9%) |
| 65 to 74 Years | 1,132 (22.2%) | 5 (0.4%) |
| 75 Years and over | 101 (3.2%) | 0 (0.0%) |
| Total | 29,641 (70.6%) | 682 (2.3%) |
Employment Status by Educational Attainment in Calumet County
According to labor force statistics for Calumet County, 85.7% of individuals (24,122) out of the total population between 25 and 64 years of age (28,147) are in the labor force, with 1.8% or 434 of them being unemployed. The group with the highest labor force participation rate are those with the educational attainment of bachelor's degree or higher, with 91.0% or 9,085 individuals in the labor force. Within the labor force, individuals with less than high school education have the highest percentage of unemployment, with 7.1% or 63 of them being unemployed.
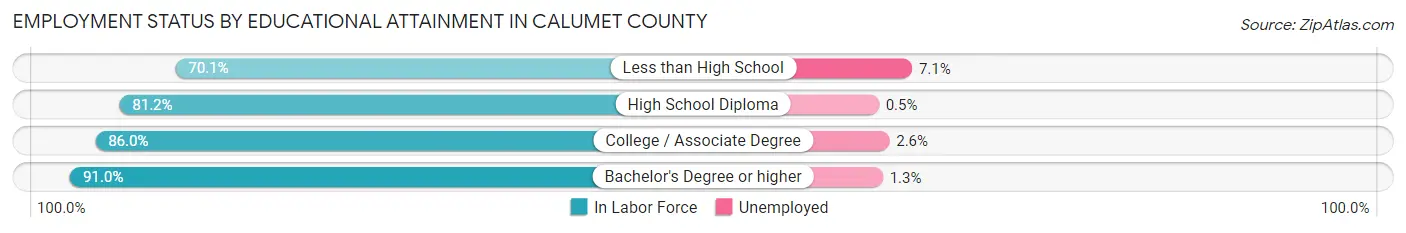
| Educational Attainment | In Labor Force | Unemployed |
| Less than High School | 890 (70.1%) | 90 (7.1%) |
| High School Diploma | 6,111 (81.2%) | 38 (0.5%) |
| College / Associate Degree | 8,056 (86.0%) | 244 (2.6%) |
| Bachelor's Degree or higher | 9,085 (91.0%) | 130 (1.3%) |
| Total | 24,122 (85.7%) | 507 (1.8%) |
Employment Occupations by Sex in Calumet County
Management, Business, Science and Arts Occupations
The most common Management, Business, Science and Arts occupations in Calumet County are Management (3,133 | 10.8%), Community & Social Service (2,491 | 8.6%), Computers, Engineering & Science (1,990 | 6.9%), Health Diagnosing & Treating (1,867 | 6.4%), and Business & Financial (1,667 | 5.8%).

Management, Business, Science and Arts Occupations by Sex
Within the Management, Business, Science and Arts occupations in Calumet County, the most male-oriented occupations are Architecture & Engineering (93.9%), Computers, Engineering & Science (78.6%), and Computers & Mathematics (74.0%), while the most female-oriented occupations are Health Technologists (86.1%), Health Diagnosing & Treating (84.9%), and Legal Services & Support (83.4%).
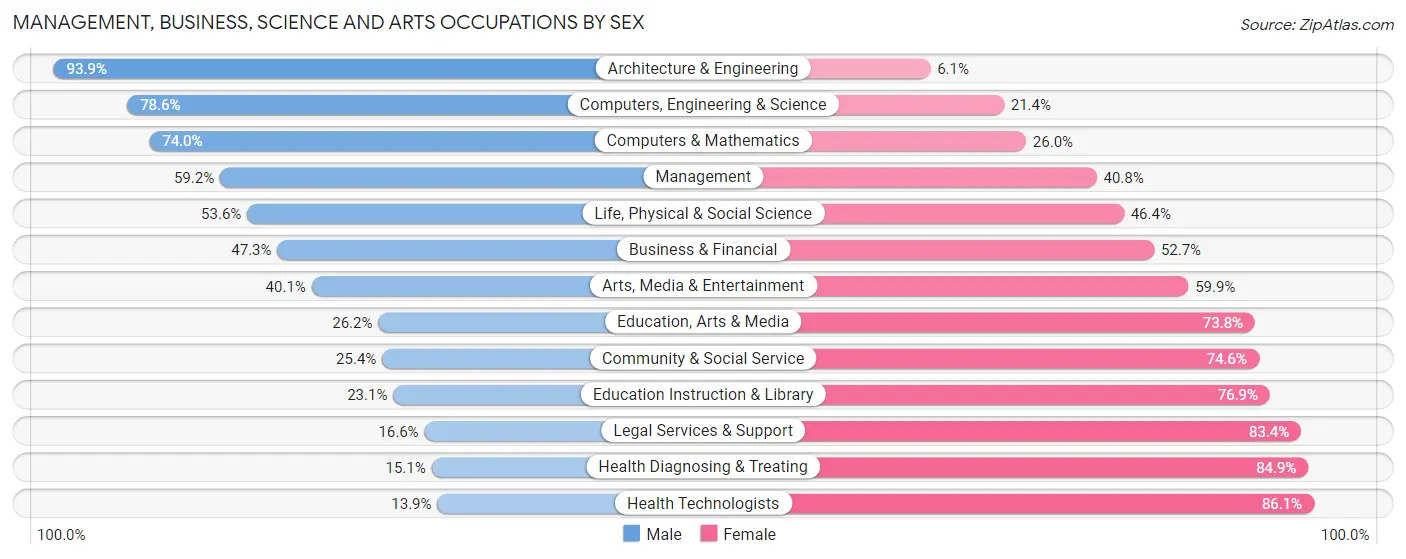
| Occupation | Male | Female |
| Management | 1,856 (59.2%) | 1,277 (40.8%) |
| Business & Financial | 788 (47.3%) | 879 (52.7%) |
| Computers, Engineering & Science | 1,564 (78.6%) | 426 (21.4%) |
| Computers & Mathematics | 671 (74.0%) | 236 (26.0%) |
| Architecture & Engineering | 728 (93.9%) | 47 (6.1%) |
| Life, Physical & Social Science | 165 (53.6%) | 143 (46.4%) |
| Community & Social Service | 633 (25.4%) | 1,858 (74.6%) |
| Education, Arts & Media | 145 (26.2%) | 408 (73.8%) |
| Legal Services & Support | 38 (16.6%) | 191 (83.4%) |
| Education Instruction & Library | 320 (23.1%) | 1,065 (76.9%) |
| Arts, Media & Entertainment | 130 (40.1%) | 194 (59.9%) |
| Health Diagnosing & Treating | 282 (15.1%) | 1,585 (84.9%) |
| Health Technologists | 188 (13.9%) | 1,165 (86.1%) |
| Total (Category) | 5,123 (46.0%) | 6,025 (54.0%) |
| Total (Overall) | 15,432 (53.3%) | 13,537 (46.7%) |
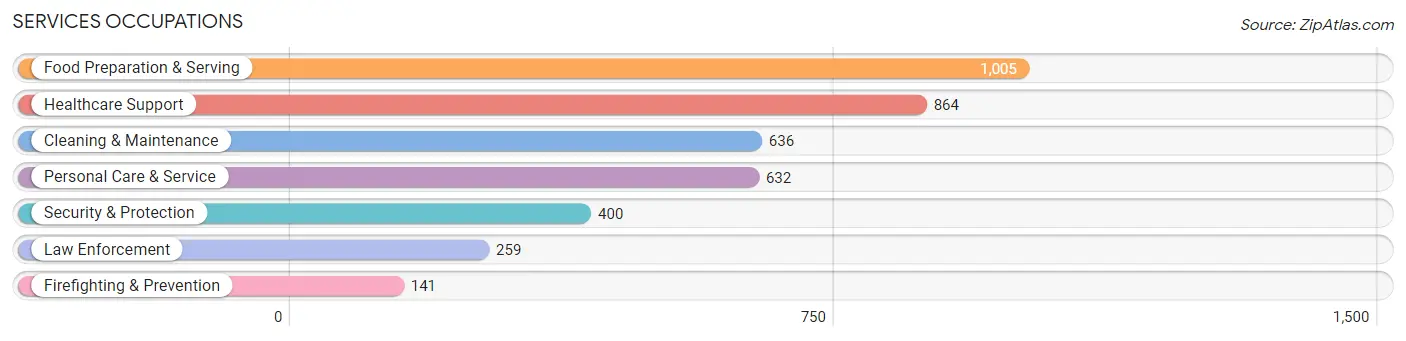
Services Occupations
The most common Services occupations in Calumet County are Food Preparation & Serving (1,005 | 3.5%), Healthcare Support (864 | 3.0%), Cleaning & Maintenance (636 | 2.2%), Personal Care & Service (632 | 2.2%), and Security & Protection (400 | 1.4%).
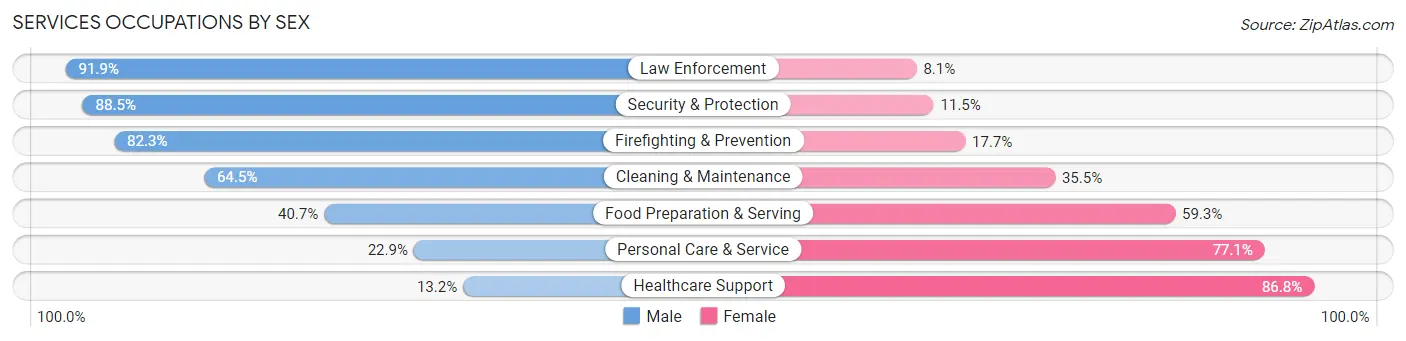
Services Occupations by Sex
Within the Services occupations in Calumet County, the most male-oriented occupations are Law Enforcement (91.9%), Security & Protection (88.5%), and Firefighting & Prevention (82.3%), while the most female-oriented occupations are Healthcare Support (86.8%), Personal Care & Service (77.1%), and Food Preparation & Serving (59.3%).
| Occupation | Male | Female |
| Healthcare Support | 114 (13.2%) | 750 (86.8%) |
| Security & Protection | 354 (88.5%) | 46 (11.5%) |
| Firefighting & Prevention | 116 (82.3%) | 25 (17.7%) |
| Law Enforcement | 238 (91.9%) | 21 (8.1%) |
| Food Preparation & Serving | 409 (40.7%) | 596 (59.3%) |
| Cleaning & Maintenance | 410 (64.5%) | 226 (35.5%) |
| Personal Care & Service | 145 (22.9%) | 487 (77.1%) |
| Total (Category) | 1,432 (40.5%) | 2,105 (59.5%) |
| Total (Overall) | 15,432 (53.3%) | 13,537 (46.7%) |
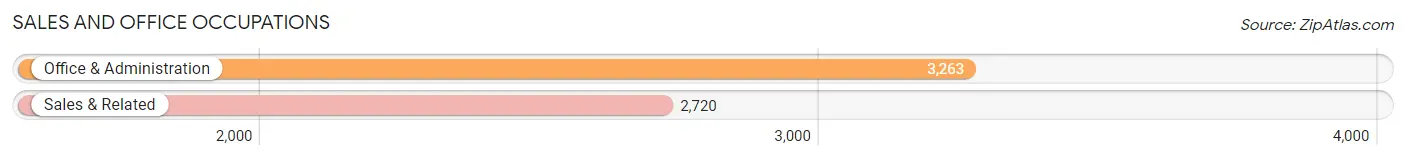
Sales and Office Occupations
The most common Sales and Office occupations in Calumet County are Office & Administration (3,263 | 11.3%), and Sales & Related (2,720 | 9.4%).
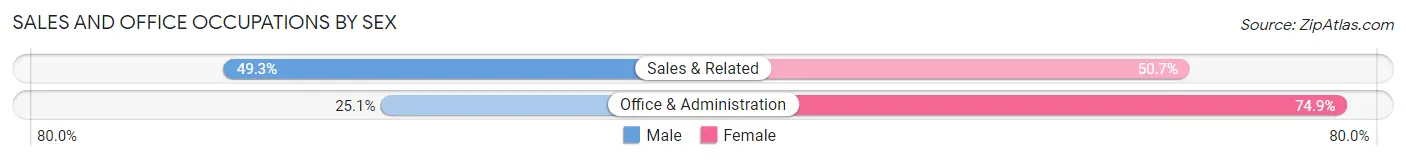
Sales and Office Occupations by Sex
| Occupation | Male | Female |
| Sales & Related | 1,342 (49.3%) | 1,378 (50.7%) |
| Office & Administration | 820 (25.1%) | 2,443 (74.9%) |
| Total (Category) | 2,162 (36.1%) | 3,821 (63.9%) |
| Total (Overall) | 15,432 (53.3%) | 13,537 (46.7%) |
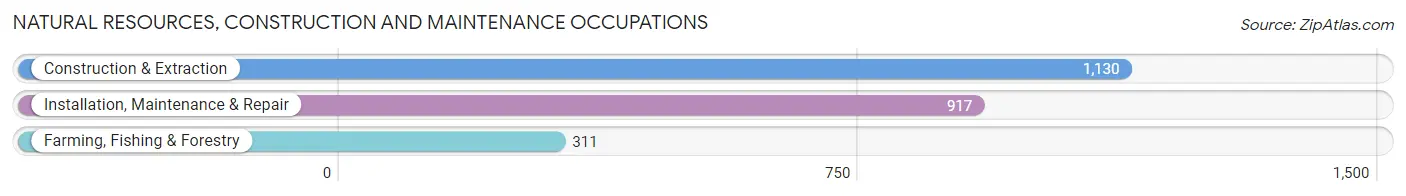
Natural Resources, Construction and Maintenance Occupations
The most common Natural Resources, Construction and Maintenance occupations in Calumet County are Construction & Extraction (1,130 | 3.9%), Installation, Maintenance & Repair (917 | 3.2%), and Farming, Fishing & Forestry (311 | 1.1%).
Natural Resources, Construction and Maintenance Occupations by Sex
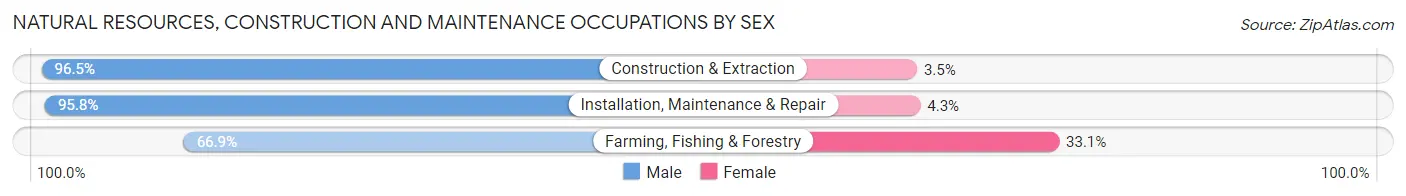
| Occupation | Male | Female |
| Farming, Fishing & Forestry | 208 (66.9%) | 103 (33.1%) |
| Construction & Extraction | 1,090 (96.5%) | 40 (3.5%) |
| Installation, Maintenance & Repair | 878 (95.8%) | 39 (4.3%) |
| Total (Category) | 2,176 (92.3%) | 182 (7.7%) |
| Total (Overall) | 15,432 (53.3%) | 13,537 (46.7%) |
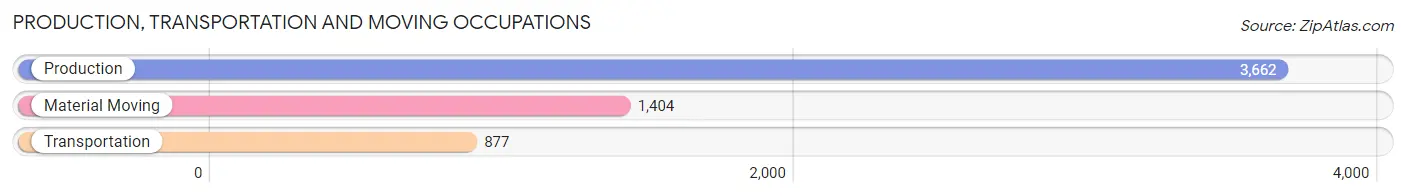
Production, Transportation and Moving Occupations
The most common Production, Transportation and Moving occupations in Calumet County are Production (3,662 | 12.6%), Material Moving (1,404 | 4.9%), and Transportation (877 | 3.0%).
Production, Transportation and Moving Occupations by Sex
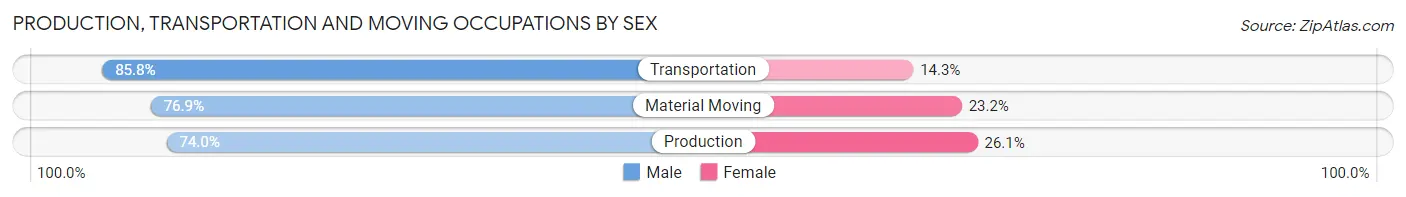
| Occupation | Male | Female |
| Production | 2,708 (74.0%) | 954 (26.1%) |
| Transportation | 752 (85.8%) | 125 (14.2%) |
| Material Moving | 1,079 (76.8%) | 325 (23.2%) |
| Total (Category) | 4,539 (76.4%) | 1,404 (23.6%) |
| Total (Overall) | 15,432 (53.3%) | 13,537 (46.7%) |
Employment Industries by Sex in Calumet County
Employment Industries in Calumet County
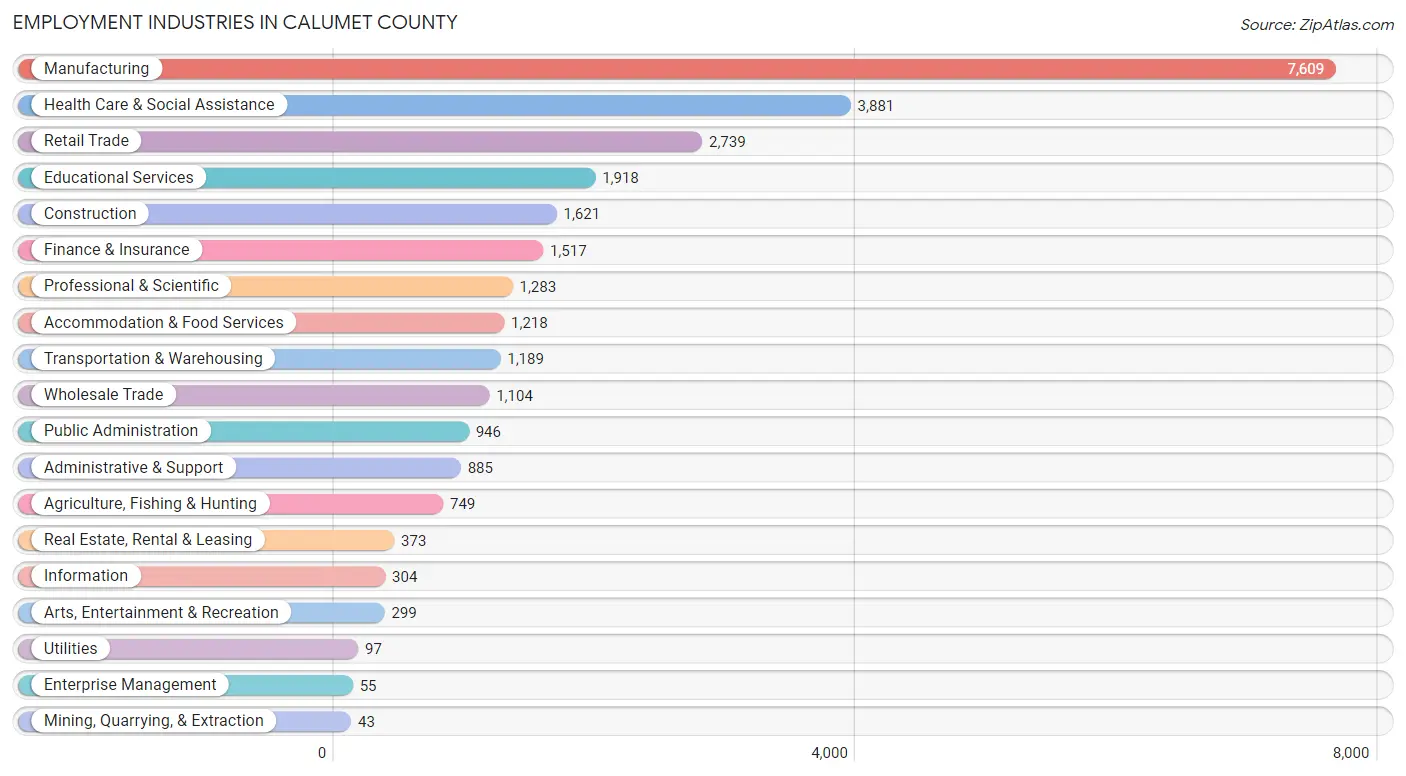
The major employment industries in Calumet County include Manufacturing (7,609 | 26.3%), Health Care & Social Assistance (3,881 | 13.4%), Retail Trade (2,739 | 9.5%), Educational Services (1,918 | 6.6%), and Construction (1,621 | 5.6%).
Employment Industries by Sex in Calumet County
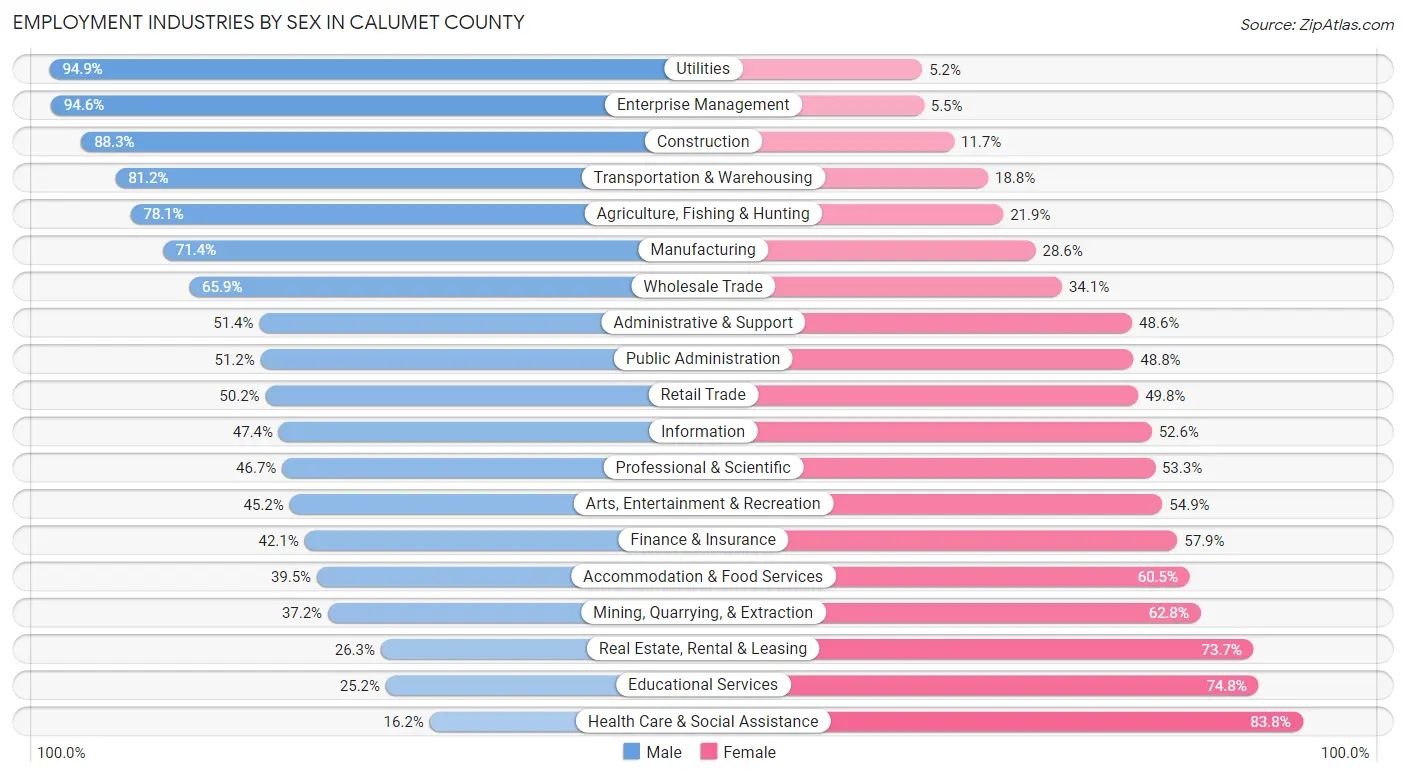
The Calumet County industries that see more men than women are Utilities (94.9%), Enterprise Management (94.6%), and Construction (88.3%), whereas the industries that tend to have a higher number of women are Health Care & Social Assistance (83.8%), Educational Services (74.8%), and Real Estate, Rental & Leasing (73.7%).
| Industry | Male | Female |
| Agriculture, Fishing & Hunting | 585 (78.1%) | 164 (21.9%) |
| Mining, Quarrying, & Extraction | 16 (37.2%) | 27 (62.8%) |
| Construction | 1,431 (88.3%) | 190 (11.7%) |
| Manufacturing | 5,432 (71.4%) | 2,177 (28.6%) |
| Wholesale Trade | 728 (65.9%) | 376 (34.1%) |
| Retail Trade | 1,374 (50.2%) | 1,365 (49.8%) |
| Transportation & Warehousing | 966 (81.2%) | 223 (18.8%) |
| Utilities | 92 (94.9%) | 5 (5.1%) |
| Information | 144 (47.4%) | 160 (52.6%) |
| Finance & Insurance | 638 (42.1%) | 879 (57.9%) |
| Real Estate, Rental & Leasing | 98 (26.3%) | 275 (73.7%) |
| Professional & Scientific | 599 (46.7%) | 684 (53.3%) |
| Enterprise Management | 52 (94.6%) | 3 (5.4%) |
| Administrative & Support | 455 (51.4%) | 430 (48.6%) |
| Educational Services | 484 (25.2%) | 1,434 (74.8%) |
| Health Care & Social Assistance | 627 (16.2%) | 3,254 (83.8%) |
| Arts, Entertainment & Recreation | 135 (45.2%) | 164 (54.8%) |
| Accommodation & Food Services | 481 (39.5%) | 737 (60.5%) |
| Public Administration | 484 (51.2%) | 462 (48.8%) |
| Total | 15,432 (53.3%) | 13,537 (46.7%) |
Education in Calumet County
School Enrollment in Calumet County
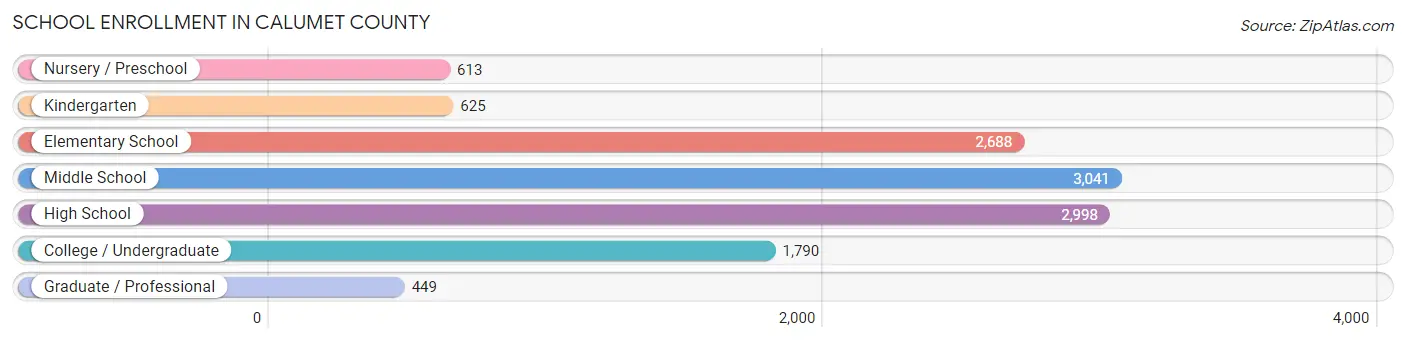
The most common levels of schooling among the 12,204 students in Calumet County are middle school (3,041 | 24.9%), high school (2,998 | 24.6%), and elementary school (2,688 | 22.0%).
| School Level | # Students | % Students |
| Nursery / Preschool | 613 | 5.0% |
| Kindergarten | 625 | 5.1% |
| Elementary School | 2,688 | 22.0% |
| Middle School | 3,041 | 24.9% |
| High School | 2,998 | 24.6% |
| College / Undergraduate | 1,790 | 14.7% |
| Graduate / Professional | 449 | 3.7% |
| Total | 12,204 | 100.0% |
School Enrollment by Age by Funding Source in Calumet County
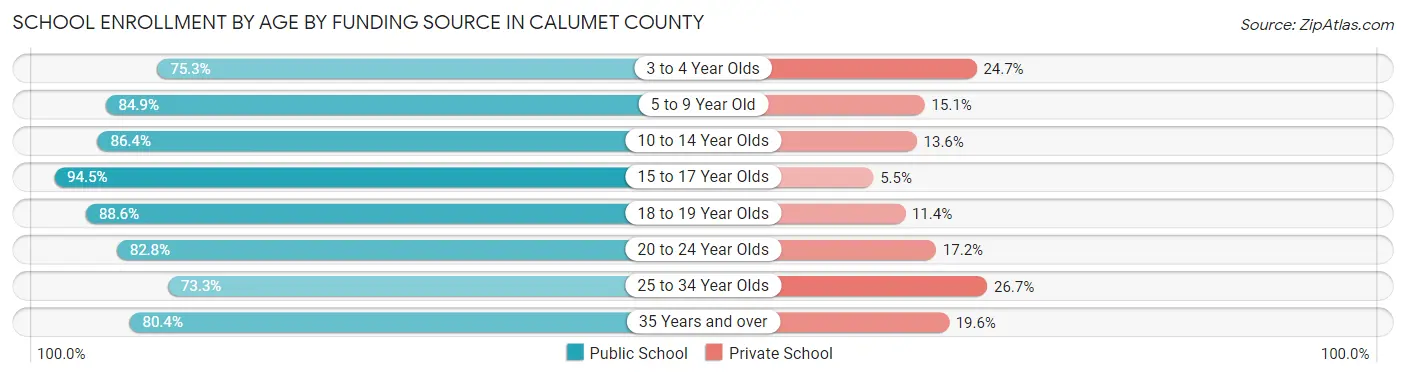
Out of a total of 12,204 students who are enrolled in schools in Calumet County, 1,672 (13.7%) attend a private institution, while the remaining 10,532 (86.3%) are enrolled in public schools. The age group of 25 to 34 year olds has the highest likelihood of being enrolled in private schools, with 102 (26.7% in the age bracket) enrolled. Conversely, the age group of 15 to 17 year olds has the lowest likelihood of being enrolled in a private school, with 2,093 (94.5% in the age bracket) attending a public institution.
| Age Bracket | Public School | Private School |
| 3 to 4 Year Olds | 283 (75.3%) | 93 (24.7%) |
| 5 to 9 Year Old | 2,709 (84.9%) | 481 (15.1%) |
| 10 to 14 Year Olds | 3,192 (86.4%) | 502 (13.6%) |
| 15 to 17 Year Olds | 2,093 (94.5%) | 122 (5.5%) |
| 18 to 19 Year Olds | 737 (88.6%) | 95 (11.4%) |
| 20 to 24 Year Olds | 882 (82.8%) | 183 (17.2%) |
| 25 to 34 Year Olds | 280 (73.3%) | 102 (26.7%) |
| 35 Years and over | 362 (80.4%) | 88 (19.6%) |
| Total | 10,532 (86.3%) | 1,672 (13.7%) |
Educational Attainment by Field of Study in Calumet County
Business (2,857 | 23.0%), education (1,872 | 15.1%), science & technology (1,480 | 11.9%), arts & humanities (1,085 | 8.7%), and bio, nature & agricultural (1,016 | 8.2%) are the most common fields of study among 12,426 individuals in Calumet County who have obtained a bachelor's degree or higher.
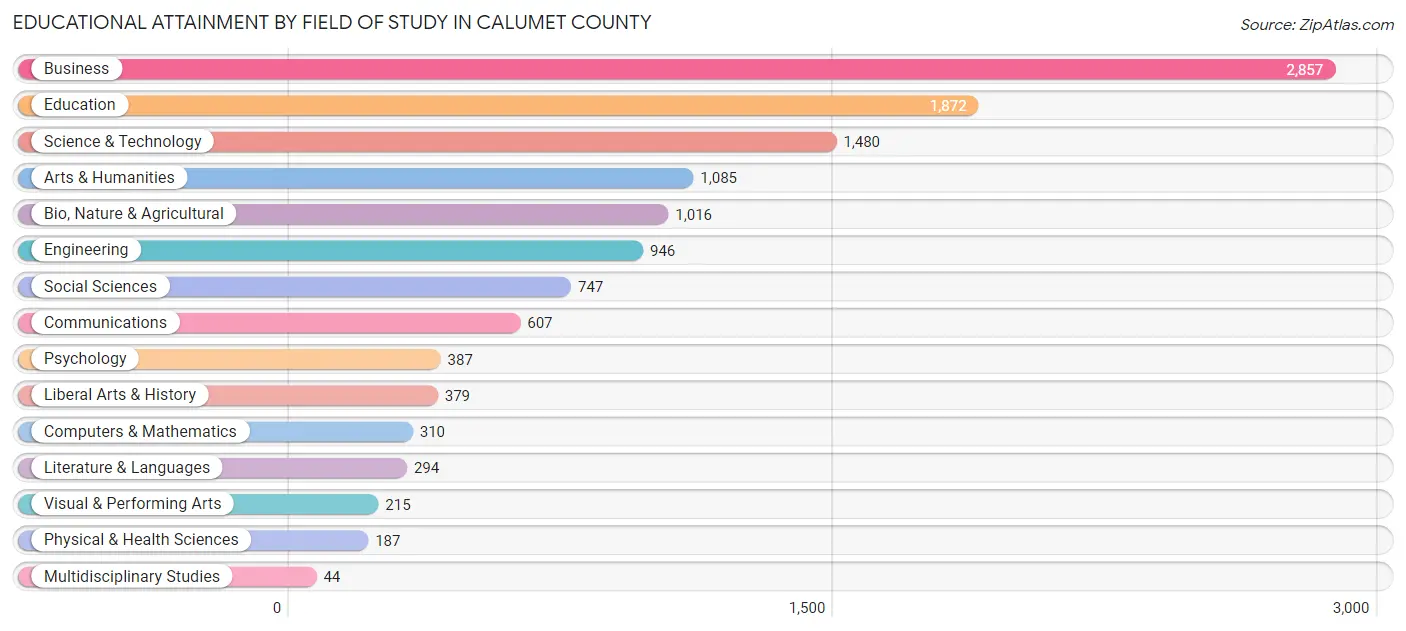
| Field of Study | # Graduates | % Graduates |
| Computers & Mathematics | 310 | 2.5% |
| Bio, Nature & Agricultural | 1,016 | 8.2% |
| Physical & Health Sciences | 187 | 1.5% |
| Psychology | 387 | 3.1% |
| Social Sciences | 747 | 6.0% |
| Engineering | 946 | 7.6% |
| Multidisciplinary Studies | 44 | 0.4% |
| Science & Technology | 1,480 | 11.9% |
| Business | 2,857 | 23.0% |
| Education | 1,872 | 15.1% |
| Literature & Languages | 294 | 2.4% |
| Liberal Arts & History | 379 | 3.0% |
| Visual & Performing Arts | 215 | 1.7% |
| Communications | 607 | 4.9% |
| Arts & Humanities | 1,085 | 8.7% |
| Total | 12,426 | 100.0% |
Transportation & Commute in Calumet County
Vehicle Availability by Sex in Calumet County
The most prevalent vehicle ownership categories in Calumet County are males with 2 vehicles (6,578, accounting for 43.0%) and females with 2 vehicles (5,825, making up 49.5%).
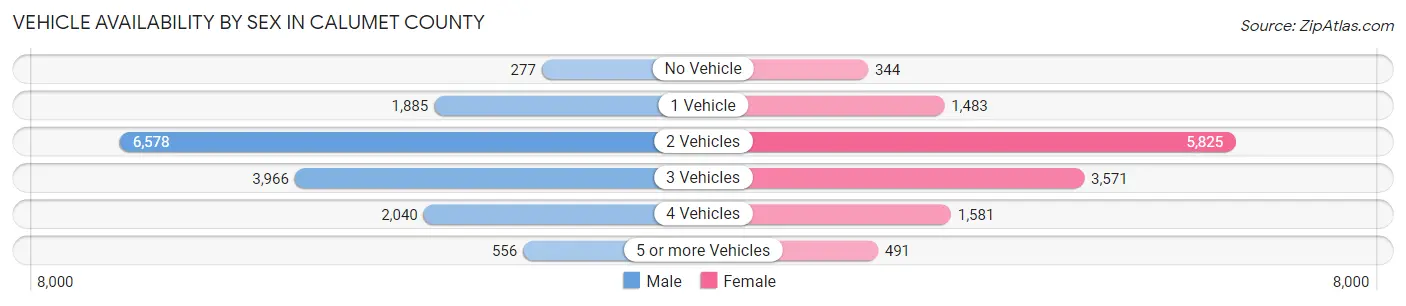
| Vehicles Available | Male | Female |
| No Vehicle | 277 (1.8%) | 344 (2.6%) |
| 1 Vehicle | 1,885 (12.3%) | 1,483 (11.2%) |
| 2 Vehicles | 6,578 (43.0%) | 5,825 (43.8%) |
| 3 Vehicles | 3,966 (25.9%) | 3,571 (26.9%) |
| 4 Vehicles | 2,040 (13.3%) | 1,581 (11.9%) |
| 5 or more Vehicles | 556 (3.6%) | 491 (3.7%) |
| Total | 15,302 (100.0%) | 13,295 (100.0%) |
Commute Time in Calumet County
The most frequently occuring commute durations in Calumet County are 15 to 19 minutes (4,531 commuters, 17.8%), 10 to 14 minutes (4,390 commuters, 17.2%), and 20 to 24 minutes (4,087 commuters, 16.0%).
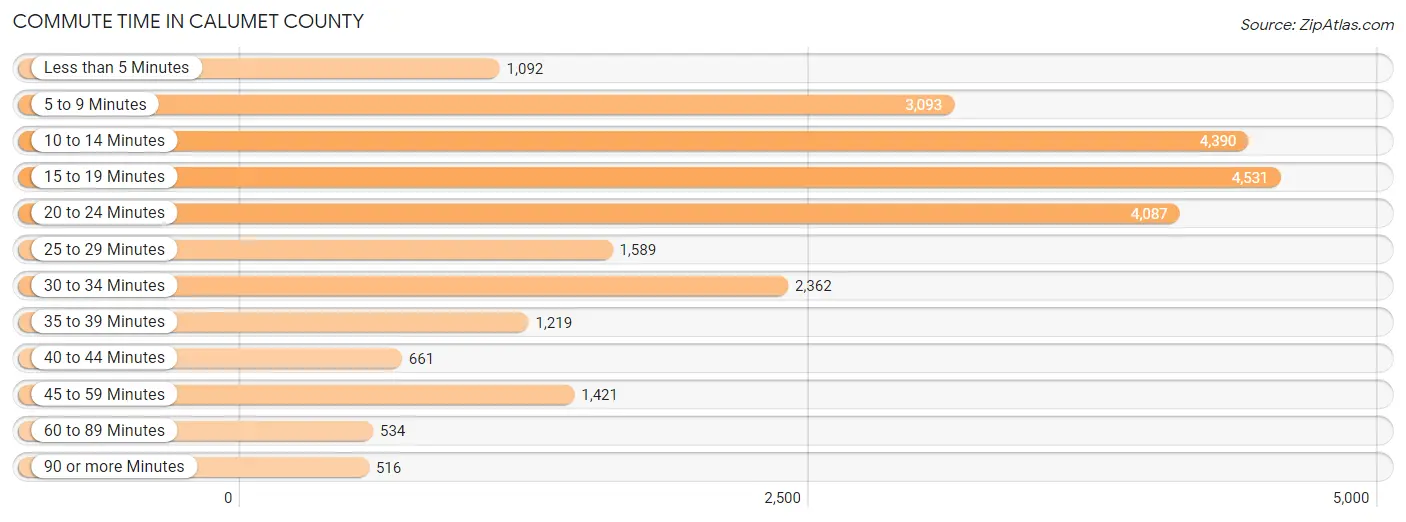
| Commute Time | # Commuters | % Commuters |
| Less than 5 Minutes | 1,092 | 4.3% |
| 5 to 9 Minutes | 3,093 | 12.1% |
| 10 to 14 Minutes | 4,390 | 17.2% |
| 15 to 19 Minutes | 4,531 | 17.8% |
| 20 to 24 Minutes | 4,087 | 16.0% |
| 25 to 29 Minutes | 1,589 | 6.2% |
| 30 to 34 Minutes | 2,362 | 9.3% |
| 35 to 39 Minutes | 1,219 | 4.8% |
| 40 to 44 Minutes | 661 | 2.6% |
| 45 to 59 Minutes | 1,421 | 5.6% |
| 60 to 89 Minutes | 534 | 2.1% |
| 90 or more Minutes | 516 | 2.0% |
Commute Time by Sex in Calumet County
The most common commute times in Calumet County are 15 to 19 minutes (2,421 commuters, 17.5%) for males and 15 to 19 minutes (2,110 commuters, 18.1%) for females.
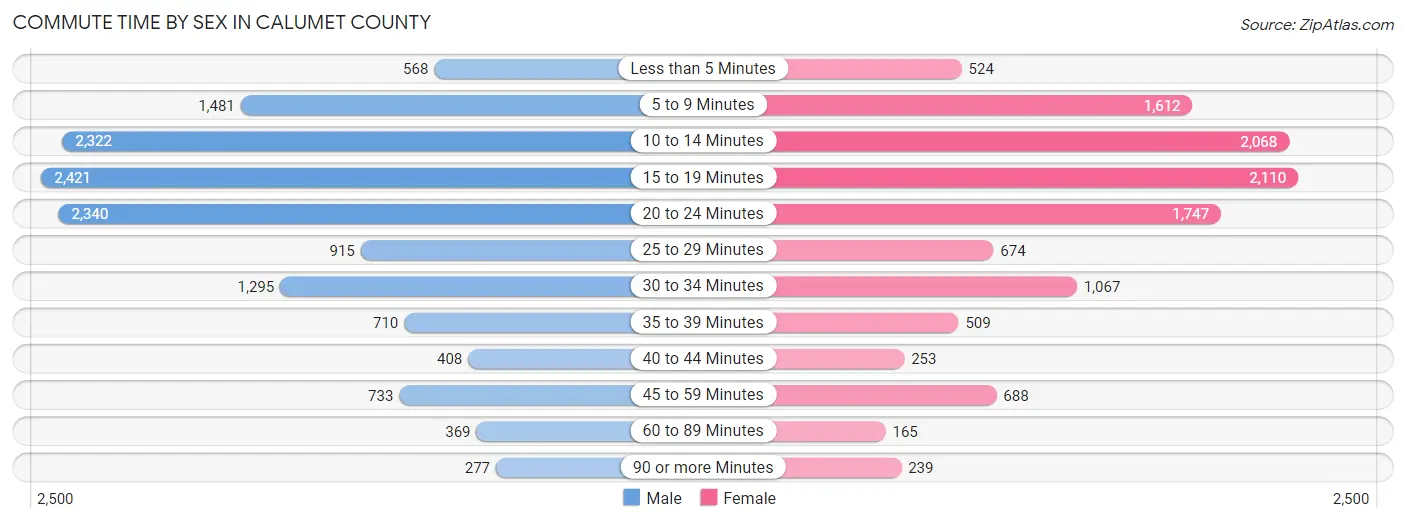
| Commute Time | Male | Female |
| Less than 5 Minutes | 568 (4.1%) | 524 (4.5%) |
| 5 to 9 Minutes | 1,481 (10.7%) | 1,612 (13.8%) |
| 10 to 14 Minutes | 2,322 (16.8%) | 2,068 (17.7%) |
| 15 to 19 Minutes | 2,421 (17.5%) | 2,110 (18.1%) |
| 20 to 24 Minutes | 2,340 (16.9%) | 1,747 (15.0%) |
| 25 to 29 Minutes | 915 (6.6%) | 674 (5.8%) |
| 30 to 34 Minutes | 1,295 (9.4%) | 1,067 (9.1%) |
| 35 to 39 Minutes | 710 (5.1%) | 509 (4.4%) |
| 40 to 44 Minutes | 408 (2.9%) | 253 (2.2%) |
| 45 to 59 Minutes | 733 (5.3%) | 688 (5.9%) |
| 60 to 89 Minutes | 369 (2.7%) | 165 (1.4%) |
| 90 or more Minutes | 277 (2.0%) | 239 (2.1%) |
Time of Departure to Work by Sex in Calumet County
The most frequent times of departure to work in Calumet County are 7:00 AM to 7:29 AM (1,784, 12.9%) for males and 7:00 AM to 7:29 AM (2,417, 20.7%) for females.
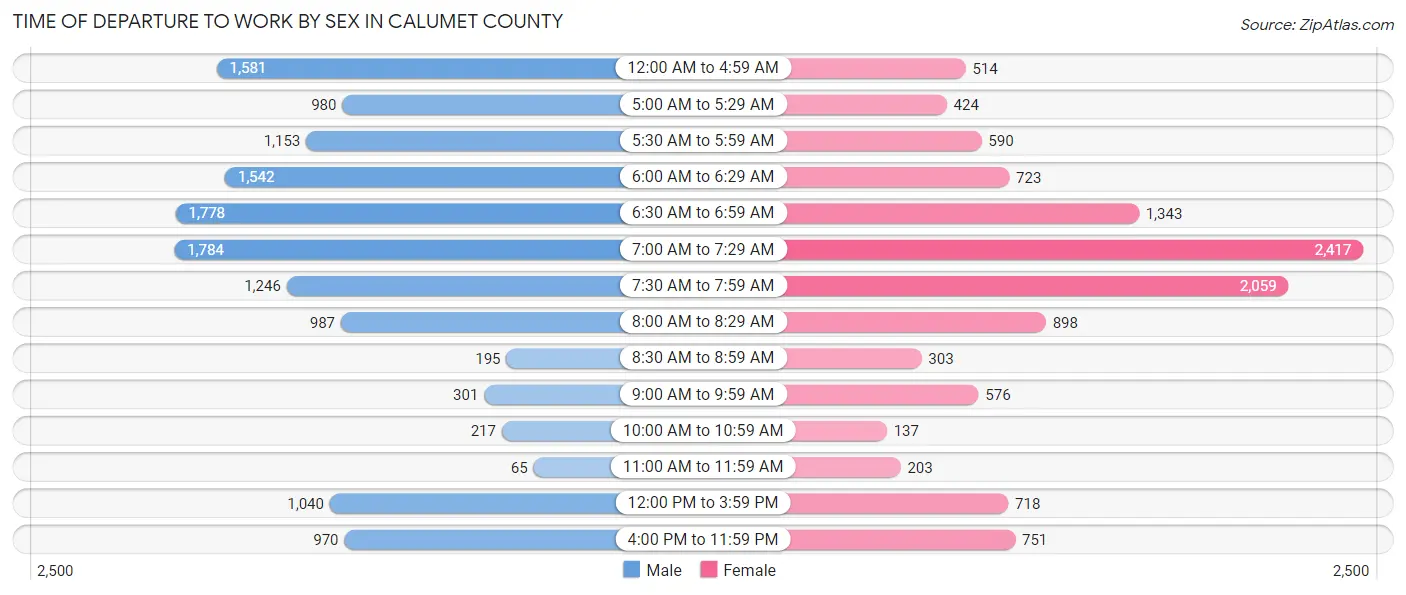
| Time of Departure | Male | Female |
| 12:00 AM to 4:59 AM | 1,581 (11.4%) | 514 (4.4%) |
| 5:00 AM to 5:29 AM | 980 (7.1%) | 424 (3.6%) |
| 5:30 AM to 5:59 AM | 1,153 (8.3%) | 590 (5.1%) |
| 6:00 AM to 6:29 AM | 1,542 (11.1%) | 723 (6.2%) |
| 6:30 AM to 6:59 AM | 1,778 (12.9%) | 1,343 (11.5%) |
| 7:00 AM to 7:29 AM | 1,784 (12.9%) | 2,417 (20.7%) |
| 7:30 AM to 7:59 AM | 1,246 (9.0%) | 2,059 (17.7%) |
| 8:00 AM to 8:29 AM | 987 (7.1%) | 898 (7.7%) |
| 8:30 AM to 8:59 AM | 195 (1.4%) | 303 (2.6%) |
| 9:00 AM to 9:59 AM | 301 (2.2%) | 576 (4.9%) |
| 10:00 AM to 10:59 AM | 217 (1.6%) | 137 (1.2%) |
| 11:00 AM to 11:59 AM | 65 (0.5%) | 203 (1.7%) |
| 12:00 PM to 3:59 PM | 1,040 (7.5%) | 718 (6.2%) |
| 4:00 PM to 11:59 PM | 970 (7.0%) | 751 (6.4%) |
| Total | 13,839 (100.0%) | 11,656 (100.0%) |
Housing Occupancy in Calumet County
Occupancy by Ownership in Calumet County
Of the total 20,712 dwellings in Calumet County, owner-occupied units account for 16,862 (81.4%), while renter-occupied units make up 3,850 (18.6%).
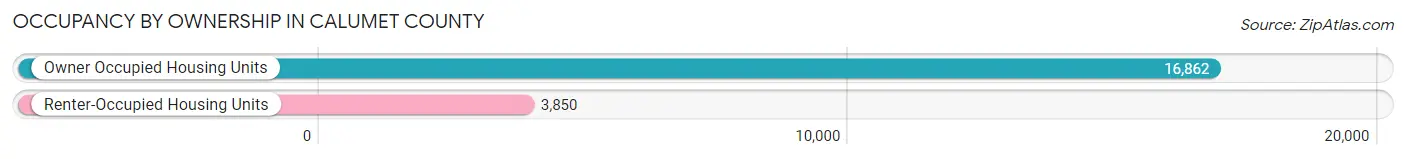
| Occupancy | # Housing Units | % Housing Units |
| Owner Occupied Housing Units | 16,862 | 81.4% |
| Renter-Occupied Housing Units | 3,850 | 18.6% |
| Total Occupied Housing Units | 20,712 | 100.0% |
Occupancy by Household Size in Calumet County
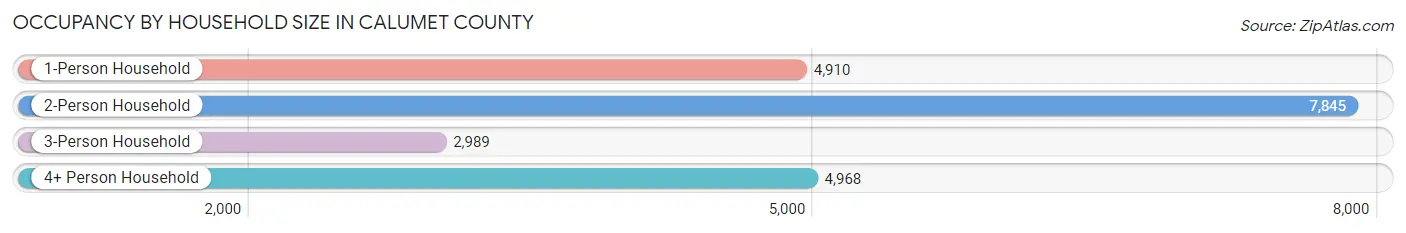
| Household Size | # Housing Units | % Housing Units |
| 1-Person Household | 4,910 | 23.7% |
| 2-Person Household | 7,845 | 37.9% |
| 3-Person Household | 2,989 | 14.4% |
| 4+ Person Household | 4,968 | 24.0% |
| Total Housing Units | 20,712 | 100.0% |
Occupancy by Ownership by Household Size in Calumet County
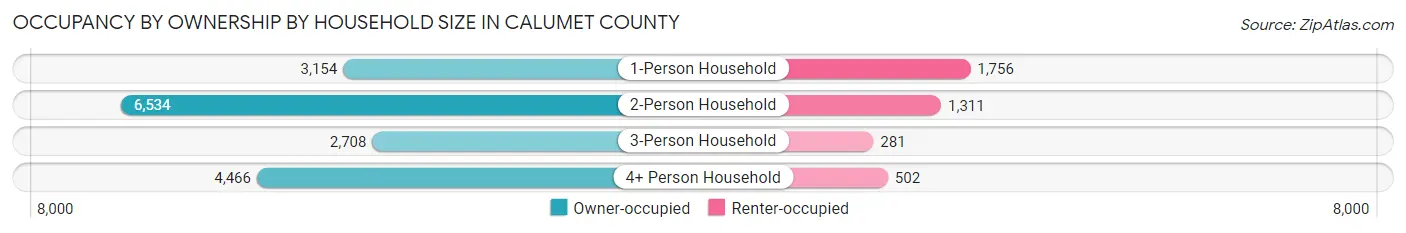
| Household Size | Owner-occupied | Renter-occupied |
| 1-Person Household | 3,154 (64.2%) | 1,756 (35.8%) |
| 2-Person Household | 6,534 (83.3%) | 1,311 (16.7%) |
| 3-Person Household | 2,708 (90.6%) | 281 (9.4%) |
| 4+ Person Household | 4,466 (89.9%) | 502 (10.1%) |
| Total Housing Units | 16,862 (81.4%) | 3,850 (18.6%) |
Occupancy by Educational Attainment in Calumet County
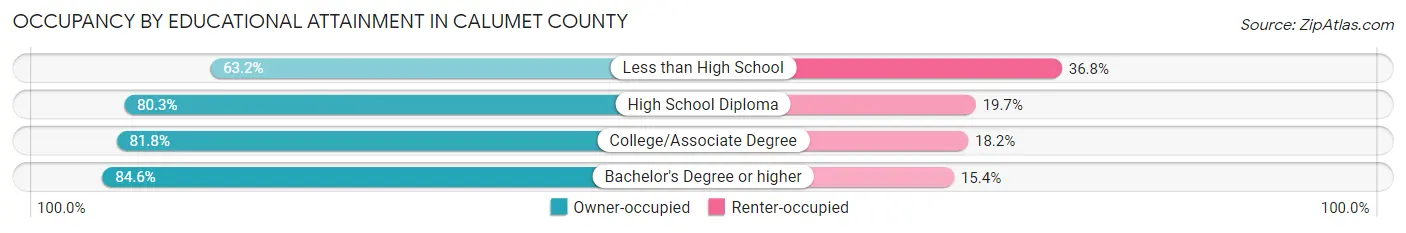
| Household Size | Owner-occupied | Renter-occupied |
| Less than High School | 601 (63.2%) | 350 (36.8%) |
| High School Diploma | 4,826 (80.3%) | 1,187 (19.7%) |
| College/Associate Degree | 5,619 (81.8%) | 1,252 (18.2%) |
| Bachelor's Degree or higher | 5,816 (84.6%) | 1,061 (15.4%) |
Occupancy by Age of Householder in Calumet County
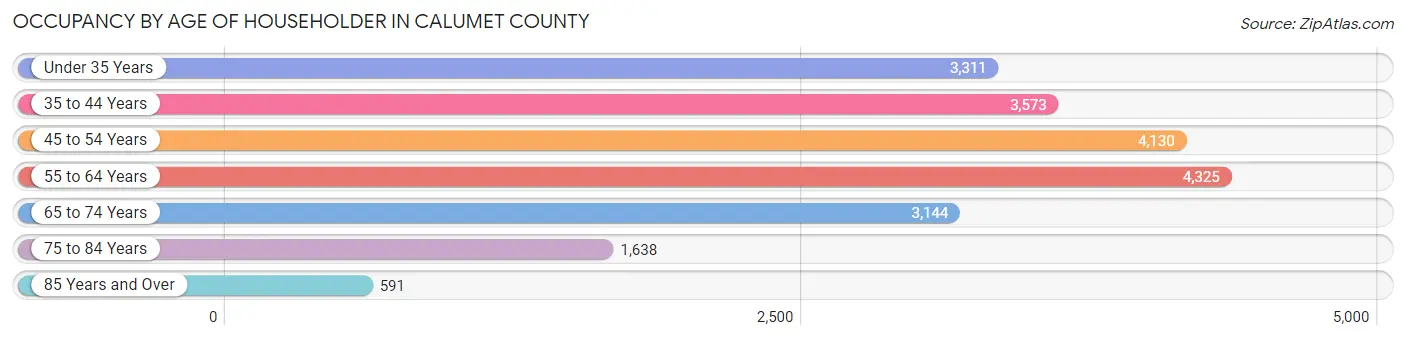
| Age Bracket | # Households | % Households |
| Under 35 Years | 3,311 | 16.0% |
| 35 to 44 Years | 3,573 | 17.2% |
| 45 to 54 Years | 4,130 | 19.9% |
| 55 to 64 Years | 4,325 | 20.9% |
| 65 to 74 Years | 3,144 | 15.2% |
| 75 to 84 Years | 1,638 | 7.9% |
| 85 Years and Over | 591 | 2.9% |
| Total | 20,712 | 100.0% |
Housing Finances in Calumet County
Median Income by Occupancy in Calumet County
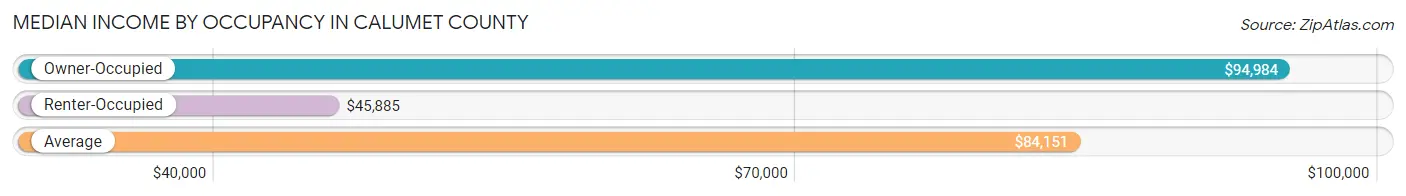
| Occupancy Type | # Households | Median Income |
| Owner-Occupied | 16,862 (81.4%) | $94,984 |
| Renter-Occupied | 3,850 (18.6%) | $45,885 |
| Average | 20,712 (100.0%) | $84,151 |
Occupancy by Householder Income Bracket in Calumet County
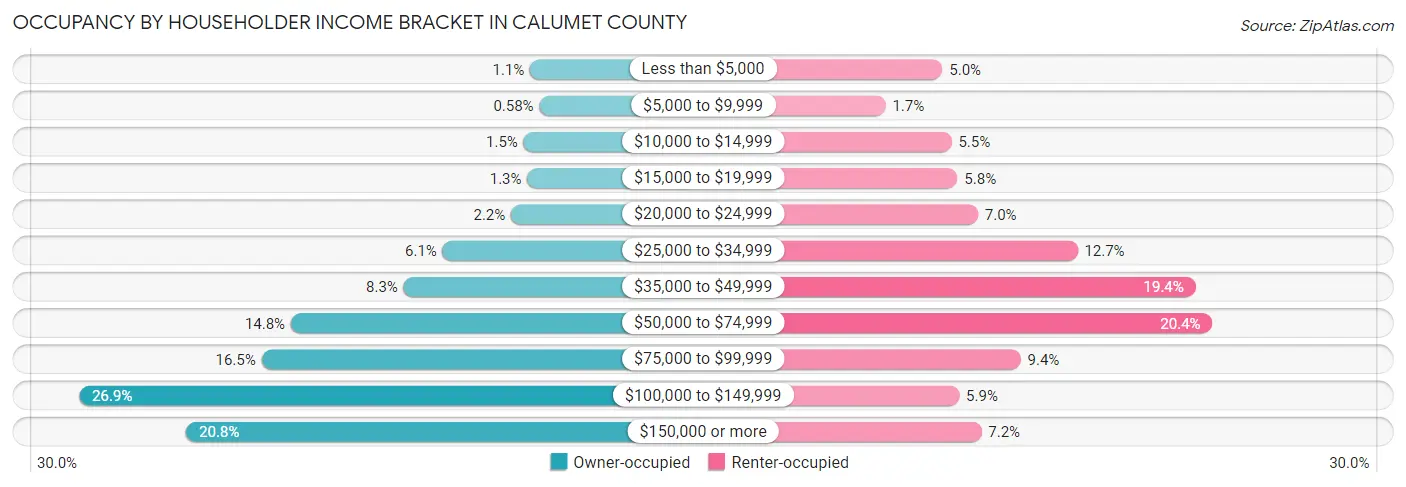
| Income Bracket | Owner-occupied | Renter-occupied |
| Less than $5,000 | 188 (1.1%) | 191 (5.0%) |
| $5,000 to $9,999 | 98 (0.6%) | 66 (1.7%) |
| $10,000 to $14,999 | 249 (1.5%) | 211 (5.5%) |
| $15,000 to $19,999 | 214 (1.3%) | 224 (5.8%) |
| $20,000 to $24,999 | 371 (2.2%) | 269 (7.0%) |
| $25,000 to $34,999 | 1,030 (6.1%) | 488 (12.7%) |
| $35,000 to $49,999 | 1,406 (8.3%) | 748 (19.4%) |
| $50,000 to $74,999 | 2,493 (14.8%) | 785 (20.4%) |
| $75,000 to $99,999 | 2,775 (16.5%) | 363 (9.4%) |
| $100,000 to $149,999 | 4,535 (26.9%) | 228 (5.9%) |
| $150,000 or more | 3,503 (20.8%) | 277 (7.2%) |
| Total | 16,862 (100.0%) | 3,850 (100.0%) |
Monthly Housing Cost Tiers in Calumet County
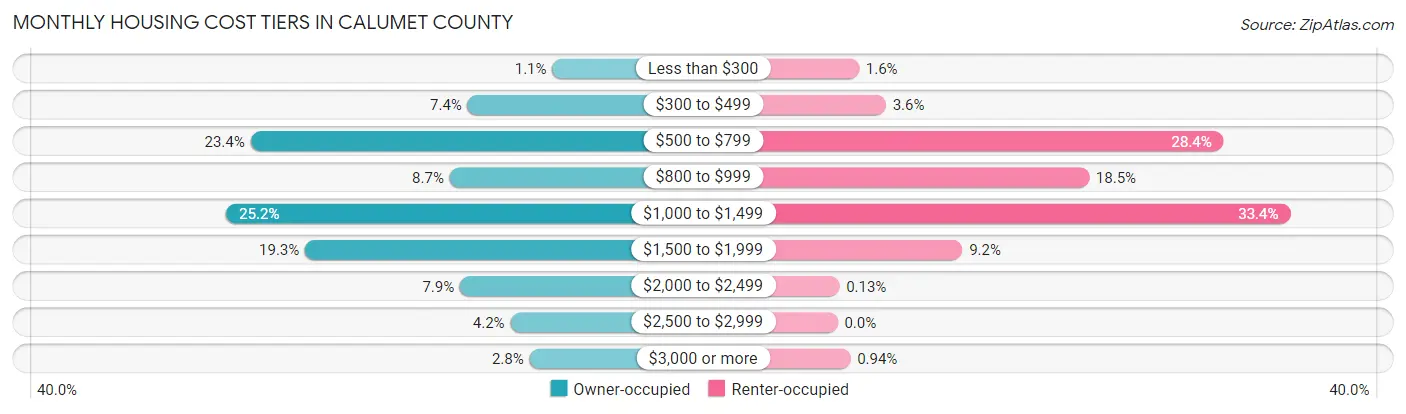
| Monthly Cost | Owner-occupied | Renter-occupied |
| Less than $300 | 190 (1.1%) | 61 (1.6%) |
| $300 to $499 | 1,243 (7.4%) | 137 (3.6%) |
| $500 to $799 | 3,939 (23.4%) | 1,095 (28.4%) |
| $800 to $999 | 1,466 (8.7%) | 713 (18.5%) |
| $1,000 to $1,499 | 4,242 (25.2%) | 1,284 (33.4%) |
| $1,500 to $1,999 | 3,261 (19.3%) | 354 (9.2%) |
| $2,000 to $2,499 | 1,337 (7.9%) | 5 (0.1%) |
| $2,500 to $2,999 | 711 (4.2%) | 0 (0.0%) |
| $3,000 or more | 473 (2.8%) | 36 (0.9%) |
| Total | 16,862 (100.0%) | 3,850 (100.0%) |
Physical Housing Characteristics in Calumet County
Housing Structures in Calumet County
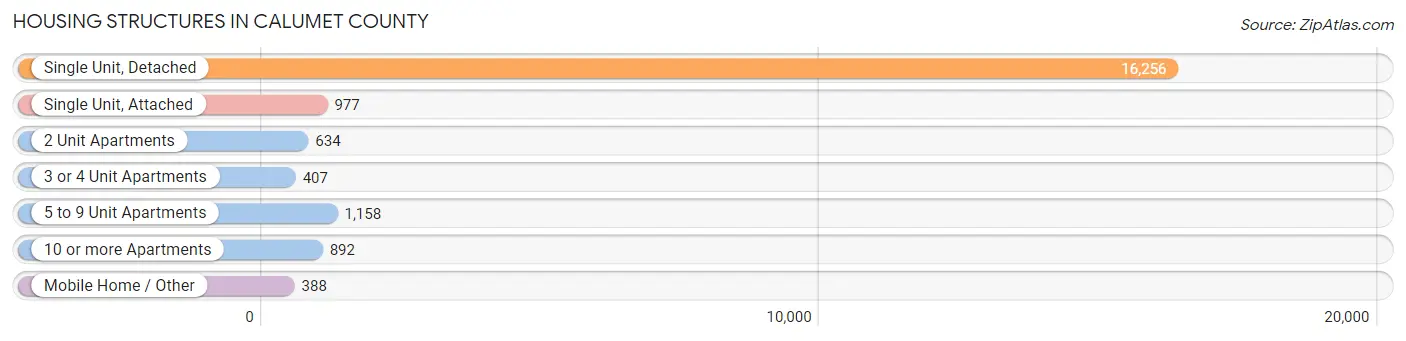
| Structure Type | # Housing Units | % Housing Units |
| Single Unit, Detached | 16,256 | 78.5% |
| Single Unit, Attached | 977 | 4.7% |
| 2 Unit Apartments | 634 | 3.1% |
| 3 or 4 Unit Apartments | 407 | 2.0% |
| 5 to 9 Unit Apartments | 1,158 | 5.6% |
| 10 or more Apartments | 892 | 4.3% |
| Mobile Home / Other | 388 | 1.9% |
| Total | 20,712 | 100.0% |
Housing Structures by Occupancy in Calumet County
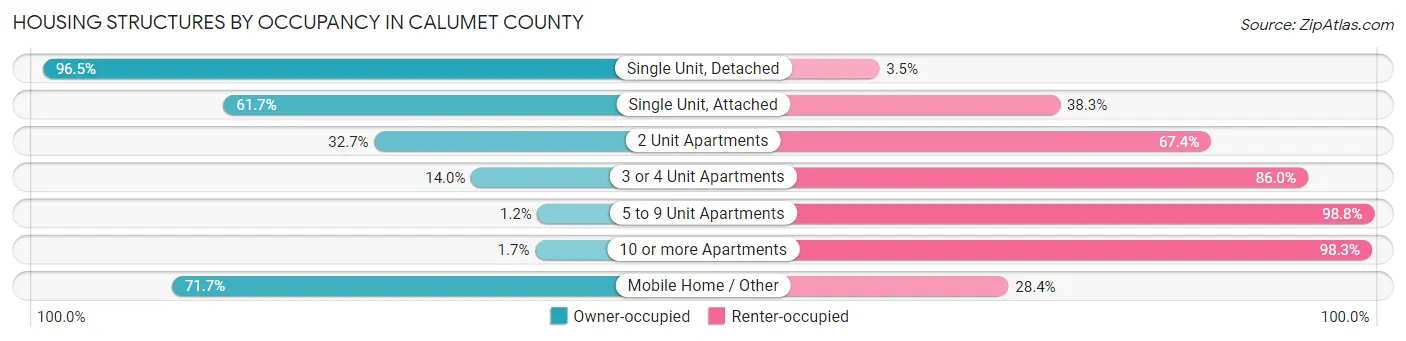
| Structure Type | Owner-occupied | Renter-occupied |
| Single Unit, Detached | 15,688 (96.5%) | 568 (3.5%) |
| Single Unit, Attached | 603 (61.7%) | 374 (38.3%) |
| 2 Unit Apartments | 207 (32.7%) | 427 (67.3%) |
| 3 or 4 Unit Apartments | 57 (14.0%) | 350 (86.0%) |
| 5 to 9 Unit Apartments | 14 (1.2%) | 1,144 (98.8%) |
| 10 or more Apartments | 15 (1.7%) | 877 (98.3%) |
| Mobile Home / Other | 278 (71.7%) | 110 (28.3%) |
| Total | 16,862 (81.4%) | 3,850 (18.6%) |
Housing Structures by Number of Rooms in Calumet County
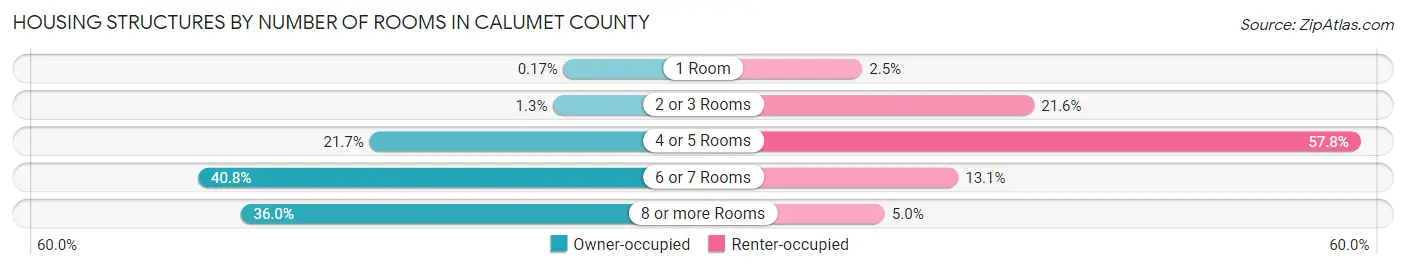
| Number of Rooms | Owner-occupied | Renter-occupied |
| 1 Room | 29 (0.2%) | 96 (2.5%) |
| 2 or 3 Rooms | 224 (1.3%) | 831 (21.6%) |
| 4 or 5 Rooms | 3,661 (21.7%) | 2,225 (57.8%) |
| 6 or 7 Rooms | 6,872 (40.7%) | 506 (13.1%) |
| 8 or more Rooms | 6,076 (36.0%) | 192 (5.0%) |
| Total | 16,862 (100.0%) | 3,850 (100.0%) |
Housing Structure by Heating Type in Calumet County
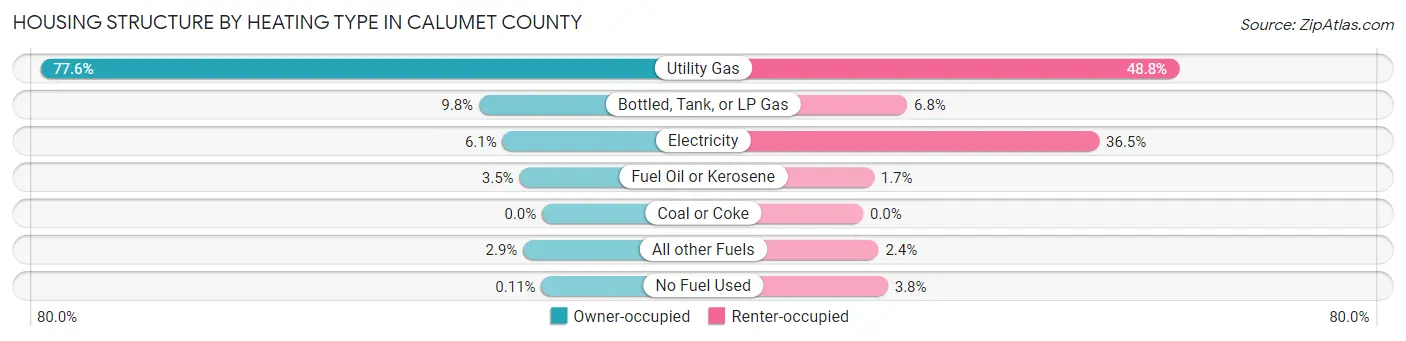
| Heating Type | Owner-occupied | Renter-occupied |
| Utility Gas | 13,082 (77.6%) | 1,880 (48.8%) |
| Bottled, Tank, or LP Gas | 1,645 (9.8%) | 262 (6.8%) |
| Electricity | 1,030 (6.1%) | 1,405 (36.5%) |
| Fuel Oil or Kerosene | 592 (3.5%) | 64 (1.7%) |
| Coal or Coke | 0 (0.0%) | 0 (0.0%) |
| All other Fuels | 494 (2.9%) | 92 (2.4%) |
| No Fuel Used | 19 (0.1%) | 147 (3.8%) |
| Total | 16,862 (100.0%) | 3,850 (100.0%) |
Household Vehicle Usage in Calumet County
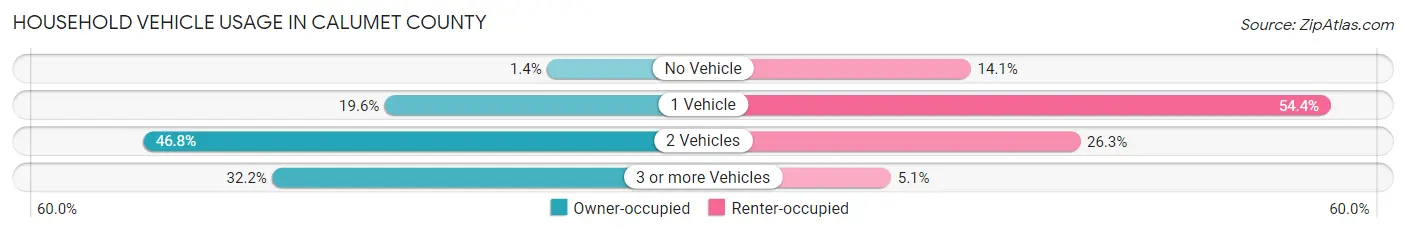
| Vehicles per Household | Owner-occupied | Renter-occupied |
| No Vehicle | 239 (1.4%) | 542 (14.1%) |
| 1 Vehicle | 3,307 (19.6%) | 2,096 (54.4%) |
| 2 Vehicles | 7,884 (46.8%) | 1,014 (26.3%) |
| 3 or more Vehicles | 5,432 (32.2%) | 198 (5.1%) |
| Total | 16,862 (100.0%) | 3,850 (100.0%) |
Real Estate & Mortgages in Calumet County
Real Estate and Mortgage Overview in Calumet County
| Characteristic | Without Mortgage | With Mortgage |
| Housing Units | 6,119 | 10,743 |
| Median Property Value | $225,100 | $239,100 |
| Median Household Income | $74,205 | $2,518 |
| Monthly Housing Costs | $629 | $473 |
| Real Estate Taxes | $3,586 | $23 |
Property Value by Mortgage Status in Calumet County
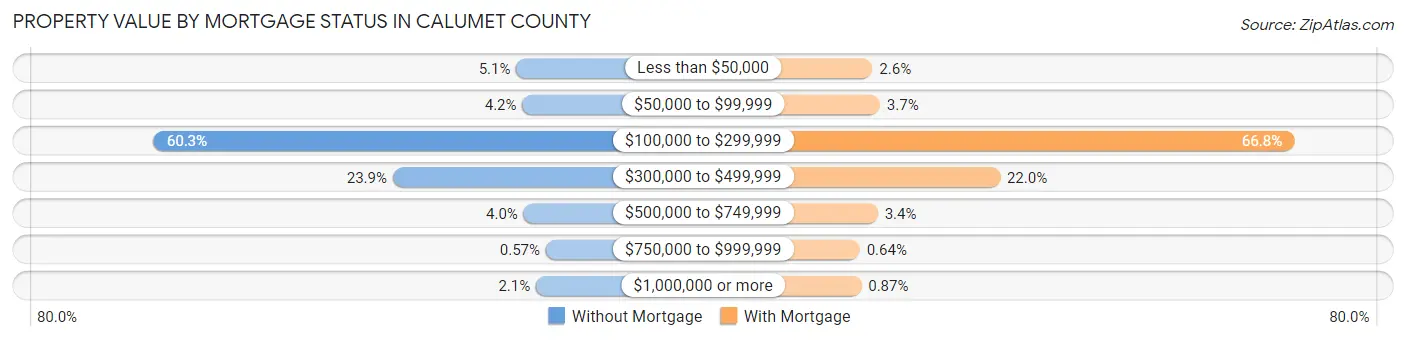
| Property Value | Without Mortgage | With Mortgage |
| Less than $50,000 | 310 (5.1%) | 276 (2.6%) |
| $50,000 to $99,999 | 254 (4.2%) | 399 (3.7%) |
| $100,000 to $299,999 | 3,690 (60.3%) | 7,177 (66.8%) |
| $300,000 to $499,999 | 1,462 (23.9%) | 2,365 (22.0%) |
| $500,000 to $749,999 | 242 (4.0%) | 363 (3.4%) |
| $750,000 to $999,999 | 35 (0.6%) | 69 (0.6%) |
| $1,000,000 or more | 126 (2.1%) | 94 (0.9%) |
| Total | 6,119 (100.0%) | 10,743 (100.0%) |
Household Income by Mortgage Status in Calumet County
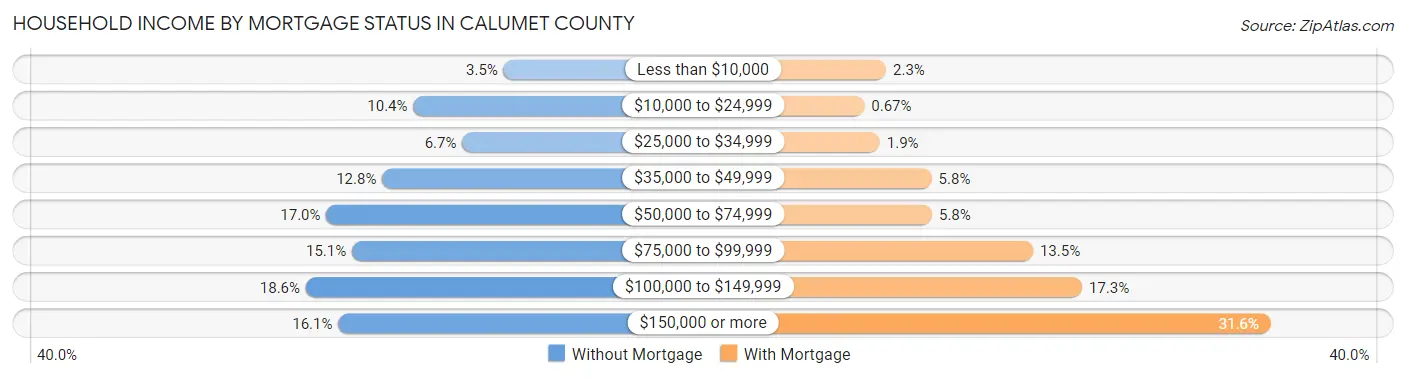
| Household Income | Without Mortgage | With Mortgage |
| Less than $10,000 | 214 (3.5%) | 250 (2.3%) |
| $10,000 to $24,999 | 635 (10.4%) | 72 (0.7%) |
| $25,000 to $34,999 | 407 (6.7%) | 199 (1.8%) |
| $35,000 to $49,999 | 780 (12.8%) | 623 (5.8%) |
| $50,000 to $74,999 | 1,041 (17.0%) | 626 (5.8%) |
| $75,000 to $99,999 | 921 (15.0%) | 1,452 (13.5%) |
| $100,000 to $149,999 | 1,136 (18.6%) | 1,854 (17.3%) |
| $150,000 or more | 985 (16.1%) | 3,399 (31.6%) |
| Total | 6,119 (100.0%) | 10,743 (100.0%) |
Property Value to Household Income Ratio in Calumet County
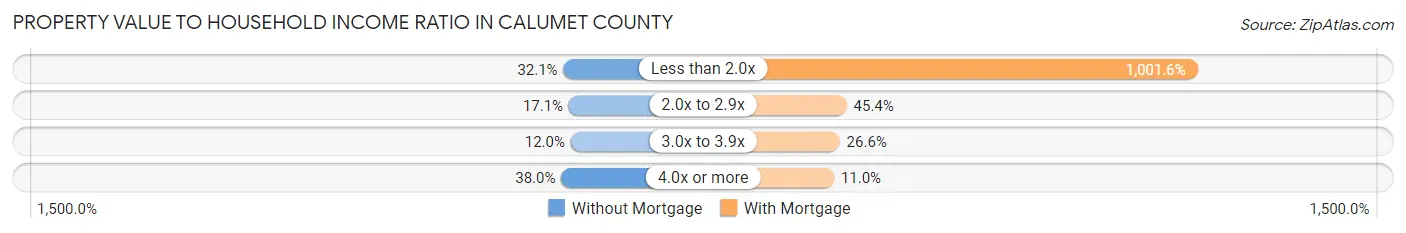
| Value-to-Income Ratio | Without Mortgage | With Mortgage |
| Less than 2.0x | 1,963 (32.1%) | 107,603 (1,001.6%) |
| 2.0x to 2.9x | 1,048 (17.1%) | 4,880 (45.4%) |
| 3.0x to 3.9x | 735 (12.0%) | 2,857 (26.6%) |
| 4.0x or more | 2,324 (38.0%) | 1,182 (11.0%) |
| Total | 6,119 (100.0%) | 10,743 (100.0%) |
Real Estate Taxes by Mortgage Status in Calumet County
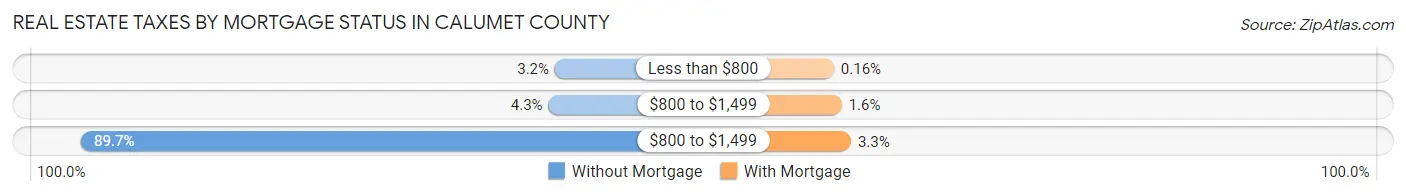
| Property Taxes | Without Mortgage | With Mortgage |
| Less than $800 | 193 (3.2%) | 17 (0.2%) |
| $800 to $1,499 | 265 (4.3%) | 171 (1.6%) |
| $800 to $1,499 | 5,486 (89.7%) | 351 (3.3%) |
| Total | 6,119 (100.0%) | 10,743 (100.0%) |
Health & Disability in Calumet County
Health Insurance Coverage by Age in Calumet County
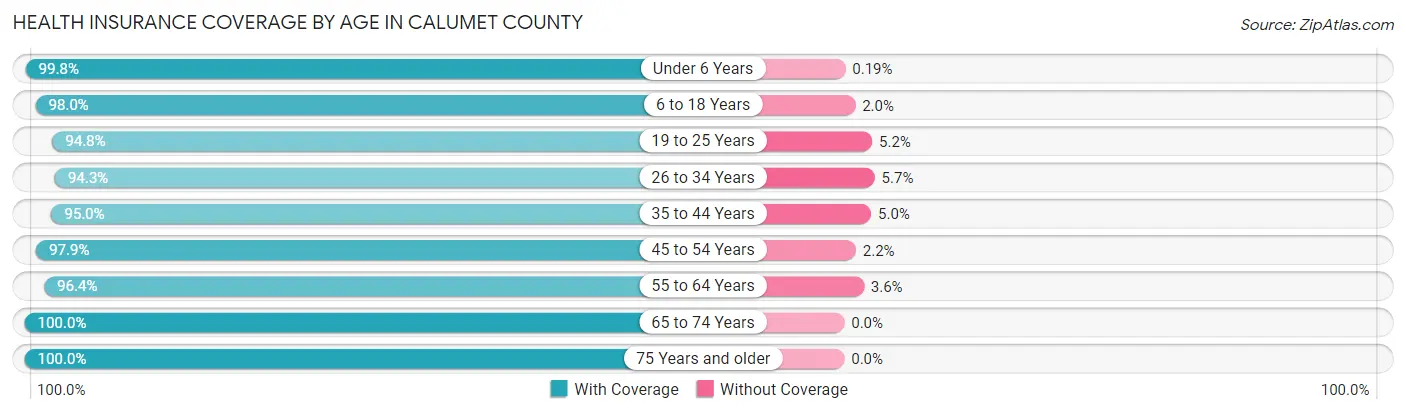
| Age Bracket | With Coverage | Without Coverage |
| Under 6 Years | 3,169 (99.8%) | 6 (0.2%) |
| 6 to 18 Years | 9,220 (98.0%) | 191 (2.0%) |
| 19 to 25 Years | 3,571 (94.8%) | 195 (5.2%) |
| 26 to 34 Years | 5,231 (94.3%) | 314 (5.7%) |
| 35 to 44 Years | 6,473 (95.0%) | 341 (5.0%) |
| 45 to 54 Years | 7,245 (97.9%) | 159 (2.1%) |
| 55 to 64 Years | 7,646 (96.4%) | 289 (3.6%) |
| 65 to 74 Years | 5,061 (100.0%) | 0 (0.0%) |
| 75 Years and older | 3,112 (100.0%) | 0 (0.0%) |
| Total | 50,728 (97.1%) | 1,495 (2.9%) |
Health Insurance Coverage by Citizenship Status in Calumet County

| Citizenship Status | With Coverage | Without Coverage |
| Native Born | 3,169 (99.8%) | 6 (0.2%) |
| Foreign Born, Citizen | 9,220 (98.0%) | 191 (2.0%) |
| Foreign Born, not a Citizen | 3,571 (94.8%) | 195 (5.2%) |
Health Insurance Coverage by Household Income in Calumet County

| Household Income | With Coverage | Without Coverage |
| Under $25,000 | 2,743 (93.0%) | 206 (7.0%) |
| $25,000 to $49,999 | 6,614 (95.7%) | 300 (4.3%) |
| $50,000 to $74,999 | 6,061 (93.3%) | 438 (6.7%) |
| $75,000 to $99,999 | 8,093 (97.1%) | 242 (2.9%) |
| $100,000 and over | 27,148 (98.9%) | 309 (1.1%) |
Public vs Private Health Insurance Coverage by Age in Calumet County
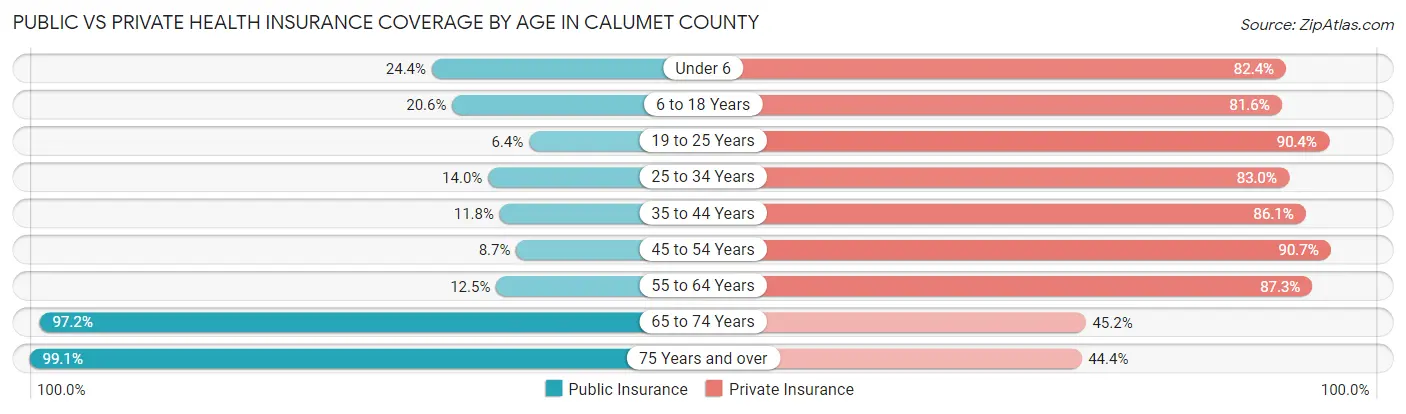
| Age Bracket | Public Insurance | Private Insurance |
| Under 6 | 775 (24.4%) | 2,617 (82.4%) |
| 6 to 18 Years | 1,941 (20.6%) | 7,680 (81.6%) |
| 19 to 25 Years | 240 (6.4%) | 3,404 (90.4%) |
| 25 to 34 Years | 774 (14.0%) | 4,600 (83.0%) |
| 35 to 44 Years | 804 (11.8%) | 5,866 (86.1%) |
| 45 to 54 Years | 647 (8.7%) | 6,716 (90.7%) |
| 55 to 64 Years | 989 (12.5%) | 6,928 (87.3%) |
| 65 to 74 Years | 4,921 (97.2%) | 2,289 (45.2%) |
| 75 Years and over | 3,083 (99.1%) | 1,383 (44.4%) |
| Total | 14,174 (27.1%) | 41,483 (79.4%) |
Disability Status by Sex by Age in Calumet County
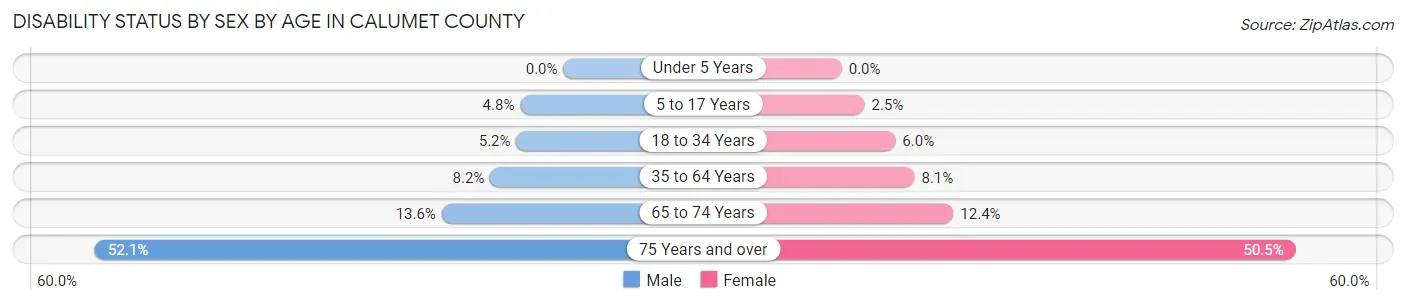
| Age Bracket | Male | Female |
| Under 5 Years | 0 (0.0%) | 0 (0.0%) |
| 5 to 17 Years | 237 (4.8%) | 112 (2.5%) |
| 18 to 34 Years | 270 (5.2%) | 284 (6.0%) |
| 35 to 64 Years | 919 (8.2%) | 881 (8.1%) |
| 65 to 74 Years | 339 (13.6%) | 318 (12.4%) |
| 75 Years and over | 693 (52.1%) | 901 (50.5%) |
Disability Class by Sex by Age in Calumet County
Disability Class: Hearing Difficulty
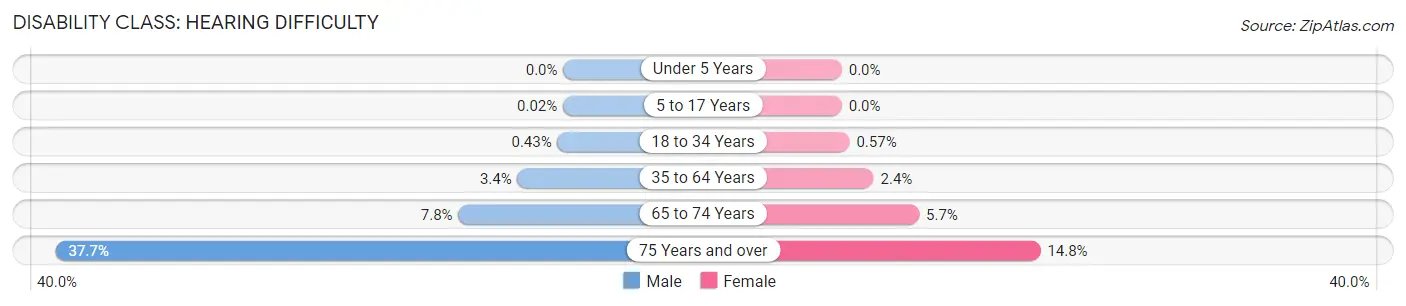
| Age Bracket | Male | Female |
| Under 5 Years | 0 (0.0%) | 0 (0.0%) |
| 5 to 17 Years | 1 (0.0%) | 0 (0.0%) |
| 18 to 34 Years | 22 (0.4%) | 27 (0.6%) |
| 35 to 64 Years | 383 (3.4%) | 257 (2.4%) |
| 65 to 74 Years | 195 (7.8%) | 147 (5.7%) |
| 75 Years and over | 501 (37.7%) | 263 (14.7%) |
Disability Class: Vision Difficulty
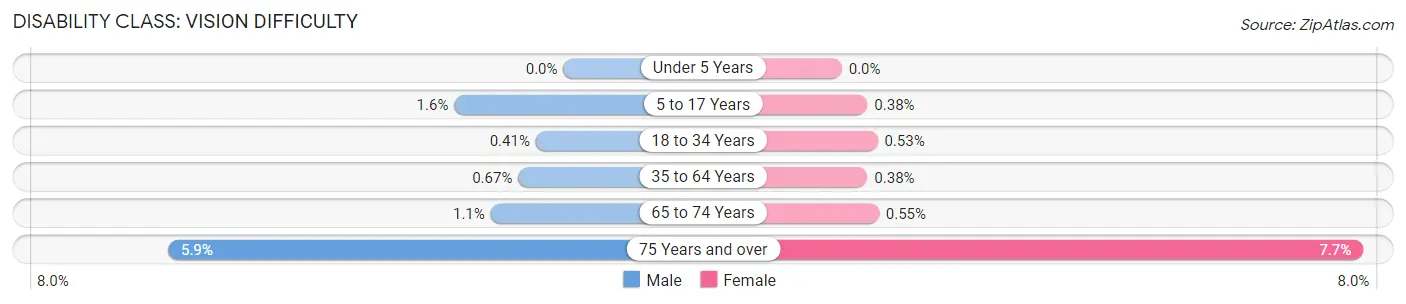
| Age Bracket | Male | Female |
| Under 5 Years | 0 (0.0%) | 0 (0.0%) |
| 5 to 17 Years | 80 (1.6%) | 17 (0.4%) |
| 18 to 34 Years | 21 (0.4%) | 25 (0.5%) |
| 35 to 64 Years | 75 (0.7%) | 41 (0.4%) |
| 65 to 74 Years | 27 (1.1%) | 14 (0.5%) |
| 75 Years and over | 78 (5.9%) | 138 (7.7%) |
Disability Class: Cognitive Difficulty

| Age Bracket | Male | Female |
| 5 to 17 Years | 154 (3.1%) | 88 (2.0%) |
| 18 to 34 Years | 172 (3.3%) | 106 (2.2%) |
| 35 to 64 Years | 199 (1.8%) | 304 (2.8%) |
| 65 to 74 Years | 45 (1.8%) | 39 (1.5%) |
| 75 Years and over | 206 (15.5%) | 171 (9.6%) |
Disability Class: Ambulatory Difficulty
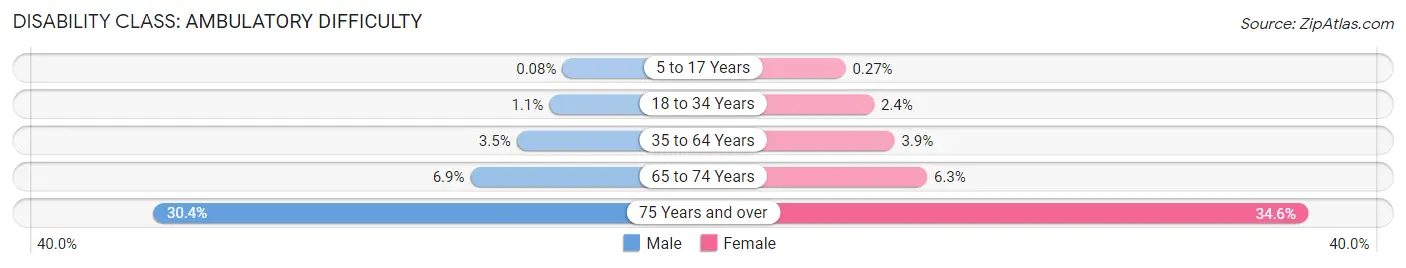
| Age Bracket | Male | Female |
| 5 to 17 Years | 4 (0.1%) | 12 (0.3%) |
| 18 to 34 Years | 55 (1.1%) | 114 (2.4%) |
| 35 to 64 Years | 392 (3.5%) | 425 (3.9%) |
| 65 to 74 Years | 173 (6.9%) | 162 (6.3%) |
| 75 Years and over | 404 (30.4%) | 617 (34.6%) |
Disability Class: Self-Care Difficulty
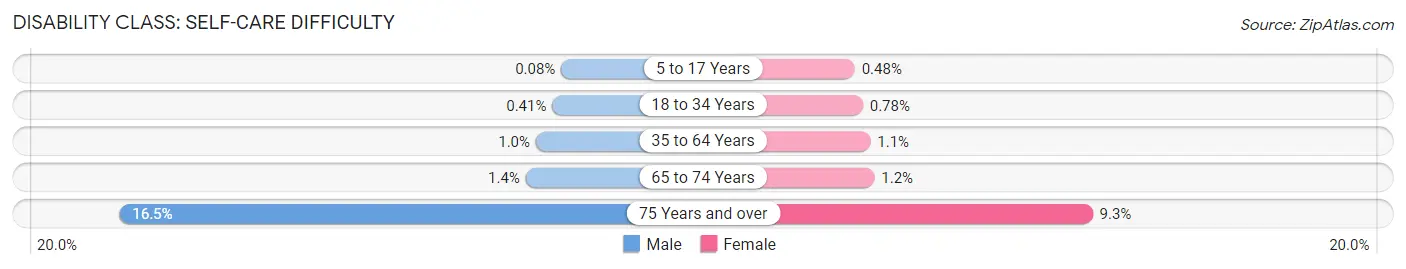
| Age Bracket | Male | Female |
| 5 to 17 Years | 4 (0.1%) | 21 (0.5%) |
| 18 to 34 Years | 21 (0.4%) | 37 (0.8%) |
| 35 to 64 Years | 115 (1.0%) | 115 (1.1%) |
| 65 to 74 Years | 35 (1.4%) | 31 (1.2%) |
| 75 Years and over | 219 (16.5%) | 166 (9.3%) |
Technology Access in Calumet County
Computing Device Access in Calumet County
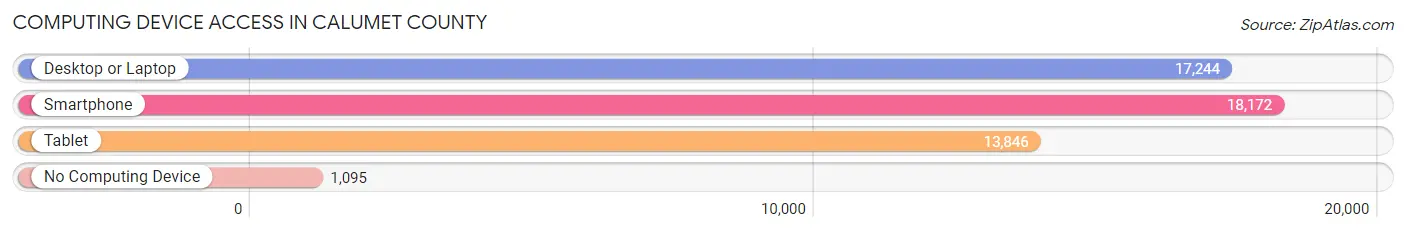
| Device Type | # Households | % Households |
| Desktop or Laptop | 17,244 | 83.3% |
| Smartphone | 18,172 | 87.7% |
| Tablet | 13,846 | 66.8% |
| No Computing Device | 1,095 | 5.3% |
| Total | 20,712 | 100.0% |
Internet Access in Calumet County
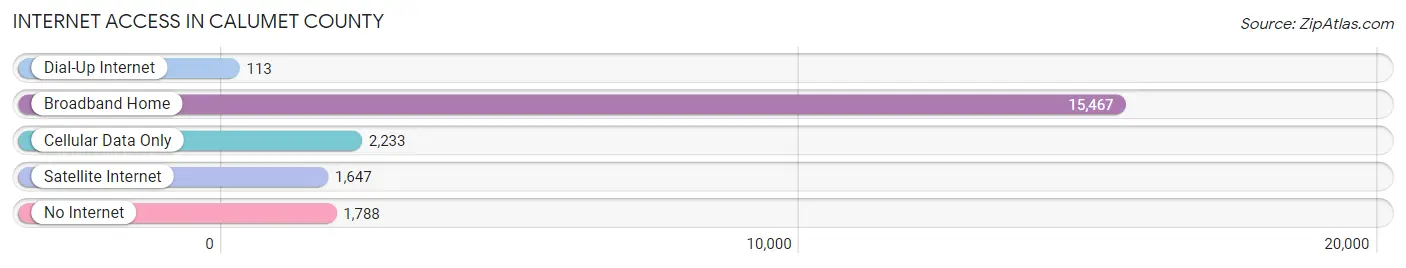
| Internet Type | # Households | % Households |
| Dial-Up Internet | 113 | 0.5% |
| Broadband Home | 15,467 | 74.7% |
| Cellular Data Only | 2,233 | 10.8% |
| Satellite Internet | 1,647 | 8.0% |
| No Internet | 1,788 | 8.6% |
| Total | 20,712 | 100.0% |
Calumet County Summary
Calumet County is located in the east-central part of Wisconsin, in the Fox River Valley. It is bordered by Outagamie County to the north, Winnebago County to the east, Fond du Lac County to the south, and Brown County to the west. The county seat is Chilton, and the largest city is Appleton. The county was created in 1836 and named after the Calumet River, which flows through the county.
Geography
Calumet County covers an area of 545 square miles, of which 543 square miles is land and 2 square miles is water. The Fox River flows through the county, and there are several lakes, including Lake Winnebago, Lake Poygan, and Lake Winneconne. The terrain is mostly flat, with some rolling hills in the western part of the county. The highest point in the county is located in the town of Brothertown, at an elevation of 1,068 feet.
Demographics
As of the 2010 census, there were 48,971 people, 18,845 households, and 13,541 families living in the county. The population density was 90 people per square mile. The racial makeup of the county was 95.3% White, 0.7% Black or African American, 0.4% Native American, 1.7% Asian, 0.1% Pacific Islander, 0.9% from other races, and 1.1% from two or more races. 2.7% of the population were Hispanic or Latino of any race.
The median income for a household in the county was $54,945, and the median income for a family was $65,945. The per capita income for the county was $25,945. About 5.2% of families and 7.3% of the population were below the poverty line, including 9.2% of those under age 18 and 6.2% of those age 65 or over.
Economy
Calumet County is home to several major industries, including manufacturing, agriculture, and tourism. The county is home to several large manufacturing companies, including Kimberly-Clark, Oshkosh Corporation, and Bemis Company. Agriculture is also an important part of the economy, with dairy farming being the most common type of farming in the county. Tourism is also an important part of the economy, with many visitors coming to the county to enjoy its natural beauty and recreational activities.
History
Calumet County was created in 1836 from parts of Brown and Winnebago counties. The county was named after the Calumet River, which flows through the county. The first settlers arrived in the area in the early 1800s, and the county was officially organized in 1845.
The county was an important part of the Underground Railroad, with many runaway slaves passing through the county on their way to freedom. The county was also an important part of the lumber industry, with many sawmills located in the area.
In the late 19th century, the county was home to several large dairy farms, and the county is still known for its dairy industry today. The county is also home to several large manufacturing companies, including Kimberly-Clark, Oshkosh Corporation, and Bemis Company.
Today, Calumet County is a vibrant and diverse community, with a strong economy and a rich history. The county is home to several large industries, and it is also a popular tourist destination, with many visitors coming to the county to enjoy its natural beauty and recreational activities.
Common Questions
What is the Total Population of Calumet County?
Total Population of Calumet County is 52,361.
What is the Total Male Population of Calumet County?
Total Male Population of Calumet County is 26,565.
What is the Total Female Population of Calumet County?
Total Female Population of Calumet County is 25,796.
What is the Ratio of Males per 100 Females in Calumet County?
There are 102.98 Males per 100 Females in Calumet County.
What is the Ratio of Females per 100 Males in Calumet County?
There are 97.11 Females per 100 Males in Calumet County.
What is the Median Population Age in Calumet County?
Median Population Age in Calumet County is 41.7 Years.
What is the Average Family Size in Calumet County
Average Family Size in Calumet County is 3.0 People.
What is the Average Household Size in Calumet County
Average Household Size in Calumet County is 2.5 People.
What is Per Capita Income in Calumet County?
Per Capita income in Calumet County is $42,110.
What is the Median Family Income in Calumet County?
Median Family Income in Calumet County is $103,656.
What is the Median Household income in Calumet County?
Median Household Income in Calumet County is $84,151.
What is Income or Wage Gap in Calumet County?
Income or Wage Gap in Calumet County is 30.0%.
Women in Calumet County earn 70.0 cents for every dollar earned by a man.
What is Family Income Deficit in Calumet County?
Family Income Deficit in Calumet County is $7,369.
Families that are below poverty line in Calumet County earn $7,369 less on average than the poverty threshold level.
What is Inequality or Gini Index in Calumet County?
Inequality or Gini Index in Calumet County is 0.41.
How Large is the Labor Force in Calumet County?
There are 29,641 People in the Labor Forcein in Calumet County.
What is the Percentage of People in the Labor Force in Calumet County?
70.6% of People are in the Labor Force in Calumet County.
What is the Unemployment Rate in Calumet County?
Unemployment Rate in Calumet County is 2.3%.