Burnett County, WI
Burnett County Map
Burnett County Overview
16,561
TOTAL POPULATION
8,572
MALE POPULATION
7,989
FEMALE POPULATION
107.30
MALES / 100 FEMALES
93.20
FEMALES / 100 MALES
54.4
MEDIAN AGE
2.9
AVG FAMILY SIZE
2.4
AVG HOUSEHOLD SIZE
$36,322
PER CAPITA INCOME
$75,934
AVG FAMILY INCOME
$60,466
AVG HOUSEHOLD INCOME
25.0%
WAGE / INCOME GAP [ % ]
75.0¢/ $1
WAGE / INCOME GAP [ $ ]
$8,265
FAMILY INCOME DEFICIT
0.45
INEQUALITY / GINI INDEX
7,222
LABOR FORCE [ PEOPLE ]
51.1%
PERCENT IN LABOR FORCE
5.2%
UNEMPLOYMENT RATE
Burnett County Area Codes
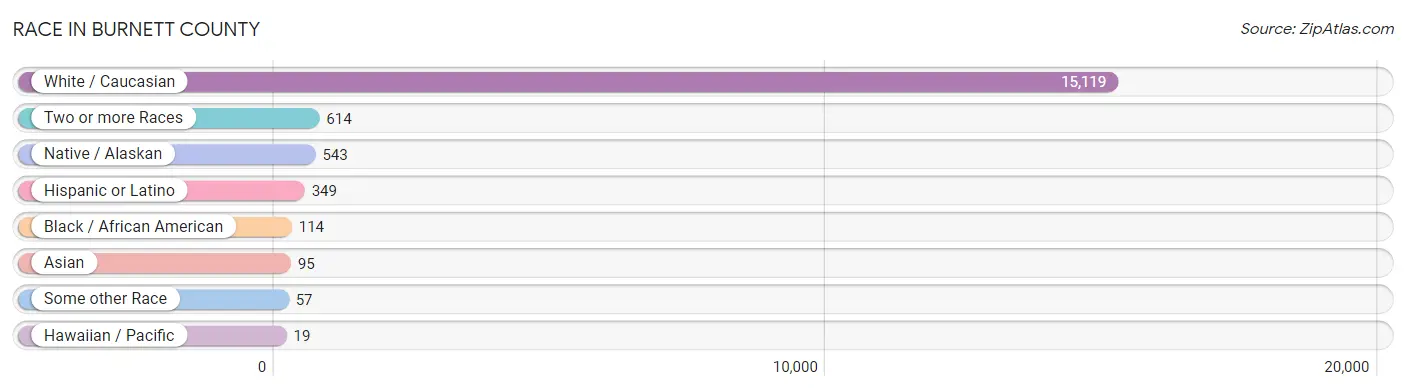
Race in Burnett County
The most populous races in Burnett County are White / Caucasian (15,119 | 91.3%), Two or more Races (614 | 3.7%), and Native / Alaskan (543 | 3.3%).
| Race | # Population | % Population |
| Asian | 95 | 0.6% |
| Black / African American | 114 | 0.7% |
| Hawaiian / Pacific | 19 | 0.1% |
| Hispanic or Latino | 349 | 2.1% |
| Native / Alaskan | 543 | 3.3% |
| White / Caucasian | 15,119 | 91.3% |
| Two or more Races | 614 | 3.7% |
| Some other Race | 57 | 0.3% |
| Total | 16,561 | 100.0% |
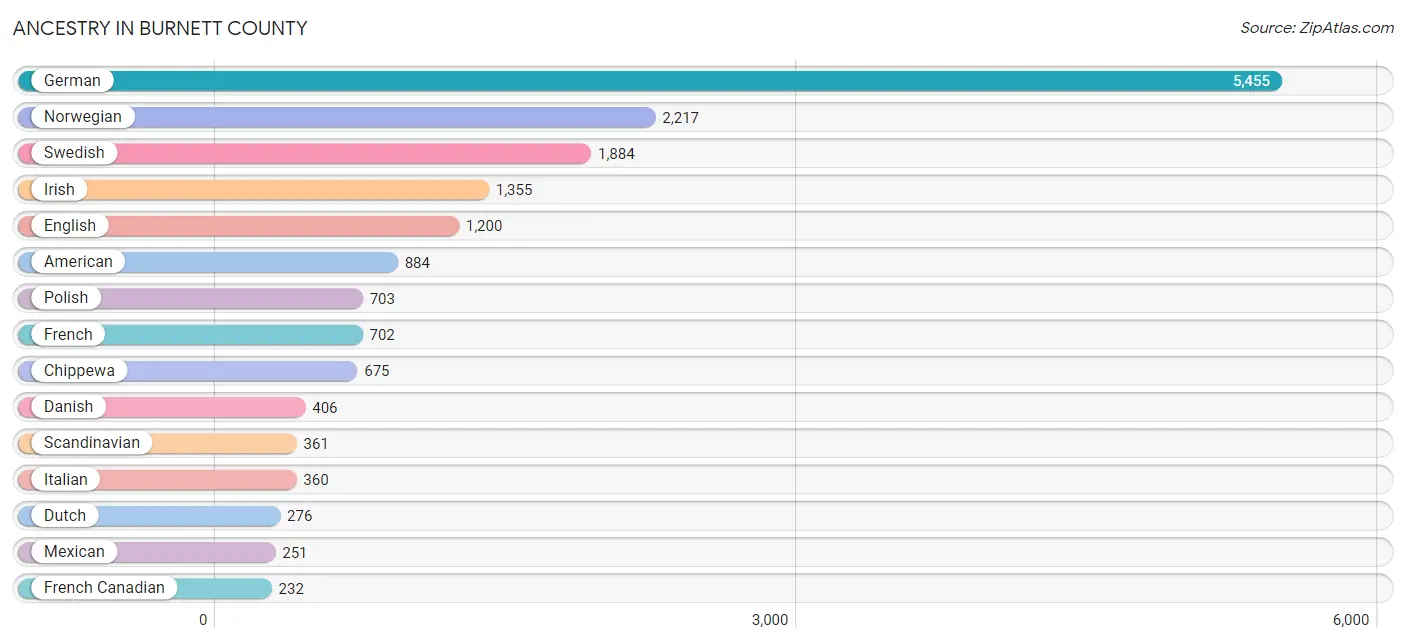
Ancestry in Burnett County
The most populous ancestries reported in Burnett County are German (5,455 | 32.9%), Norwegian (2,217 | 13.4%), Swedish (1,884 | 11.4%), Irish (1,355 | 8.2%), and English (1,200 | 7.2%), together accounting for 73.1% of all Burnett County residents.
| Ancestry | # Population | % Population |
| African | 19 | 0.1% |
| Alaska Native | 1 | 0.0% |
| Albanian | 17 | 0.1% |
| Aleut | 3 | 0.0% |
| Alsatian | 2 | 0.0% |
| American | 884 | 5.3% |
| Arab | 46 | 0.3% |
| Arapaho | 2 | 0.0% |
| Armenian | 2 | 0.0% |
| Austrian | 60 | 0.4% |
| Bangladeshi | 69 | 0.4% |
| Belgian | 19 | 0.1% |
| Belizean | 9 | 0.1% |
| Bhutanese | 6 | 0.0% |
| Blackfeet | 5 | 0.0% |
| British | 48 | 0.3% |
| Burmese | 5 | 0.0% |
| Canadian | 16 | 0.1% |
| Central American | 18 | 0.1% |
| Cherokee | 7 | 0.0% |
| Chippewa | 675 | 4.1% |
| Colombian | 7 | 0.0% |
| Croatian | 22 | 0.1% |
| Cuban | 18 | 0.1% |
| Czech | 175 | 1.1% |
| Czechoslovakian | 29 | 0.2% |
| Danish | 406 | 2.5% |
| Dutch | 276 | 1.7% |
| Eastern European | 46 | 0.3% |
| English | 1,200 | 7.2% |
| Ethiopian | 1 | 0.0% |
| European | 189 | 1.1% |
| Finnish | 142 | 0.9% |
| French | 702 | 4.2% |
| French American Indian | 2 | 0.0% |
| French Canadian | 232 | 1.4% |
| German | 5,455 | 32.9% |
| Greek | 15 | 0.1% |
| Guamanian / Chamorro | 52 | 0.3% |
| Guatemalan | 13 | 0.1% |
| Hungarian | 29 | 0.2% |
| Icelander | 2 | 0.0% |
| Indian (Asian) | 9 | 0.1% |
| Inupiat | 15 | 0.1% |
| Irish | 1,355 | 8.2% |
| Italian | 360 | 2.2% |
| Kenyan | 6 | 0.0% |
| Korean | 31 | 0.2% |
| Latvian | 8 | 0.1% |
| Lebanese | 40 | 0.2% |
| Lithuanian | 31 | 0.2% |
| Luxembourger | 22 | 0.1% |
| Mexican | 251 | 1.5% |
| Mexican American Indian | 19 | 0.1% |
| Native Hawaiian | 20 | 0.1% |
| Northern European | 45 | 0.3% |
| Norwegian | 2,217 | 13.4% |
| Paiute | 20 | 0.1% |
| Pennsylvania German | 8 | 0.1% |
| Polish | 703 | 4.2% |
| Portuguese | 6 | 0.0% |
| Puerto Rican | 9 | 0.1% |
| Romanian | 6 | 0.0% |
| Russian | 151 | 0.9% |
| Salvadoran | 5 | 0.0% |
| Samoan | 5 | 0.0% |
| Scandinavian | 361 | 2.2% |
| Scotch-Irish | 140 | 0.9% |
| Scottish | 200 | 1.2% |
| Serbian | 11 | 0.1% |
| Sioux | 14 | 0.1% |
| Slavic | 13 | 0.1% |
| Slovak | 35 | 0.2% |
| Slovene | 4 | 0.0% |
| South American | 7 | 0.0% |
| Spaniard | 2 | 0.0% |
| Spanish | 29 | 0.2% |
| Spanish American Indian | 1 | 0.0% |
| Subsaharan African | 26 | 0.2% |
| Swedish | 1,884 | 11.4% |
| Swiss | 66 | 0.4% |
| Syrian | 2 | 0.0% |
| Ukrainian | 8 | 0.1% |
| Welsh | 42 | 0.3% |
| Yugoslavian | 16 | 0.1% | View All 85 Rows |
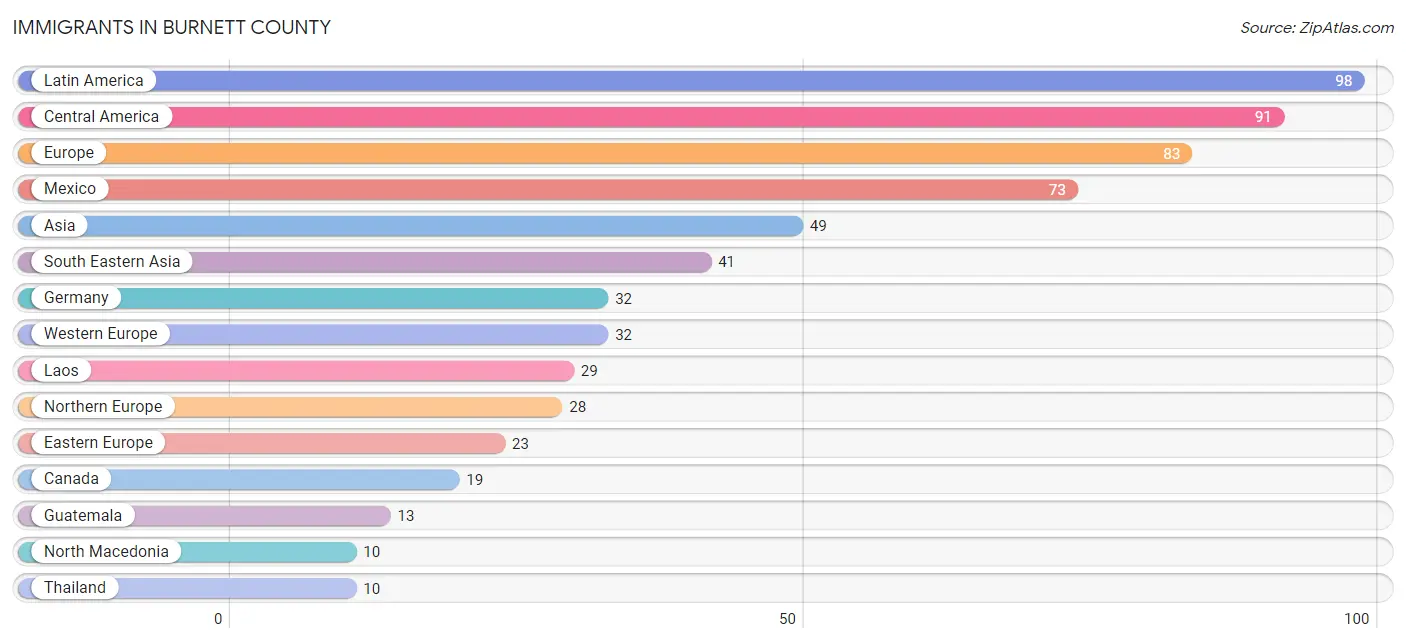
Immigrants in Burnett County
The most numerous immigrant groups reported in Burnett County came from Latin America (98 | 0.6%), Central America (91 | 0.5%), Europe (83 | 0.5%), Mexico (73 | 0.4%), and Asia (49 | 0.3%), together accounting for 2.4% of all Burnett County residents.
| Immigration Origin | # Population | % Population |
| Africa | 3 | 0.0% |
| Asia | 49 | 0.3% |
| Canada | 19 | 0.1% |
| Central America | 91 | 0.5% |
| China | 5 | 0.0% |
| Colombia | 7 | 0.0% |
| Eastern Africa | 3 | 0.0% |
| Eastern Asia | 8 | 0.1% |
| Eastern Europe | 23 | 0.1% |
| El Salvador | 5 | 0.0% |
| England | 3 | 0.0% |
| Ethiopia | 1 | 0.0% |
| Europe | 83 | 0.5% |
| Germany | 32 | 0.2% |
| Guatemala | 13 | 0.1% |
| Hungary | 2 | 0.0% |
| Japan | 3 | 0.0% |
| Laos | 29 | 0.2% |
| Latin America | 98 | 0.6% |
| Latvia | 6 | 0.0% |
| Mexico | 73 | 0.4% |
| North Macedonia | 10 | 0.1% |
| Northern Europe | 28 | 0.2% |
| Philippines | 2 | 0.0% |
| Russia | 5 | 0.0% |
| South America | 7 | 0.0% |
| South Eastern Asia | 41 | 0.3% |
| Sweden | 3 | 0.0% |
| Thailand | 10 | 0.1% |
| Western Europe | 32 | 0.2% | View All 30 Rows |
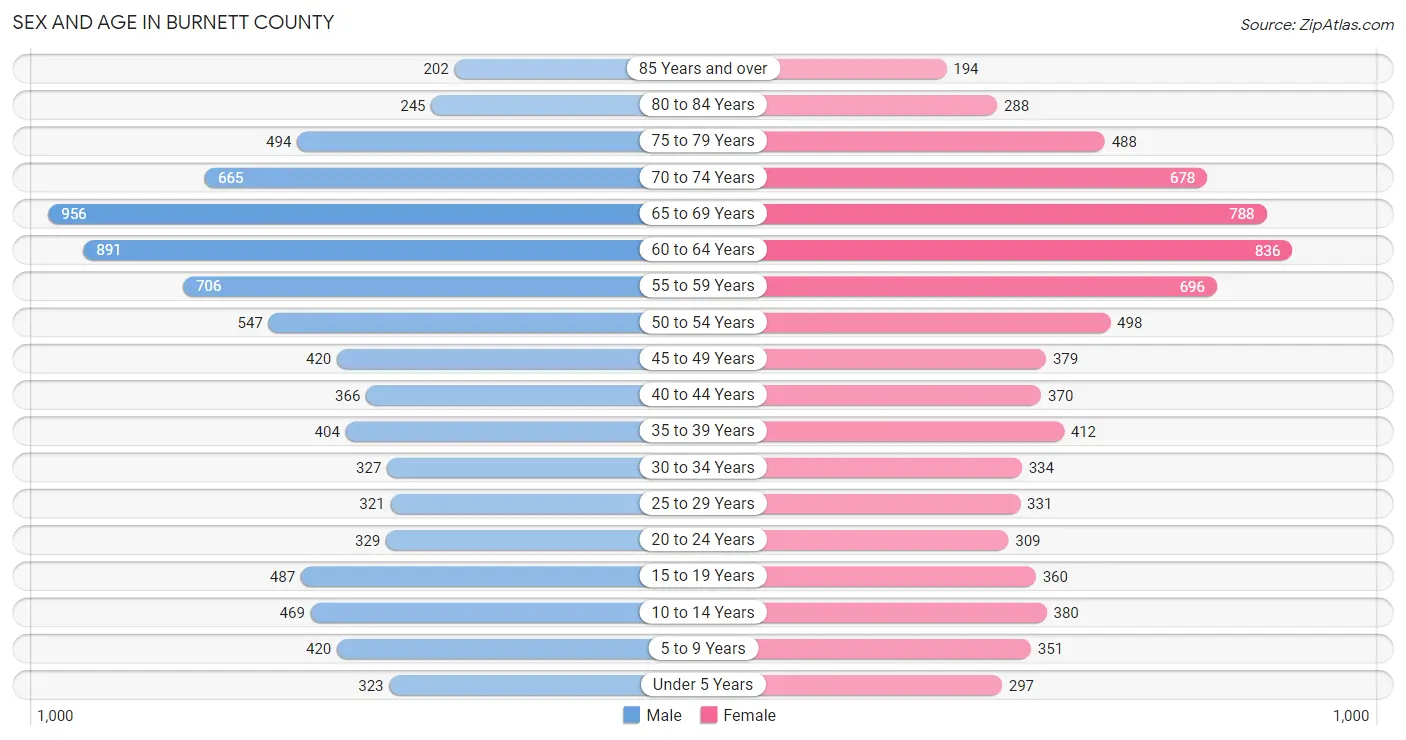
Sex and Age in Burnett County
Sex and Age in Burnett County
The most populous age groups in Burnett County are 65 to 69 Years (956 | 11.2%) for men and 60 to 64 Years (836 | 10.5%) for women.
| Age Bracket | Male | Female |
| Under 5 Years | 323 (3.8%) | 297 (3.7%) |
| 5 to 9 Years | 420 (4.9%) | 351 (4.4%) |
| 10 to 14 Years | 469 (5.5%) | 380 (4.8%) |
| 15 to 19 Years | 487 (5.7%) | 360 (4.5%) |
| 20 to 24 Years | 329 (3.8%) | 309 (3.9%) |
| 25 to 29 Years | 321 (3.7%) | 331 (4.1%) |
| 30 to 34 Years | 327 (3.8%) | 334 (4.2%) |
| 35 to 39 Years | 404 (4.7%) | 412 (5.2%) |
| 40 to 44 Years | 366 (4.3%) | 370 (4.6%) |
| 45 to 49 Years | 420 (4.9%) | 379 (4.7%) |
| 50 to 54 Years | 547 (6.4%) | 498 (6.2%) |
| 55 to 59 Years | 706 (8.2%) | 696 (8.7%) |
| 60 to 64 Years | 891 (10.4%) | 836 (10.5%) |
| 65 to 69 Years | 956 (11.2%) | 788 (9.9%) |
| 70 to 74 Years | 665 (7.8%) | 678 (8.5%) |
| 75 to 79 Years | 494 (5.8%) | 488 (6.1%) |
| 80 to 84 Years | 245 (2.9%) | 288 (3.6%) |
| 85 Years and over | 202 (2.4%) | 194 (2.4%) |
| Total | 8,572 (100.0%) | 7,989 (100.0%) |
Families and Households in Burnett County
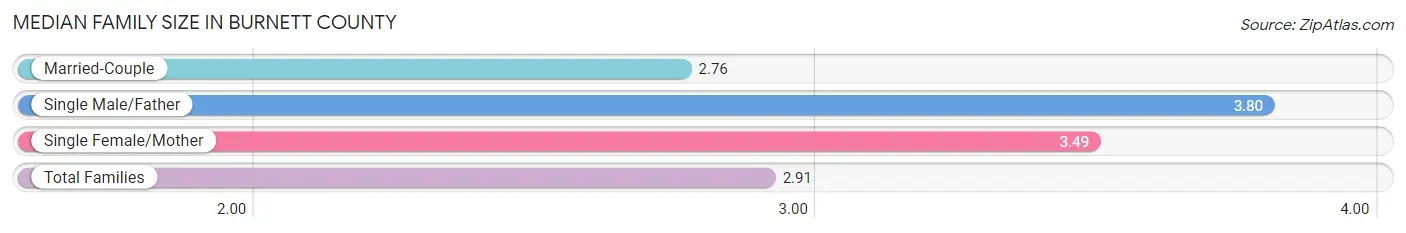
Median Family Size in Burnett County
The median family size in Burnett County is 2.91 persons per family, with single male/father families (298 | 6.9%) accounting for the largest median family size of 3.8 persons per family. On the other hand, married-couple families (3,584 | 82.7%) represent the smallest median family size with 2.76 persons per family.
| Family Type | # Families | Family Size |
| Married-Couple | 3,584 (82.7%) | 2.76 |
| Single Male/Father | 298 (6.9%) | 3.80 |
| Single Female/Mother | 452 (10.4%) | 3.49 |
| Total Families | 4,334 (100.0%) | 2.91 |
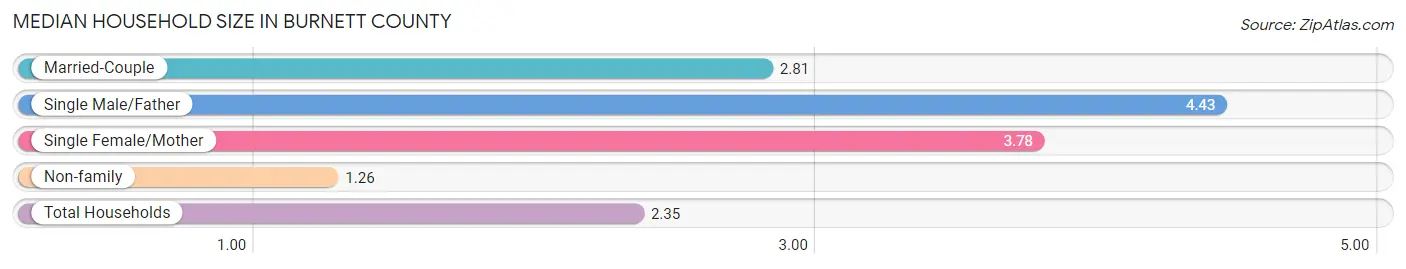
Median Household Size in Burnett County
The median household size in Burnett County is 2.35 persons per household, with single male/father households (298 | 4.3%) accounting for the largest median household size of 4.43 persons per household. non-family households (2,655 | 38.0%) represent the smallest median household size with 1.26 persons per household.
| Household Type | # Households | Household Size |
| Married-Couple | 3,584 (51.3%) | 2.81 |
| Single Male/Father | 298 (4.3%) | 4.43 |
| Single Female/Mother | 452 (6.5%) | 3.78 |
| Non-family | 2,655 (38.0%) | 1.26 |
| Total Households | 6,989 (100.0%) | 2.35 |
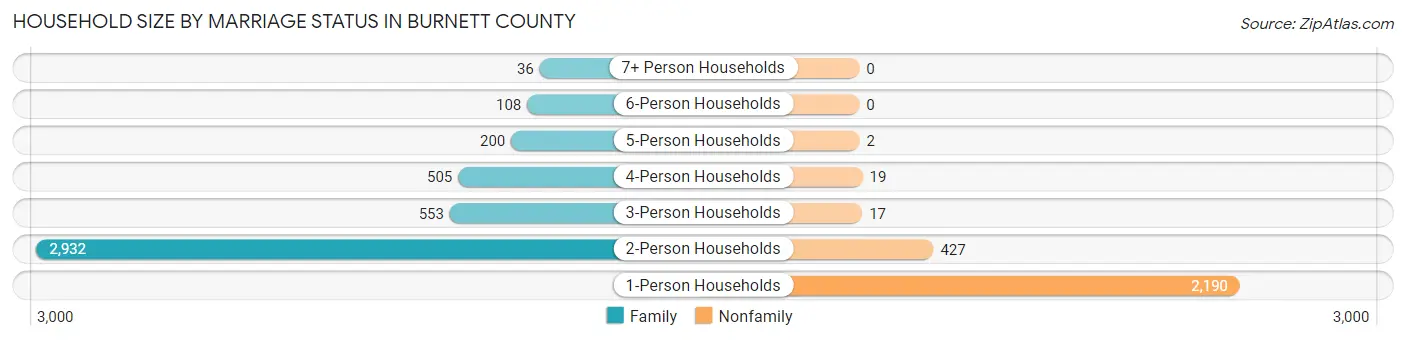
Household Size by Marriage Status in Burnett County
Out of a total of 6,989 households in Burnett County, 4,334 (62.0%) are family households, while 2,655 (38.0%) are nonfamily households. The most numerous type of family households are 2-person households, comprising 2,932, and the most common type of nonfamily households are 1-person households, comprising 2,190.
| Household Size | Family Households | Nonfamily Households |
| 1-Person Households | - | 2,190 (31.3%) |
| 2-Person Households | 2,932 (41.9%) | 427 (6.1%) |
| 3-Person Households | 553 (7.9%) | 17 (0.2%) |
| 4-Person Households | 505 (7.2%) | 19 (0.3%) |
| 5-Person Households | 200 (2.9%) | 2 (0.0%) |
| 6-Person Households | 108 (1.5%) | 0 (0.0%) |
| 7+ Person Households | 36 (0.5%) | 0 (0.0%) |
| Total | 4,334 (62.0%) | 2,655 (38.0%) |
Female Fertility in Burnett County
Fertility by Age in Burnett County
Average fertility rate in Burnett County is 33.0 births per 1,000 women. Women in the age bracket of 20 to 34 years have the highest fertility rate with 77.0 births per 1,000 women. Women in the age bracket of 20 to 34 years acount for 89.3% of all women with births.
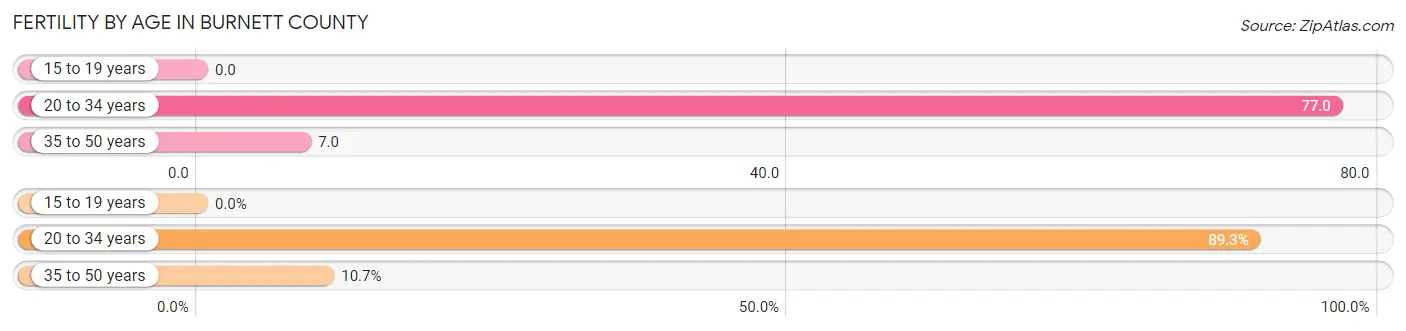
| Age Bracket | Women with Births | Births / 1,000 Women |
| 15 to 19 years | 0 (0.0%) | 0.0 |
| 20 to 34 years | 75 (89.3%) | 77.0 |
| 35 to 50 years | 9 (10.7%) | 7.0 |
| Total | 84 (100.0%) | 33.0 |
Fertility by Age by Marriage Status in Burnett County
51.2% of women with births (84) in Burnett County are married. The highest percentage of unmarried women with births falls into 20 to 34 years age bracket with 49.3% of them unmarried at the time of birth, while the lowest percentage of unmarried women with births belong to 35 to 50 years age bracket with 44.4% of them unmarried.
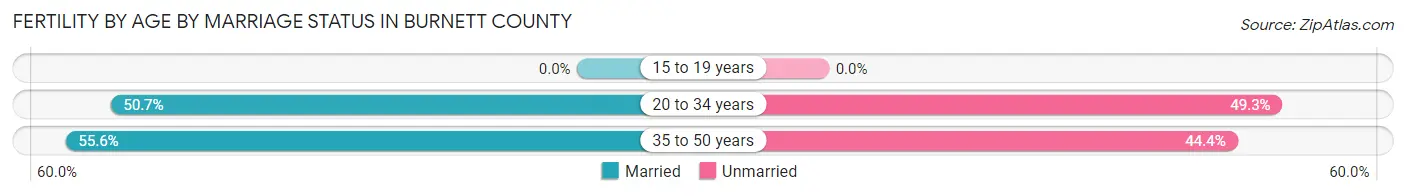
| Age Bracket | Married | Unmarried |
| 15 to 19 years | 0 (0.0%) | 0 (0.0%) |
| 20 to 34 years | 38 (50.7%) | 37 (49.3%) |
| 35 to 50 years | 5 (55.6%) | 4 (44.4%) |
| Total | 43 (51.2%) | 41 (48.8%) |
Fertility by Education in Burnett County
Average fertility rate in Burnett County is 33.0 births per 1,000 women. Women with the education attainment of college or associate's degree have the highest fertility rate of 57.0 births per 1,000 women, while women with the education attainment of graduate degree have the lowest fertility at 14.0 births per 1,000 women. Women with the education attainment of college or associate's degree represent 61.9% of all women with births.
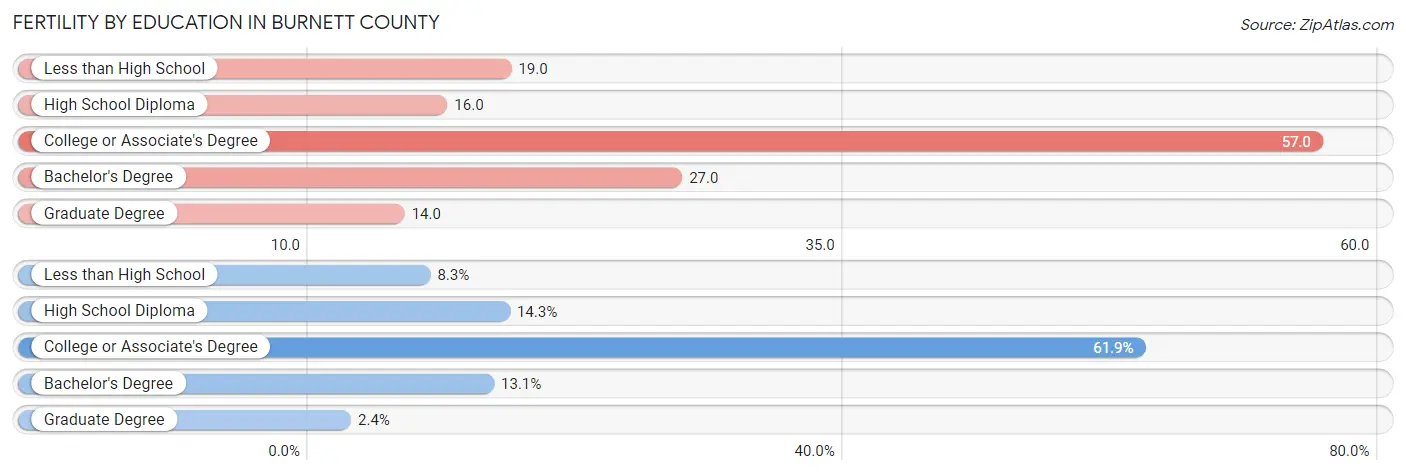
| Educational Attainment | Women with Births | Births / 1,000 Women |
| Less than High School | 7 (8.3%) | 19.0 |
| High School Diploma | 12 (14.3%) | 16.0 |
| College or Associate's Degree | 52 (61.9%) | 57.0 |
| Bachelor's Degree | 11 (13.1%) | 27.0 |
| Graduate Degree | 2 (2.4%) | 14.0 |
| Total | 84 (100.0%) | 33.0 |
Fertility by Education by Marriage Status in Burnett County
48.8% of women with births in Burnett County are unmarried. Women with the educational attainment of bachelor's degree are most likely to be married with 100.0% of them married at childbirth, while women with the educational attainment of less than high school are least likely to be married with 100.0% of them unmarried at childbirth.
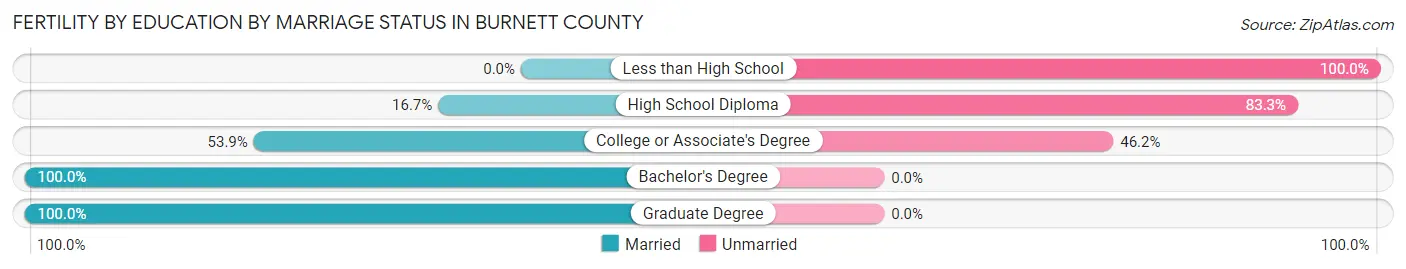
| Educational Attainment | Married | Unmarried |
| Less than High School | 0 (0.0%) | 7 (100.0%) |
| High School Diploma | 2 (16.7%) | 10 (83.3%) |
| College or Associate's Degree | 28 (53.8%) | 24 (46.2%) |
| Bachelor's Degree | 11 (100.0%) | 0 (0.0%) |
| Graduate Degree | 2 (100.0%) | 0 (0.0%) |
| Total | 43 (51.2%) | 41 (48.8%) |
Income in Burnett County
Income Overview in Burnett County
Per Capita Income in Burnett County is $36,322, while median incomes of families and households are $75,934 and $60,466 respectively.
| Characteristic | Number | Measure |
| Per Capita Income | 16,561 | $36,322 |
| Median Family Income | 4,334 | $75,934 |
| Mean Family Income | 4,334 | $95,560 |
| Median Household Income | 6,989 | $60,466 |
| Mean Household Income | 6,989 | $79,906 |
| Income Deficit | 4,334 | $8,265 |
| Wage / Income Gap (%) | 16,561 | 24.98% |
| Wage / Income Gap ($) | 16,561 | 75.02¢ per $1 |
| Gini / Inequality Index | 16,561 | 0.45 |
Earnings by Sex in Burnett County
Average Earnings in Burnett County are $36,134, $41,822 for men and $31,376 for women, a difference of 25.0%.
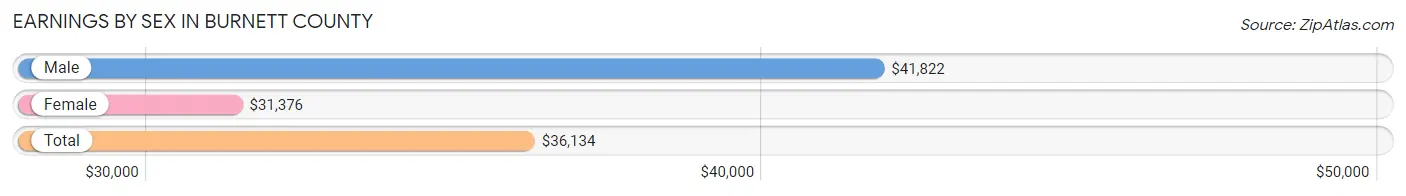
| Sex | Number | Average Earnings |
| Male | 4,010 (51.3%) | $41,822 |
| Female | 3,809 (48.7%) | $31,376 |
| Total | 7,819 (100.0%) | $36,134 |
Earnings by Sex by Income Bracket in Burnett County
The most common earnings brackets in Burnett County are $100,000+ for men (424 | 10.6%) and $35,000 to $39,999 for women (298 | 7.8%).
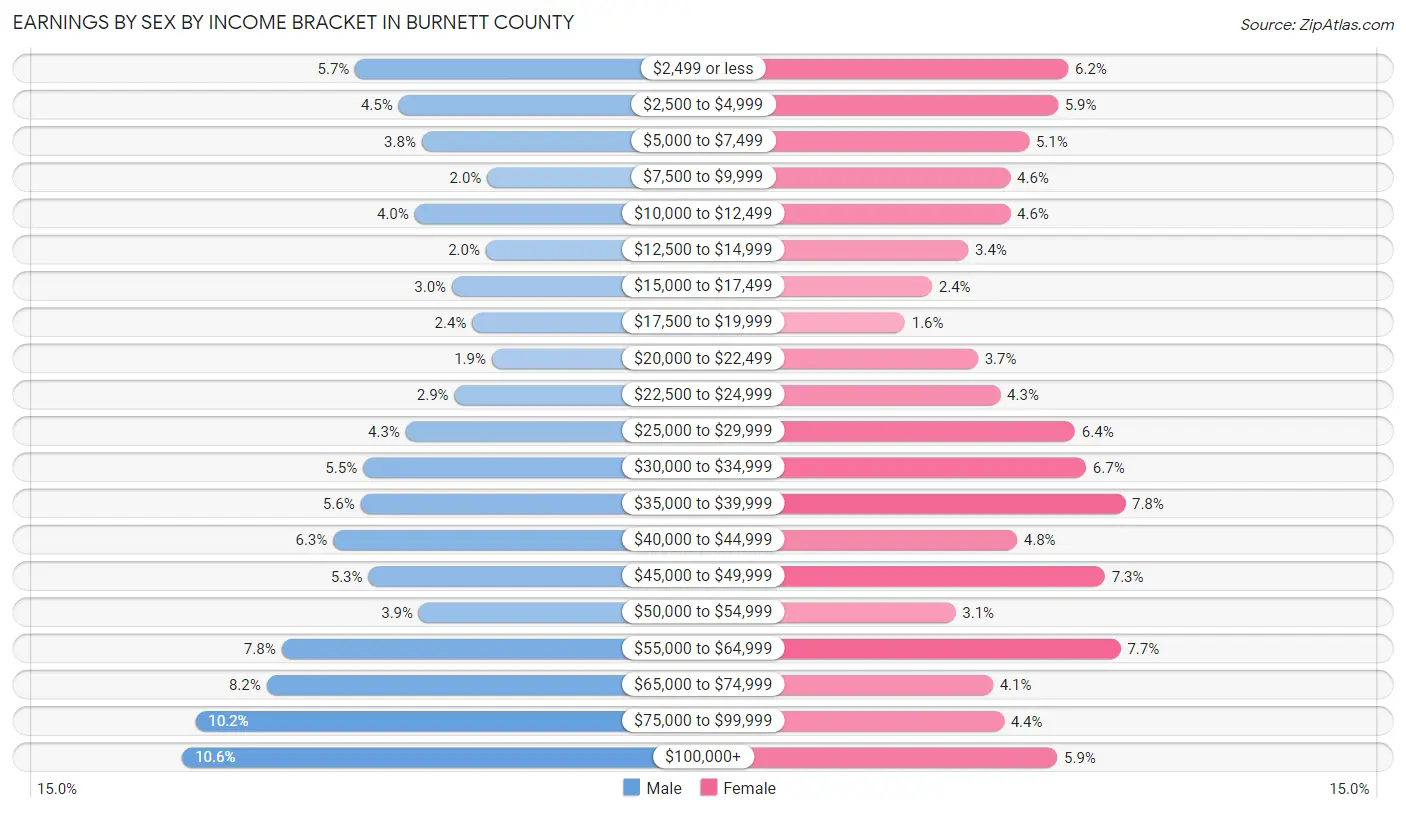
| Income | Male | Female |
| $2,499 or less | 229 (5.7%) | 237 (6.2%) |
| $2,500 to $4,999 | 180 (4.5%) | 226 (5.9%) |
| $5,000 to $7,499 | 154 (3.8%) | 195 (5.1%) |
| $7,500 to $9,999 | 80 (2.0%) | 175 (4.6%) |
| $10,000 to $12,499 | 162 (4.0%) | 175 (4.6%) |
| $12,500 to $14,999 | 82 (2.0%) | 130 (3.4%) |
| $15,000 to $17,499 | 120 (3.0%) | 91 (2.4%) |
| $17,500 to $19,999 | 97 (2.4%) | 62 (1.6%) |
| $20,000 to $22,499 | 75 (1.9%) | 140 (3.7%) |
| $22,500 to $24,999 | 117 (2.9%) | 164 (4.3%) |
| $25,000 to $29,999 | 172 (4.3%) | 244 (6.4%) |
| $30,000 to $34,999 | 220 (5.5%) | 256 (6.7%) |
| $35,000 to $39,999 | 223 (5.6%) | 298 (7.8%) |
| $40,000 to $44,999 | 254 (6.3%) | 182 (4.8%) |
| $45,000 to $49,999 | 214 (5.3%) | 276 (7.2%) |
| $50,000 to $54,999 | 157 (3.9%) | 116 (3.0%) |
| $55,000 to $64,999 | 312 (7.8%) | 293 (7.7%) |
| $65,000 to $74,999 | 329 (8.2%) | 156 (4.1%) |
| $75,000 to $99,999 | 409 (10.2%) | 168 (4.4%) |
| $100,000+ | 424 (10.6%) | 225 (5.9%) |
| Total | 4,010 (100.0%) | 3,809 (100.0%) |
Earnings by Sex by Educational Attainment in Burnett County
Average earnings in Burnett County are $45,307 for men and $34,969 for women, a difference of 22.8%. Men with an educational attainment of bachelor's degree enjoy the highest average annual earnings of $58,966, while those with less than high school education earn the least with $31,296. Women with an educational attainment of graduate degree earn the most with the average annual earnings of $62,292, while those with high school diploma education have the smallest earnings of $26,699.

| Educational Attainment | Male Income | Female Income |
| Less than High School | $31,296 | $32,596 |
| High School Diploma | $43,171 | $26,699 |
| College or Associate's Degree | $47,929 | $35,296 |
| Bachelor's Degree | $58,966 | $45,417 |
| Graduate Degree | $45,417 | $62,292 |
| Total | $45,307 | $34,969 |
Family Income in Burnett County
Family Income Brackets in Burnett County
According to the Burnett County family income data, there are 940 families falling into the $50,000 to $74,999 income range, which is the most common income bracket and makes up 21.7% of all families. Conversely, the less than $10,000 income bracket is the least frequent group with only 100 families (2.3%) belonging to this category.
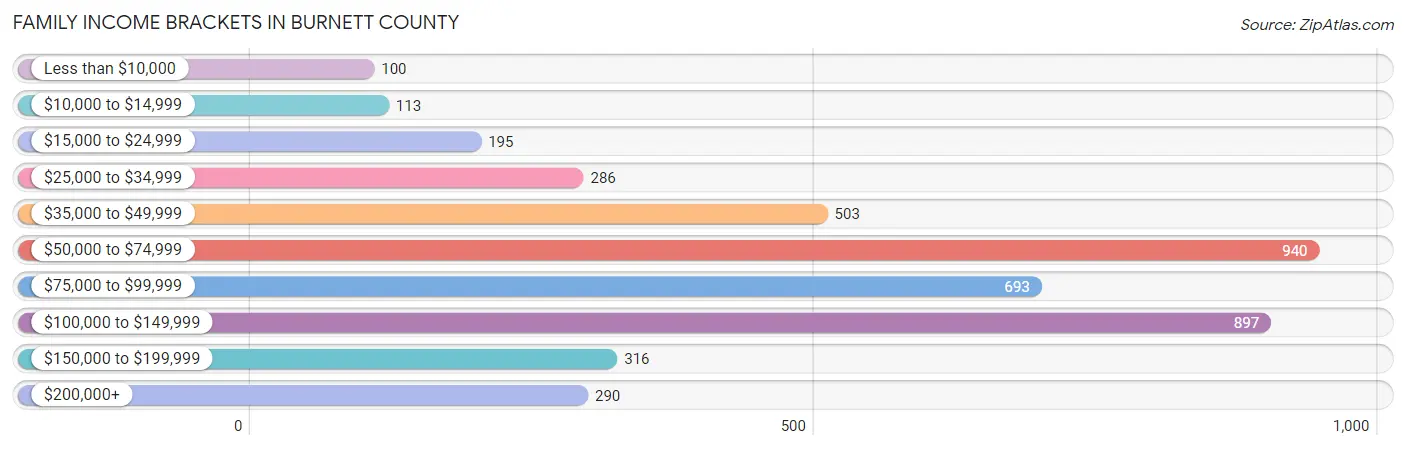
| Income Bracket | # Families | % Families |
| Less than $10,000 | 100 | 2.3% |
| $10,000 to $14,999 | 113 | 2.6% |
| $15,000 to $24,999 | 195 | 4.5% |
| $25,000 to $34,999 | 286 | 6.6% |
| $35,000 to $49,999 | 503 | 11.6% |
| $50,000 to $74,999 | 940 | 21.7% |
| $75,000 to $99,999 | 693 | 16.0% |
| $100,000 to $149,999 | 897 | 20.7% |
| $150,000 to $199,999 | 316 | 7.3% |
| $200,000+ | 290 | 6.7% |
Family Income by Famaliy Size in Burnett County
4-person families (440 | 10.2%) account for the highest median family income in Burnett County with $105,000 per family, while 2-person families (3,047 | 70.3%) have the highest median income of $35,307 per family member.
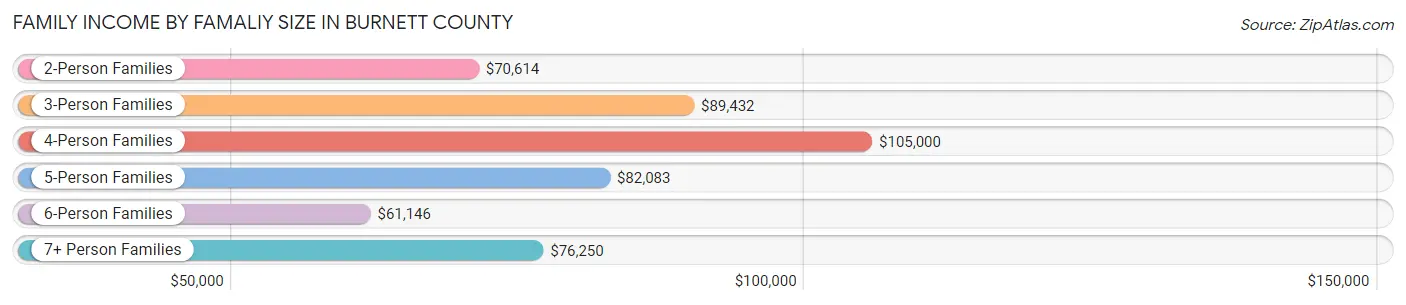
| Income Bracket | # Families | Median Income |
| 2-Person Families | 3,047 (70.3%) | $70,614 |
| 3-Person Families | 565 (13.0%) | $89,432 |
| 4-Person Families | 440 (10.2%) | $105,000 |
| 5-Person Families | 159 (3.7%) | $82,083 |
| 6-Person Families | 97 (2.2%) | $61,146 |
| 7+ Person Families | 26 (0.6%) | $76,250 |
| Total | 4,334 (100.0%) | $75,934 |
Family Income by Number of Earners in Burnett County
The median family income in Burnett County is $75,934, with families comprising 3+ earners (283) having the highest median family income of $118,393, while families with no earners (1,333) have the lowest median family income of $60,542, accounting for 6.5% and 30.8% of families, respectively.
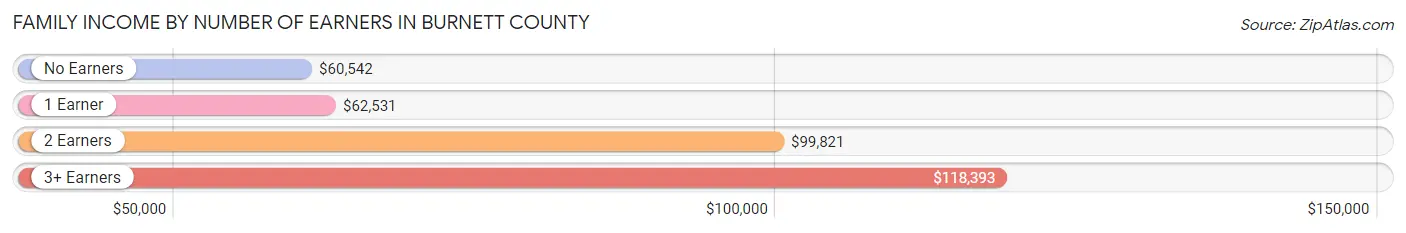
| Number of Earners | # Families | Median Income |
| No Earners | 1,333 (30.8%) | $60,542 |
| 1 Earner | 1,255 (29.0%) | $62,531 |
| 2 Earners | 1,463 (33.8%) | $99,821 |
| 3+ Earners | 283 (6.5%) | $118,393 |
| Total | 4,334 (100.0%) | $75,934 |
Household Income in Burnett County
Household Income Brackets in Burnett County
With 1,433 households falling in the category, the $50,000 to $74,999 income range is the most frequent in Burnett County, accounting for 20.5% of all households. In contrast, only 321 households (4.6%) fall into the $10,000 to $14,999 income bracket, making it the least populous group.
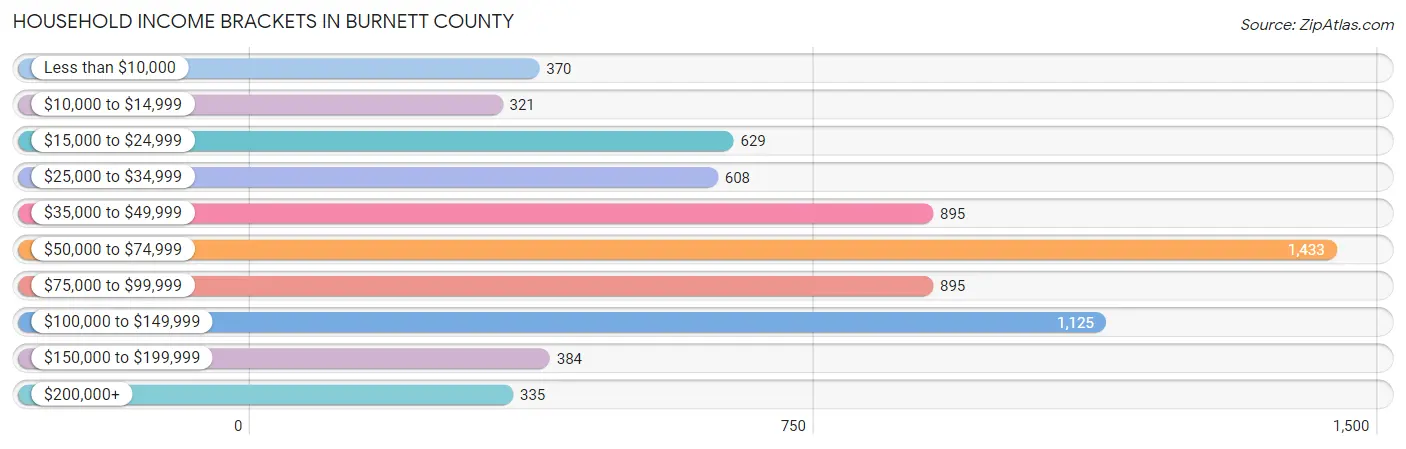
| Income Bracket | # Households | % Households |
| Less than $10,000 | 370 | 5.3% |
| $10,000 to $14,999 | 321 | 4.6% |
| $15,000 to $24,999 | 629 | 9.0% |
| $25,000 to $34,999 | 608 | 8.7% |
| $35,000 to $49,999 | 895 | 12.8% |
| $50,000 to $74,999 | 1,433 | 20.5% |
| $75,000 to $99,999 | 895 | 12.8% |
| $100,000 to $149,999 | 1,125 | 16.1% |
| $150,000 to $199,999 | 384 | 5.5% |
| $200,000+ | 335 | 4.8% |
Household Income by Householder Age in Burnett County
The median household income in Burnett County is $60,466, with the highest median household income of $72,550 found in the 25 to 44 years age bracket for the primary householder. A total of 1,097 households (15.7%) fall into this category. Meanwhile, the 65+ years age bracket for the primary householder has the lowest median household income of $50,696, with 3,096 households (44.3%) in this group.
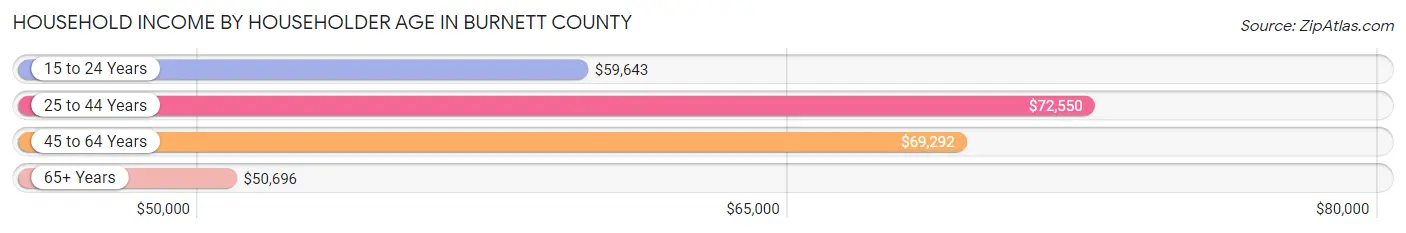
| Income Bracket | # Households | Median Income |
| 15 to 24 Years | 106 (1.5%) | $59,643 |
| 25 to 44 Years | 1,097 (15.7%) | $72,550 |
| 45 to 64 Years | 2,690 (38.5%) | $69,292 |
| 65+ Years | 3,096 (44.3%) | $50,696 |
| Total | 6,989 (100.0%) | $60,466 |
Poverty in Burnett County
Income Below Poverty by Sex and Age in Burnett County
With 10.6% poverty level for males and 12.7% for females among the residents of Burnett County, 15 year old males and under 5 year old females are the most vulnerable to poverty, with 21 males (15.8%) and 69 females (23.5%) in their respective age groups living below the poverty level.
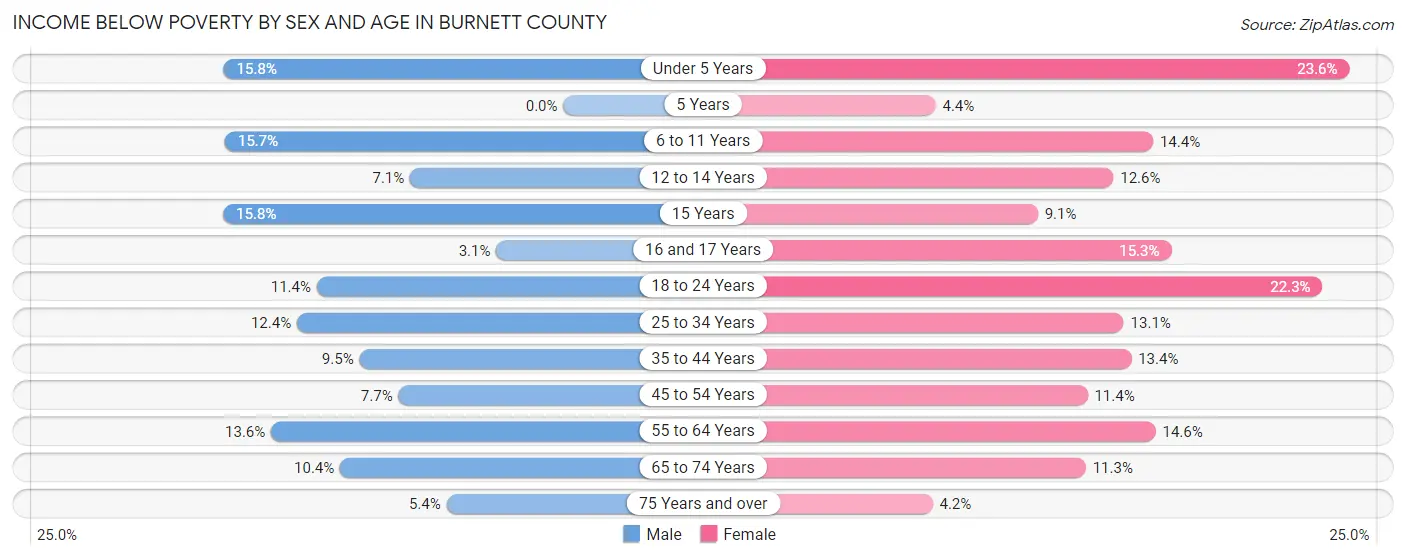
| Age Bracket | Male | Female |
| Under 5 Years | 50 (15.8%) | 69 (23.5%) |
| 5 Years | 0 (0.0%) | 3 (4.3%) |
| 6 to 11 Years | 96 (15.7%) | 54 (14.4%) |
| 12 to 14 Years | 14 (7.1%) | 32 (12.6%) |
| 15 Years | 21 (15.8%) | 5 (9.1%) |
| 16 and 17 Years | 5 (3.1%) | 26 (15.3%) |
| 18 to 24 Years | 58 (11.4%) | 99 (22.3%) |
| 25 to 34 Years | 79 (12.4%) | 87 (13.1%) |
| 35 to 44 Years | 72 (9.5%) | 105 (13.4%) |
| 45 to 54 Years | 74 (7.6%) | 100 (11.4%) |
| 55 to 64 Years | 215 (13.6%) | 223 (14.6%) |
| 65 to 74 Years | 168 (10.4%) | 166 (11.3%) |
| 75 Years and over | 50 (5.4%) | 40 (4.2%) |
| Total | 902 (10.6%) | 1,009 (12.7%) |
Income Above Poverty by Sex and Age in Burnett County
According to the poverty statistics in Burnett County, males aged 5 years and females aged 75 years and over are the age groups that are most secure financially, with 100.0% of males and 95.8% of females in these age groups living above the poverty line.
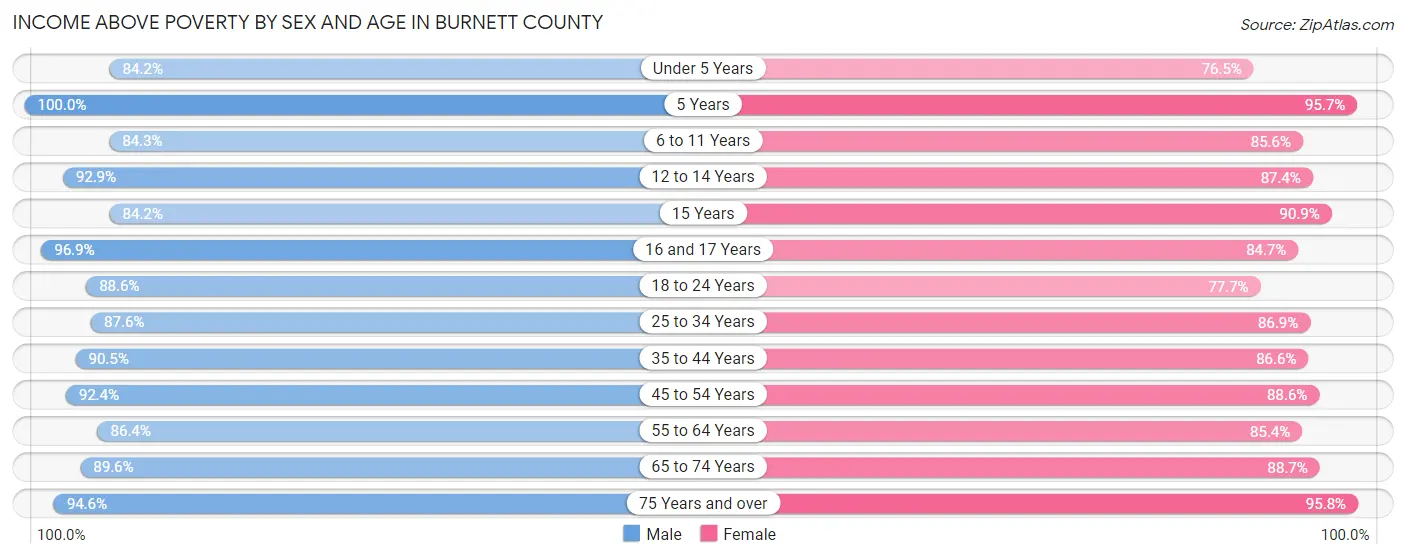
| Age Bracket | Male | Female |
| Under 5 Years | 267 (84.2%) | 224 (76.4%) |
| 5 Years | 56 (100.0%) | 66 (95.7%) |
| 6 to 11 Years | 515 (84.3%) | 320 (85.6%) |
| 12 to 14 Years | 183 (92.9%) | 222 (87.4%) |
| 15 Years | 112 (84.2%) | 50 (90.9%) |
| 16 and 17 Years | 156 (96.9%) | 144 (84.7%) |
| 18 to 24 Years | 449 (88.6%) | 345 (77.7%) |
| 25 to 34 Years | 560 (87.6%) | 578 (86.9%) |
| 35 to 44 Years | 689 (90.5%) | 677 (86.6%) |
| 45 to 54 Years | 893 (92.3%) | 777 (88.6%) |
| 55 to 64 Years | 1,370 (86.4%) | 1,309 (85.4%) |
| 65 to 74 Years | 1,453 (89.6%) | 1,300 (88.7%) |
| 75 Years and over | 873 (94.6%) | 911 (95.8%) |
| Total | 7,576 (89.4%) | 6,923 (87.3%) |
Income Below Poverty Among Married-Couple Families in Burnett County
The poverty statistics for married-couple families in Burnett County show that 4.6% or 166 of the total 3,584 families live below the poverty line. Families with 3 or 4 children have the highest poverty rate of 13.1%, comprising of 20 families. On the other hand, families with 1 or 2 children have the lowest poverty rate of 3.8%, which includes 22 families.
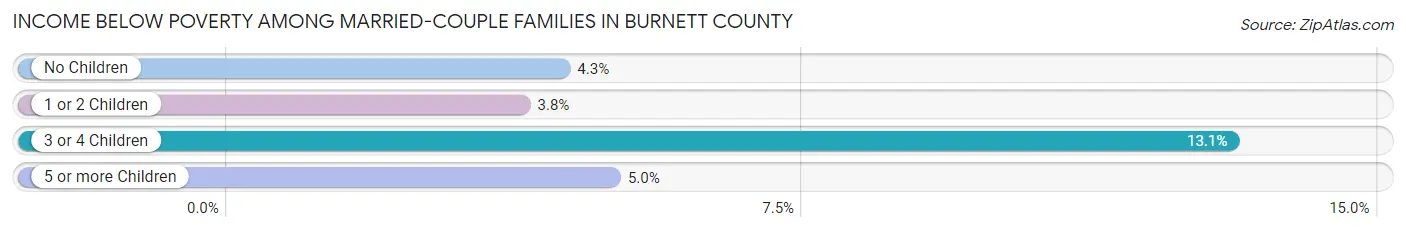
| Children | Above Poverty | Below Poverty |
| No Children | 2,712 (95.7%) | 123 (4.3%) |
| 1 or 2 Children | 554 (96.2%) | 22 (3.8%) |
| 3 or 4 Children | 133 (86.9%) | 20 (13.1%) |
| 5 or more Children | 19 (95.0%) | 1 (5.0%) |
| Total | 3,418 (95.4%) | 166 (4.6%) |
Income Below Poverty Among Single-Parent Households in Burnett County
According to the poverty data in Burnett County, 21.5% or 64 single-father households and 22.8% or 103 single-mother households are living below the poverty line. Among single-father households, those with no children have the highest poverty rate, with 40 households (25.2%) experiencing poverty. Likewise, among single-mother households, those with 3 or 4 children have the highest poverty rate, with 19 households (33.9%) falling below the poverty line.
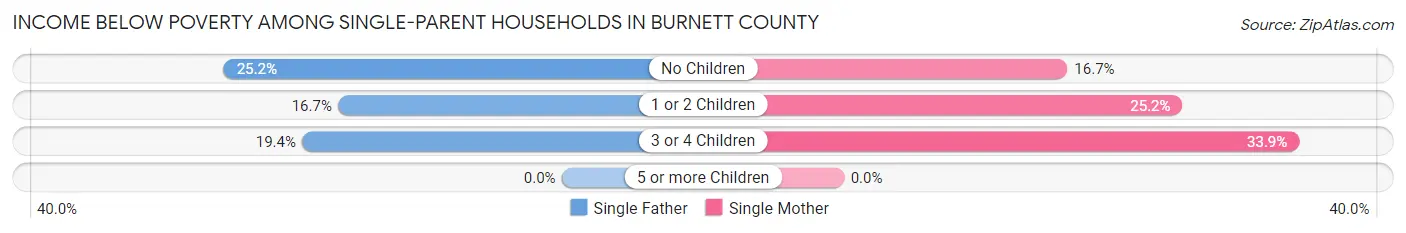
| Children | Single Father | Single Mother |
| No Children | 40 (25.2%) | 30 (16.7%) |
| 1 or 2 Children | 18 (16.7%) | 54 (25.2%) |
| 3 or 4 Children | 6 (19.4%) | 19 (33.9%) |
| 5 or more Children | 0 (0.0%) | 0 (0.0%) |
| Total | 64 (21.5%) | 103 (22.8%) |
Income Below Poverty Among Married-Couple vs Single-Parent Households in Burnett County
The poverty data for Burnett County shows that 166 of the married-couple family households (4.6%) and 167 of the single-parent households (22.3%) are living below the poverty level. Within the married-couple family households, those with 3 or 4 children have the highest poverty rate, with 20 households (13.1%) falling below the poverty line. Among the single-parent households, those with 3 or 4 children have the highest poverty rate, with 25 household (28.7%) living below poverty.
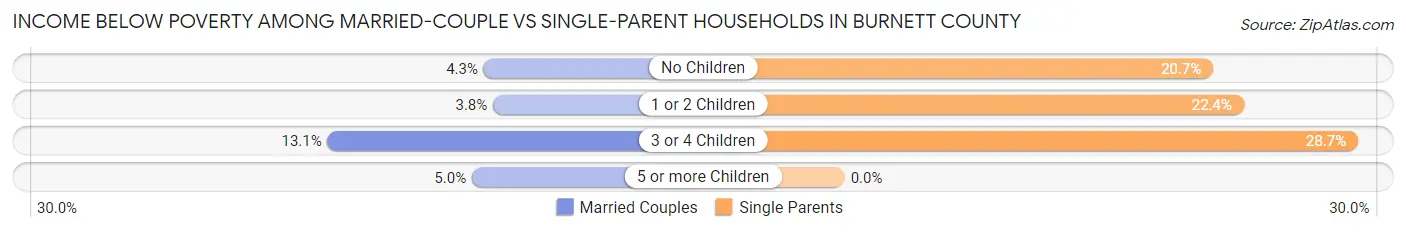
| Children | Married-Couple Families | Single-Parent Households |
| No Children | 123 (4.3%) | 70 (20.6%) |
| 1 or 2 Children | 22 (3.8%) | 72 (22.4%) |
| 3 or 4 Children | 20 (13.1%) | 25 (28.7%) |
| 5 or more Children | 1 (5.0%) | 0 (0.0%) |
| Total | 166 (4.6%) | 167 (22.3%) |
Employment Characteristics in Burnett County
Employment by Class of Employer in Burnett County
Among the 6,800 employed individuals in Burnett County, private company employees (4,222 | 62.1%), not-for-profit organizations (775 | 11.4%), and local government employees (583 | 8.6%) make up the most common classes of employment.
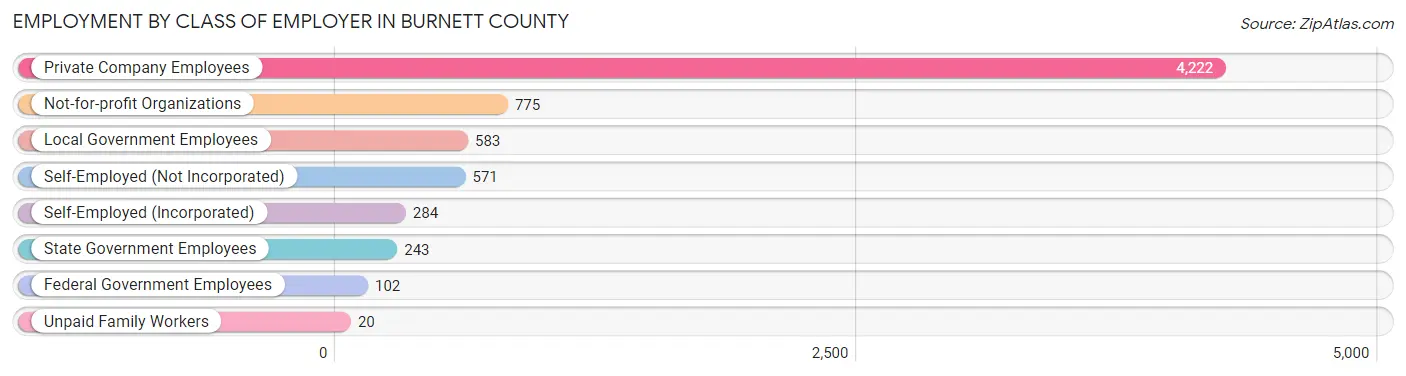
| Employer Class | # Employees | % Employees |
| Private Company Employees | 4,222 | 62.1% |
| Self-Employed (Incorporated) | 284 | 4.2% |
| Self-Employed (Not Incorporated) | 571 | 8.4% |
| Not-for-profit Organizations | 775 | 11.4% |
| Local Government Employees | 583 | 8.6% |
| State Government Employees | 243 | 3.6% |
| Federal Government Employees | 102 | 1.5% |
| Unpaid Family Workers | 20 | 0.3% |
| Total | 6,800 | 100.0% |
Employment Status by Age in Burnett County
According to the labor force statistics for Burnett County, out of the total population over 16 years of age (14,133), 51.1% or 7,222 individuals are in the labor force, with 5.2% or 376 of them unemployed. The age group with the highest labor force participation rate is 25 to 29 years, with 88.8% or 579 individuals in the labor force. Within the labor force, the 16 to 19 years age range has the highest percentage of unemployed individuals, with 16.4% or 52 of them being unemployed.
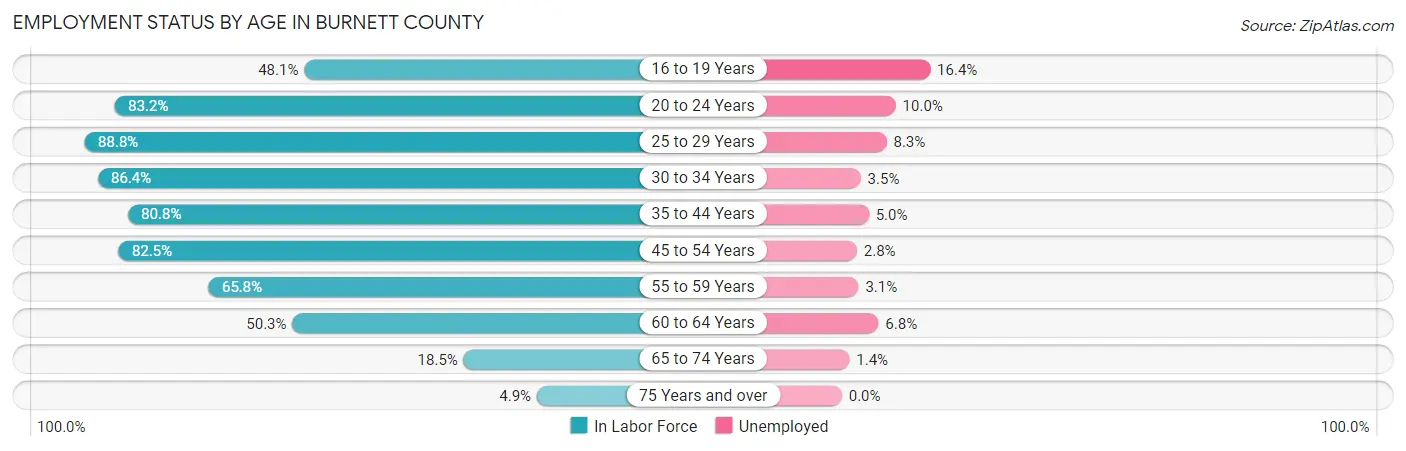
| Age Bracket | In Labor Force | Unemployed |
| 16 to 19 Years | 317 (48.1%) | 52 (16.4%) |
| 20 to 24 Years | 531 (83.2%) | 53 (10.0%) |
| 25 to 29 Years | 579 (88.8%) | 48 (8.3%) |
| 30 to 34 Years | 571 (86.4%) | 20 (3.5%) |
| 35 to 44 Years | 1,254 (80.8%) | 63 (5.0%) |
| 45 to 54 Years | 1,521 (82.5%) | 43 (2.8%) |
| 55 to 59 Years | 923 (65.8%) | 29 (3.1%) |
| 60 to 64 Years | 869 (50.3%) | 59 (6.8%) |
| 65 to 74 Years | 571 (18.5%) | 8 (1.4%) |
| 75 Years and over | 94 (4.9%) | 0 (0.0%) |
| Total | 7,222 (51.1%) | 376 (5.2%) |
Employment Status by Educational Attainment in Burnett County
According to labor force statistics for Burnett County, 72.9% of individuals (5,714) out of the total population between 25 and 64 years of age (7,838) are in the labor force, with 4.6% or 263 of them being unemployed. The group with the highest labor force participation rate are those with the educational attainment of bachelor's degree or higher, with 81.3% or 1,354 individuals in the labor force. Within the labor force, individuals with less than high school education have the highest percentage of unemployment, with 11.2% or 38 of them being unemployed.
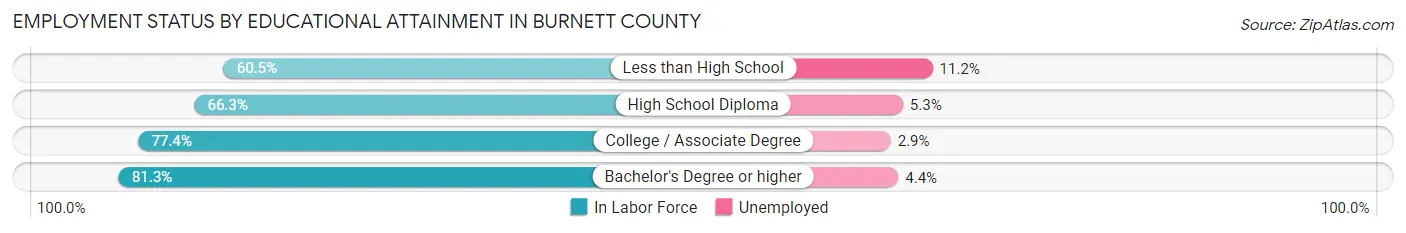
| Educational Attainment | In Labor Force | Unemployed |
| Less than High School | 340 (60.5%) | 63 (11.2%) |
| High School Diploma | 1,907 (66.3%) | 152 (5.3%) |
| College / Associate Degree | 2,116 (77.4%) | 79 (2.9%) |
| Bachelor's Degree or higher | 1,354 (81.3%) | 73 (4.4%) |
| Total | 5,714 (72.9%) | 361 (4.6%) |
Employment Occupations by Sex in Burnett County
Management, Business, Science and Arts Occupations
The most common Management, Business, Science and Arts occupations in Burnett County are Management (840 | 12.3%), Community & Social Service (588 | 8.6%), Education Instruction & Library (372 | 5.4%), Health Diagnosing & Treating (361 | 5.3%), and Business & Financial (277 | 4.0%).
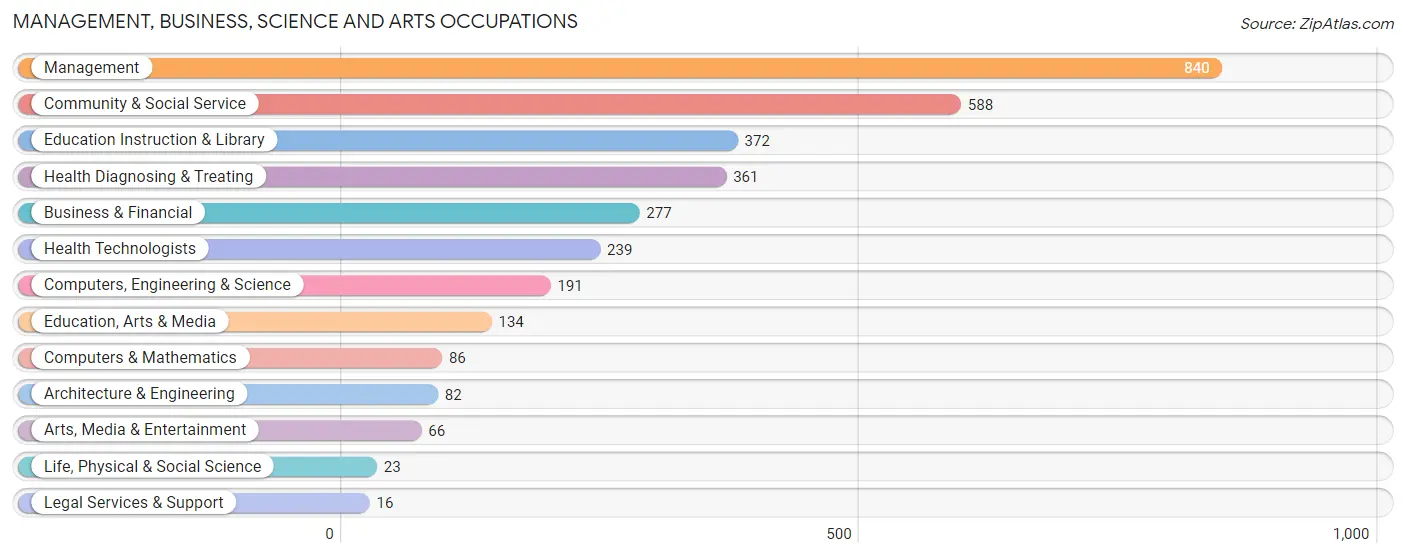
Management, Business, Science and Arts Occupations by Sex
Within the Management, Business, Science and Arts occupations in Burnett County, the most male-oriented occupations are Architecture & Engineering (97.6%), Life, Physical & Social Science (87.0%), and Computers, Engineering & Science (79.6%), while the most female-oriented occupations are Health Diagnosing & Treating (91.7%), Health Technologists (89.1%), and Arts, Media & Entertainment (72.7%).
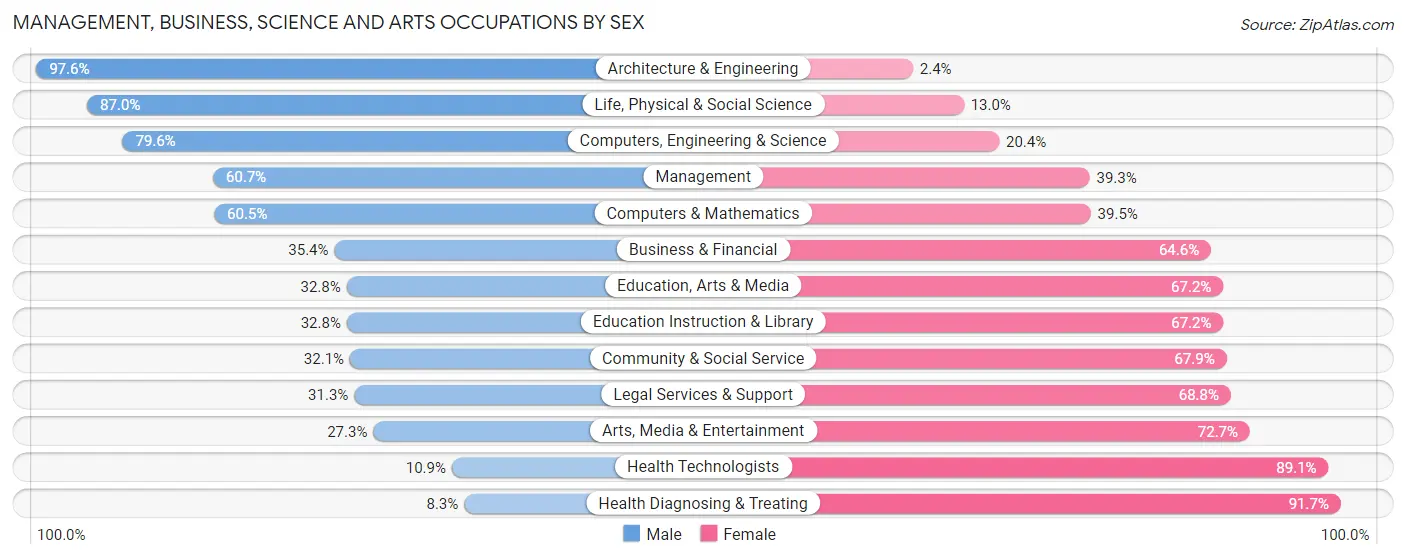
| Occupation | Male | Female |
| Management | 510 (60.7%) | 330 (39.3%) |
| Business & Financial | 98 (35.4%) | 179 (64.6%) |
| Computers, Engineering & Science | 152 (79.6%) | 39 (20.4%) |
| Computers & Mathematics | 52 (60.5%) | 34 (39.5%) |
| Architecture & Engineering | 80 (97.6%) | 2 (2.4%) |
| Life, Physical & Social Science | 20 (87.0%) | 3 (13.0%) |
| Community & Social Service | 189 (32.1%) | 399 (67.9%) |
| Education, Arts & Media | 44 (32.8%) | 90 (67.2%) |
| Legal Services & Support | 5 (31.2%) | 11 (68.8%) |
| Education Instruction & Library | 122 (32.8%) | 250 (67.2%) |
| Arts, Media & Entertainment | 18 (27.3%) | 48 (72.7%) |
| Health Diagnosing & Treating | 30 (8.3%) | 331 (91.7%) |
| Health Technologists | 26 (10.9%) | 213 (89.1%) |
| Total (Category) | 979 (43.4%) | 1,278 (56.6%) |
| Total (Overall) | 3,496 (51.0%) | 3,358 (49.0%) |
Services Occupations
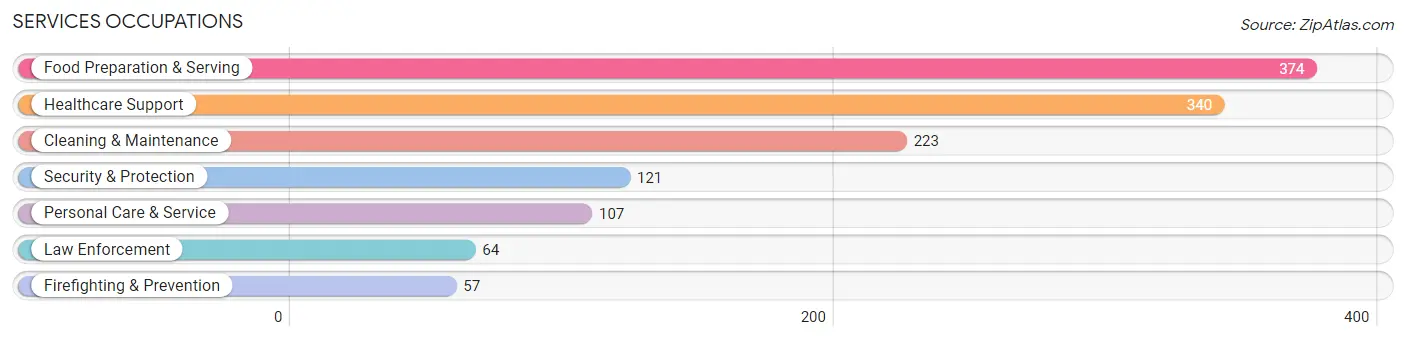
The most common Services occupations in Burnett County are Food Preparation & Serving (374 | 5.5%), Healthcare Support (340 | 5.0%), Cleaning & Maintenance (223 | 3.3%), Security & Protection (121 | 1.8%), and Personal Care & Service (107 | 1.6%).
Services Occupations by Sex
Within the Services occupations in Burnett County, the most male-oriented occupations are Firefighting & Prevention (89.5%), Security & Protection (80.2%), and Cleaning & Maintenance (76.2%), while the most female-oriented occupations are Healthcare Support (85.6%), Personal Care & Service (79.4%), and Food Preparation & Serving (70.3%).
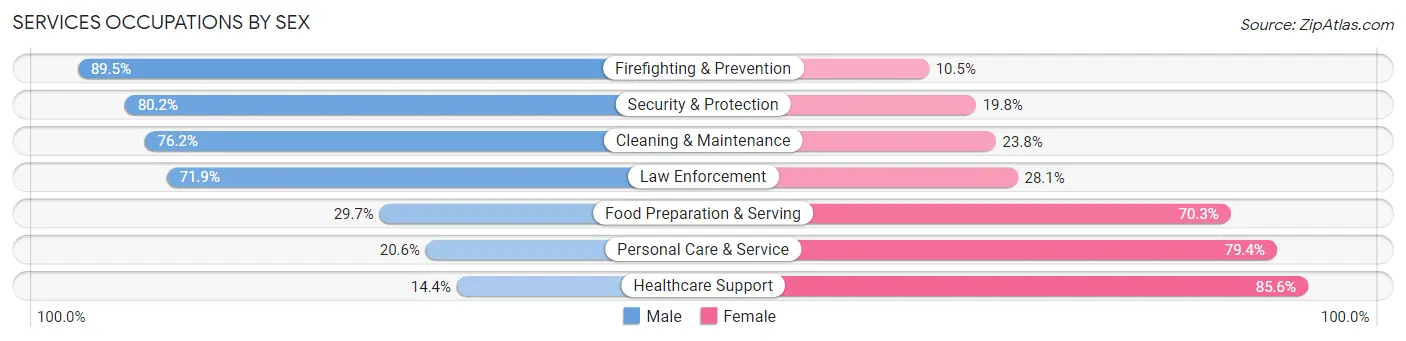
| Occupation | Male | Female |
| Healthcare Support | 49 (14.4%) | 291 (85.6%) |
| Security & Protection | 97 (80.2%) | 24 (19.8%) |
| Firefighting & Prevention | 51 (89.5%) | 6 (10.5%) |
| Law Enforcement | 46 (71.9%) | 18 (28.1%) |
| Food Preparation & Serving | 111 (29.7%) | 263 (70.3%) |
| Cleaning & Maintenance | 170 (76.2%) | 53 (23.8%) |
| Personal Care & Service | 22 (20.6%) | 85 (79.4%) |
| Total (Category) | 449 (38.5%) | 716 (61.5%) |
| Total (Overall) | 3,496 (51.0%) | 3,358 (49.0%) |
Sales and Office Occupations
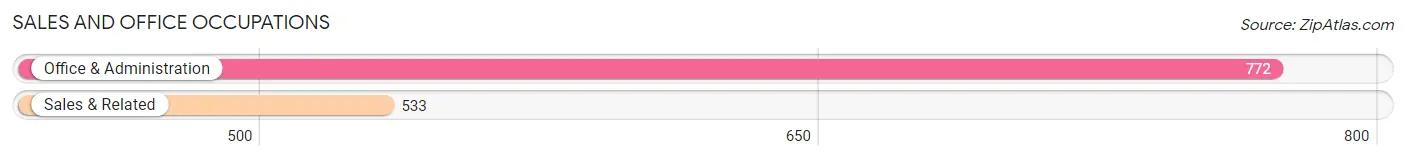
The most common Sales and Office occupations in Burnett County are Office & Administration (772 | 11.3%), and Sales & Related (533 | 7.8%).
Sales and Office Occupations by Sex
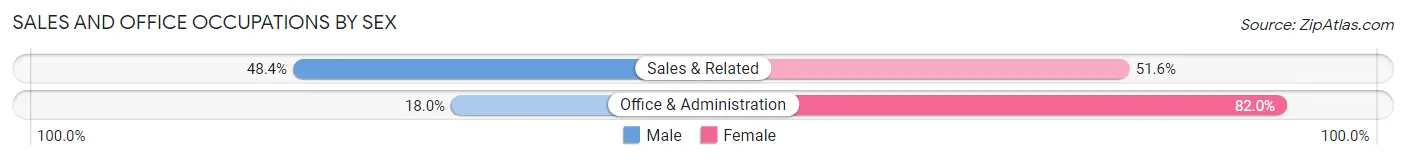
| Occupation | Male | Female |
| Sales & Related | 258 (48.4%) | 275 (51.6%) |
| Office & Administration | 139 (18.0%) | 633 (82.0%) |
| Total (Category) | 397 (30.4%) | 908 (69.6%) |
| Total (Overall) | 3,496 (51.0%) | 3,358 (49.0%) |
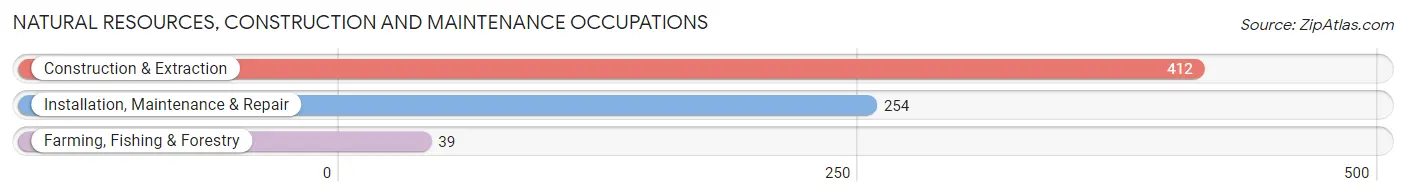
Natural Resources, Construction and Maintenance Occupations
The most common Natural Resources, Construction and Maintenance occupations in Burnett County are Construction & Extraction (412 | 6.0%), Installation, Maintenance & Repair (254 | 3.7%), and Farming, Fishing & Forestry (39 | 0.6%).
Natural Resources, Construction and Maintenance Occupations by Sex
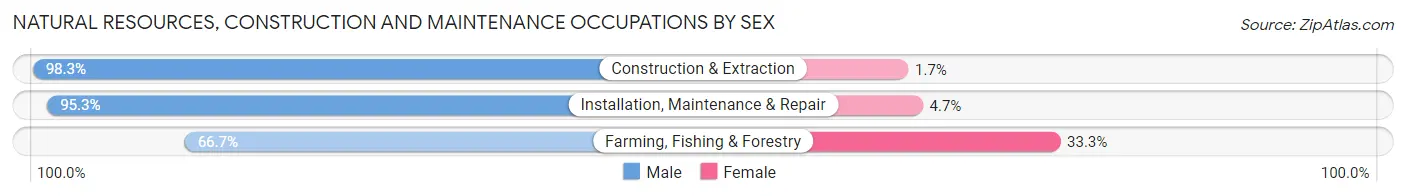
| Occupation | Male | Female |
| Farming, Fishing & Forestry | 26 (66.7%) | 13 (33.3%) |
| Construction & Extraction | 405 (98.3%) | 7 (1.7%) |
| Installation, Maintenance & Repair | 242 (95.3%) | 12 (4.7%) |
| Total (Category) | 673 (95.5%) | 32 (4.5%) |
| Total (Overall) | 3,496 (51.0%) | 3,358 (49.0%) |
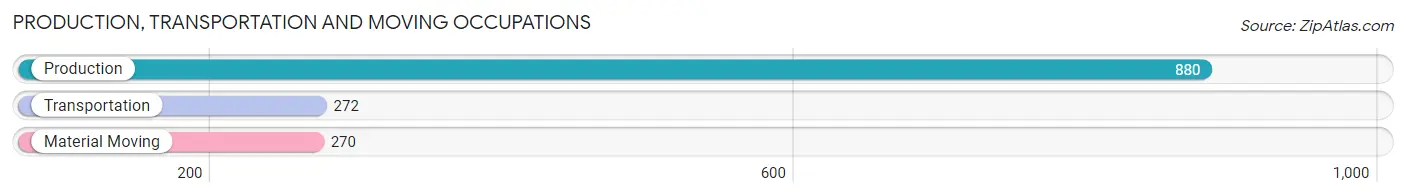
Production, Transportation and Moving Occupations
The most common Production, Transportation and Moving occupations in Burnett County are Production (880 | 12.8%), Transportation (272 | 4.0%), and Material Moving (270 | 3.9%).
Production, Transportation and Moving Occupations by Sex
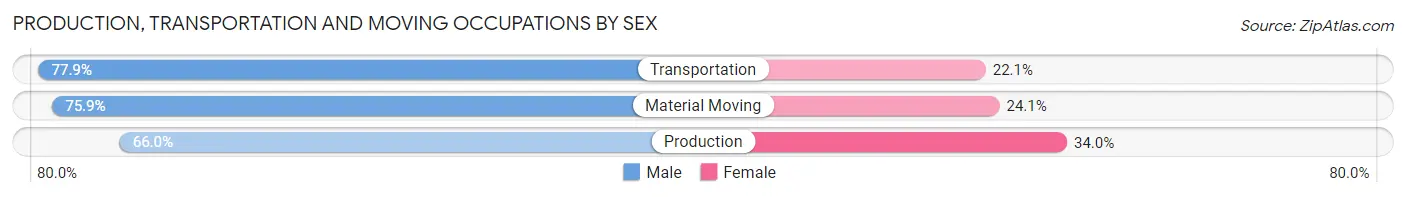
| Occupation | Male | Female |
| Production | 581 (66.0%) | 299 (34.0%) |
| Transportation | 212 (77.9%) | 60 (22.1%) |
| Material Moving | 205 (75.9%) | 65 (24.1%) |
| Total (Category) | 998 (70.2%) | 424 (29.8%) |
| Total (Overall) | 3,496 (51.0%) | 3,358 (49.0%) |
Employment Industries by Sex in Burnett County
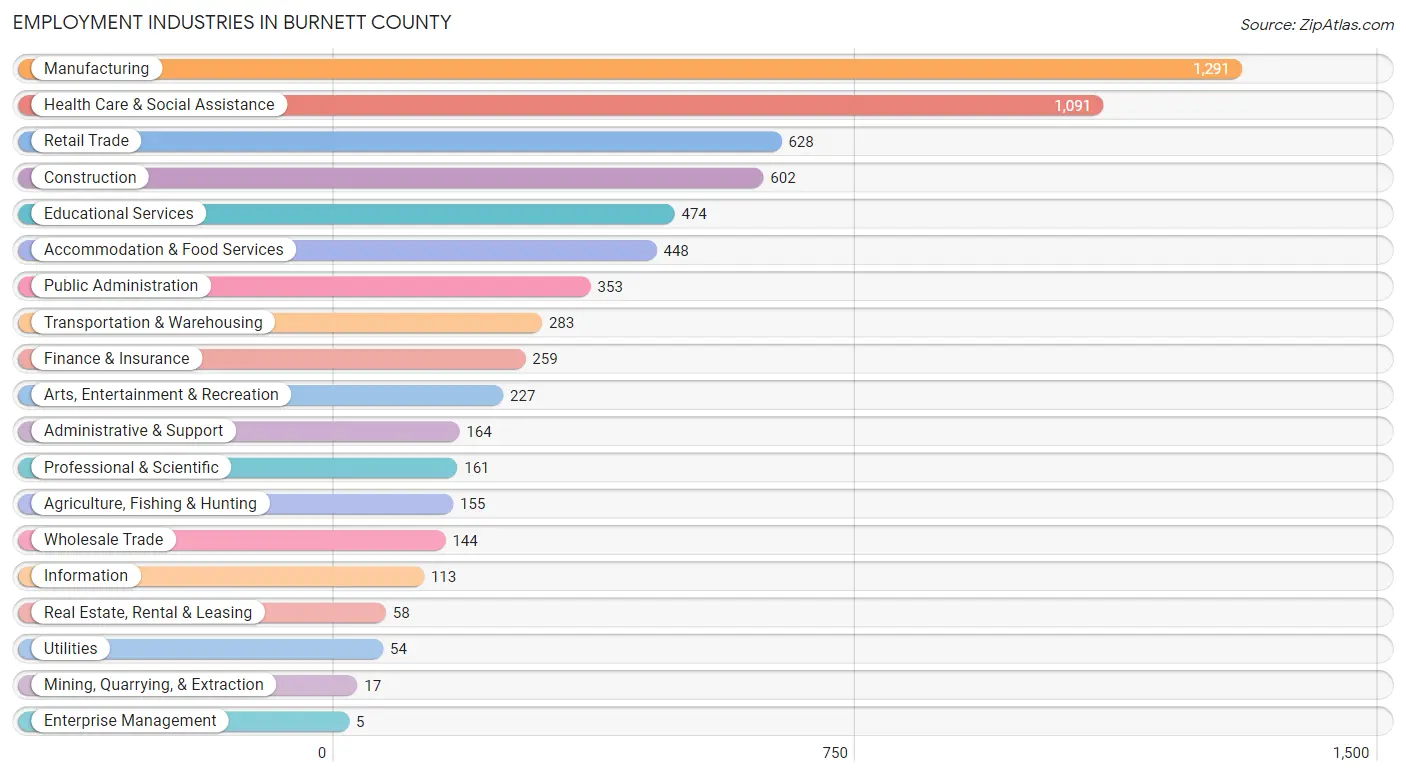
Employment Industries in Burnett County
The major employment industries in Burnett County include Manufacturing (1,291 | 18.8%), Health Care & Social Assistance (1,091 | 15.9%), Retail Trade (628 | 9.2%), Construction (602 | 8.8%), and Educational Services (474 | 6.9%).
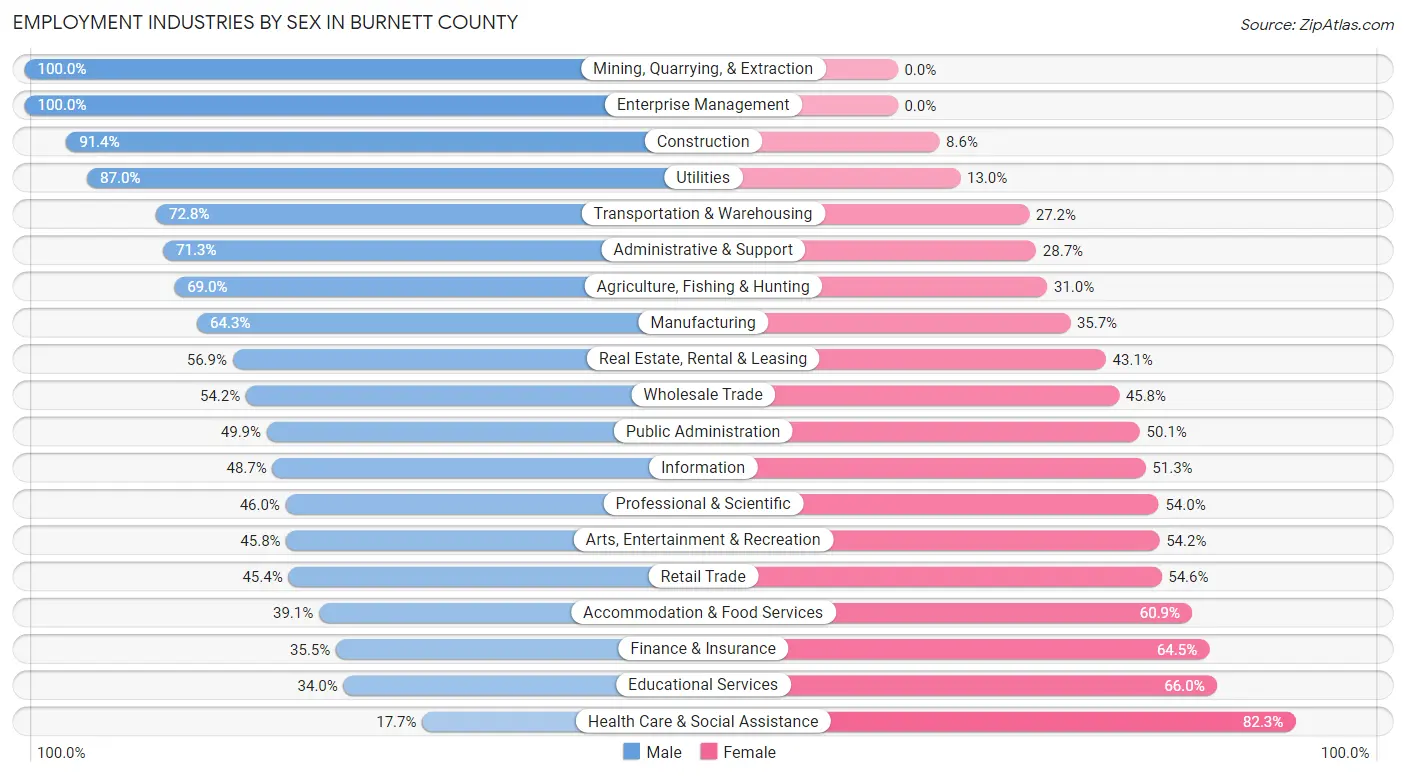
Employment Industries by Sex in Burnett County
The Burnett County industries that see more men than women are Mining, Quarrying, & Extraction (100.0%), Enterprise Management (100.0%), and Construction (91.4%), whereas the industries that tend to have a higher number of women are Health Care & Social Assistance (82.3%), Educational Services (66.0%), and Finance & Insurance (64.5%).
| Industry | Male | Female |
| Agriculture, Fishing & Hunting | 107 (69.0%) | 48 (31.0%) |
| Mining, Quarrying, & Extraction | 17 (100.0%) | 0 (0.0%) |
| Construction | 550 (91.4%) | 52 (8.6%) |
| Manufacturing | 830 (64.3%) | 461 (35.7%) |
| Wholesale Trade | 78 (54.2%) | 66 (45.8%) |
| Retail Trade | 285 (45.4%) | 343 (54.6%) |
| Transportation & Warehousing | 206 (72.8%) | 77 (27.2%) |
| Utilities | 47 (87.0%) | 7 (13.0%) |
| Information | 55 (48.7%) | 58 (51.3%) |
| Finance & Insurance | 92 (35.5%) | 167 (64.5%) |
| Real Estate, Rental & Leasing | 33 (56.9%) | 25 (43.1%) |
| Professional & Scientific | 74 (46.0%) | 87 (54.0%) |
| Enterprise Management | 5 (100.0%) | 0 (0.0%) |
| Administrative & Support | 117 (71.3%) | 47 (28.7%) |
| Educational Services | 161 (34.0%) | 313 (66.0%) |
| Health Care & Social Assistance | 193 (17.7%) | 898 (82.3%) |
| Arts, Entertainment & Recreation | 104 (45.8%) | 123 (54.2%) |
| Accommodation & Food Services | 175 (39.1%) | 273 (60.9%) |
| Public Administration | 176 (49.9%) | 177 (50.1%) |
| Total | 3,496 (51.0%) | 3,358 (49.0%) |
Education in Burnett County
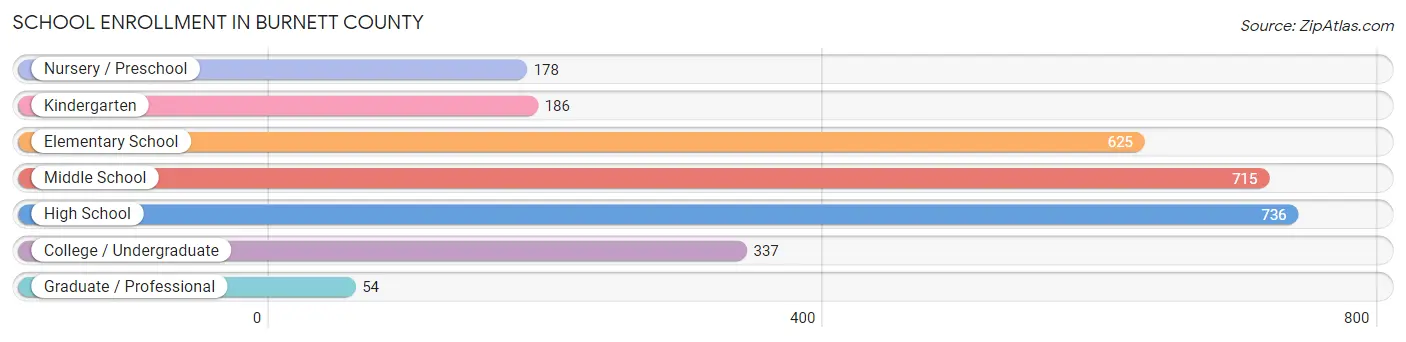
School Enrollment in Burnett County
The most common levels of schooling among the 2,831 students in Burnett County are high school (736 | 26.0%), middle school (715 | 25.3%), and elementary school (625 | 22.1%).
| School Level | # Students | % Students |
| Nursery / Preschool | 178 | 6.3% |
| Kindergarten | 186 | 6.6% |
| Elementary School | 625 | 22.1% |
| Middle School | 715 | 25.3% |
| High School | 736 | 26.0% |
| College / Undergraduate | 337 | 11.9% |
| Graduate / Professional | 54 | 1.9% |
| Total | 2,831 | 100.0% |
School Enrollment by Age by Funding Source in Burnett County
Out of a total of 2,831 students who are enrolled in schools in Burnett County, 272 (9.6%) attend a private institution, while the remaining 2,559 (90.4%) are enrolled in public schools. The age group of 3 to 4 year olds has the highest likelihood of being enrolled in private schools, with 39 (29.8% in the age bracket) enrolled. Conversely, the age group of 18 to 19 year olds has the lowest likelihood of being enrolled in a private school, with 239 (98.0% in the age bracket) attending a public institution.
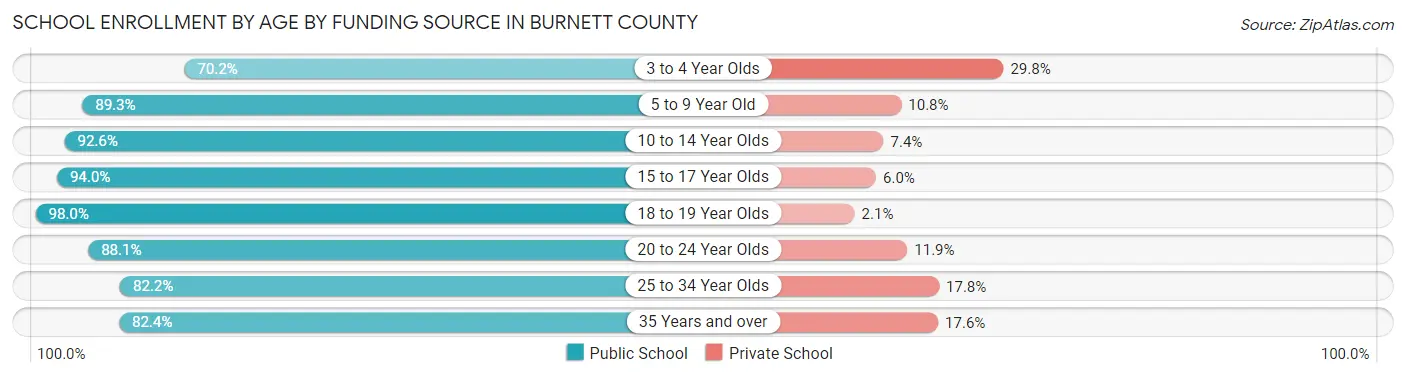
| Age Bracket | Public School | Private School |
| 3 to 4 Year Olds | 92 (70.2%) | 39 (29.8%) |
| 5 to 9 Year Old | 681 (89.2%) | 82 (10.7%) |
| 10 to 14 Year Olds | 784 (92.6%) | 63 (7.4%) |
| 15 to 17 Year Olds | 482 (94.0%) | 31 (6.0%) |
| 18 to 19 Year Olds | 239 (98.0%) | 5 (2.1%) |
| 20 to 24 Year Olds | 104 (88.1%) | 14 (11.9%) |
| 25 to 34 Year Olds | 74 (82.2%) | 16 (17.8%) |
| 35 Years and over | 103 (82.4%) | 22 (17.6%) |
| Total | 2,559 (90.4%) | 272 (9.6%) |
Educational Attainment by Field of Study in Burnett County
Education (595 | 19.0%), business (533 | 17.1%), science & technology (274 | 8.8%), bio, nature & agricultural (249 | 8.0%), and social sciences (247 | 7.9%) are the most common fields of study among 3,126 individuals in Burnett County who have obtained a bachelor's degree or higher.
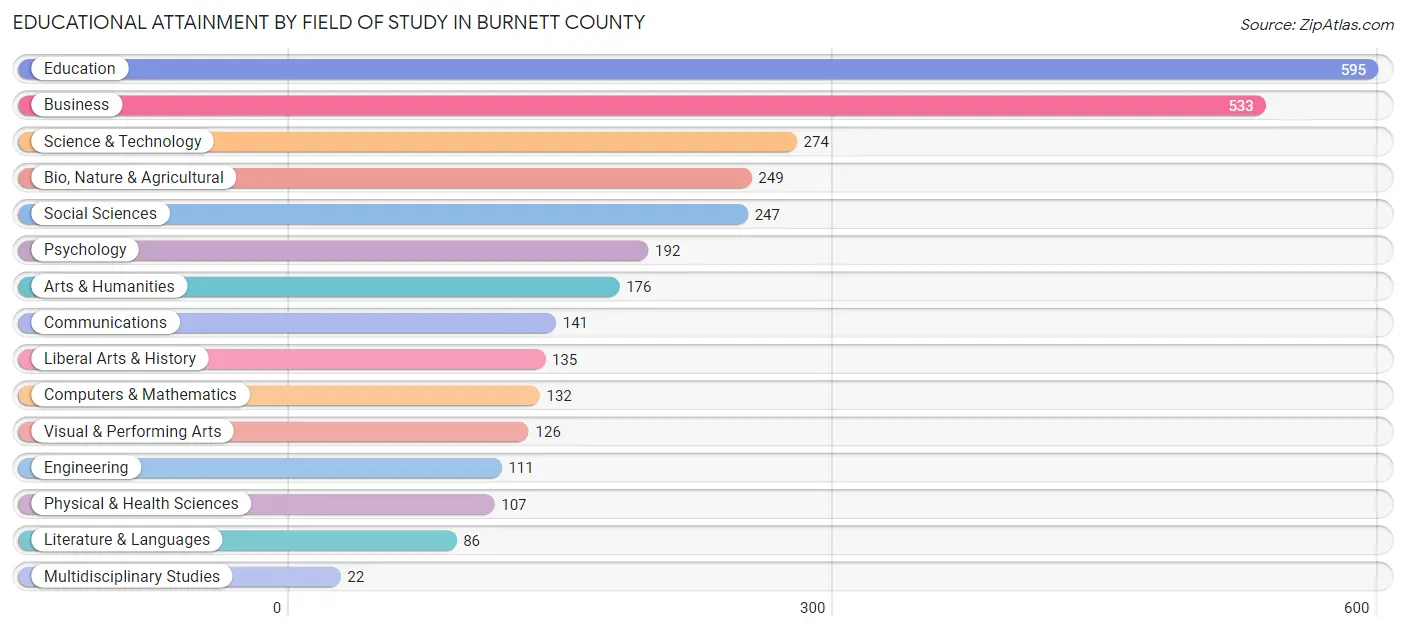
| Field of Study | # Graduates | % Graduates |
| Computers & Mathematics | 132 | 4.2% |
| Bio, Nature & Agricultural | 249 | 8.0% |
| Physical & Health Sciences | 107 | 3.4% |
| Psychology | 192 | 6.1% |
| Social Sciences | 247 | 7.9% |
| Engineering | 111 | 3.5% |
| Multidisciplinary Studies | 22 | 0.7% |
| Science & Technology | 274 | 8.8% |
| Business | 533 | 17.1% |
| Education | 595 | 19.0% |
| Literature & Languages | 86 | 2.8% |
| Liberal Arts & History | 135 | 4.3% |
| Visual & Performing Arts | 126 | 4.0% |
| Communications | 141 | 4.5% |
| Arts & Humanities | 176 | 5.6% |
| Total | 3,126 | 100.0% |
Transportation & Commute in Burnett County
Vehicle Availability by Sex in Burnett County
The most prevalent vehicle ownership categories in Burnett County are males with 2 vehicles (1,184, accounting for 34.1%) and females with 2 vehicles (1,156, making up 35.7%).
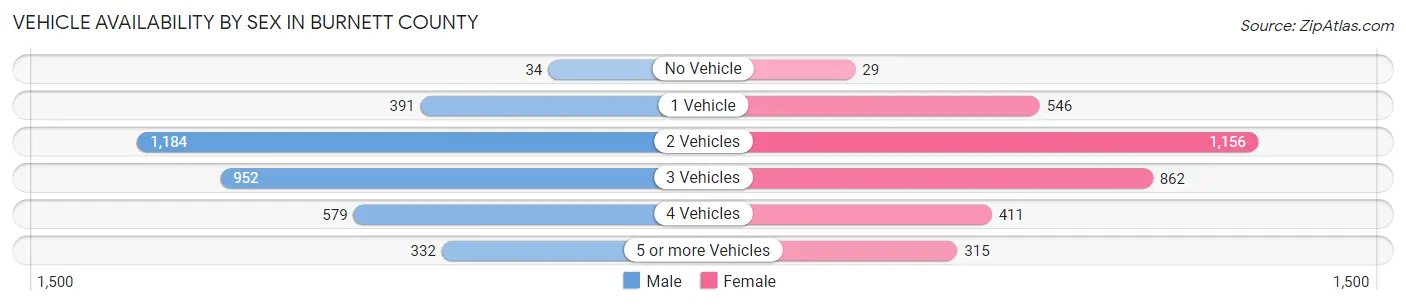
| Vehicles Available | Male | Female |
| No Vehicle | 34 (1.0%) | 29 (0.9%) |
| 1 Vehicle | 391 (11.3%) | 546 (16.5%) |
| 2 Vehicles | 1,184 (34.1%) | 1,156 (34.8%) |
| 3 Vehicles | 952 (27.4%) | 862 (26.0%) |
| 4 Vehicles | 579 (16.7%) | 411 (12.4%) |
| 5 or more Vehicles | 332 (9.6%) | 315 (9.5%) |
| Total | 3,472 (100.0%) | 3,319 (100.0%) |
Commute Time in Burnett County
The most frequently occuring commute durations in Burnett County are 10 to 14 minutes (948 commuters, 15.3%), 5 to 9 minutes (907 commuters, 14.7%), and 15 to 19 minutes (705 commuters, 11.4%).
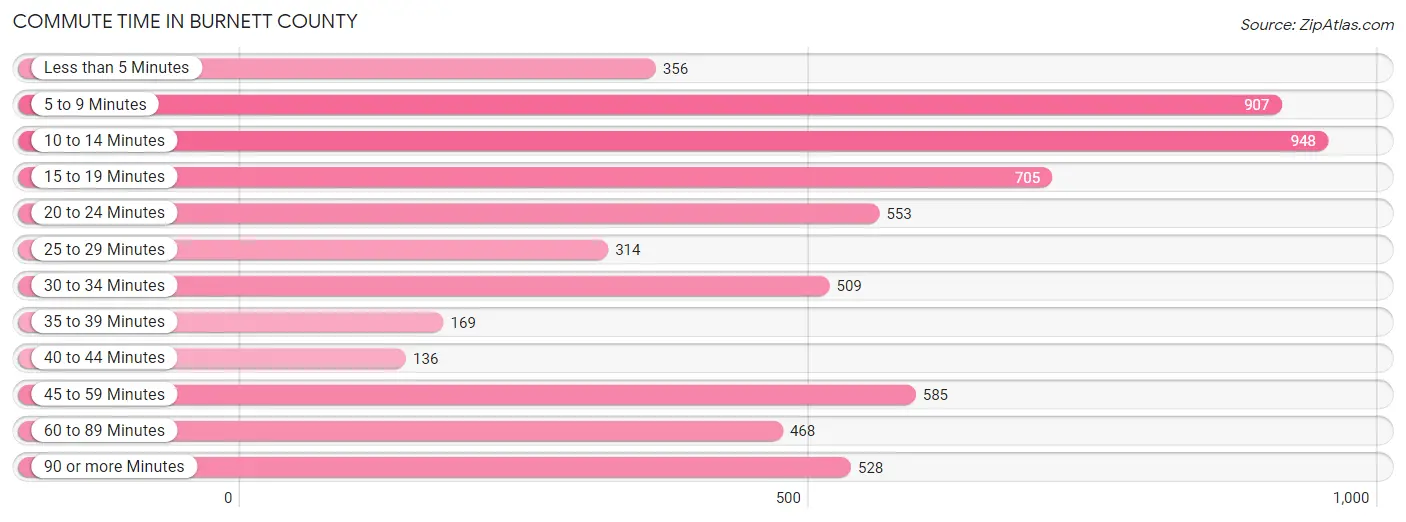
| Commute Time | # Commuters | % Commuters |
| Less than 5 Minutes | 356 | 5.8% |
| 5 to 9 Minutes | 907 | 14.7% |
| 10 to 14 Minutes | 948 | 15.3% |
| 15 to 19 Minutes | 705 | 11.4% |
| 20 to 24 Minutes | 553 | 8.9% |
| 25 to 29 Minutes | 314 | 5.1% |
| 30 to 34 Minutes | 509 | 8.2% |
| 35 to 39 Minutes | 169 | 2.7% |
| 40 to 44 Minutes | 136 | 2.2% |
| 45 to 59 Minutes | 585 | 9.5% |
| 60 to 89 Minutes | 468 | 7.6% |
| 90 or more Minutes | 528 | 8.6% |
Commute Time by Sex in Burnett County
The most common commute times in Burnett County are 10 to 14 minutes (473 commuters, 15.0%) for males and 10 to 14 minutes (475 commuters, 15.7%) for females.
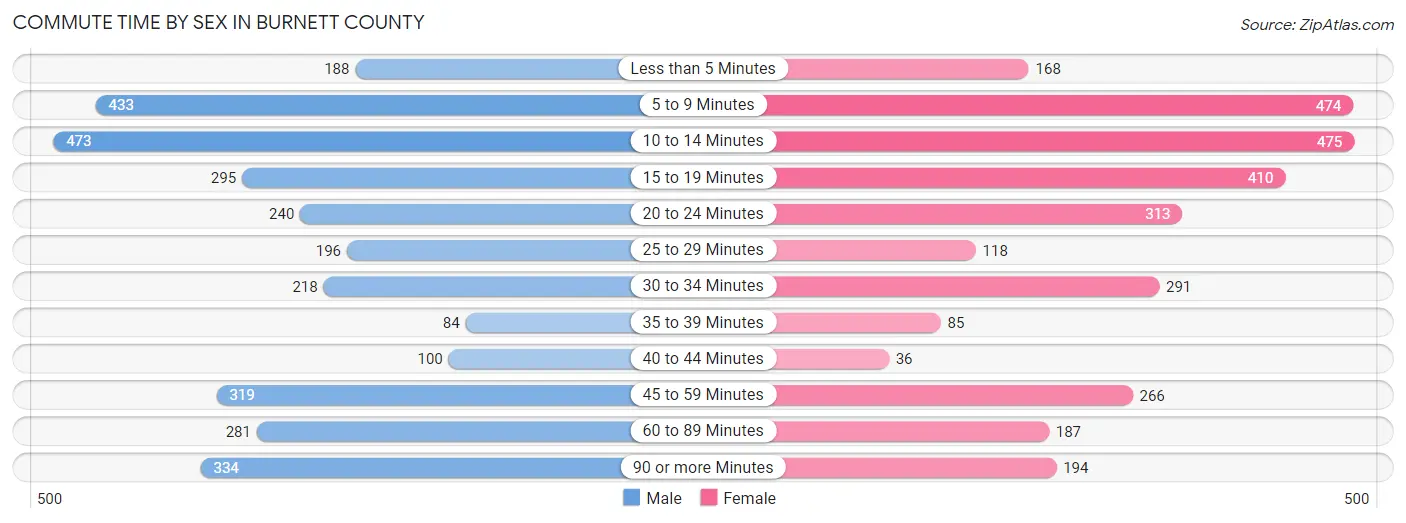
| Commute Time | Male | Female |
| Less than 5 Minutes | 188 (5.9%) | 168 (5.6%) |
| 5 to 9 Minutes | 433 (13.7%) | 474 (15.7%) |
| 10 to 14 Minutes | 473 (15.0%) | 475 (15.7%) |
| 15 to 19 Minutes | 295 (9.3%) | 410 (13.6%) |
| 20 to 24 Minutes | 240 (7.6%) | 313 (10.4%) |
| 25 to 29 Minutes | 196 (6.2%) | 118 (3.9%) |
| 30 to 34 Minutes | 218 (6.9%) | 291 (9.7%) |
| 35 to 39 Minutes | 84 (2.7%) | 85 (2.8%) |
| 40 to 44 Minutes | 100 (3.2%) | 36 (1.2%) |
| 45 to 59 Minutes | 319 (10.1%) | 266 (8.8%) |
| 60 to 89 Minutes | 281 (8.9%) | 187 (6.2%) |
| 90 or more Minutes | 334 (10.6%) | 194 (6.4%) |
Time of Departure to Work by Sex in Burnett County
The most frequent times of departure to work in Burnett County are 7:00 AM to 7:29 AM (429, 13.6%) for males and 7:30 AM to 7:59 AM (575, 19.1%) for females.
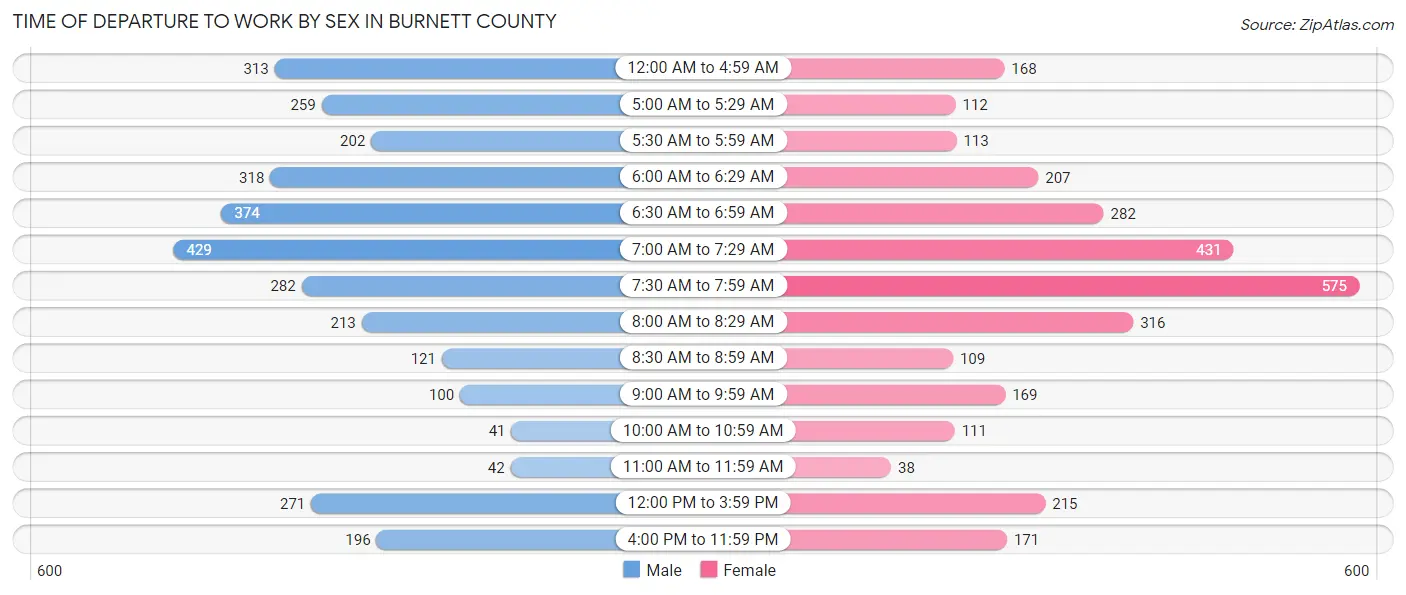
| Time of Departure | Male | Female |
| 12:00 AM to 4:59 AM | 313 (9.9%) | 168 (5.6%) |
| 5:00 AM to 5:29 AM | 259 (8.2%) | 112 (3.7%) |
| 5:30 AM to 5:59 AM | 202 (6.4%) | 113 (3.7%) |
| 6:00 AM to 6:29 AM | 318 (10.1%) | 207 (6.9%) |
| 6:30 AM to 6:59 AM | 374 (11.8%) | 282 (9.3%) |
| 7:00 AM to 7:29 AM | 429 (13.6%) | 431 (14.3%) |
| 7:30 AM to 7:59 AM | 282 (8.9%) | 575 (19.1%) |
| 8:00 AM to 8:29 AM | 213 (6.7%) | 316 (10.5%) |
| 8:30 AM to 8:59 AM | 121 (3.8%) | 109 (3.6%) |
| 9:00 AM to 9:59 AM | 100 (3.2%) | 169 (5.6%) |
| 10:00 AM to 10:59 AM | 41 (1.3%) | 111 (3.7%) |
| 11:00 AM to 11:59 AM | 42 (1.3%) | 38 (1.3%) |
| 12:00 PM to 3:59 PM | 271 (8.6%) | 215 (7.1%) |
| 4:00 PM to 11:59 PM | 196 (6.2%) | 171 (5.7%) |
| Total | 3,161 (100.0%) | 3,017 (100.0%) |
Housing Occupancy in Burnett County
Occupancy by Ownership in Burnett County
Of the total 6,989 dwellings in Burnett County, owner-occupied units account for 5,918 (84.7%), while renter-occupied units make up 1,071 (15.3%).
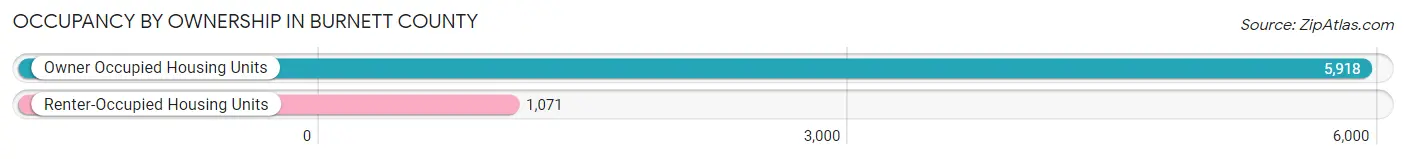
| Occupancy | # Housing Units | % Housing Units |
| Owner Occupied Housing Units | 5,918 | 84.7% |
| Renter-Occupied Housing Units | 1,071 | 15.3% |
| Total Occupied Housing Units | 6,989 | 100.0% |
Occupancy by Household Size in Burnett County
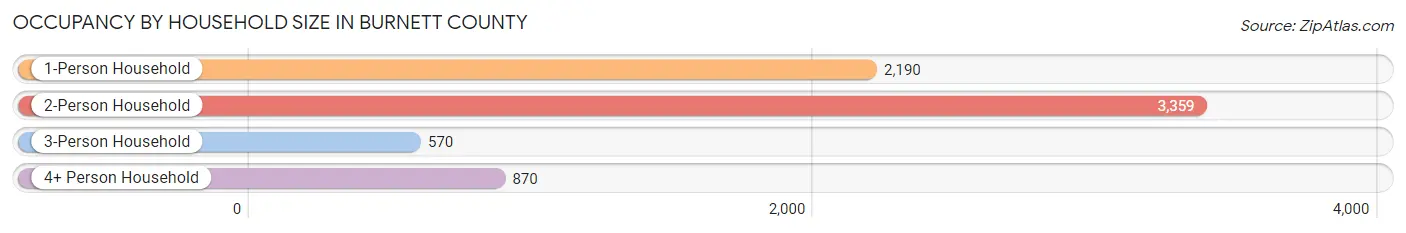
| Household Size | # Housing Units | % Housing Units |
| 1-Person Household | 2,190 | 31.3% |
| 2-Person Household | 3,359 | 48.1% |
| 3-Person Household | 570 | 8.2% |
| 4+ Person Household | 870 | 12.4% |
| Total Housing Units | 6,989 | 100.0% |
Occupancy by Ownership by Household Size in Burnett County
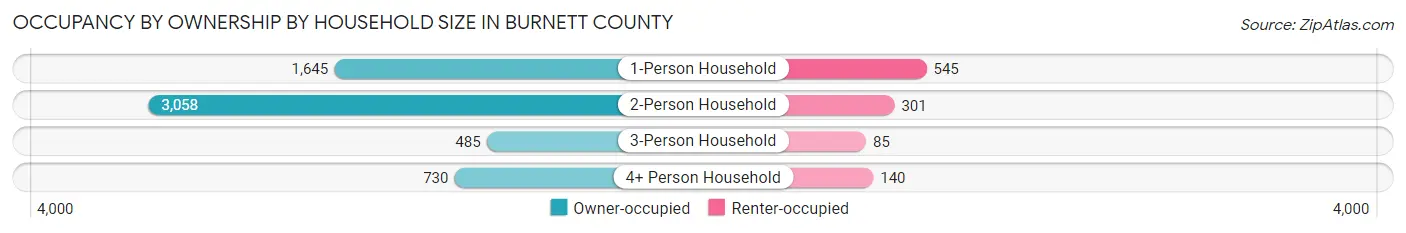
| Household Size | Owner-occupied | Renter-occupied |
| 1-Person Household | 1,645 (75.1%) | 545 (24.9%) |
| 2-Person Household | 3,058 (91.0%) | 301 (9.0%) |
| 3-Person Household | 485 (85.1%) | 85 (14.9%) |
| 4+ Person Household | 730 (83.9%) | 140 (16.1%) |
| Total Housing Units | 5,918 (84.7%) | 1,071 (15.3%) |
Occupancy by Educational Attainment in Burnett County
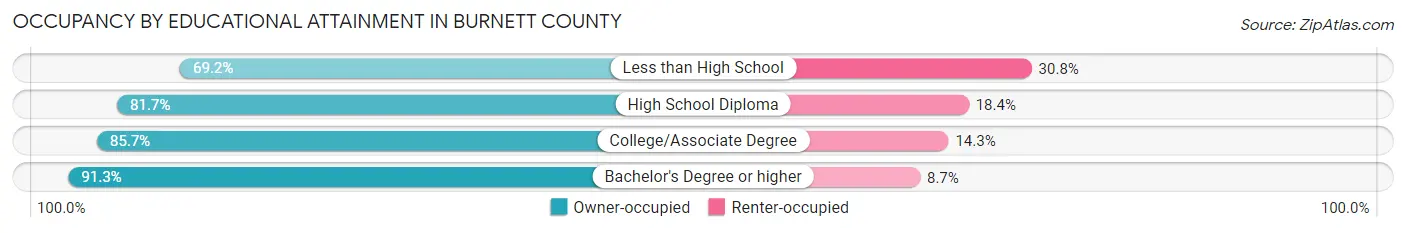
| Household Size | Owner-occupied | Renter-occupied |
| Less than High School | 267 (69.2%) | 119 (30.8%) |
| High School Diploma | 2,025 (81.7%) | 455 (18.3%) |
| College/Associate Degree | 2,102 (85.7%) | 352 (14.3%) |
| Bachelor's Degree or higher | 1,524 (91.3%) | 145 (8.7%) |
Occupancy by Age of Householder in Burnett County
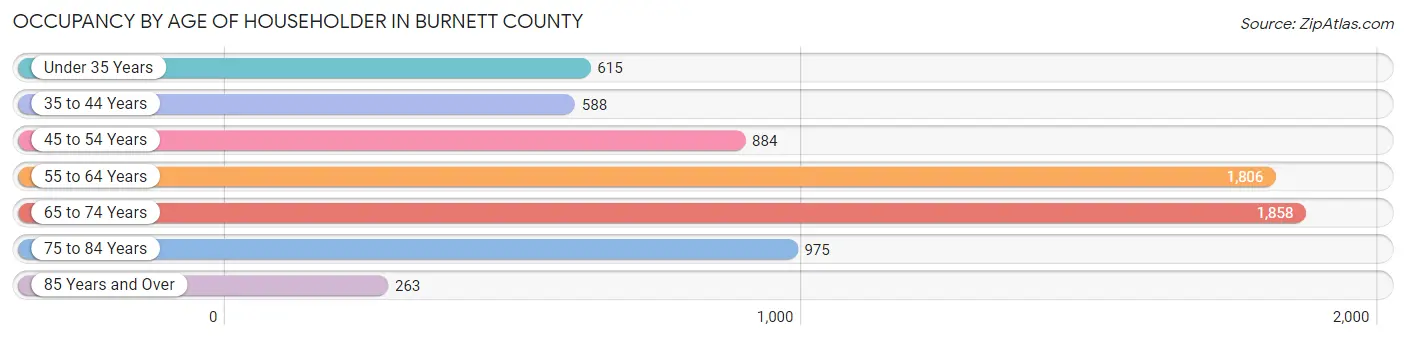
| Age Bracket | # Households | % Households |
| Under 35 Years | 615 | 8.8% |
| 35 to 44 Years | 588 | 8.4% |
| 45 to 54 Years | 884 | 12.7% |
| 55 to 64 Years | 1,806 | 25.8% |
| 65 to 74 Years | 1,858 | 26.6% |
| 75 to 84 Years | 975 | 14.0% |
| 85 Years and Over | 263 | 3.8% |
| Total | 6,989 | 100.0% |
Housing Finances in Burnett County
Median Income by Occupancy in Burnett County
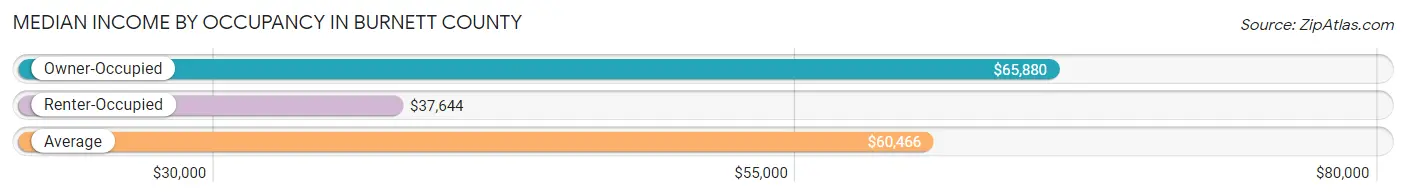
| Occupancy Type | # Households | Median Income |
| Owner-Occupied | 5,918 (84.7%) | $65,880 |
| Renter-Occupied | 1,071 (15.3%) | $37,644 |
| Average | 6,989 (100.0%) | $60,466 |
Occupancy by Householder Income Bracket in Burnett County
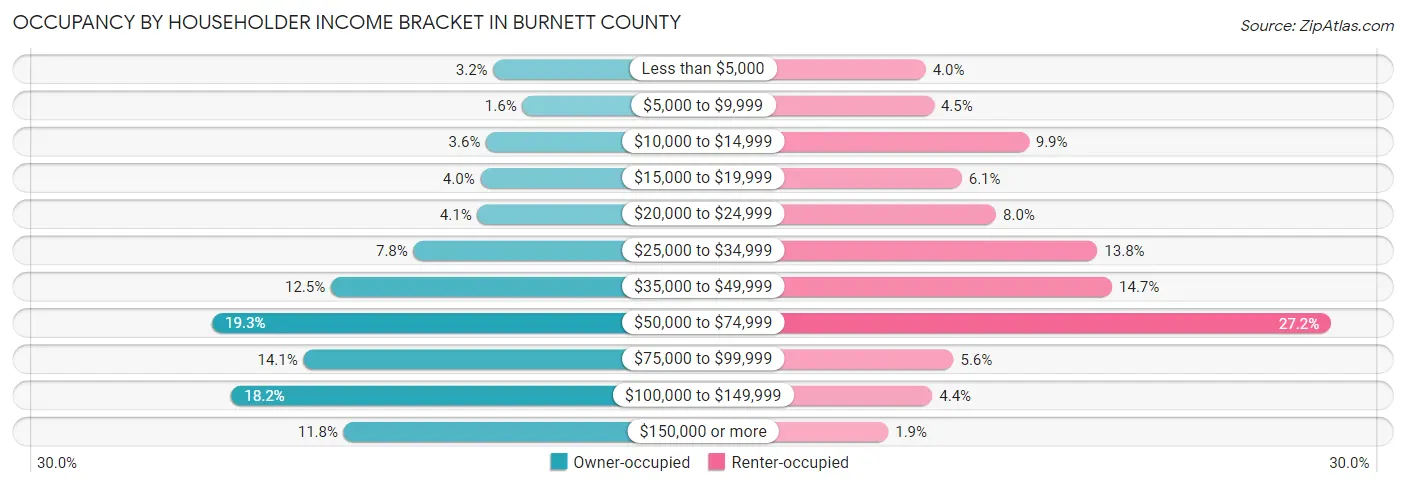
| Income Bracket | Owner-occupied | Renter-occupied |
| Less than $5,000 | 190 (3.2%) | 43 (4.0%) |
| $5,000 to $9,999 | 92 (1.5%) | 48 (4.5%) |
| $10,000 to $14,999 | 214 (3.6%) | 106 (9.9%) |
| $15,000 to $19,999 | 234 (4.0%) | 65 (6.1%) |
| $20,000 to $24,999 | 244 (4.1%) | 86 (8.0%) |
| $25,000 to $34,999 | 460 (7.8%) | 148 (13.8%) |
| $35,000 to $49,999 | 739 (12.5%) | 157 (14.7%) |
| $50,000 to $74,999 | 1,141 (19.3%) | 291 (27.2%) |
| $75,000 to $99,999 | 832 (14.1%) | 60 (5.6%) |
| $100,000 to $149,999 | 1,076 (18.2%) | 47 (4.4%) |
| $150,000 or more | 696 (11.8%) | 20 (1.9%) |
| Total | 5,918 (100.0%) | 1,071 (100.0%) |
Monthly Housing Cost Tiers in Burnett County
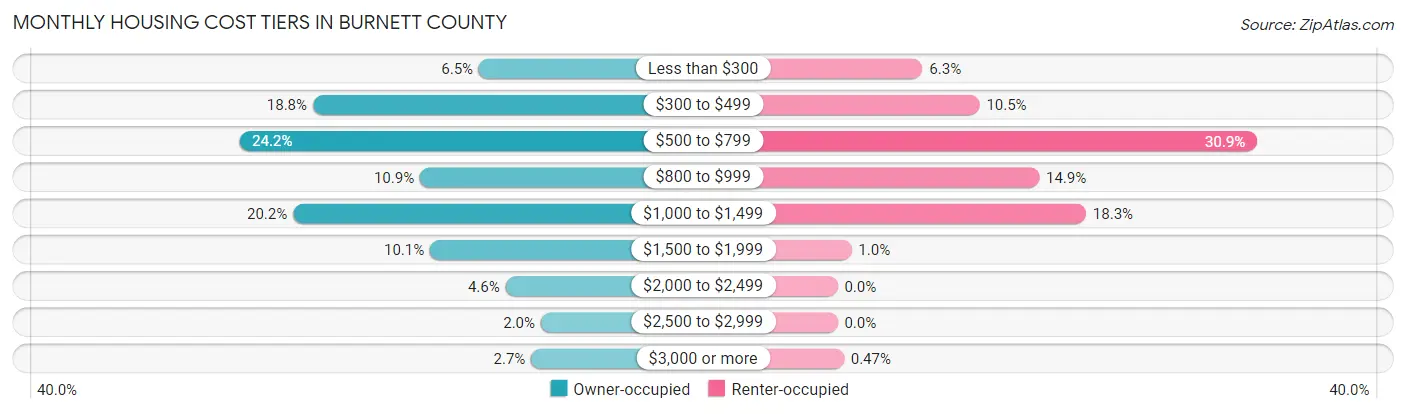
| Monthly Cost | Owner-occupied | Renter-occupied |
| Less than $300 | 387 (6.5%) | 67 (6.3%) |
| $300 to $499 | 1,111 (18.8%) | 112 (10.5%) |
| $500 to $799 | 1,432 (24.2%) | 331 (30.9%) |
| $800 to $999 | 644 (10.9%) | 159 (14.8%) |
| $1,000 to $1,499 | 1,197 (20.2%) | 196 (18.3%) |
| $1,500 to $1,999 | 600 (10.1%) | 11 (1.0%) |
| $2,000 to $2,499 | 271 (4.6%) | 0 (0.0%) |
| $2,500 to $2,999 | 117 (2.0%) | 0 (0.0%) |
| $3,000 or more | 159 (2.7%) | 5 (0.5%) |
| Total | 5,918 (100.0%) | 1,071 (100.0%) |
Physical Housing Characteristics in Burnett County
Housing Structures in Burnett County

| Structure Type | # Housing Units | % Housing Units |
| Single Unit, Detached | 5,961 | 85.3% |
| Single Unit, Attached | 65 | 0.9% |
| 2 Unit Apartments | 130 | 1.9% |
| 3 or 4 Unit Apartments | 45 | 0.6% |
| 5 to 9 Unit Apartments | 61 | 0.9% |
| 10 or more Apartments | 164 | 2.4% |
| Mobile Home / Other | 563 | 8.1% |
| Total | 6,989 | 100.0% |
Housing Structures by Occupancy in Burnett County
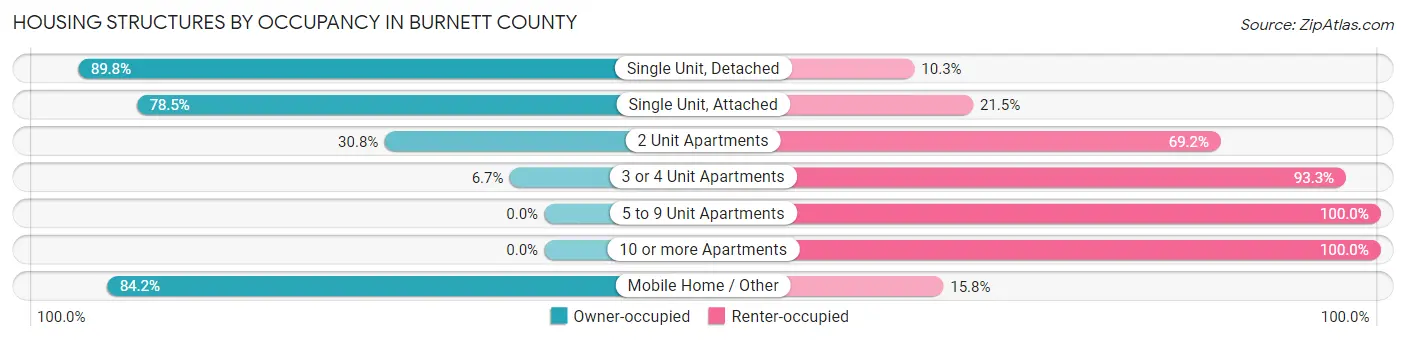
| Structure Type | Owner-occupied | Renter-occupied |
| Single Unit, Detached | 5,350 (89.7%) | 611 (10.2%) |
| Single Unit, Attached | 51 (78.5%) | 14 (21.5%) |
| 2 Unit Apartments | 40 (30.8%) | 90 (69.2%) |
| 3 or 4 Unit Apartments | 3 (6.7%) | 42 (93.3%) |
| 5 to 9 Unit Apartments | 0 (0.0%) | 61 (100.0%) |
| 10 or more Apartments | 0 (0.0%) | 164 (100.0%) |
| Mobile Home / Other | 474 (84.2%) | 89 (15.8%) |
| Total | 5,918 (84.7%) | 1,071 (15.3%) |
Housing Structures by Number of Rooms in Burnett County
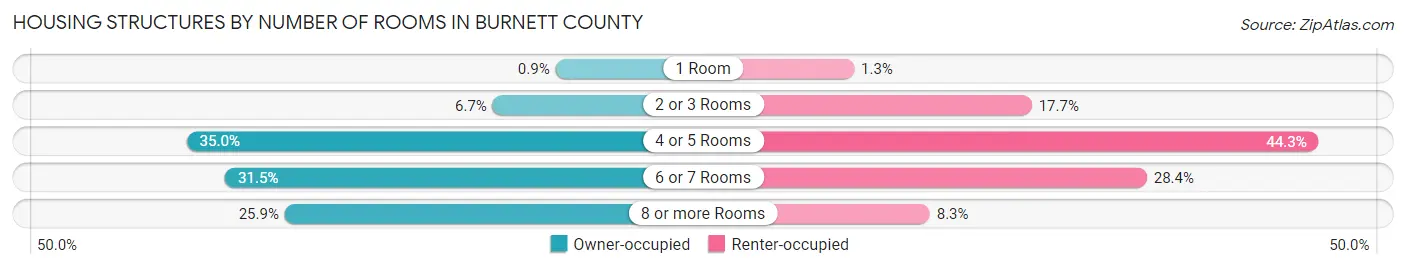
| Number of Rooms | Owner-occupied | Renter-occupied |
| 1 Room | 53 (0.9%) | 14 (1.3%) |
| 2 or 3 Rooms | 397 (6.7%) | 190 (17.7%) |
| 4 or 5 Rooms | 2,072 (35.0%) | 474 (44.3%) |
| 6 or 7 Rooms | 1,861 (31.5%) | 304 (28.4%) |
| 8 or more Rooms | 1,535 (25.9%) | 89 (8.3%) |
| Total | 5,918 (100.0%) | 1,071 (100.0%) |
Housing Structure by Heating Type in Burnett County
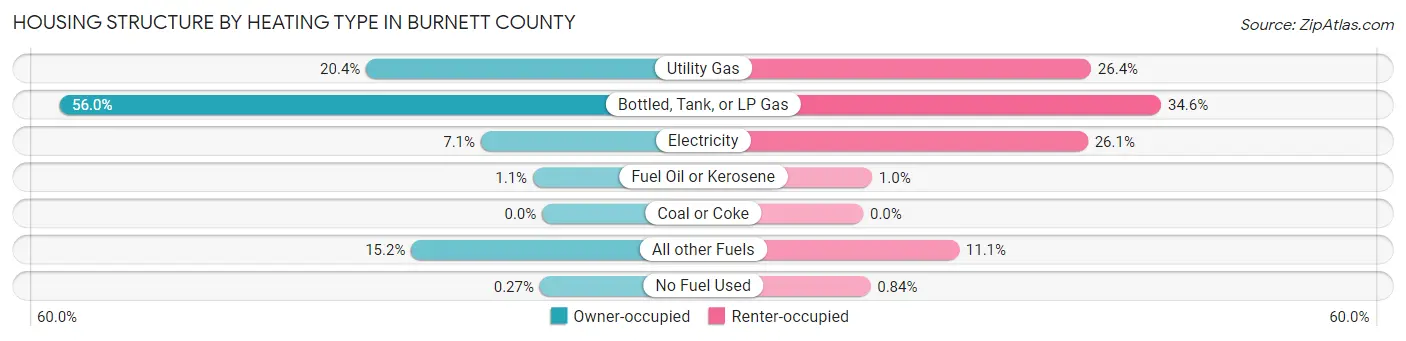
| Heating Type | Owner-occupied | Renter-occupied |
| Utility Gas | 1,207 (20.4%) | 283 (26.4%) |
| Bottled, Tank, or LP Gas | 3,314 (56.0%) | 370 (34.5%) |
| Electricity | 420 (7.1%) | 279 (26.1%) |
| Fuel Oil or Kerosene | 63 (1.1%) | 11 (1.0%) |
| Coal or Coke | 0 (0.0%) | 0 (0.0%) |
| All other Fuels | 898 (15.2%) | 119 (11.1%) |
| No Fuel Used | 16 (0.3%) | 9 (0.8%) |
| Total | 5,918 (100.0%) | 1,071 (100.0%) |
Household Vehicle Usage in Burnett County
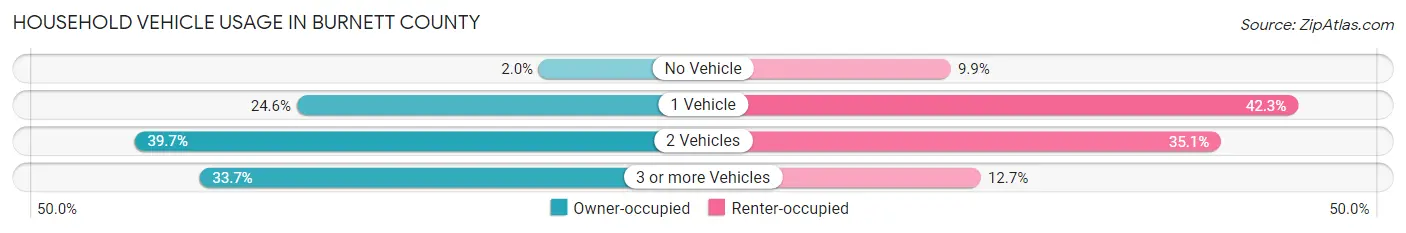
| Vehicles per Household | Owner-occupied | Renter-occupied |
| No Vehicle | 118 (2.0%) | 106 (9.9%) |
| 1 Vehicle | 1,455 (24.6%) | 453 (42.3%) |
| 2 Vehicles | 2,352 (39.7%) | 376 (35.1%) |
| 3 or more Vehicles | 1,993 (33.7%) | 136 (12.7%) |
| Total | 5,918 (100.0%) | 1,071 (100.0%) |
Real Estate & Mortgages in Burnett County
Real Estate and Mortgage Overview in Burnett County
| Characteristic | Without Mortgage | With Mortgage |
| Housing Units | 2,858 | 3,060 |
| Median Property Value | $198,700 | $202,800 |
| Median Household Income | $56,716 | $433 |
| Monthly Housing Costs | $496 | $154 |
| Real Estate Taxes | $2,030 | $18 |
Property Value by Mortgage Status in Burnett County
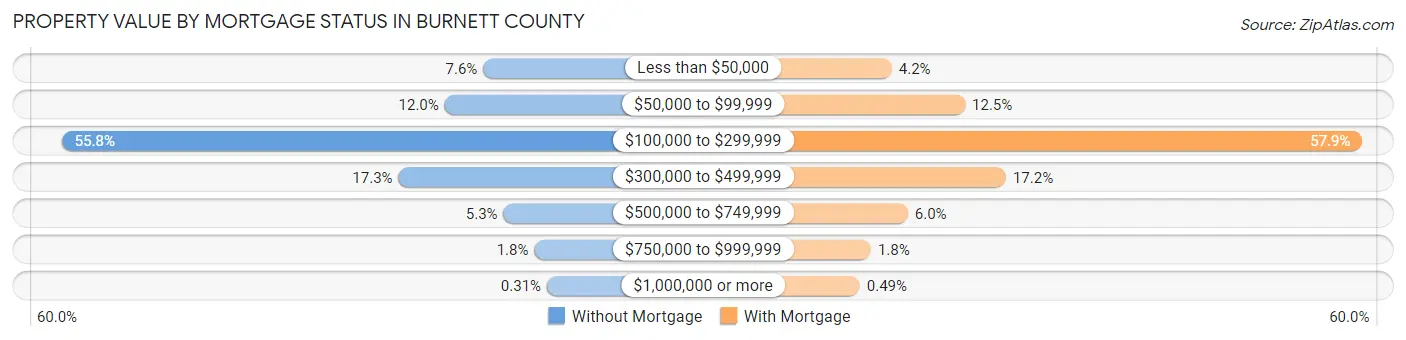
| Property Value | Without Mortgage | With Mortgage |
| Less than $50,000 | 217 (7.6%) | 127 (4.2%) |
| $50,000 to $99,999 | 343 (12.0%) | 383 (12.5%) |
| $100,000 to $299,999 | 1,594 (55.8%) | 1,772 (57.9%) |
| $300,000 to $499,999 | 494 (17.3%) | 526 (17.2%) |
| $500,000 to $749,999 | 151 (5.3%) | 183 (6.0%) |
| $750,000 to $999,999 | 50 (1.8%) | 54 (1.8%) |
| $1,000,000 or more | 9 (0.3%) | 15 (0.5%) |
| Total | 2,858 (100.0%) | 3,060 (100.0%) |
Household Income by Mortgage Status in Burnett County
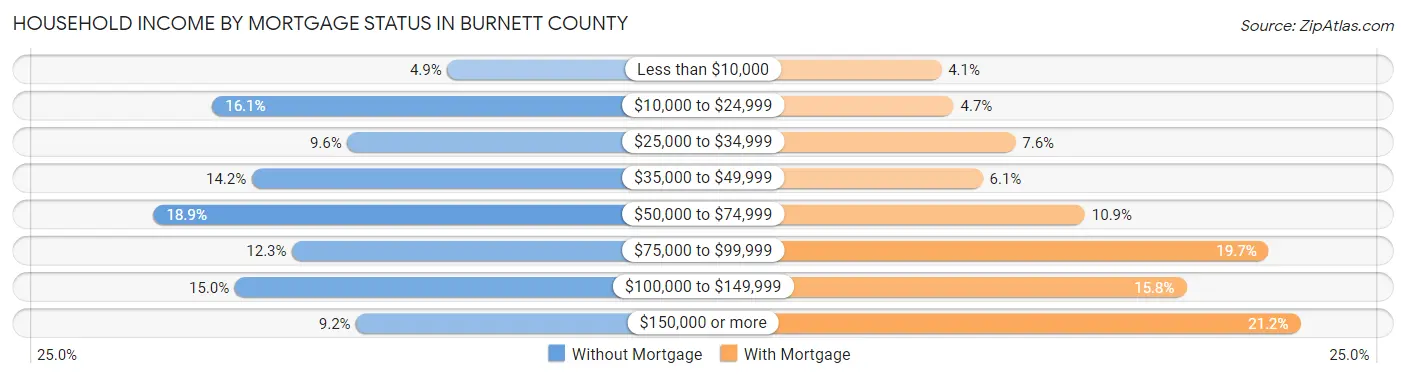
| Household Income | Without Mortgage | With Mortgage |
| Less than $10,000 | 139 (4.9%) | 125 (4.1%) |
| $10,000 to $24,999 | 459 (16.1%) | 143 (4.7%) |
| $25,000 to $34,999 | 275 (9.6%) | 233 (7.6%) |
| $35,000 to $49,999 | 405 (14.2%) | 185 (6.0%) |
| $50,000 to $74,999 | 539 (18.9%) | 334 (10.9%) |
| $75,000 to $99,999 | 350 (12.2%) | 602 (19.7%) |
| $100,000 to $149,999 | 428 (15.0%) | 482 (15.8%) |
| $150,000 or more | 263 (9.2%) | 648 (21.2%) |
| Total | 2,858 (100.0%) | 3,060 (100.0%) |
Property Value to Household Income Ratio in Burnett County
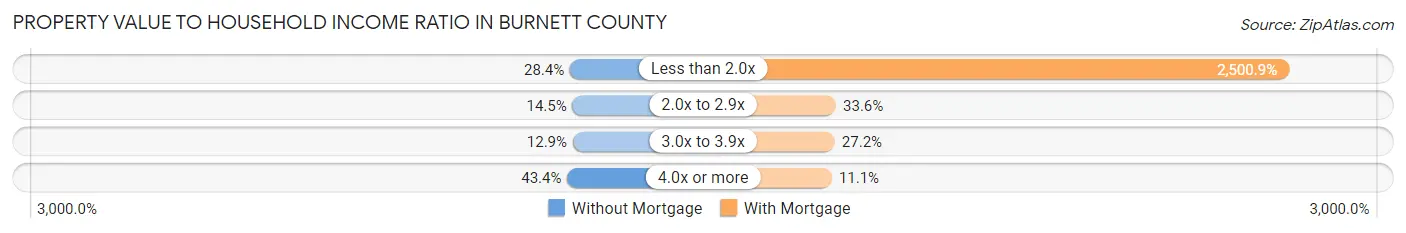
| Value-to-Income Ratio | Without Mortgage | With Mortgage |
| Less than 2.0x | 812 (28.4%) | 76,528 (2,500.9%) |
| 2.0x to 2.9x | 413 (14.4%) | 1,029 (33.6%) |
| 3.0x to 3.9x | 368 (12.9%) | 833 (27.2%) |
| 4.0x or more | 1,239 (43.3%) | 340 (11.1%) |
| Total | 2,858 (100.0%) | 3,060 (100.0%) |
Real Estate Taxes by Mortgage Status in Burnett County
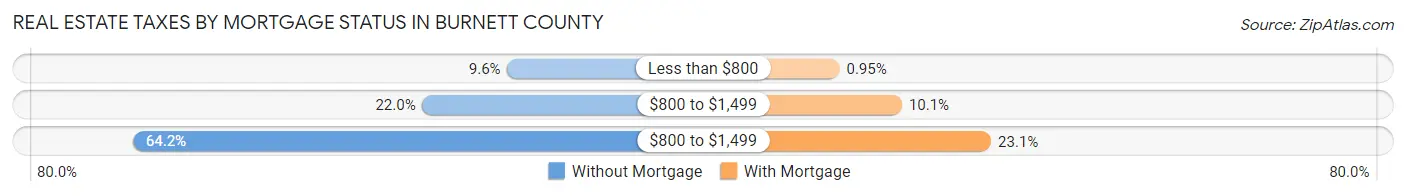
| Property Taxes | Without Mortgage | With Mortgage |
| Less than $800 | 274 (9.6%) | 29 (0.9%) |
| $800 to $1,499 | 629 (22.0%) | 308 (10.1%) |
| $800 to $1,499 | 1,834 (64.2%) | 707 (23.1%) |
| Total | 2,858 (100.0%) | 3,060 (100.0%) |
Health & Disability in Burnett County
Health Insurance Coverage by Age in Burnett County
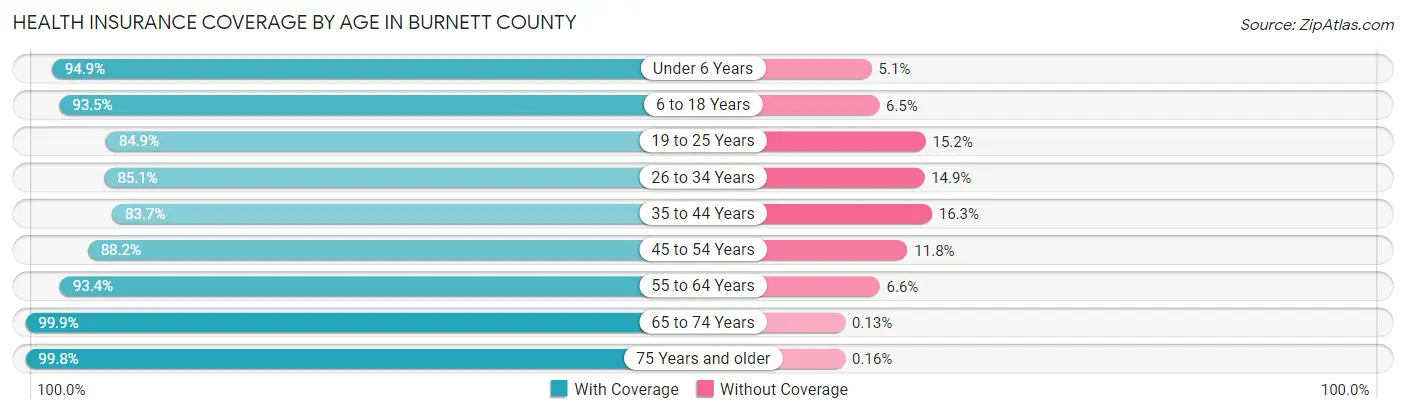
| Age Bracket | With Coverage | Without Coverage |
| Under 6 Years | 709 (94.9%) | 38 (5.1%) |
| 6 to 18 Years | 2,048 (93.5%) | 142 (6.5%) |
| 19 to 25 Years | 767 (84.9%) | 137 (15.1%) |
| 26 to 34 Years | 994 (85.1%) | 174 (14.9%) |
| 35 to 44 Years | 1,291 (83.7%) | 252 (16.3%) |
| 45 to 54 Years | 1,627 (88.2%) | 217 (11.8%) |
| 55 to 64 Years | 2,912 (93.4%) | 205 (6.6%) |
| 65 to 74 Years | 3,083 (99.9%) | 4 (0.1%) |
| 75 Years and older | 1,871 (99.8%) | 3 (0.2%) |
| Total | 15,302 (92.9%) | 1,172 (7.1%) |
Health Insurance Coverage by Citizenship Status in Burnett County
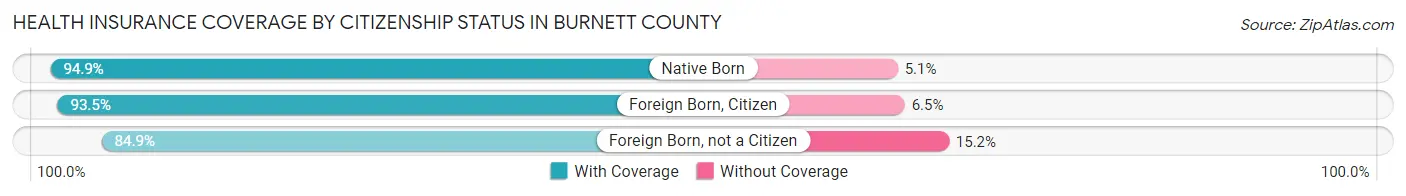
| Citizenship Status | With Coverage | Without Coverage |
| Native Born | 709 (94.9%) | 38 (5.1%) |
| Foreign Born, Citizen | 2,048 (93.5%) | 142 (6.5%) |
| Foreign Born, not a Citizen | 767 (84.9%) | 137 (15.1%) |
Health Insurance Coverage by Household Income in Burnett County
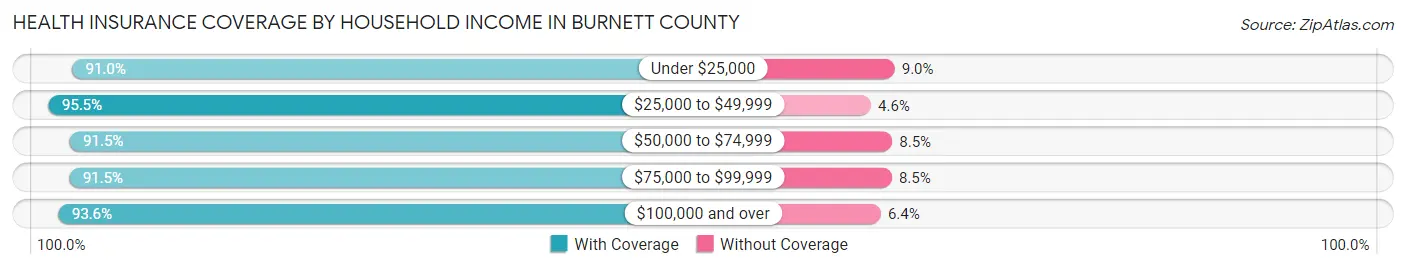
| Household Income | With Coverage | Without Coverage |
| Under $25,000 | 1,801 (91.0%) | 178 (9.0%) |
| $25,000 to $49,999 | 2,898 (95.5%) | 138 (4.5%) |
| $50,000 to $74,999 | 3,041 (91.5%) | 284 (8.5%) |
| $75,000 to $99,999 | 2,284 (91.5%) | 211 (8.5%) |
| $100,000 and over | 5,238 (93.6%) | 359 (6.4%) |
Public vs Private Health Insurance Coverage by Age in Burnett County

| Age Bracket | Public Insurance | Private Insurance |
| Under 6 | 460 (61.6%) | 329 (44.0%) |
| 6 to 18 Years | 1,029 (47.0%) | 1,166 (53.2%) |
| 19 to 25 Years | 231 (25.6%) | 582 (64.4%) |
| 25 to 34 Years | 382 (32.7%) | 658 (56.3%) |
| 35 to 44 Years | 396 (25.7%) | 960 (62.2%) |
| 45 to 54 Years | 385 (20.9%) | 1,314 (71.3%) |
| 55 to 64 Years | 895 (28.7%) | 2,202 (70.6%) |
| 65 to 74 Years | 3,054 (98.9%) | 1,867 (60.5%) |
| 75 Years and over | 1,846 (98.5%) | 1,228 (65.5%) |
| Total | 8,678 (52.7%) | 10,306 (62.6%) |
Disability Status by Sex by Age in Burnett County
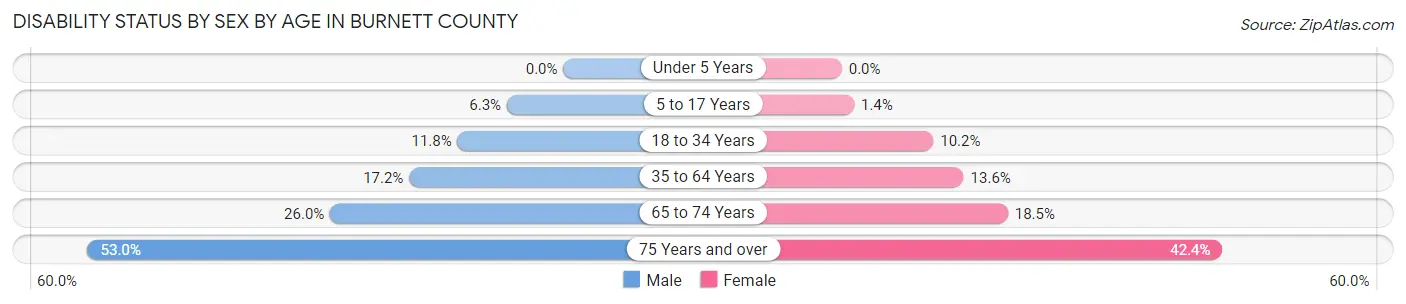
| Age Bracket | Male | Female |
| Under 5 Years | 0 (0.0%) | 0 (0.0%) |
| 5 to 17 Years | 74 (6.3%) | 13 (1.4%) |
| 18 to 34 Years | 135 (11.8%) | 113 (10.2%) |
| 35 to 64 Years | 569 (17.2%) | 433 (13.6%) |
| 65 to 74 Years | 421 (26.0%) | 271 (18.5%) |
| 75 Years and over | 489 (53.0%) | 403 (42.4%) |
Disability Class by Sex by Age in Burnett County
Disability Class: Hearing Difficulty
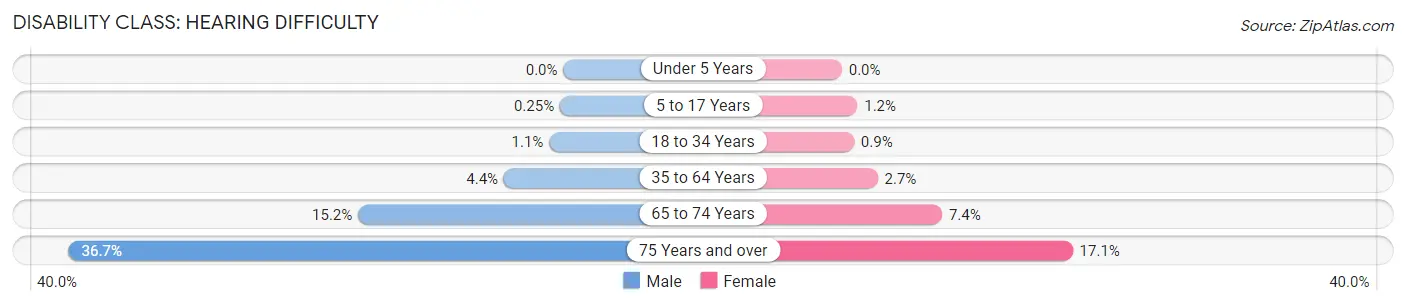
| Age Bracket | Male | Female |
| Under 5 Years | 0 (0.0%) | 0 (0.0%) |
| 5 to 17 Years | 3 (0.3%) | 11 (1.1%) |
| 18 to 34 Years | 12 (1.1%) | 10 (0.9%) |
| 35 to 64 Years | 146 (4.4%) | 85 (2.7%) |
| 65 to 74 Years | 247 (15.2%) | 109 (7.4%) |
| 75 Years and over | 339 (36.7%) | 163 (17.1%) |
Disability Class: Vision Difficulty
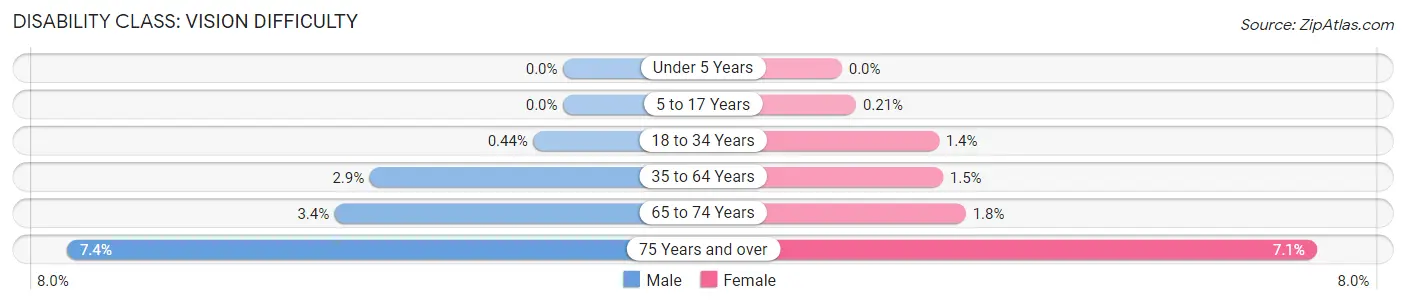
| Age Bracket | Male | Female |
| Under 5 Years | 0 (0.0%) | 0 (0.0%) |
| 5 to 17 Years | 0 (0.0%) | 2 (0.2%) |
| 18 to 34 Years | 5 (0.4%) | 16 (1.4%) |
| 35 to 64 Years | 95 (2.9%) | 48 (1.5%) |
| 65 to 74 Years | 55 (3.4%) | 27 (1.8%) |
| 75 Years and over | 68 (7.4%) | 67 (7.0%) |
Disability Class: Cognitive Difficulty
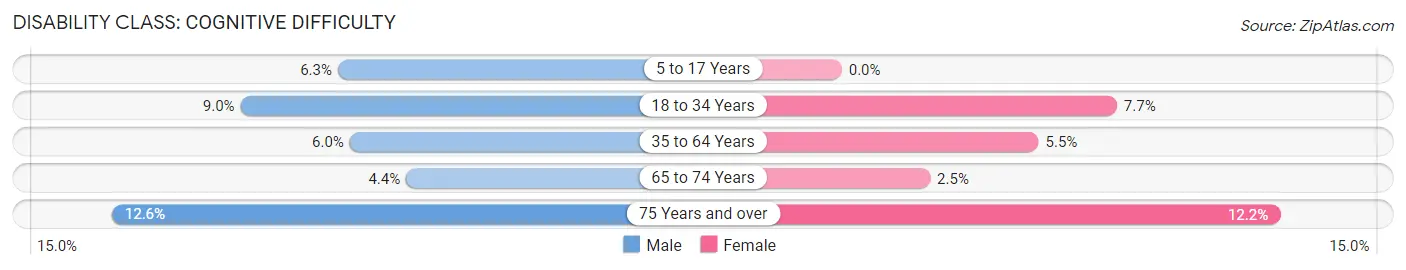
| Age Bracket | Male | Female |
| 5 to 17 Years | 74 (6.3%) | 0 (0.0%) |
| 18 to 34 Years | 103 (9.0%) | 85 (7.7%) |
| 35 to 64 Years | 197 (5.9%) | 175 (5.5%) |
| 65 to 74 Years | 71 (4.4%) | 36 (2.5%) |
| 75 Years and over | 116 (12.6%) | 116 (12.2%) |
Disability Class: Ambulatory Difficulty
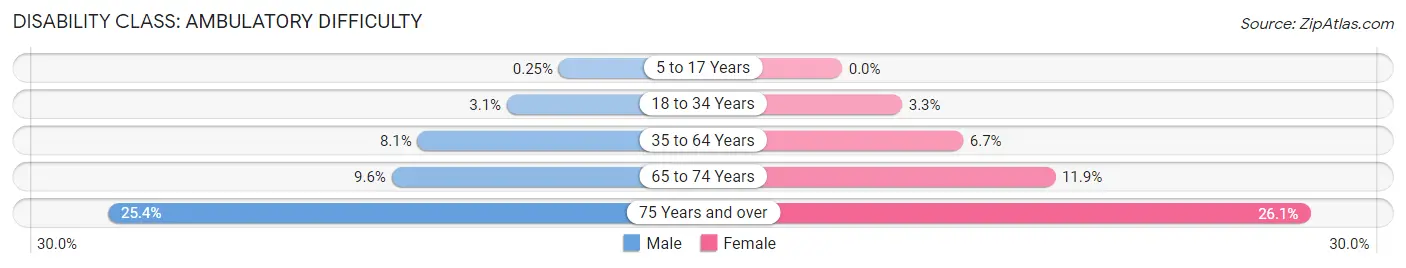
| Age Bracket | Male | Female |
| 5 to 17 Years | 3 (0.3%) | 0 (0.0%) |
| 18 to 34 Years | 36 (3.1%) | 37 (3.3%) |
| 35 to 64 Years | 269 (8.1%) | 215 (6.7%) |
| 65 to 74 Years | 155 (9.6%) | 174 (11.9%) |
| 75 Years and over | 234 (25.4%) | 248 (26.1%) |
Disability Class: Self-Care Difficulty
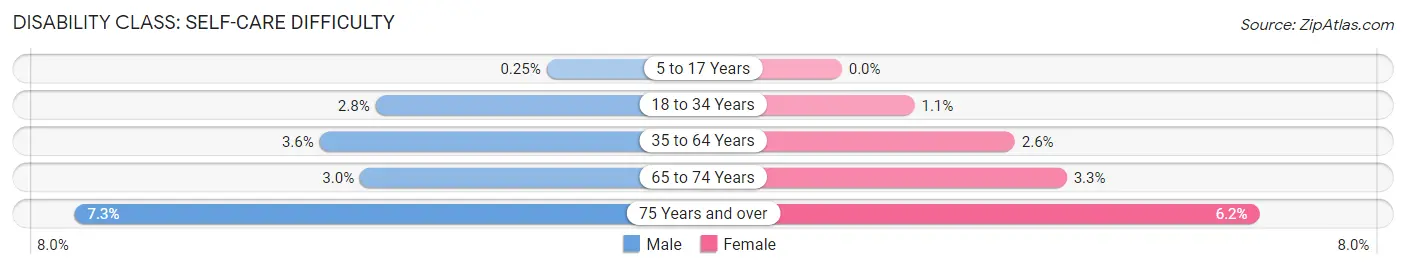
| Age Bracket | Male | Female |
| 5 to 17 Years | 3 (0.3%) | 0 (0.0%) |
| 18 to 34 Years | 32 (2.8%) | 12 (1.1%) |
| 35 to 64 Years | 120 (3.6%) | 82 (2.6%) |
| 65 to 74 Years | 49 (3.0%) | 49 (3.3%) |
| 75 Years and over | 67 (7.3%) | 59 (6.2%) |
Technology Access in Burnett County
Computing Device Access in Burnett County
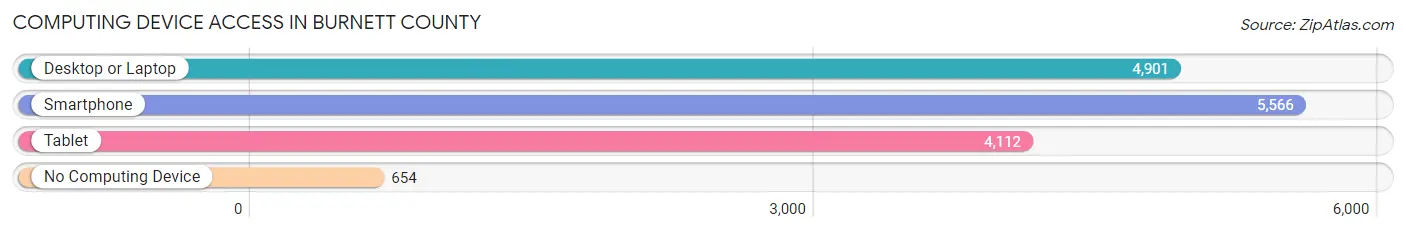
| Device Type | # Households | % Households |
| Desktop or Laptop | 4,901 | 70.1% |
| Smartphone | 5,566 | 79.6% |
| Tablet | 4,112 | 58.8% |
| No Computing Device | 654 | 9.4% |
| Total | 6,989 | 100.0% |
Internet Access in Burnett County
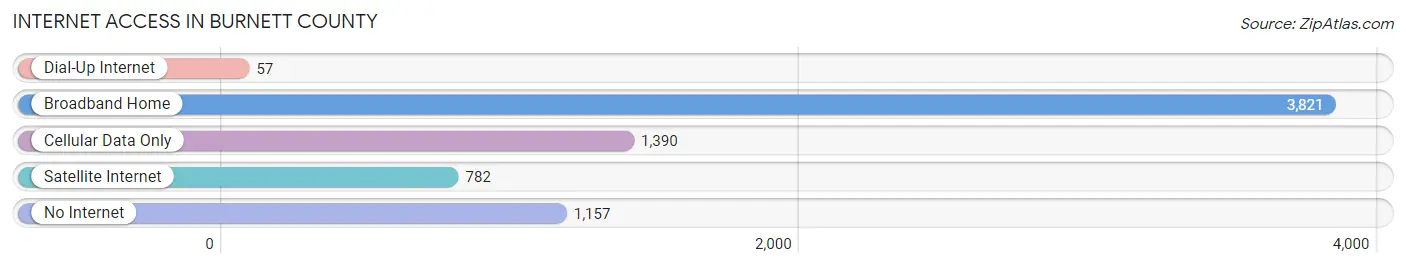
| Internet Type | # Households | % Households |
| Dial-Up Internet | 57 | 0.8% |
| Broadband Home | 3,821 | 54.7% |
| Cellular Data Only | 1,390 | 19.9% |
| Satellite Internet | 782 | 11.2% |
| No Internet | 1,157 | 16.6% |
| Total | 6,989 | 100.0% |
Burnett County Summary
Burnett County is located in the northwestern corner of Wisconsin, and is part of the Twin Cities metropolitan area. It is bordered by Polk County to the north, Barron County to the east, Washburn County to the south, and St. Croix County to the west. The county seat is Siren, and the largest city is Grantsburg. The county was established in 1856 and named after Edward D. Burnett, a Wisconsin legislator.
Geography
Burnett County covers an area of 576 square miles, of which 574 square miles is land and 2 square miles is water. The county is located in the northwest corner of Wisconsin, and is part of the Twin Cities metropolitan area. It is bordered by Polk County to the north, Barron County to the east, Washburn County to the south, and St. Croix County to the west. The terrain is mostly rolling hills and wooded areas, with some wetlands and lakes. The St. Croix River forms the western border of the county.
The county is home to several state parks and recreation areas, including Crex Meadows Wildlife Area, Governor Knowles State Forest, and St. Croix State Park. There are also several lakes in the county, including Big Sand Lake, Grindstone Lake, and Yellow Lake.
Demographics
As of the 2010 census, there were 15,879 people, 6,541 households, and 4,541 families living in the county. The population density was 28 people per square mile. The racial makeup of the county was 97.2% White, 0.4% Black or African American, 0.5% Native American, 0.3% Asian, 0.2% from other races, and 1.4% from two or more races. Hispanic or Latino of any race were 1.2% of the population.
The median income for a household in the county was $41,945, and the median income for a family was $50,945. The per capita income for the county was $20,945. About 8.7% of families and 11.7% of the population were below the poverty line, including 15.2% of those under age 18 and 8.2% of those age 65 or over.
Economy
The economy of Burnett County is largely based on agriculture, forestry, and tourism. The county is home to several large farms, as well as several small family farms. The county is also home to several logging and timber companies, as well as several sawmills. Tourism is also an important part of the economy, with several resorts and campgrounds located in the county.
The county is also home to several manufacturing companies, including a paper mill, a furniture factory, and a plastics factory. The county is also home to several retail stores, restaurants, and other businesses.
History
Burnett County was established in 1856 and named after Edward D. Burnett, a Wisconsin legislator. The county was originally home to several Native American tribes, including the Ojibwe, Dakota, and Menominee. The first European settlers arrived in the area in the early 1800s, and the county was officially organized in 1856.
The county was largely rural until the late 19th century, when logging and farming began to take off. The county was also home to several resorts and campgrounds, which attracted tourists from all over the Midwest. The county continued to grow throughout the 20th century, and today it is home to several small towns and villages.
Common Questions
What is the Total Population of Burnett County?
Total Population of Burnett County is 16,561.
What is the Total Male Population of Burnett County?
Total Male Population of Burnett County is 8,572.
What is the Total Female Population of Burnett County?
Total Female Population of Burnett County is 7,989.
What is the Ratio of Males per 100 Females in Burnett County?
There are 107.30 Males per 100 Females in Burnett County.
What is the Ratio of Females per 100 Males in Burnett County?
There are 93.20 Females per 100 Males in Burnett County.
What is the Median Population Age in Burnett County?
Median Population Age in Burnett County is 54.4 Years.
What is the Average Family Size in Burnett County
Average Family Size in Burnett County is 2.9 People.
What is the Average Household Size in Burnett County
Average Household Size in Burnett County is 2.4 People.
What is Per Capita Income in Burnett County?
Per Capita income in Burnett County is $36,322.
What is the Median Family Income in Burnett County?
Median Family Income in Burnett County is $75,934.
What is the Median Household income in Burnett County?
Median Household Income in Burnett County is $60,466.
What is Income or Wage Gap in Burnett County?
Income or Wage Gap in Burnett County is 25.0%.
Women in Burnett County earn 75.0 cents for every dollar earned by a man.
What is Family Income Deficit in Burnett County?
Family Income Deficit in Burnett County is $8,265.
Families that are below poverty line in Burnett County earn $8,265 less on average than the poverty threshold level.
What is Inequality or Gini Index in Burnett County?
Inequality or Gini Index in Burnett County is 0.45.
How Large is the Labor Force in Burnett County?
There are 7,222 People in the Labor Forcein in Burnett County.
What is the Percentage of People in the Labor Force in Burnett County?
51.1% of People are in the Labor Force in Burnett County.
What is the Unemployment Rate in Burnett County?
Unemployment Rate in Burnett County is 5.2%.