Birch Hill, WI
Birch Hill Map
Birch Hill Overview
318
TOTAL POPULATION
122
MALE POPULATION
196
FEMALE POPULATION
62.24
MALES / 100 FEMALES
160.66
FEMALES / 100 MALES
32.8
MEDIAN AGE
2.5
AVG FAMILY SIZE
2.7
AVG HOUSEHOLD SIZE
$21,959
PER CAPITA INCOME
$61,250
AVG FAMILY INCOME
$57,292
AVG HOUSEHOLD INCOME
13.7%
WAGE / INCOME GAP [ % ]
86.3¢/ $1
WAGE / INCOME GAP [ $ ]
$10,032
FAMILY INCOME DEFICIT
0.29
INEQUALITY / GINI INDEX
216
LABOR FORCE [ PEOPLE ]
80.3%
PERCENT IN LABOR FORCE
9.7%
UNEMPLOYMENT RATE
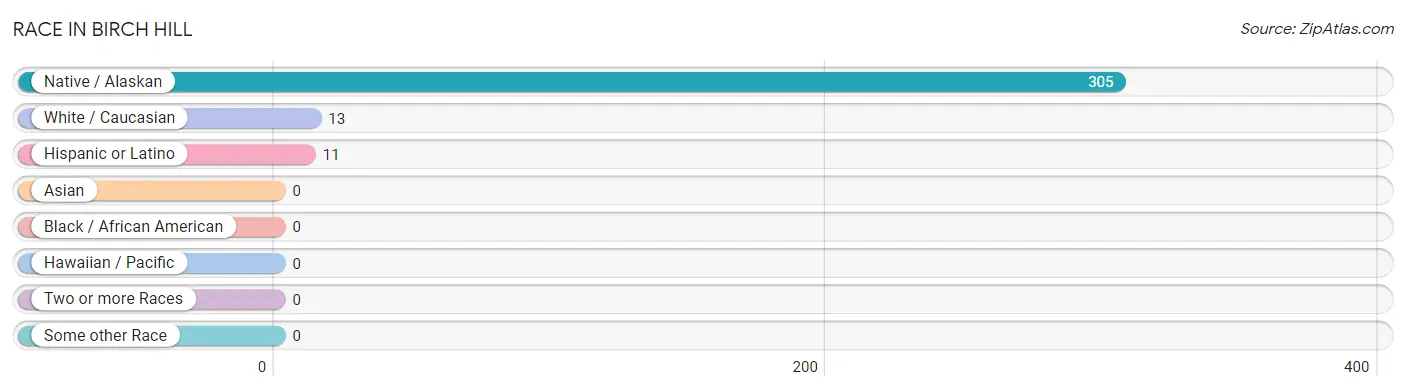
Race in Birch Hill
The most populous races in Birch Hill are Native / Alaskan (305 | 95.9%), White / Caucasian (13 | 4.1%), and Hispanic or Latino (11 | 3.5%).
| Race | # Population | % Population |
| Asian | 0 | 0.0% |
| Black / African American | 0 | 0.0% |
| Hawaiian / Pacific | 0 | 0.0% |
| Hispanic or Latino | 11 | 3.5% |
| Native / Alaskan | 305 | 95.9% |
| White / Caucasian | 13 | 4.1% |
| Two or more Races | 0 | 0.0% |
| Some other Race | 0 | 0.0% |
| Total | 318 | 100.0% |
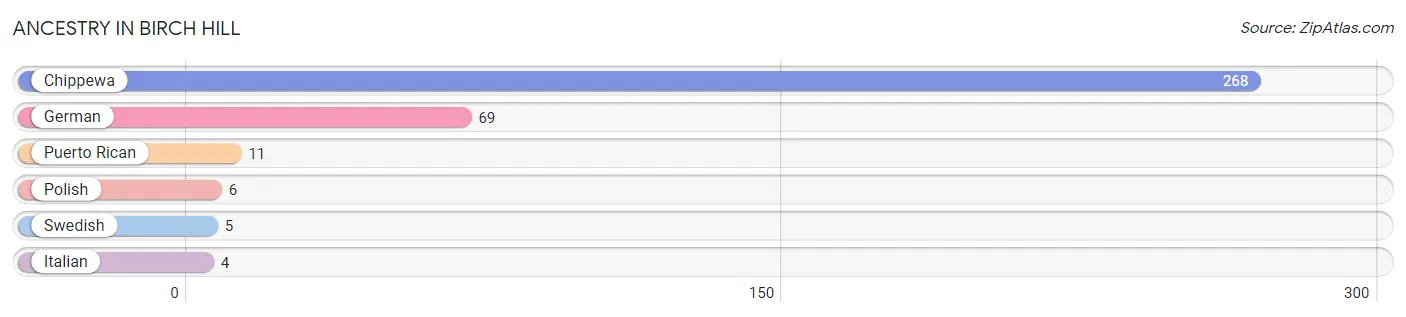
Ancestry in Birch Hill
The most populous ancestries reported in Birch Hill are Chippewa (268 | 84.3%), German (69 | 21.7%), Puerto Rican (11 | 3.5%), Polish (6 | 1.9%), and Swedish (5 | 1.6%), together accounting for 112.9% of all Birch Hill residents.
| Ancestry | # Population | % Population |
| Chippewa | 268 | 84.3% |
| German | 69 | 21.7% |
| Italian | 4 | 1.3% |
| Polish | 6 | 1.9% |
| Puerto Rican | 11 | 3.5% |
| Swedish | 5 | 1.6% | View All 6 Rows |
Immigrants in Birch Hill

| Immigration Origin | # Population | % Population | View All 0 Rows |
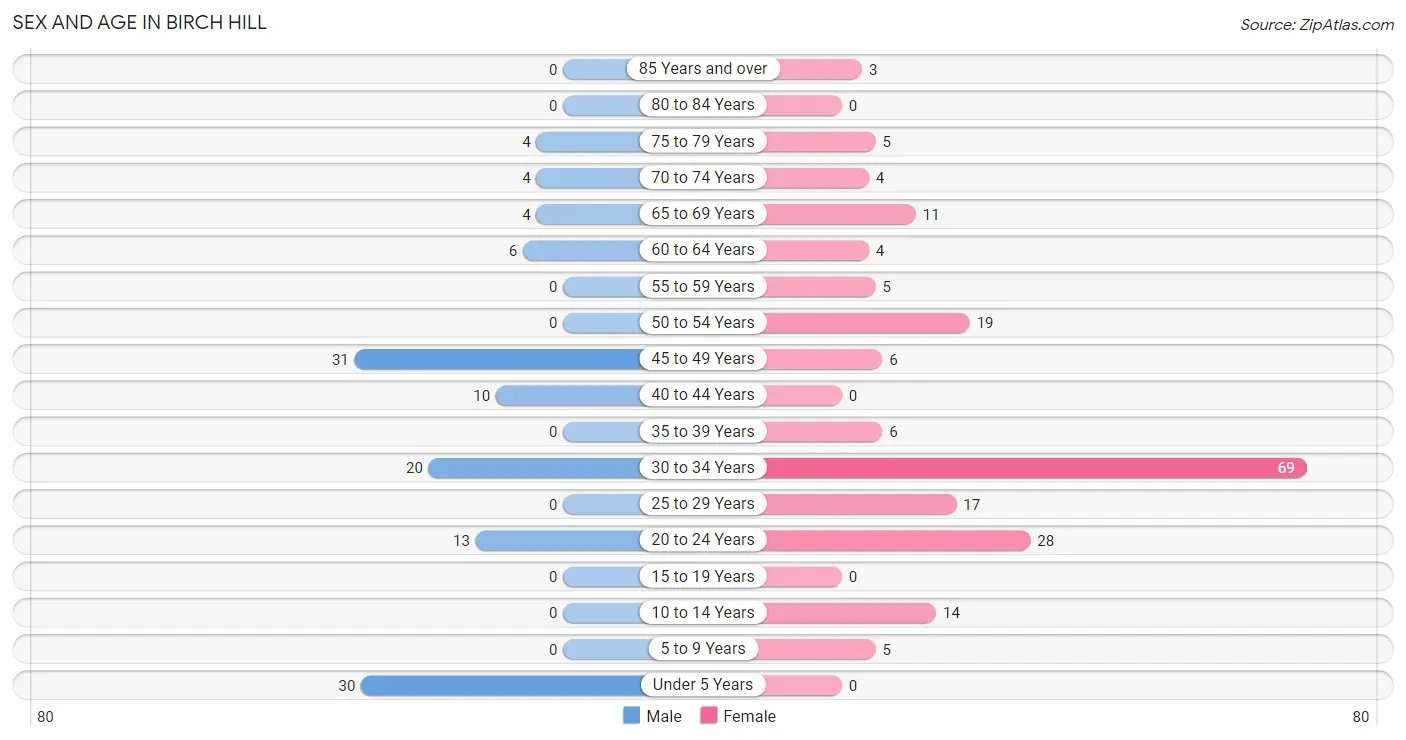
Sex and Age in Birch Hill
Sex and Age in Birch Hill
The most populous age groups in Birch Hill are 45 to 49 Years (31 | 25.4%) for men and 30 to 34 Years (69 | 35.2%) for women.
| Age Bracket | Male | Female |
| Under 5 Years | 30 (24.6%) | 0 (0.0%) |
| 5 to 9 Years | 0 (0.0%) | 5 (2.5%) |
| 10 to 14 Years | 0 (0.0%) | 14 (7.1%) |
| 15 to 19 Years | 0 (0.0%) | 0 (0.0%) |
| 20 to 24 Years | 13 (10.7%) | 28 (14.3%) |
| 25 to 29 Years | 0 (0.0%) | 17 (8.7%) |
| 30 to 34 Years | 20 (16.4%) | 69 (35.2%) |
| 35 to 39 Years | 0 (0.0%) | 6 (3.1%) |
| 40 to 44 Years | 10 (8.2%) | 0 (0.0%) |
| 45 to 49 Years | 31 (25.4%) | 6 (3.1%) |
| 50 to 54 Years | 0 (0.0%) | 19 (9.7%) |
| 55 to 59 Years | 0 (0.0%) | 5 (2.5%) |
| 60 to 64 Years | 6 (4.9%) | 4 (2.0%) |
| 65 to 69 Years | 4 (3.3%) | 11 (5.6%) |
| 70 to 74 Years | 4 (3.3%) | 4 (2.0%) |
| 75 to 79 Years | 4 (3.3%) | 5 (2.5%) |
| 80 to 84 Years | 0 (0.0%) | 0 (0.0%) |
| 85 Years and over | 0 (0.0%) | 3 (1.5%) |
| Total | 122 (100.0%) | 196 (100.0%) |
Families and Households in Birch Hill
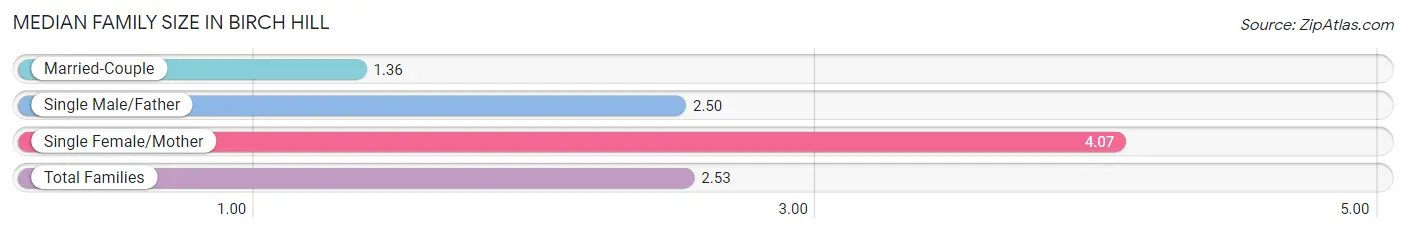
Median Family Size in Birch Hill
The median family size in Birch Hill is 2.53 persons per family, with single female/mother families (30 | 40.0%) accounting for the largest median family size of 4.07 persons per family. On the other hand, married-couple families (39 | 52.0%) represent the smallest median family size with 1.36 persons per family.
| Family Type | # Families | Family Size |
| Married-Couple | 39 (52.0%) | 1.36 |
| Single Male/Father | 6 (8.0%) | 2.50 |
| Single Female/Mother | 30 (40.0%) | 4.07 |
| Total Families | 75 (100.0%) | 2.53 |
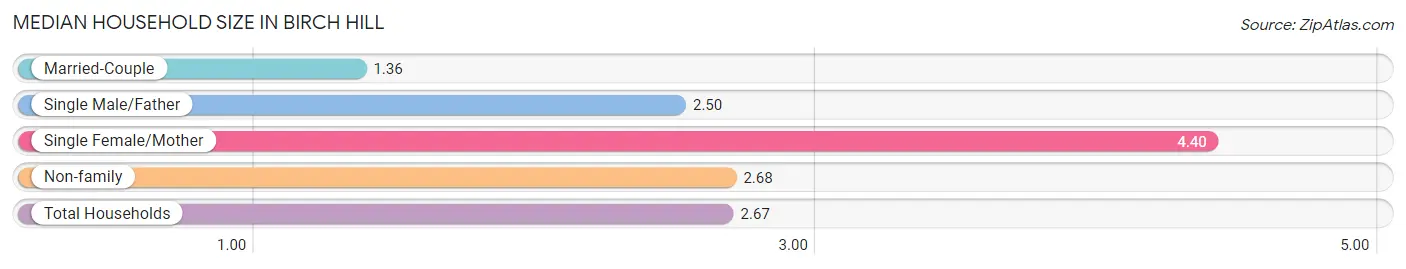
Median Household Size in Birch Hill
The median household size in Birch Hill is 2.67 persons per household, with single female/mother households (30 | 25.2%) accounting for the largest median household size of 4.4 persons per household. married-couple households (39 | 32.8%) represent the smallest median household size with 1.36 persons per household.
| Household Type | # Households | Household Size |
| Married-Couple | 39 (32.8%) | 1.36 |
| Single Male/Father | 6 (5.0%) | 2.50 |
| Single Female/Mother | 30 (25.2%) | 4.40 |
| Non-family | 44 (37.0%) | 2.68 |
| Total Households | 119 (100.0%) | 2.67 |
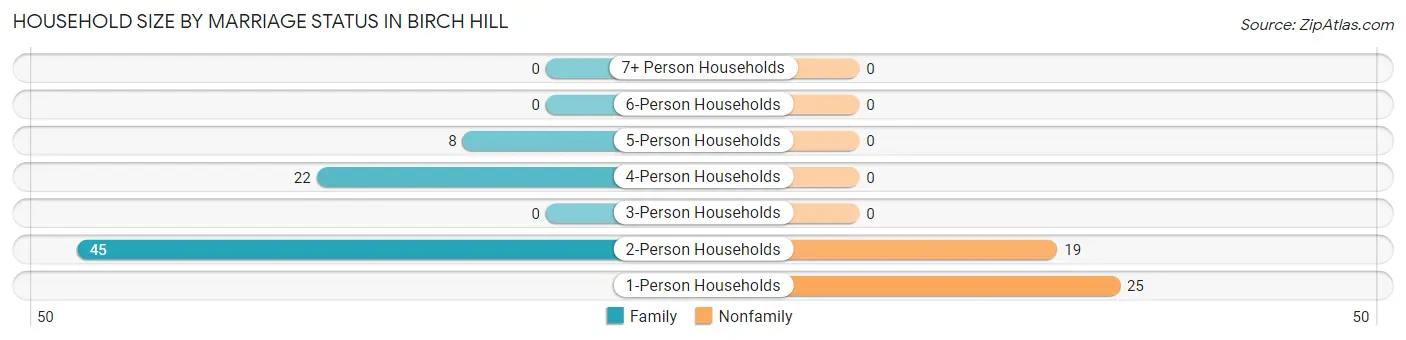
Household Size by Marriage Status in Birch Hill
Out of a total of 119 households in Birch Hill, 75 (63.0%) are family households, while 44 (37.0%) are nonfamily households. The most numerous type of family households are 2-person households, comprising 45, and the most common type of nonfamily households are 1-person households, comprising 25.
| Household Size | Family Households | Nonfamily Households |
| 1-Person Households | - | 25 (21.0%) |
| 2-Person Households | 45 (37.8%) | 19 (16.0%) |
| 3-Person Households | 0 (0.0%) | 0 (0.0%) |
| 4-Person Households | 22 (18.5%) | 0 (0.0%) |
| 5-Person Households | 8 (6.7%) | 0 (0.0%) |
| 6-Person Households | 0 (0.0%) | 0 (0.0%) |
| 7+ Person Households | 0 (0.0%) | 0 (0.0%) |
| Total | 75 (63.0%) | 44 (37.0%) |
Female Fertility in Birch Hill
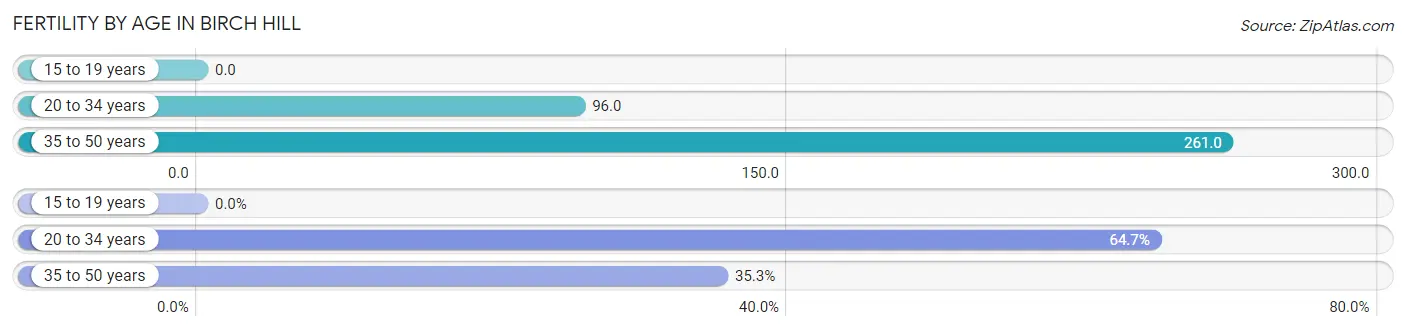
Fertility by Age in Birch Hill
Average fertility rate in Birch Hill is 124.0 births per 1,000 women. Women in the age bracket of 35 to 50 years have the highest fertility rate with 261.0 births per 1,000 women. Women in the age bracket of 20 to 34 years acount for 64.7% of all women with births.
| Age Bracket | Women with Births | Births / 1,000 Women |
| 15 to 19 years | 0 (0.0%) | 0.0 |
| 20 to 34 years | 11 (64.7%) | 96.0 |
| 35 to 50 years | 6 (35.3%) | 261.0 |
| Total | 17 (100.0%) | 124.0 |
Fertility by Age by Marriage Status in Birch Hill
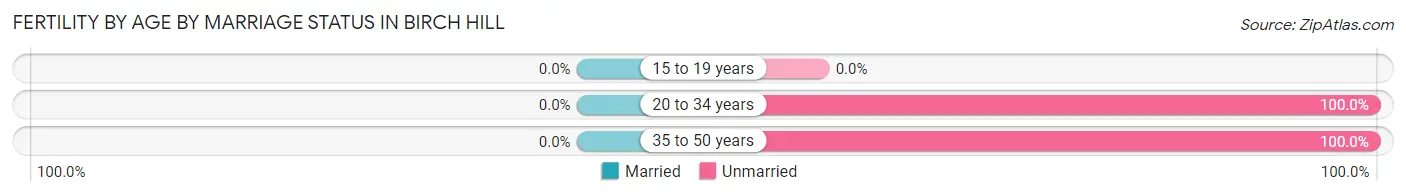
| Age Bracket | Married | Unmarried |
| 15 to 19 years | 0 (0.0%) | 0 (0.0%) |
| 20 to 34 years | 0 (0.0%) | 11 (100.0%) |
| 35 to 50 years | 0 (0.0%) | 6 (100.0%) |
| Total | 0 (0.0%) | 17 (100.0%) |
Fertility by Education in Birch Hill
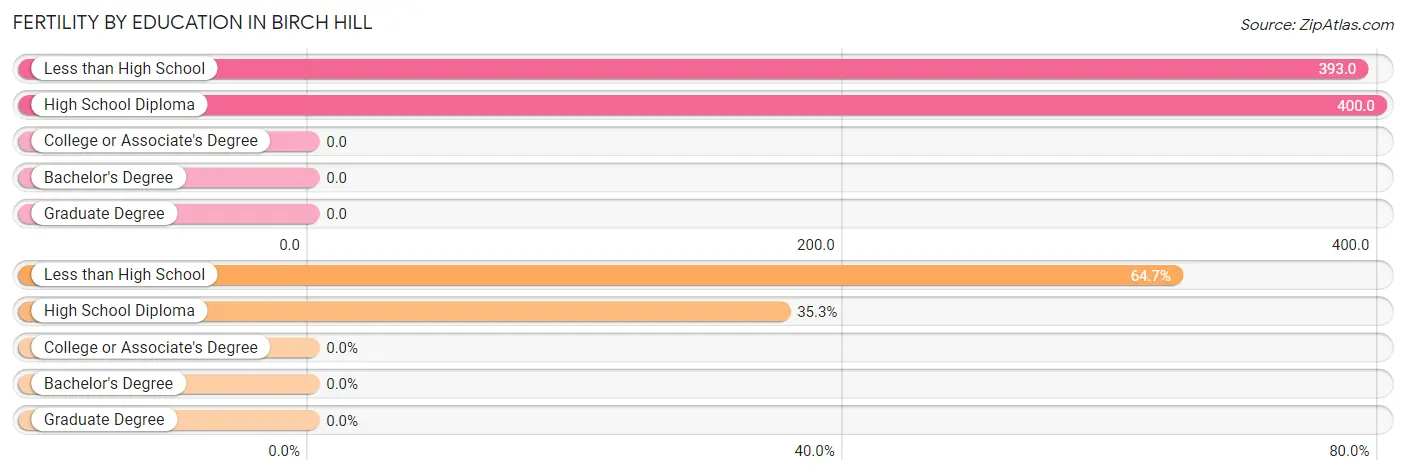
| Educational Attainment | Women with Births | Births / 1,000 Women |
| Less than High School | 11 (64.7%) | 393.0 |
| High School Diploma | 6 (35.3%) | 400.0 |
| College or Associate's Degree | 0 (0.0%) | 0.0 |
| Bachelor's Degree | 0 (0.0%) | 0.0 |
| Graduate Degree | 0 (0.0%) | 0.0 |
| Total | 17 (100.0%) | 124.0 |
Fertility by Education by Marriage Status in Birch Hill
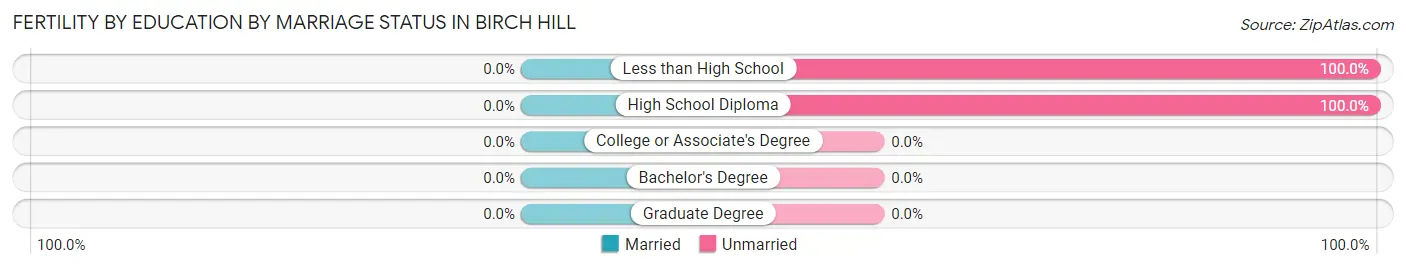
| Educational Attainment | Married | Unmarried |
| Less than High School | 0 (0.0%) | 11 (100.0%) |
| High School Diploma | 0 (0.0%) | 6 (100.0%) |
| College or Associate's Degree | 0 (0.0%) | 0 (0.0%) |
| Bachelor's Degree | 0 (0.0%) | 0 (0.0%) |
| Graduate Degree | 0 (0.0%) | 0 (0.0%) |
| Total | 0 (0.0%) | 17 (100.0%) |
Income in Birch Hill
Income Overview in Birch Hill
Per Capita Income in Birch Hill is $21,959, while median incomes of families and households are $61,250 and $57,292 respectively.
| Characteristic | Number | Measure |
| Per Capita Income | 318 | $21,959 |
| Median Family Income | 75 | $61,250 |
| Mean Family Income | 75 | $48,508 |
| Median Household Income | 119 | $57,292 |
| Mean Household Income | 119 | $47,132 |
| Income Deficit | 75 | $10,032 |
| Wage / Income Gap (%) | 318 | 13.75% |
| Wage / Income Gap ($) | 318 | 86.25¢ per $1 |
| Gini / Inequality Index | 318 | 0.29 |
Earnings by Sex in Birch Hill
Average Earnings in Birch Hill are $35,694, $32,500 for men and $37,681 for women, a difference of 13.8%.
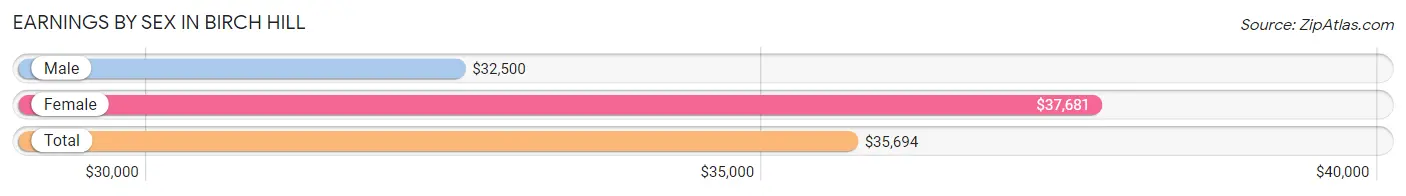
| Sex | Number | Average Earnings |
| Male | 62 (30.1%) | $32,500 |
| Female | 144 (69.9%) | $37,681 |
| Total | 206 (100.0%) | $35,694 |
Earnings by Sex by Income Bracket in Birch Hill
The most common earnings brackets in Birch Hill are $35,000 to $39,999 for men (31 | 50.0%) and $35,000 to $39,999 for women (74 | 51.4%).
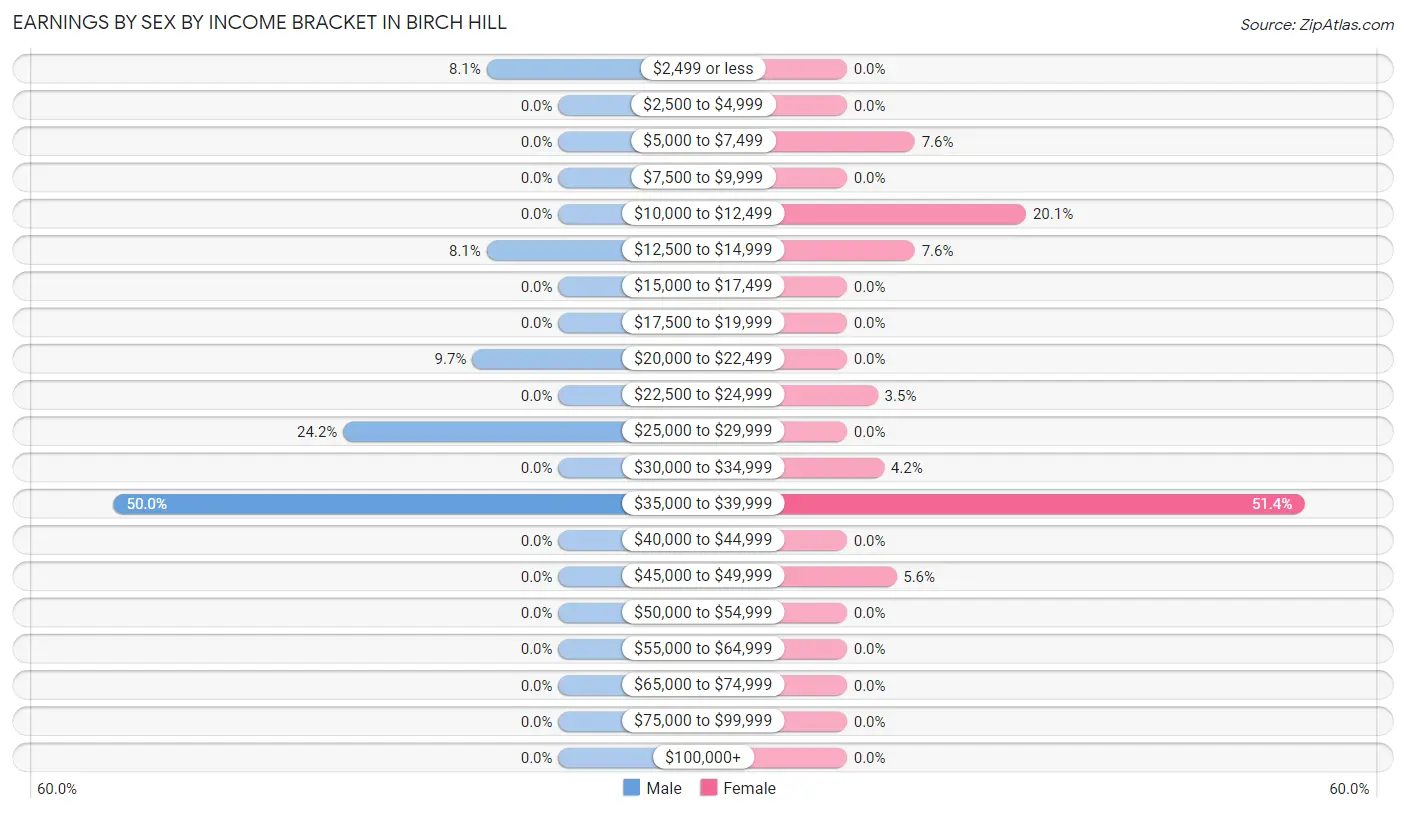
| Income | Male | Female |
| $2,499 or less | 5 (8.1%) | 0 (0.0%) |
| $2,500 to $4,999 | 0 (0.0%) | 0 (0.0%) |
| $5,000 to $7,499 | 0 (0.0%) | 11 (7.6%) |
| $7,500 to $9,999 | 0 (0.0%) | 0 (0.0%) |
| $10,000 to $12,499 | 0 (0.0%) | 29 (20.1%) |
| $12,500 to $14,999 | 5 (8.1%) | 11 (7.6%) |
| $15,000 to $17,499 | 0 (0.0%) | 0 (0.0%) |
| $17,500 to $19,999 | 0 (0.0%) | 0 (0.0%) |
| $20,000 to $22,499 | 6 (9.7%) | 0 (0.0%) |
| $22,500 to $24,999 | 0 (0.0%) | 5 (3.5%) |
| $25,000 to $29,999 | 15 (24.2%) | 0 (0.0%) |
| $30,000 to $34,999 | 0 (0.0%) | 6 (4.2%) |
| $35,000 to $39,999 | 31 (50.0%) | 74 (51.4%) |
| $40,000 to $44,999 | 0 (0.0%) | 0 (0.0%) |
| $45,000 to $49,999 | 0 (0.0%) | 8 (5.6%) |
| $50,000 to $54,999 | 0 (0.0%) | 0 (0.0%) |
| $55,000 to $64,999 | 0 (0.0%) | 0 (0.0%) |
| $65,000 to $74,999 | 0 (0.0%) | 0 (0.0%) |
| $75,000 to $99,999 | 0 (0.0%) | 0 (0.0%) |
| $100,000+ | 0 (0.0%) | 0 (0.0%) |
| Total | 62 (100.0%) | 144 (100.0%) |
Earnings by Sex by Educational Attainment in Birch Hill
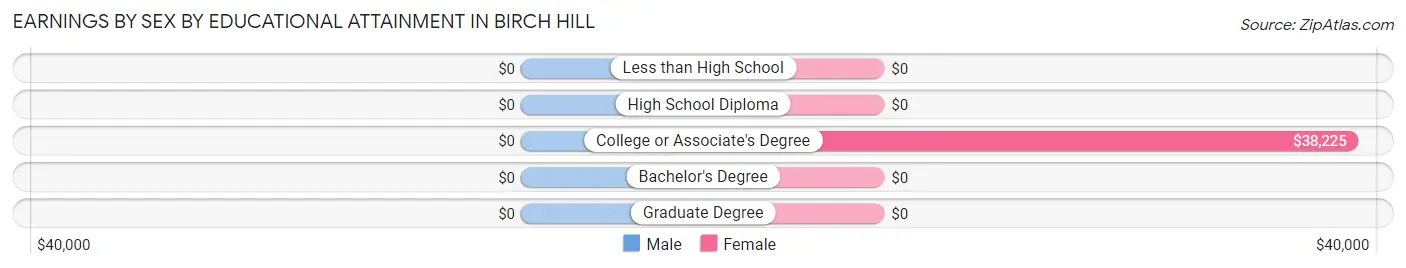
| Educational Attainment | Male Income | Female Income |
| Less than High School | - | - |
| High School Diploma | - | - |
| College or Associate's Degree | - | - |
| Bachelor's Degree | - | - |
| Graduate Degree | - | - |
| Total | $35,202 | $38,188 |
Family Income in Birch Hill
Family Income Brackets in Birch Hill
According to the Birch Hill family income data, there are 36 families falling into the $50,000 to $74,999 income range, which is the most common income bracket and makes up 48.0% of all families.
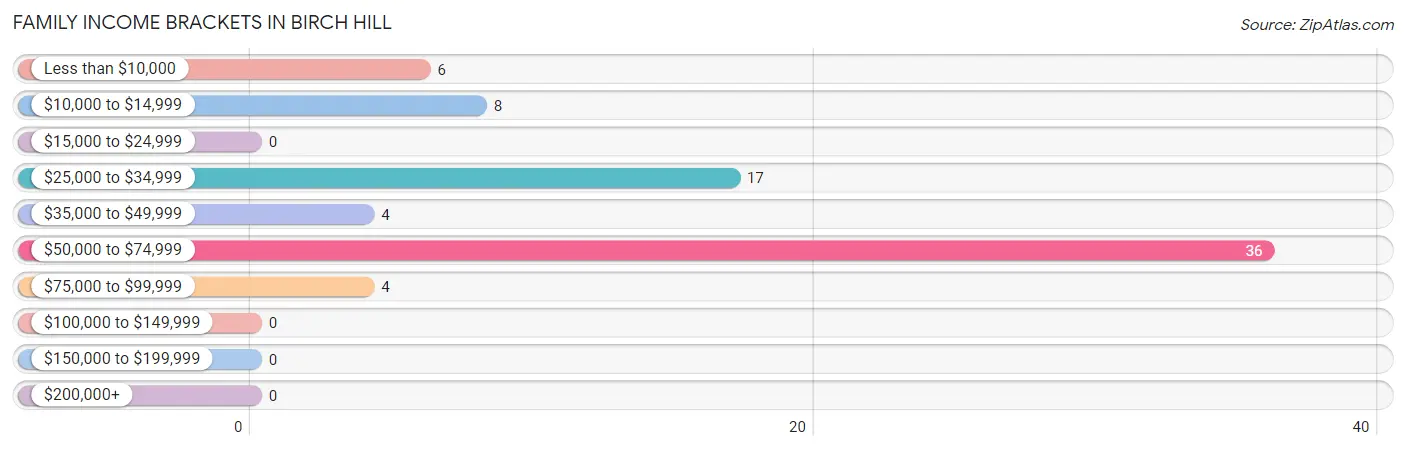
| Income Bracket | # Families | % Families |
| Less than $10,000 | 6 | 8.0% |
| $10,000 to $14,999 | 8 | 10.7% |
| $15,000 to $24,999 | 0 | 0.0% |
| $25,000 to $34,999 | 17 | 22.7% |
| $35,000 to $49,999 | 4 | 5.3% |
| $50,000 to $74,999 | 36 | 48.0% |
| $75,000 to $99,999 | 4 | 5.3% |
| $100,000 to $149,999 | 0 | 0.0% |
| $150,000 to $199,999 | 0 | 0.0% |
| $200,000+ | 0 | 0.0% |
Family Income by Famaliy Size in Birch Hill
2-person families (45 | 60.0%) account for the highest median family income in Birch Hill with $71,008 per family, while 2-person families (45 | 60.0%) have the highest median income of $35,504 per family member.
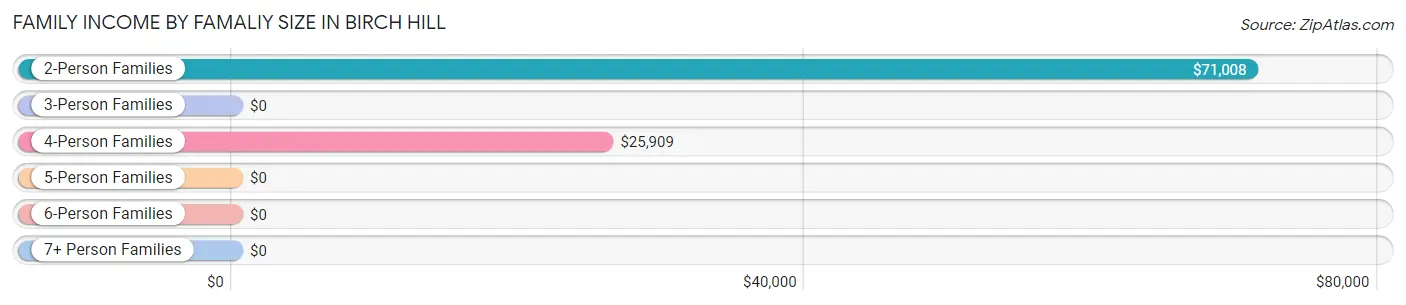
| Income Bracket | # Families | Median Income |
| 2-Person Families | 45 (60.0%) | $71,008 |
| 3-Person Families | 6 (8.0%) | $0 |
| 4-Person Families | 24 (32.0%) | $25,909 |
| 5-Person Families | 0 (0.0%) | $0 |
| 6-Person Families | 0 (0.0%) | $0 |
| 7+ Person Families | 0 (0.0%) | $0 |
| Total | 75 (100.0%) | $61,250 |
Family Income by Number of Earners in Birch Hill
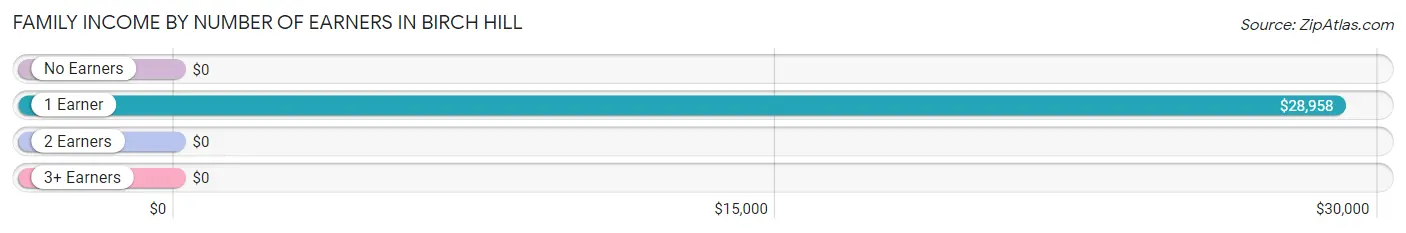
| Number of Earners | # Families | Median Income |
| No Earners | 10 (13.3%) | $0 |
| 1 Earner | 23 (30.7%) | $28,958 |
| 2 Earners | 42 (56.0%) | $0 |
| 3+ Earners | 0 (0.0%) | $0 |
| Total | 75 (100.0%) | $61,250 |
Household Income in Birch Hill
Household Income Brackets in Birch Hill
With 61 households falling in the category, the $50,000 to $74,999 income range is the most frequent in Birch Hill, accounting for 51.3% of all households.
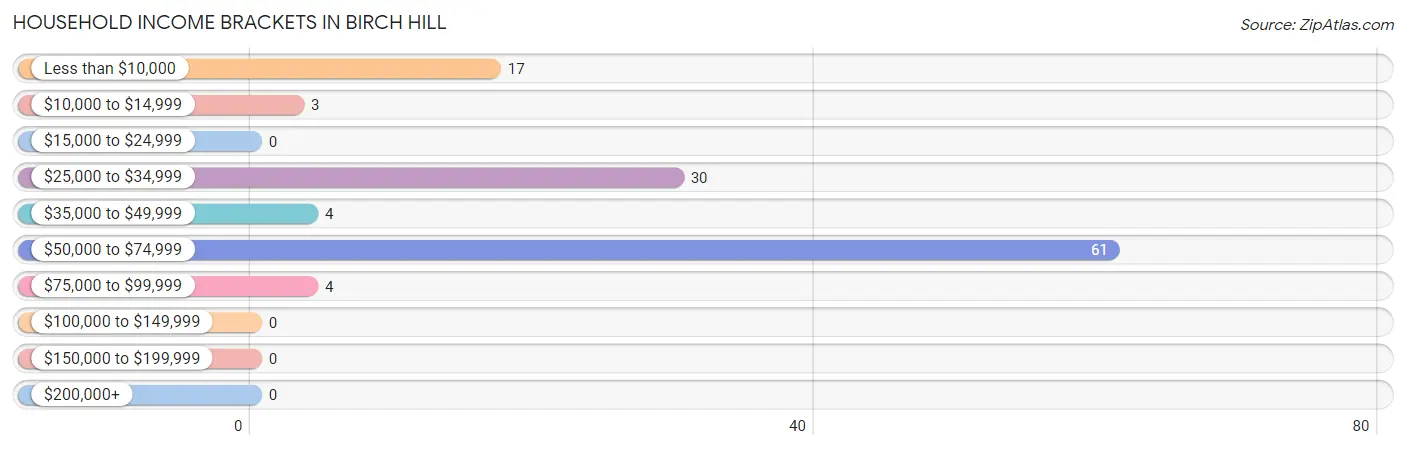
| Income Bracket | # Households | % Households |
| Less than $10,000 | 17 | 14.3% |
| $10,000 to $14,999 | 3 | 2.5% |
| $15,000 to $24,999 | 0 | 0.0% |
| $25,000 to $34,999 | 30 | 25.2% |
| $35,000 to $49,999 | 4 | 3.4% |
| $50,000 to $74,999 | 61 | 51.3% |
| $75,000 to $99,999 | 4 | 3.4% |
| $100,000 to $149,999 | 0 | 0.0% |
| $150,000 to $199,999 | 0 | 0.0% |
| $200,000+ | 0 | 0.0% |
Household Income by Householder Age in Birch Hill
The median household income in Birch Hill is $57,292, with the highest median household income of $70,403 found in the 45 to 64 years age bracket for the primary householder. A total of 52 households (43.7%) fall into this category. Meanwhile, the 15 to 24 years age bracket for the primary householder has the lowest median household income of $0, with 11 households (9.2%) in this group.
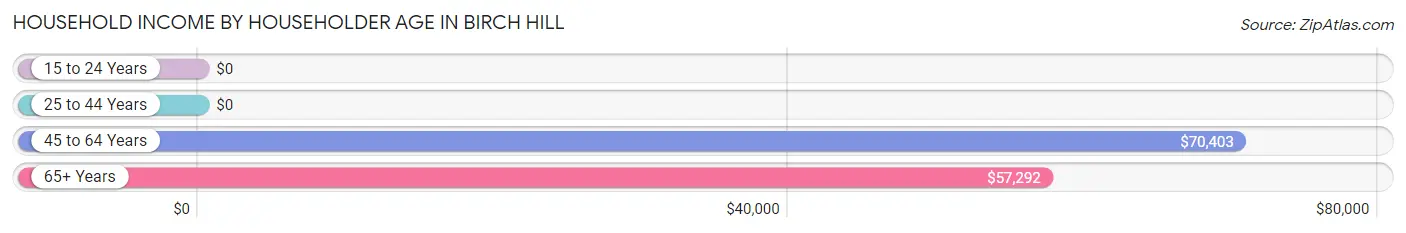
| Income Bracket | # Households | Median Income |
| 15 to 24 Years | 11 (9.2%) | $0 |
| 25 to 44 Years | 29 (24.4%) | $0 |
| 45 to 64 Years | 52 (43.7%) | $70,403 |
| 65+ Years | 27 (22.7%) | $57,292 |
| Total | 119 (100.0%) | $57,292 |
Poverty in Birch Hill
Income Below Poverty by Sex and Age in Birch Hill
With 39.3% poverty level for males and 35.7% for females among the residents of Birch Hill, under 5 year old males and 18 to 24 year old females are the most vulnerable to poverty, with 30 males (100.0%) and 28 females (100.0%) in their respective age groups living below the poverty level.
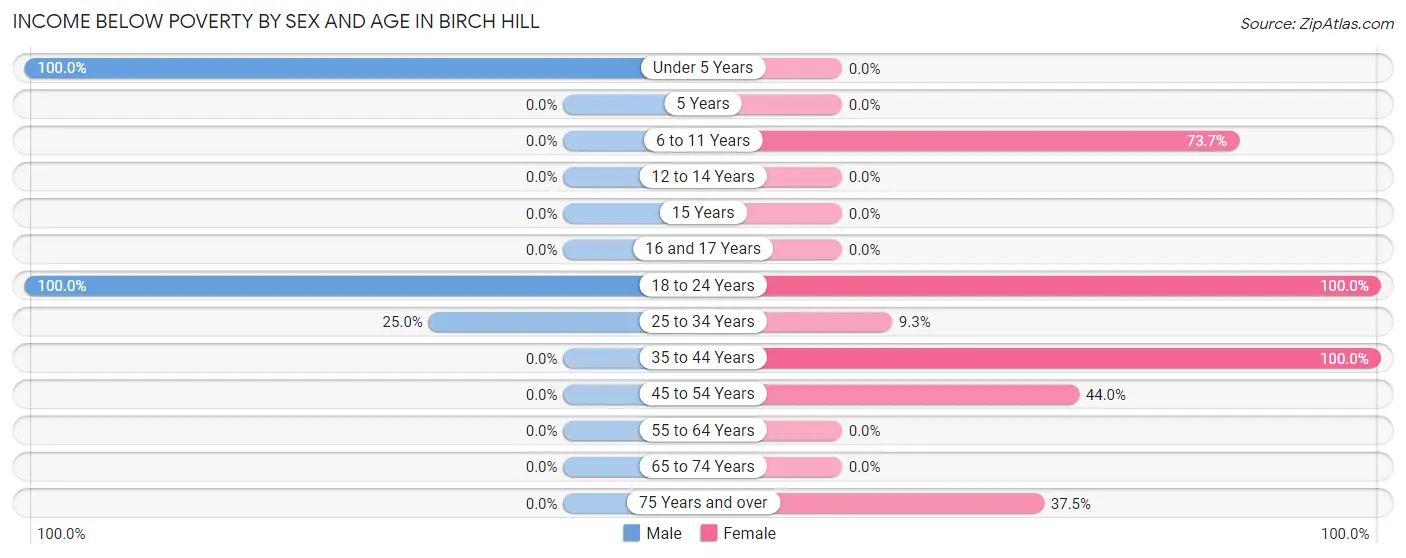
| Age Bracket | Male | Female |
| Under 5 Years | 30 (100.0%) | 0 (0.0%) |
| 5 Years | 0 (0.0%) | 0 (0.0%) |
| 6 to 11 Years | 0 (0.0%) | 14 (73.7%) |
| 12 to 14 Years | 0 (0.0%) | 0 (0.0%) |
| 15 Years | 0 (0.0%) | 0 (0.0%) |
| 16 and 17 Years | 0 (0.0%) | 0 (0.0%) |
| 18 to 24 Years | 13 (100.0%) | 28 (100.0%) |
| 25 to 34 Years | 5 (25.0%) | 8 (9.3%) |
| 35 to 44 Years | 0 (0.0%) | 6 (100.0%) |
| 45 to 54 Years | 0 (0.0%) | 11 (44.0%) |
| 55 to 64 Years | 0 (0.0%) | 0 (0.0%) |
| 65 to 74 Years | 0 (0.0%) | 0 (0.0%) |
| 75 Years and over | 0 (0.0%) | 3 (37.5%) |
| Total | 48 (39.3%) | 70 (35.7%) |
Income Above Poverty by Sex and Age in Birch Hill
According to the poverty statistics in Birch Hill, males aged 35 to 44 years and females aged 55 to 64 years are the age groups that are most secure financially, with 100.0% of males and 100.0% of females in these age groups living above the poverty line.
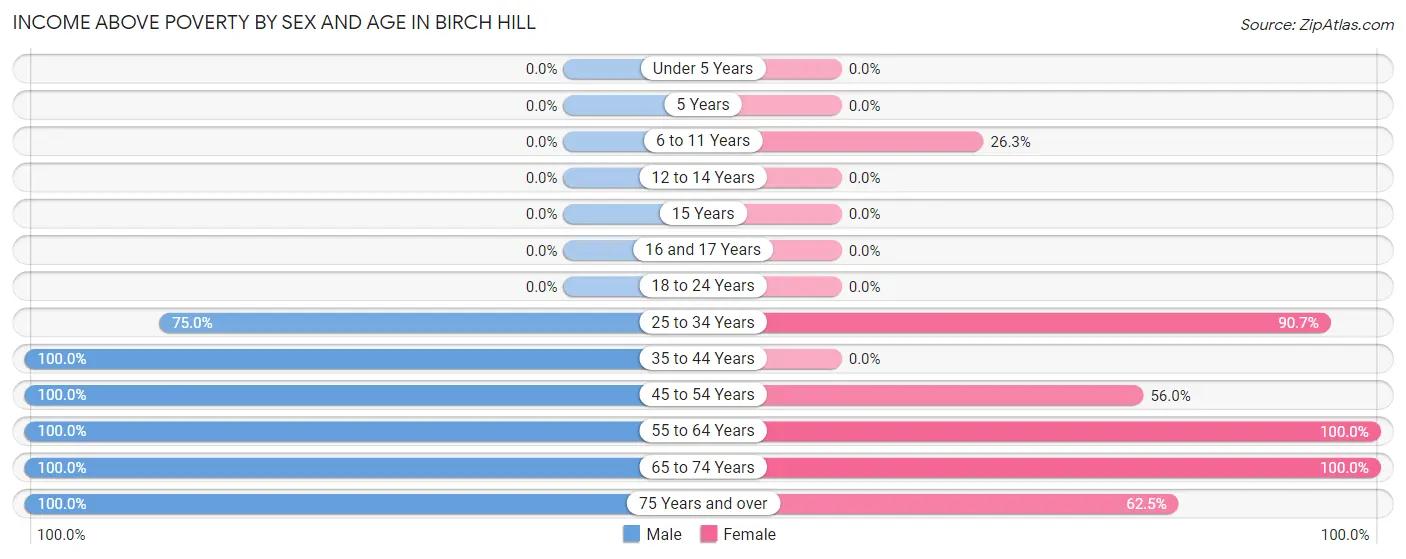
| Age Bracket | Male | Female |
| Under 5 Years | 0 (0.0%) | 0 (0.0%) |
| 5 Years | 0 (0.0%) | 0 (0.0%) |
| 6 to 11 Years | 0 (0.0%) | 5 (26.3%) |
| 12 to 14 Years | 0 (0.0%) | 0 (0.0%) |
| 15 Years | 0 (0.0%) | 0 (0.0%) |
| 16 and 17 Years | 0 (0.0%) | 0 (0.0%) |
| 18 to 24 Years | 0 (0.0%) | 0 (0.0%) |
| 25 to 34 Years | 15 (75.0%) | 78 (90.7%) |
| 35 to 44 Years | 10 (100.0%) | 0 (0.0%) |
| 45 to 54 Years | 31 (100.0%) | 14 (56.0%) |
| 55 to 64 Years | 6 (100.0%) | 9 (100.0%) |
| 65 to 74 Years | 8 (100.0%) | 15 (100.0%) |
| 75 Years and over | 4 (100.0%) | 5 (62.5%) |
| Total | 74 (60.7%) | 126 (64.3%) |
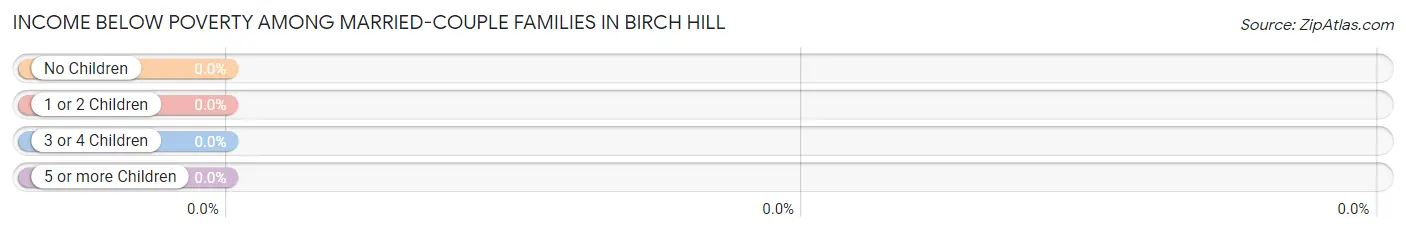
Income Below Poverty Among Married-Couple Families in Birch Hill
| Children | Above Poverty | Below Poverty |
| No Children | 39 (100.0%) | 0 (0.0%) |
| 1 or 2 Children | 0 (0.0%) | 0 (0.0%) |
| 3 or 4 Children | 0 (0.0%) | 0 (0.0%) |
| 5 or more Children | 0 (0.0%) | 0 (0.0%) |
| Total | 39 (100.0%) | 0 (0.0%) |
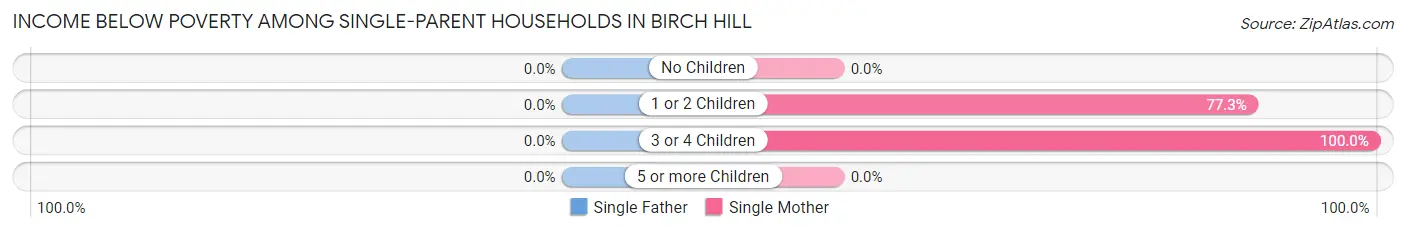
Income Below Poverty Among Single-Parent Households in Birch Hill
| Children | Single Father | Single Mother |
| No Children | 0 (0.0%) | 0 (0.0%) |
| 1 or 2 Children | 0 (0.0%) | 17 (77.3%) |
| 3 or 4 Children | 0 (0.0%) | 8 (100.0%) |
| 5 or more Children | 0 (0.0%) | 0 (0.0%) |
| Total | 0 (0.0%) | 25 (83.3%) |
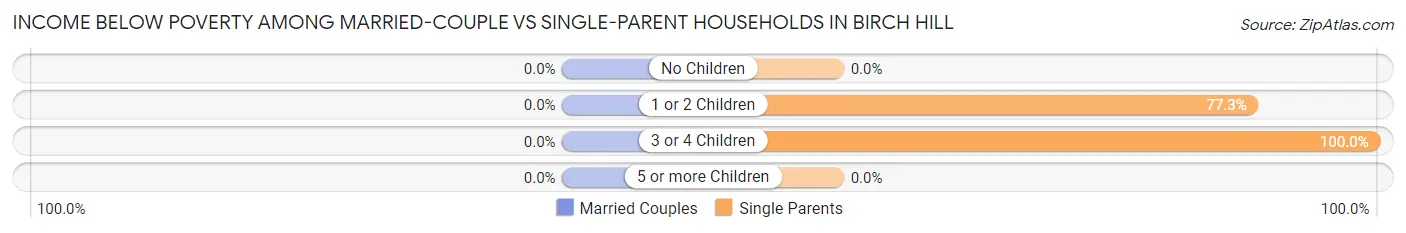
Income Below Poverty Among Married-Couple vs Single-Parent Households in Birch Hill
| Children | Married-Couple Families | Single-Parent Households |
| No Children | 0 (0.0%) | 0 (0.0%) |
| 1 or 2 Children | 0 (0.0%) | 17 (77.3%) |
| 3 or 4 Children | 0 (0.0%) | 8 (100.0%) |
| 5 or more Children | 0 (0.0%) | 0 (0.0%) |
| Total | 0 (0.0%) | 25 (69.4%) |
Employment Characteristics in Birch Hill
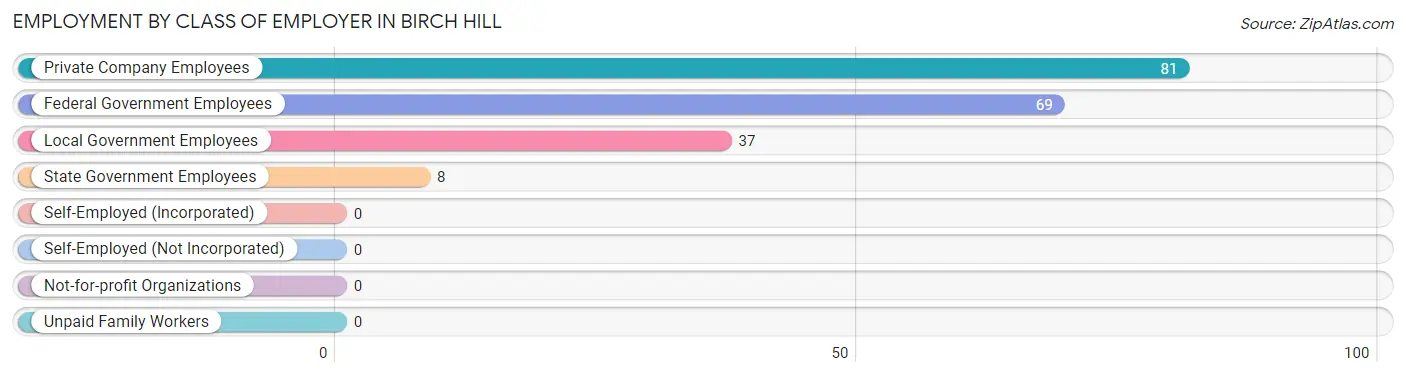
Employment by Class of Employer in Birch Hill
Among the 195 employed individuals in Birch Hill, private company employees (81 | 41.5%), federal government employees (69 | 35.4%), and local government employees (37 | 19.0%) make up the most common classes of employment.
| Employer Class | # Employees | % Employees |
| Private Company Employees | 81 | 41.5% |
| Self-Employed (Incorporated) | 0 | 0.0% |
| Self-Employed (Not Incorporated) | 0 | 0.0% |
| Not-for-profit Organizations | 0 | 0.0% |
| Local Government Employees | 37 | 19.0% |
| State Government Employees | 8 | 4.1% |
| Federal Government Employees | 69 | 35.4% |
| Unpaid Family Workers | 0 | 0.0% |
| Total | 195 | 100.0% |
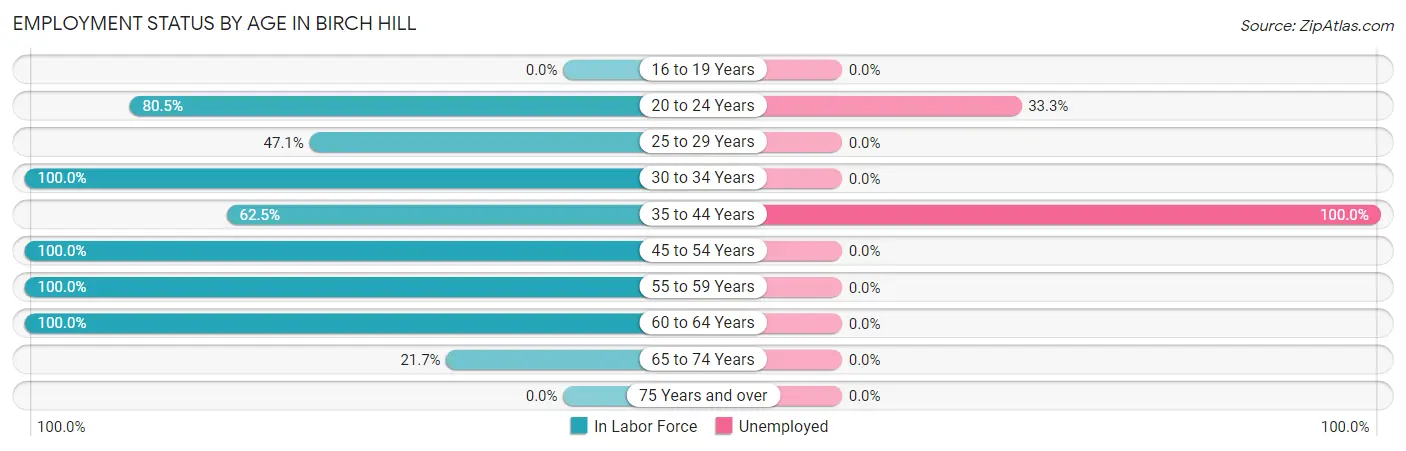
Employment Status by Age in Birch Hill
According to the labor force statistics for Birch Hill, out of the total population over 16 years of age (269), 80.3% or 216 individuals are in the labor force, with 9.7% or 21 of them unemployed. The age group with the highest labor force participation rate is 30 to 34 years, with 100.0% or 89 individuals in the labor force. Within the labor force, the 35 to 44 years age range has the highest percentage of unemployed individuals, with 100.0% or 10 of them being unemployed.
| Age Bracket | In Labor Force | Unemployed |
| 16 to 19 Years | 0 (0.0%) | 0 (0.0%) |
| 20 to 24 Years | 33 (80.5%) | 11 (33.3%) |
| 25 to 29 Years | 8 (47.1%) | 0 (0.0%) |
| 30 to 34 Years | 89 (100.0%) | 0 (0.0%) |
| 35 to 44 Years | 10 (62.5%) | 10 (100.0%) |
| 45 to 54 Years | 56 (100.0%) | 0 (0.0%) |
| 55 to 59 Years | 5 (100.0%) | 0 (0.0%) |
| 60 to 64 Years | 10 (100.0%) | 0 (0.0%) |
| 65 to 74 Years | 5 (21.7%) | 0 (0.0%) |
| 75 Years and over | 0 (0.0%) | 0 (0.0%) |
| Total | 216 (80.3%) | 21 (9.7%) |
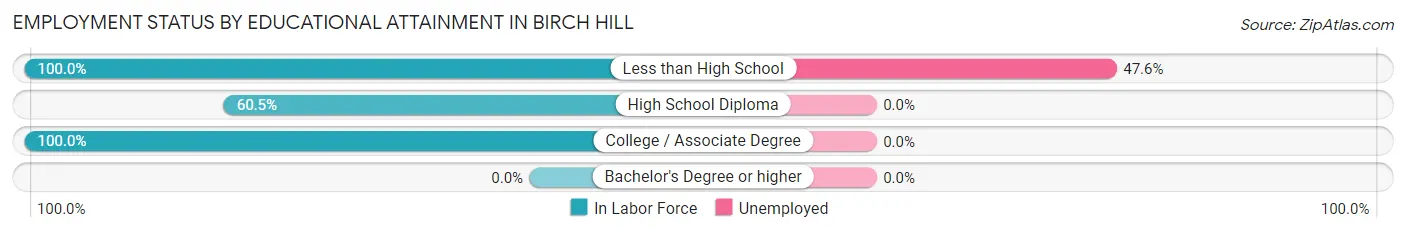
Employment Status by Educational Attainment in Birch Hill
According to labor force statistics for Birch Hill, 92.2% of individuals (178) out of the total population between 25 and 64 years of age (193) are in the labor force, with 5.6% or 10 of them being unemployed. The group with the highest labor force participation rate are those with the educational attainment of less than high school, with 100.0% or 21 individuals in the labor force. Within the labor force, individuals with less than high school education have the highest percentage of unemployment, with 47.6% or 10 of them being unemployed.
| Educational Attainment | In Labor Force | Unemployed |
| Less than High School | 21 (100.0%) | 10 (47.6%) |
| High School Diploma | 23 (60.5%) | 0 (0.0%) |
| College / Associate Degree | 134 (100.0%) | 0 (0.0%) |
| Bachelor's Degree or higher | 0 (0.0%) | 0 (0.0%) |
| Total | 178 (92.2%) | 11 (5.6%) |
Employment Occupations by Sex in Birch Hill
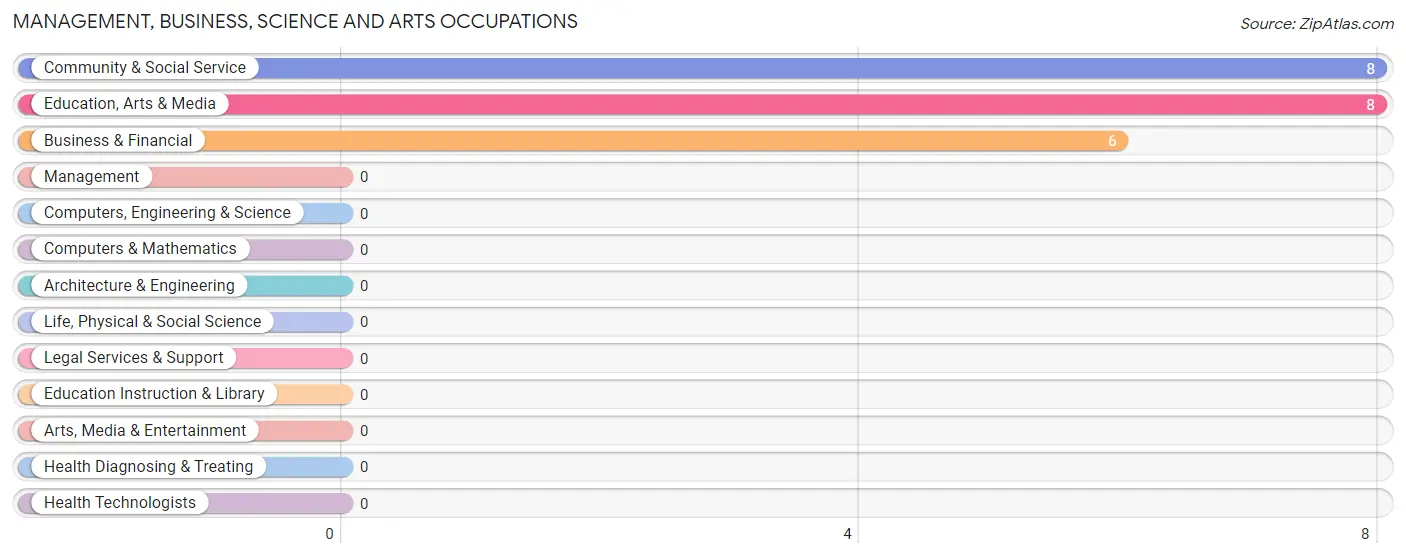
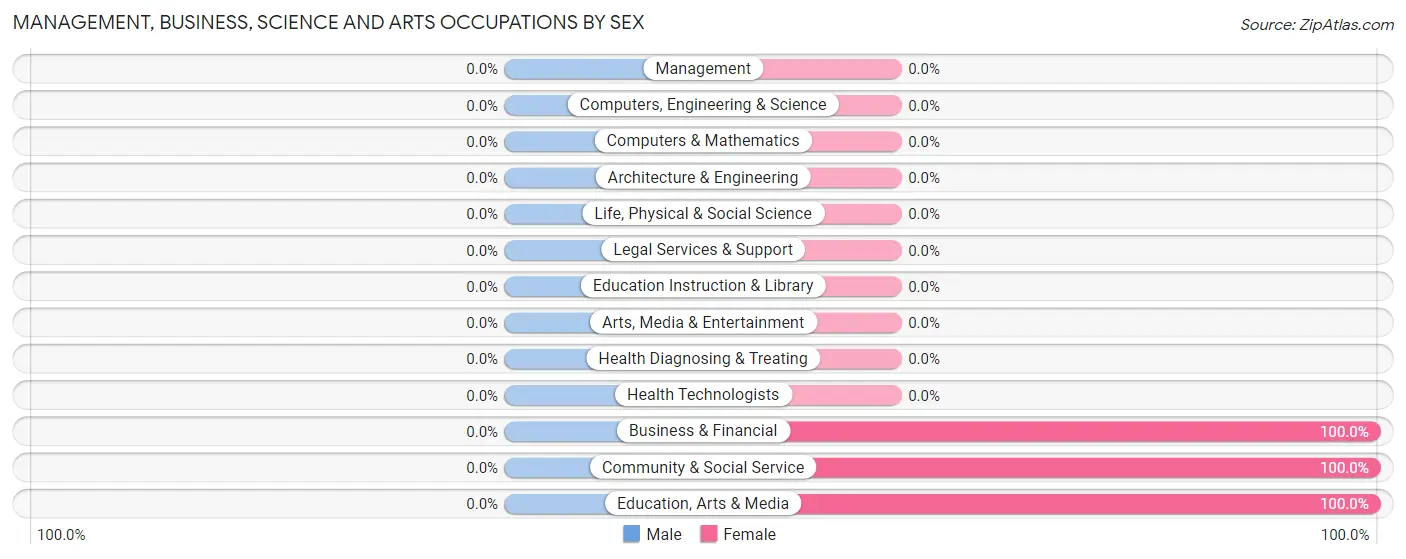
Management, Business, Science and Arts Occupations
The most common Management, Business, Science and Arts occupations in Birch Hill are Community & Social Service (8 | 4.1%), Education, Arts & Media (8 | 4.1%), and Business & Financial (6 | 3.1%).
Management, Business, Science and Arts Occupations by Sex
| Occupation | Male | Female |
| Management | 0 (0.0%) | 0 (0.0%) |
| Business & Financial | 0 (0.0%) | 6 (100.0%) |
| Computers, Engineering & Science | 0 (0.0%) | 0 (0.0%) |
| Computers & Mathematics | 0 (0.0%) | 0 (0.0%) |
| Architecture & Engineering | 0 (0.0%) | 0 (0.0%) |
| Life, Physical & Social Science | 0 (0.0%) | 0 (0.0%) |
| Community & Social Service | 0 (0.0%) | 8 (100.0%) |
| Education, Arts & Media | 0 (0.0%) | 8 (100.0%) |
| Legal Services & Support | 0 (0.0%) | 0 (0.0%) |
| Education Instruction & Library | 0 (0.0%) | 0 (0.0%) |
| Arts, Media & Entertainment | 0 (0.0%) | 0 (0.0%) |
| Health Diagnosing & Treating | 0 (0.0%) | 0 (0.0%) |
| Health Technologists | 0 (0.0%) | 0 (0.0%) |
| Total (Category) | 0 (0.0%) | 14 (100.0%) |
| Total (Overall) | 62 (31.8%) | 133 (68.2%) |
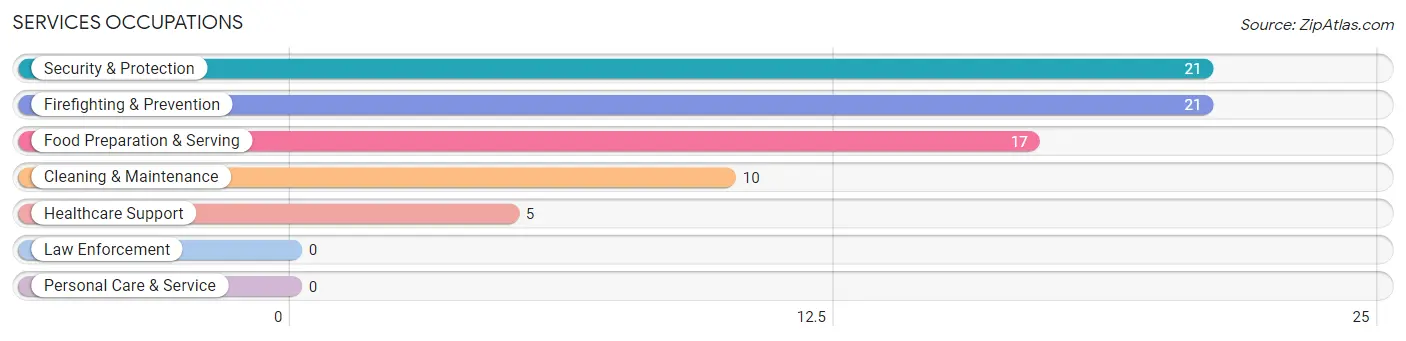
Services Occupations
The most common Services occupations in Birch Hill are Security & Protection (21 | 10.8%), Firefighting & Prevention (21 | 10.8%), Food Preparation & Serving (17 | 8.7%), Cleaning & Maintenance (10 | 5.1%), and Healthcare Support (5 | 2.6%).
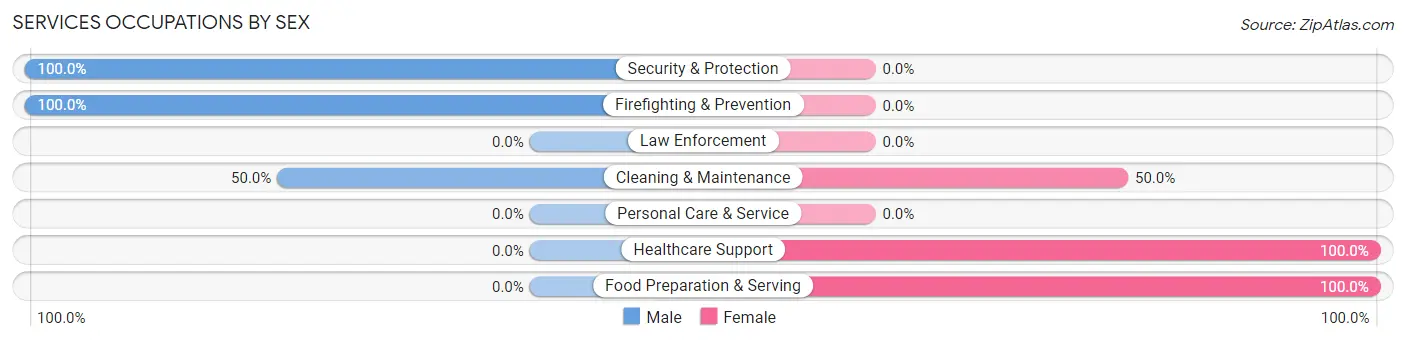
Services Occupations by Sex
Within the Services occupations in Birch Hill, the most male-oriented occupations are Security & Protection (100.0%), Firefighting & Prevention (100.0%), and Cleaning & Maintenance (50.0%), while the most female-oriented occupations are Healthcare Support (100.0%), Food Preparation & Serving (100.0%), and Cleaning & Maintenance (50.0%).
| Occupation | Male | Female |
| Healthcare Support | 0 (0.0%) | 5 (100.0%) |
| Security & Protection | 21 (100.0%) | 0 (0.0%) |
| Firefighting & Prevention | 21 (100.0%) | 0 (0.0%) |
| Law Enforcement | 0 (0.0%) | 0 (0.0%) |
| Food Preparation & Serving | 0 (0.0%) | 17 (100.0%) |
| Cleaning & Maintenance | 5 (50.0%) | 5 (50.0%) |
| Personal Care & Service | 0 (0.0%) | 0 (0.0%) |
| Total (Category) | 26 (49.1%) | 27 (50.9%) |
| Total (Overall) | 62 (31.8%) | 133 (68.2%) |
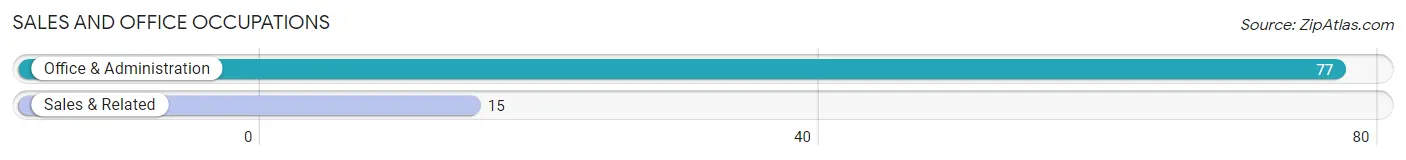
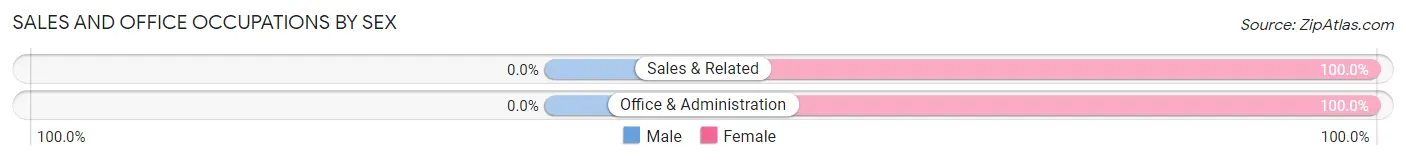
Sales and Office Occupations
The most common Sales and Office occupations in Birch Hill are Office & Administration (77 | 39.5%), and Sales & Related (15 | 7.7%).
Sales and Office Occupations by Sex
| Occupation | Male | Female |
| Sales & Related | 0 (0.0%) | 15 (100.0%) |
| Office & Administration | 0 (0.0%) | 77 (100.0%) |
| Total (Category) | 0 (0.0%) | 92 (100.0%) |
| Total (Overall) | 62 (31.8%) | 133 (68.2%) |
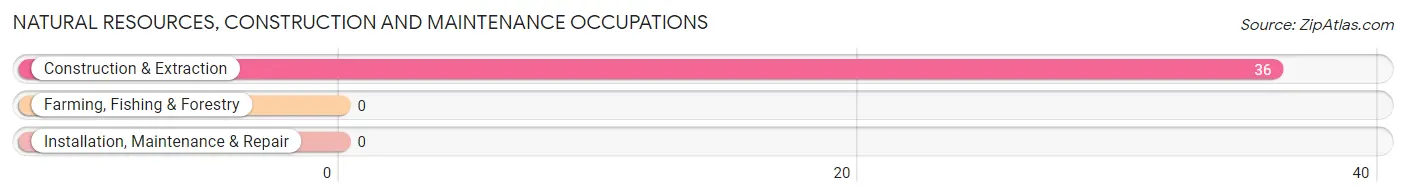
Natural Resources, Construction and Maintenance Occupations
The most common Natural Resources, Construction and Maintenance occupations in Birch Hill are , and Construction & Extraction (36 | 18.5%).
Natural Resources, Construction and Maintenance Occupations by Sex
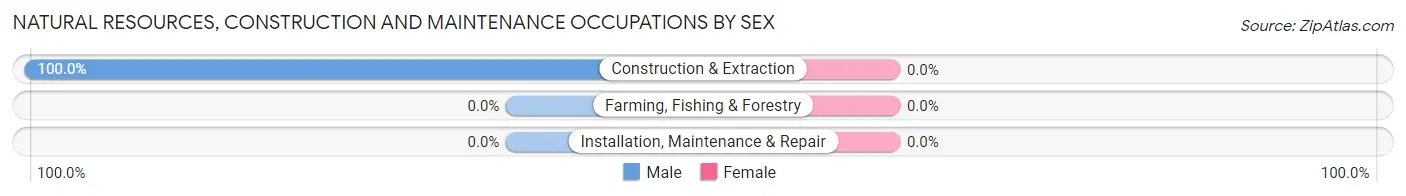
| Occupation | Male | Female |
| Farming, Fishing & Forestry | 0 (0.0%) | 0 (0.0%) |
| Construction & Extraction | 36 (100.0%) | 0 (0.0%) |
| Installation, Maintenance & Repair | 0 (0.0%) | 0 (0.0%) |
| Total (Category) | 36 (100.0%) | 0 (0.0%) |
| Total (Overall) | 62 (31.8%) | 133 (68.2%) |
Production, Transportation and Moving Occupations
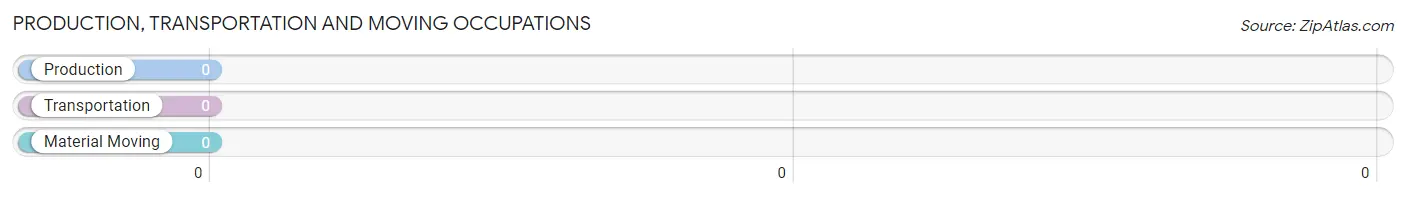
Production, Transportation and Moving Occupations by Sex
| Occupation | Male | Female |
| Production | 0 (0.0%) | 0 (0.0%) |
| Transportation | 0 (0.0%) | 0 (0.0%) |
| Material Moving | 0 (0.0%) | 0 (0.0%) |
| Total (Category) | 0 (0.0%) | 0 (0.0%) |
| Total (Overall) | 62 (31.8%) | 133 (68.2%) |
Employment Industries by Sex in Birch Hill
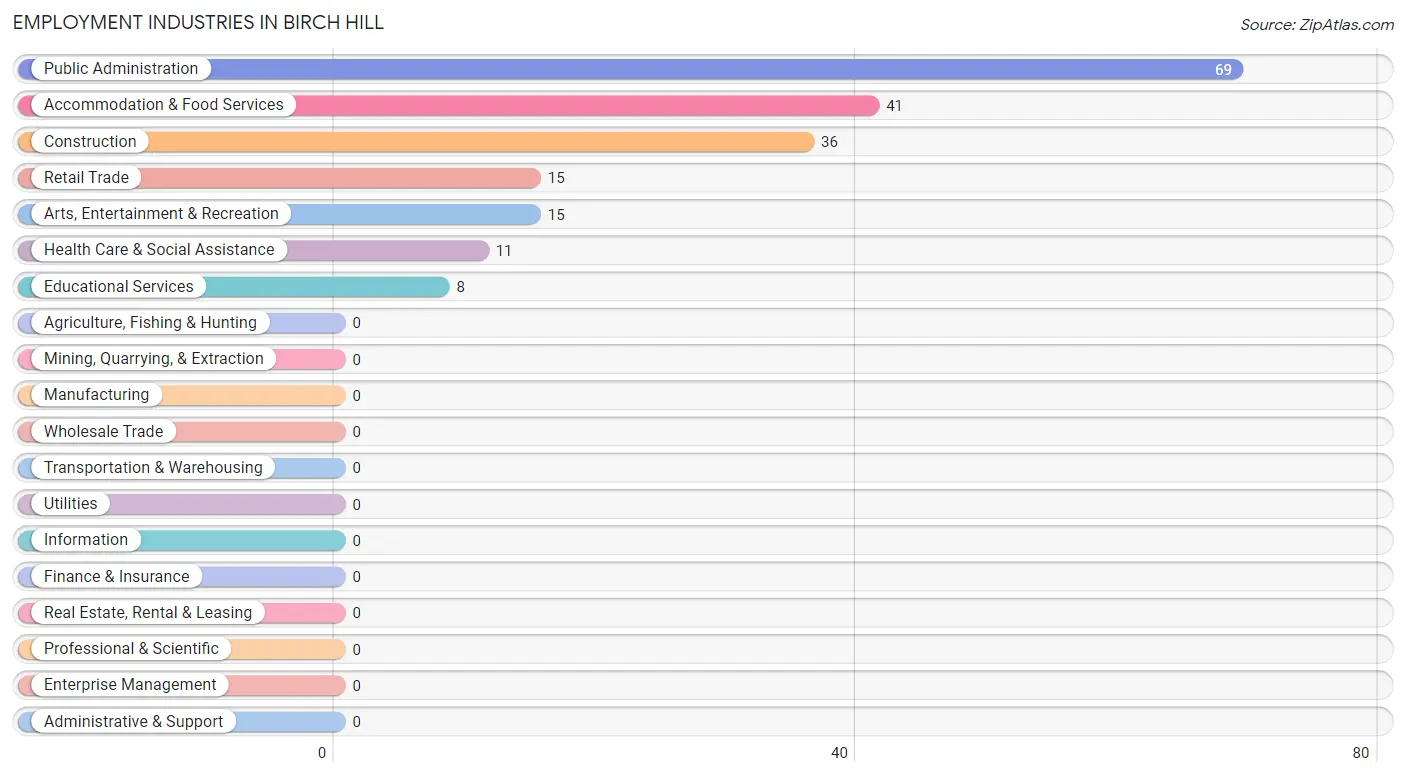
Employment Industries in Birch Hill
The major employment industries in Birch Hill include Public Administration (69 | 35.4%), Accommodation & Food Services (41 | 21.0%), Construction (36 | 18.5%), Retail Trade (15 | 7.7%), and Arts, Entertainment & Recreation (15 | 7.7%).
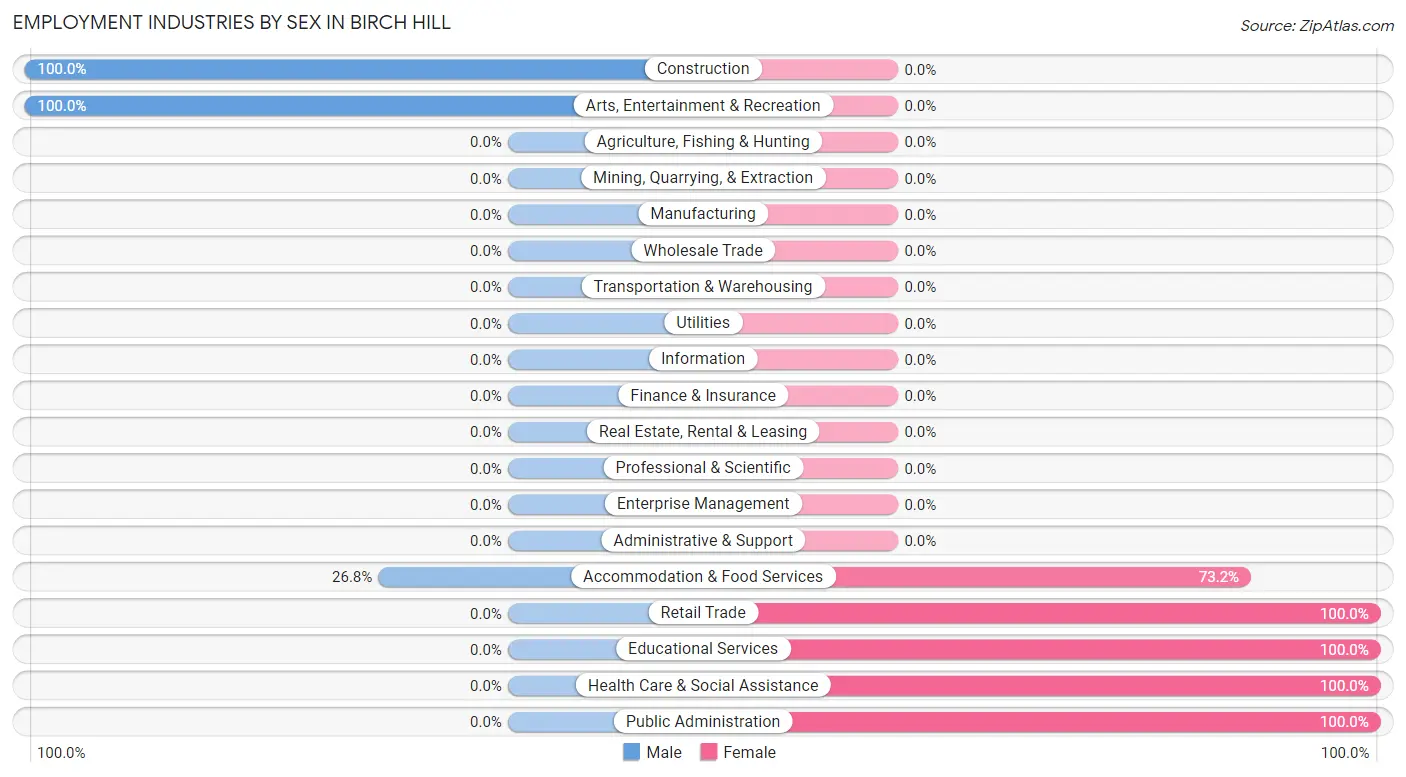
Employment Industries by Sex in Birch Hill
The Birch Hill industries that see more men than women are Construction (100.0%), Arts, Entertainment & Recreation (100.0%), and Accommodation & Food Services (26.8%), whereas the industries that tend to have a higher number of women are Retail Trade (100.0%), Educational Services (100.0%), and Health Care & Social Assistance (100.0%).
| Industry | Male | Female |
| Agriculture, Fishing & Hunting | 0 (0.0%) | 0 (0.0%) |
| Mining, Quarrying, & Extraction | 0 (0.0%) | 0 (0.0%) |
| Construction | 36 (100.0%) | 0 (0.0%) |
| Manufacturing | 0 (0.0%) | 0 (0.0%) |
| Wholesale Trade | 0 (0.0%) | 0 (0.0%) |
| Retail Trade | 0 (0.0%) | 15 (100.0%) |
| Transportation & Warehousing | 0 (0.0%) | 0 (0.0%) |
| Utilities | 0 (0.0%) | 0 (0.0%) |
| Information | 0 (0.0%) | 0 (0.0%) |
| Finance & Insurance | 0 (0.0%) | 0 (0.0%) |
| Real Estate, Rental & Leasing | 0 (0.0%) | 0 (0.0%) |
| Professional & Scientific | 0 (0.0%) | 0 (0.0%) |
| Enterprise Management | 0 (0.0%) | 0 (0.0%) |
| Administrative & Support | 0 (0.0%) | 0 (0.0%) |
| Educational Services | 0 (0.0%) | 8 (100.0%) |
| Health Care & Social Assistance | 0 (0.0%) | 11 (100.0%) |
| Arts, Entertainment & Recreation | 15 (100.0%) | 0 (0.0%) |
| Accommodation & Food Services | 11 (26.8%) | 30 (73.2%) |
| Public Administration | 0 (0.0%) | 69 (100.0%) |
| Total | 62 (31.8%) | 133 (68.2%) |
Education in Birch Hill
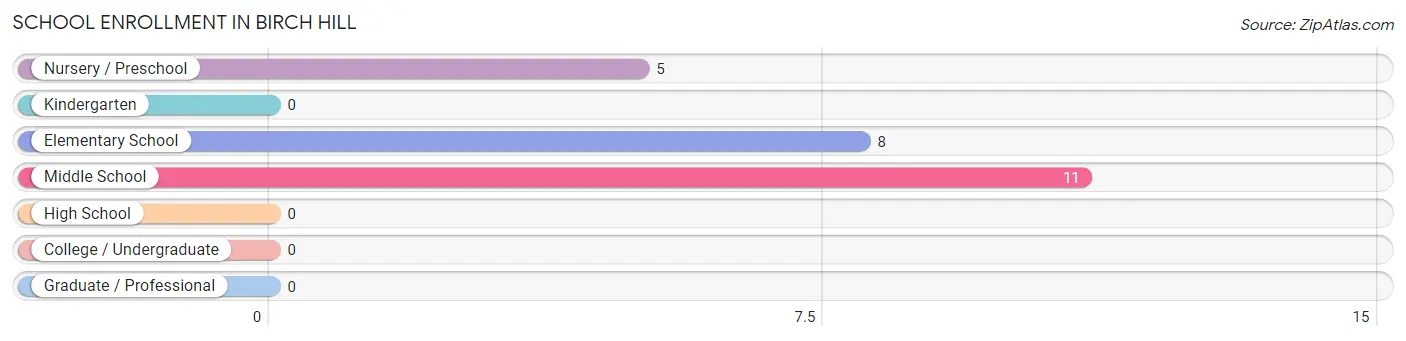
School Enrollment in Birch Hill
The most common levels of schooling among the 24 students in Birch Hill are middle school (11 | 45.8%), elementary school (8 | 33.3%), and nursery / preschool (5 | 20.8%).
| School Level | # Students | % Students |
| Nursery / Preschool | 5 | 20.8% |
| Kindergarten | 0 | 0.0% |
| Elementary School | 8 | 33.3% |
| Middle School | 11 | 45.8% |
| High School | 0 | 0.0% |
| College / Undergraduate | 0 | 0.0% |
| Graduate / Professional | 0 | 0.0% |
| Total | 24 | 100.0% |
School Enrollment by Age by Funding Source in Birch Hill
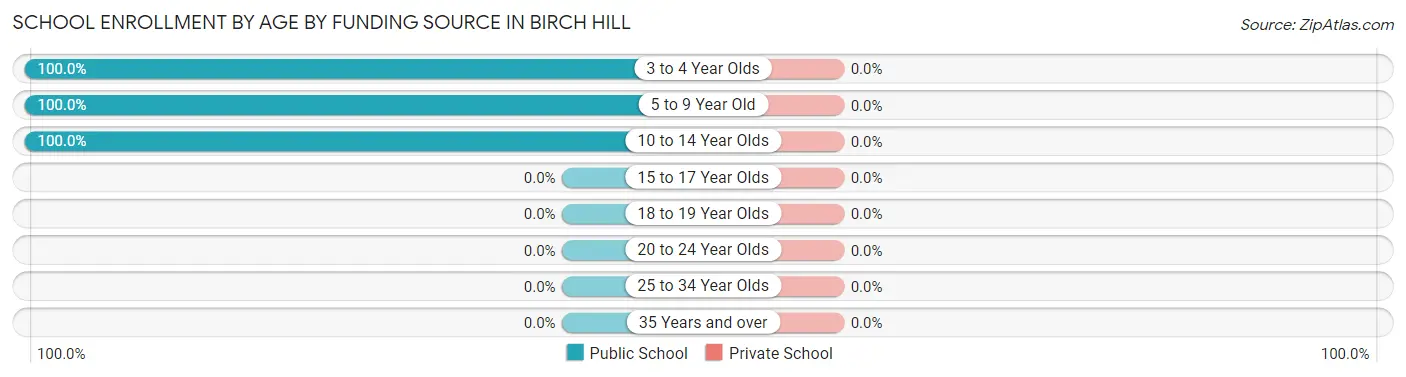
| Age Bracket | Public School | Private School |
| 3 to 4 Year Olds | 5 (100.0%) | 0 (0.0%) |
| 5 to 9 Year Old | 5 (100.0%) | 0 (0.0%) |
| 10 to 14 Year Olds | 14 (100.0%) | 0 (0.0%) |
| 15 to 17 Year Olds | 0 (0.0%) | 0 (0.0%) |
| 18 to 19 Year Olds | 0 (0.0%) | 0 (0.0%) |
| 20 to 24 Year Olds | 0 (0.0%) | 0 (0.0%) |
| 25 to 34 Year Olds | 0 (0.0%) | 0 (0.0%) |
| 35 Years and over | 0 (0.0%) | 0 (0.0%) |
| Total | 24 (100.0%) | 0 (0.0%) |
Educational Attainment by Field of Study in Birch Hill
Physical & health sciences (6 | 40.0%), arts & humanities (5 | 33.3%), and social sciences (4 | 26.7%) are the most common fields of study among 15 individuals in Birch Hill who have obtained a bachelor's degree or higher.
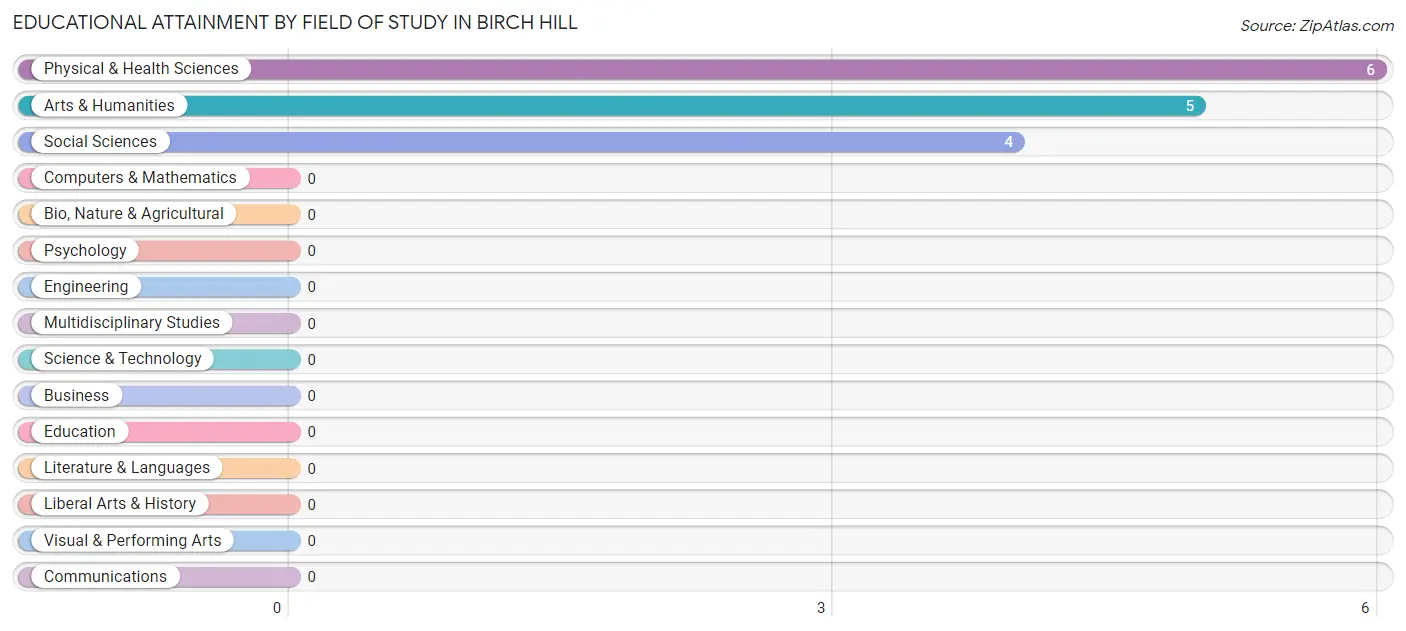
| Field of Study | # Graduates | % Graduates |
| Computers & Mathematics | 0 | 0.0% |
| Bio, Nature & Agricultural | 0 | 0.0% |
| Physical & Health Sciences | 6 | 40.0% |
| Psychology | 0 | 0.0% |
| Social Sciences | 4 | 26.7% |
| Engineering | 0 | 0.0% |
| Multidisciplinary Studies | 0 | 0.0% |
| Science & Technology | 0 | 0.0% |
| Business | 0 | 0.0% |
| Education | 0 | 0.0% |
| Literature & Languages | 0 | 0.0% |
| Liberal Arts & History | 0 | 0.0% |
| Visual & Performing Arts | 0 | 0.0% |
| Communications | 0 | 0.0% |
| Arts & Humanities | 5 | 33.3% |
| Total | 15 | 100.0% |
Transportation & Commute in Birch Hill
Vehicle Availability by Sex in Birch Hill
The most prevalent vehicle ownership categories in Birch Hill are males with 2 vehicles (36, accounting for 58.1%) and females with 2 vehicles (19, making up 27.1%).
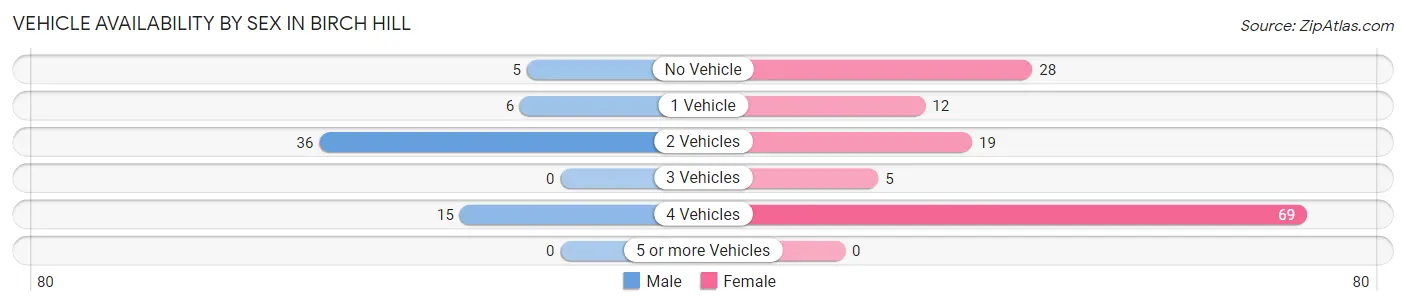
| Vehicles Available | Male | Female |
| No Vehicle | 5 (8.1%) | 28 (21.0%) |
| 1 Vehicle | 6 (9.7%) | 12 (9.0%) |
| 2 Vehicles | 36 (58.1%) | 19 (14.3%) |
| 3 Vehicles | 0 (0.0%) | 5 (3.8%) |
| 4 Vehicles | 15 (24.2%) | 69 (51.9%) |
| 5 or more Vehicles | 0 (0.0%) | 0 (0.0%) |
| Total | 62 (100.0%) | 133 (100.0%) |
Commute Time in Birch Hill
The most frequently occuring commute durations in Birch Hill are 10 to 14 minutes (111 commuters, 58.1%), 20 to 24 minutes (41 commuters, 21.5%), and 15 to 19 minutes (20 commuters, 10.5%).
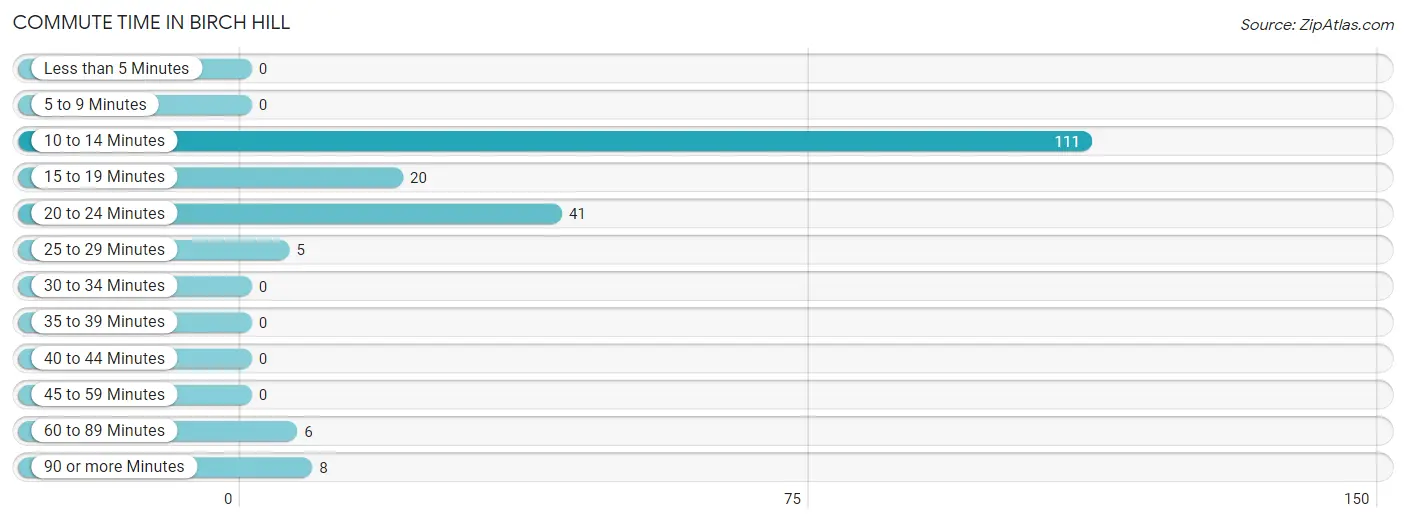
| Commute Time | # Commuters | % Commuters |
| Less than 5 Minutes | 0 | 0.0% |
| 5 to 9 Minutes | 0 | 0.0% |
| 10 to 14 Minutes | 111 | 58.1% |
| 15 to 19 Minutes | 20 | 10.5% |
| 20 to 24 Minutes | 41 | 21.5% |
| 25 to 29 Minutes | 5 | 2.6% |
| 30 to 34 Minutes | 0 | 0.0% |
| 35 to 39 Minutes | 0 | 0.0% |
| 40 to 44 Minutes | 0 | 0.0% |
| 45 to 59 Minutes | 0 | 0.0% |
| 60 to 89 Minutes | 6 | 3.1% |
| 90 or more Minutes | 8 | 4.2% |
Commute Time by Sex in Birch Hill
The most common commute times in Birch Hill are 10 to 14 minutes (31 commuters, 50.0%) for males and 10 to 14 minutes (80 commuters, 62.0%) for females.
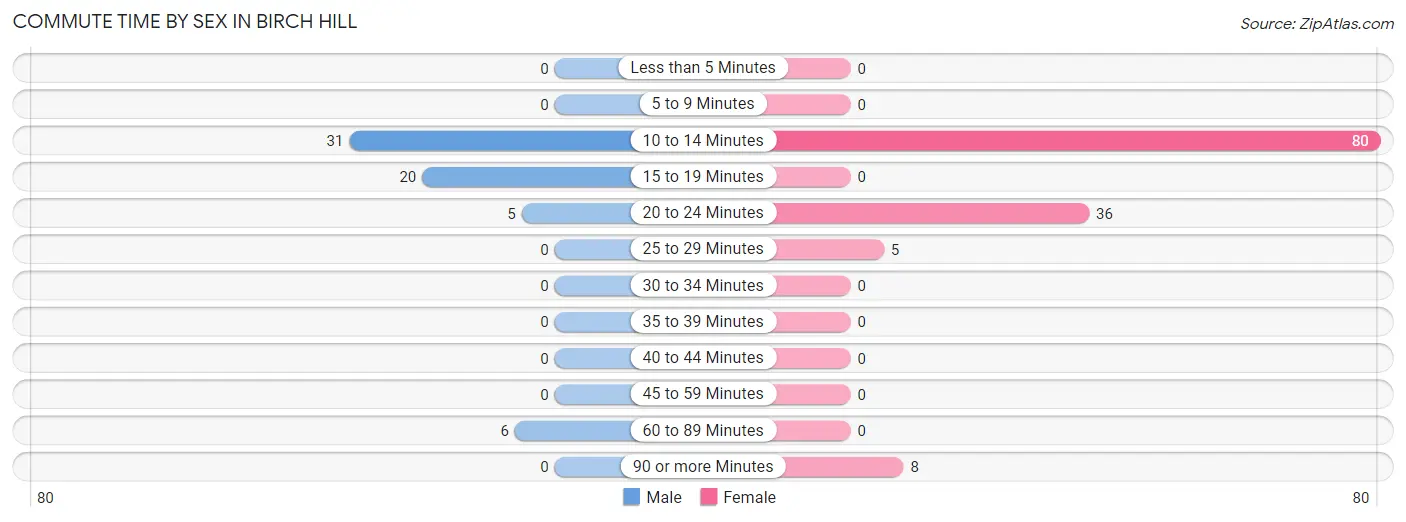
| Commute Time | Male | Female |
| Less than 5 Minutes | 0 (0.0%) | 0 (0.0%) |
| 5 to 9 Minutes | 0 (0.0%) | 0 (0.0%) |
| 10 to 14 Minutes | 31 (50.0%) | 80 (62.0%) |
| 15 to 19 Minutes | 20 (32.3%) | 0 (0.0%) |
| 20 to 24 Minutes | 5 (8.1%) | 36 (27.9%) |
| 25 to 29 Minutes | 0 (0.0%) | 5 (3.9%) |
| 30 to 34 Minutes | 0 (0.0%) | 0 (0.0%) |
| 35 to 39 Minutes | 0 (0.0%) | 0 (0.0%) |
| 40 to 44 Minutes | 0 (0.0%) | 0 (0.0%) |
| 45 to 59 Minutes | 0 (0.0%) | 0 (0.0%) |
| 60 to 89 Minutes | 6 (9.7%) | 0 (0.0%) |
| 90 or more Minutes | 0 (0.0%) | 8 (6.2%) |
Time of Departure to Work by Sex in Birch Hill
The most frequent times of departure to work in Birch Hill are 5:30 AM to 5:59 AM (31, 50.0%) for males and 7:30 AM to 7:59 AM (88, 68.2%) for females.
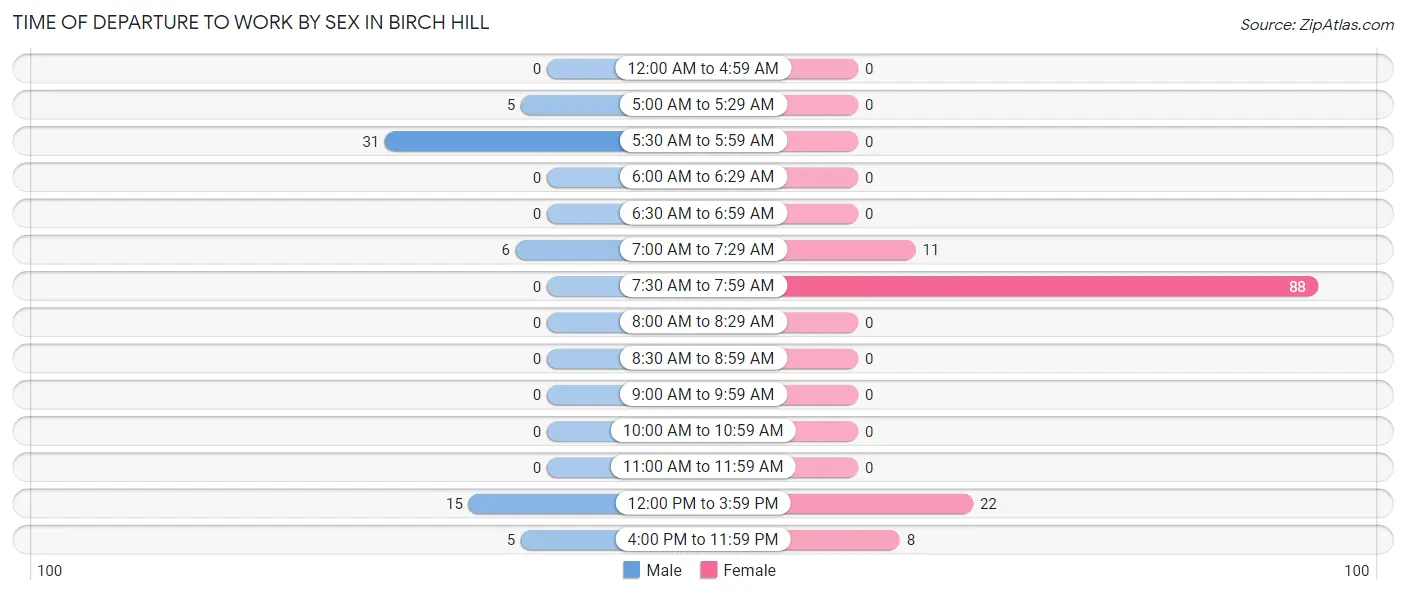
| Time of Departure | Male | Female |
| 12:00 AM to 4:59 AM | 0 (0.0%) | 0 (0.0%) |
| 5:00 AM to 5:29 AM | 5 (8.1%) | 0 (0.0%) |
| 5:30 AM to 5:59 AM | 31 (50.0%) | 0 (0.0%) |
| 6:00 AM to 6:29 AM | 0 (0.0%) | 0 (0.0%) |
| 6:30 AM to 6:59 AM | 0 (0.0%) | 0 (0.0%) |
| 7:00 AM to 7:29 AM | 6 (9.7%) | 11 (8.5%) |
| 7:30 AM to 7:59 AM | 0 (0.0%) | 88 (68.2%) |
| 8:00 AM to 8:29 AM | 0 (0.0%) | 0 (0.0%) |
| 8:30 AM to 8:59 AM | 0 (0.0%) | 0 (0.0%) |
| 9:00 AM to 9:59 AM | 0 (0.0%) | 0 (0.0%) |
| 10:00 AM to 10:59 AM | 0 (0.0%) | 0 (0.0%) |
| 11:00 AM to 11:59 AM | 0 (0.0%) | 0 (0.0%) |
| 12:00 PM to 3:59 PM | 15 (24.2%) | 22 (17.1%) |
| 4:00 PM to 11:59 PM | 5 (8.1%) | 8 (6.2%) |
| Total | 62 (100.0%) | 129 (100.0%) |
Housing Occupancy in Birch Hill
Occupancy by Ownership in Birch Hill
Of the total 119 dwellings in Birch Hill, owner-occupied units account for 36 (30.2%), while renter-occupied units make up 83 (69.8%).
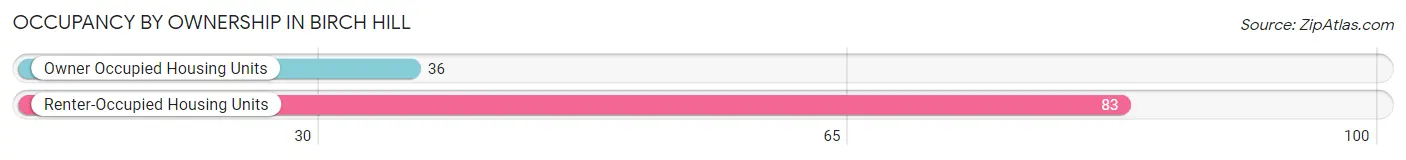
| Occupancy | # Housing Units | % Housing Units |
| Owner Occupied Housing Units | 36 | 30.2% |
| Renter-Occupied Housing Units | 83 | 69.8% |
| Total Occupied Housing Units | 119 | 100.0% |
Occupancy by Household Size in Birch Hill
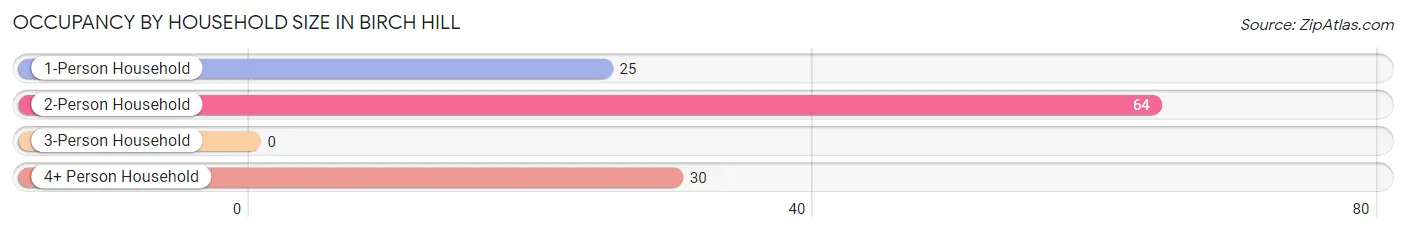
| Household Size | # Housing Units | % Housing Units |
| 1-Person Household | 25 | 21.0% |
| 2-Person Household | 64 | 53.8% |
| 3-Person Household | 0 | 0.0% |
| 4+ Person Household | 30 | 25.2% |
| Total Housing Units | 119 | 100.0% |
Occupancy by Ownership by Household Size in Birch Hill
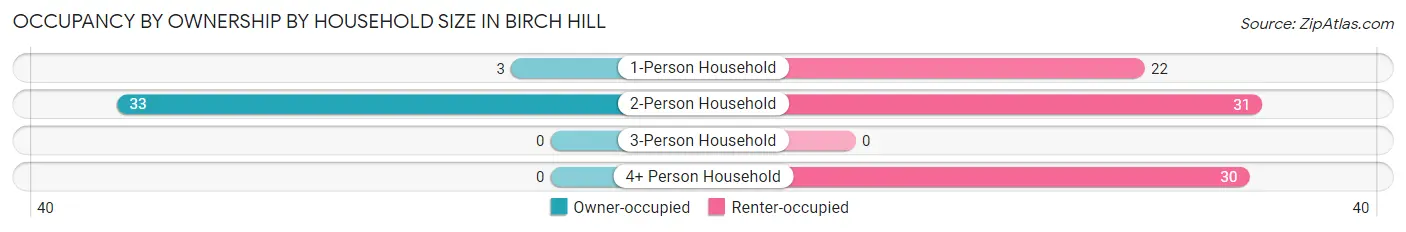
| Household Size | Owner-occupied | Renter-occupied |
| 1-Person Household | 3 (12.0%) | 22 (88.0%) |
| 2-Person Household | 33 (51.6%) | 31 (48.4%) |
| 3-Person Household | 0 (0.0%) | 0 (0.0%) |
| 4+ Person Household | 0 (0.0%) | 30 (100.0%) |
| Total Housing Units | 36 (30.2%) | 83 (69.8%) |
Occupancy by Educational Attainment in Birch Hill
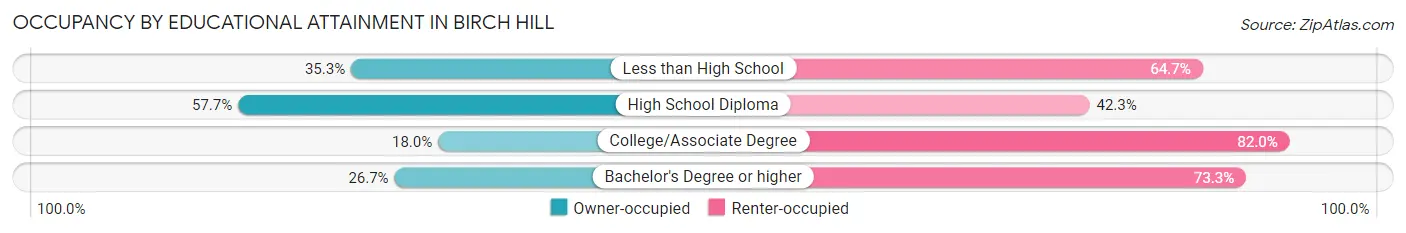
| Household Size | Owner-occupied | Renter-occupied |
| Less than High School | 6 (35.3%) | 11 (64.7%) |
| High School Diploma | 15 (57.7%) | 11 (42.3%) |
| College/Associate Degree | 11 (18.0%) | 50 (82.0%) |
| Bachelor's Degree or higher | 4 (26.7%) | 11 (73.3%) |
Occupancy by Age of Householder in Birch Hill
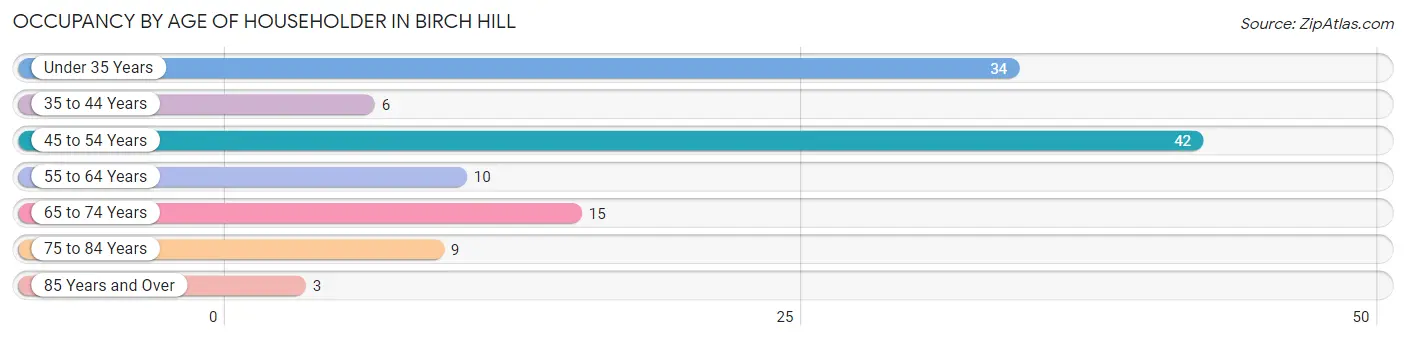
| Age Bracket | # Households | % Households |
| Under 35 Years | 34 | 28.6% |
| 35 to 44 Years | 6 | 5.0% |
| 45 to 54 Years | 42 | 35.3% |
| 55 to 64 Years | 10 | 8.4% |
| 65 to 74 Years | 15 | 12.6% |
| 75 to 84 Years | 9 | 7.6% |
| 85 Years and Over | 3 | 2.5% |
| Total | 119 | 100.0% |
Housing Finances in Birch Hill
Median Income by Occupancy in Birch Hill
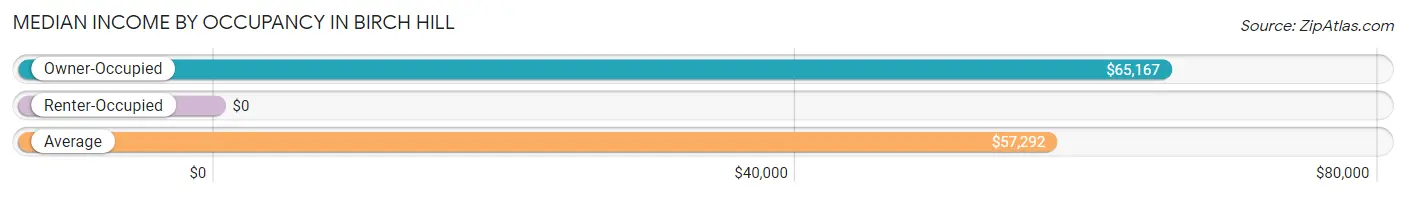
| Occupancy Type | # Households | Median Income |
| Owner-Occupied | 36 (30.2%) | $65,167 |
| Renter-Occupied | 83 (69.8%) | $0 |
| Average | 119 (100.0%) | $57,292 |
Occupancy by Householder Income Bracket in Birch Hill
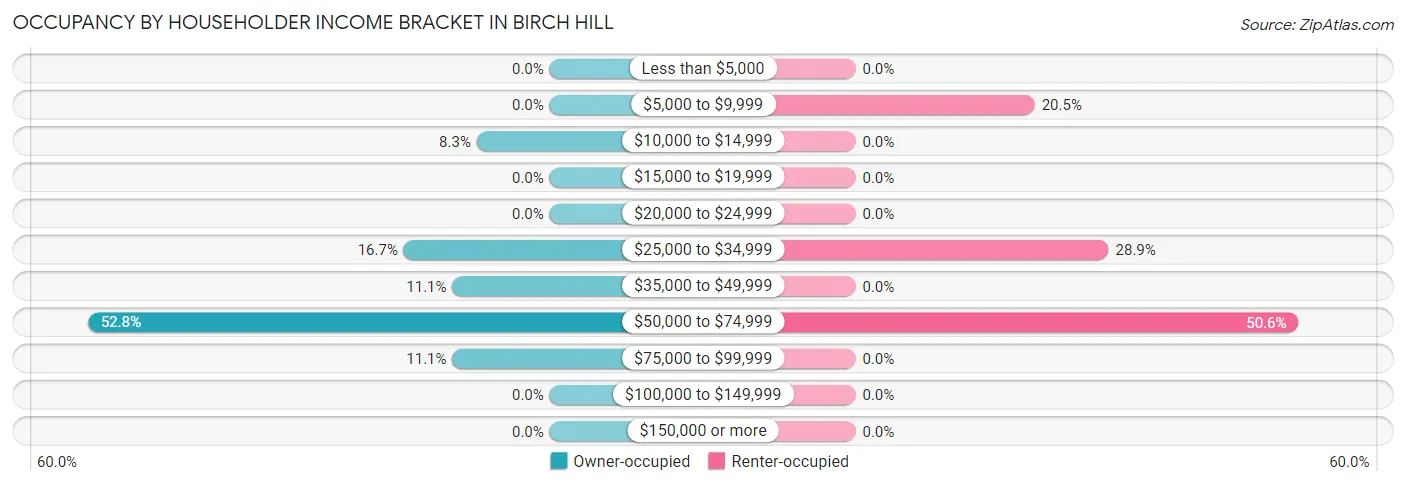
| Income Bracket | Owner-occupied | Renter-occupied |
| Less than $5,000 | 0 (0.0%) | 0 (0.0%) |
| $5,000 to $9,999 | 0 (0.0%) | 17 (20.5%) |
| $10,000 to $14,999 | 3 (8.3%) | 0 (0.0%) |
| $15,000 to $19,999 | 0 (0.0%) | 0 (0.0%) |
| $20,000 to $24,999 | 0 (0.0%) | 0 (0.0%) |
| $25,000 to $34,999 | 6 (16.7%) | 24 (28.9%) |
| $35,000 to $49,999 | 4 (11.1%) | 0 (0.0%) |
| $50,000 to $74,999 | 19 (52.8%) | 42 (50.6%) |
| $75,000 to $99,999 | 4 (11.1%) | 0 (0.0%) |
| $100,000 to $149,999 | 0 (0.0%) | 0 (0.0%) |
| $150,000 or more | 0 (0.0%) | 0 (0.0%) |
| Total | 36 (100.0%) | 83 (100.0%) |
Monthly Housing Cost Tiers in Birch Hill
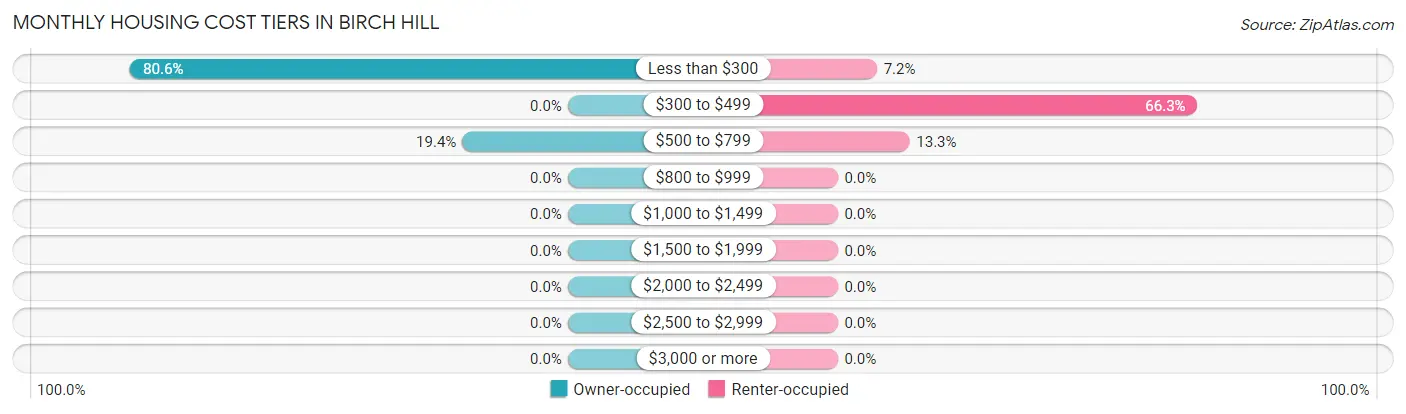
| Monthly Cost | Owner-occupied | Renter-occupied |
| Less than $300 | 29 (80.6%) | 6 (7.2%) |
| $300 to $499 | 0 (0.0%) | 55 (66.3%) |
| $500 to $799 | 7 (19.4%) | 11 (13.3%) |
| $800 to $999 | 0 (0.0%) | 0 (0.0%) |
| $1,000 to $1,499 | 0 (0.0%) | 0 (0.0%) |
| $1,500 to $1,999 | 0 (0.0%) | 0 (0.0%) |
| $2,000 to $2,499 | 0 (0.0%) | 0 (0.0%) |
| $2,500 to $2,999 | 0 (0.0%) | 0 (0.0%) |
| $3,000 or more | 0 (0.0%) | 0 (0.0%) |
| Total | 36 (100.0%) | 83 (100.0%) |
Physical Housing Characteristics in Birch Hill
Housing Structures in Birch Hill
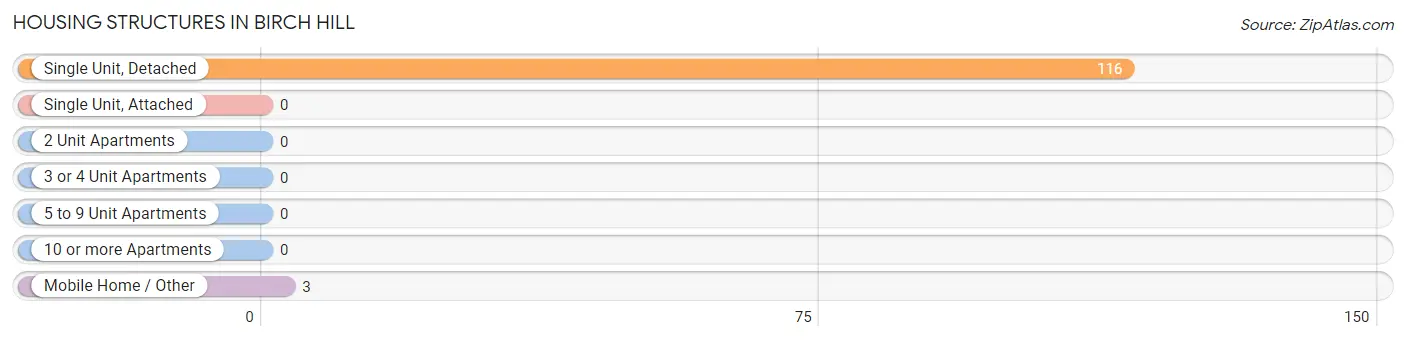
| Structure Type | # Housing Units | % Housing Units |
| Single Unit, Detached | 116 | 97.5% |
| Single Unit, Attached | 0 | 0.0% |
| 2 Unit Apartments | 0 | 0.0% |
| 3 or 4 Unit Apartments | 0 | 0.0% |
| 5 to 9 Unit Apartments | 0 | 0.0% |
| 10 or more Apartments | 0 | 0.0% |
| Mobile Home / Other | 3 | 2.5% |
| Total | 119 | 100.0% |
Housing Structures by Occupancy in Birch Hill
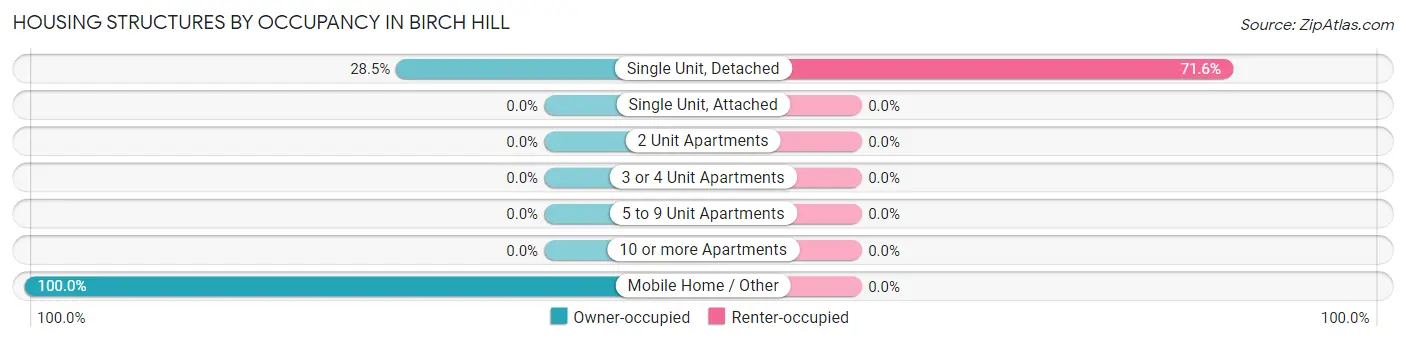
| Structure Type | Owner-occupied | Renter-occupied |
| Single Unit, Detached | 33 (28.4%) | 83 (71.6%) |
| Single Unit, Attached | 0 (0.0%) | 0 (0.0%) |
| 2 Unit Apartments | 0 (0.0%) | 0 (0.0%) |
| 3 or 4 Unit Apartments | 0 (0.0%) | 0 (0.0%) |
| 5 to 9 Unit Apartments | 0 (0.0%) | 0 (0.0%) |
| 10 or more Apartments | 0 (0.0%) | 0 (0.0%) |
| Mobile Home / Other | 3 (100.0%) | 0 (0.0%) |
| Total | 36 (30.2%) | 83 (69.8%) |
Housing Structures by Number of Rooms in Birch Hill
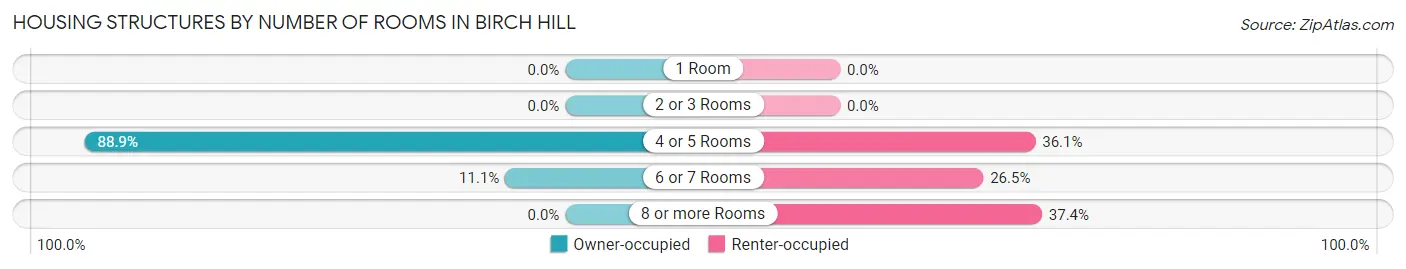
| Number of Rooms | Owner-occupied | Renter-occupied |
| 1 Room | 0 (0.0%) | 0 (0.0%) |
| 2 or 3 Rooms | 0 (0.0%) | 0 (0.0%) |
| 4 or 5 Rooms | 32 (88.9%) | 30 (36.1%) |
| 6 or 7 Rooms | 4 (11.1%) | 22 (26.5%) |
| 8 or more Rooms | 0 (0.0%) | 31 (37.3%) |
| Total | 36 (100.0%) | 83 (100.0%) |
Housing Structure by Heating Type in Birch Hill
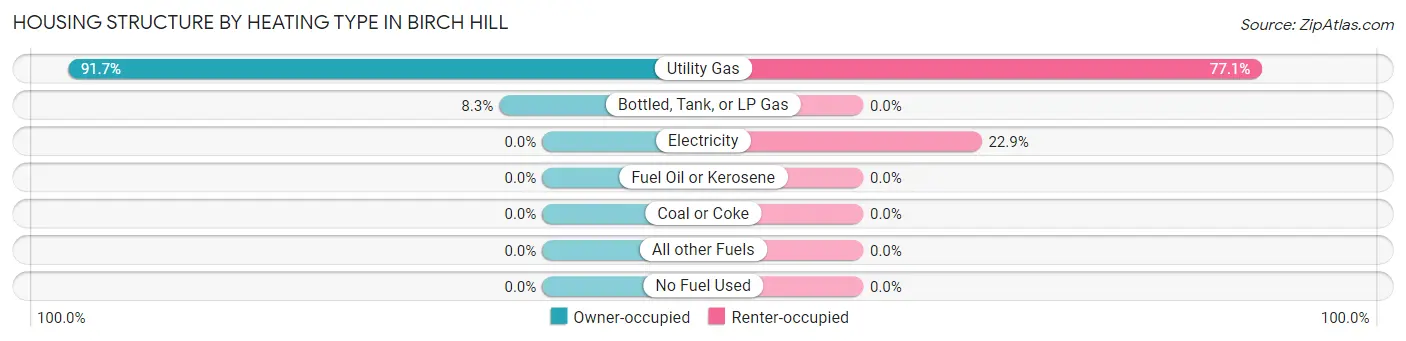
| Heating Type | Owner-occupied | Renter-occupied |
| Utility Gas | 33 (91.7%) | 64 (77.1%) |
| Bottled, Tank, or LP Gas | 3 (8.3%) | 0 (0.0%) |
| Electricity | 0 (0.0%) | 19 (22.9%) |
| Fuel Oil or Kerosene | 0 (0.0%) | 0 (0.0%) |
| Coal or Coke | 0 (0.0%) | 0 (0.0%) |
| All other Fuels | 0 (0.0%) | 0 (0.0%) |
| No Fuel Used | 0 (0.0%) | 0 (0.0%) |
| Total | 36 (100.0%) | 83 (100.0%) |
Household Vehicle Usage in Birch Hill
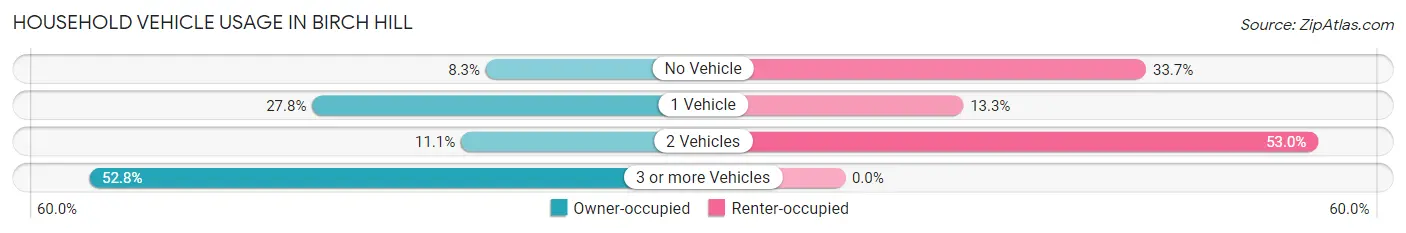
| Vehicles per Household | Owner-occupied | Renter-occupied |
| No Vehicle | 3 (8.3%) | 28 (33.7%) |
| 1 Vehicle | 10 (27.8%) | 11 (13.3%) |
| 2 Vehicles | 4 (11.1%) | 44 (53.0%) |
| 3 or more Vehicles | 19 (52.8%) | 0 (0.0%) |
| Total | 36 (100.0%) | 83 (100.0%) |
Real Estate & Mortgages in Birch Hill
Real Estate and Mortgage Overview in Birch Hill
| Characteristic | Without Mortgage | With Mortgage |
| Housing Units | 33 | 3 |
| Median Property Value | $54,300 | $0 |
| Median Household Income | $65,417 | $0 |
| Monthly Housing Costs | $205 | $0 |
| Real Estate Taxes | - | - |
Property Value by Mortgage Status in Birch Hill
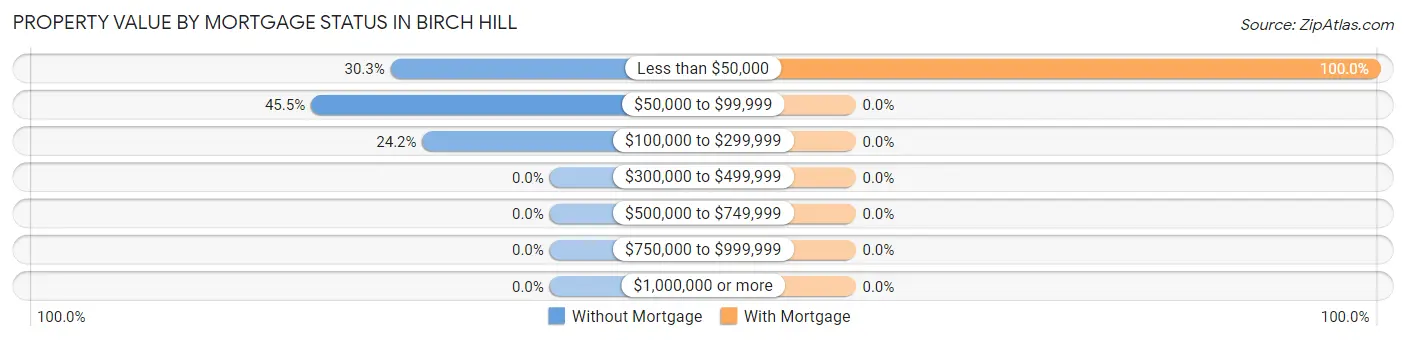
| Property Value | Without Mortgage | With Mortgage |
| Less than $50,000 | 10 (30.3%) | 3 (100.0%) |
| $50,000 to $99,999 | 15 (45.5%) | 0 (0.0%) |
| $100,000 to $299,999 | 8 (24.2%) | 0 (0.0%) |
| $300,000 to $499,999 | 0 (0.0%) | 0 (0.0%) |
| $500,000 to $749,999 | 0 (0.0%) | 0 (0.0%) |
| $750,000 to $999,999 | 0 (0.0%) | 0 (0.0%) |
| $1,000,000 or more | 0 (0.0%) | 0 (0.0%) |
| Total | 33 (100.0%) | 3 (100.0%) |
Household Income by Mortgage Status in Birch Hill
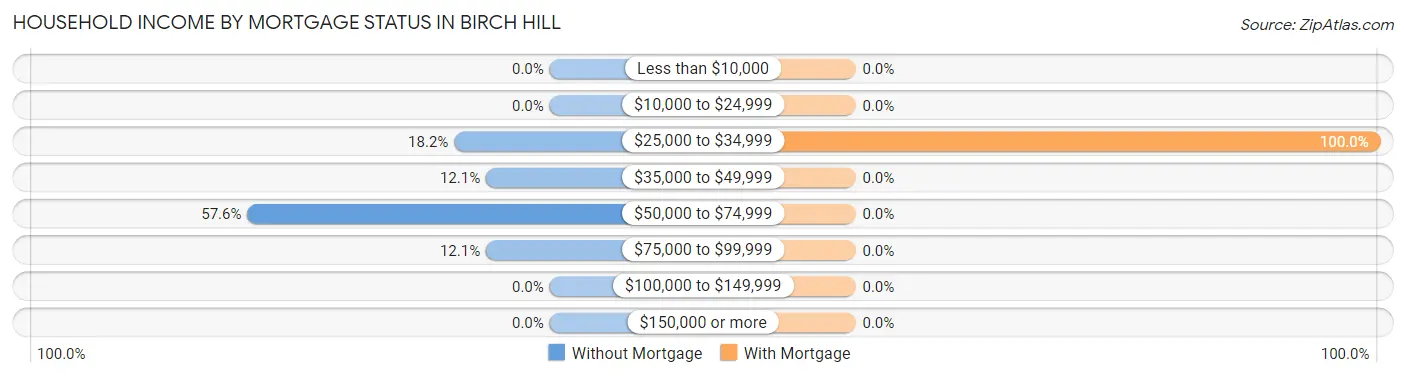
| Household Income | Without Mortgage | With Mortgage |
| Less than $10,000 | 0 (0.0%) | 0 (0.0%) |
| $10,000 to $24,999 | 0 (0.0%) | 0 (0.0%) |
| $25,000 to $34,999 | 6 (18.2%) | 3 (100.0%) |
| $35,000 to $49,999 | 4 (12.1%) | 0 (0.0%) |
| $50,000 to $74,999 | 19 (57.6%) | 0 (0.0%) |
| $75,000 to $99,999 | 4 (12.1%) | 0 (0.0%) |
| $100,000 to $149,999 | 0 (0.0%) | 0 (0.0%) |
| $150,000 or more | 0 (0.0%) | 0 (0.0%) |
| Total | 33 (100.0%) | 3 (100.0%) |
Property Value to Household Income Ratio in Birch Hill
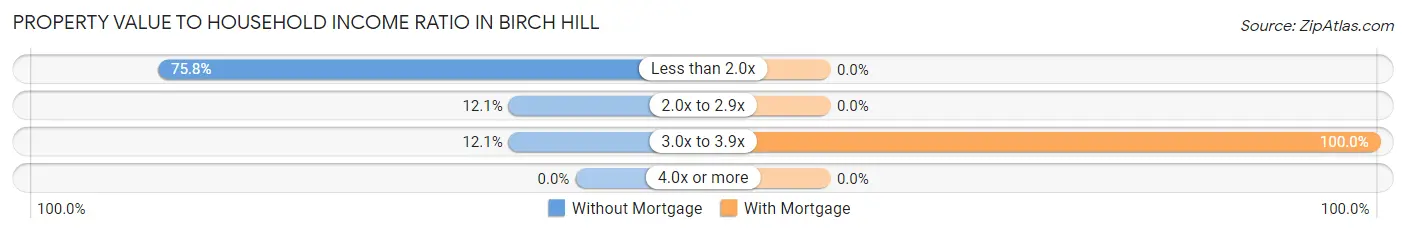
| Value-to-Income Ratio | Without Mortgage | With Mortgage |
| Less than 2.0x | 25 (75.8%) | 0 (0.0%) |
| 2.0x to 2.9x | 4 (12.1%) | 0 (0.0%) |
| 3.0x to 3.9x | 4 (12.1%) | 3 (100.0%) |
| 4.0x or more | 0 (0.0%) | 0 (0.0%) |
| Total | 33 (100.0%) | 3 (100.0%) |
Real Estate Taxes by Mortgage Status in Birch Hill
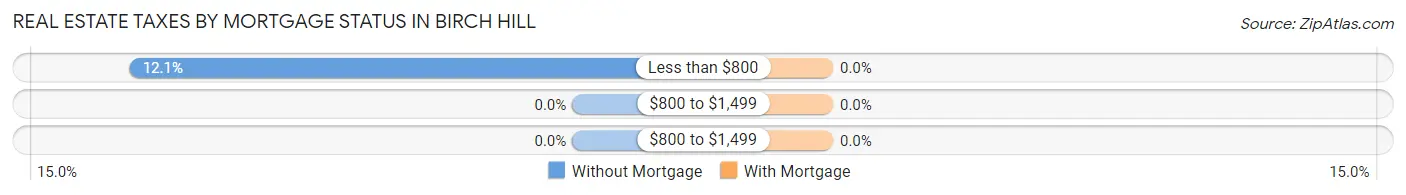
| Property Taxes | Without Mortgage | With Mortgage |
| Less than $800 | 4 (12.1%) | 0 (0.0%) |
| $800 to $1,499 | 0 (0.0%) | 0 (0.0%) |
| $800 to $1,499 | 0 (0.0%) | 0 (0.0%) |
| Total | 33 (100.0%) | 3 (100.0%) |
Health & Disability in Birch Hill
Health Insurance Coverage by Age in Birch Hill
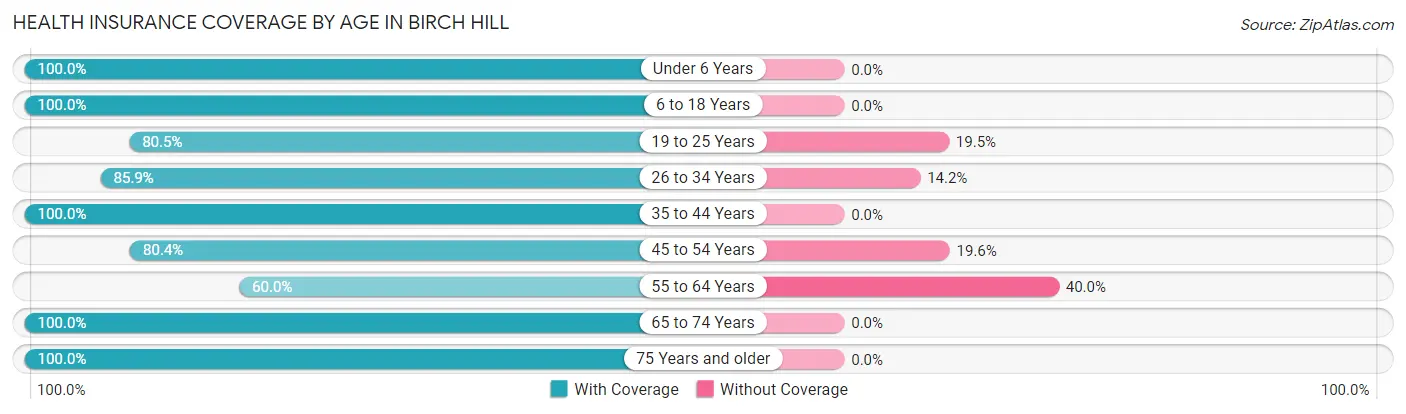
| Age Bracket | With Coverage | Without Coverage |
| Under 6 Years | 30 (100.0%) | 0 (0.0%) |
| 6 to 18 Years | 19 (100.0%) | 0 (0.0%) |
| 19 to 25 Years | 33 (80.5%) | 8 (19.5%) |
| 26 to 34 Years | 91 (85.9%) | 15 (14.1%) |
| 35 to 44 Years | 16 (100.0%) | 0 (0.0%) |
| 45 to 54 Years | 45 (80.4%) | 11 (19.6%) |
| 55 to 64 Years | 9 (60.0%) | 6 (40.0%) |
| 65 to 74 Years | 23 (100.0%) | 0 (0.0%) |
| 75 Years and older | 12 (100.0%) | 0 (0.0%) |
| Total | 278 (87.4%) | 40 (12.6%) |
Health Insurance Coverage by Citizenship Status in Birch Hill
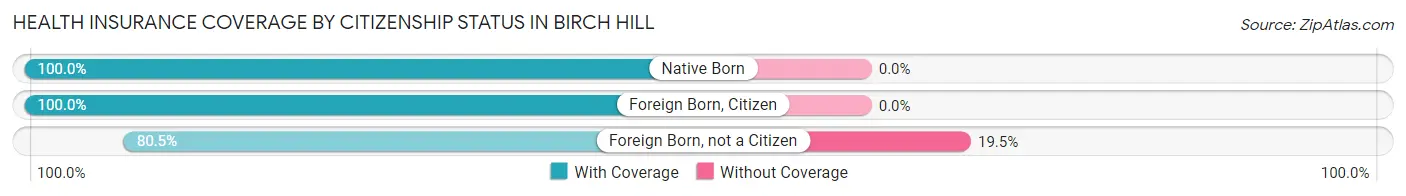
| Citizenship Status | With Coverage | Without Coverage |
| Native Born | 30 (100.0%) | 0 (0.0%) |
| Foreign Born, Citizen | 19 (100.0%) | 0 (0.0%) |
| Foreign Born, not a Citizen | 33 (80.5%) | 8 (19.5%) |
Health Insurance Coverage by Household Income in Birch Hill
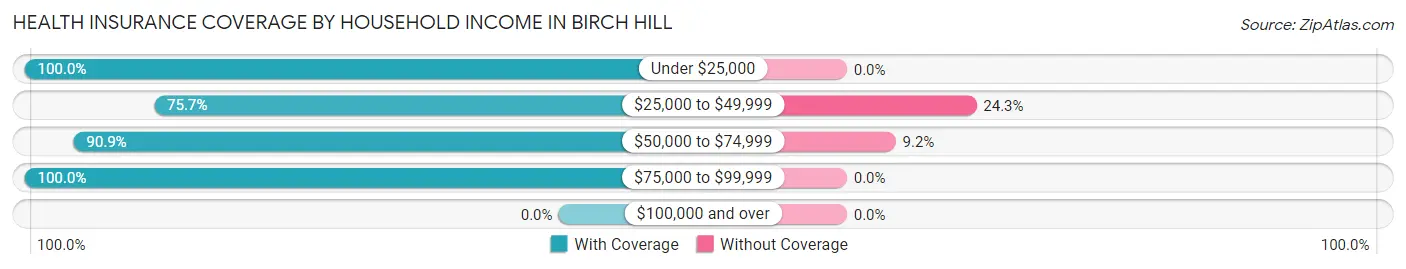
| Household Income | With Coverage | Without Coverage |
| Under $25,000 | 43 (100.0%) | 0 (0.0%) |
| $25,000 to $49,999 | 78 (75.7%) | 25 (24.3%) |
| $50,000 to $74,999 | 149 (90.8%) | 15 (9.1%) |
| $75,000 to $99,999 | 8 (100.0%) | 0 (0.0%) |
| $100,000 and over | 0 (0.0%) | 0 (0.0%) |
Public vs Private Health Insurance Coverage by Age in Birch Hill
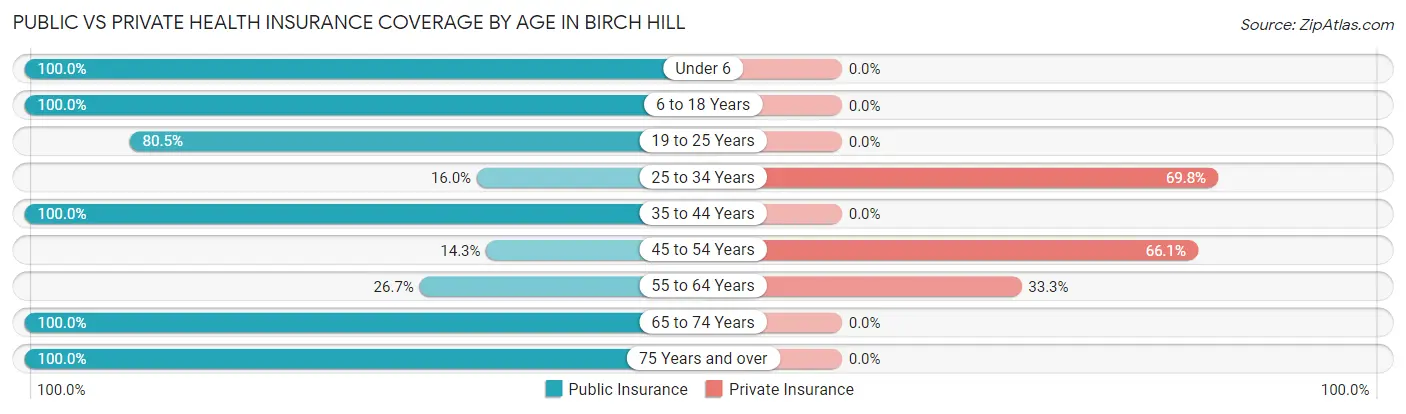
| Age Bracket | Public Insurance | Private Insurance |
| Under 6 | 30 (100.0%) | 0 (0.0%) |
| 6 to 18 Years | 19 (100.0%) | 0 (0.0%) |
| 19 to 25 Years | 33 (80.5%) | 0 (0.0%) |
| 25 to 34 Years | 17 (16.0%) | 74 (69.8%) |
| 35 to 44 Years | 16 (100.0%) | 0 (0.0%) |
| 45 to 54 Years | 8 (14.3%) | 37 (66.1%) |
| 55 to 64 Years | 4 (26.7%) | 5 (33.3%) |
| 65 to 74 Years | 23 (100.0%) | 0 (0.0%) |
| 75 Years and over | 12 (100.0%) | 0 (0.0%) |
| Total | 162 (50.9%) | 116 (36.5%) |
Disability Status by Sex by Age in Birch Hill
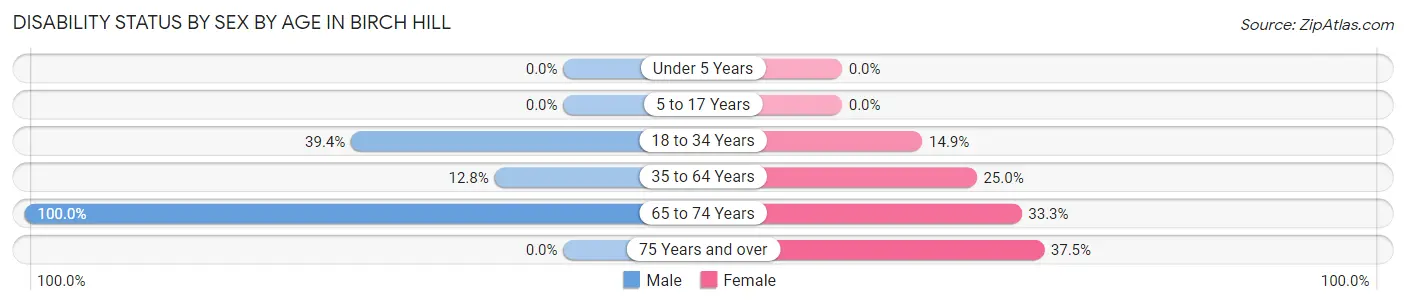
| Age Bracket | Male | Female |
| Under 5 Years | 0 (0.0%) | 0 (0.0%) |
| 5 to 17 Years | 0 (0.0%) | 0 (0.0%) |
| 18 to 34 Years | 13 (39.4%) | 17 (14.9%) |
| 35 to 64 Years | 6 (12.8%) | 10 (25.0%) |
| 65 to 74 Years | 8 (100.0%) | 5 (33.3%) |
| 75 Years and over | 0 (0.0%) | 3 (37.5%) |
Disability Class by Sex by Age in Birch Hill
Disability Class: Hearing Difficulty
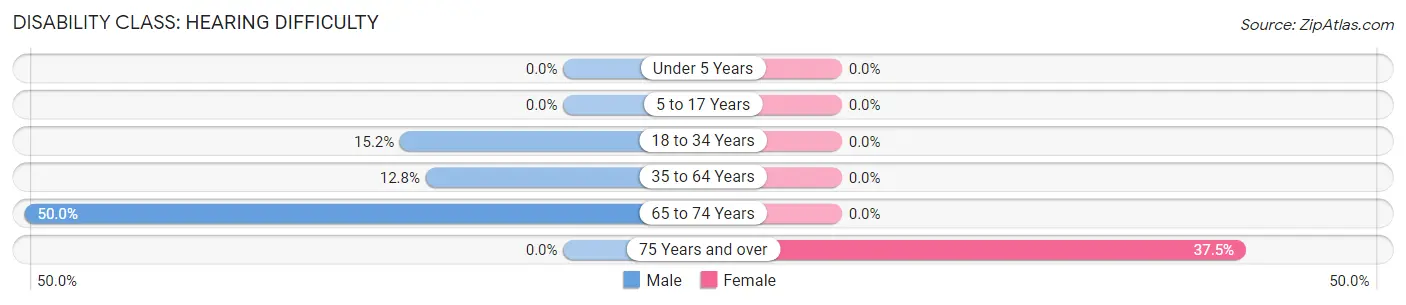
| Age Bracket | Male | Female |
| Under 5 Years | 0 (0.0%) | 0 (0.0%) |
| 5 to 17 Years | 0 (0.0%) | 0 (0.0%) |
| 18 to 34 Years | 5 (15.1%) | 0 (0.0%) |
| 35 to 64 Years | 6 (12.8%) | 0 (0.0%) |
| 65 to 74 Years | 4 (50.0%) | 0 (0.0%) |
| 75 Years and over | 0 (0.0%) | 3 (37.5%) |
Disability Class: Vision Difficulty
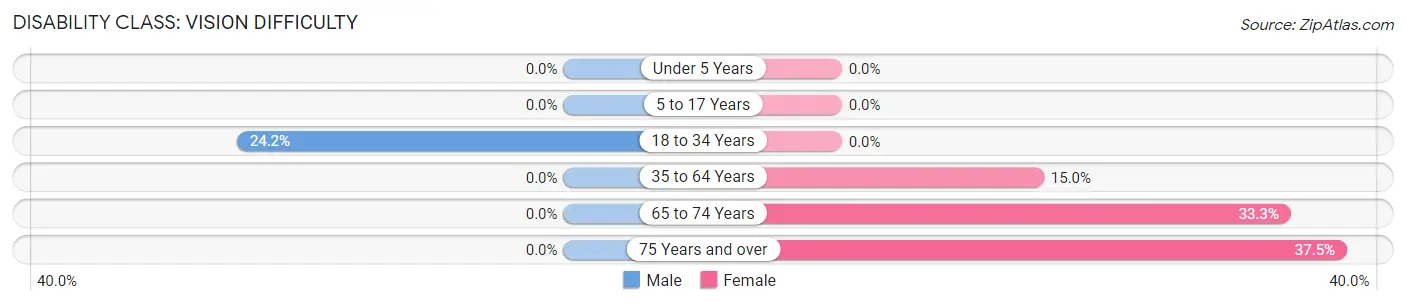
| Age Bracket | Male | Female |
| Under 5 Years | 0 (0.0%) | 0 (0.0%) |
| 5 to 17 Years | 0 (0.0%) | 0 (0.0%) |
| 18 to 34 Years | 8 (24.2%) | 0 (0.0%) |
| 35 to 64 Years | 0 (0.0%) | 6 (15.0%) |
| 65 to 74 Years | 0 (0.0%) | 5 (33.3%) |
| 75 Years and over | 0 (0.0%) | 3 (37.5%) |
Disability Class: Cognitive Difficulty
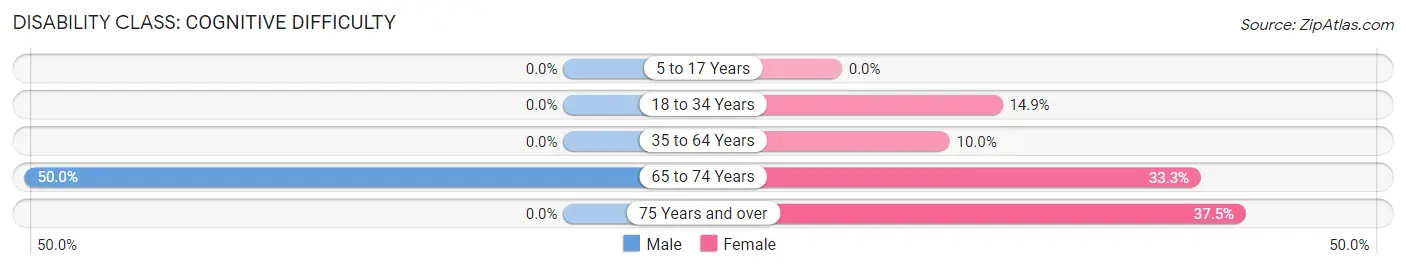
| Age Bracket | Male | Female |
| 5 to 17 Years | 0 (0.0%) | 0 (0.0%) |
| 18 to 34 Years | 0 (0.0%) | 17 (14.9%) |
| 35 to 64 Years | 0 (0.0%) | 4 (10.0%) |
| 65 to 74 Years | 4 (50.0%) | 5 (33.3%) |
| 75 Years and over | 0 (0.0%) | 3 (37.5%) |
Disability Class: Ambulatory Difficulty
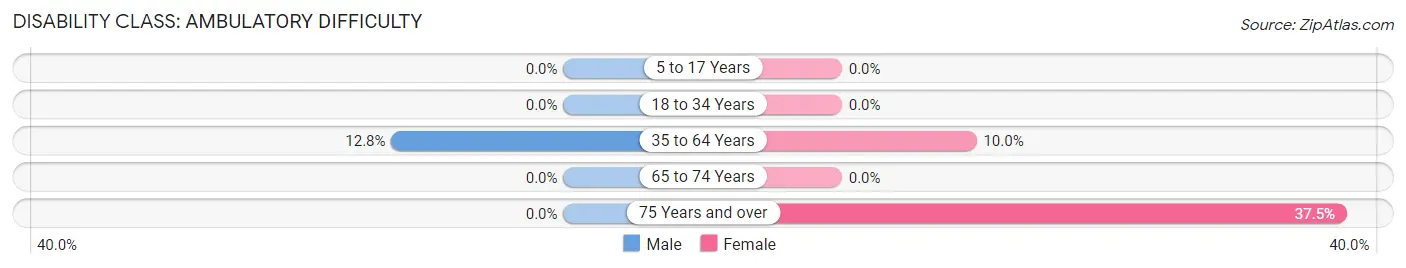
| Age Bracket | Male | Female |
| 5 to 17 Years | 0 (0.0%) | 0 (0.0%) |
| 18 to 34 Years | 0 (0.0%) | 0 (0.0%) |
| 35 to 64 Years | 6 (12.8%) | 4 (10.0%) |
| 65 to 74 Years | 0 (0.0%) | 0 (0.0%) |
| 75 Years and over | 0 (0.0%) | 3 (37.5%) |
Disability Class: Self-Care Difficulty
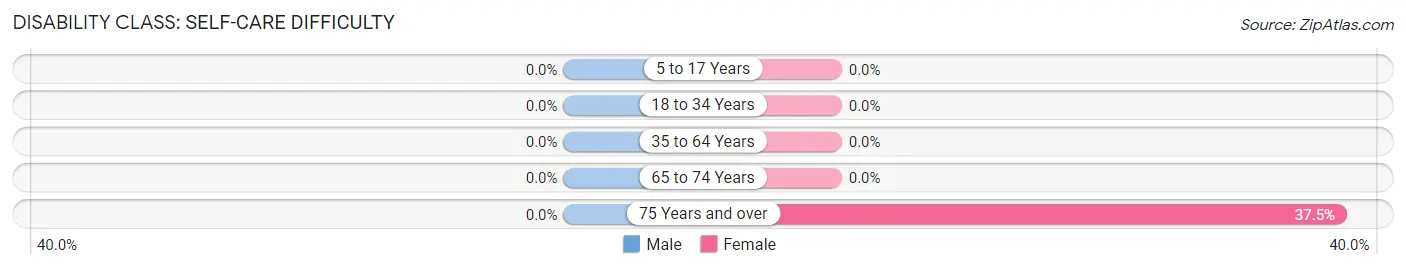
| Age Bracket | Male | Female |
| 5 to 17 Years | 0 (0.0%) | 0 (0.0%) |
| 18 to 34 Years | 0 (0.0%) | 0 (0.0%) |
| 35 to 64 Years | 0 (0.0%) | 0 (0.0%) |
| 65 to 74 Years | 0 (0.0%) | 0 (0.0%) |
| 75 Years and over | 0 (0.0%) | 3 (37.5%) |
Technology Access in Birch Hill
Computing Device Access in Birch Hill
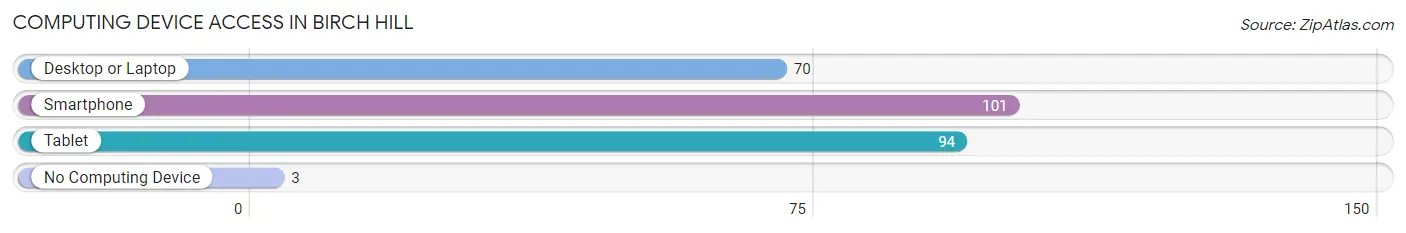
| Device Type | # Households | % Households |
| Desktop or Laptop | 70 | 58.8% |
| Smartphone | 101 | 84.9% |
| Tablet | 94 | 79.0% |
| No Computing Device | 3 | 2.5% |
| Total | 119 | 100.0% |
Internet Access in Birch Hill
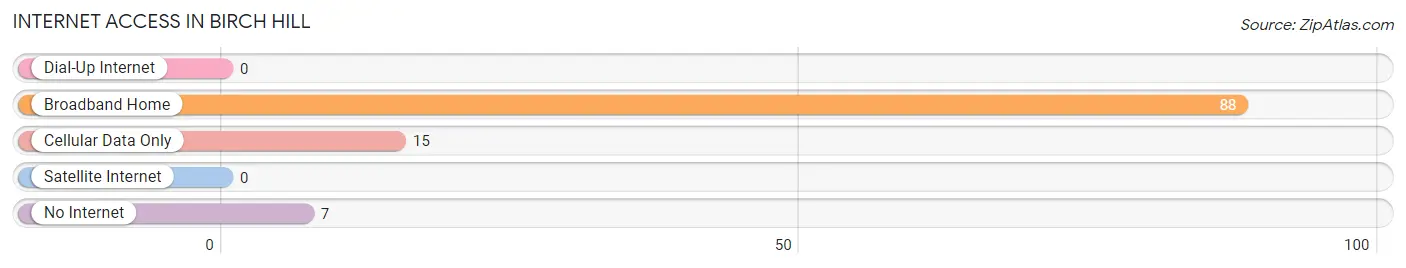
| Internet Type | # Households | % Households |
| Dial-Up Internet | 0 | 0.0% |
| Broadband Home | 88 | 74.0% |
| Cellular Data Only | 15 | 12.6% |
| Satellite Internet | 0 | 0.0% |
| No Internet | 7 | 5.9% |
| Total | 119 | 100.0% |
Birch Hill Summary
Birch Hill, Wisconsin is a small unincorporated community located in the town of Birch Hill in Rusk County, Wisconsin. The community is situated on the banks of the Chippewa River, approximately 10 miles south of Ladysmith. The population of Birch Hill was estimated to be around 200 people in 2020.
History
Birch Hill was first settled in the late 1800s by a group of Finnish immigrants. The settlers were attracted to the area due to its abundance of timber and the potential for farming. The community was originally known as “Finn Town” and was later renamed Birch Hill. The first post office was established in 1891 and the first school was built in 1895.
In the early 1900s, the community began to grow and prosper. The Chippewa River provided a source of power for the sawmills and other industries that were established in the area. The lumber industry was the main source of employment for the residents of Birch Hill.
Geography
Birch Hill is located in the northwest corner of Rusk County, Wisconsin. The community is situated on the banks of the Chippewa River, approximately 10 miles south of Ladysmith. The terrain is mostly flat with some rolling hills. The area is heavily forested with a mix of hardwood and coniferous trees.
The climate in Birch Hill is classified as humid continental, with warm summers and cold winters. The average annual temperature is around 40°F (4°C). The average annual precipitation is around 30 inches (76 cm).
Economy
The economy of Birch Hill is largely based on the lumber industry. The area is home to several sawmills and other wood-related businesses. The community also has a few small businesses, including a general store, a gas station, and a restaurant.
The unemployment rate in Birch Hill is slightly higher than the national average. The median household income is around $35,000, which is lower than the national average.
Demographics
The population of Birch Hill was estimated to be around 200 people in 2020. The racial makeup of the community is predominantly white (97.5%), with a small percentage of African Americans (1.5%) and Native Americans (1%).
The median age in Birch Hill is around 40 years old. The majority of the population is married (60%) and the median household size is 2.5 people. The median household income is around $35,000, which is lower than the national average.
Conclusion
Birch Hill, Wisconsin is a small unincorporated community located in the town of Birch Hill in Rusk County, Wisconsin. The community is situated on the banks of the Chippewa River, approximately 10 miles south of Ladysmith. The population of Birch Hill was estimated to be around 200 people in 2020. The economy of Birch Hill is largely based on the lumber industry, with a few small businesses also operating in the area. The racial makeup of the community is predominantly white, with a small percentage of African Americans and Native Americans. The median age in Birch Hill is around 40 years old and the median household income is around $35,000, which is lower than the national average.
Common Questions
What is the Total Population of Birch Hill?
Total Population of Birch Hill is 318.
What is the Total Male Population of Birch Hill?
Total Male Population of Birch Hill is 122.
What is the Total Female Population of Birch Hill?
Total Female Population of Birch Hill is 196.
What is the Ratio of Males per 100 Females in Birch Hill?
There are 62.24 Males per 100 Females in Birch Hill.
What is the Ratio of Females per 100 Males in Birch Hill?
There are 160.66 Females per 100 Males in Birch Hill.
What is the Median Population Age in Birch Hill?
Median Population Age in Birch Hill is 32.8 Years.
What is the Average Family Size in Birch Hill
Average Family Size in Birch Hill is 2.5 People.
What is the Average Household Size in Birch Hill
Average Household Size in Birch Hill is 2.7 People.
What is Per Capita Income in Birch Hill?
Per Capita income in Birch Hill is $21,959.
What is the Median Family Income in Birch Hill?
Median Family Income in Birch Hill is $61,250.
What is the Median Household income in Birch Hill?
Median Household Income in Birch Hill is $57,292.
What is Income or Wage Gap in Birch Hill?
Income or Wage Gap in Birch Hill is 13.7%.
Women in Birch Hill earn 86.3 cents for every dollar earned by a man.
What is Family Income Deficit in Birch Hill?
Family Income Deficit in Birch Hill is $10,032.
Families that are below poverty line in Birch Hill earn $10,032 less on average than the poverty threshold level.
What is Inequality or Gini Index in Birch Hill?
Inequality or Gini Index in Birch Hill is 0.29.
How Large is the Labor Force in Birch Hill?
There are 216 People in the Labor Forcein in Birch Hill.
What is the Percentage of People in the Labor Force in Birch Hill?
80.3% of People are in the Labor Force in Birch Hill.
What is the Unemployment Rate in Birch Hill?
Unemployment Rate in Birch Hill is 9.7%.