Almond, WI
Almond Map
Almond Overview
444
TOTAL POPULATION
207
MALE POPULATION
237
FEMALE POPULATION
87.34
MALES / 100 FEMALES
114.49
FEMALES / 100 MALES
35.8
MEDIAN AGE
2.9
AVG FAMILY SIZE
2.5
AVG HOUSEHOLD SIZE
$34,503
PER CAPITA INCOME
$79,464
AVG FAMILY INCOME
$69,107
AVG HOUSEHOLD INCOME
53.6%
WAGE / INCOME GAP [ % ]
46.4¢/ $1
WAGE / INCOME GAP [ $ ]
0.41
INEQUALITY / GINI INDEX
242
LABOR FORCE [ PEOPLE ]
68.8%
PERCENT IN LABOR FORCE
0.4%
UNEMPLOYMENT RATE
Almond Zip Codes
Almond Area Codes
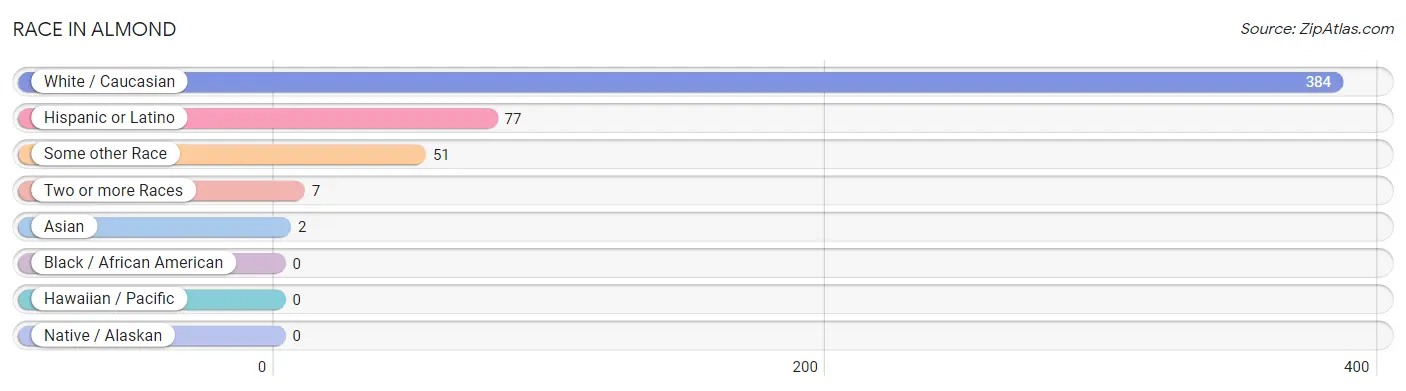
Race in Almond
The most populous races in Almond are White / Caucasian (384 | 86.5%), Hispanic or Latino (77 | 17.3%), and Some other Race (51 | 11.5%).
| Race | # Population | % Population |
| Asian | 2 | 0.4% |
| Black / African American | 0 | 0.0% |
| Hawaiian / Pacific | 0 | 0.0% |
| Hispanic or Latino | 77 | 17.3% |
| Native / Alaskan | 0 | 0.0% |
| White / Caucasian | 384 | 86.5% |
| Two or more Races | 7 | 1.6% |
| Some other Race | 51 | 11.5% |
| Total | 444 | 100.0% |
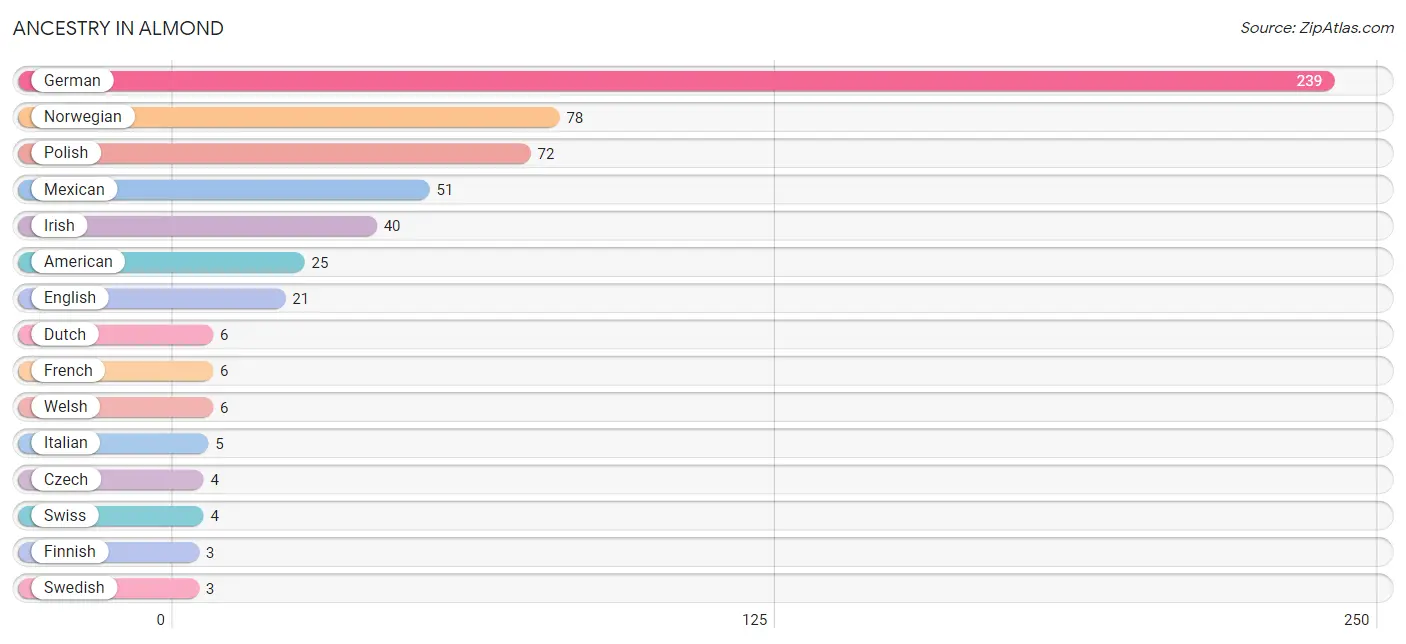
Ancestry in Almond
The most populous ancestries reported in Almond are German (239 | 53.8%), Norwegian (78 | 17.6%), Polish (72 | 16.2%), Mexican (51 | 11.5%), and Irish (40 | 9.0%), together accounting for 108.1% of all Almond residents.
| Ancestry | # Population | % Population |
| American | 25 | 5.6% |
| Belgian | 1 | 0.2% |
| Czech | 4 | 0.9% |
| Dutch | 6 | 1.3% |
| English | 21 | 4.7% |
| Finnish | 3 | 0.7% |
| French | 6 | 1.3% |
| German | 239 | 53.8% |
| Irish | 40 | 9.0% |
| Italian | 5 | 1.1% |
| Mexican | 51 | 11.5% |
| Norwegian | 78 | 17.6% |
| Polish | 72 | 16.2% |
| Scotch-Irish | 1 | 0.2% |
| Sioux | 1 | 0.2% |
| Swedish | 3 | 0.7% |
| Swiss | 4 | 0.9% |
| Welsh | 6 | 1.3% | View All 18 Rows |
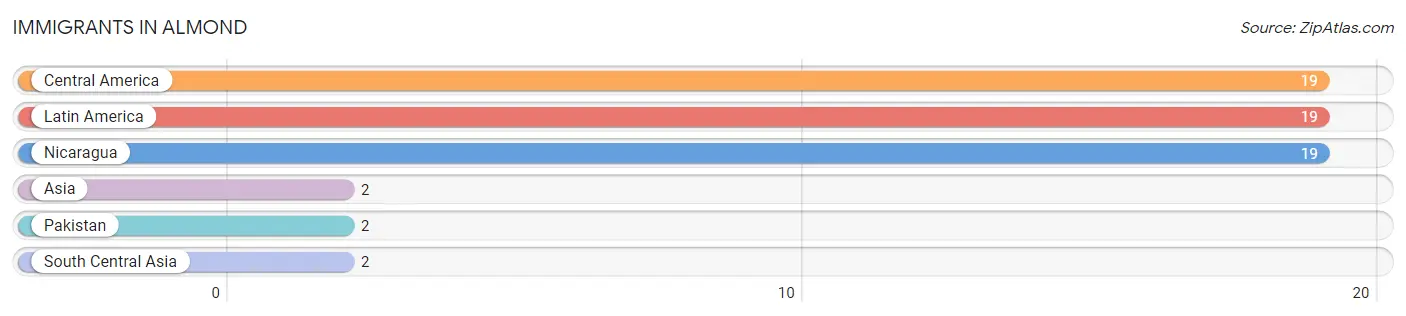
Immigrants in Almond
The most numerous immigrant groups reported in Almond came from Central America (19 | 4.3%), Latin America (19 | 4.3%), Nicaragua (19 | 4.3%), Asia (2 | 0.4%), and Pakistan (2 | 0.4%), together accounting for 13.7% of all Almond residents.
| Immigration Origin | # Population | % Population |
| Asia | 2 | 0.4% |
| Central America | 19 | 4.3% |
| Latin America | 19 | 4.3% |
| Nicaragua | 19 | 4.3% |
| Pakistan | 2 | 0.4% |
| South Central Asia | 2 | 0.4% | View All 6 Rows |
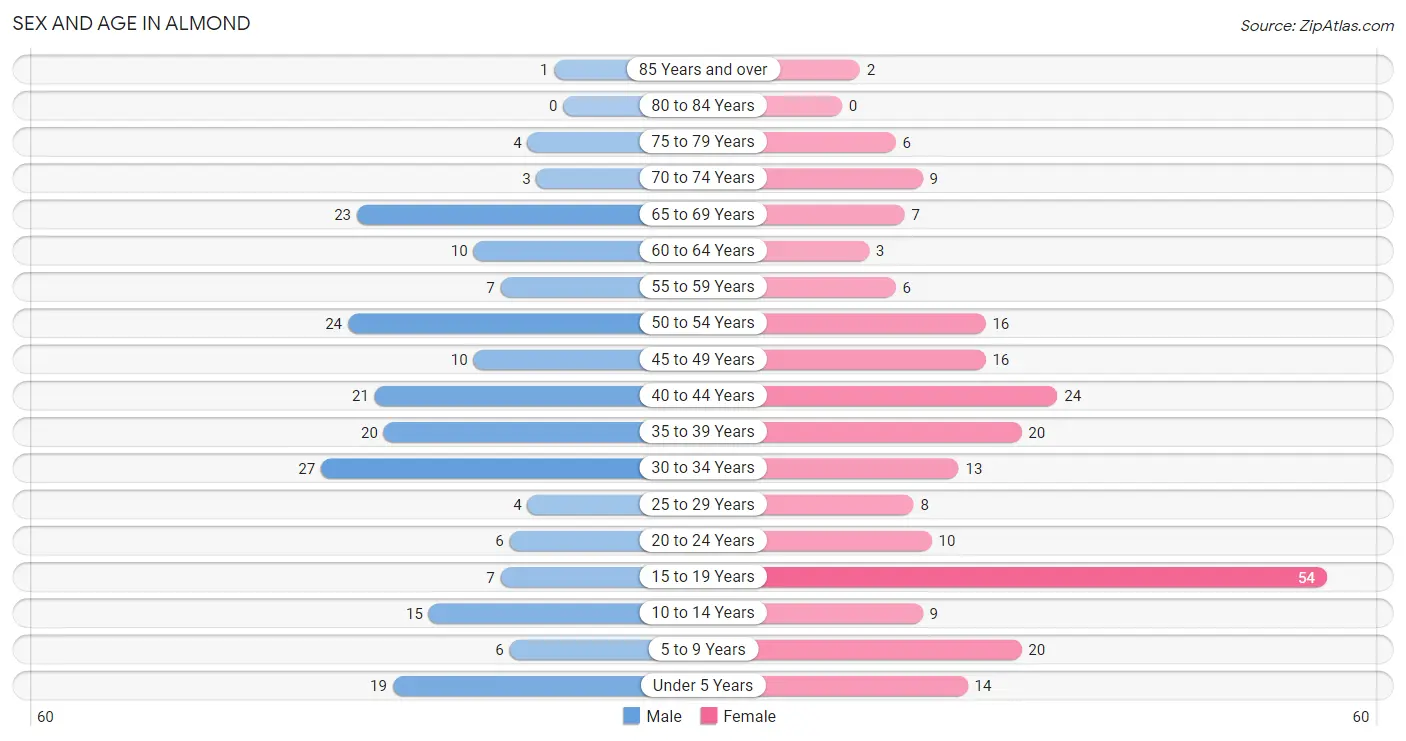
Sex and Age in Almond
Sex and Age in Almond
The most populous age groups in Almond are 30 to 34 Years (27 | 13.0%) for men and 15 to 19 Years (54 | 22.8%) for women.
| Age Bracket | Male | Female |
| Under 5 Years | 19 (9.2%) | 14 (5.9%) |
| 5 to 9 Years | 6 (2.9%) | 20 (8.4%) |
| 10 to 14 Years | 15 (7.2%) | 9 (3.8%) |
| 15 to 19 Years | 7 (3.4%) | 54 (22.8%) |
| 20 to 24 Years | 6 (2.9%) | 10 (4.2%) |
| 25 to 29 Years | 4 (1.9%) | 8 (3.4%) |
| 30 to 34 Years | 27 (13.0%) | 13 (5.5%) |
| 35 to 39 Years | 20 (9.7%) | 20 (8.4%) |
| 40 to 44 Years | 21 (10.1%) | 24 (10.1%) |
| 45 to 49 Years | 10 (4.8%) | 16 (6.8%) |
| 50 to 54 Years | 24 (11.6%) | 16 (6.8%) |
| 55 to 59 Years | 7 (3.4%) | 6 (2.5%) |
| 60 to 64 Years | 10 (4.8%) | 3 (1.3%) |
| 65 to 69 Years | 23 (11.1%) | 7 (2.9%) |
| 70 to 74 Years | 3 (1.5%) | 9 (3.8%) |
| 75 to 79 Years | 4 (1.9%) | 6 (2.5%) |
| 80 to 84 Years | 0 (0.0%) | 0 (0.0%) |
| 85 Years and over | 1 (0.5%) | 2 (0.8%) |
| Total | 207 (100.0%) | 237 (100.0%) |
Families and Households in Almond
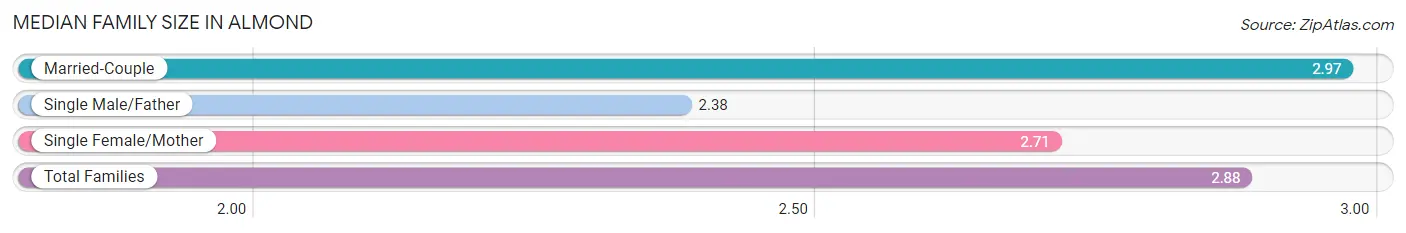
Median Family Size in Almond
The median family size in Almond is 2.88 persons per family, with married-couple families (100 | 78.7%) accounting for the largest median family size of 2.97 persons per family. On the other hand, single male/father families (13 | 10.2%) represent the smallest median family size with 2.38 persons per family.
| Family Type | # Families | Family Size |
| Married-Couple | 100 (78.7%) | 2.97 |
| Single Male/Father | 13 (10.2%) | 2.38 |
| Single Female/Mother | 14 (11.0%) | 2.71 |
| Total Families | 127 (100.0%) | 2.88 |
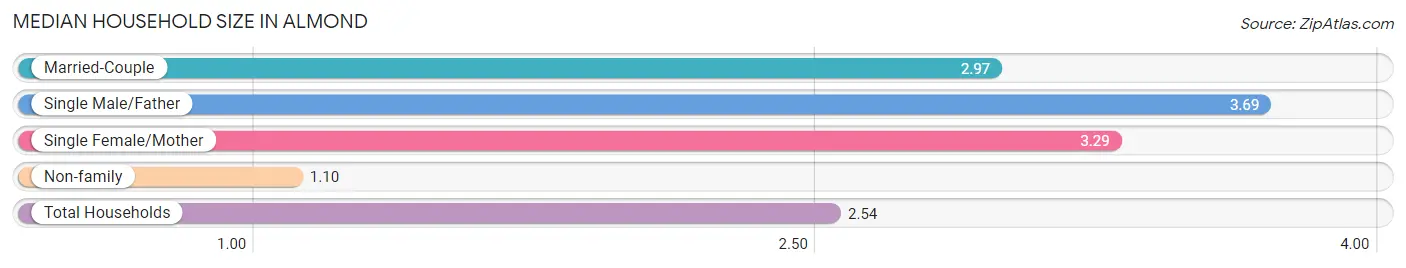
Median Household Size in Almond
The median household size in Almond is 2.54 persons per household, with single male/father households (13 | 7.4%) accounting for the largest median household size of 3.69 persons per household. non-family households (48 | 27.4%) represent the smallest median household size with 1.10 persons per household.
| Household Type | # Households | Household Size |
| Married-Couple | 100 (57.1%) | 2.97 |
| Single Male/Father | 13 (7.4%) | 3.69 |
| Single Female/Mother | 14 (8.0%) | 3.29 |
| Non-family | 48 (27.4%) | 1.10 |
| Total Households | 175 (100.0%) | 2.54 |
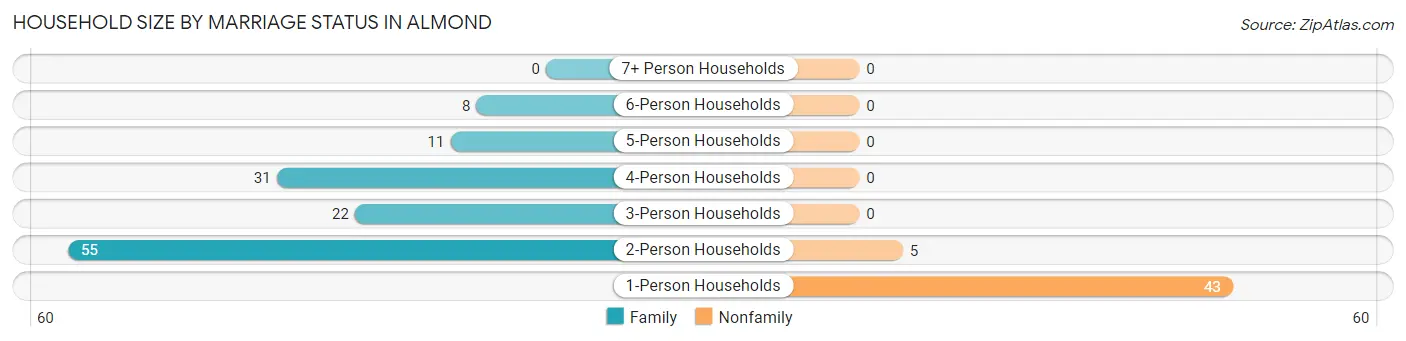
Household Size by Marriage Status in Almond
Out of a total of 175 households in Almond, 127 (72.6%) are family households, while 48 (27.4%) are nonfamily households. The most numerous type of family households are 2-person households, comprising 55, and the most common type of nonfamily households are 1-person households, comprising 43.
| Household Size | Family Households | Nonfamily Households |
| 1-Person Households | - | 43 (24.6%) |
| 2-Person Households | 55 (31.4%) | 5 (2.9%) |
| 3-Person Households | 22 (12.6%) | 0 (0.0%) |
| 4-Person Households | 31 (17.7%) | 0 (0.0%) |
| 5-Person Households | 11 (6.3%) | 0 (0.0%) |
| 6-Person Households | 8 (4.6%) | 0 (0.0%) |
| 7+ Person Households | 0 (0.0%) | 0 (0.0%) |
| Total | 127 (72.6%) | 48 (27.4%) |
Female Fertility in Almond
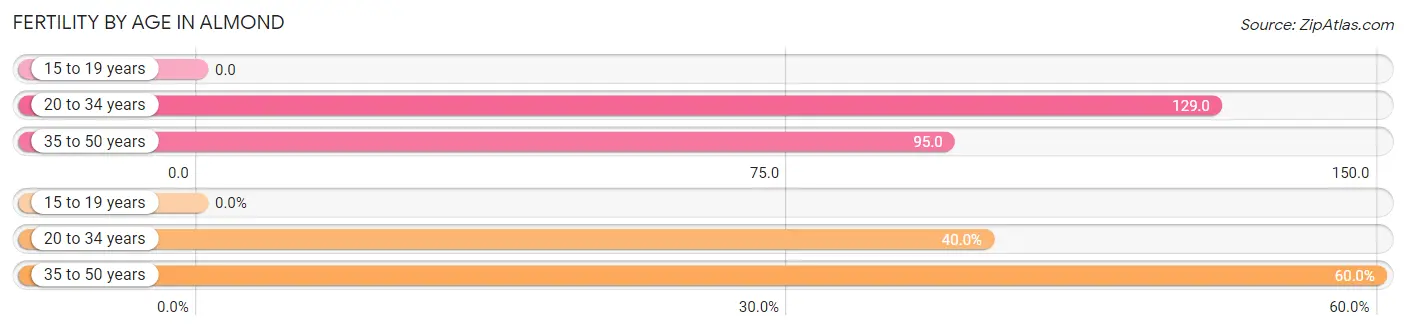
Fertility by Age in Almond
Average fertility rate in Almond is 68.0 births per 1,000 women. Women in the age bracket of 20 to 34 years have the highest fertility rate with 129.0 births per 1,000 women. Women in the age bracket of 35 to 50 years acount for 60.0% of all women with births.
| Age Bracket | Women with Births | Births / 1,000 Women |
| 15 to 19 years | 0 (0.0%) | 0.0 |
| 20 to 34 years | 4 (40.0%) | 129.0 |
| 35 to 50 years | 6 (60.0%) | 95.0 |
| Total | 10 (100.0%) | 68.0 |
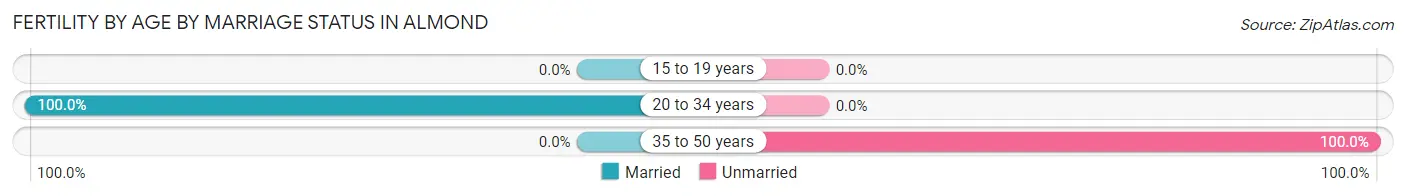
Fertility by Age by Marriage Status in Almond
40.0% of women with births (10) in Almond are married. The highest percentage of unmarried women with births falls into 35 to 50 years age bracket with 100.0% of them unmarried at the time of birth, while the lowest percentage of unmarried women with births belong to 20 to 34 years age bracket with 0.0% of them unmarried.
| Age Bracket | Married | Unmarried |
| 15 to 19 years | 0 (0.0%) | 0 (0.0%) |
| 20 to 34 years | 4 (100.0%) | 0 (0.0%) |
| 35 to 50 years | 0 (0.0%) | 6 (100.0%) |
| Total | 4 (40.0%) | 6 (60.0%) |
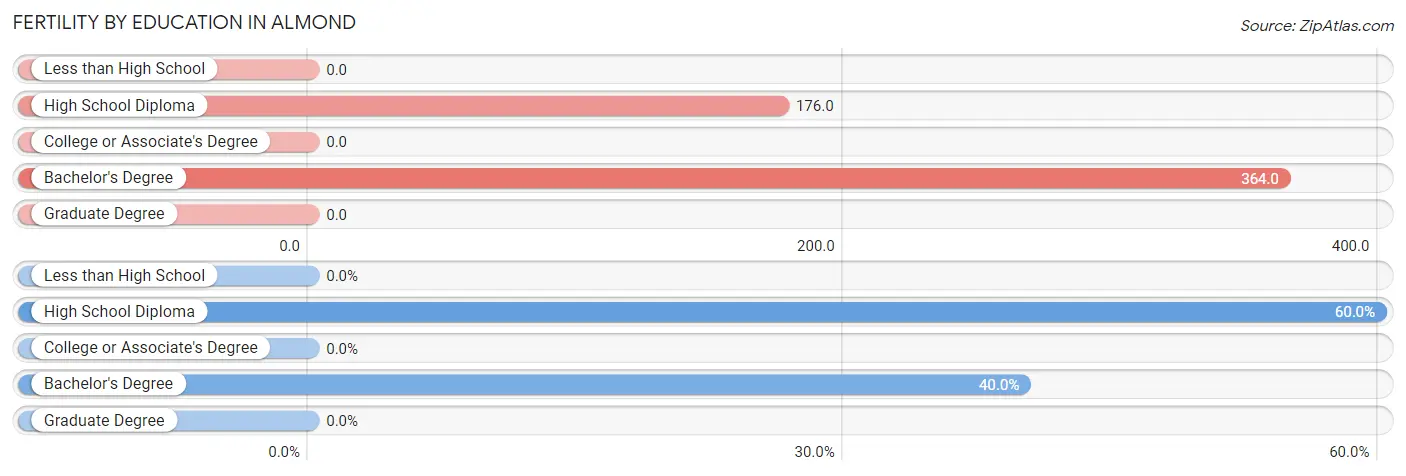
Fertility by Education in Almond
| Educational Attainment | Women with Births | Births / 1,000 Women |
| Less than High School | 0 (0.0%) | 0.0 |
| High School Diploma | 6 (60.0%) | 176.0 |
| College or Associate's Degree | 0 (0.0%) | 0.0 |
| Bachelor's Degree | 4 (40.0%) | 364.0 |
| Graduate Degree | 0 (0.0%) | 0.0 |
| Total | 10 (100.0%) | 68.0 |
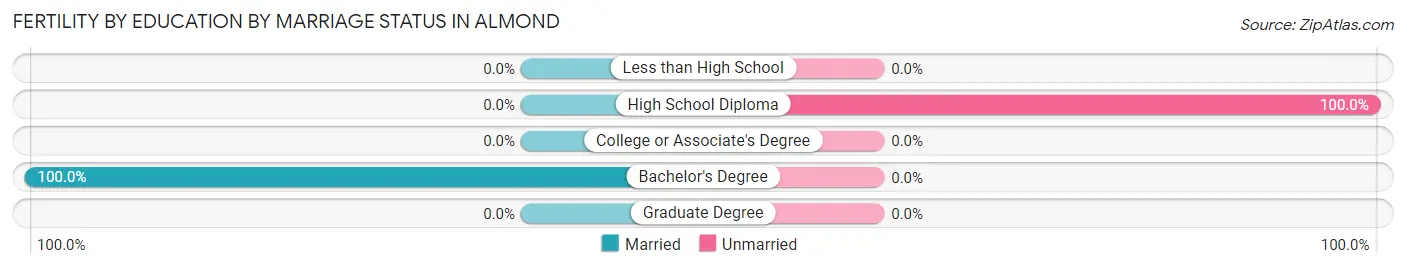
Fertility by Education by Marriage Status in Almond
60.0% of women with births in Almond are unmarried. Women with the educational attainment of bachelor's degree are most likely to be married with 100.0% of them married at childbirth, while women with the educational attainment of high school diploma are least likely to be married with 100.0% of them unmarried at childbirth.
| Educational Attainment | Married | Unmarried |
| Less than High School | 0 (0.0%) | 0 (0.0%) |
| High School Diploma | 0 (0.0%) | 6 (100.0%) |
| College or Associate's Degree | 0 (0.0%) | 0 (0.0%) |
| Bachelor's Degree | 4 (100.0%) | 0 (0.0%) |
| Graduate Degree | 0 (0.0%) | 0 (0.0%) |
| Total | 4 (40.0%) | 6 (60.0%) |
Income in Almond
Income Overview in Almond
Per Capita Income in Almond is $34,503, while median incomes of families and households are $79,464 and $69,107 respectively.
| Characteristic | Number | Measure |
| Per Capita Income | 444 | $34,503 |
| Median Family Income | 127 | $79,464 |
| Mean Family Income | 127 | $101,191 |
| Median Household Income | 175 | $69,107 |
| Mean Household Income | 175 | $88,885 |
| Income Deficit | 127 | $0 |
| Wage / Income Gap (%) | 444 | 53.61% |
| Wage / Income Gap ($) | 444 | 46.39¢ per $1 |
| Gini / Inequality Index | 444 | 0.41 |
Earnings by Sex in Almond
Average Earnings in Almond are $34,583, $44,464 for men and $20,625 for women, a difference of 53.6%.
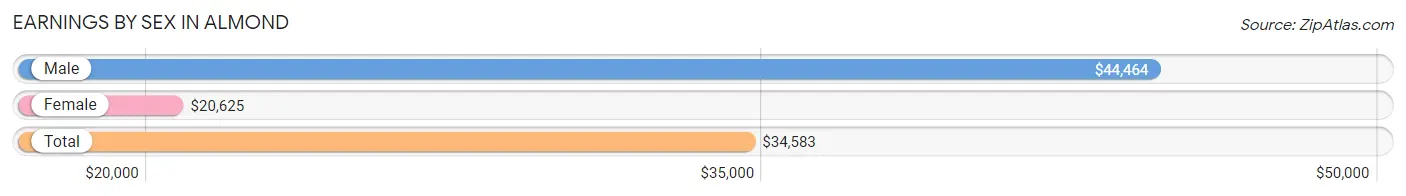
| Sex | Number | Average Earnings |
| Male | 117 (46.4%) | $44,464 |
| Female | 135 (53.6%) | $20,625 |
| Total | 252 (100.0%) | $34,583 |
Earnings by Sex by Income Bracket in Almond
The most common earnings brackets in Almond are $40,000 to $44,999 for men (27 | 23.1%) and $2,499 or less for women (26 | 19.3%).
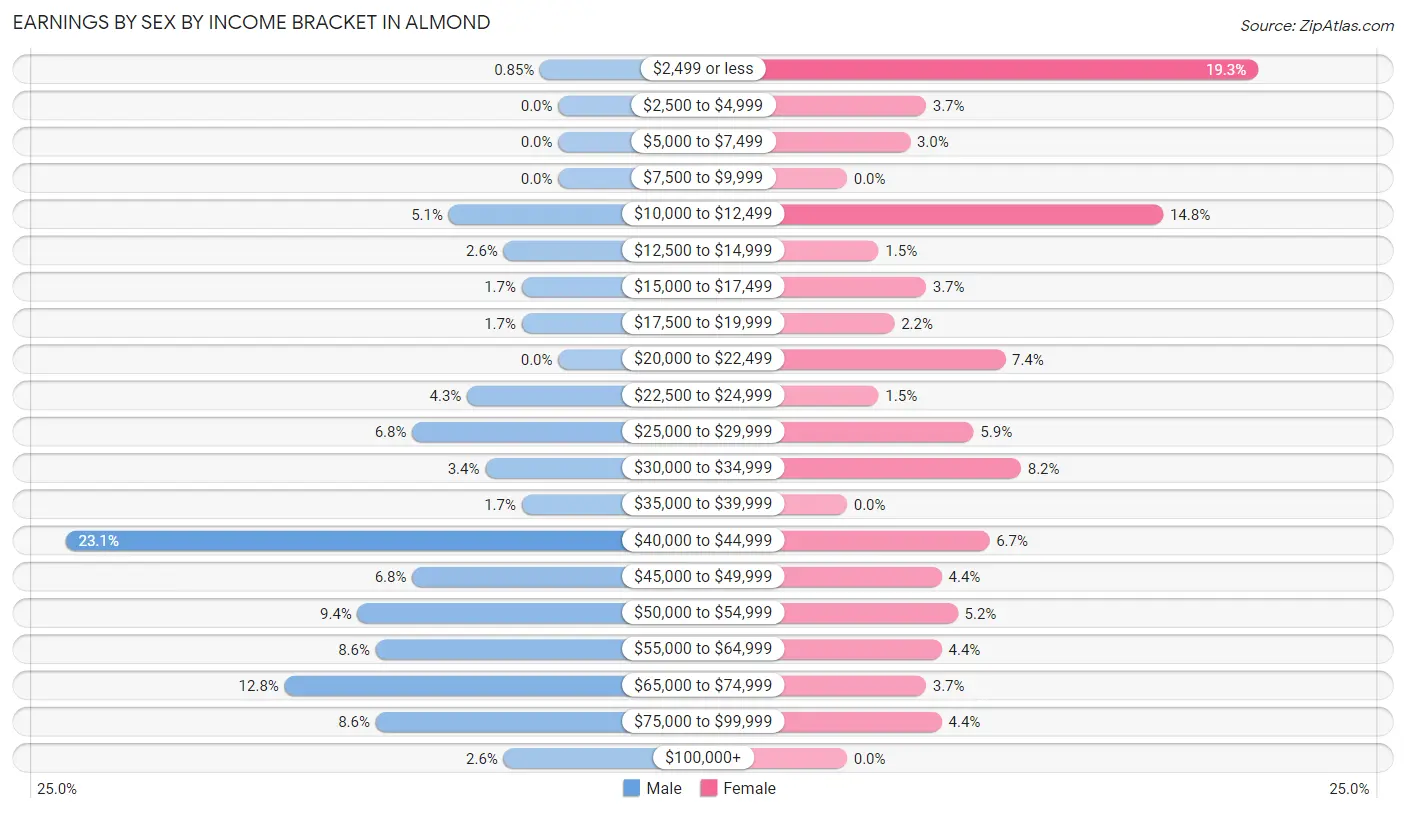
| Income | Male | Female |
| $2,499 or less | 1 (0.9%) | 26 (19.3%) |
| $2,500 to $4,999 | 0 (0.0%) | 5 (3.7%) |
| $5,000 to $7,499 | 0 (0.0%) | 4 (3.0%) |
| $7,500 to $9,999 | 0 (0.0%) | 0 (0.0%) |
| $10,000 to $12,499 | 6 (5.1%) | 20 (14.8%) |
| $12,500 to $14,999 | 3 (2.6%) | 2 (1.5%) |
| $15,000 to $17,499 | 2 (1.7%) | 5 (3.7%) |
| $17,500 to $19,999 | 2 (1.7%) | 3 (2.2%) |
| $20,000 to $22,499 | 0 (0.0%) | 10 (7.4%) |
| $22,500 to $24,999 | 5 (4.3%) | 2 (1.5%) |
| $25,000 to $29,999 | 8 (6.8%) | 8 (5.9%) |
| $30,000 to $34,999 | 4 (3.4%) | 11 (8.2%) |
| $35,000 to $39,999 | 2 (1.7%) | 0 (0.0%) |
| $40,000 to $44,999 | 27 (23.1%) | 9 (6.7%) |
| $45,000 to $49,999 | 8 (6.8%) | 6 (4.4%) |
| $50,000 to $54,999 | 11 (9.4%) | 7 (5.2%) |
| $55,000 to $64,999 | 10 (8.6%) | 6 (4.4%) |
| $65,000 to $74,999 | 15 (12.8%) | 5 (3.7%) |
| $75,000 to $99,999 | 10 (8.6%) | 6 (4.4%) |
| $100,000+ | 3 (2.6%) | 0 (0.0%) |
| Total | 117 (100.0%) | 135 (100.0%) |
Earnings by Sex by Educational Attainment in Almond
Average earnings in Almond are $45,417 for men and $34,375 for women, a difference of 24.3%. Men with an educational attainment of college or associate's degree enjoy the highest average annual earnings of $65,938, while those with less than high school education earn the least with $40,781. Women with an educational attainment of high school diploma earn the most with the average annual earnings of $40,625, while those with college or associate's degree education have the smallest earnings of $32,321.
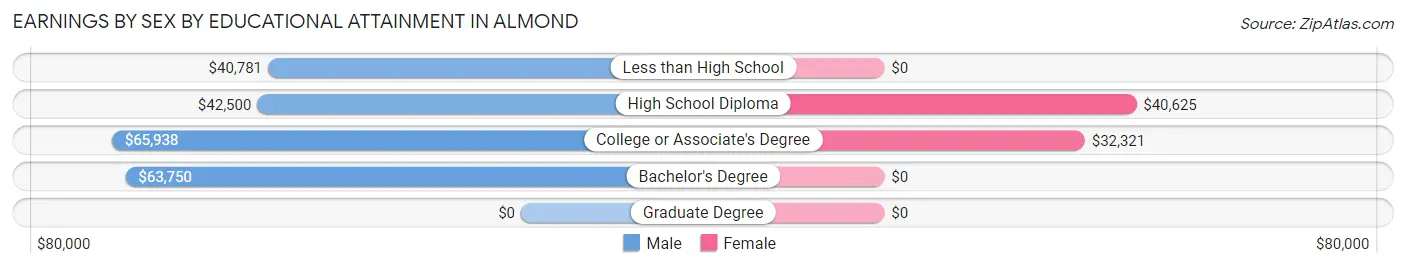
| Educational Attainment | Male Income | Female Income |
| Less than High School | $40,781 | $0 |
| High School Diploma | $42,500 | $40,625 |
| College or Associate's Degree | $65,938 | $32,321 |
| Bachelor's Degree | $63,750 | $0 |
| Graduate Degree | - | - |
| Total | $45,417 | $34,375 |
Family Income in Almond
Family Income Brackets in Almond
According to the Almond family income data, there are 38 families falling into the $50,000 to $74,999 income range, which is the most common income bracket and makes up 29.9% of all families. Conversely, the less than $10,000 income bracket is the least frequent group with only 1 families (0.8%) belonging to this category.
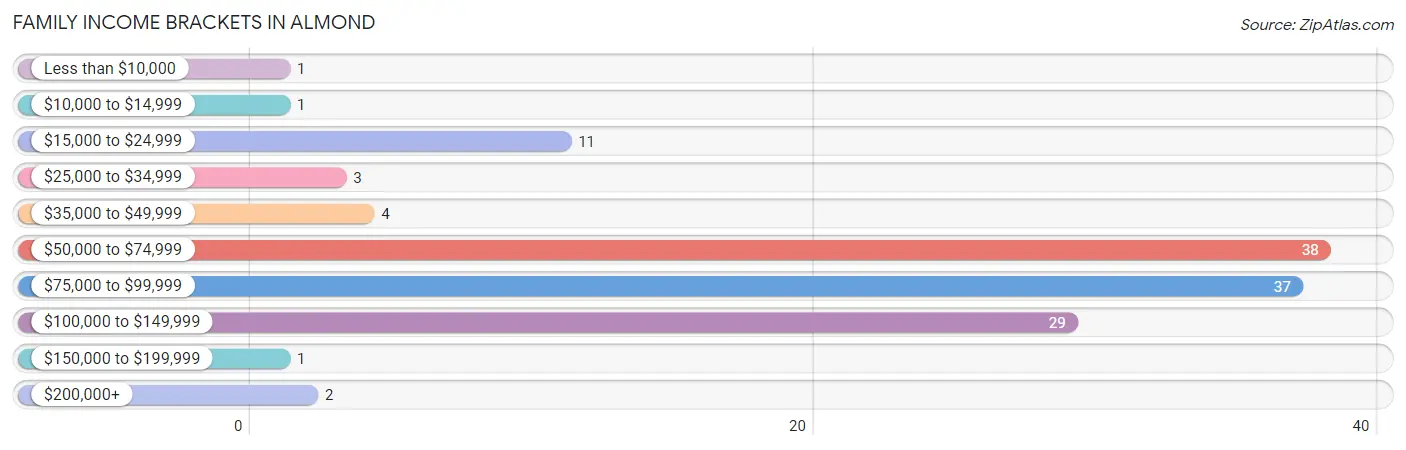
| Income Bracket | # Families | % Families |
| Less than $10,000 | 1 | 0.8% |
| $10,000 to $14,999 | 1 | 0.8% |
| $15,000 to $24,999 | 11 | 8.7% |
| $25,000 to $34,999 | 3 | 2.4% |
| $35,000 to $49,999 | 4 | 3.1% |
| $50,000 to $74,999 | 38 | 29.9% |
| $75,000 to $99,999 | 37 | 29.1% |
| $100,000 to $149,999 | 29 | 22.8% |
| $150,000 to $199,999 | 1 | 0.8% |
| $200,000+ | 2 | 1.6% |
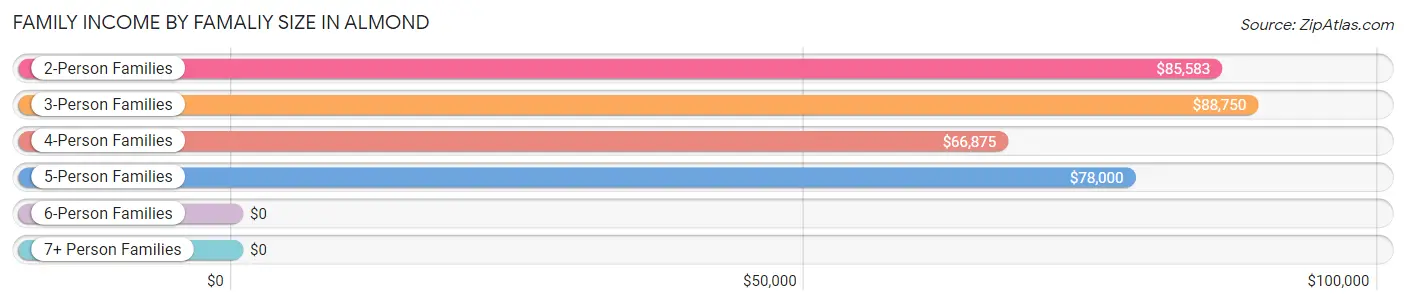
Family Income by Famaliy Size in Almond
3-person families (16 | 12.6%) account for the highest median family income in Almond with $88,750 per family, while 2-person families (65 | 51.2%) have the highest median income of $42,792 per family member.
| Income Bracket | # Families | Median Income |
| 2-Person Families | 65 (51.2%) | $85,583 |
| 3-Person Families | 16 (12.6%) | $88,750 |
| 4-Person Families | 32 (25.2%) | $66,875 |
| 5-Person Families | 10 (7.9%) | $78,000 |
| 6-Person Families | 4 (3.2%) | $0 |
| 7+ Person Families | 0 (0.0%) | $0 |
| Total | 127 (100.0%) | $79,464 |
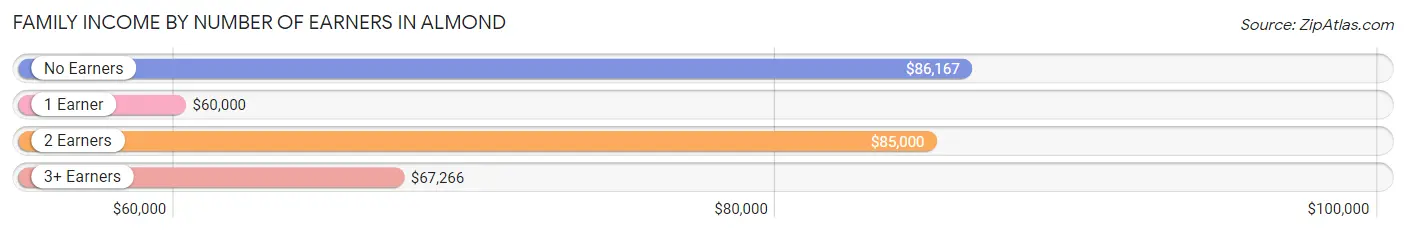
Family Income by Number of Earners in Almond
The median family income in Almond is $79,464, with families comprising no earners (22) having the highest median family income of $86,167, while families with 1 earner (40) have the lowest median family income of $60,000, accounting for 17.3% and 31.5% of families, respectively.
| Number of Earners | # Families | Median Income |
| No Earners | 22 (17.3%) | $86,167 |
| 1 Earner | 40 (31.5%) | $60,000 |
| 2 Earners | 36 (28.3%) | $85,000 |
| 3+ Earners | 29 (22.8%) | $67,266 |
| Total | 127 (100.0%) | $79,464 |
Household Income in Almond
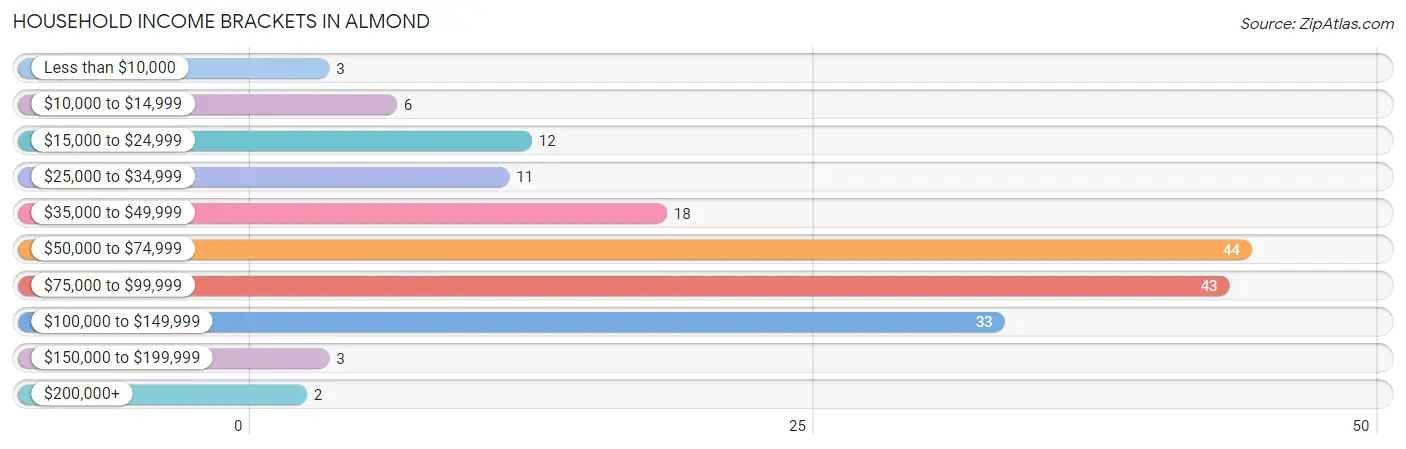
Household Income Brackets in Almond
With 44 households falling in the category, the $50,000 to $74,999 income range is the most frequent in Almond, accounting for 25.1% of all households. In contrast, only 2 households (1.1%) fall into the $200,000+ income bracket, making it the least populous group.
| Income Bracket | # Households | % Households |
| Less than $10,000 | 3 | 1.7% |
| $10,000 to $14,999 | 6 | 3.4% |
| $15,000 to $24,999 | 12 | 6.9% |
| $25,000 to $34,999 | 11 | 6.3% |
| $35,000 to $49,999 | 18 | 10.3% |
| $50,000 to $74,999 | 44 | 25.1% |
| $75,000 to $99,999 | 43 | 24.6% |
| $100,000 to $149,999 | 33 | 18.9% |
| $150,000 to $199,999 | 3 | 1.7% |
| $200,000+ | 2 | 1.1% |
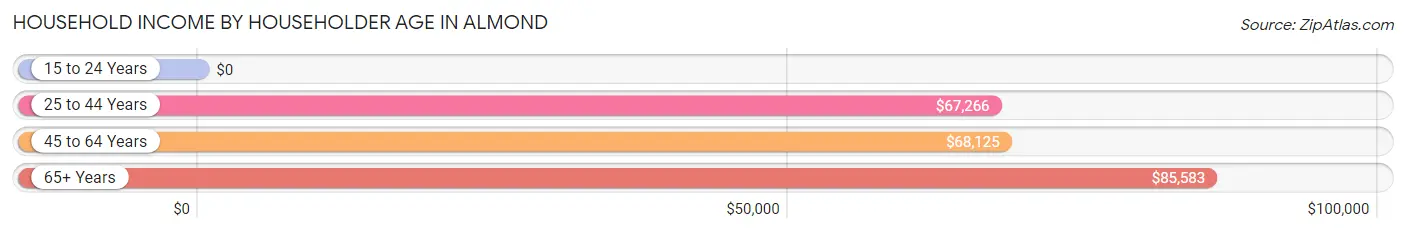
Household Income by Householder Age in Almond
The median household income in Almond is $69,107, with the highest median household income of $85,583 found in the 65+ years age bracket for the primary householder. A total of 45 households (25.7%) fall into this category. Meanwhile, the 15 to 24 years age bracket for the primary householder has the lowest median household income of $0, with 4 households (2.3%) in this group.
| Income Bracket | # Households | Median Income |
| 15 to 24 Years | 4 (2.3%) | $0 |
| 25 to 44 Years | 79 (45.1%) | $67,266 |
| 45 to 64 Years | 47 (26.9%) | $68,125 |
| 65+ Years | 45 (25.7%) | $85,583 |
| Total | 175 (100.0%) | $69,107 |
Poverty in Almond
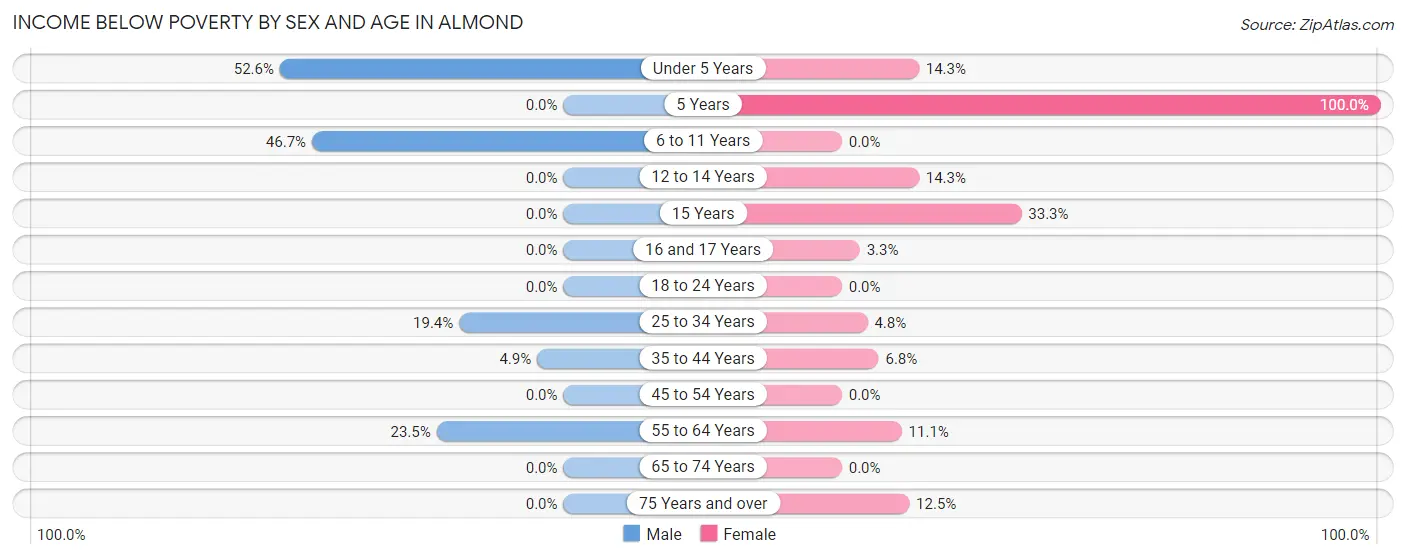
Income Below Poverty by Sex and Age in Almond
With 14.0% poverty level for males and 5.9% for females among the residents of Almond, under 5 year old males and 5 year old females are the most vulnerable to poverty, with 10 males (52.6%) and 2 females (100.0%) in their respective age groups living below the poverty level.
| Age Bracket | Male | Female |
| Under 5 Years | 10 (52.6%) | 2 (14.3%) |
| 5 Years | 0 (0.0%) | 2 (100.0%) |
| 6 to 11 Years | 7 (46.7%) | 0 (0.0%) |
| 12 to 14 Years | 0 (0.0%) | 1 (14.3%) |
| 15 Years | 0 (0.0%) | 2 (33.3%) |
| 16 and 17 Years | 0 (0.0%) | 1 (3.3%) |
| 18 to 24 Years | 0 (0.0%) | 0 (0.0%) |
| 25 to 34 Years | 6 (19.4%) | 1 (4.8%) |
| 35 to 44 Years | 2 (4.9%) | 3 (6.8%) |
| 45 to 54 Years | 0 (0.0%) | 0 (0.0%) |
| 55 to 64 Years | 4 (23.5%) | 1 (11.1%) |
| 65 to 74 Years | 0 (0.0%) | 0 (0.0%) |
| 75 Years and over | 0 (0.0%) | 1 (12.5%) |
| Total | 29 (14.0%) | 14 (5.9%) |
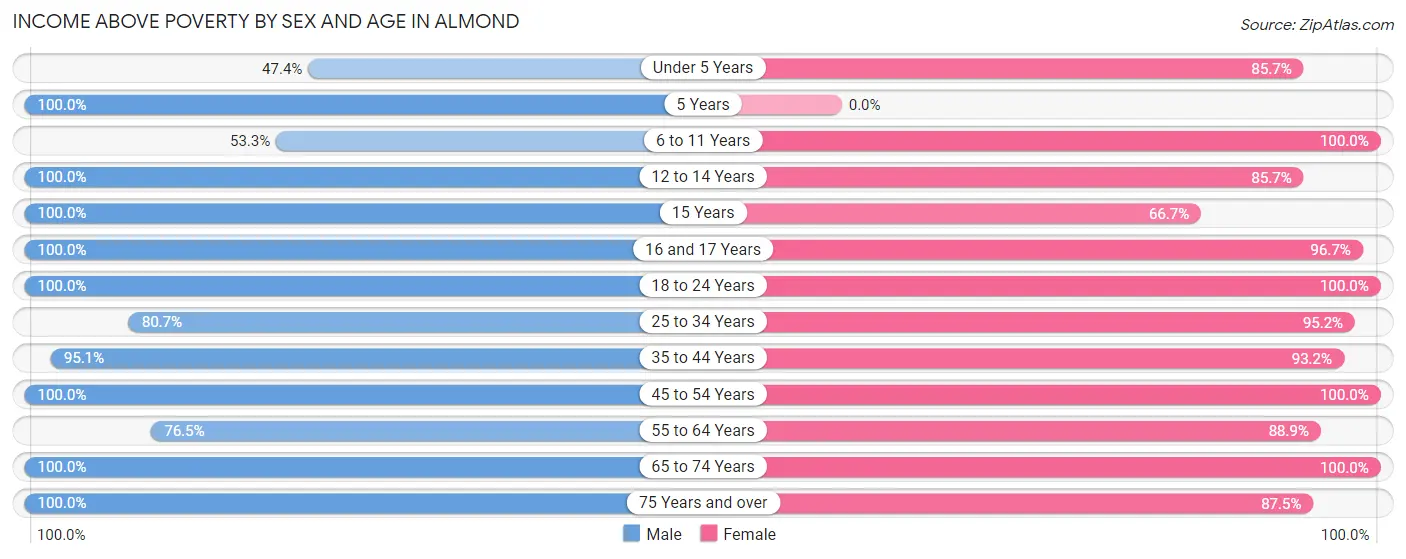
Income Above Poverty by Sex and Age in Almond
According to the poverty statistics in Almond, males aged 5 years and females aged 6 to 11 years are the age groups that are most secure financially, with 100.0% of males and 100.0% of females in these age groups living above the poverty line.
| Age Bracket | Male | Female |
| Under 5 Years | 9 (47.4%) | 12 (85.7%) |
| 5 Years | 1 (100.0%) | 0 (0.0%) |
| 6 to 11 Years | 8 (53.3%) | 20 (100.0%) |
| 12 to 14 Years | 5 (100.0%) | 6 (85.7%) |
| 15 Years | 3 (100.0%) | 4 (66.7%) |
| 16 and 17 Years | 4 (100.0%) | 29 (96.7%) |
| 18 to 24 Years | 6 (100.0%) | 28 (100.0%) |
| 25 to 34 Years | 25 (80.6%) | 20 (95.2%) |
| 35 to 44 Years | 39 (95.1%) | 41 (93.2%) |
| 45 to 54 Years | 34 (100.0%) | 32 (100.0%) |
| 55 to 64 Years | 13 (76.5%) | 8 (88.9%) |
| 65 to 74 Years | 26 (100.0%) | 16 (100.0%) |
| 75 Years and over | 5 (100.0%) | 7 (87.5%) |
| Total | 178 (86.0%) | 223 (94.1%) |
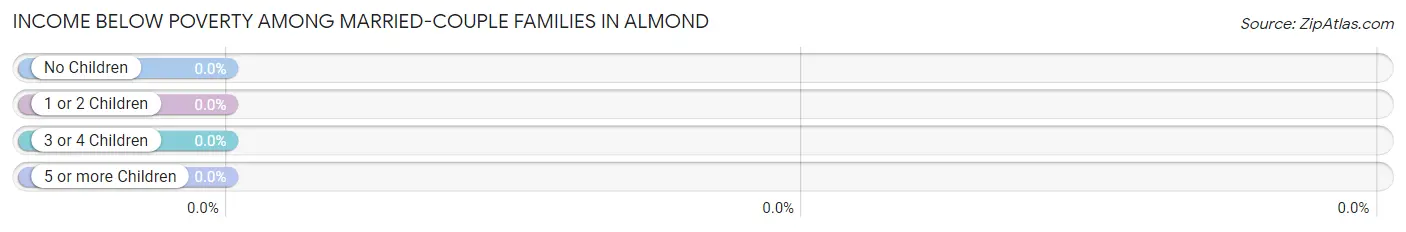
Income Below Poverty Among Married-Couple Families in Almond
| Children | Above Poverty | Below Poverty |
| No Children | 49 (100.0%) | 0 (0.0%) |
| 1 or 2 Children | 37 (100.0%) | 0 (0.0%) |
| 3 or 4 Children | 14 (100.0%) | 0 (0.0%) |
| 5 or more Children | 0 (0.0%) | 0 (0.0%) |
| Total | 100 (100.0%) | 0 (0.0%) |
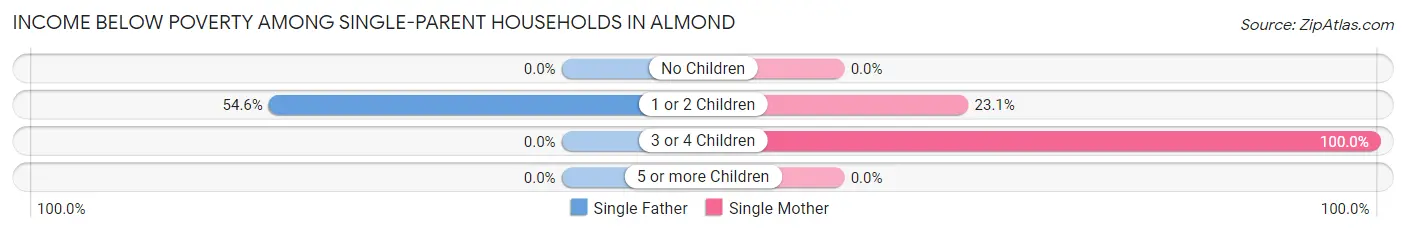
Income Below Poverty Among Single-Parent Households in Almond
According to the poverty data in Almond, 46.2% or 6 single-father households and 28.6% or 4 single-mother households are living below the poverty line. Among single-father households, those with 1 or 2 children have the highest poverty rate, with 6 households (54.5%) experiencing poverty. Likewise, among single-mother households, those with 3 or 4 children have the highest poverty rate, with 1 households (100.0%) falling below the poverty line.
| Children | Single Father | Single Mother |
| No Children | 0 (0.0%) | 0 (0.0%) |
| 1 or 2 Children | 6 (54.5%) | 3 (23.1%) |
| 3 or 4 Children | 0 (0.0%) | 1 (100.0%) |
| 5 or more Children | 0 (0.0%) | 0 (0.0%) |
| Total | 6 (46.2%) | 4 (28.6%) |
Income Below Poverty Among Married-Couple vs Single-Parent Households in Almond
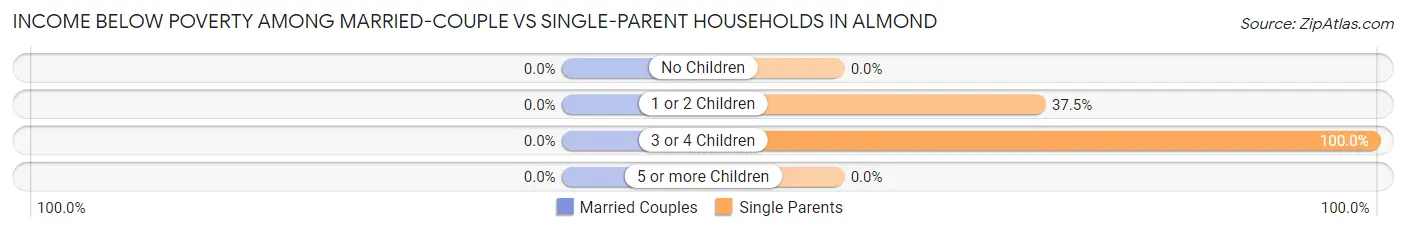
| Children | Married-Couple Families | Single-Parent Households |
| No Children | 0 (0.0%) | 0 (0.0%) |
| 1 or 2 Children | 0 (0.0%) | 9 (37.5%) |
| 3 or 4 Children | 0 (0.0%) | 1 (100.0%) |
| 5 or more Children | 0 (0.0%) | 0 (0.0%) |
| Total | 0 (0.0%) | 10 (37.0%) |
Employment Characteristics in Almond
Employment by Class of Employer in Almond
Among the 240 employed individuals in Almond, private company employees (182 | 75.8%), local government employees (14 | 5.8%), and not-for-profit organizations (13 | 5.4%) make up the most common classes of employment.
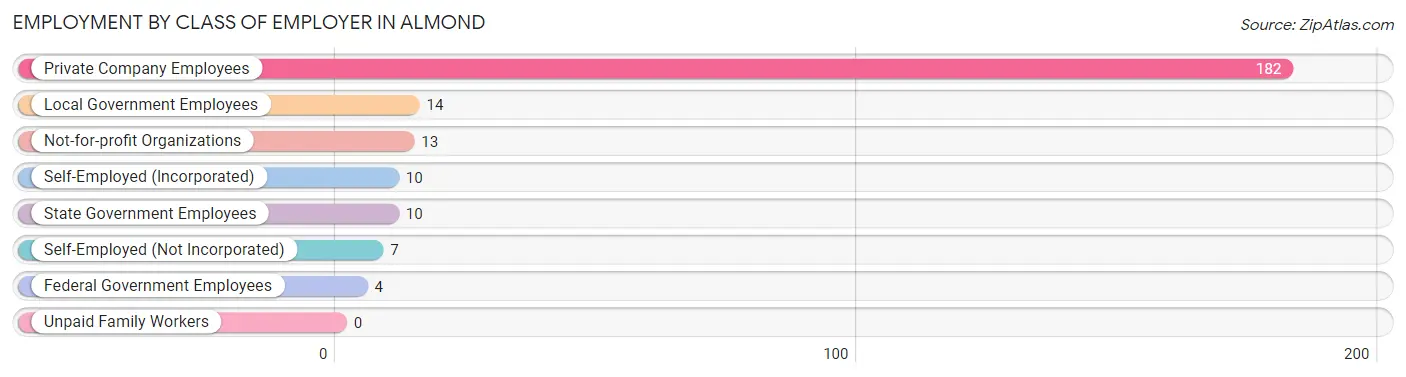
| Employer Class | # Employees | % Employees |
| Private Company Employees | 182 | 75.8% |
| Self-Employed (Incorporated) | 10 | 4.2% |
| Self-Employed (Not Incorporated) | 7 | 2.9% |
| Not-for-profit Organizations | 13 | 5.4% |
| Local Government Employees | 14 | 5.8% |
| State Government Employees | 10 | 4.2% |
| Federal Government Employees | 4 | 1.7% |
| Unpaid Family Workers | 0 | 0.0% |
| Total | 240 | 100.0% |
Employment Status by Age in Almond
According to the labor force statistics for Almond, out of the total population over 16 years of age (352), 68.8% or 242 individuals are in the labor force, with 0.4% or 1 of them unemployed. The age group with the highest labor force participation rate is 20 to 24 years, with 100.0% or 16 individuals in the labor force. Within the labor force, the 25 to 29 years age range has the highest percentage of unemployed individuals, with 8.3% or 1 of them being unemployed.
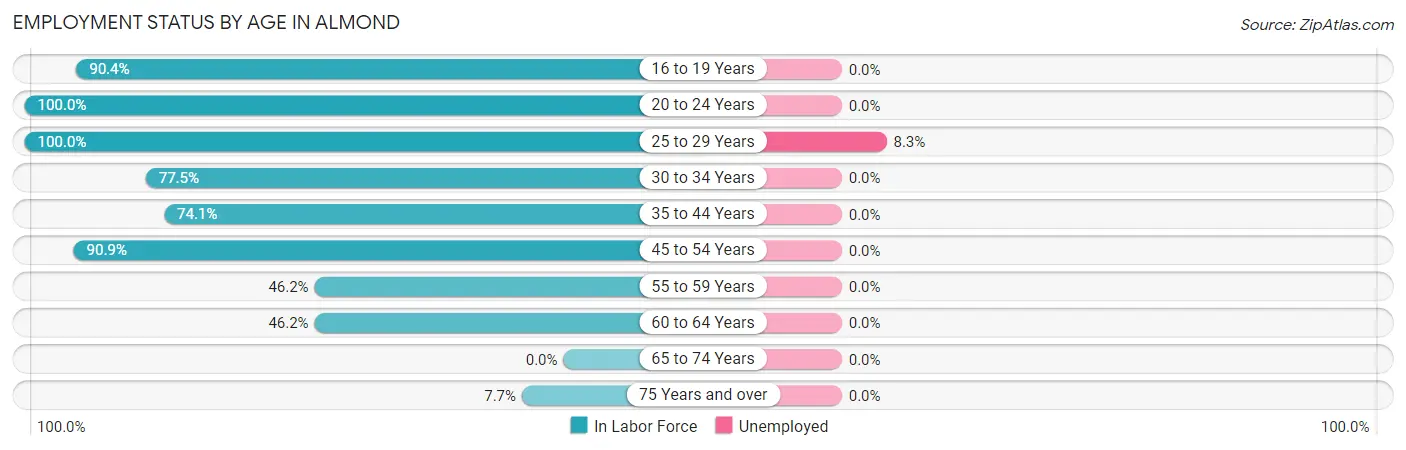
| Age Bracket | In Labor Force | Unemployed |
| 16 to 19 Years | 47 (90.4%) | 0 (0.0%) |
| 20 to 24 Years | 16 (100.0%) | 0 (0.0%) |
| 25 to 29 Years | 12 (100.0%) | 1 (8.3%) |
| 30 to 34 Years | 31 (77.5%) | 0 (0.0%) |
| 35 to 44 Years | 63 (74.1%) | 0 (0.0%) |
| 45 to 54 Years | 60 (90.9%) | 0 (0.0%) |
| 55 to 59 Years | 6 (46.2%) | 0 (0.0%) |
| 60 to 64 Years | 6 (46.2%) | 0 (0.0%) |
| 65 to 74 Years | 0 (0.0%) | 0 (0.0%) |
| 75 Years and over | 1 (7.7%) | 0 (0.0%) |
| Total | 242 (68.8%) | 1 (0.4%) |
Employment Status by Educational Attainment in Almond
According to labor force statistics for Almond, 77.7% of individuals (178) out of the total population between 25 and 64 years of age (229) are in the labor force, with 0.6% or 1 of them being unemployed. The group with the highest labor force participation rate are those with the educational attainment of less than high school, with 96.8% or 30 individuals in the labor force. Within the labor force, individuals with college / associate degree education have the highest percentage of unemployment, with 1.6% or 1 of them being unemployed.
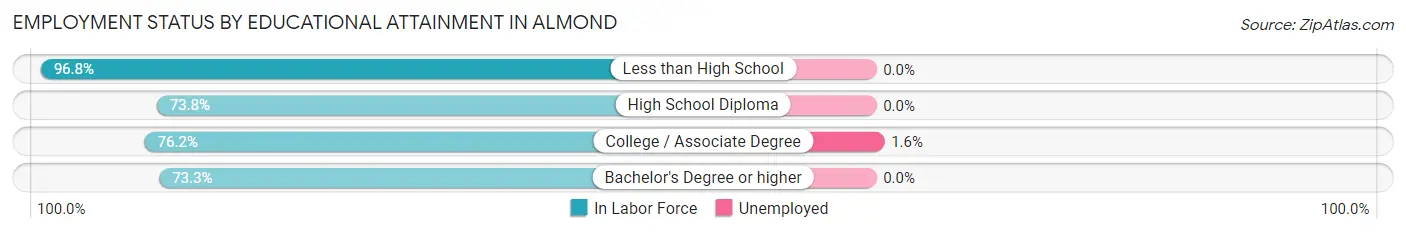
| Educational Attainment | In Labor Force | Unemployed |
| Less than High School | 30 (96.8%) | 0 (0.0%) |
| High School Diploma | 62 (73.8%) | 0 (0.0%) |
| College / Associate Degree | 64 (76.2%) | 1 (1.6%) |
| Bachelor's Degree or higher | 22 (73.3%) | 0 (0.0%) |
| Total | 178 (77.7%) | 1 (0.6%) |
Employment Occupations by Sex in Almond
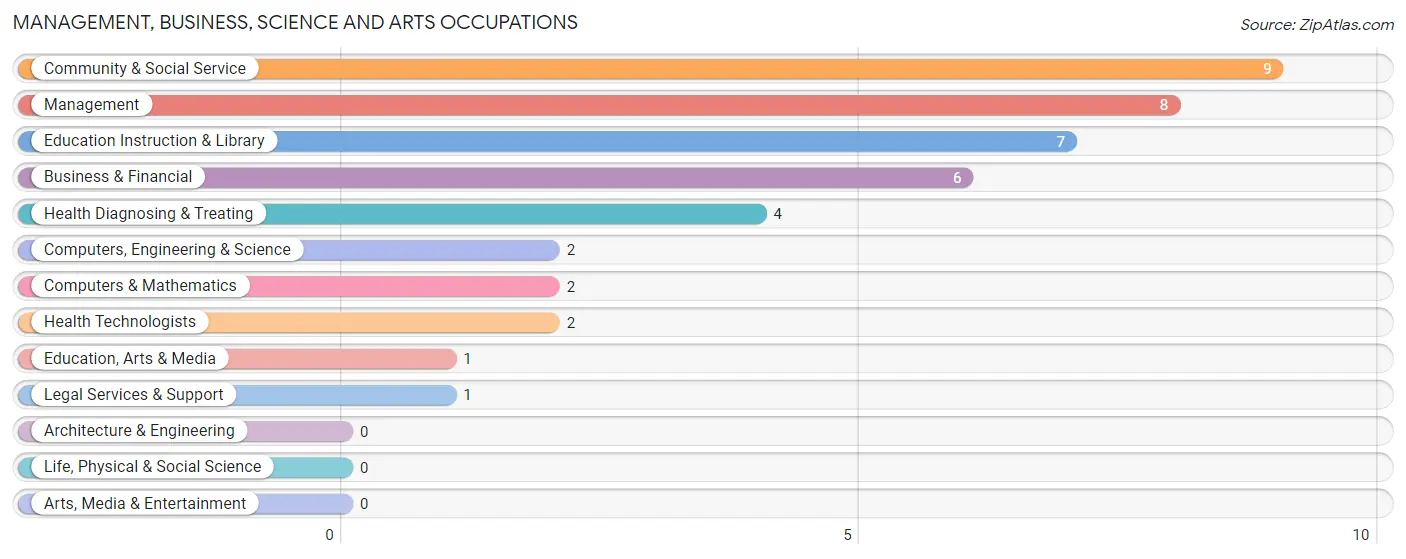
Management, Business, Science and Arts Occupations
The most common Management, Business, Science and Arts occupations in Almond are Community & Social Service (9 | 3.7%), Management (8 | 3.3%), Education Instruction & Library (7 | 2.9%), Business & Financial (6 | 2.5%), and Health Diagnosing & Treating (4 | 1.7%).
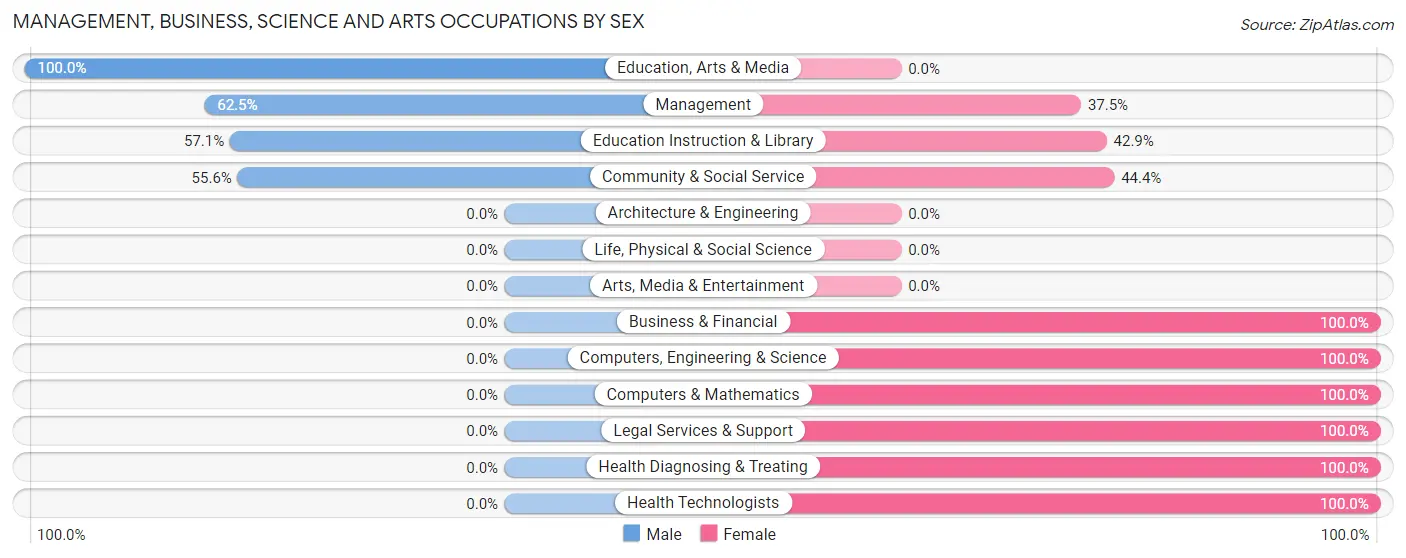
Management, Business, Science and Arts Occupations by Sex
Within the Management, Business, Science and Arts occupations in Almond, the most male-oriented occupations are Education, Arts & Media (100.0%), Management (62.5%), and Education Instruction & Library (57.1%), while the most female-oriented occupations are Business & Financial (100.0%), Computers, Engineering & Science (100.0%), and Computers & Mathematics (100.0%).
| Occupation | Male | Female |
| Management | 5 (62.5%) | 3 (37.5%) |
| Business & Financial | 0 (0.0%) | 6 (100.0%) |
| Computers, Engineering & Science | 0 (0.0%) | 2 (100.0%) |
| Computers & Mathematics | 0 (0.0%) | 2 (100.0%) |
| Architecture & Engineering | 0 (0.0%) | 0 (0.0%) |
| Life, Physical & Social Science | 0 (0.0%) | 0 (0.0%) |
| Community & Social Service | 5 (55.6%) | 4 (44.4%) |
| Education, Arts & Media | 1 (100.0%) | 0 (0.0%) |
| Legal Services & Support | 0 (0.0%) | 1 (100.0%) |
| Education Instruction & Library | 4 (57.1%) | 3 (42.9%) |
| Arts, Media & Entertainment | 0 (0.0%) | 0 (0.0%) |
| Health Diagnosing & Treating | 0 (0.0%) | 4 (100.0%) |
| Health Technologists | 0 (0.0%) | 2 (100.0%) |
| Total (Category) | 10 (34.5%) | 19 (65.5%) |
| Total (Overall) | 116 (48.1%) | 125 (51.9%) |
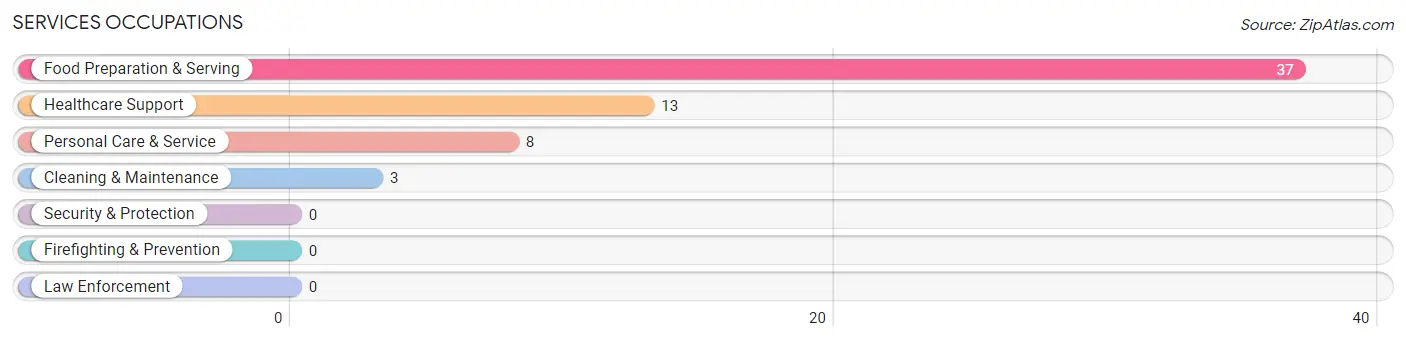
Services Occupations
The most common Services occupations in Almond are Food Preparation & Serving (37 | 15.3%), Healthcare Support (13 | 5.4%), Personal Care & Service (8 | 3.3%), and Cleaning & Maintenance (3 | 1.2%).
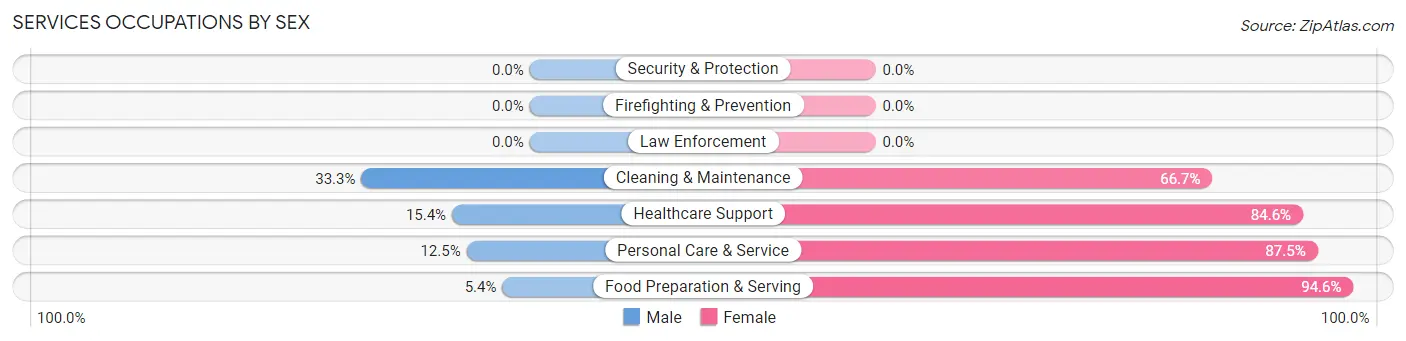
Services Occupations by Sex
Within the Services occupations in Almond, the most male-oriented occupations are Cleaning & Maintenance (33.3%), Healthcare Support (15.4%), and Personal Care & Service (12.5%), while the most female-oriented occupations are Food Preparation & Serving (94.6%), Personal Care & Service (87.5%), and Healthcare Support (84.6%).
| Occupation | Male | Female |
| Healthcare Support | 2 (15.4%) | 11 (84.6%) |
| Security & Protection | 0 (0.0%) | 0 (0.0%) |
| Firefighting & Prevention | 0 (0.0%) | 0 (0.0%) |
| Law Enforcement | 0 (0.0%) | 0 (0.0%) |
| Food Preparation & Serving | 2 (5.4%) | 35 (94.6%) |
| Cleaning & Maintenance | 1 (33.3%) | 2 (66.7%) |
| Personal Care & Service | 1 (12.5%) | 7 (87.5%) |
| Total (Category) | 6 (9.8%) | 55 (90.2%) |
| Total (Overall) | 116 (48.1%) | 125 (51.9%) |
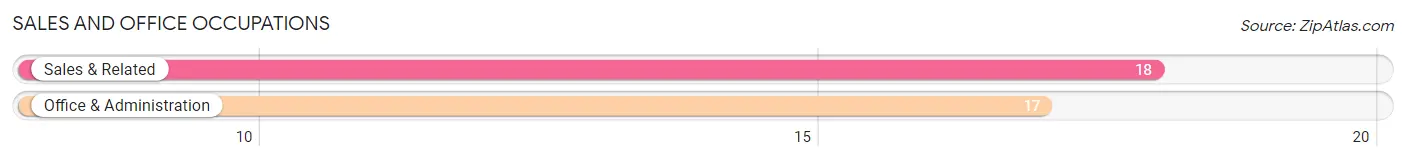
Sales and Office Occupations
The most common Sales and Office occupations in Almond are Sales & Related (18 | 7.5%), and Office & Administration (17 | 7.0%).
Sales and Office Occupations by Sex
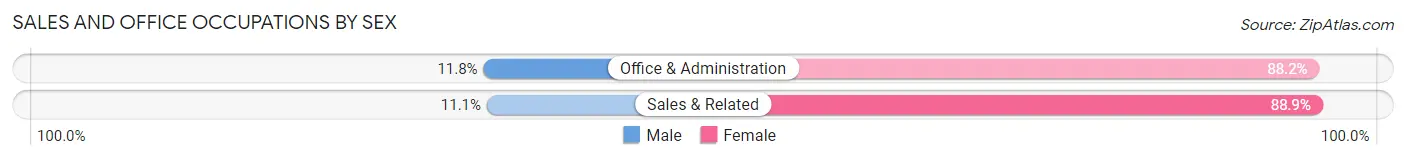
| Occupation | Male | Female |
| Sales & Related | 2 (11.1%) | 16 (88.9%) |
| Office & Administration | 2 (11.8%) | 15 (88.2%) |
| Total (Category) | 4 (11.4%) | 31 (88.6%) |
| Total (Overall) | 116 (48.1%) | 125 (51.9%) |
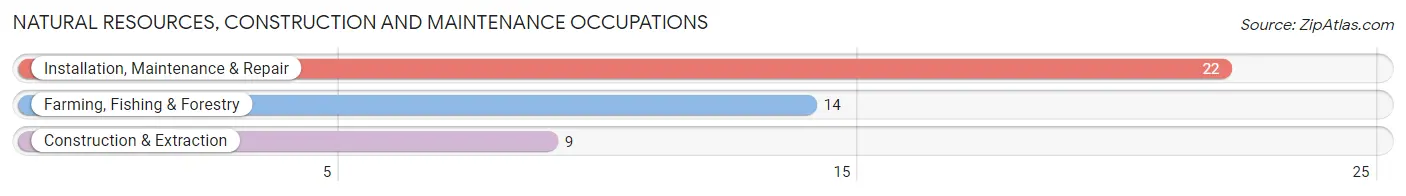
Natural Resources, Construction and Maintenance Occupations
The most common Natural Resources, Construction and Maintenance occupations in Almond are Installation, Maintenance & Repair (22 | 9.1%), Farming, Fishing & Forestry (14 | 5.8%), and Construction & Extraction (9 | 3.7%).
Natural Resources, Construction and Maintenance Occupations by Sex
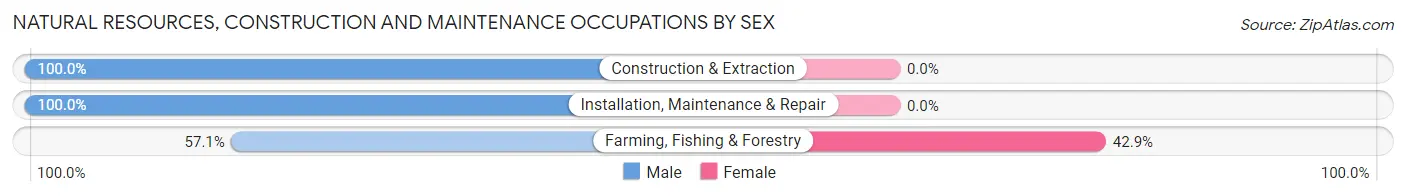
| Occupation | Male | Female |
| Farming, Fishing & Forestry | 8 (57.1%) | 6 (42.9%) |
| Construction & Extraction | 9 (100.0%) | 0 (0.0%) |
| Installation, Maintenance & Repair | 22 (100.0%) | 0 (0.0%) |
| Total (Category) | 39 (86.7%) | 6 (13.3%) |
| Total (Overall) | 116 (48.1%) | 125 (51.9%) |
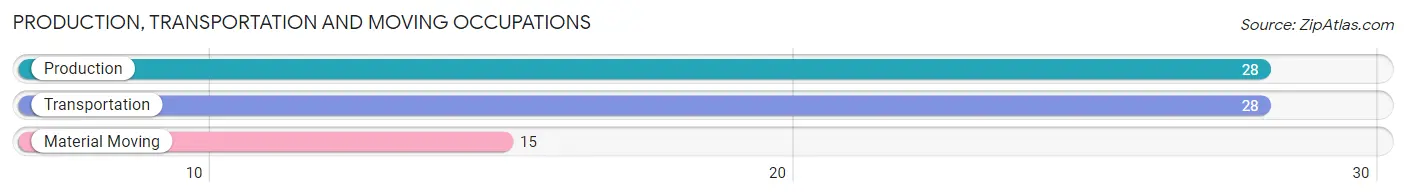
Production, Transportation and Moving Occupations
The most common Production, Transportation and Moving occupations in Almond are Production (28 | 11.6%), Transportation (28 | 11.6%), and Material Moving (15 | 6.2%).
Production, Transportation and Moving Occupations by Sex
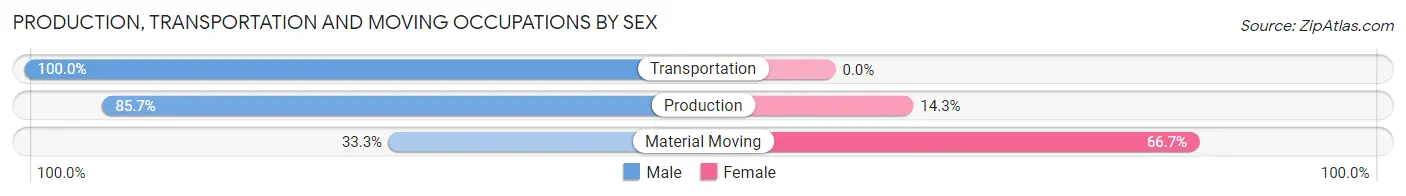
| Occupation | Male | Female |
| Production | 24 (85.7%) | 4 (14.3%) |
| Transportation | 28 (100.0%) | 0 (0.0%) |
| Material Moving | 5 (33.3%) | 10 (66.7%) |
| Total (Category) | 57 (80.3%) | 14 (19.7%) |
| Total (Overall) | 116 (48.1%) | 125 (51.9%) |
Employment Industries by Sex in Almond
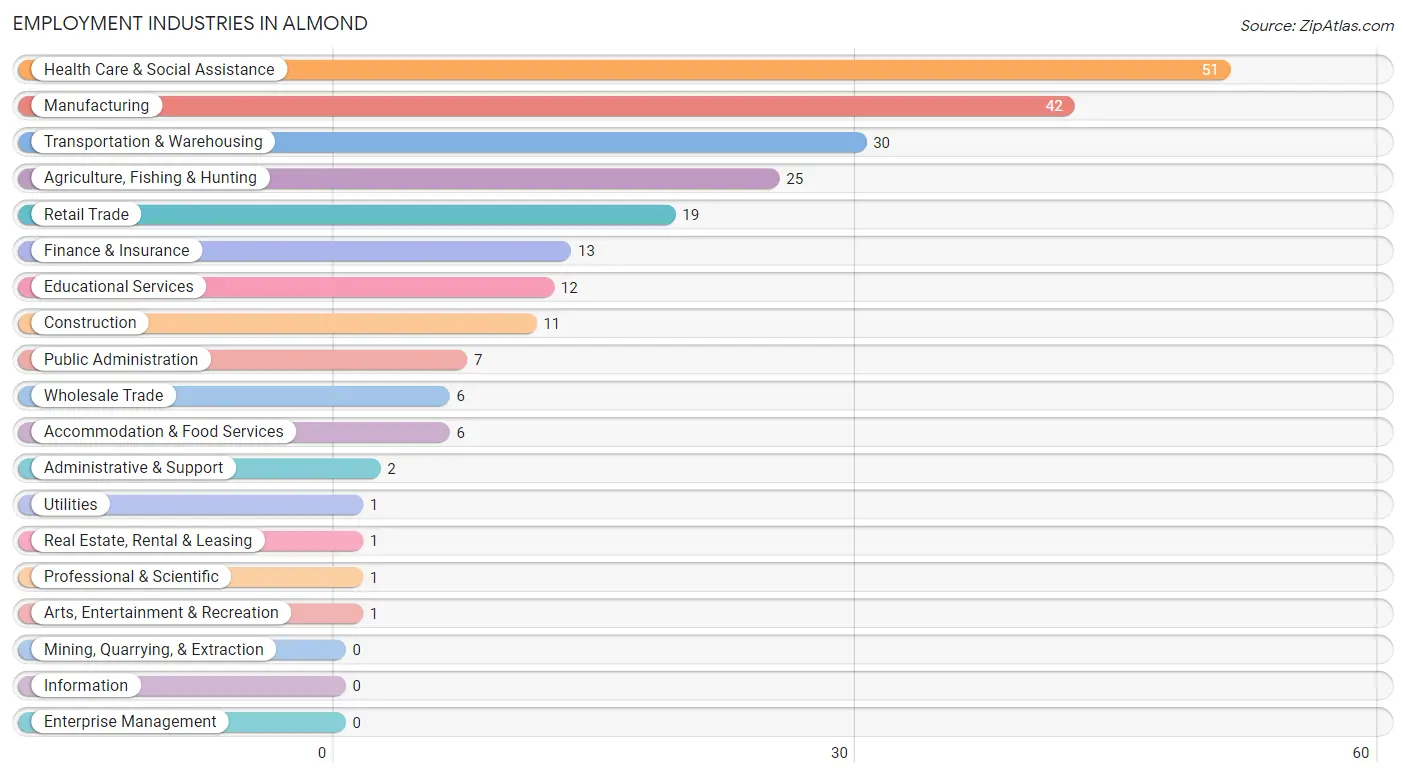
Employment Industries in Almond
The major employment industries in Almond include Health Care & Social Assistance (51 | 21.2%), Manufacturing (42 | 17.4%), Transportation & Warehousing (30 | 12.4%), Agriculture, Fishing & Hunting (25 | 10.4%), and Retail Trade (19 | 7.9%).
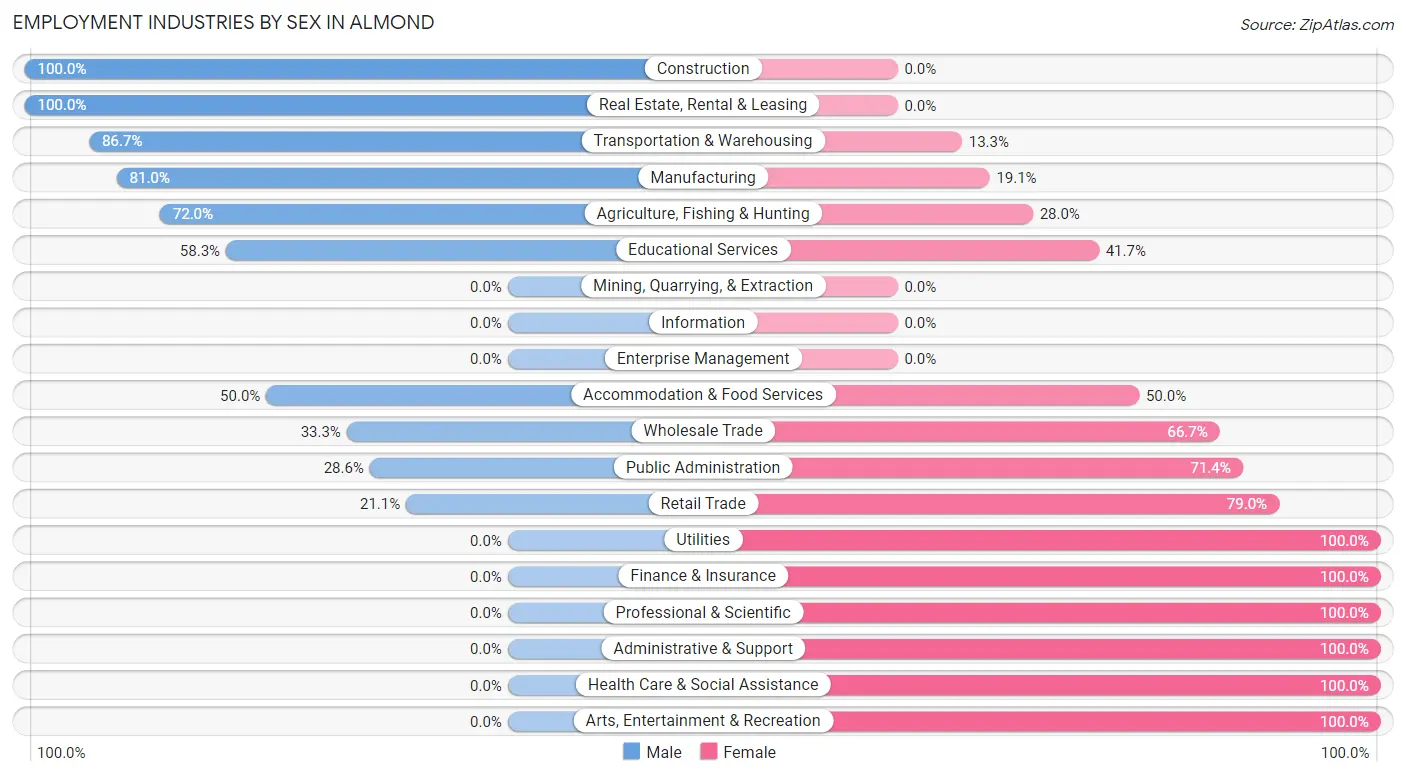
Employment Industries by Sex in Almond
The Almond industries that see more men than women are Construction (100.0%), Real Estate, Rental & Leasing (100.0%), and Transportation & Warehousing (86.7%), whereas the industries that tend to have a higher number of women are Utilities (100.0%), Finance & Insurance (100.0%), and Professional & Scientific (100.0%).
| Industry | Male | Female |
| Agriculture, Fishing & Hunting | 18 (72.0%) | 7 (28.0%) |
| Mining, Quarrying, & Extraction | 0 (0.0%) | 0 (0.0%) |
| Construction | 11 (100.0%) | 0 (0.0%) |
| Manufacturing | 34 (80.9%) | 8 (19.1%) |
| Wholesale Trade | 2 (33.3%) | 4 (66.7%) |
| Retail Trade | 4 (21.0%) | 15 (78.9%) |
| Transportation & Warehousing | 26 (86.7%) | 4 (13.3%) |
| Utilities | 0 (0.0%) | 1 (100.0%) |
| Information | 0 (0.0%) | 0 (0.0%) |
| Finance & Insurance | 0 (0.0%) | 13 (100.0%) |
| Real Estate, Rental & Leasing | 1 (100.0%) | 0 (0.0%) |
| Professional & Scientific | 0 (0.0%) | 1 (100.0%) |
| Enterprise Management | 0 (0.0%) | 0 (0.0%) |
| Administrative & Support | 0 (0.0%) | 2 (100.0%) |
| Educational Services | 7 (58.3%) | 5 (41.7%) |
| Health Care & Social Assistance | 0 (0.0%) | 51 (100.0%) |
| Arts, Entertainment & Recreation | 0 (0.0%) | 1 (100.0%) |
| Accommodation & Food Services | 3 (50.0%) | 3 (50.0%) |
| Public Administration | 2 (28.6%) | 5 (71.4%) |
| Total | 116 (48.1%) | 125 (51.9%) |
Education in Almond
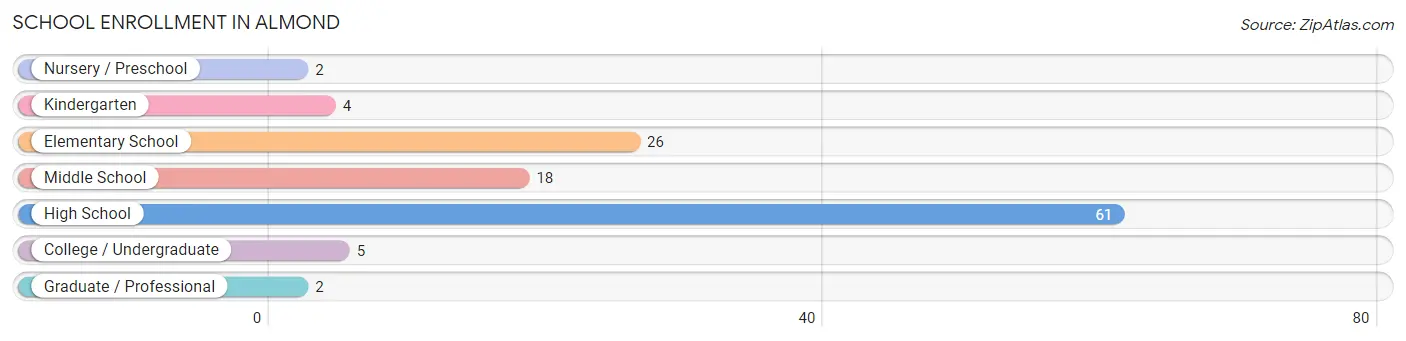
School Enrollment in Almond
The most common levels of schooling among the 118 students in Almond are high school (61 | 51.7%), elementary school (26 | 22.0%), and middle school (18 | 15.2%).
| School Level | # Students | % Students |
| Nursery / Preschool | 2 | 1.7% |
| Kindergarten | 4 | 3.4% |
| Elementary School | 26 | 22.0% |
| Middle School | 18 | 15.2% |
| High School | 61 | 51.7% |
| College / Undergraduate | 5 | 4.2% |
| Graduate / Professional | 2 | 1.7% |
| Total | 118 | 100.0% |
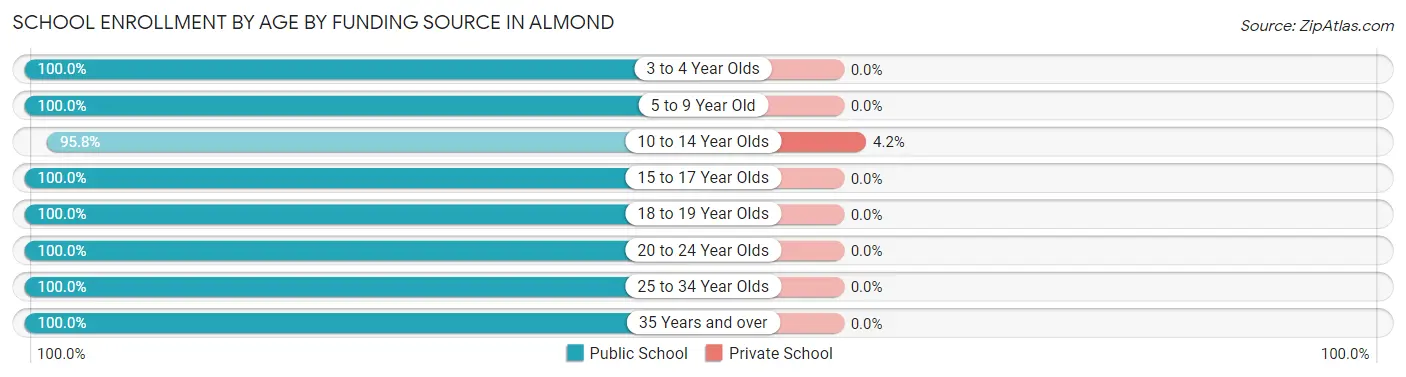
School Enrollment by Age by Funding Source in Almond
Out of a total of 118 students who are enrolled in schools in Almond, 1 (0.8%) attend a private institution, while the remaining 117 (99.2%) are enrolled in public schools. The age group of 10 to 14 year olds has the highest likelihood of being enrolled in private schools, with 1 (4.2% in the age bracket) enrolled. Conversely, the age group of 3 to 4 year olds has the lowest likelihood of being enrolled in a private school, with 1 (100.0% in the age bracket) attending a public institution.
| Age Bracket | Public School | Private School |
| 3 to 4 Year Olds | 1 (100.0%) | 0 (0.0%) |
| 5 to 9 Year Old | 26 (100.0%) | 0 (0.0%) |
| 10 to 14 Year Olds | 23 (95.8%) | 1 (4.2%) |
| 15 to 17 Year Olds | 42 (100.0%) | 0 (0.0%) |
| 18 to 19 Year Olds | 18 (100.0%) | 0 (0.0%) |
| 20 to 24 Year Olds | 2 (100.0%) | 0 (0.0%) |
| 25 to 34 Year Olds | 3 (100.0%) | 0 (0.0%) |
| 35 Years and over | 2 (100.0%) | 0 (0.0%) |
| Total | 117 (99.2%) | 1 (0.8%) |
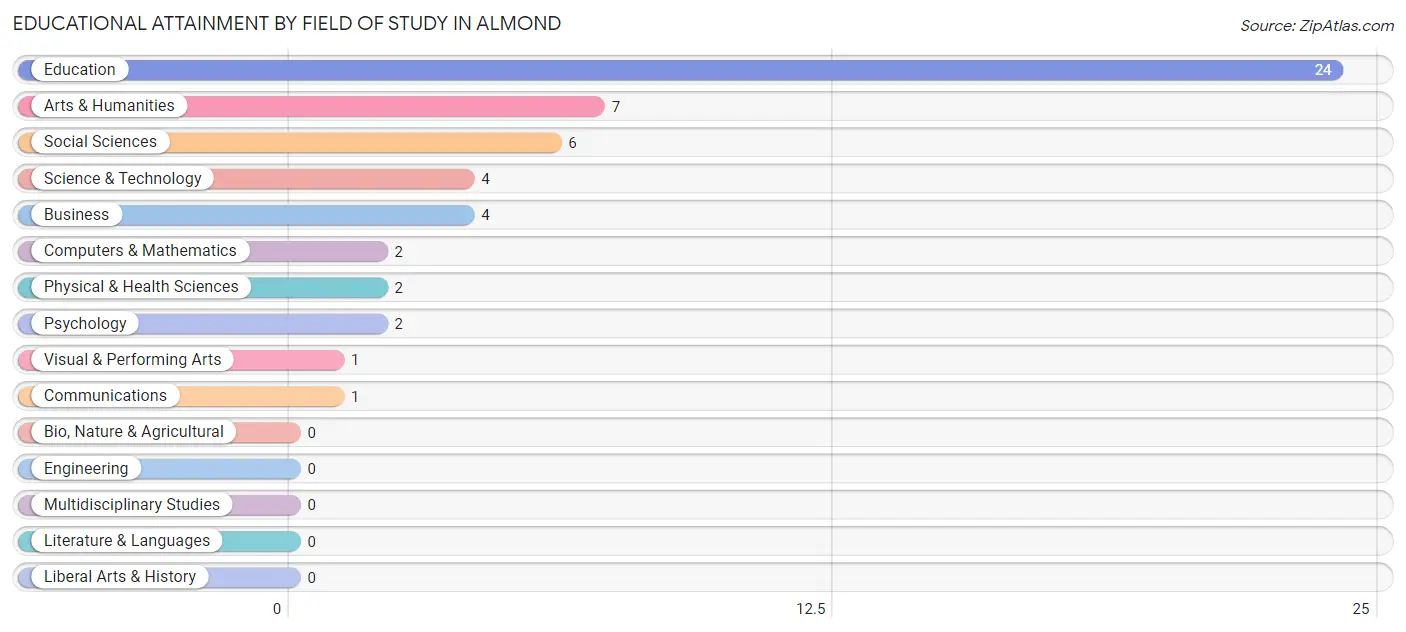
Educational Attainment by Field of Study in Almond
Education (24 | 45.3%), arts & humanities (7 | 13.2%), social sciences (6 | 11.3%), science & technology (4 | 7.5%), and business (4 | 7.5%) are the most common fields of study among 53 individuals in Almond who have obtained a bachelor's degree or higher.
| Field of Study | # Graduates | % Graduates |
| Computers & Mathematics | 2 | 3.8% |
| Bio, Nature & Agricultural | 0 | 0.0% |
| Physical & Health Sciences | 2 | 3.8% |
| Psychology | 2 | 3.8% |
| Social Sciences | 6 | 11.3% |
| Engineering | 0 | 0.0% |
| Multidisciplinary Studies | 0 | 0.0% |
| Science & Technology | 4 | 7.5% |
| Business | 4 | 7.5% |
| Education | 24 | 45.3% |
| Literature & Languages | 0 | 0.0% |
| Liberal Arts & History | 0 | 0.0% |
| Visual & Performing Arts | 1 | 1.9% |
| Communications | 1 | 1.9% |
| Arts & Humanities | 7 | 13.2% |
| Total | 53 | 100.0% |
Transportation & Commute in Almond
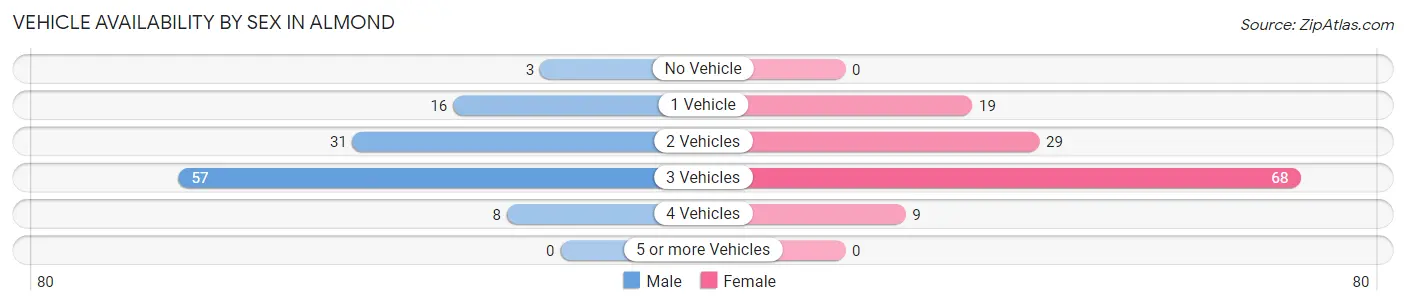
Vehicle Availability by Sex in Almond
The most prevalent vehicle ownership categories in Almond are males with 3 vehicles (57, accounting for 49.6%) and females with 3 vehicles (68, making up 45.6%).
| Vehicles Available | Male | Female |
| No Vehicle | 3 (2.6%) | 0 (0.0%) |
| 1 Vehicle | 16 (13.9%) | 19 (15.2%) |
| 2 Vehicles | 31 (27.0%) | 29 (23.2%) |
| 3 Vehicles | 57 (49.6%) | 68 (54.4%) |
| 4 Vehicles | 8 (7.0%) | 9 (7.2%) |
| 5 or more Vehicles | 0 (0.0%) | 0 (0.0%) |
| Total | 115 (100.0%) | 125 (100.0%) |
Commute Time in Almond
The most frequently occuring commute durations in Almond are 40 to 44 minutes (55 commuters, 23.1%), 30 to 34 minutes (47 commuters, 19.8%), and 25 to 29 minutes (35 commuters, 14.7%).
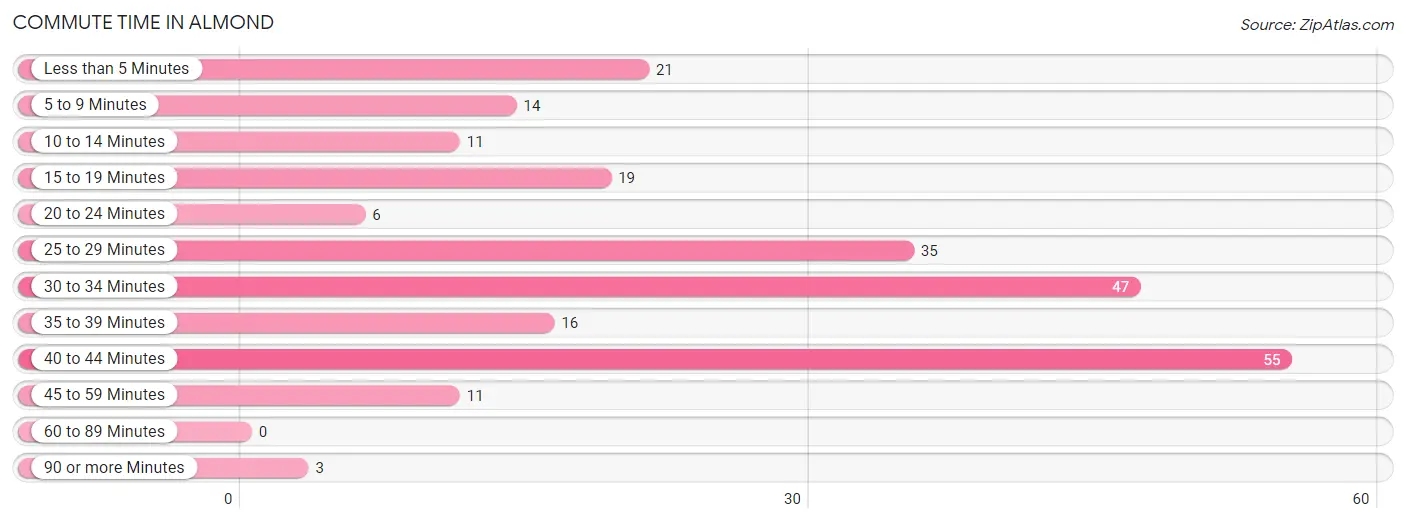
| Commute Time | # Commuters | % Commuters |
| Less than 5 Minutes | 21 | 8.8% |
| 5 to 9 Minutes | 14 | 5.9% |
| 10 to 14 Minutes | 11 | 4.6% |
| 15 to 19 Minutes | 19 | 8.0% |
| 20 to 24 Minutes | 6 | 2.5% |
| 25 to 29 Minutes | 35 | 14.7% |
| 30 to 34 Minutes | 47 | 19.8% |
| 35 to 39 Minutes | 16 | 6.7% |
| 40 to 44 Minutes | 55 | 23.1% |
| 45 to 59 Minutes | 11 | 4.6% |
| 60 to 89 Minutes | 0 | 0.0% |
| 90 or more Minutes | 3 | 1.3% |
Commute Time by Sex in Almond
The most common commute times in Almond are 40 to 44 minutes (21 commuters, 18.4%) for males and 40 to 44 minutes (34 commuters, 27.4%) for females.
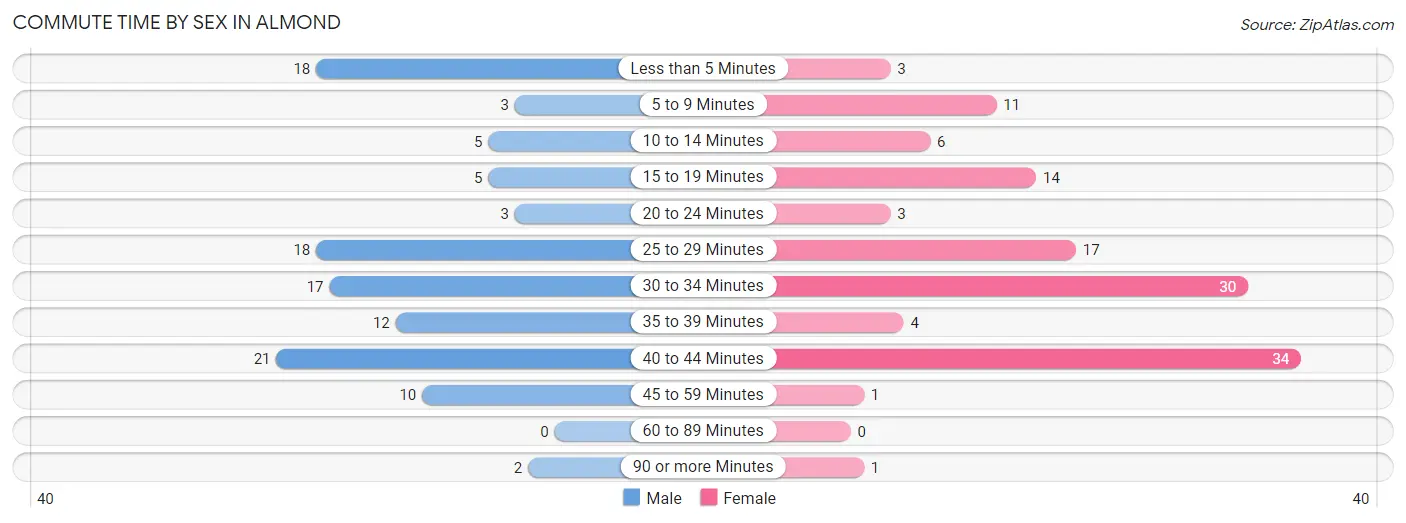
| Commute Time | Male | Female |
| Less than 5 Minutes | 18 (15.8%) | 3 (2.4%) |
| 5 to 9 Minutes | 3 (2.6%) | 11 (8.9%) |
| 10 to 14 Minutes | 5 (4.4%) | 6 (4.8%) |
| 15 to 19 Minutes | 5 (4.4%) | 14 (11.3%) |
| 20 to 24 Minutes | 3 (2.6%) | 3 (2.4%) |
| 25 to 29 Minutes | 18 (15.8%) | 17 (13.7%) |
| 30 to 34 Minutes | 17 (14.9%) | 30 (24.2%) |
| 35 to 39 Minutes | 12 (10.5%) | 4 (3.2%) |
| 40 to 44 Minutes | 21 (18.4%) | 34 (27.4%) |
| 45 to 59 Minutes | 10 (8.8%) | 1 (0.8%) |
| 60 to 89 Minutes | 0 (0.0%) | 0 (0.0%) |
| 90 or more Minutes | 2 (1.8%) | 1 (0.8%) |
Time of Departure to Work by Sex in Almond
The most frequent times of departure to work in Almond are 6:00 AM to 6:29 AM (24, 21.0%) for males and 12:00 PM to 3:59 PM (29, 23.4%) for females.
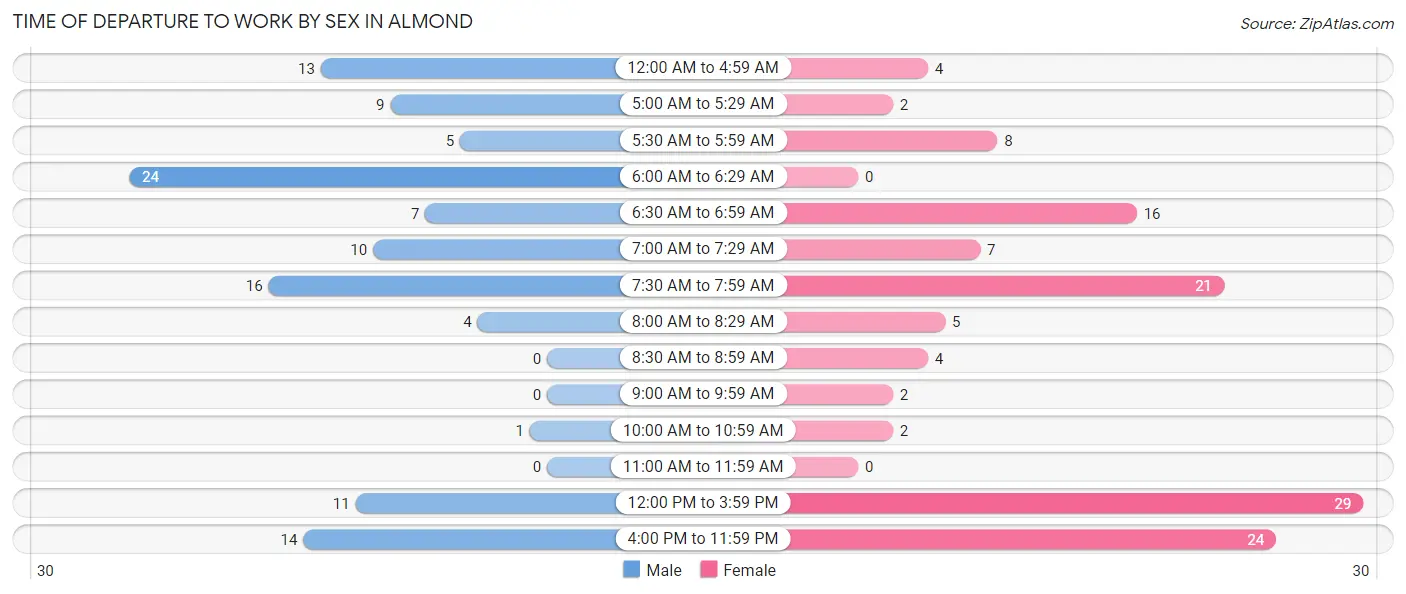
| Time of Departure | Male | Female |
| 12:00 AM to 4:59 AM | 13 (11.4%) | 4 (3.2%) |
| 5:00 AM to 5:29 AM | 9 (7.9%) | 2 (1.6%) |
| 5:30 AM to 5:59 AM | 5 (4.4%) | 8 (6.5%) |
| 6:00 AM to 6:29 AM | 24 (21.0%) | 0 (0.0%) |
| 6:30 AM to 6:59 AM | 7 (6.1%) | 16 (12.9%) |
| 7:00 AM to 7:29 AM | 10 (8.8%) | 7 (5.7%) |
| 7:30 AM to 7:59 AM | 16 (14.0%) | 21 (16.9%) |
| 8:00 AM to 8:29 AM | 4 (3.5%) | 5 (4.0%) |
| 8:30 AM to 8:59 AM | 0 (0.0%) | 4 (3.2%) |
| 9:00 AM to 9:59 AM | 0 (0.0%) | 2 (1.6%) |
| 10:00 AM to 10:59 AM | 1 (0.9%) | 2 (1.6%) |
| 11:00 AM to 11:59 AM | 0 (0.0%) | 0 (0.0%) |
| 12:00 PM to 3:59 PM | 11 (9.7%) | 29 (23.4%) |
| 4:00 PM to 11:59 PM | 14 (12.3%) | 24 (19.4%) |
| Total | 114 (100.0%) | 124 (100.0%) |
Housing Occupancy in Almond
Occupancy by Ownership in Almond
Of the total 175 dwellings in Almond, owner-occupied units account for 133 (76.0%), while renter-occupied units make up 42 (24.0%).
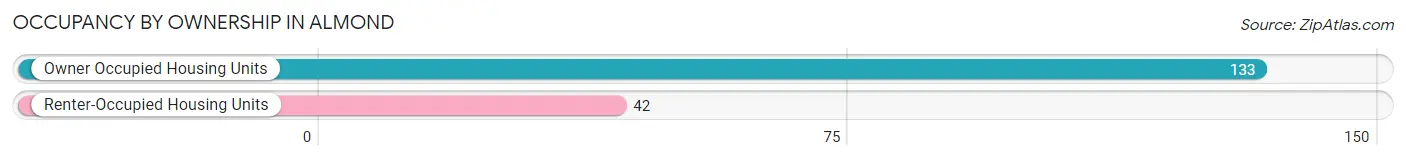
| Occupancy | # Housing Units | % Housing Units |
| Owner Occupied Housing Units | 133 | 76.0% |
| Renter-Occupied Housing Units | 42 | 24.0% |
| Total Occupied Housing Units | 175 | 100.0% |
Occupancy by Household Size in Almond
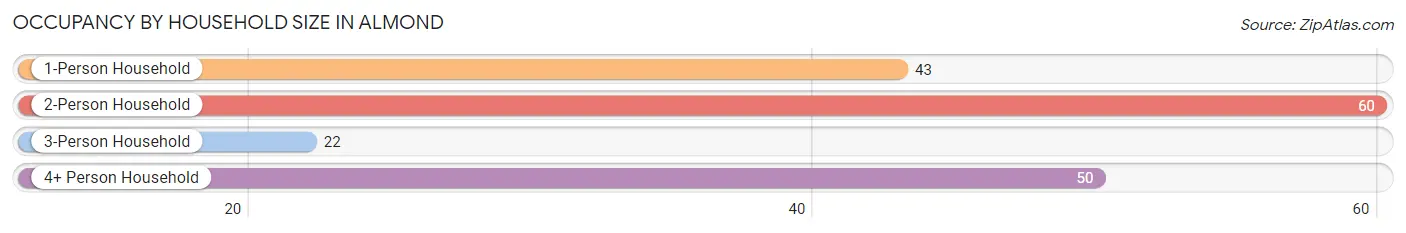
| Household Size | # Housing Units | % Housing Units |
| 1-Person Household | 43 | 24.6% |
| 2-Person Household | 60 | 34.3% |
| 3-Person Household | 22 | 12.6% |
| 4+ Person Household | 50 | 28.6% |
| Total Housing Units | 175 | 100.0% |
Occupancy by Ownership by Household Size in Almond
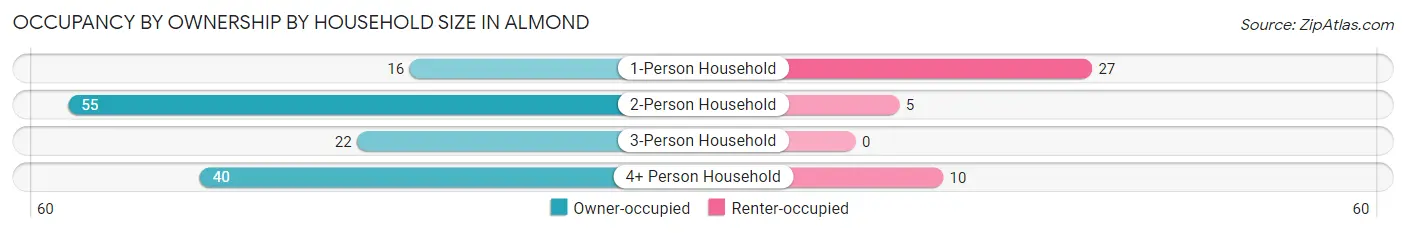
| Household Size | Owner-occupied | Renter-occupied |
| 1-Person Household | 16 (37.2%) | 27 (62.8%) |
| 2-Person Household | 55 (91.7%) | 5 (8.3%) |
| 3-Person Household | 22 (100.0%) | 0 (0.0%) |
| 4+ Person Household | 40 (80.0%) | 10 (20.0%) |
| Total Housing Units | 133 (76.0%) | 42 (24.0%) |
Occupancy by Educational Attainment in Almond
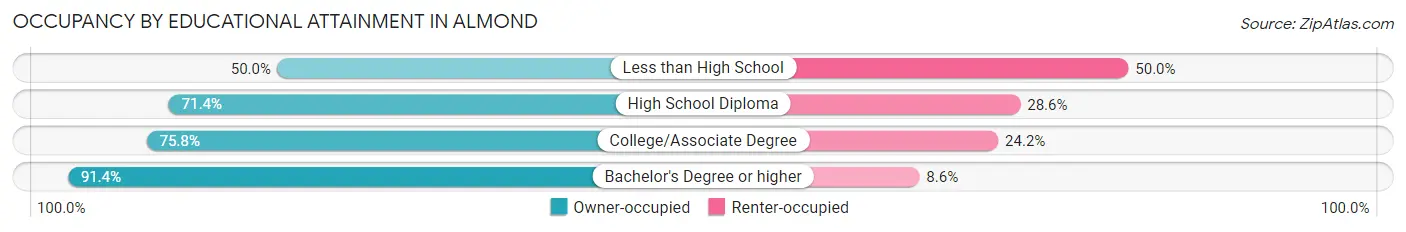
| Household Size | Owner-occupied | Renter-occupied |
| Less than High School | 4 (50.0%) | 4 (50.0%) |
| High School Diploma | 50 (71.4%) | 20 (28.6%) |
| College/Associate Degree | 47 (75.8%) | 15 (24.2%) |
| Bachelor's Degree or higher | 32 (91.4%) | 3 (8.6%) |
Occupancy by Age of Householder in Almond
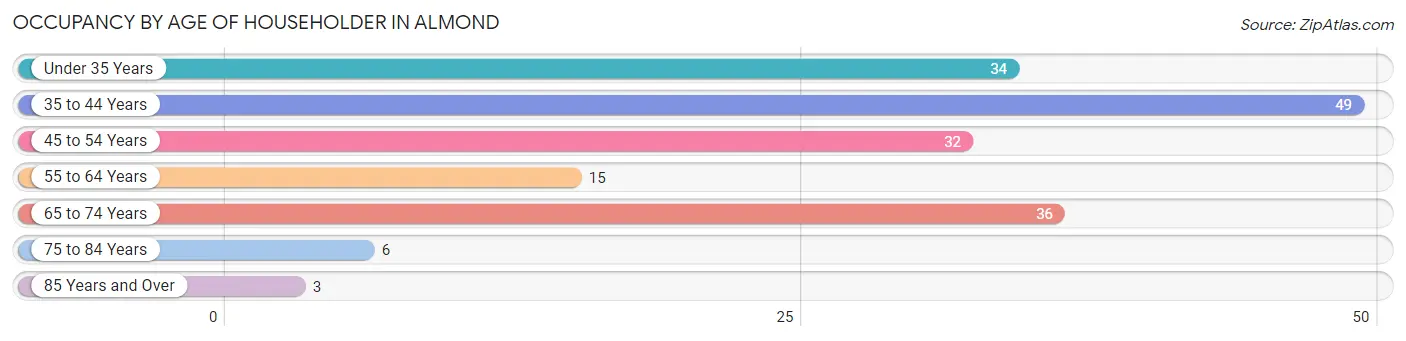
| Age Bracket | # Households | % Households |
| Under 35 Years | 34 | 19.4% |
| 35 to 44 Years | 49 | 28.0% |
| 45 to 54 Years | 32 | 18.3% |
| 55 to 64 Years | 15 | 8.6% |
| 65 to 74 Years | 36 | 20.6% |
| 75 to 84 Years | 6 | 3.4% |
| 85 Years and Over | 3 | 1.7% |
| Total | 175 | 100.0% |
Housing Finances in Almond
Median Income by Occupancy in Almond
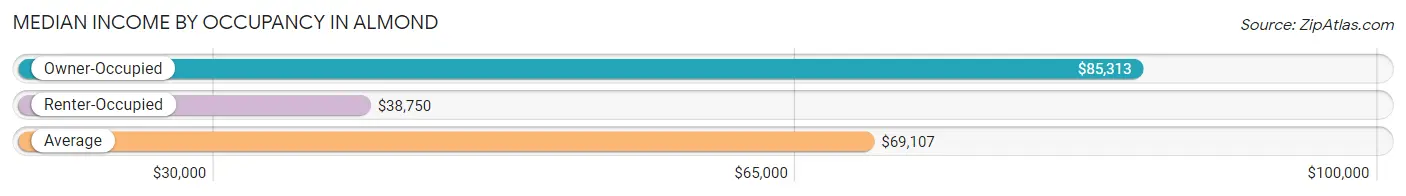
| Occupancy Type | # Households | Median Income |
| Owner-Occupied | 133 (76.0%) | $85,313 |
| Renter-Occupied | 42 (24.0%) | $38,750 |
| Average | 175 (100.0%) | $69,107 |
Occupancy by Householder Income Bracket in Almond
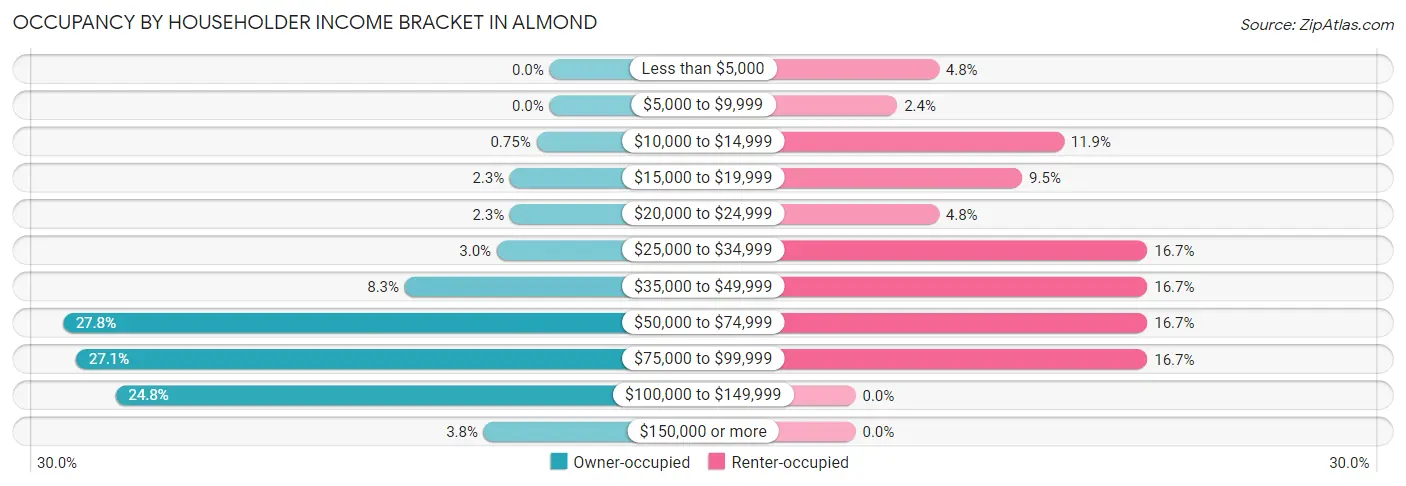
| Income Bracket | Owner-occupied | Renter-occupied |
| Less than $5,000 | 0 (0.0%) | 2 (4.8%) |
| $5,000 to $9,999 | 0 (0.0%) | 1 (2.4%) |
| $10,000 to $14,999 | 1 (0.7%) | 5 (11.9%) |
| $15,000 to $19,999 | 3 (2.3%) | 4 (9.5%) |
| $20,000 to $24,999 | 3 (2.3%) | 2 (4.8%) |
| $25,000 to $34,999 | 4 (3.0%) | 7 (16.7%) |
| $35,000 to $49,999 | 11 (8.3%) | 7 (16.7%) |
| $50,000 to $74,999 | 37 (27.8%) | 7 (16.7%) |
| $75,000 to $99,999 | 36 (27.1%) | 7 (16.7%) |
| $100,000 to $149,999 | 33 (24.8%) | 0 (0.0%) |
| $150,000 or more | 5 (3.8%) | 0 (0.0%) |
| Total | 133 (100.0%) | 42 (100.0%) |
Monthly Housing Cost Tiers in Almond
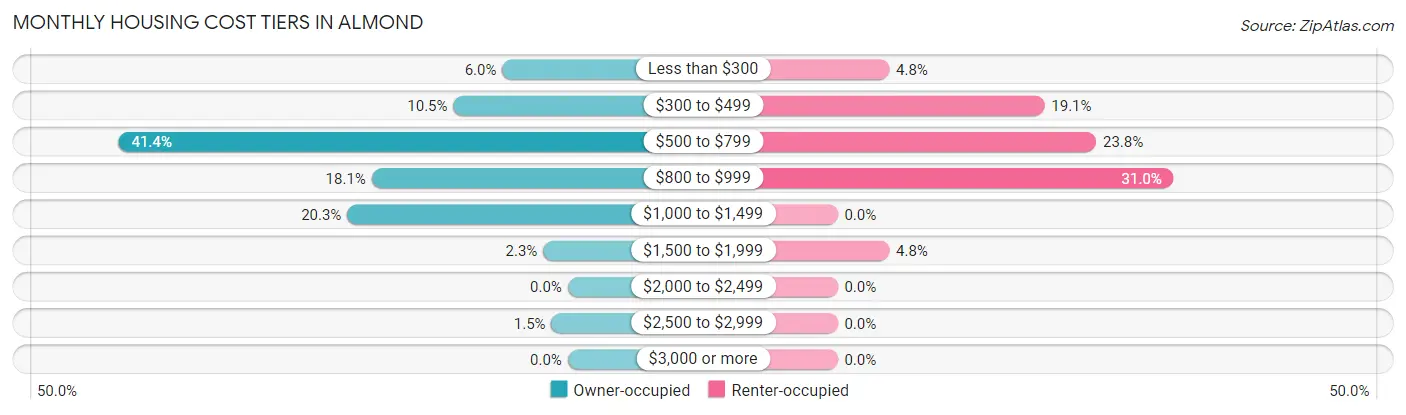
| Monthly Cost | Owner-occupied | Renter-occupied |
| Less than $300 | 8 (6.0%) | 2 (4.8%) |
| $300 to $499 | 14 (10.5%) | 8 (19.1%) |
| $500 to $799 | 55 (41.3%) | 10 (23.8%) |
| $800 to $999 | 24 (18.0%) | 13 (30.9%) |
| $1,000 to $1,499 | 27 (20.3%) | 0 (0.0%) |
| $1,500 to $1,999 | 3 (2.3%) | 2 (4.8%) |
| $2,000 to $2,499 | 0 (0.0%) | 0 (0.0%) |
| $2,500 to $2,999 | 2 (1.5%) | 0 (0.0%) |
| $3,000 or more | 0 (0.0%) | 0 (0.0%) |
| Total | 133 (100.0%) | 42 (100.0%) |
Physical Housing Characteristics in Almond
Housing Structures in Almond
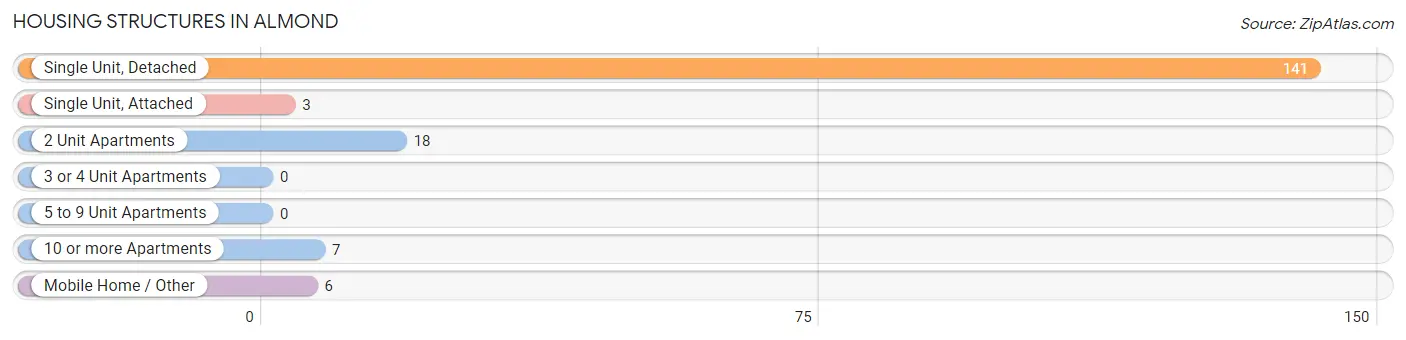
| Structure Type | # Housing Units | % Housing Units |
| Single Unit, Detached | 141 | 80.6% |
| Single Unit, Attached | 3 | 1.7% |
| 2 Unit Apartments | 18 | 10.3% |
| 3 or 4 Unit Apartments | 0 | 0.0% |
| 5 to 9 Unit Apartments | 0 | 0.0% |
| 10 or more Apartments | 7 | 4.0% |
| Mobile Home / Other | 6 | 3.4% |
| Total | 175 | 100.0% |
Housing Structures by Occupancy in Almond
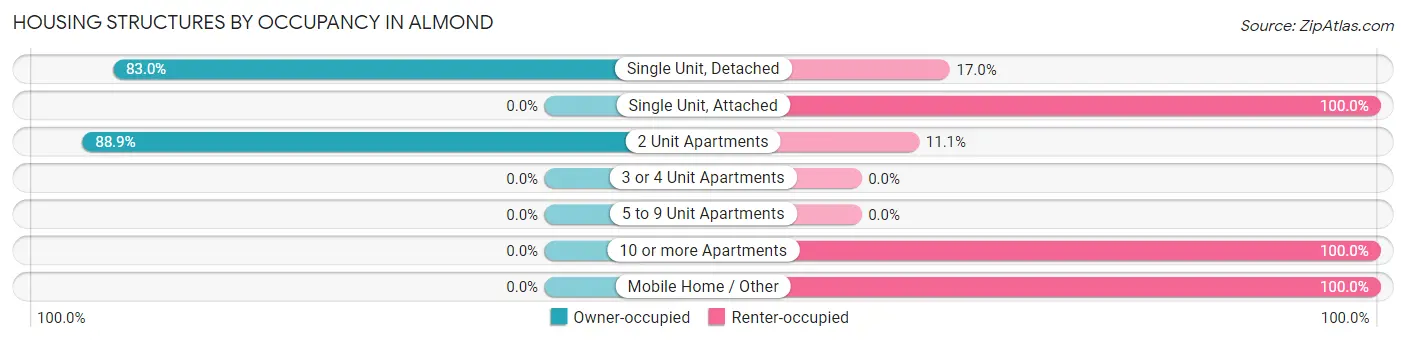
| Structure Type | Owner-occupied | Renter-occupied |
| Single Unit, Detached | 117 (83.0%) | 24 (17.0%) |
| Single Unit, Attached | 0 (0.0%) | 3 (100.0%) |
| 2 Unit Apartments | 16 (88.9%) | 2 (11.1%) |
| 3 or 4 Unit Apartments | 0 (0.0%) | 0 (0.0%) |
| 5 to 9 Unit Apartments | 0 (0.0%) | 0 (0.0%) |
| 10 or more Apartments | 0 (0.0%) | 7 (100.0%) |
| Mobile Home / Other | 0 (0.0%) | 6 (100.0%) |
| Total | 133 (76.0%) | 42 (24.0%) |
Housing Structures by Number of Rooms in Almond
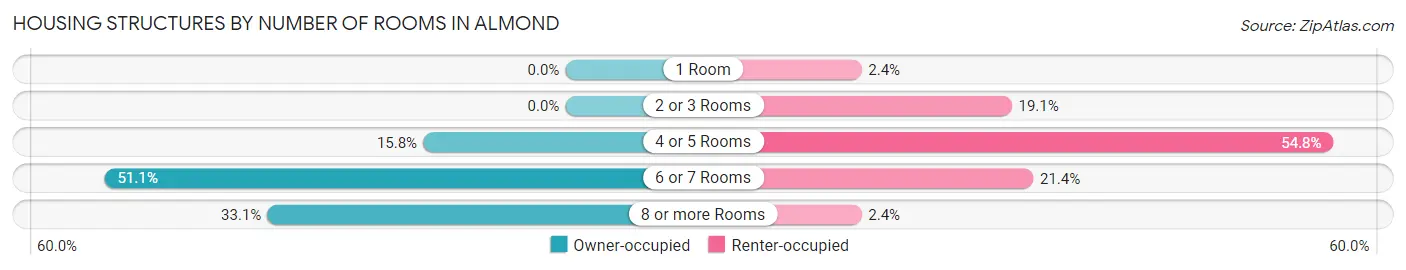
| Number of Rooms | Owner-occupied | Renter-occupied |
| 1 Room | 0 (0.0%) | 1 (2.4%) |
| 2 or 3 Rooms | 0 (0.0%) | 8 (19.1%) |
| 4 or 5 Rooms | 21 (15.8%) | 23 (54.8%) |
| 6 or 7 Rooms | 68 (51.1%) | 9 (21.4%) |
| 8 or more Rooms | 44 (33.1%) | 1 (2.4%) |
| Total | 133 (100.0%) | 42 (100.0%) |
Housing Structure by Heating Type in Almond
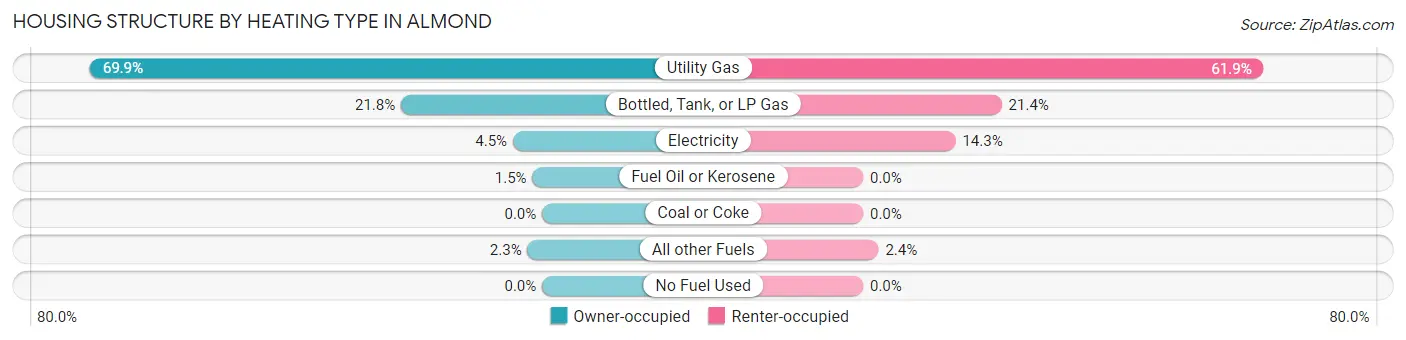
| Heating Type | Owner-occupied | Renter-occupied |
| Utility Gas | 93 (69.9%) | 26 (61.9%) |
| Bottled, Tank, or LP Gas | 29 (21.8%) | 9 (21.4%) |
| Electricity | 6 (4.5%) | 6 (14.3%) |
| Fuel Oil or Kerosene | 2 (1.5%) | 0 (0.0%) |
| Coal or Coke | 0 (0.0%) | 0 (0.0%) |
| All other Fuels | 3 (2.3%) | 1 (2.4%) |
| No Fuel Used | 0 (0.0%) | 0 (0.0%) |
| Total | 133 (100.0%) | 42 (100.0%) |
Household Vehicle Usage in Almond
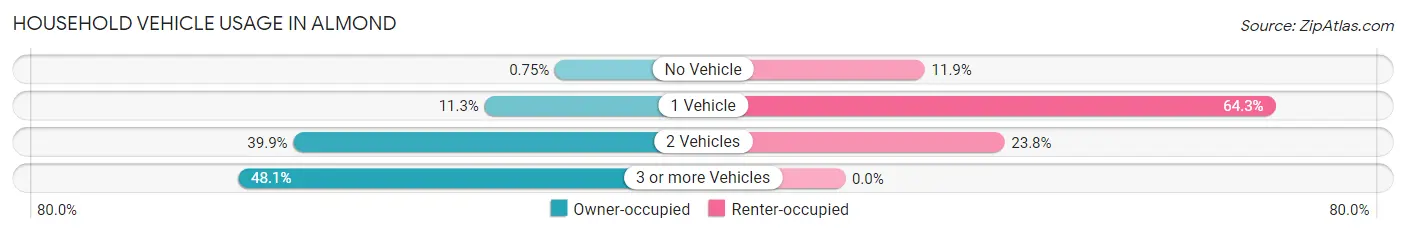
| Vehicles per Household | Owner-occupied | Renter-occupied |
| No Vehicle | 1 (0.7%) | 5 (11.9%) |
| 1 Vehicle | 15 (11.3%) | 27 (64.3%) |
| 2 Vehicles | 53 (39.9%) | 10 (23.8%) |
| 3 or more Vehicles | 64 (48.1%) | 0 (0.0%) |
| Total | 133 (100.0%) | 42 (100.0%) |
Real Estate & Mortgages in Almond
Real Estate and Mortgage Overview in Almond
| Characteristic | Without Mortgage | With Mortgage |
| Housing Units | 63 | 70 |
| Median Property Value | $130,400 | $120,300 |
| Median Household Income | $80,625 | $1 |
| Monthly Housing Costs | $553 | $0 |
| Real Estate Taxes | $2,017 | $1 |
Property Value by Mortgage Status in Almond
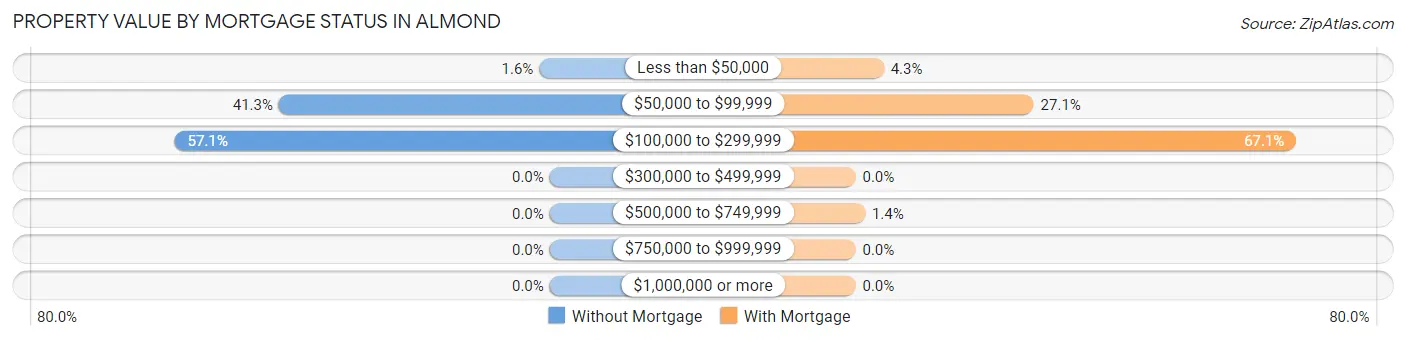
| Property Value | Without Mortgage | With Mortgage |
| Less than $50,000 | 1 (1.6%) | 3 (4.3%) |
| $50,000 to $99,999 | 26 (41.3%) | 19 (27.1%) |
| $100,000 to $299,999 | 36 (57.1%) | 47 (67.1%) |
| $300,000 to $499,999 | 0 (0.0%) | 0 (0.0%) |
| $500,000 to $749,999 | 0 (0.0%) | 1 (1.4%) |
| $750,000 to $999,999 | 0 (0.0%) | 0 (0.0%) |
| $1,000,000 or more | 0 (0.0%) | 0 (0.0%) |
| Total | 63 (100.0%) | 70 (100.0%) |
Household Income by Mortgage Status in Almond
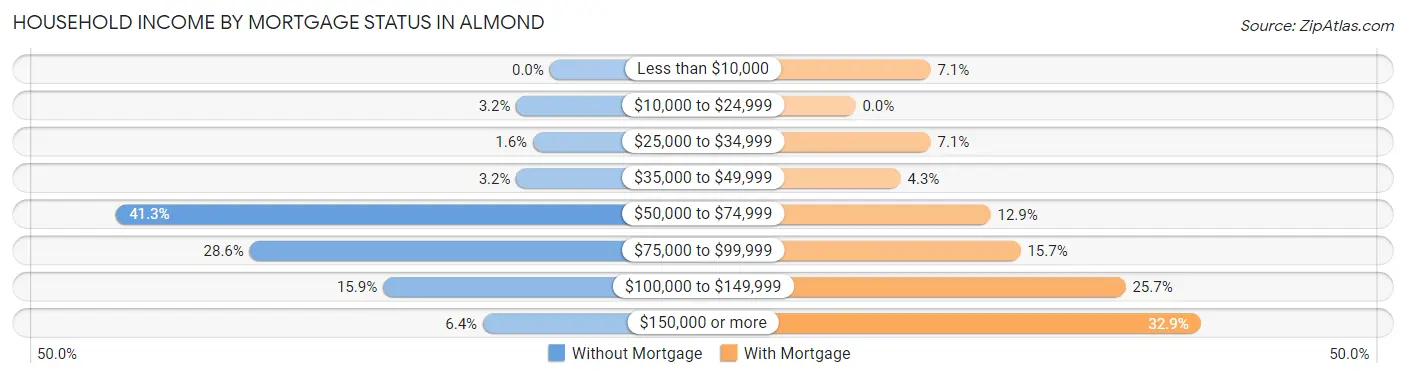
| Household Income | Without Mortgage | With Mortgage |
| Less than $10,000 | 0 (0.0%) | 5 (7.1%) |
| $10,000 to $24,999 | 2 (3.2%) | 0 (0.0%) |
| $25,000 to $34,999 | 1 (1.6%) | 5 (7.1%) |
| $35,000 to $49,999 | 2 (3.2%) | 3 (4.3%) |
| $50,000 to $74,999 | 26 (41.3%) | 9 (12.9%) |
| $75,000 to $99,999 | 18 (28.6%) | 11 (15.7%) |
| $100,000 to $149,999 | 10 (15.9%) | 18 (25.7%) |
| $150,000 or more | 4 (6.4%) | 23 (32.9%) |
| Total | 63 (100.0%) | 70 (100.0%) |
Property Value to Household Income Ratio in Almond
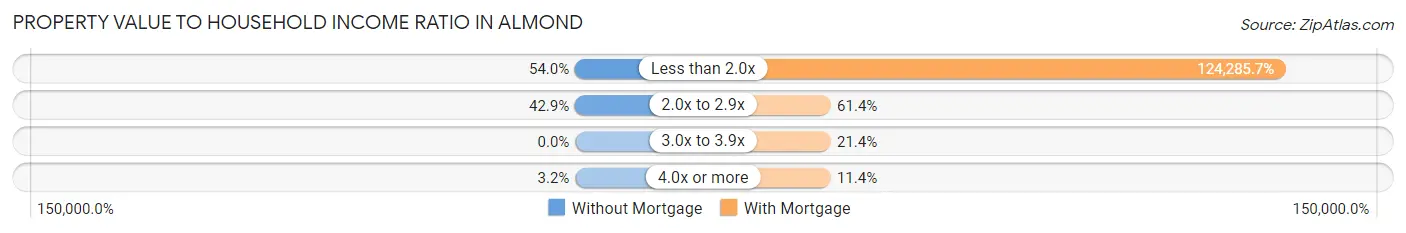
| Value-to-Income Ratio | Without Mortgage | With Mortgage |
| Less than 2.0x | 34 (54.0%) | 87,000 (124,285.7%) |
| 2.0x to 2.9x | 27 (42.9%) | 43 (61.4%) |
| 3.0x to 3.9x | 0 (0.0%) | 15 (21.4%) |
| 4.0x or more | 2 (3.2%) | 8 (11.4%) |
| Total | 63 (100.0%) | 70 (100.0%) |
Real Estate Taxes by Mortgage Status in Almond
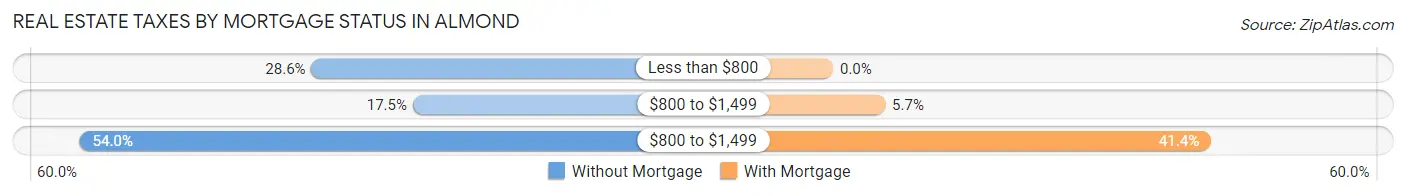
| Property Taxes | Without Mortgage | With Mortgage |
| Less than $800 | 18 (28.6%) | 0 (0.0%) |
| $800 to $1,499 | 11 (17.5%) | 4 (5.7%) |
| $800 to $1,499 | 34 (54.0%) | 29 (41.4%) |
| Total | 63 (100.0%) | 70 (100.0%) |
Health & Disability in Almond
Health Insurance Coverage by Age in Almond
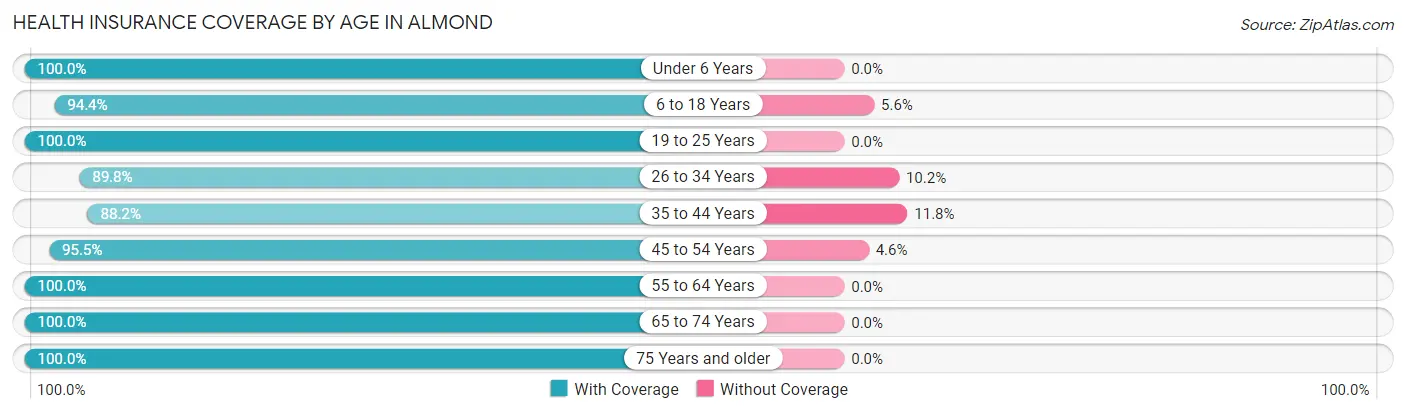
| Age Bracket | With Coverage | Without Coverage |
| Under 6 Years | 36 (100.0%) | 0 (0.0%) |
| 6 to 18 Years | 102 (94.4%) | 6 (5.6%) |
| 19 to 25 Years | 19 (100.0%) | 0 (0.0%) |
| 26 to 34 Years | 44 (89.8%) | 5 (10.2%) |
| 35 to 44 Years | 75 (88.2%) | 10 (11.8%) |
| 45 to 54 Years | 63 (95.5%) | 3 (4.5%) |
| 55 to 64 Years | 26 (100.0%) | 0 (0.0%) |
| 65 to 74 Years | 42 (100.0%) | 0 (0.0%) |
| 75 Years and older | 13 (100.0%) | 0 (0.0%) |
| Total | 420 (94.6%) | 24 (5.4%) |
Health Insurance Coverage by Citizenship Status in Almond
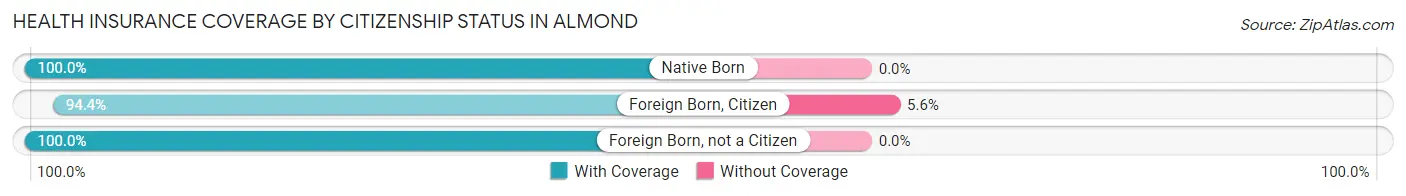
| Citizenship Status | With Coverage | Without Coverage |
| Native Born | 36 (100.0%) | 0 (0.0%) |
| Foreign Born, Citizen | 102 (94.4%) | 6 (5.6%) |
| Foreign Born, not a Citizen | 19 (100.0%) | 0 (0.0%) |
Health Insurance Coverage by Household Income in Almond
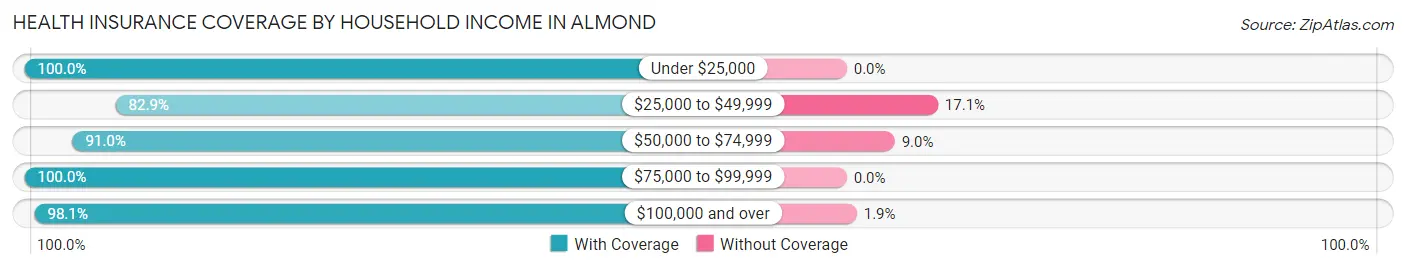
| Household Income | With Coverage | Without Coverage |
| Under $25,000 | 27 (100.0%) | 0 (0.0%) |
| $25,000 to $49,999 | 34 (82.9%) | 7 (17.1%) |
| $50,000 to $74,999 | 152 (91.0%) | 15 (9.0%) |
| $75,000 to $99,999 | 102 (100.0%) | 0 (0.0%) |
| $100,000 and over | 105 (98.1%) | 2 (1.9%) |
Public vs Private Health Insurance Coverage by Age in Almond
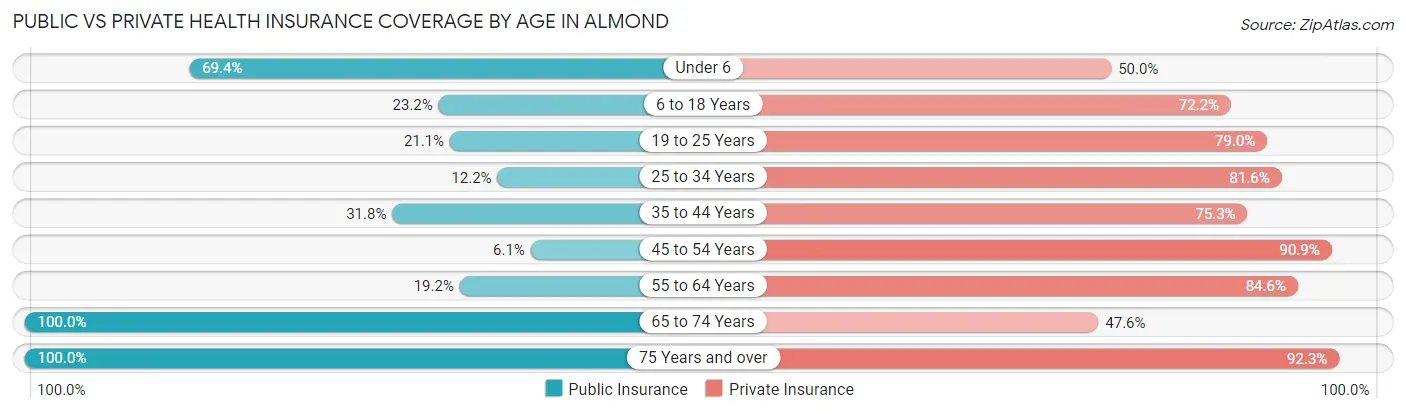
| Age Bracket | Public Insurance | Private Insurance |
| Under 6 | 25 (69.4%) | 18 (50.0%) |
| 6 to 18 Years | 25 (23.2%) | 78 (72.2%) |
| 19 to 25 Years | 4 (21.0%) | 15 (78.9%) |
| 25 to 34 Years | 6 (12.2%) | 40 (81.6%) |
| 35 to 44 Years | 27 (31.8%) | 64 (75.3%) |
| 45 to 54 Years | 4 (6.1%) | 60 (90.9%) |
| 55 to 64 Years | 5 (19.2%) | 22 (84.6%) |
| 65 to 74 Years | 42 (100.0%) | 20 (47.6%) |
| 75 Years and over | 13 (100.0%) | 12 (92.3%) |
| Total | 151 (34.0%) | 329 (74.1%) |
Disability Status by Sex by Age in Almond
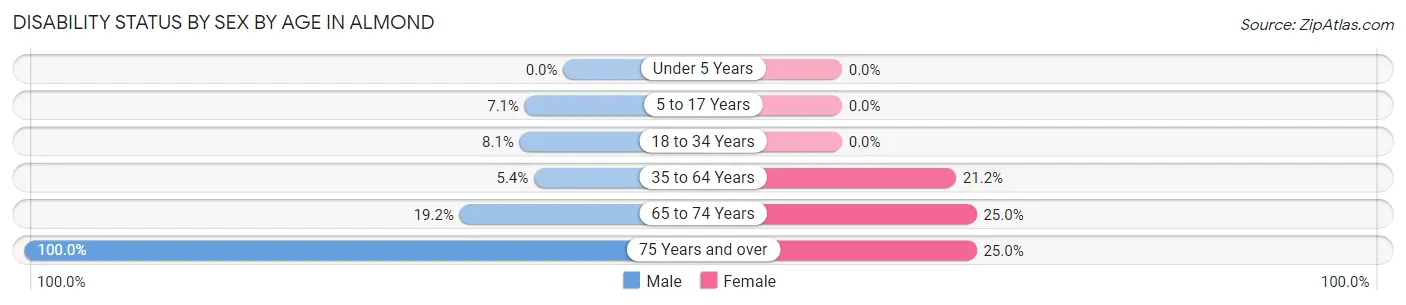
| Age Bracket | Male | Female |
| Under 5 Years | 0 (0.0%) | 0 (0.0%) |
| 5 to 17 Years | 2 (7.1%) | 0 (0.0%) |
| 18 to 34 Years | 3 (8.1%) | 0 (0.0%) |
| 35 to 64 Years | 5 (5.4%) | 18 (21.2%) |
| 65 to 74 Years | 5 (19.2%) | 4 (25.0%) |
| 75 Years and over | 5 (100.0%) | 2 (25.0%) |
Disability Class by Sex by Age in Almond
Disability Class: Hearing Difficulty
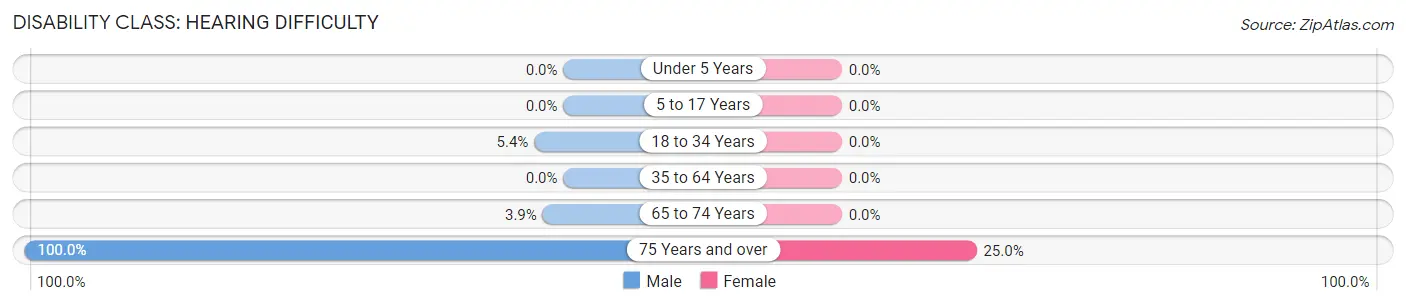
| Age Bracket | Male | Female |
| Under 5 Years | 0 (0.0%) | 0 (0.0%) |
| 5 to 17 Years | 0 (0.0%) | 0 (0.0%) |
| 18 to 34 Years | 2 (5.4%) | 0 (0.0%) |
| 35 to 64 Years | 0 (0.0%) | 0 (0.0%) |
| 65 to 74 Years | 1 (3.8%) | 0 (0.0%) |
| 75 Years and over | 5 (100.0%) | 2 (25.0%) |
Disability Class: Vision Difficulty
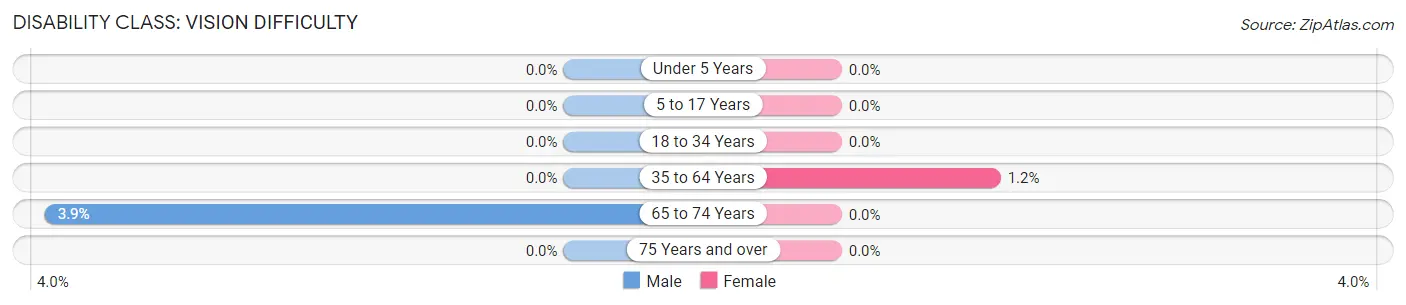
| Age Bracket | Male | Female |
| Under 5 Years | 0 (0.0%) | 0 (0.0%) |
| 5 to 17 Years | 0 (0.0%) | 0 (0.0%) |
| 18 to 34 Years | 0 (0.0%) | 0 (0.0%) |
| 35 to 64 Years | 0 (0.0%) | 1 (1.2%) |
| 65 to 74 Years | 1 (3.8%) | 0 (0.0%) |
| 75 Years and over | 0 (0.0%) | 0 (0.0%) |
Disability Class: Cognitive Difficulty
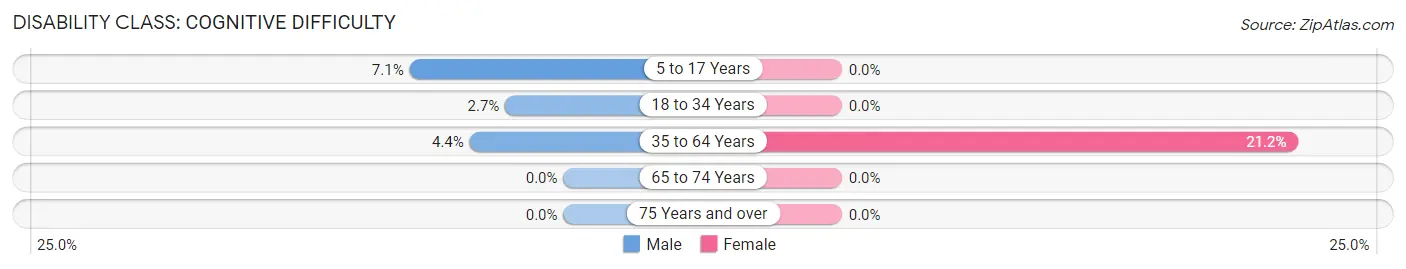
| Age Bracket | Male | Female |
| 5 to 17 Years | 2 (7.1%) | 0 (0.0%) |
| 18 to 34 Years | 1 (2.7%) | 0 (0.0%) |
| 35 to 64 Years | 4 (4.3%) | 18 (21.2%) |
| 65 to 74 Years | 0 (0.0%) | 0 (0.0%) |
| 75 Years and over | 0 (0.0%) | 0 (0.0%) |
Disability Class: Ambulatory Difficulty
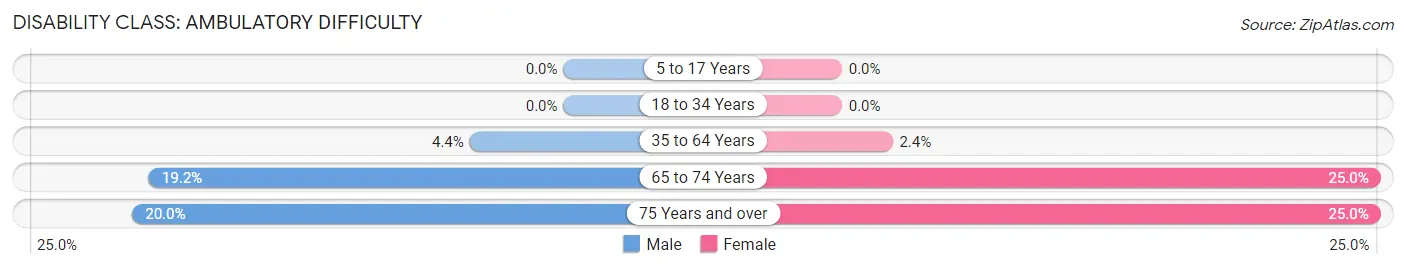
| Age Bracket | Male | Female |
| 5 to 17 Years | 0 (0.0%) | 0 (0.0%) |
| 18 to 34 Years | 0 (0.0%) | 0 (0.0%) |
| 35 to 64 Years | 4 (4.3%) | 2 (2.4%) |
| 65 to 74 Years | 5 (19.2%) | 4 (25.0%) |
| 75 Years and over | 1 (20.0%) | 2 (25.0%) |
Disability Class: Self-Care Difficulty
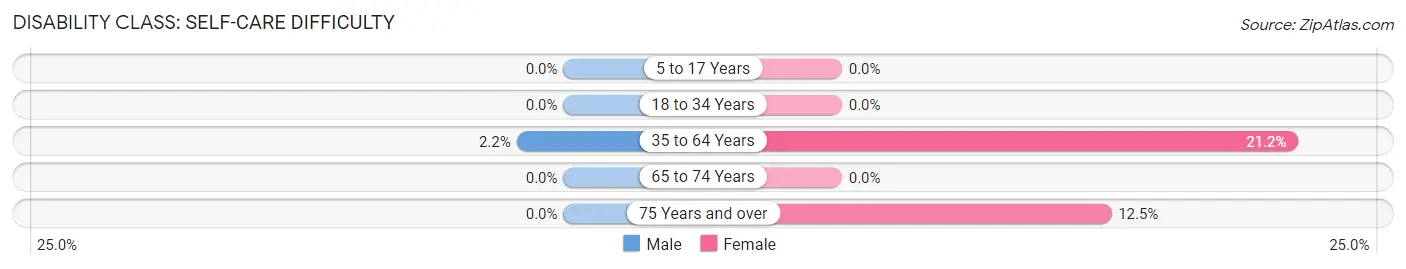
| Age Bracket | Male | Female |
| 5 to 17 Years | 0 (0.0%) | 0 (0.0%) |
| 18 to 34 Years | 0 (0.0%) | 0 (0.0%) |
| 35 to 64 Years | 2 (2.2%) | 18 (21.2%) |
| 65 to 74 Years | 0 (0.0%) | 0 (0.0%) |
| 75 Years and over | 0 (0.0%) | 1 (12.5%) |
Technology Access in Almond
Computing Device Access in Almond
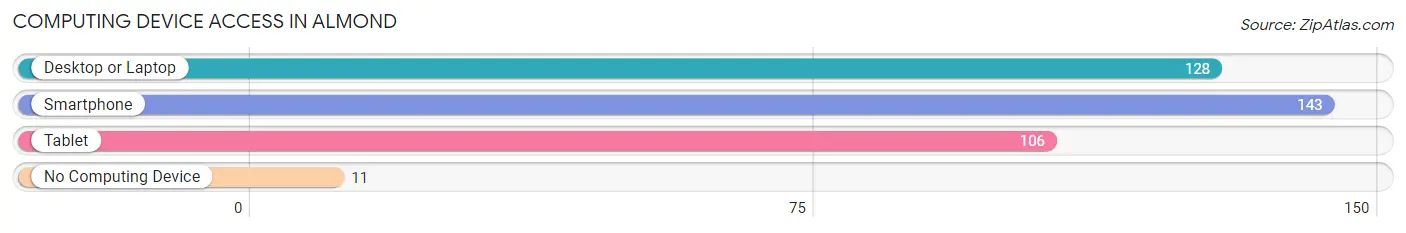
| Device Type | # Households | % Households |
| Desktop or Laptop | 128 | 73.1% |
| Smartphone | 143 | 81.7% |
| Tablet | 106 | 60.6% |
| No Computing Device | 11 | 6.3% |
| Total | 175 | 100.0% |
Internet Access in Almond
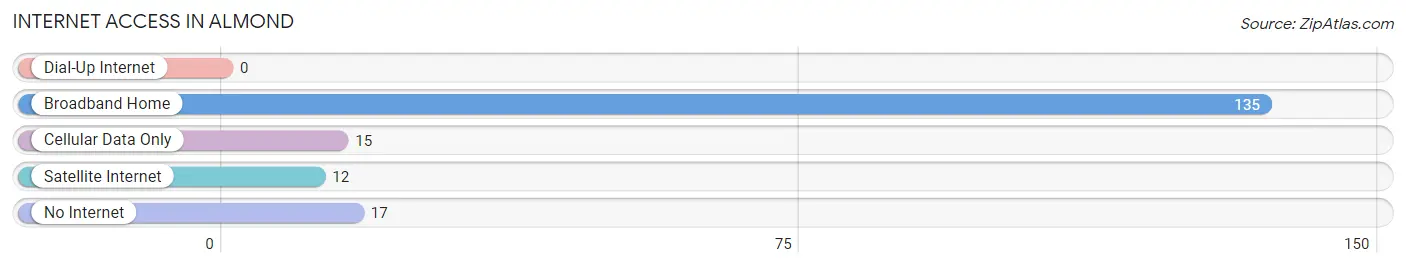
| Internet Type | # Households | % Households |
| Dial-Up Internet | 0 | 0.0% |
| Broadband Home | 135 | 77.1% |
| Cellular Data Only | 15 | 8.6% |
| Satellite Internet | 12 | 6.9% |
| No Internet | 17 | 9.7% |
| Total | 175 | 100.0% |
Almond Summary
Almond, Wisconsin is a small village located in Portage County, Wisconsin. It is situated on the banks of the Wisconsin River, about 20 miles east of Stevens Point. The village has a population of about 1,000 people and is part of the Stevens Point Metropolitan Statistical Area.
History
Almond was first settled in 1848 by a group of settlers from New York. The village was originally known as “Almondville” and was named after the almond trees that grew in the area. The village was officially incorporated in 1876.
In the late 19th century, Almond was a thriving lumber town. The village was home to several sawmills and a large paper mill. The paper mill was the largest employer in the village and provided jobs for many of the residents.
In the early 20th century, the paper mill closed and the village began to decline. The population decreased and many of the businesses closed. In the 1950s, the village was revitalized with the construction of a hydroelectric dam on the Wisconsin River. The dam provided electricity to the village and helped to attract new businesses and residents.
Geography
Almond is located in central Wisconsin, about 20 miles east of Stevens Point. The village is situated on the banks of the Wisconsin River and is surrounded by rolling hills and forests. The village is located in a rural area and is home to several small farms.
The climate in Almond is typical of the Midwest. Summers are warm and humid, while winters are cold and snowy. The average annual temperature is around 50 degrees Fahrenheit.
Economy
The economy of Almond is largely based on agriculture and tourism. The village is home to several small farms that produce a variety of crops, including corn, soybeans, and hay. The village also has several small businesses, including a grocery store, a hardware store, and a few restaurants.
Tourism is an important part of the economy in Almond. The village is home to several parks and recreational areas, including the Almond Marsh State Wildlife Area. The village also hosts several festivals and events throughout the year, including the Almond Festival in August.
Demographics
As of the 2010 census, the population of Almond was 1,039. The racial makeup of the village was 97.2% White, 0.7% African American, 0.3% Native American, 0.3% Asian, 0.2% from other races, and 1.5% from two or more races. Hispanic or Latino of any race were 1.2% of the population.
The median household income in Almond was $45,000, and the median family income was $50,000. About 11.2% of the population was below the poverty line. The village has a high rate of homeownership, with about 85% of the population owning their own homes.
Conclusion
Almond, Wisconsin is a small village located in Portage County, Wisconsin. It is situated on the banks of the Wisconsin River and has a population of about 1,000 people. The village has a long history of lumber and paper production, but today the economy is largely based on agriculture and tourism. The village has a diverse population and a high rate of homeownership. Almond is a great place to live and work, and it is a great place to visit.
Common Questions
What is the Total Population of Almond?
Total Population of Almond is 444.
What is the Total Male Population of Almond?
Total Male Population of Almond is 207.
What is the Total Female Population of Almond?
Total Female Population of Almond is 237.
What is the Ratio of Males per 100 Females in Almond?
There are 87.34 Males per 100 Females in Almond.
What is the Ratio of Females per 100 Males in Almond?
There are 114.49 Females per 100 Males in Almond.
What is the Median Population Age in Almond?
Median Population Age in Almond is 35.8 Years.
What is the Average Family Size in Almond
Average Family Size in Almond is 2.9 People.
What is the Average Household Size in Almond
Average Household Size in Almond is 2.5 People.
What is Per Capita Income in Almond?
Per Capita income in Almond is $34,503.
What is the Median Family Income in Almond?
Median Family Income in Almond is $79,464.
What is the Median Household income in Almond?
Median Household Income in Almond is $69,107.
What is Income or Wage Gap in Almond?
Income or Wage Gap in Almond is 53.6%.
Women in Almond earn 46.4 cents for every dollar earned by a man.
What is Inequality or Gini Index in Almond?
Inequality or Gini Index in Almond is 0.41.
How Large is the Labor Force in Almond?
There are 242 People in the Labor Forcein in Almond.
What is the Percentage of People in the Labor Force in Almond?
68.8% of People are in the Labor Force in Almond.
What is the Unemployment Rate in Almond?
Unemployment Rate in Almond is 0.4%.