Zip Codes with the Highest Percentage of Population Employed in Health Diagnosing & Treating in Issaquah, WA
RELATED REPORTS & OPTIONS
Health Diagnosing & Treating
Issaquah
Compare Zip Codes
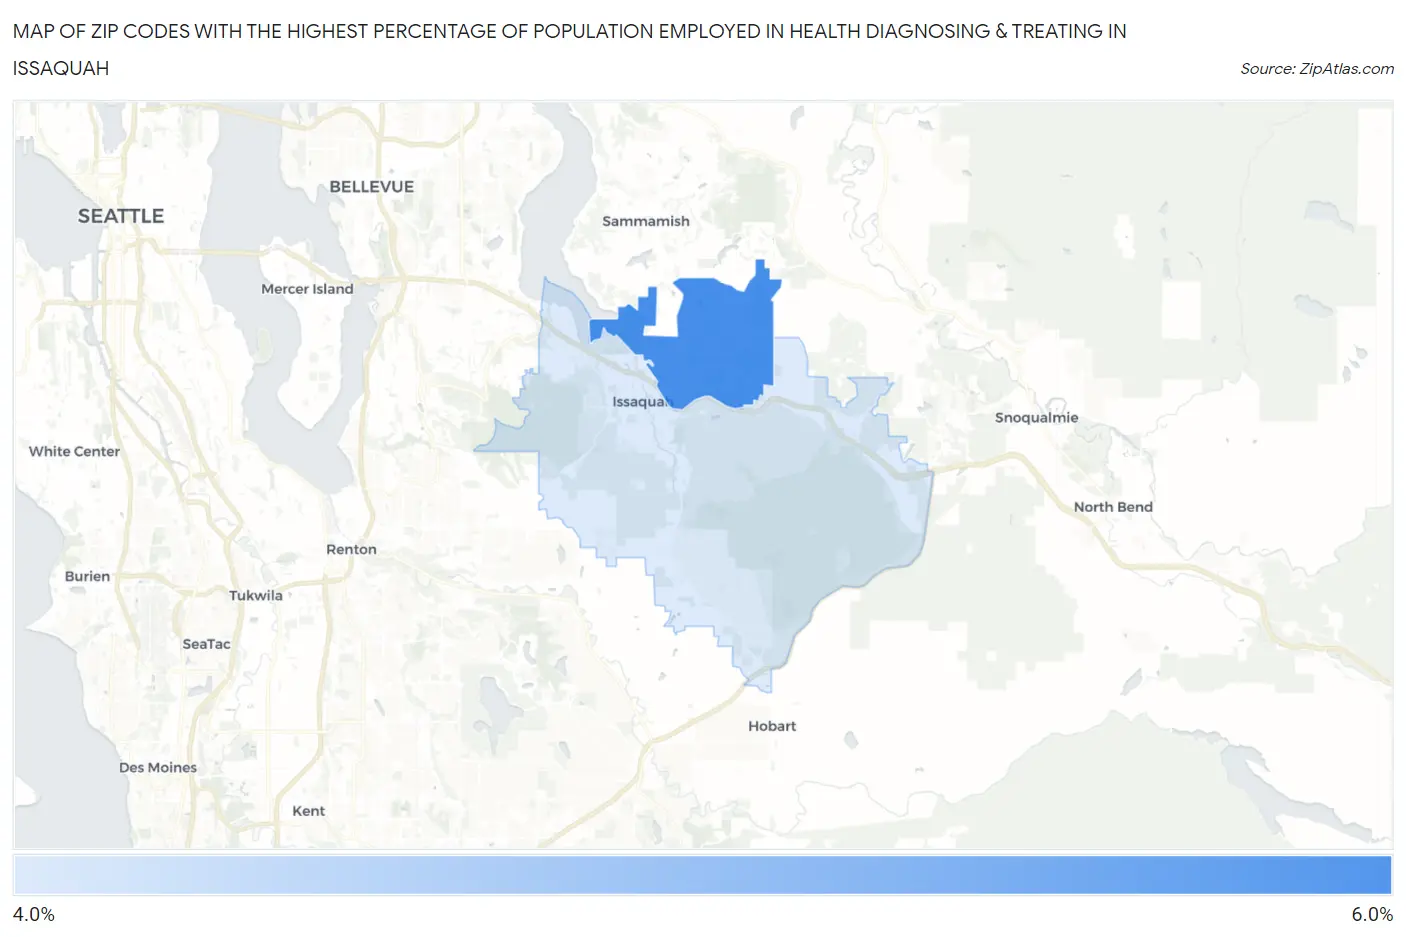
Map of Zip Codes with the Highest Percentage of Population Employed in Health Diagnosing & Treating in Issaquah
0.0%
6.0%
Zip Codes with the Highest Percentage of Population Employed in Health Diagnosing & Treating in Issaquah, WA
| Zip Code | % Employed | vs State | vs National | |
| 1. | 98029 | 5.3% | 5.6%(-0.250)#236 | 6.2%(-0.941)#16,541 |
| 2. | 98027 | 5.0% | 5.6%(-0.587)#272 | 6.2%(-1.28)#17,842 |
1
Common Questions
What are the Top Zip Codes with the Highest Percentage of Population Employed in Health Diagnosing & Treating in Issaquah, WA?
Top Zip Codes with the Highest Percentage of Population Employed in Health Diagnosing & Treating in Issaquah, WA are:
What zip code has the Highest Percentage of Population Employed in Health Diagnosing & Treating in Issaquah, WA?
98029 has the Highest Percentage of Population Employed in Health Diagnosing & Treating in Issaquah, WA with 5.3%.
What is the Percentage of Population Employed in Health Diagnosing & Treating in Issaquah, WA?
Percentage of Population Employed in Health Diagnosing & Treating in Issaquah is 5.2%.
What is the Percentage of Population Employed in Health Diagnosing & Treating in Washington?
Percentage of Population Employed in Health Diagnosing & Treating in Washington is 5.6%.
What is the Percentage of Population Employed in Health Diagnosing & Treating in the United States?
Percentage of Population Employed in Health Diagnosing & Treating in the United States is 6.2%.