Windsor County, VT
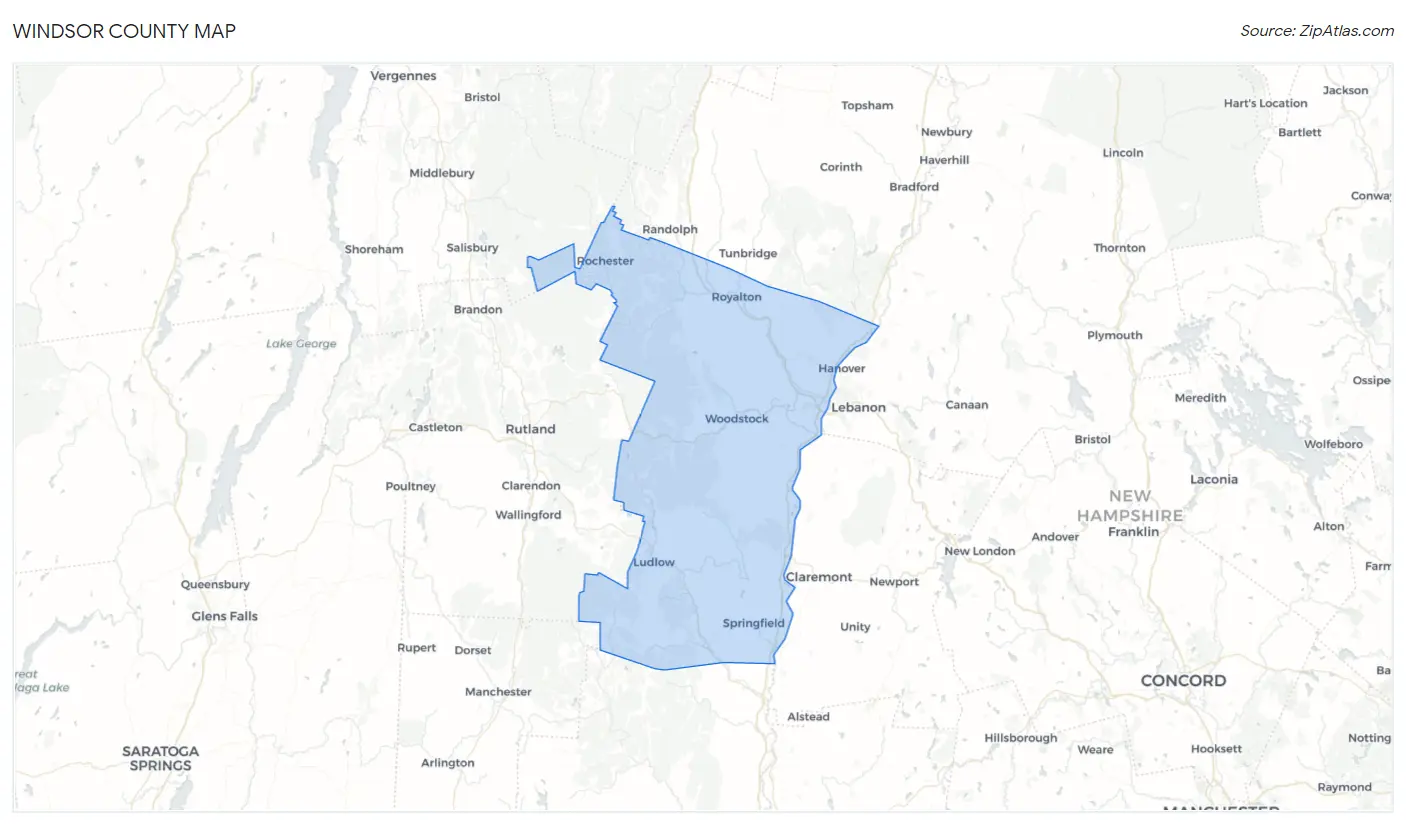
Windsor County Map
Windsor County Overview
57,832
TOTAL POPULATION
28,520
MALE POPULATION
29,312
FEMALE POPULATION
97.30
MALES / 100 FEMALES
102.78
FEMALES / 100 MALES
47.8
MEDIAN AGE
3.0
AVG FAMILY SIZE
2.3
AVG HOUSEHOLD SIZE
$43,180
PER CAPITA INCOME
$94,699
AVG FAMILY INCOME
$69,492
AVG HOUSEHOLD INCOME
15.2%
WAGE / INCOME GAP [ % ]
84.8¢/ $1
WAGE / INCOME GAP [ $ ]
$9,906
FAMILY INCOME DEFICIT
0.47
INEQUALITY / GINI INDEX
30,343
LABOR FORCE [ PEOPLE ]
62.2%
PERCENT IN LABOR FORCE
3.7%
UNEMPLOYMENT RATE
Windsor County Area Codes
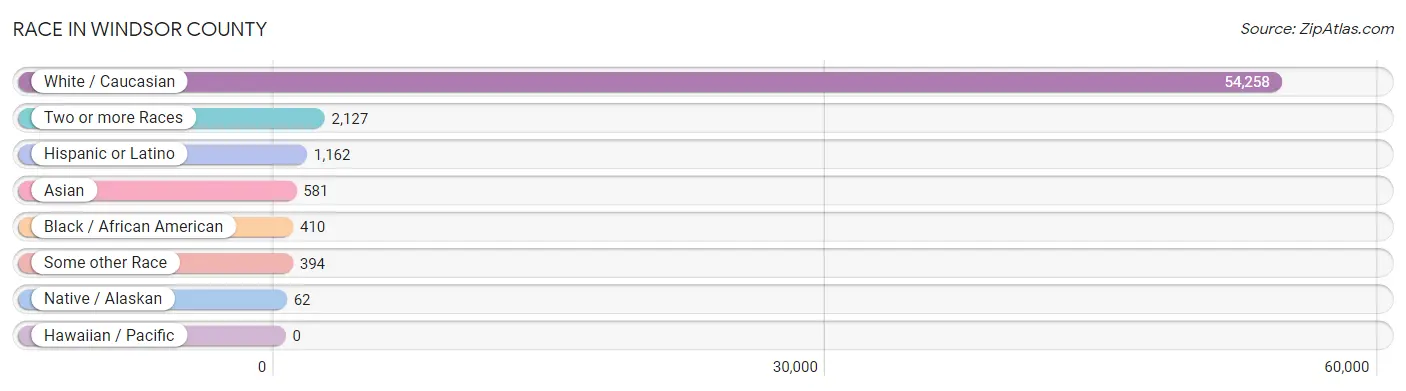
Race in Windsor County
The most populous races in Windsor County are White / Caucasian (54,258 | 93.8%), Two or more Races (2,127 | 3.7%), and Hispanic or Latino (1,162 | 2.0%).
| Race | # Population | % Population |
| Asian | 581 | 1.0% |
| Black / African American | 410 | 0.7% |
| Hawaiian / Pacific | 0 | 0.0% |
| Hispanic or Latino | 1,162 | 2.0% |
| Native / Alaskan | 62 | 0.1% |
| White / Caucasian | 54,258 | 93.8% |
| Two or more Races | 2,127 | 3.7% |
| Some other Race | 394 | 0.7% |
| Total | 57,832 | 100.0% |
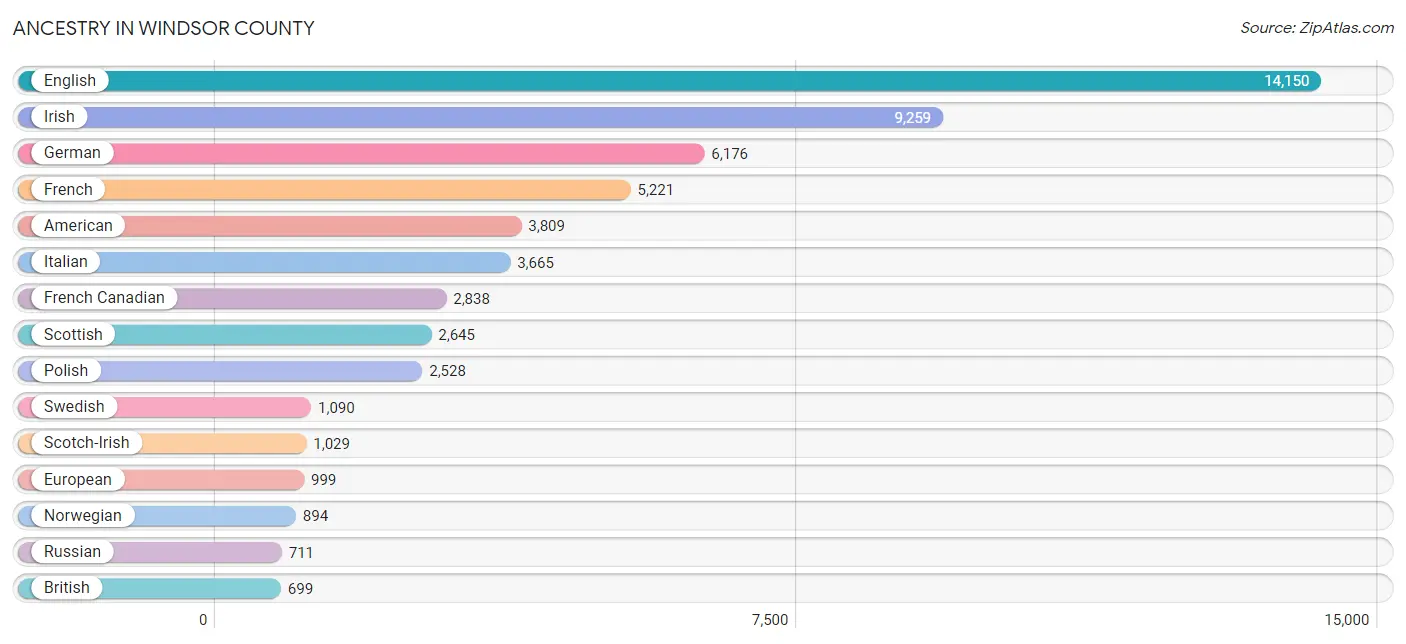
Ancestry in Windsor County
The most populous ancestries reported in Windsor County are English (14,150 | 24.5%), Irish (9,259 | 16.0%), German (6,176 | 10.7%), French (5,221 | 9.0%), and American (3,809 | 6.6%), together accounting for 66.8% of all Windsor County residents.
| Ancestry | # Population | % Population |
| African | 59 | 0.1% |
| Albanian | 7 | 0.0% |
| American | 3,809 | 6.6% |
| Arab | 139 | 0.2% |
| Argentinean | 61 | 0.1% |
| Armenian | 80 | 0.1% |
| Australian | 33 | 0.1% |
| Austrian | 234 | 0.4% |
| Barbadian | 8 | 0.0% |
| Basque | 2 | 0.0% |
| Belgian | 13 | 0.0% |
| Bhutanese | 10 | 0.0% |
| Blackfeet | 4 | 0.0% |
| Brazilian | 189 | 0.3% |
| British | 699 | 1.2% |
| Bulgarian | 3 | 0.0% |
| Burmese | 70 | 0.1% |
| Cajun | 4 | 0.0% |
| Canadian | 376 | 0.6% |
| Cape Verdean | 1 | 0.0% |
| Carpatho Rusyn | 7 | 0.0% |
| Celtic | 34 | 0.1% |
| Central American | 117 | 0.2% |
| Cherokee | 122 | 0.2% |
| Chickasaw | 23 | 0.0% |
| Choctaw | 23 | 0.0% |
| Colombian | 19 | 0.0% |
| Costa Rican | 48 | 0.1% |
| Creek | 7 | 0.0% |
| Croatian | 4 | 0.0% |
| Cuban | 73 | 0.1% |
| Czech | 91 | 0.2% |
| Czechoslovakian | 59 | 0.1% |
| Danish | 295 | 0.5% |
| Dominican | 91 | 0.2% |
| Dutch | 696 | 1.2% |
| Eastern European | 198 | 0.3% |
| Egyptian | 12 | 0.0% |
| English | 14,150 | 24.5% |
| Ethiopian | 12 | 0.0% |
| European | 999 | 1.7% |
| Finnish | 523 | 0.9% |
| French | 5,221 | 9.0% |
| French American Indian | 72 | 0.1% |
| French Canadian | 2,838 | 4.9% |
| German | 6,176 | 10.7% |
| Greek | 164 | 0.3% |
| Guatemalan | 15 | 0.0% |
| Hopi | 9 | 0.0% |
| Hungarian | 195 | 0.3% |
| Icelander | 41 | 0.1% |
| Indian (Asian) | 241 | 0.4% |
| Indonesian | 29 | 0.1% |
| Iranian | 27 | 0.1% |
| Irish | 9,259 | 16.0% |
| Iroquois | 11 | 0.0% |
| Italian | 3,665 | 6.3% |
| Jamaican | 94 | 0.2% |
| Japanese | 4 | 0.0% |
| Kenyan | 54 | 0.1% |
| Korean | 164 | 0.3% |
| Latvian | 10 | 0.0% |
| Lebanese | 72 | 0.1% |
| Lithuanian | 137 | 0.2% |
| Malaysian | 30 | 0.1% |
| Mexican | 115 | 0.2% |
| Mongolian | 46 | 0.1% |
| Native Hawaiian | 6 | 0.0% |
| Nicaraguan | 27 | 0.1% |
| Nigerian | 11 | 0.0% |
| Northern European | 234 | 0.4% |
| Norwegian | 894 | 1.5% |
| Osage | 8 | 0.0% |
| Pakistani | 34 | 0.1% |
| Pennsylvania German | 46 | 0.1% |
| Polish | 2,528 | 4.4% |
| Portuguese | 290 | 0.5% |
| Puerto Rican | 140 | 0.2% |
| Romanian | 79 | 0.1% |
| Russian | 711 | 1.2% |
| Salvadoran | 27 | 0.1% |
| Scandinavian | 188 | 0.3% |
| Scotch-Irish | 1,029 | 1.8% |
| Scottish | 2,645 | 4.6% |
| Seminole | 1 | 0.0% |
| Serbian | 3 | 0.0% |
| Sioux | 22 | 0.0% |
| Slavic | 13 | 0.0% |
| Slovak | 92 | 0.2% |
| Slovene | 25 | 0.0% |
| South American | 80 | 0.1% |
| South American Indian | 4 | 0.0% |
| Spaniard | 140 | 0.2% |
| Spanish | 130 | 0.2% |
| Sri Lankan | 20 | 0.0% |
| Subsaharan African | 155 | 0.3% |
| Swedish | 1,090 | 1.9% |
| Swiss | 237 | 0.4% |
| Syrian | 8 | 0.0% |
| Thai | 190 | 0.3% |
| Ukrainian | 247 | 0.4% |
| Welsh | 318 | 0.5% |
| Yugoslavian | 30 | 0.1% |
| Zimbabwean | 16 | 0.0% | View All 104 Rows |
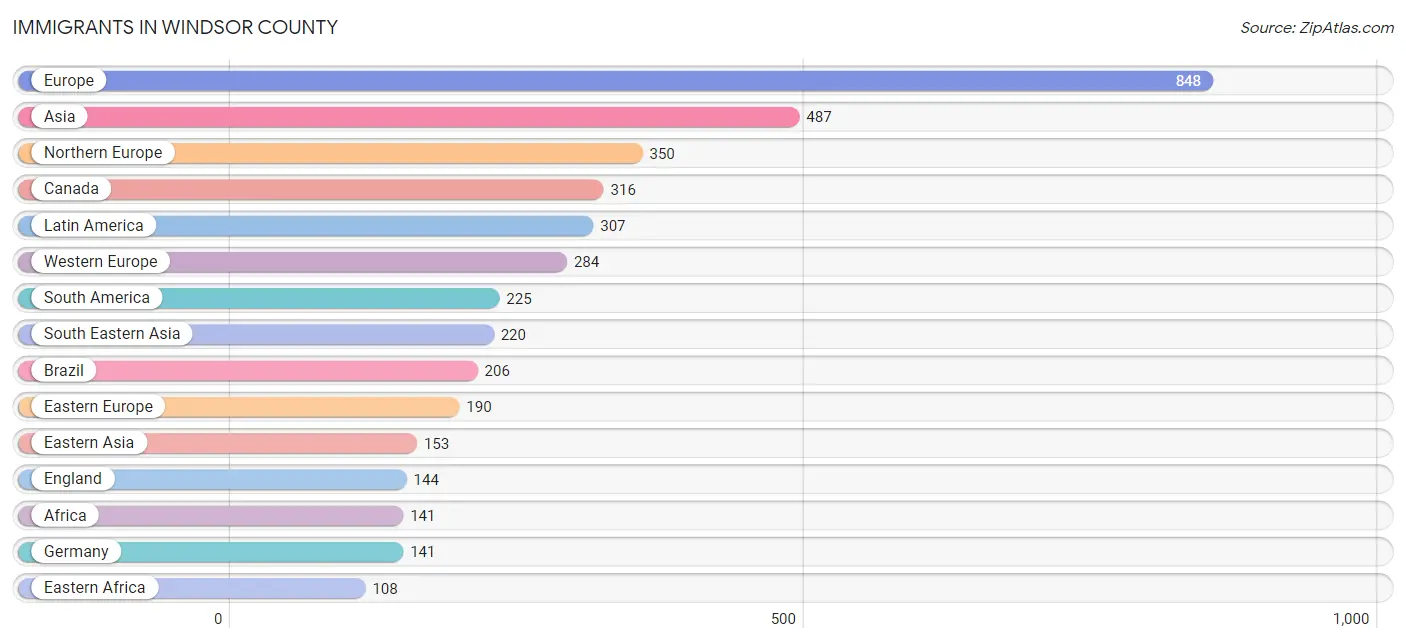
Immigrants in Windsor County
The most numerous immigrant groups reported in Windsor County came from Europe (848 | 1.5%), Asia (487 | 0.8%), Northern Europe (350 | 0.6%), Canada (316 | 0.5%), and Latin America (307 | 0.5%), together accounting for 4.0% of all Windsor County residents.
| Immigration Origin | # Population | % Population |
| Africa | 141 | 0.2% |
| Argentina | 7 | 0.0% |
| Asia | 487 | 0.8% |
| Australia | 39 | 0.1% |
| Bahamas | 10 | 0.0% |
| Brazil | 206 | 0.4% |
| Bulgaria | 9 | 0.0% |
| Canada | 316 | 0.5% |
| Caribbean | 27 | 0.1% |
| Central America | 55 | 0.1% |
| China | 98 | 0.2% |
| Congo | 3 | 0.0% |
| Croatia | 4 | 0.0% |
| Cuba | 1 | 0.0% |
| Czechoslovakia | 2 | 0.0% |
| Denmark | 3 | 0.0% |
| Eastern Africa | 108 | 0.2% |
| Eastern Asia | 153 | 0.3% |
| Eastern Europe | 190 | 0.3% |
| England | 144 | 0.3% |
| Europe | 848 | 1.5% |
| France | 33 | 0.1% |
| Germany | 141 | 0.2% |
| India | 34 | 0.1% |
| Iran | 16 | 0.0% |
| Ireland | 24 | 0.0% |
| Italy | 17 | 0.0% |
| Jamaica | 10 | 0.0% |
| Japan | 13 | 0.0% |
| Kenya | 41 | 0.1% |
| Korea | 42 | 0.1% |
| Laos | 30 | 0.1% |
| Latin America | 307 | 0.5% |
| Liberia | 16 | 0.0% |
| Malaysia | 20 | 0.0% |
| Mexico | 48 | 0.1% |
| Middle Africa | 15 | 0.0% |
| Moldova | 19 | 0.0% |
| Nepal | 2 | 0.0% |
| Netherlands | 101 | 0.2% |
| Nicaragua | 7 | 0.0% |
| Northern Europe | 350 | 0.6% |
| Oceania | 39 | 0.1% |
| Pakistan | 20 | 0.0% |
| Philippines | 107 | 0.2% |
| Poland | 9 | 0.0% |
| Romania | 25 | 0.0% |
| Russia | 71 | 0.1% |
| Scotland | 29 | 0.1% |
| Singapore | 8 | 0.0% |
| South America | 225 | 0.4% |
| South Central Asia | 102 | 0.2% |
| South Eastern Asia | 220 | 0.4% |
| Southern Europe | 24 | 0.0% |
| Spain | 7 | 0.0% |
| Sri Lanka | 30 | 0.1% |
| Sweden | 23 | 0.0% |
| Switzerland | 9 | 0.0% |
| Taiwan | 12 | 0.0% |
| Thailand | 10 | 0.0% |
| Trinidad and Tobago | 4 | 0.0% |
| Ukraine | 17 | 0.0% |
| Venezuela | 7 | 0.0% |
| Vietnam | 16 | 0.0% |
| Western Africa | 18 | 0.0% |
| Western Asia | 12 | 0.0% |
| Western Europe | 284 | 0.5% |
| Yemen | 12 | 0.0% |
| Zimbabwe | 67 | 0.1% | View All 69 Rows |
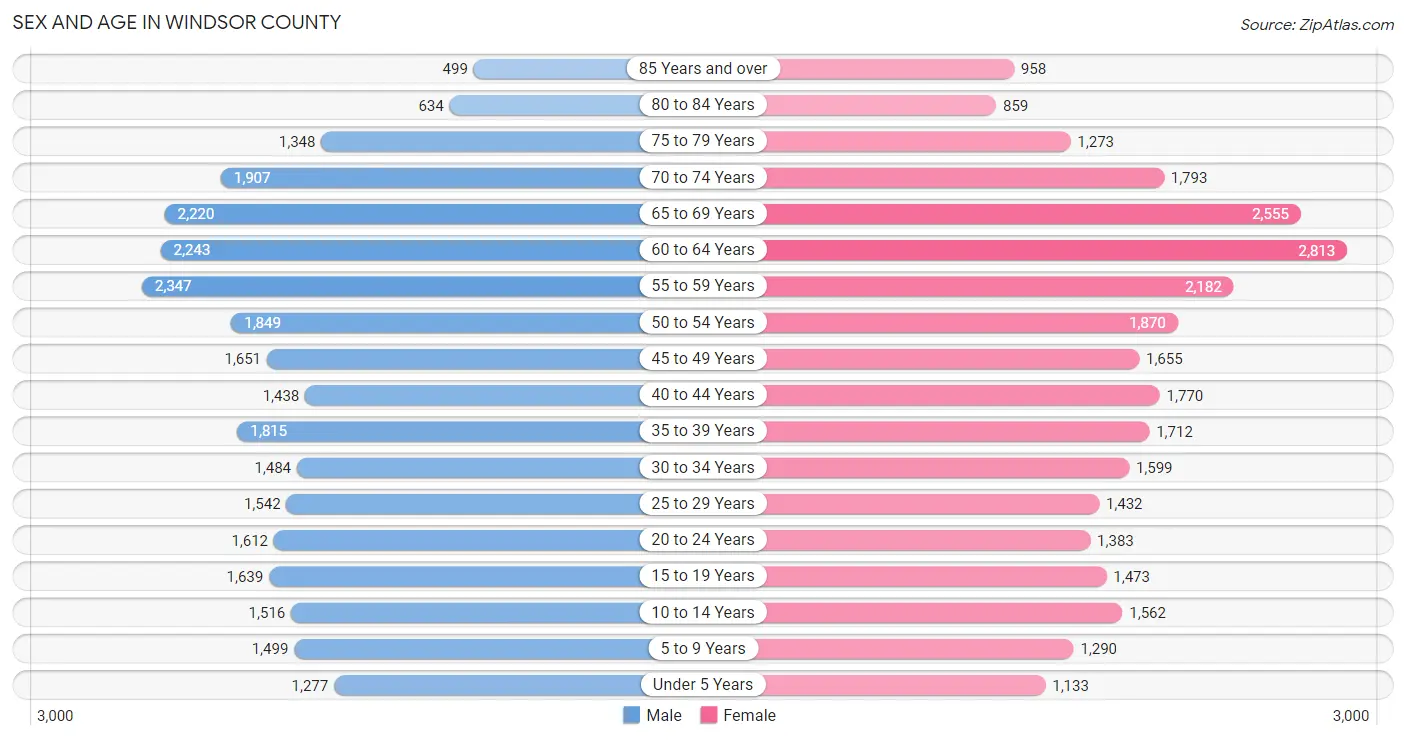
Sex and Age in Windsor County
Sex and Age in Windsor County
The most populous age groups in Windsor County are 55 to 59 Years (2,347 | 8.2%) for men and 60 to 64 Years (2,813 | 9.6%) for women.
| Age Bracket | Male | Female |
| Under 5 Years | 1,277 (4.5%) | 1,133 (3.9%) |
| 5 to 9 Years | 1,499 (5.3%) | 1,290 (4.4%) |
| 10 to 14 Years | 1,516 (5.3%) | 1,562 (5.3%) |
| 15 to 19 Years | 1,639 (5.8%) | 1,473 (5.0%) |
| 20 to 24 Years | 1,612 (5.7%) | 1,383 (4.7%) |
| 25 to 29 Years | 1,542 (5.4%) | 1,432 (4.9%) |
| 30 to 34 Years | 1,484 (5.2%) | 1,599 (5.5%) |
| 35 to 39 Years | 1,815 (6.4%) | 1,712 (5.8%) |
| 40 to 44 Years | 1,438 (5.0%) | 1,770 (6.0%) |
| 45 to 49 Years | 1,651 (5.8%) | 1,655 (5.7%) |
| 50 to 54 Years | 1,849 (6.5%) | 1,870 (6.4%) |
| 55 to 59 Years | 2,347 (8.2%) | 2,182 (7.4%) |
| 60 to 64 Years | 2,243 (7.9%) | 2,813 (9.6%) |
| 65 to 69 Years | 2,220 (7.8%) | 2,555 (8.7%) |
| 70 to 74 Years | 1,907 (6.7%) | 1,793 (6.1%) |
| 75 to 79 Years | 1,348 (4.7%) | 1,273 (4.3%) |
| 80 to 84 Years | 634 (2.2%) | 859 (2.9%) |
| 85 Years and over | 499 (1.8%) | 958 (3.3%) |
| Total | 28,520 (100.0%) | 29,312 (100.0%) |
Families and Households in Windsor County
Median Family Size in Windsor County
The median family size in Windsor County is 2.97 persons per family, with single female/mother families (1,673 | 11.7%) accounting for the largest median family size of 3.22 persons per family. On the other hand, married-couple families (12,070 | 84.1%) represent the smallest median family size with 2.92 persons per family.
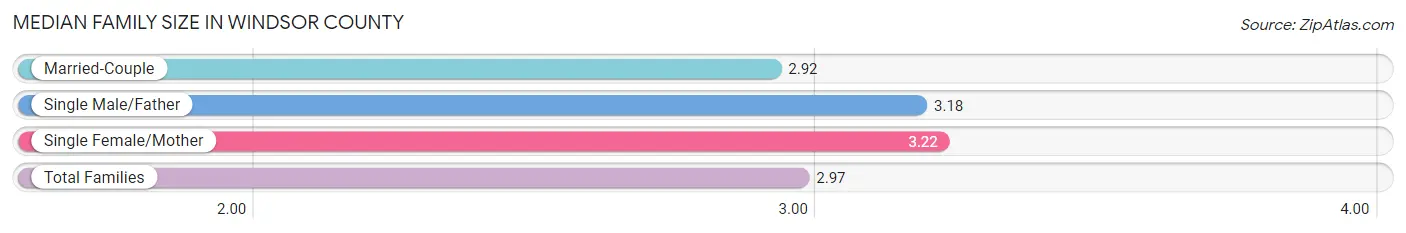
| Family Type | # Families | Family Size |
| Married-Couple | 12,070 (84.1%) | 2.92 |
| Single Male/Father | 614 (4.3%) | 3.18 |
| Single Female/Mother | 1,673 (11.7%) | 3.22 |
| Total Families | 14,357 (100.0%) | 2.97 |
Median Household Size in Windsor County
The median household size in Windsor County is 2.32 persons per household, with single male/father households (614 | 2.5%) accounting for the largest median household size of 3.65 persons per household. non-family households (10,179 | 41.5%) represent the smallest median household size with 1.28 persons per household.
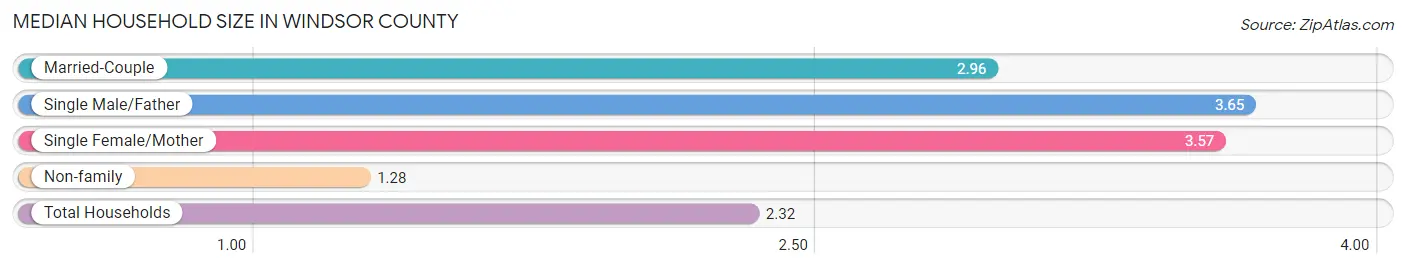
| Household Type | # Households | Household Size |
| Married-Couple | 12,070 (49.2%) | 2.96 |
| Single Male/Father | 614 (2.5%) | 3.65 |
| Single Female/Mother | 1,673 (6.8%) | 3.57 |
| Non-family | 10,179 (41.5%) | 1.28 |
| Total Households | 24,536 (100.0%) | 2.32 |
Household Size by Marriage Status in Windsor County
Out of a total of 24,536 households in Windsor County, 14,357 (58.5%) are family households, while 10,179 (41.5%) are nonfamily households. The most numerous type of family households are 2-person households, comprising 8,261, and the most common type of nonfamily households are 1-person households, comprising 8,198.
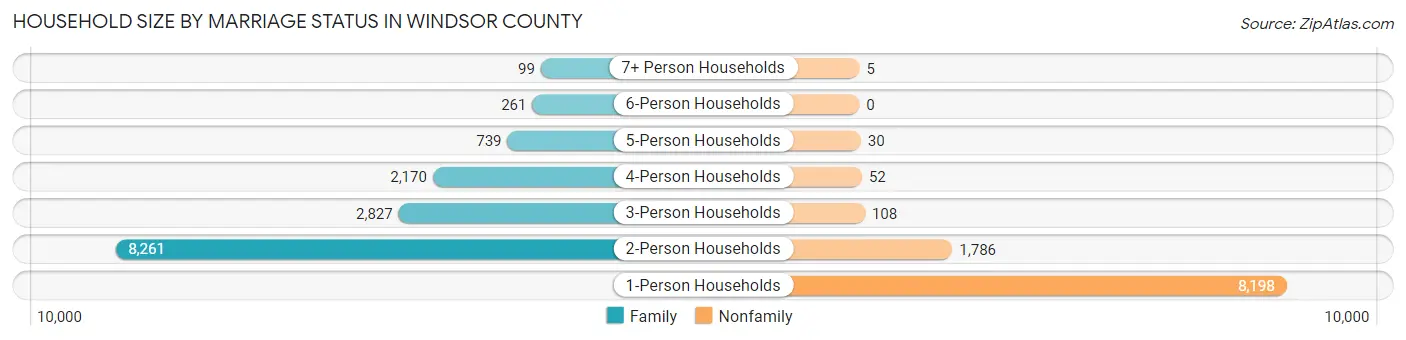
| Household Size | Family Households | Nonfamily Households |
| 1-Person Households | - | 8,198 (33.4%) |
| 2-Person Households | 8,261 (33.7%) | 1,786 (7.3%) |
| 3-Person Households | 2,827 (11.5%) | 108 (0.4%) |
| 4-Person Households | 2,170 (8.8%) | 52 (0.2%) |
| 5-Person Households | 739 (3.0%) | 30 (0.1%) |
| 6-Person Households | 261 (1.1%) | 0 (0.0%) |
| 7+ Person Households | 99 (0.4%) | 5 (0.0%) |
| Total | 14,357 (58.5%) | 10,179 (41.5%) |
Female Fertility in Windsor County
Fertility by Age in Windsor County
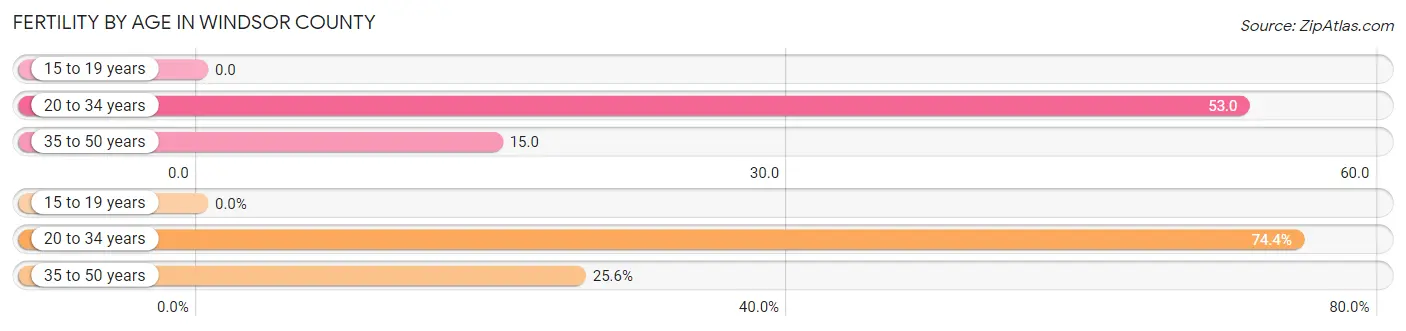
Average fertility rate in Windsor County is 28.0 births per 1,000 women. Women in the age bracket of 20 to 34 years have the highest fertility rate with 53.0 births per 1,000 women. Women in the age bracket of 20 to 34 years acount for 74.4% of all women with births.
| Age Bracket | Women with Births | Births / 1,000 Women |
| 15 to 19 years | 0 (0.0%) | 0.0 |
| 20 to 34 years | 232 (74.4%) | 53.0 |
| 35 to 50 years | 80 (25.6%) | 15.0 |
| Total | 312 (100.0%) | 28.0 |
Fertility by Age by Marriage Status in Windsor County
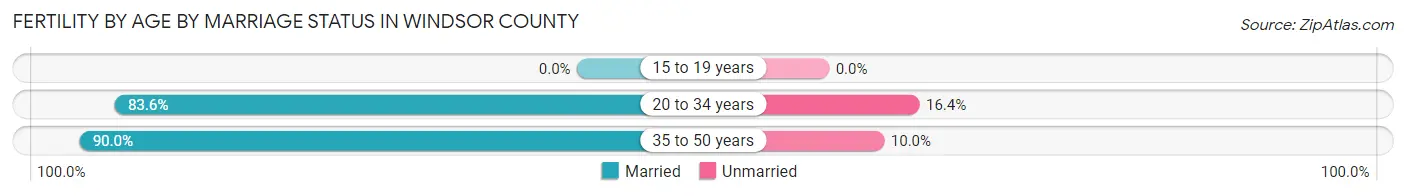
85.3% of women with births (312) in Windsor County are married. The highest percentage of unmarried women with births falls into 20 to 34 years age bracket with 16.4% of them unmarried at the time of birth, while the lowest percentage of unmarried women with births belong to 35 to 50 years age bracket with 10.0% of them unmarried.
| Age Bracket | Married | Unmarried |
| 15 to 19 years | 0 (0.0%) | 0 (0.0%) |
| 20 to 34 years | 194 (83.6%) | 38 (16.4%) |
| 35 to 50 years | 72 (90.0%) | 8 (10.0%) |
| Total | 266 (85.3%) | 46 (14.7%) |
Fertility by Education in Windsor County
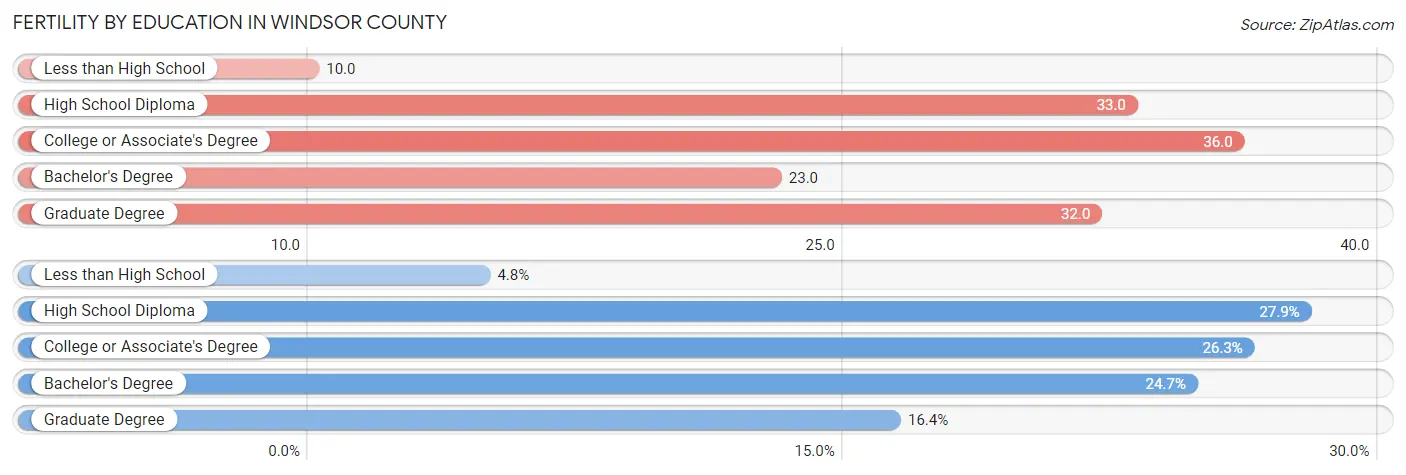
Average fertility rate in Windsor County is 28.0 births per 1,000 women. Women with the education attainment of college or associate's degree have the highest fertility rate of 36.0 births per 1,000 women, while women with the education attainment of less than high school have the lowest fertility at 10.0 births per 1,000 women. Women with the education attainment of high school diploma represent 27.9% of all women with births.
| Educational Attainment | Women with Births | Births / 1,000 Women |
| Less than High School | 15 (4.8%) | 10.0 |
| High School Diploma | 87 (27.9%) | 33.0 |
| College or Associate's Degree | 82 (26.3%) | 36.0 |
| Bachelor's Degree | 77 (24.7%) | 23.0 |
| Graduate Degree | 51 (16.4%) | 32.0 |
| Total | 312 (100.0%) | 28.0 |
Fertility by Education by Marriage Status in Windsor County
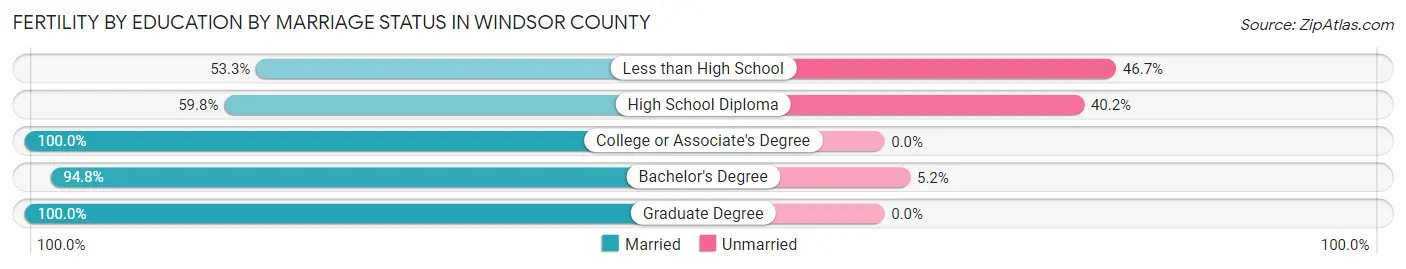
14.7% of women with births in Windsor County are unmarried. Women with the educational attainment of college or associate's degree are most likely to be married with 100.0% of them married at childbirth, while women with the educational attainment of less than high school are least likely to be married with 46.7% of them unmarried at childbirth.
| Educational Attainment | Married | Unmarried |
| Less than High School | 8 (53.3%) | 7 (46.7%) |
| High School Diploma | 52 (59.8%) | 35 (40.2%) |
| College or Associate's Degree | 82 (100.0%) | 0 (0.0%) |
| Bachelor's Degree | 73 (94.8%) | 4 (5.2%) |
| Graduate Degree | 51 (100.0%) | 0 (0.0%) |
| Total | 266 (85.3%) | 46 (14.7%) |
Income in Windsor County
Income Overview in Windsor County
Per Capita Income in Windsor County is $43,180, while median incomes of families and households are $94,699 and $69,492 respectively.
| Characteristic | Number | Measure |
| Per Capita Income | 57,832 | $43,180 |
| Median Family Income | 14,357 | $94,699 |
| Mean Family Income | 14,357 | $123,778 |
| Median Household Income | 24,536 | $69,492 |
| Mean Household Income | 24,536 | $98,098 |
| Income Deficit | 14,357 | $9,906 |
| Wage / Income Gap (%) | 57,832 | 15.21% |
| Wage / Income Gap ($) | 57,832 | 84.79¢ per $1 |
| Gini / Inequality Index | 57,832 | 0.47 |
Earnings by Sex in Windsor County
Average Earnings in Windsor County are $41,750, $45,594 for men and $38,660 for women, a difference of 15.2%.
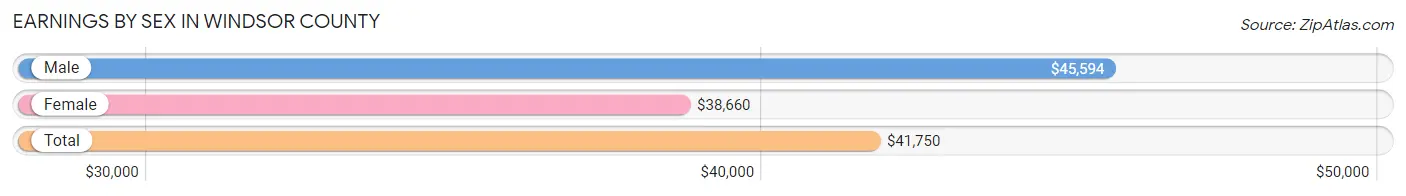
| Sex | Number | Average Earnings |
| Male | 16,645 (51.0%) | $45,594 |
| Female | 16,006 (49.0%) | $38,660 |
| Total | 32,651 (100.0%) | $41,750 |
Earnings by Sex by Income Bracket in Windsor County
The most common earnings brackets in Windsor County are $100,000+ for men (2,657 | 16.0%) and $75,000 to $99,999 for women (1,536 | 9.6%).
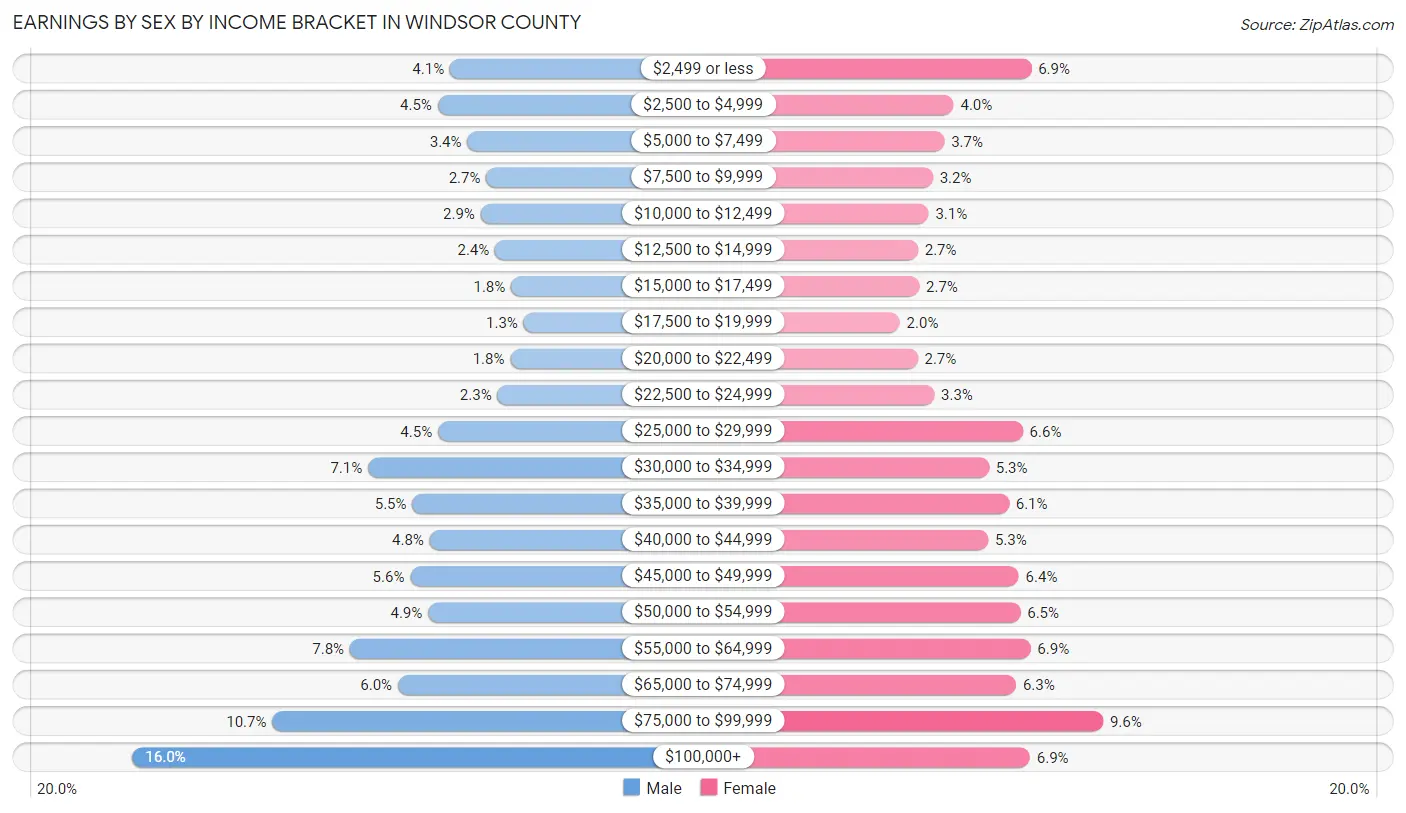
| Income | Male | Female |
| $2,499 or less | 676 (4.1%) | 1,106 (6.9%) |
| $2,500 to $4,999 | 753 (4.5%) | 641 (4.0%) |
| $5,000 to $7,499 | 568 (3.4%) | 585 (3.6%) |
| $7,500 to $9,999 | 449 (2.7%) | 515 (3.2%) |
| $10,000 to $12,499 | 485 (2.9%) | 490 (3.1%) |
| $12,500 to $14,999 | 395 (2.4%) | 426 (2.7%) |
| $15,000 to $17,499 | 295 (1.8%) | 434 (2.7%) |
| $17,500 to $19,999 | 216 (1.3%) | 317 (2.0%) |
| $20,000 to $22,499 | 299 (1.8%) | 424 (2.6%) |
| $22,500 to $24,999 | 380 (2.3%) | 524 (3.3%) |
| $25,000 to $29,999 | 751 (4.5%) | 1,054 (6.6%) |
| $30,000 to $34,999 | 1,187 (7.1%) | 852 (5.3%) |
| $35,000 to $39,999 | 911 (5.5%) | 971 (6.1%) |
| $40,000 to $44,999 | 802 (4.8%) | 846 (5.3%) |
| $45,000 to $49,999 | 924 (5.6%) | 1,031 (6.4%) |
| $50,000 to $54,999 | 813 (4.9%) | 1,041 (6.5%) |
| $55,000 to $64,999 | 1,300 (7.8%) | 1,101 (6.9%) |
| $65,000 to $74,999 | 1,000 (6.0%) | 1,014 (6.3%) |
| $75,000 to $99,999 | 1,784 (10.7%) | 1,536 (9.6%) |
| $100,000+ | 2,657 (16.0%) | 1,098 (6.9%) |
| Total | 16,645 (100.0%) | 16,006 (100.0%) |
Earnings by Sex by Educational Attainment in Windsor County
Average earnings in Windsor County are $51,668 for men and $42,746 for women, a difference of 17.3%. Men with an educational attainment of graduate degree enjoy the highest average annual earnings of $97,841, while those with less than high school education earn the least with $38,648. Women with an educational attainment of graduate degree earn the most with the average annual earnings of $67,571, while those with less than high school education have the smallest earnings of $27,891.
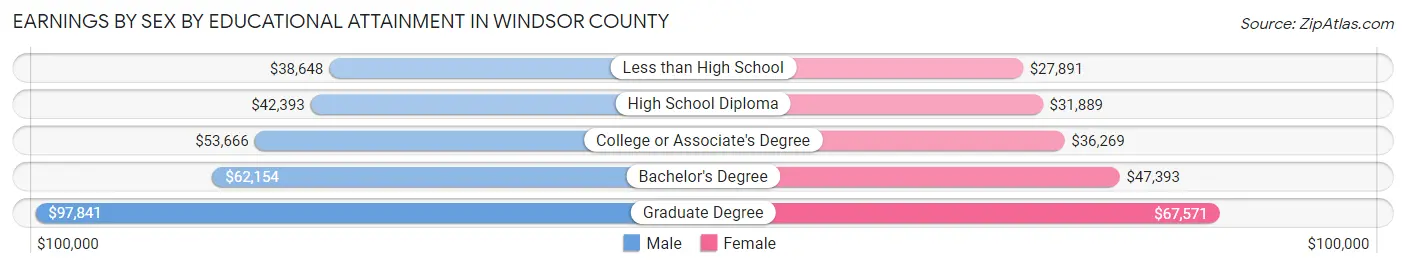
| Educational Attainment | Male Income | Female Income |
| Less than High School | $38,648 | $27,891 |
| High School Diploma | $42,393 | $31,889 |
| College or Associate's Degree | $53,666 | $36,269 |
| Bachelor's Degree | $62,154 | $47,393 |
| Graduate Degree | $97,841 | $67,571 |
| Total | $51,668 | $42,746 |
Family Income in Windsor County
Family Income Brackets in Windsor County
According to the Windsor County family income data, there are 3,216 families falling into the $100,000 to $149,999 income range, which is the most common income bracket and makes up 22.4% of all families. Conversely, the $10,000 to $14,999 income bracket is the least frequent group with only 100 families (0.7%) belonging to this category.
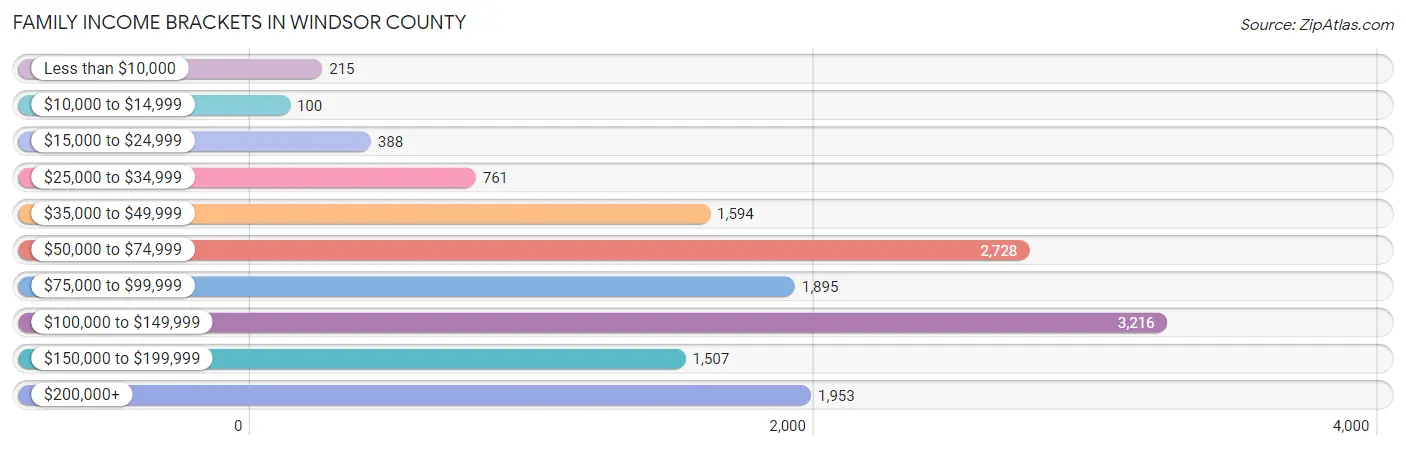
| Income Bracket | # Families | % Families |
| Less than $10,000 | 215 | 1.5% |
| $10,000 to $14,999 | 100 | 0.7% |
| $15,000 to $24,999 | 388 | 2.7% |
| $25,000 to $34,999 | 761 | 5.3% |
| $35,000 to $49,999 | 1,594 | 11.1% |
| $50,000 to $74,999 | 2,728 | 19.0% |
| $75,000 to $99,999 | 1,895 | 13.2% |
| $100,000 to $149,999 | 3,216 | 22.4% |
| $150,000 to $199,999 | 1,507 | 10.5% |
| $200,000+ | 1,953 | 13.6% |
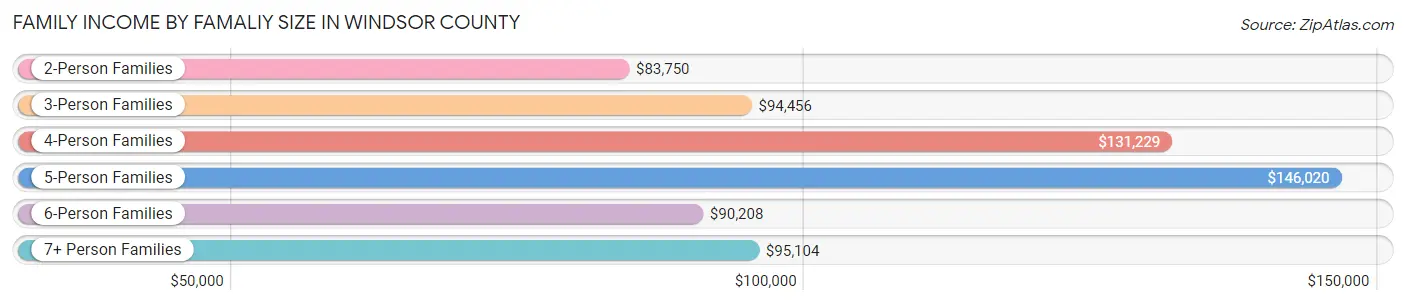
Family Income by Famaliy Size in Windsor County
5-person families (657 | 4.6%) account for the highest median family income in Windsor County with $146,020 per family, while 2-person families (8,630 | 60.1%) have the highest median income of $41,875 per family member.
| Income Bracket | # Families | Median Income |
| 2-Person Families | 8,630 (60.1%) | $83,750 |
| 3-Person Families | 2,821 (19.7%) | $94,456 |
| 4-Person Families | 1,939 (13.5%) | $131,229 |
| 5-Person Families | 657 (4.6%) | $146,020 |
| 6-Person Families | 223 (1.5%) | $90,208 |
| 7+ Person Families | 87 (0.6%) | $95,104 |
| Total | 14,357 (100.0%) | $94,699 |
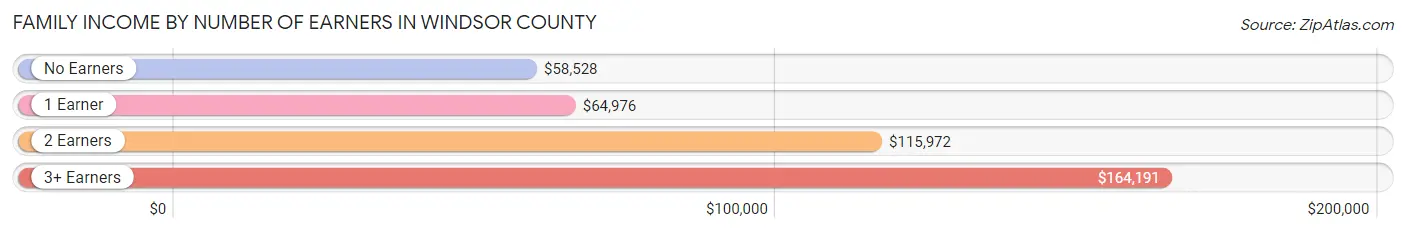
Family Income by Number of Earners in Windsor County
The median family income in Windsor County is $94,699, with families comprising 3+ earners (1,263) having the highest median family income of $164,191, while families with no earners (2,247) have the lowest median family income of $58,528, accounting for 8.8% and 15.7% of families, respectively.
| Number of Earners | # Families | Median Income |
| No Earners | 2,247 (15.7%) | $58,528 |
| 1 Earner | 4,024 (28.0%) | $64,976 |
| 2 Earners | 6,823 (47.5%) | $115,972 |
| 3+ Earners | 1,263 (8.8%) | $164,191 |
| Total | 14,357 (100.0%) | $94,699 |
Household Income in Windsor County
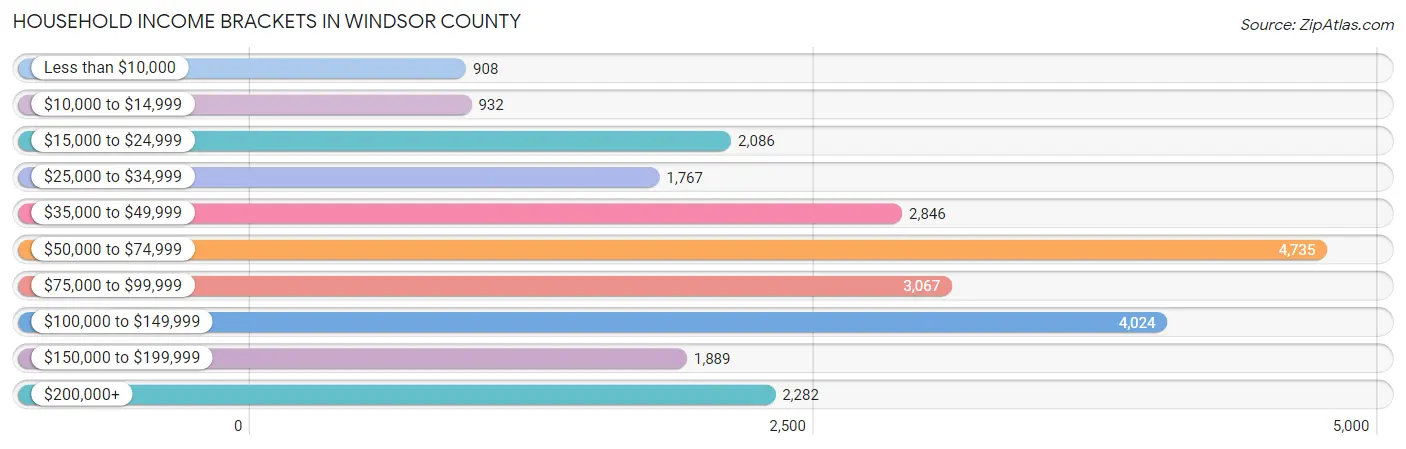
Household Income Brackets in Windsor County
With 4,735 households falling in the category, the $50,000 to $74,999 income range is the most frequent in Windsor County, accounting for 19.3% of all households. In contrast, only 908 households (3.7%) fall into the less than $10,000 income bracket, making it the least populous group.
| Income Bracket | # Households | % Households |
| Less than $10,000 | 908 | 3.7% |
| $10,000 to $14,999 | 932 | 3.8% |
| $15,000 to $24,999 | 2,086 | 8.5% |
| $25,000 to $34,999 | 1,767 | 7.2% |
| $35,000 to $49,999 | 2,846 | 11.6% |
| $50,000 to $74,999 | 4,735 | 19.3% |
| $75,000 to $99,999 | 3,067 | 12.5% |
| $100,000 to $149,999 | 4,024 | 16.4% |
| $150,000 to $199,999 | 1,889 | 7.7% |
| $200,000+ | 2,282 | 9.3% |
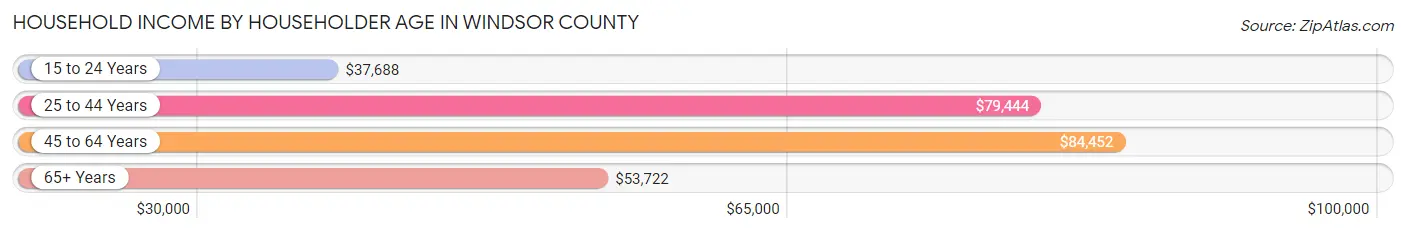
Household Income by Householder Age in Windsor County
The median household income in Windsor County is $69,492, with the highest median household income of $84,452 found in the 45 to 64 years age bracket for the primary householder. A total of 9,305 households (37.9%) fall into this category. Meanwhile, the 15 to 24 years age bracket for the primary householder has the lowest median household income of $37,688, with 581 households (2.4%) in this group.
| Income Bracket | # Households | Median Income |
| 15 to 24 Years | 581 (2.4%) | $37,688 |
| 25 to 44 Years | 5,750 (23.4%) | $79,444 |
| 45 to 64 Years | 9,305 (37.9%) | $84,452 |
| 65+ Years | 8,900 (36.3%) | $53,722 |
| Total | 24,536 (100.0%) | $69,492 |
Poverty in Windsor County
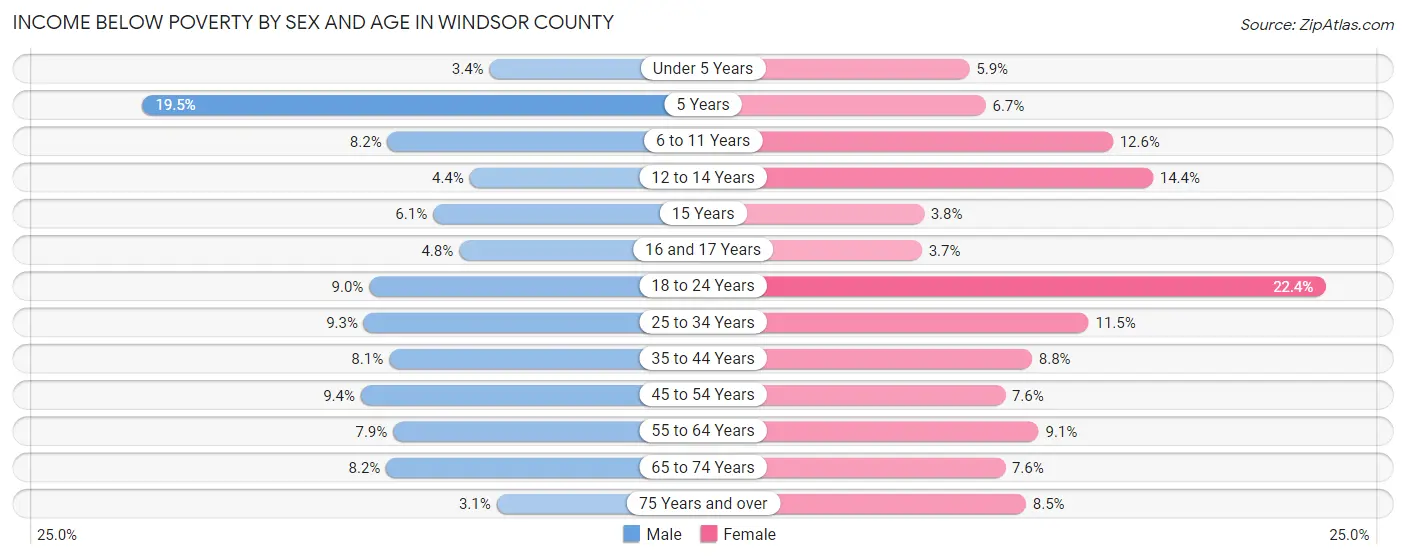
Income Below Poverty by Sex and Age in Windsor County
With 7.7% poverty level for males and 9.7% for females among the residents of Windsor County, 5 year old males and 18 to 24 year old females are the most vulnerable to poverty, with 42 males (19.5%) and 413 females (22.4%) in their respective age groups living below the poverty level.
| Age Bracket | Male | Female |
| Under 5 Years | 43 (3.4%) | 66 (5.9%) |
| 5 Years | 42 (19.5%) | 17 (6.7%) |
| 6 to 11 Years | 146 (8.2%) | 200 (12.6%) |
| 12 to 14 Years | 43 (4.3%) | 142 (14.4%) |
| 15 Years | 26 (6.0%) | 13 (3.8%) |
| 16 and 17 Years | 27 (4.8%) | 25 (3.7%) |
| 18 to 24 Years | 202 (9.0%) | 413 (22.4%) |
| 25 to 34 Years | 272 (9.3%) | 347 (11.5%) |
| 35 to 44 Years | 256 (8.1%) | 307 (8.8%) |
| 45 to 54 Years | 324 (9.4%) | 267 (7.6%) |
| 55 to 64 Years | 359 (7.9%) | 455 (9.1%) |
| 65 to 74 Years | 333 (8.2%) | 326 (7.6%) |
| 75 Years and over | 75 (3.1%) | 247 (8.5%) |
| Total | 2,148 (7.7%) | 2,825 (9.7%) |
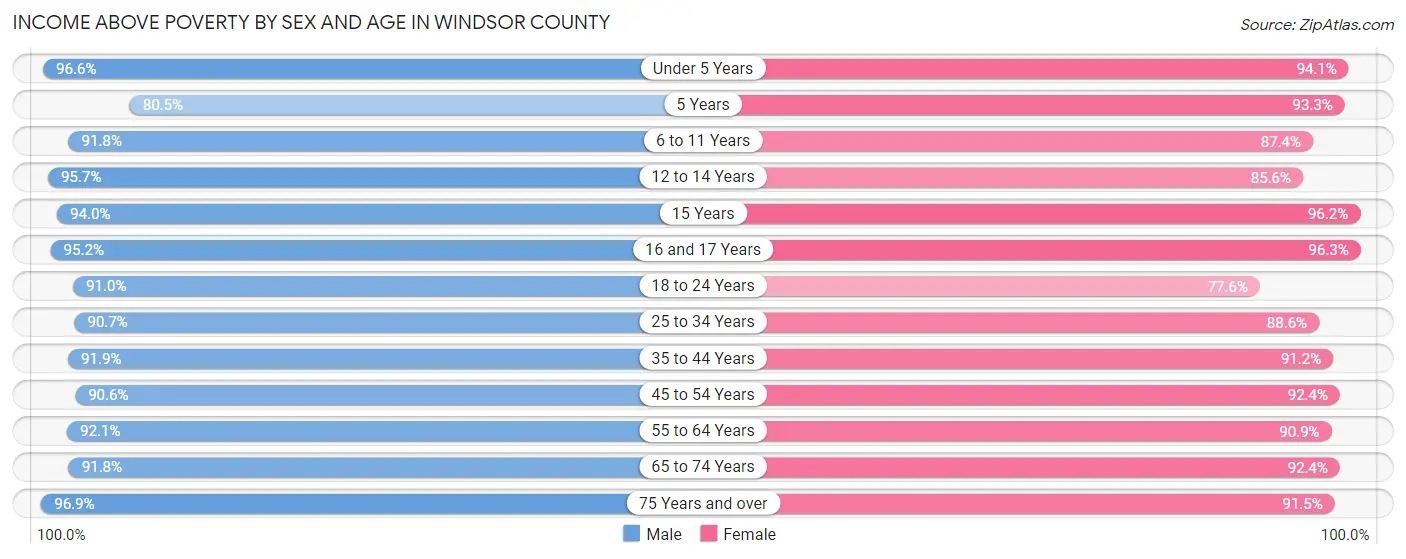
Income Above Poverty by Sex and Age in Windsor County
According to the poverty statistics in Windsor County, males aged 75 years and over and females aged 16 and 17 years are the age groups that are most secure financially, with 96.9% of males and 96.3% of females in these age groups living above the poverty line.
| Age Bracket | Male | Female |
| Under 5 Years | 1,210 (96.6%) | 1,049 (94.1%) |
| 5 Years | 173 (80.5%) | 238 (93.3%) |
| 6 to 11 Years | 1,643 (91.8%) | 1,391 (87.4%) |
| 12 to 14 Years | 945 (95.7%) | 842 (85.6%) |
| 15 Years | 404 (94.0%) | 329 (96.2%) |
| 16 and 17 Years | 531 (95.2%) | 648 (96.3%) |
| 18 to 24 Years | 2,040 (91.0%) | 1,428 (77.6%) |
| 25 to 34 Years | 2,665 (90.7%) | 2,684 (88.5%) |
| 35 to 44 Years | 2,910 (91.9%) | 3,175 (91.2%) |
| 45 to 54 Years | 3,124 (90.6%) | 3,258 (92.4%) |
| 55 to 64 Years | 4,186 (92.1%) | 4,526 (90.9%) |
| 65 to 74 Years | 3,718 (91.8%) | 3,978 (92.4%) |
| 75 Years and over | 2,341 (96.9%) | 2,644 (91.5%) |
| Total | 25,890 (92.3%) | 26,190 (90.3%) |
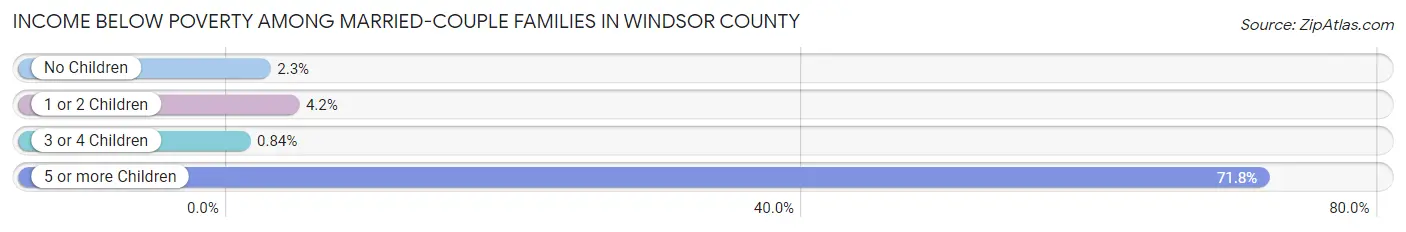
Income Below Poverty Among Married-Couple Families in Windsor County
The poverty statistics for married-couple families in Windsor County show that 2.9% or 356 of the total 12,070 families live below the poverty line. Families with 5 or more children have the highest poverty rate of 71.8%, comprising of 28 families. On the other hand, families with 3 or 4 children have the lowest poverty rate of 0.8%, which includes 5 families.
| Children | Above Poverty | Below Poverty |
| No Children | 7,980 (97.8%) | 184 (2.2%) |
| 1 or 2 Children | 3,136 (95.8%) | 139 (4.2%) |
| 3 or 4 Children | 587 (99.2%) | 5 (0.8%) |
| 5 or more Children | 11 (28.2%) | 28 (71.8%) |
| Total | 11,714 (97.1%) | 356 (2.9%) |
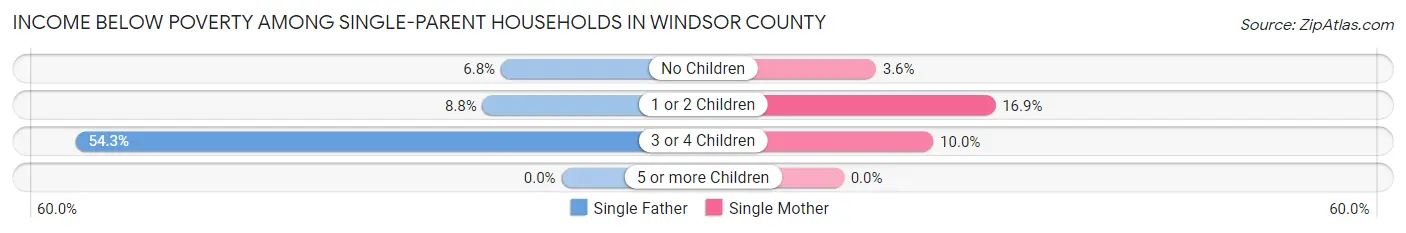
Income Below Poverty Among Single-Parent Households in Windsor County
According to the poverty data in Windsor County, 10.4% or 64 single-father households and 11.9% or 199 single-mother households are living below the poverty line. Among single-father households, those with 3 or 4 children have the highest poverty rate, with 19 households (54.3%) experiencing poverty. Likewise, among single-mother households, those with 1 or 2 children have the highest poverty rate, with 173 households (16.9%) falling below the poverty line.
| Children | Single Father | Single Mother |
| No Children | 17 (6.8%) | 22 (3.6%) |
| 1 or 2 Children | 28 (8.8%) | 173 (16.9%) |
| 3 or 4 Children | 19 (54.3%) | 4 (10.0%) |
| 5 or more Children | 0 (0.0%) | 0 (0.0%) |
| Total | 64 (10.4%) | 199 (11.9%) |
Income Below Poverty Among Married-Couple vs Single-Parent Households in Windsor County
The poverty data for Windsor County shows that 356 of the married-couple family households (2.9%) and 263 of the single-parent households (11.5%) are living below the poverty level. Within the married-couple family households, those with 5 or more children have the highest poverty rate, with 28 households (71.8%) falling below the poverty line. Among the single-parent households, those with 3 or 4 children have the highest poverty rate, with 23 household (30.7%) living below poverty.
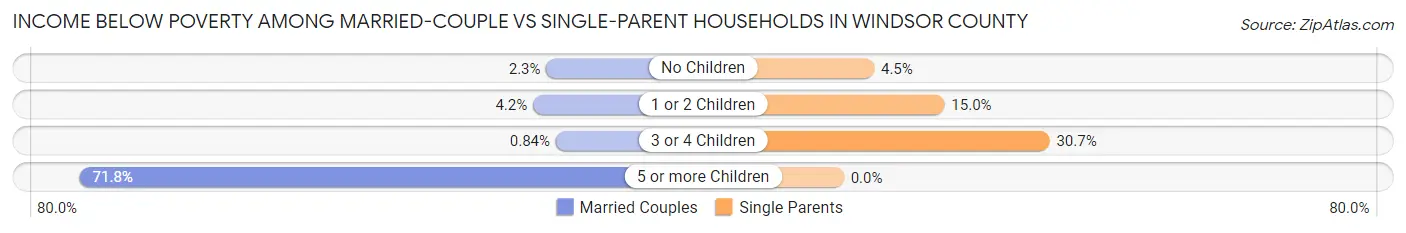
| Children | Married-Couple Families | Single-Parent Households |
| No Children | 184 (2.2%) | 39 (4.5%) |
| 1 or 2 Children | 139 (4.2%) | 201 (15.0%) |
| 3 or 4 Children | 5 (0.8%) | 23 (30.7%) |
| 5 or more Children | 28 (71.8%) | 0 (0.0%) |
| Total | 356 (2.9%) | 263 (11.5%) |
Employment Characteristics in Windsor County
Employment by Class of Employer in Windsor County
Among the 28,757 employed individuals in Windsor County, private company employees (15,788 | 54.9%), not-for-profit organizations (4,844 | 16.8%), and self-employed (not incorporated) (3,169 | 11.0%) make up the most common classes of employment.
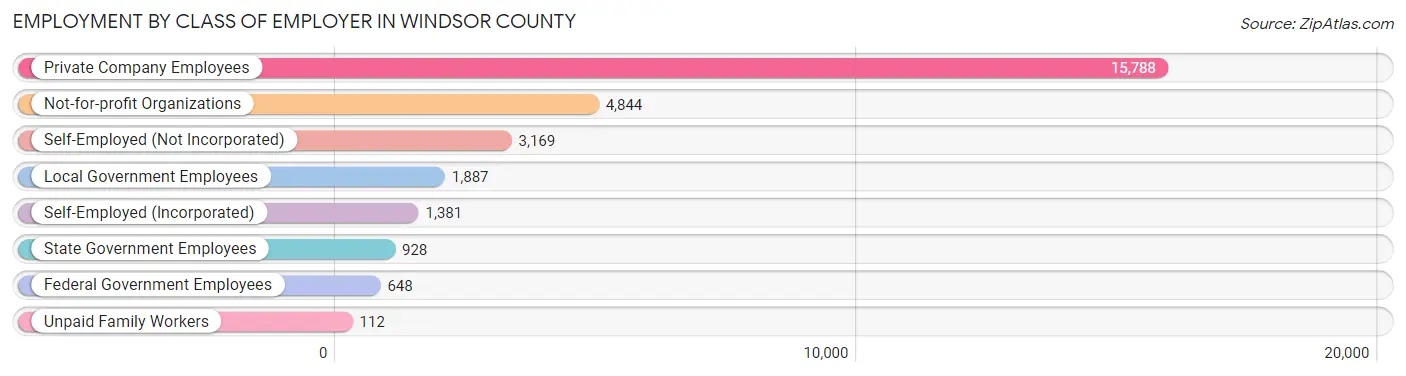
| Employer Class | # Employees | % Employees |
| Private Company Employees | 15,788 | 54.9% |
| Self-Employed (Incorporated) | 1,381 | 4.8% |
| Self-Employed (Not Incorporated) | 3,169 | 11.0% |
| Not-for-profit Organizations | 4,844 | 16.8% |
| Local Government Employees | 1,887 | 6.6% |
| State Government Employees | 928 | 3.2% |
| Federal Government Employees | 648 | 2.2% |
| Unpaid Family Workers | 112 | 0.4% |
| Total | 28,757 | 100.0% |
Employment Status by Age in Windsor County
According to the labor force statistics for Windsor County, out of the total population over 16 years of age (48,783), 62.2% or 30,343 individuals are in the labor force, with 3.7% or 1,123 of them unemployed. The age group with the highest labor force participation rate is 30 to 34 years, with 86.1% or 2,654 individuals in the labor force. Within the labor force, the 16 to 19 years age range has the highest percentage of unemployed individuals, with 7.6% or 76 of them being unemployed.
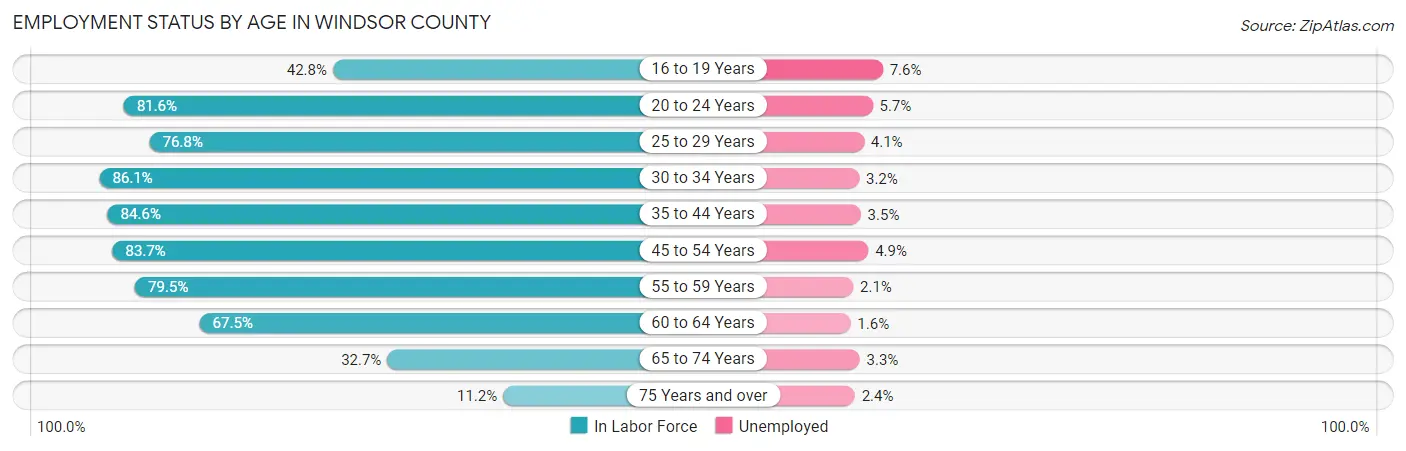
| Age Bracket | In Labor Force | Unemployed |
| 16 to 19 Years | 1,002 (42.8%) | 76 (7.6%) |
| 20 to 24 Years | 2,444 (81.6%) | 139 (5.7%) |
| 25 to 29 Years | 2,284 (76.8%) | 94 (4.1%) |
| 30 to 34 Years | 2,654 (86.1%) | 85 (3.2%) |
| 35 to 44 Years | 5,698 (84.6%) | 199 (3.5%) |
| 45 to 54 Years | 5,880 (83.7%) | 288 (4.9%) |
| 55 to 59 Years | 3,601 (79.5%) | 76 (2.1%) |
| 60 to 64 Years | 3,413 (67.5%) | 55 (1.6%) |
| 65 to 74 Years | 2,771 (32.7%) | 91 (3.3%) |
| 75 Years and over | 624 (11.2%) | 15 (2.4%) |
| Total | 30,343 (62.2%) | 1,123 (3.7%) |
Employment Status by Educational Attainment in Windsor County
According to labor force statistics for Windsor County, 80.0% of individuals (23,522) out of the total population between 25 and 64 years of age (29,402) are in the labor force, with 3.4% or 800 of them being unemployed. The group with the highest labor force participation rate are those with the educational attainment of bachelor's degree or higher, with 86.4% or 10,548 individuals in the labor force. Within the labor force, individuals with less than high school education have the highest percentage of unemployment, with 5.5% or 45 of them being unemployed.
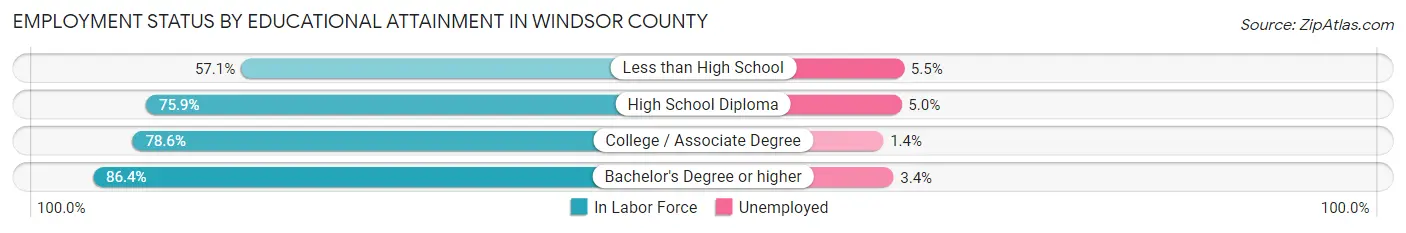
| Educational Attainment | In Labor Force | Unemployed |
| Less than High School | 811 (57.1%) | 78 (5.5%) |
| High School Diploma | 6,281 (75.9%) | 414 (5.0%) |
| College / Associate Degree | 5,893 (78.6%) | 105 (1.4%) |
| Bachelor's Degree or higher | 10,548 (86.4%) | 415 (3.4%) |
| Total | 23,522 (80.0%) | 1,000 (3.4%) |
Employment Occupations by Sex in Windsor County
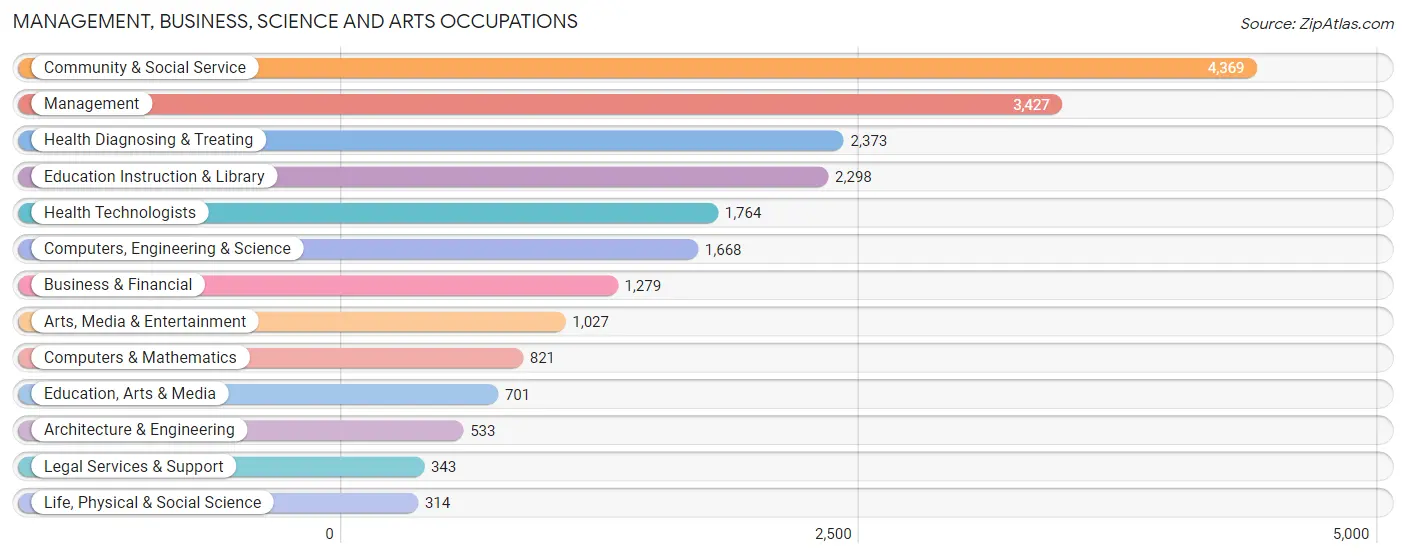
Management, Business, Science and Arts Occupations
The most common Management, Business, Science and Arts occupations in Windsor County are Community & Social Service (4,369 | 15.0%), Management (3,427 | 11.7%), Health Diagnosing & Treating (2,373 | 8.1%), Education Instruction & Library (2,298 | 7.9%), and Health Technologists (1,764 | 6.0%).
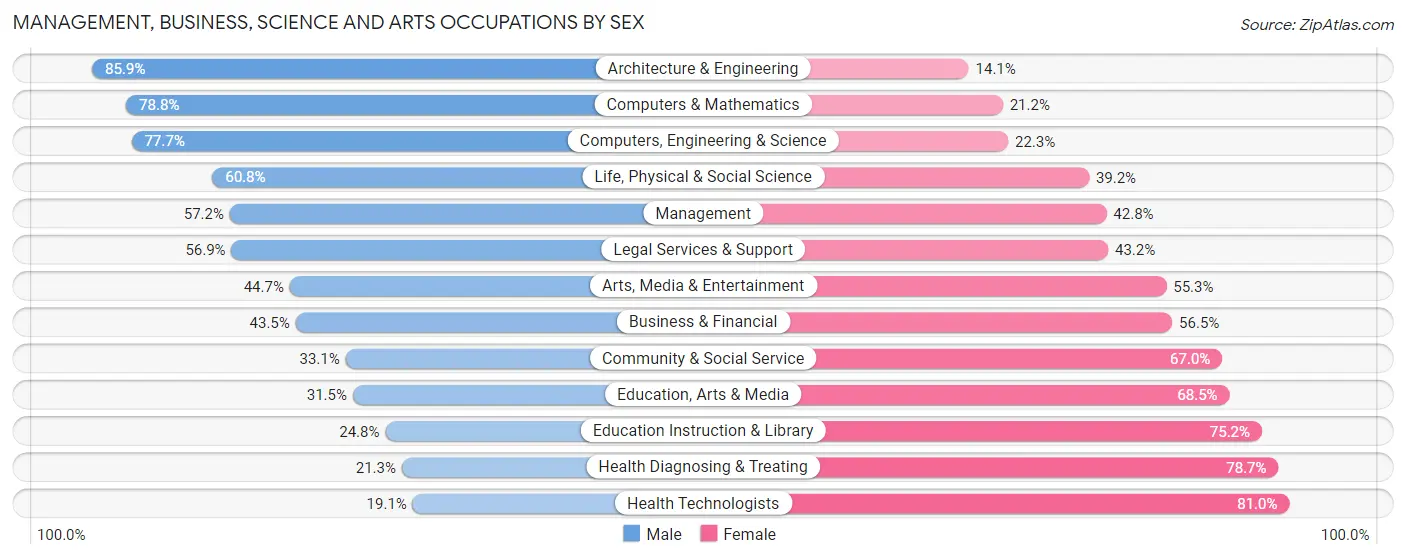
Management, Business, Science and Arts Occupations by Sex
Within the Management, Business, Science and Arts occupations in Windsor County, the most male-oriented occupations are Architecture & Engineering (85.9%), Computers & Mathematics (78.8%), and Computers, Engineering & Science (77.7%), while the most female-oriented occupations are Health Technologists (80.9%), Health Diagnosing & Treating (78.7%), and Education Instruction & Library (75.2%).
| Occupation | Male | Female |
| Management | 1,960 (57.2%) | 1,467 (42.8%) |
| Business & Financial | 556 (43.5%) | 723 (56.5%) |
| Computers, Engineering & Science | 1,296 (77.7%) | 372 (22.3%) |
| Computers & Mathematics | 647 (78.8%) | 174 (21.2%) |
| Architecture & Engineering | 458 (85.9%) | 75 (14.1%) |
| Life, Physical & Social Science | 191 (60.8%) | 123 (39.2%) |
| Community & Social Service | 1,444 (33.1%) | 2,925 (66.9%) |
| Education, Arts & Media | 221 (31.5%) | 480 (68.5%) |
| Legal Services & Support | 195 (56.9%) | 148 (43.1%) |
| Education Instruction & Library | 569 (24.8%) | 1,729 (75.2%) |
| Arts, Media & Entertainment | 459 (44.7%) | 568 (55.3%) |
| Health Diagnosing & Treating | 506 (21.3%) | 1,867 (78.7%) |
| Health Technologists | 336 (19.1%) | 1,428 (80.9%) |
| Total (Category) | 5,762 (43.9%) | 7,354 (56.1%) |
| Total (Overall) | 14,709 (50.4%) | 14,494 (49.6%) |
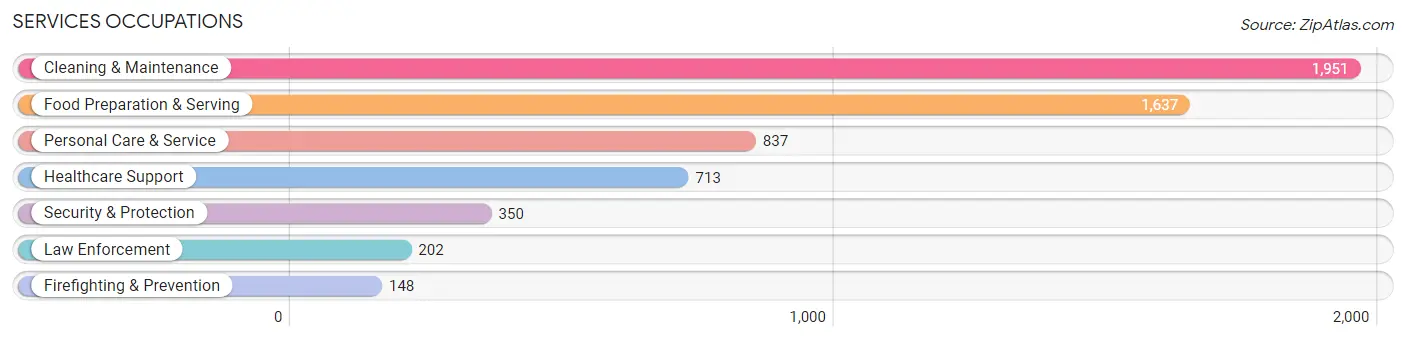
Services Occupations
The most common Services occupations in Windsor County are Cleaning & Maintenance (1,951 | 6.7%), Food Preparation & Serving (1,637 | 5.6%), Personal Care & Service (837 | 2.9%), Healthcare Support (713 | 2.4%), and Security & Protection (350 | 1.2%).
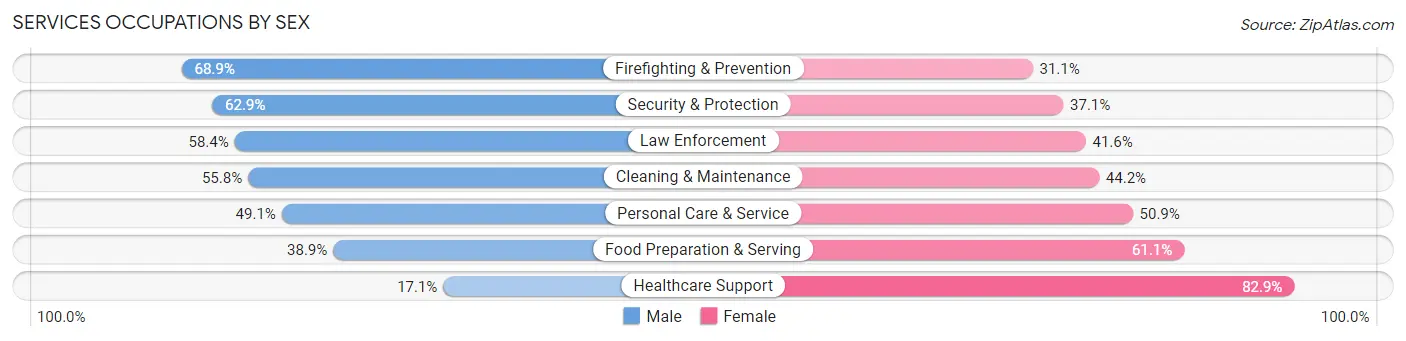
Services Occupations by Sex
Within the Services occupations in Windsor County, the most male-oriented occupations are Firefighting & Prevention (68.9%), Security & Protection (62.9%), and Law Enforcement (58.4%), while the most female-oriented occupations are Healthcare Support (82.9%), Food Preparation & Serving (61.1%), and Personal Care & Service (50.9%).
| Occupation | Male | Female |
| Healthcare Support | 122 (17.1%) | 591 (82.9%) |
| Security & Protection | 220 (62.9%) | 130 (37.1%) |
| Firefighting & Prevention | 102 (68.9%) | 46 (31.1%) |
| Law Enforcement | 118 (58.4%) | 84 (41.6%) |
| Food Preparation & Serving | 637 (38.9%) | 1,000 (61.1%) |
| Cleaning & Maintenance | 1,088 (55.8%) | 863 (44.2%) |
| Personal Care & Service | 411 (49.1%) | 426 (50.9%) |
| Total (Category) | 2,478 (45.2%) | 3,010 (54.8%) |
| Total (Overall) | 14,709 (50.4%) | 14,494 (49.6%) |
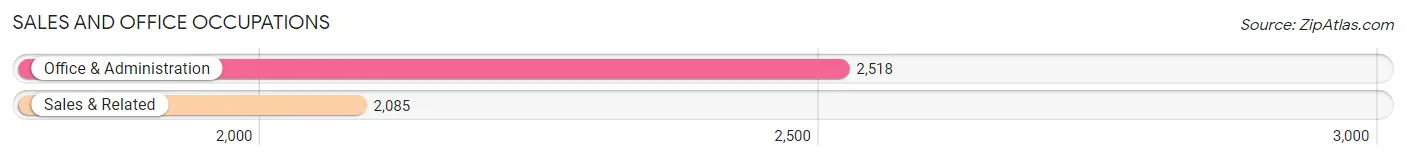
Sales and Office Occupations
The most common Sales and Office occupations in Windsor County are Office & Administration (2,518 | 8.6%), and Sales & Related (2,085 | 7.1%).
Sales and Office Occupations by Sex

| Occupation | Male | Female |
| Sales & Related | 832 (39.9%) | 1,253 (60.1%) |
| Office & Administration | 438 (17.4%) | 2,080 (82.6%) |
| Total (Category) | 1,270 (27.6%) | 3,333 (72.4%) |
| Total (Overall) | 14,709 (50.4%) | 14,494 (49.6%) |
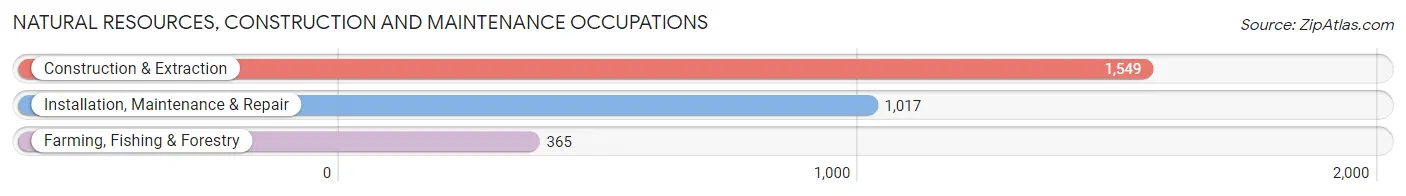
Natural Resources, Construction and Maintenance Occupations
The most common Natural Resources, Construction and Maintenance occupations in Windsor County are Construction & Extraction (1,549 | 5.3%), Installation, Maintenance & Repair (1,017 | 3.5%), and Farming, Fishing & Forestry (365 | 1.3%).
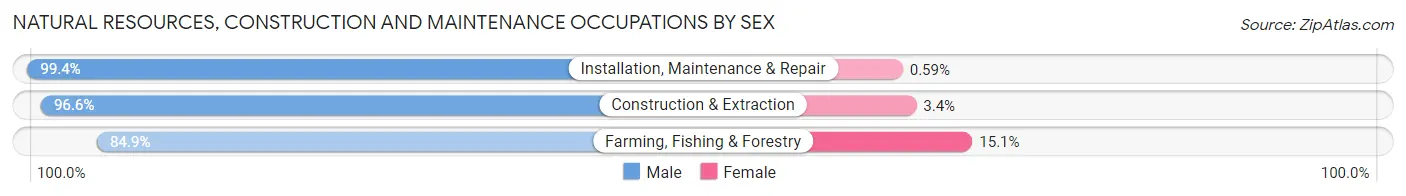
Natural Resources, Construction and Maintenance Occupations by Sex
| Occupation | Male | Female |
| Farming, Fishing & Forestry | 310 (84.9%) | 55 (15.1%) |
| Construction & Extraction | 1,496 (96.6%) | 53 (3.4%) |
| Installation, Maintenance & Repair | 1,011 (99.4%) | 6 (0.6%) |
| Total (Category) | 2,817 (96.1%) | 114 (3.9%) |
| Total (Overall) | 14,709 (50.4%) | 14,494 (49.6%) |
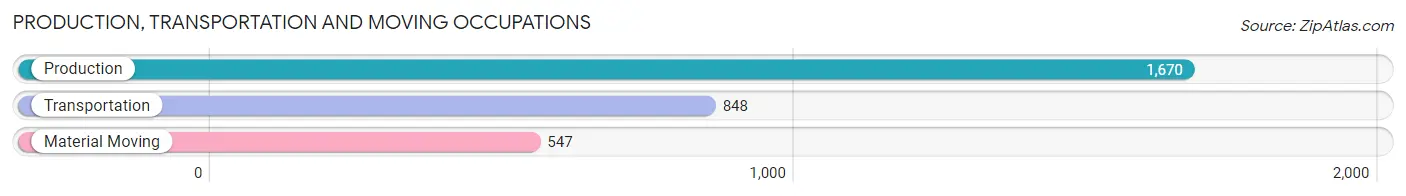
Production, Transportation and Moving Occupations
The most common Production, Transportation and Moving occupations in Windsor County are Production (1,670 | 5.7%), Transportation (848 | 2.9%), and Material Moving (547 | 1.9%).
Production, Transportation and Moving Occupations by Sex
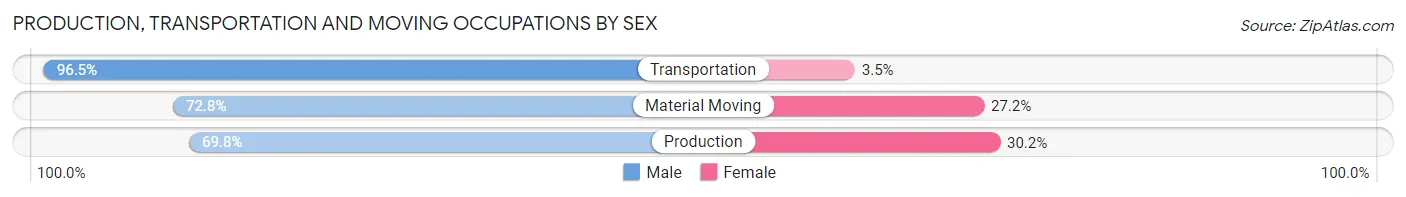
| Occupation | Male | Female |
| Production | 1,166 (69.8%) | 504 (30.2%) |
| Transportation | 818 (96.5%) | 30 (3.5%) |
| Material Moving | 398 (72.8%) | 149 (27.2%) |
| Total (Category) | 2,382 (77.7%) | 683 (22.3%) |
| Total (Overall) | 14,709 (50.4%) | 14,494 (49.6%) |
Employment Industries by Sex in Windsor County
Employment Industries in Windsor County
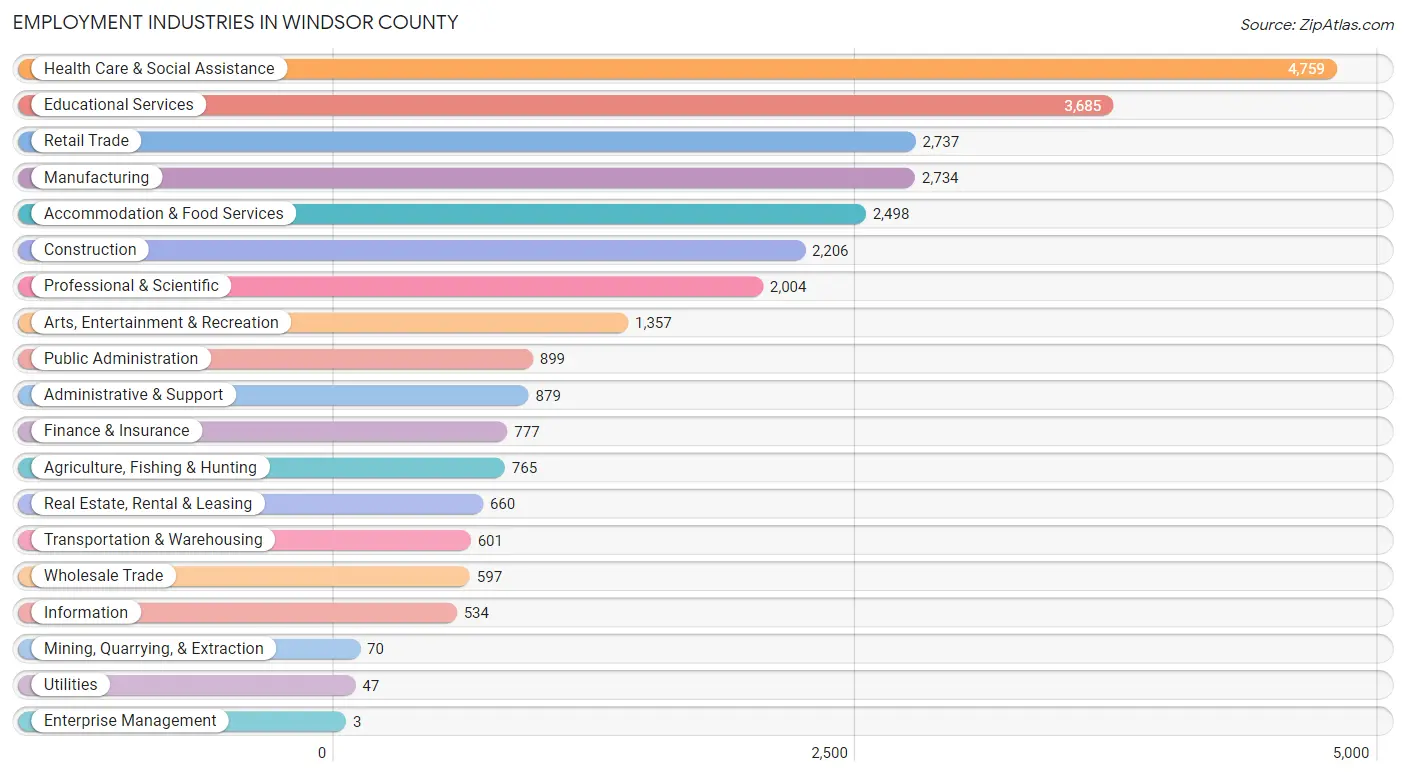
The major employment industries in Windsor County include Health Care & Social Assistance (4,759 | 16.3%), Educational Services (3,685 | 12.6%), Retail Trade (2,737 | 9.4%), Manufacturing (2,734 | 9.4%), and Accommodation & Food Services (2,498 | 8.6%).
Employment Industries by Sex in Windsor County
The Windsor County industries that see more men than women are Construction (92.0%), Transportation & Warehousing (86.5%), and Utilities (83.0%), whereas the industries that tend to have a higher number of women are Enterprise Management (100.0%), Mining, Quarrying, & Extraction (87.1%), and Health Care & Social Assistance (78.5%).

| Industry | Male | Female |
| Agriculture, Fishing & Hunting | 590 (77.1%) | 175 (22.9%) |
| Mining, Quarrying, & Extraction | 9 (12.9%) | 61 (87.1%) |
| Construction | 2,029 (92.0%) | 177 (8.0%) |
| Manufacturing | 2,031 (74.3%) | 703 (25.7%) |
| Wholesale Trade | 303 (50.7%) | 294 (49.2%) |
| Retail Trade | 1,296 (47.3%) | 1,441 (52.6%) |
| Transportation & Warehousing | 520 (86.5%) | 81 (13.5%) |
| Utilities | 39 (83.0%) | 8 (17.0%) |
| Information | 303 (56.7%) | 231 (43.3%) |
| Finance & Insurance | 310 (39.9%) | 467 (60.1%) |
| Real Estate, Rental & Leasing | 417 (63.2%) | 243 (36.8%) |
| Professional & Scientific | 1,209 (60.3%) | 795 (39.7%) |
| Enterprise Management | 0 (0.0%) | 3 (100.0%) |
| Administrative & Support | 514 (58.5%) | 365 (41.5%) |
| Educational Services | 1,215 (33.0%) | 2,470 (67.0%) |
| Health Care & Social Assistance | 1,023 (21.5%) | 3,736 (78.5%) |
| Arts, Entertainment & Recreation | 860 (63.4%) | 497 (36.6%) |
| Accommodation & Food Services | 1,011 (40.5%) | 1,487 (59.5%) |
| Public Administration | 433 (48.2%) | 466 (51.8%) |
| Total | 14,709 (50.4%) | 14,494 (49.6%) |
Education in Windsor County
School Enrollment in Windsor County
The most common levels of schooling among the 10,880 students in Windsor County are high school (2,736 | 25.2%), middle school (2,481 | 22.8%), and elementary school (2,328 | 21.4%).
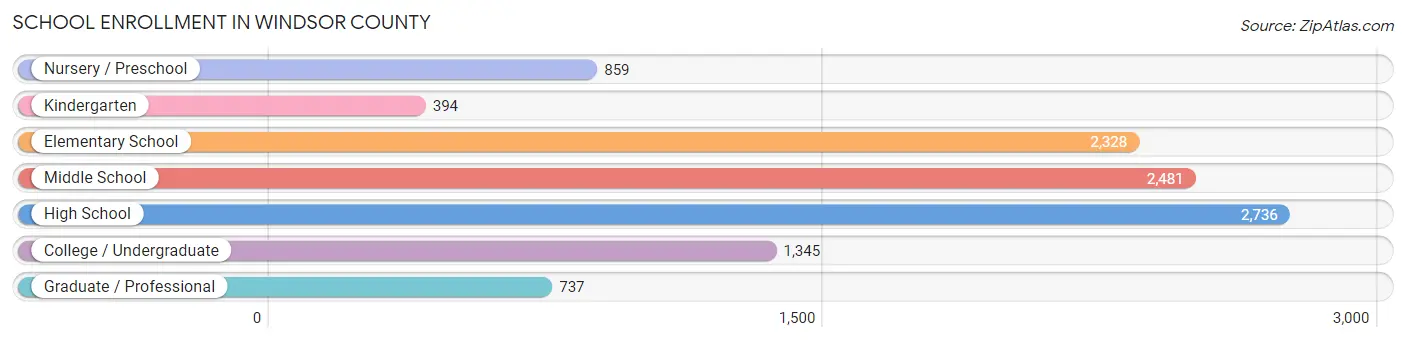
| School Level | # Students | % Students |
| Nursery / Preschool | 859 | 7.9% |
| Kindergarten | 394 | 3.6% |
| Elementary School | 2,328 | 21.4% |
| Middle School | 2,481 | 22.8% |
| High School | 2,736 | 25.2% |
| College / Undergraduate | 1,345 | 12.4% |
| Graduate / Professional | 737 | 6.8% |
| Total | 10,880 | 100.0% |
School Enrollment by Age by Funding Source in Windsor County
Out of a total of 10,880 students who are enrolled in schools in Windsor County, 2,481 (22.8%) attend a private institution, while the remaining 8,399 (77.2%) are enrolled in public schools. The age group of 25 to 34 year olds has the highest likelihood of being enrolled in private schools, with 372 (56.0% in the age bracket) enrolled. Conversely, the age group of 15 to 17 year olds has the lowest likelihood of being enrolled in a private school, with 1,783 (90.2% in the age bracket) attending a public institution.
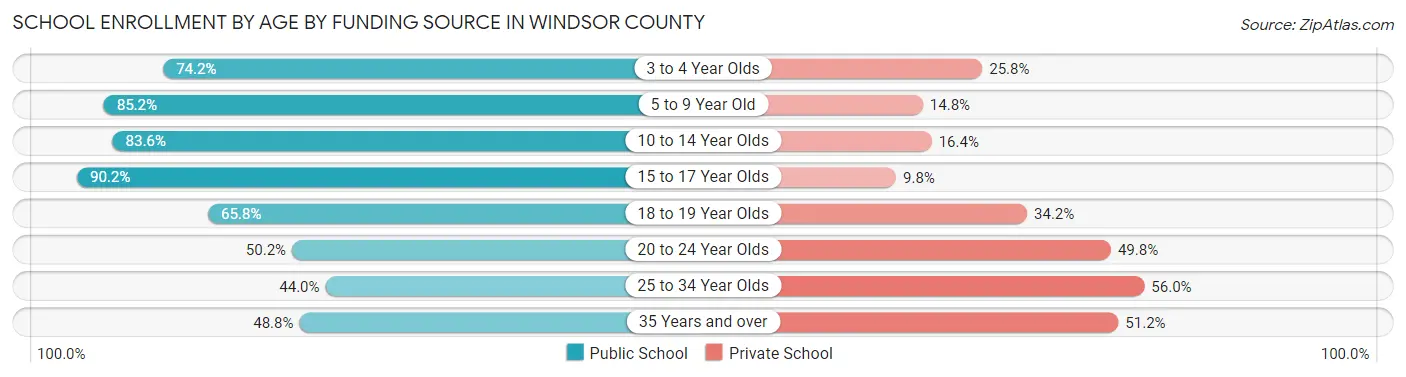
| Age Bracket | Public School | Private School |
| 3 to 4 Year Olds | 517 (74.2%) | 180 (25.8%) |
| 5 to 9 Year Old | 2,224 (85.2%) | 385 (14.8%) |
| 10 to 14 Year Olds | 2,513 (83.6%) | 493 (16.4%) |
| 15 to 17 Year Olds | 1,783 (90.2%) | 193 (9.8%) |
| 18 to 19 Year Olds | 472 (65.8%) | 245 (34.2%) |
| 20 to 24 Year Olds | 351 (50.2%) | 348 (49.8%) |
| 25 to 34 Year Olds | 292 (44.0%) | 372 (56.0%) |
| 35 Years and over | 250 (48.8%) | 262 (51.2%) |
| Total | 8,399 (77.2%) | 2,481 (22.8%) |
Educational Attainment by Field of Study in Windsor County
Education (2,172 | 11.2%), social sciences (2,120 | 10.9%), bio, nature & agricultural (1,869 | 9.6%), liberal arts & history (1,749 | 9.0%), and science & technology (1,654 | 8.5%) are the most common fields of study among 19,380 individuals in Windsor County who have obtained a bachelor's degree or higher.
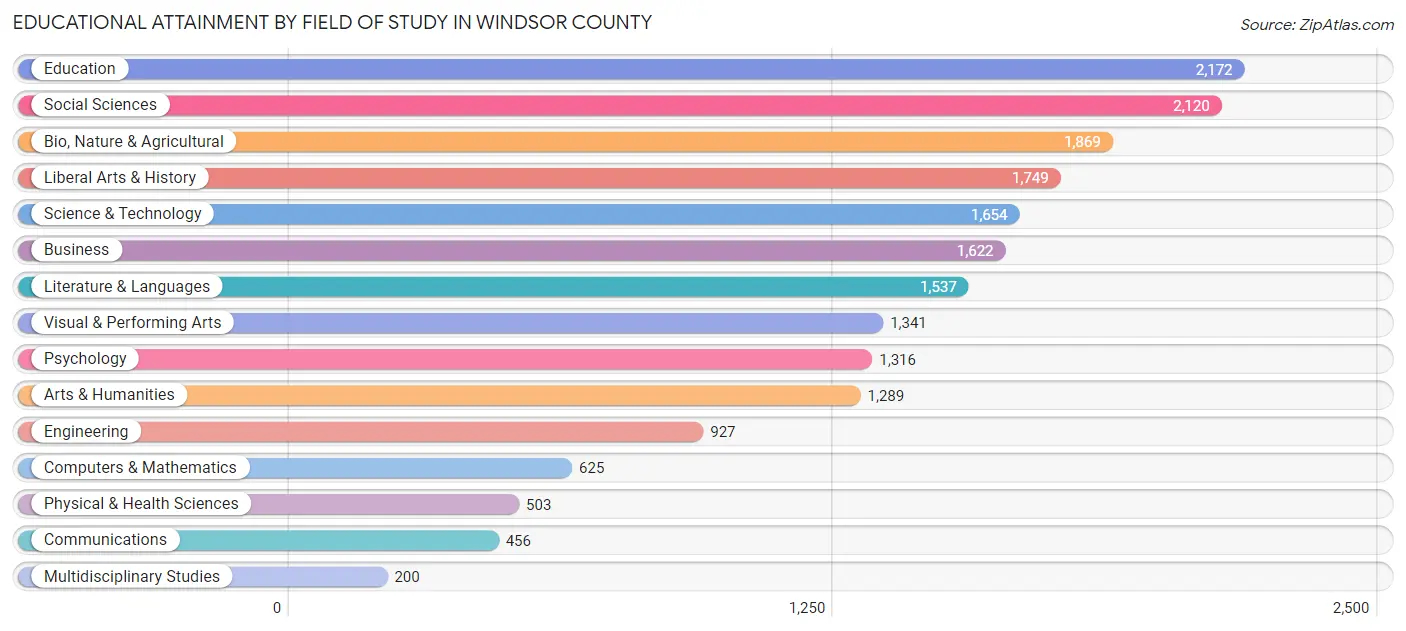
| Field of Study | # Graduates | % Graduates |
| Computers & Mathematics | 625 | 3.2% |
| Bio, Nature & Agricultural | 1,869 | 9.6% |
| Physical & Health Sciences | 503 | 2.6% |
| Psychology | 1,316 | 6.8% |
| Social Sciences | 2,120 | 10.9% |
| Engineering | 927 | 4.8% |
| Multidisciplinary Studies | 200 | 1.0% |
| Science & Technology | 1,654 | 8.5% |
| Business | 1,622 | 8.4% |
| Education | 2,172 | 11.2% |
| Literature & Languages | 1,537 | 7.9% |
| Liberal Arts & History | 1,749 | 9.0% |
| Visual & Performing Arts | 1,341 | 6.9% |
| Communications | 456 | 2.4% |
| Arts & Humanities | 1,289 | 6.7% |
| Total | 19,380 | 100.0% |
Transportation & Commute in Windsor County
Vehicle Availability by Sex in Windsor County
The most prevalent vehicle ownership categories in Windsor County are males with 2 vehicles (6,865, accounting for 47.2%) and females with 2 vehicles (6,673, making up 48.3%).
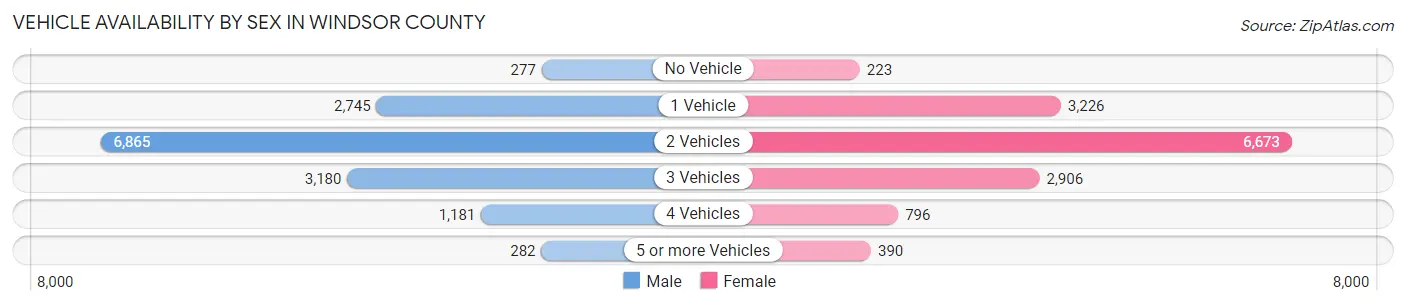
| Vehicles Available | Male | Female |
| No Vehicle | 277 (1.9%) | 223 (1.6%) |
| 1 Vehicle | 2,745 (18.9%) | 3,226 (22.7%) |
| 2 Vehicles | 6,865 (47.2%) | 6,673 (46.9%) |
| 3 Vehicles | 3,180 (21.9%) | 2,906 (20.4%) |
| 4 Vehicles | 1,181 (8.1%) | 796 (5.6%) |
| 5 or more Vehicles | 282 (1.9%) | 390 (2.7%) |
| Total | 14,530 (100.0%) | 14,214 (100.0%) |
Commute Time in Windsor County
The most frequently occuring commute durations in Windsor County are 20 to 24 minutes (3,871 commuters, 15.5%), 15 to 19 minutes (3,677 commuters, 14.7%), and 10 to 14 minutes (3,438 commuters, 13.8%).
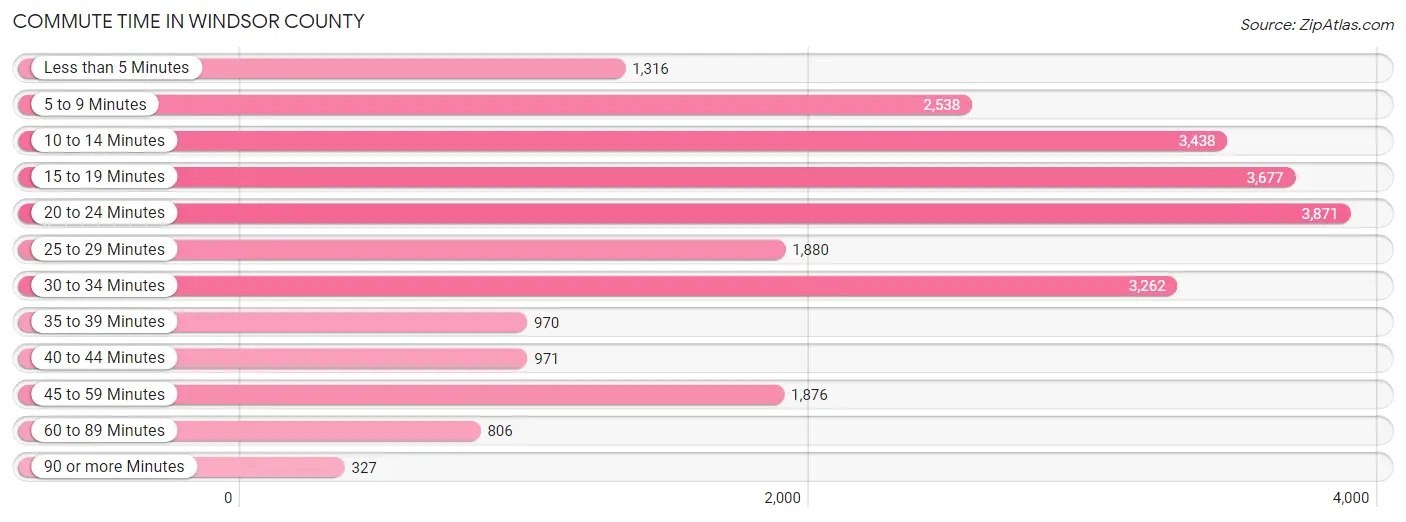
| Commute Time | # Commuters | % Commuters |
| Less than 5 Minutes | 1,316 | 5.3% |
| 5 to 9 Minutes | 2,538 | 10.2% |
| 10 to 14 Minutes | 3,438 | 13.8% |
| 15 to 19 Minutes | 3,677 | 14.7% |
| 20 to 24 Minutes | 3,871 | 15.5% |
| 25 to 29 Minutes | 1,880 | 7.5% |
| 30 to 34 Minutes | 3,262 | 13.1% |
| 35 to 39 Minutes | 970 | 3.9% |
| 40 to 44 Minutes | 971 | 3.9% |
| 45 to 59 Minutes | 1,876 | 7.5% |
| 60 to 89 Minutes | 806 | 3.2% |
| 90 or more Minutes | 327 | 1.3% |
Commute Time by Sex in Windsor County
The most common commute times in Windsor County are 15 to 19 minutes (1,960 commuters, 15.4%) for males and 20 to 24 minutes (2,012 commuters, 16.4%) for females.
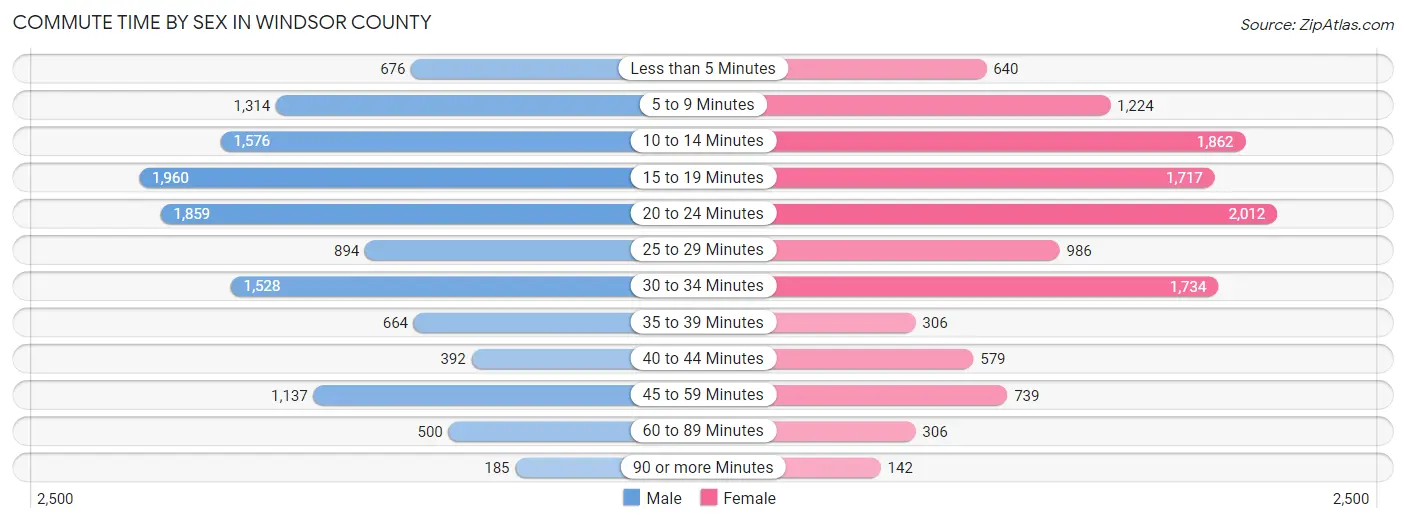
| Commute Time | Male | Female |
| Less than 5 Minutes | 676 (5.3%) | 640 (5.2%) |
| 5 to 9 Minutes | 1,314 (10.4%) | 1,224 (10.0%) |
| 10 to 14 Minutes | 1,576 (12.4%) | 1,862 (15.2%) |
| 15 to 19 Minutes | 1,960 (15.4%) | 1,717 (14.0%) |
| 20 to 24 Minutes | 1,859 (14.7%) | 2,012 (16.4%) |
| 25 to 29 Minutes | 894 (7.0%) | 986 (8.1%) |
| 30 to 34 Minutes | 1,528 (12.0%) | 1,734 (14.2%) |
| 35 to 39 Minutes | 664 (5.2%) | 306 (2.5%) |
| 40 to 44 Minutes | 392 (3.1%) | 579 (4.7%) |
| 45 to 59 Minutes | 1,137 (9.0%) | 739 (6.0%) |
| 60 to 89 Minutes | 500 (3.9%) | 306 (2.5%) |
| 90 or more Minutes | 185 (1.5%) | 142 (1.2%) |
Time of Departure to Work by Sex in Windsor County
The most frequent times of departure to work in Windsor County are 7:00 AM to 7:29 AM (1,960, 15.4%) for males and 7:00 AM to 7:29 AM (2,557, 20.9%) for females.
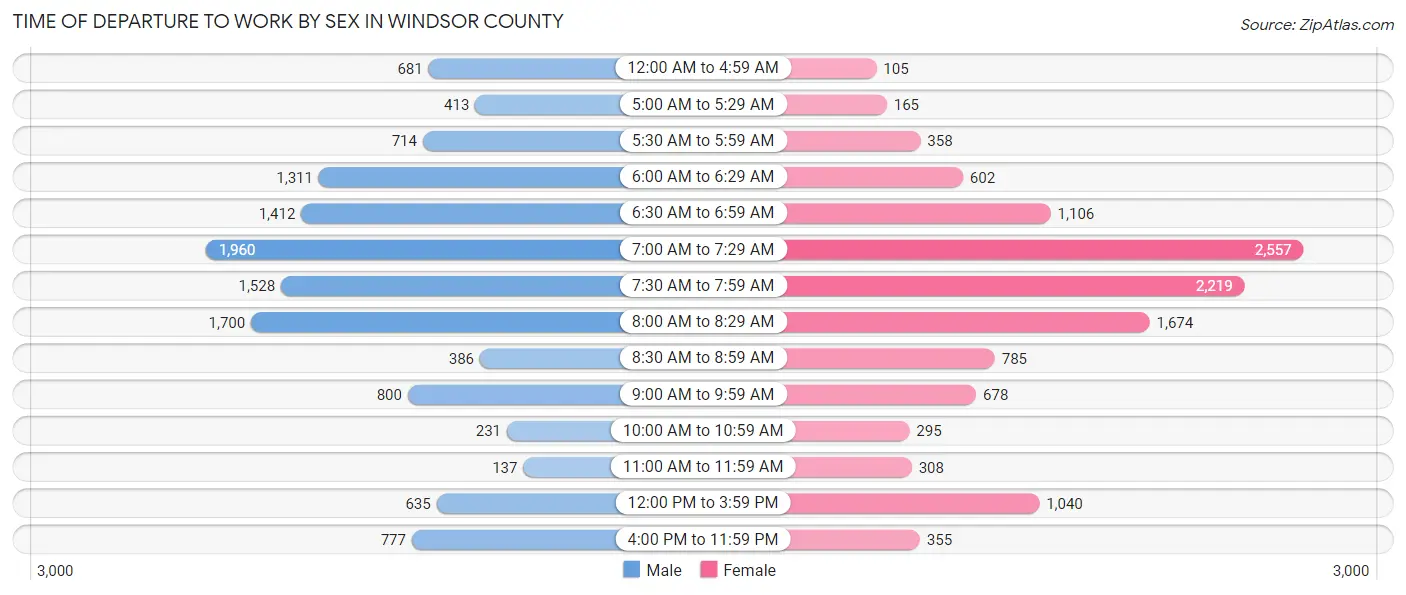
| Time of Departure | Male | Female |
| 12:00 AM to 4:59 AM | 681 (5.4%) | 105 (0.9%) |
| 5:00 AM to 5:29 AM | 413 (3.3%) | 165 (1.3%) |
| 5:30 AM to 5:59 AM | 714 (5.6%) | 358 (2.9%) |
| 6:00 AM to 6:29 AM | 1,311 (10.3%) | 602 (4.9%) |
| 6:30 AM to 6:59 AM | 1,412 (11.1%) | 1,106 (9.0%) |
| 7:00 AM to 7:29 AM | 1,960 (15.4%) | 2,557 (20.9%) |
| 7:30 AM to 7:59 AM | 1,528 (12.0%) | 2,219 (18.1%) |
| 8:00 AM to 8:29 AM | 1,700 (13.4%) | 1,674 (13.7%) |
| 8:30 AM to 8:59 AM | 386 (3.0%) | 785 (6.4%) |
| 9:00 AM to 9:59 AM | 800 (6.3%) | 678 (5.5%) |
| 10:00 AM to 10:59 AM | 231 (1.8%) | 295 (2.4%) |
| 11:00 AM to 11:59 AM | 137 (1.1%) | 308 (2.5%) |
| 12:00 PM to 3:59 PM | 635 (5.0%) | 1,040 (8.5%) |
| 4:00 PM to 11:59 PM | 777 (6.1%) | 355 (2.9%) |
| Total | 12,685 (100.0%) | 12,247 (100.0%) |
Housing Occupancy in Windsor County
Occupancy by Ownership in Windsor County
Of the total 24,536 dwellings in Windsor County, owner-occupied units account for 18,794 (76.6%), while renter-occupied units make up 5,742 (23.4%).
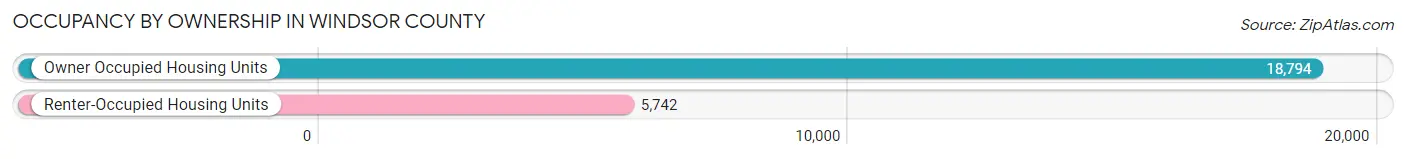
| Occupancy | # Housing Units | % Housing Units |
| Owner Occupied Housing Units | 18,794 | 76.6% |
| Renter-Occupied Housing Units | 5,742 | 23.4% |
| Total Occupied Housing Units | 24,536 | 100.0% |
Occupancy by Household Size in Windsor County
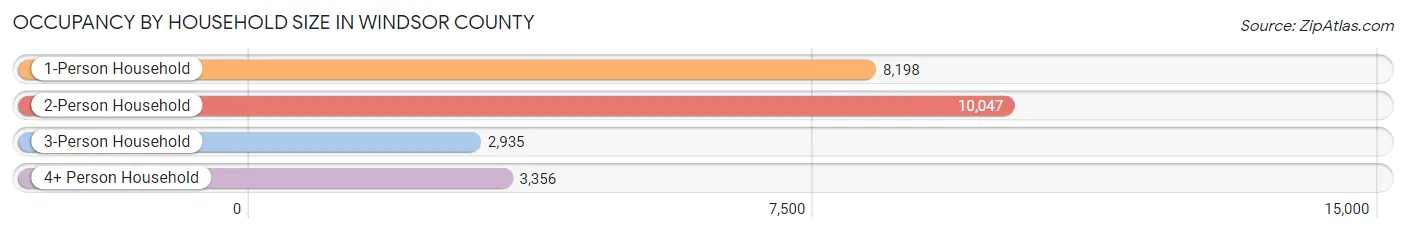
| Household Size | # Housing Units | % Housing Units |
| 1-Person Household | 8,198 | 33.4% |
| 2-Person Household | 10,047 | 40.9% |
| 3-Person Household | 2,935 | 12.0% |
| 4+ Person Household | 3,356 | 13.7% |
| Total Housing Units | 24,536 | 100.0% |
Occupancy by Ownership by Household Size in Windsor County
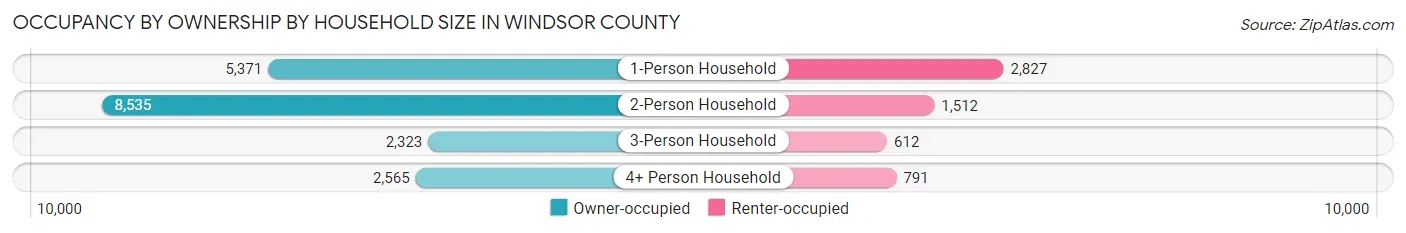
| Household Size | Owner-occupied | Renter-occupied |
| 1-Person Household | 5,371 (65.5%) | 2,827 (34.5%) |
| 2-Person Household | 8,535 (85.0%) | 1,512 (15.0%) |
| 3-Person Household | 2,323 (79.1%) | 612 (20.8%) |
| 4+ Person Household | 2,565 (76.4%) | 791 (23.6%) |
| Total Housing Units | 18,794 (76.6%) | 5,742 (23.4%) |
Occupancy by Educational Attainment in Windsor County
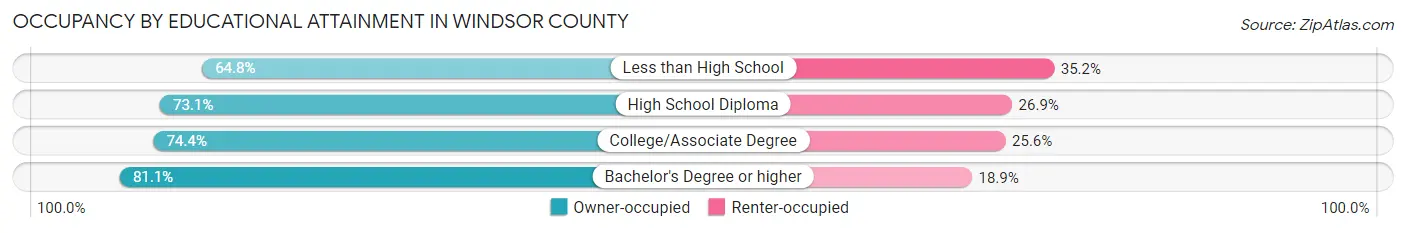
| Household Size | Owner-occupied | Renter-occupied |
| Less than High School | 651 (64.8%) | 354 (35.2%) |
| High School Diploma | 4,698 (73.1%) | 1,725 (26.9%) |
| College/Associate Degree | 4,784 (74.4%) | 1,643 (25.6%) |
| Bachelor's Degree or higher | 8,661 (81.1%) | 2,020 (18.9%) |
Occupancy by Age of Householder in Windsor County
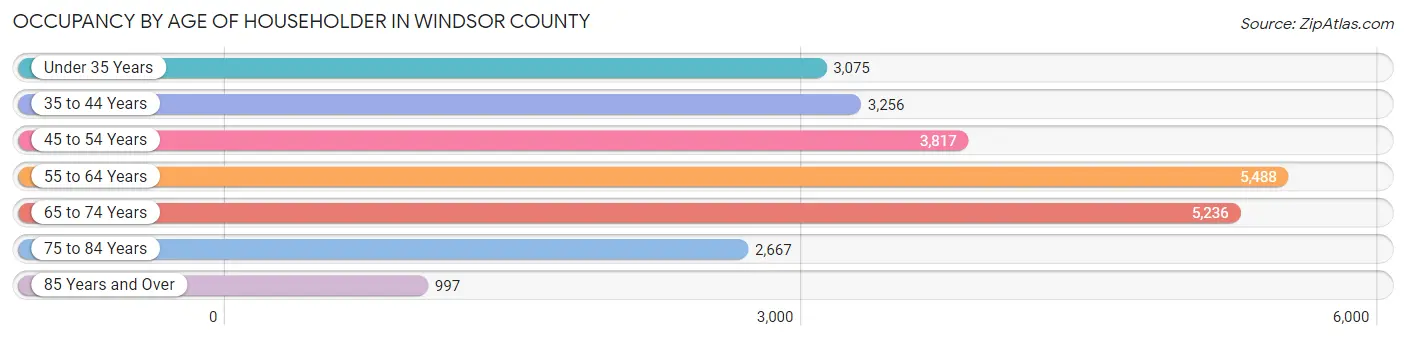
| Age Bracket | # Households | % Households |
| Under 35 Years | 3,075 | 12.5% |
| 35 to 44 Years | 3,256 | 13.3% |
| 45 to 54 Years | 3,817 | 15.6% |
| 55 to 64 Years | 5,488 | 22.4% |
| 65 to 74 Years | 5,236 | 21.3% |
| 75 to 84 Years | 2,667 | 10.9% |
| 85 Years and Over | 997 | 4.1% |
| Total | 24,536 | 100.0% |
Housing Finances in Windsor County
Median Income by Occupancy in Windsor County
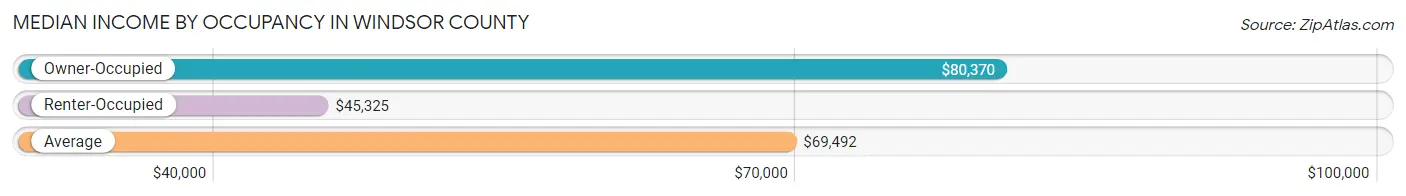
| Occupancy Type | # Households | Median Income |
| Owner-Occupied | 18,794 (76.6%) | $80,370 |
| Renter-Occupied | 5,742 (23.4%) | $45,325 |
| Average | 24,536 (100.0%) | $69,492 |
Occupancy by Householder Income Bracket in Windsor County
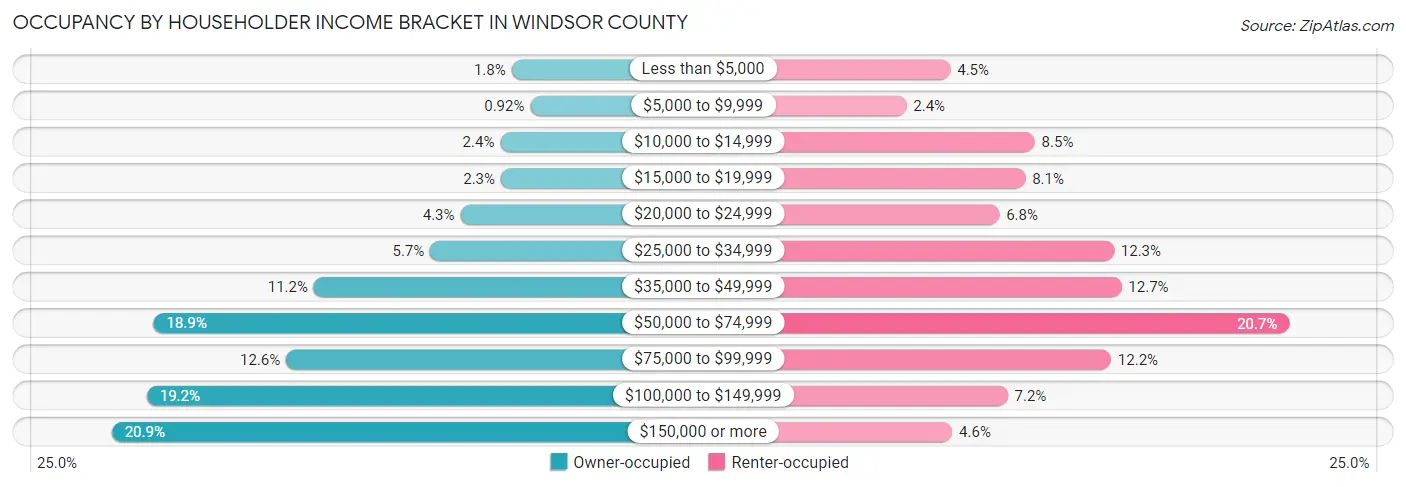
| Income Bracket | Owner-occupied | Renter-occupied |
| Less than $5,000 | 340 (1.8%) | 259 (4.5%) |
| $5,000 to $9,999 | 172 (0.9%) | 139 (2.4%) |
| $10,000 to $14,999 | 442 (2.4%) | 490 (8.5%) |
| $15,000 to $19,999 | 436 (2.3%) | 464 (8.1%) |
| $20,000 to $24,999 | 799 (4.3%) | 393 (6.8%) |
| $25,000 to $34,999 | 1,069 (5.7%) | 706 (12.3%) |
| $35,000 to $49,999 | 2,110 (11.2%) | 727 (12.7%) |
| $50,000 to $74,999 | 3,545 (18.9%) | 1,186 (20.6%) |
| $75,000 to $99,999 | 2,359 (12.6%) | 698 (12.2%) |
| $100,000 to $149,999 | 3,604 (19.2%) | 416 (7.2%) |
| $150,000 or more | 3,918 (20.8%) | 264 (4.6%) |
| Total | 18,794 (100.0%) | 5,742 (100.0%) |
Monthly Housing Cost Tiers in Windsor County
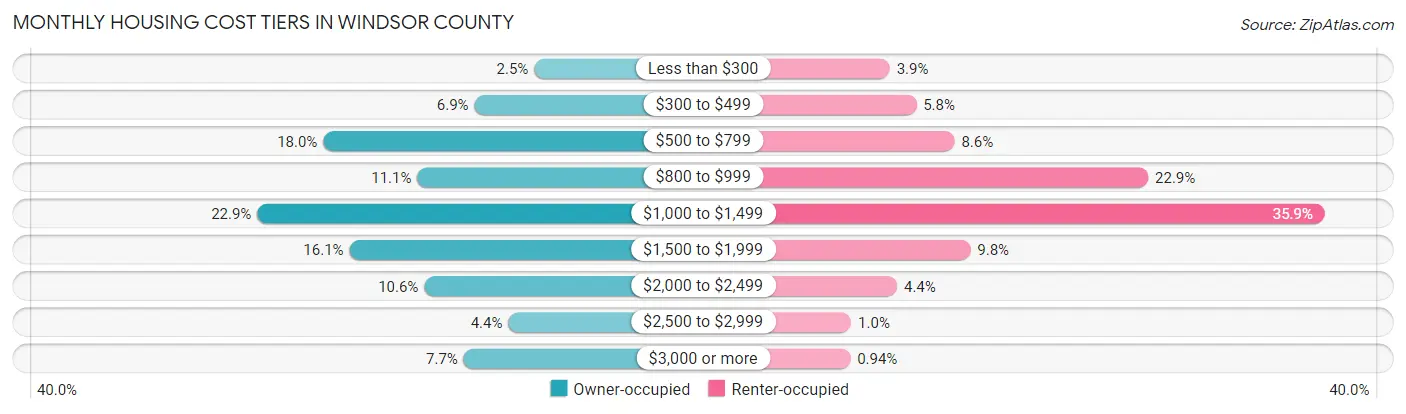
| Monthly Cost | Owner-occupied | Renter-occupied |
| Less than $300 | 465 (2.5%) | 221 (3.8%) |
| $300 to $499 | 1,291 (6.9%) | 333 (5.8%) |
| $500 to $799 | 3,384 (18.0%) | 495 (8.6%) |
| $800 to $999 | 2,083 (11.1%) | 1,314 (22.9%) |
| $1,000 to $1,499 | 4,299 (22.9%) | 2,061 (35.9%) |
| $1,500 to $1,999 | 3,023 (16.1%) | 562 (9.8%) |
| $2,000 to $2,499 | 1,986 (10.6%) | 252 (4.4%) |
| $2,500 to $2,999 | 824 (4.4%) | 58 (1.0%) |
| $3,000 or more | 1,439 (7.7%) | 54 (0.9%) |
| Total | 18,794 (100.0%) | 5,742 (100.0%) |
Physical Housing Characteristics in Windsor County
Housing Structures in Windsor County
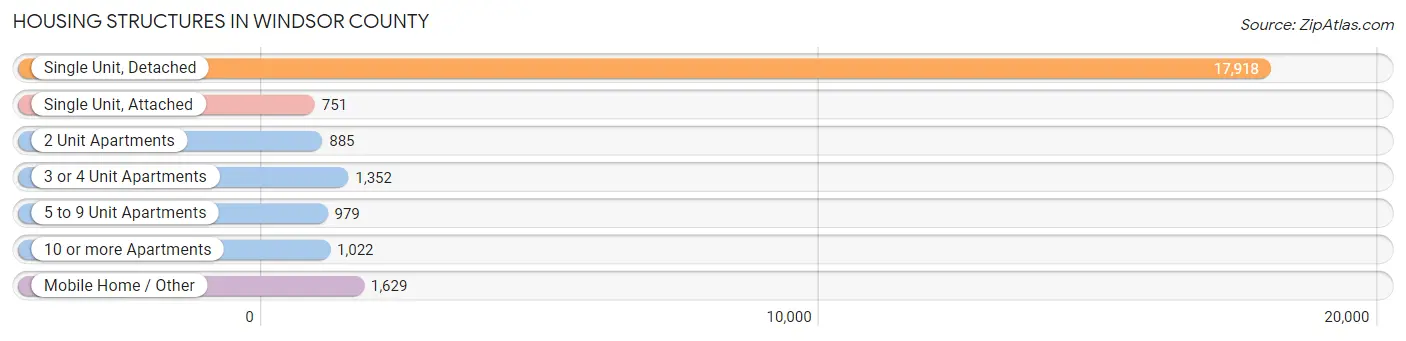
| Structure Type | # Housing Units | % Housing Units |
| Single Unit, Detached | 17,918 | 73.0% |
| Single Unit, Attached | 751 | 3.1% |
| 2 Unit Apartments | 885 | 3.6% |
| 3 or 4 Unit Apartments | 1,352 | 5.5% |
| 5 to 9 Unit Apartments | 979 | 4.0% |
| 10 or more Apartments | 1,022 | 4.2% |
| Mobile Home / Other | 1,629 | 6.6% |
| Total | 24,536 | 100.0% |
Housing Structures by Occupancy in Windsor County
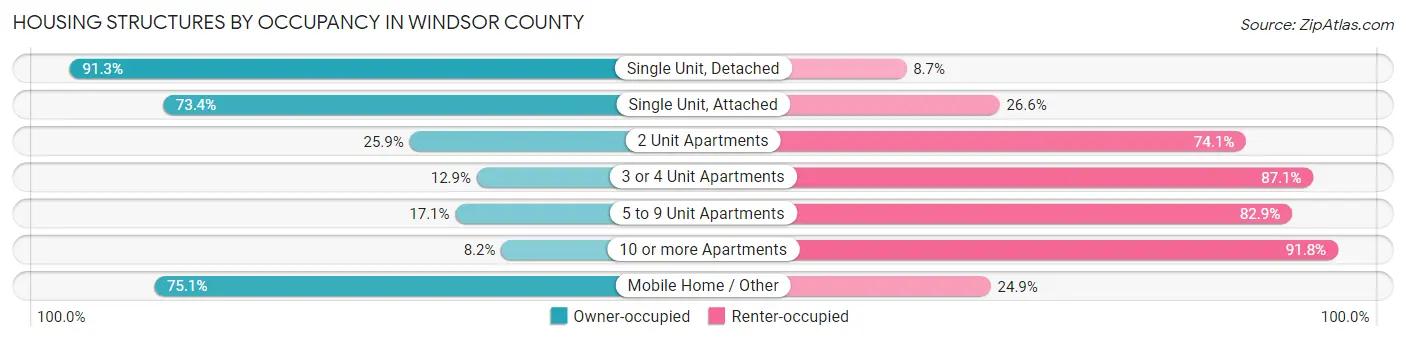
| Structure Type | Owner-occupied | Renter-occupied |
| Single Unit, Detached | 16,365 (91.3%) | 1,553 (8.7%) |
| Single Unit, Attached | 551 (73.4%) | 200 (26.6%) |
| 2 Unit Apartments | 229 (25.9%) | 656 (74.1%) |
| 3 or 4 Unit Apartments | 175 (12.9%) | 1,177 (87.1%) |
| 5 to 9 Unit Apartments | 167 (17.1%) | 812 (82.9%) |
| 10 or more Apartments | 84 (8.2%) | 938 (91.8%) |
| Mobile Home / Other | 1,223 (75.1%) | 406 (24.9%) |
| Total | 18,794 (76.6%) | 5,742 (23.4%) |
Housing Structures by Number of Rooms in Windsor County
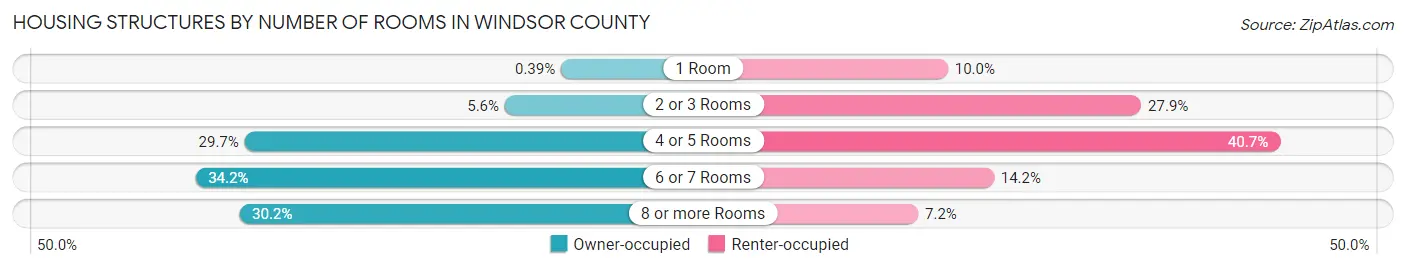
| Number of Rooms | Owner-occupied | Renter-occupied |
| 1 Room | 73 (0.4%) | 573 (10.0%) |
| 2 or 3 Rooms | 1,049 (5.6%) | 1,600 (27.9%) |
| 4 or 5 Rooms | 5,573 (29.6%) | 2,337 (40.7%) |
| 6 or 7 Rooms | 6,431 (34.2%) | 817 (14.2%) |
| 8 or more Rooms | 5,668 (30.2%) | 415 (7.2%) |
| Total | 18,794 (100.0%) | 5,742 (100.0%) |
Housing Structure by Heating Type in Windsor County
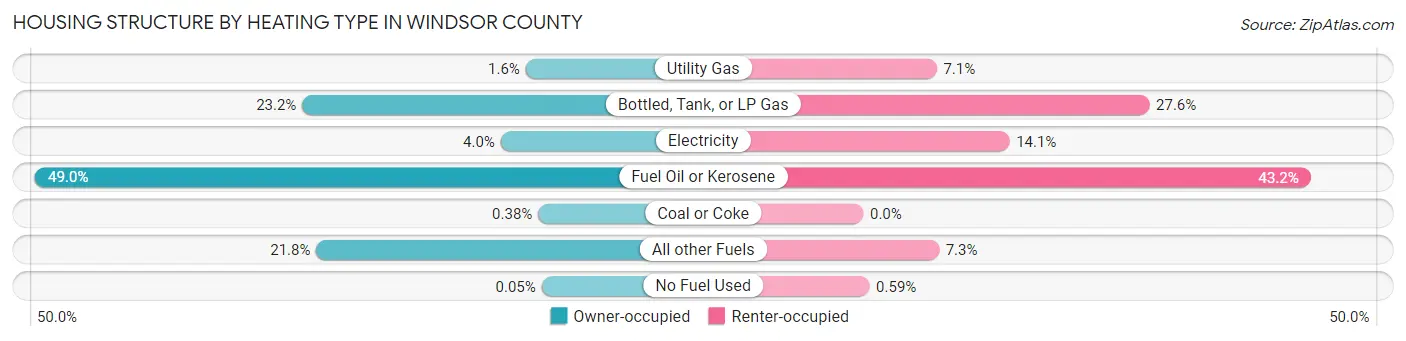
| Heating Type | Owner-occupied | Renter-occupied |
| Utility Gas | 298 (1.6%) | 407 (7.1%) |
| Bottled, Tank, or LP Gas | 4,356 (23.2%) | 1,587 (27.6%) |
| Electricity | 752 (4.0%) | 811 (14.1%) |
| Fuel Oil or Kerosene | 9,208 (49.0%) | 2,483 (43.2%) |
| Coal or Coke | 71 (0.4%) | 0 (0.0%) |
| All other Fuels | 4,100 (21.8%) | 420 (7.3%) |
| No Fuel Used | 9 (0.1%) | 34 (0.6%) |
| Total | 18,794 (100.0%) | 5,742 (100.0%) |
Household Vehicle Usage in Windsor County
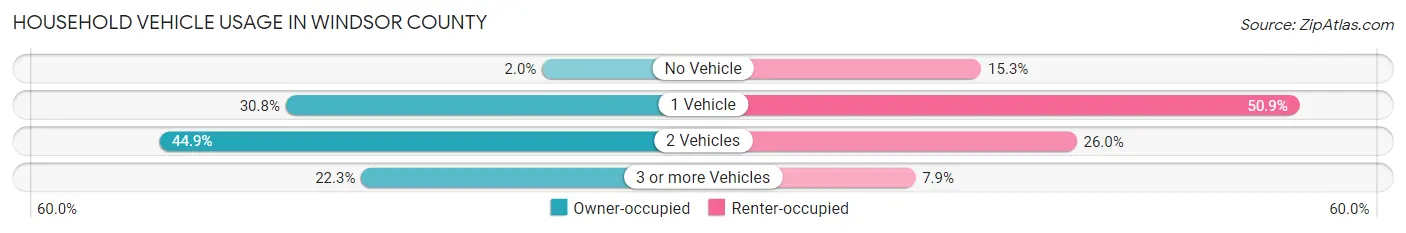
| Vehicles per Household | Owner-occupied | Renter-occupied |
| No Vehicle | 380 (2.0%) | 876 (15.3%) |
| 1 Vehicle | 5,780 (30.7%) | 2,924 (50.9%) |
| 2 Vehicles | 8,444 (44.9%) | 1,490 (26.0%) |
| 3 or more Vehicles | 4,190 (22.3%) | 452 (7.9%) |
| Total | 18,794 (100.0%) | 5,742 (100.0%) |
Real Estate & Mortgages in Windsor County
Real Estate and Mortgage Overview in Windsor County
| Characteristic | Without Mortgage | With Mortgage |
| Housing Units | 8,931 | 9,863 |
| Median Property Value | $235,800 | $264,300 |
| Median Household Income | $58,647 | $2,565 |
| Monthly Housing Costs | $777 | $1,353 |
| Real Estate Taxes | $4,788 | $20 |
Property Value by Mortgage Status in Windsor County
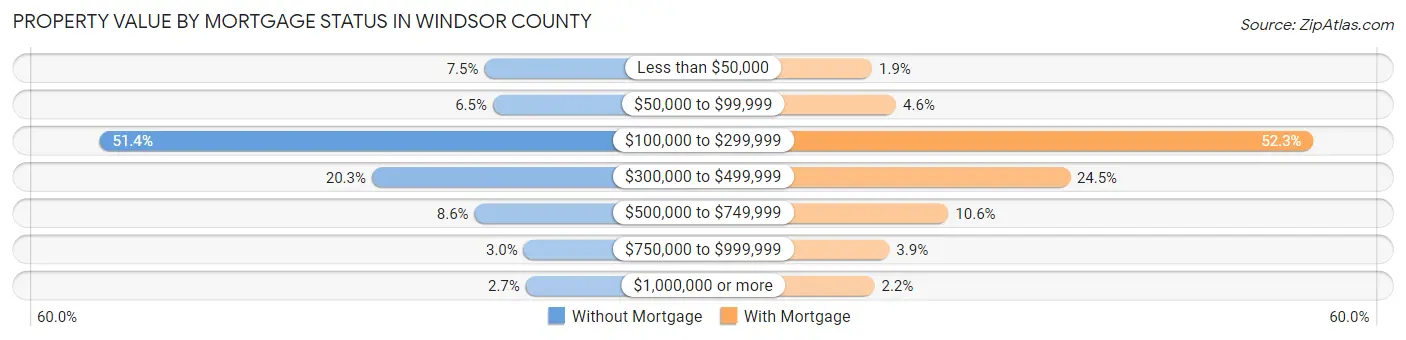
| Property Value | Without Mortgage | With Mortgage |
| Less than $50,000 | 666 (7.5%) | 186 (1.9%) |
| $50,000 to $99,999 | 580 (6.5%) | 458 (4.6%) |
| $100,000 to $299,999 | 4,593 (51.4%) | 5,161 (52.3%) |
| $300,000 to $499,999 | 1,815 (20.3%) | 2,416 (24.5%) |
| $500,000 to $749,999 | 767 (8.6%) | 1,046 (10.6%) |
| $750,000 to $999,999 | 265 (3.0%) | 382 (3.9%) |
| $1,000,000 or more | 245 (2.7%) | 214 (2.2%) |
| Total | 8,931 (100.0%) | 9,863 (100.0%) |
Household Income by Mortgage Status in Windsor County
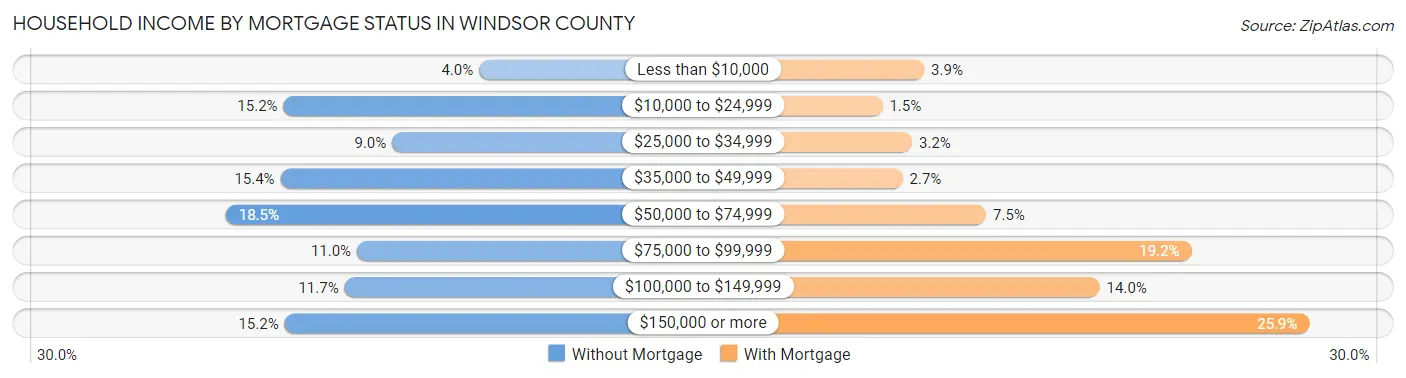
| Household Income | Without Mortgage | With Mortgage |
| Less than $10,000 | 360 (4.0%) | 387 (3.9%) |
| $10,000 to $24,999 | 1,358 (15.2%) | 152 (1.5%) |
| $25,000 to $34,999 | 804 (9.0%) | 319 (3.2%) |
| $35,000 to $49,999 | 1,374 (15.4%) | 265 (2.7%) |
| $50,000 to $74,999 | 1,652 (18.5%) | 736 (7.5%) |
| $75,000 to $99,999 | 983 (11.0%) | 1,893 (19.2%) |
| $100,000 to $149,999 | 1,047 (11.7%) | 1,376 (14.0%) |
| $150,000 or more | 1,353 (15.1%) | 2,557 (25.9%) |
| Total | 8,931 (100.0%) | 9,863 (100.0%) |
Property Value to Household Income Ratio in Windsor County
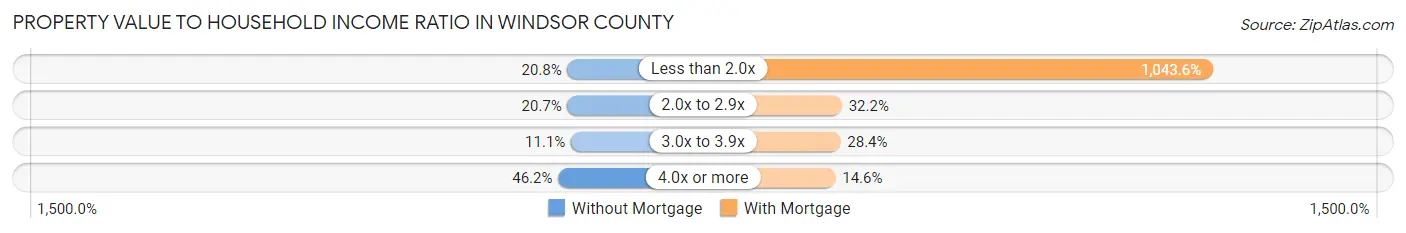
| Value-to-Income Ratio | Without Mortgage | With Mortgage |
| Less than 2.0x | 1,854 (20.8%) | 102,928 (1,043.6%) |
| 2.0x to 2.9x | 1,845 (20.7%) | 3,172 (32.2%) |
| 3.0x to 3.9x | 988 (11.1%) | 2,804 (28.4%) |
| 4.0x or more | 4,129 (46.2%) | 1,439 (14.6%) |
| Total | 8,931 (100.0%) | 9,863 (100.0%) |
Real Estate Taxes by Mortgage Status in Windsor County
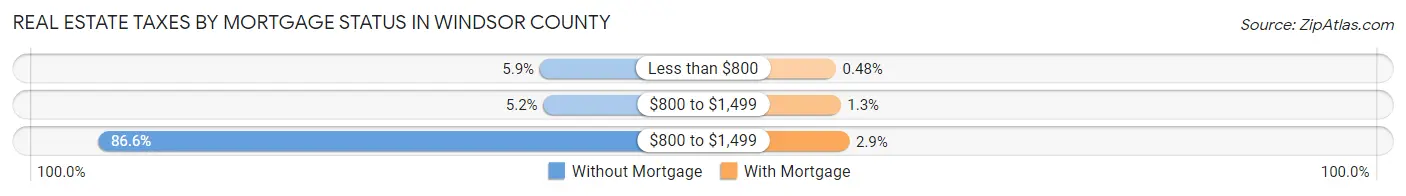
| Property Taxes | Without Mortgage | With Mortgage |
| Less than $800 | 525 (5.9%) | 47 (0.5%) |
| $800 to $1,499 | 468 (5.2%) | 131 (1.3%) |
| $800 to $1,499 | 7,734 (86.6%) | 288 (2.9%) |
| Total | 8,931 (100.0%) | 9,863 (100.0%) |
Health & Disability in Windsor County
Health Insurance Coverage by Age in Windsor County
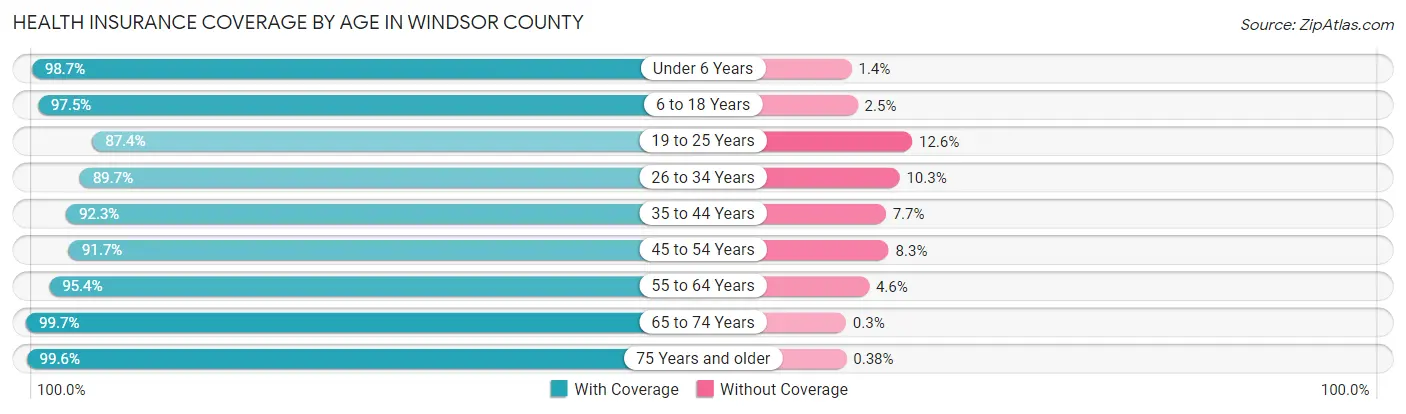
| Age Bracket | With Coverage | Without Coverage |
| Under 6 Years | 2,848 (98.7%) | 39 (1.3%) |
| 6 to 18 Years | 7,691 (97.5%) | 196 (2.5%) |
| 19 to 25 Years | 3,528 (87.4%) | 510 (12.6%) |
| 26 to 34 Years | 4,925 (89.7%) | 565 (10.3%) |
| 35 to 44 Years | 6,111 (92.3%) | 511 (7.7%) |
| 45 to 54 Years | 6,396 (91.7%) | 577 (8.3%) |
| 55 to 64 Years | 9,088 (95.4%) | 438 (4.6%) |
| 65 to 74 Years | 8,330 (99.7%) | 25 (0.3%) |
| 75 Years and older | 5,287 (99.6%) | 20 (0.4%) |
| Total | 54,204 (95.0%) | 2,881 (5.1%) |
Health Insurance Coverage by Citizenship Status in Windsor County
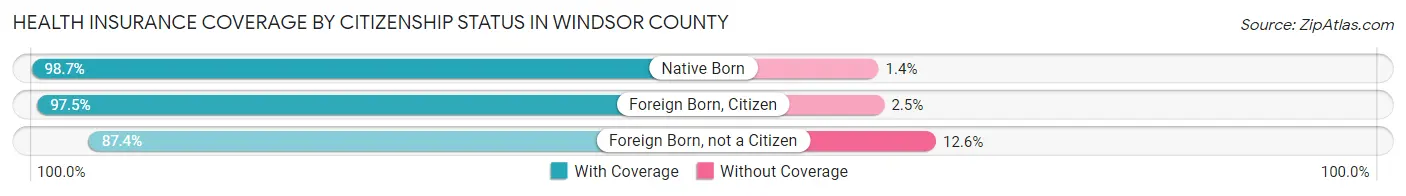
| Citizenship Status | With Coverage | Without Coverage |
| Native Born | 2,848 (98.7%) | 39 (1.3%) |
| Foreign Born, Citizen | 7,691 (97.5%) | 196 (2.5%) |
| Foreign Born, not a Citizen | 3,528 (87.4%) | 510 (12.6%) |
Health Insurance Coverage by Household Income in Windsor County
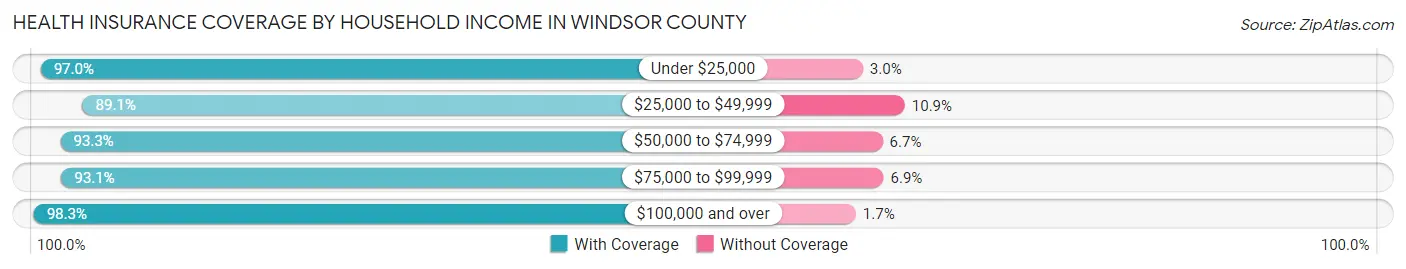
| Household Income | With Coverage | Without Coverage |
| Under $25,000 | 5,114 (97.0%) | 159 (3.0%) |
| $25,000 to $49,999 | 8,139 (89.1%) | 994 (10.9%) |
| $50,000 to $74,999 | 10,042 (93.3%) | 724 (6.7%) |
| $75,000 to $99,999 | 7,296 (93.1%) | 541 (6.9%) |
| $100,000 and over | 23,494 (98.3%) | 408 (1.7%) |
Public vs Private Health Insurance Coverage by Age in Windsor County
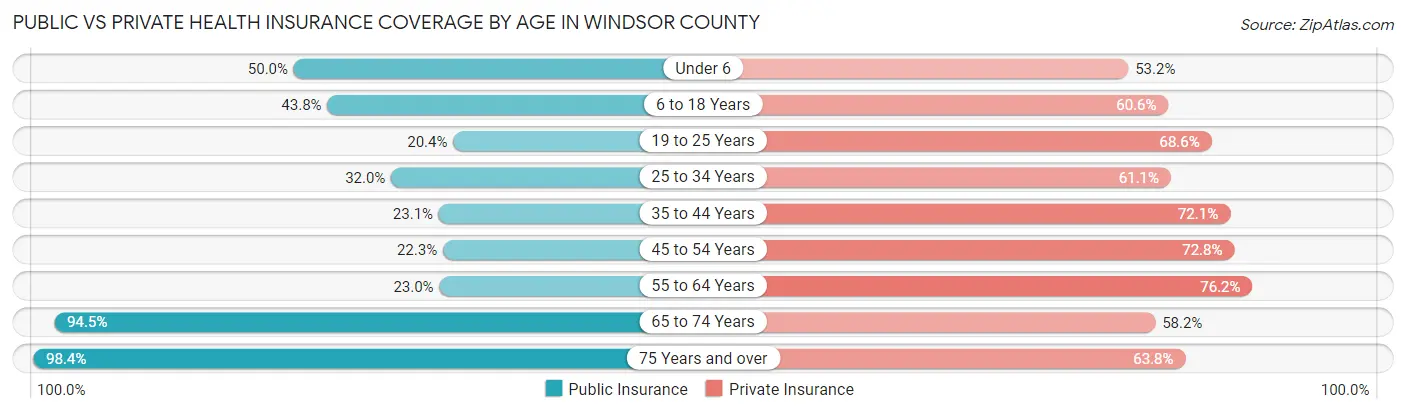
| Age Bracket | Public Insurance | Private Insurance |
| Under 6 | 1,444 (50.0%) | 1,535 (53.2%) |
| 6 to 18 Years | 3,454 (43.8%) | 4,780 (60.6%) |
| 19 to 25 Years | 825 (20.4%) | 2,771 (68.6%) |
| 25 to 34 Years | 1,754 (32.0%) | 3,353 (61.1%) |
| 35 to 44 Years | 1,530 (23.1%) | 4,771 (72.1%) |
| 45 to 54 Years | 1,558 (22.3%) | 5,079 (72.8%) |
| 55 to 64 Years | 2,191 (23.0%) | 7,259 (76.2%) |
| 65 to 74 Years | 7,899 (94.5%) | 4,860 (58.2%) |
| 75 Years and over | 5,223 (98.4%) | 3,384 (63.8%) |
| Total | 25,878 (45.3%) | 37,792 (66.2%) |
Disability Status by Sex by Age in Windsor County
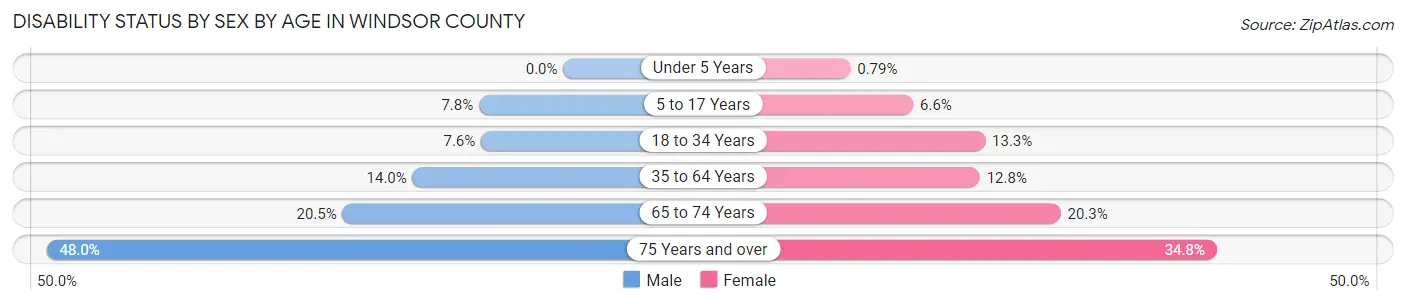
| Age Bracket | Male | Female |
| Under 5 Years | 0 (0.0%) | 9 (0.8%) |
| 5 to 17 Years | 313 (7.8%) | 256 (6.6%) |
| 18 to 34 Years | 393 (7.6%) | 648 (13.3%) |
| 35 to 64 Years | 1,557 (14.0%) | 1,534 (12.8%) |
| 65 to 74 Years | 830 (20.5%) | 874 (20.3%) |
| 75 Years and over | 1,159 (48.0%) | 1,006 (34.8%) |
Disability Class by Sex by Age in Windsor County
Disability Class: Hearing Difficulty
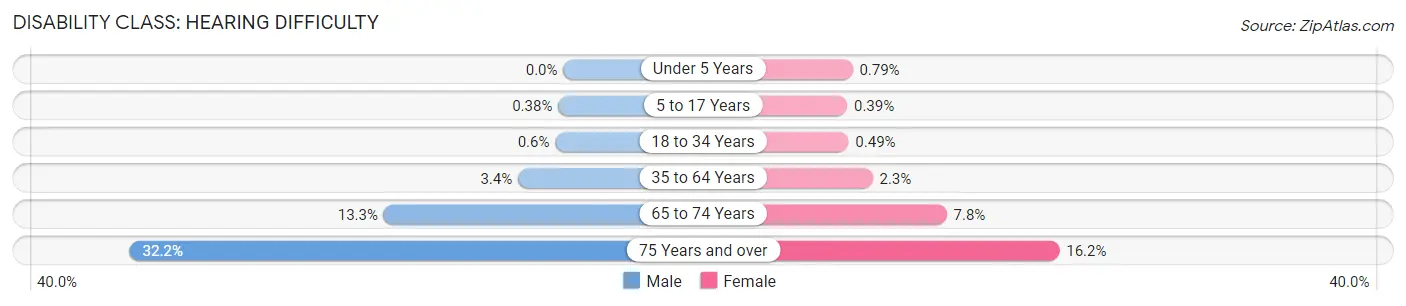
| Age Bracket | Male | Female |
| Under 5 Years | 0 (0.0%) | 9 (0.8%) |
| 5 to 17 Years | 15 (0.4%) | 15 (0.4%) |
| 18 to 34 Years | 31 (0.6%) | 24 (0.5%) |
| 35 to 64 Years | 374 (3.4%) | 273 (2.3%) |
| 65 to 74 Years | 540 (13.3%) | 335 (7.8%) |
| 75 Years and over | 778 (32.2%) | 467 (16.2%) |
Disability Class: Vision Difficulty
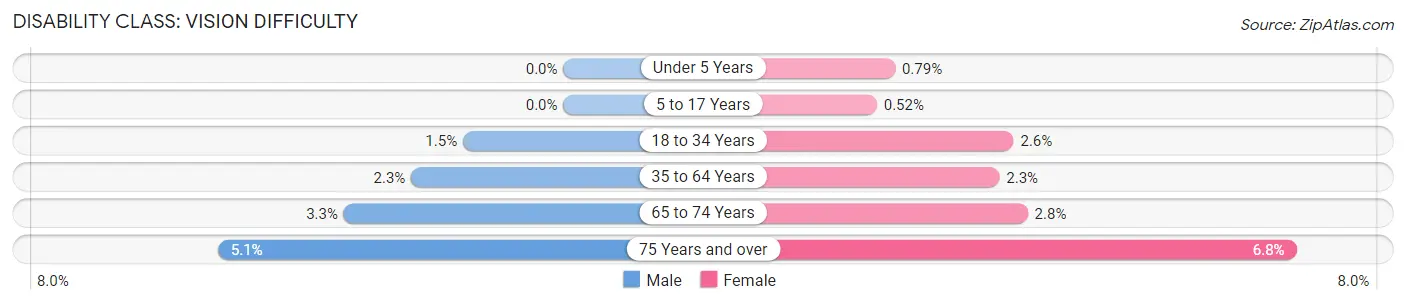
| Age Bracket | Male | Female |
| Under 5 Years | 0 (0.0%) | 9 (0.8%) |
| 5 to 17 Years | 0 (0.0%) | 20 (0.5%) |
| 18 to 34 Years | 77 (1.5%) | 124 (2.5%) |
| 35 to 64 Years | 252 (2.3%) | 281 (2.3%) |
| 65 to 74 Years | 132 (3.3%) | 119 (2.8%) |
| 75 Years and over | 124 (5.1%) | 195 (6.8%) |
Disability Class: Cognitive Difficulty
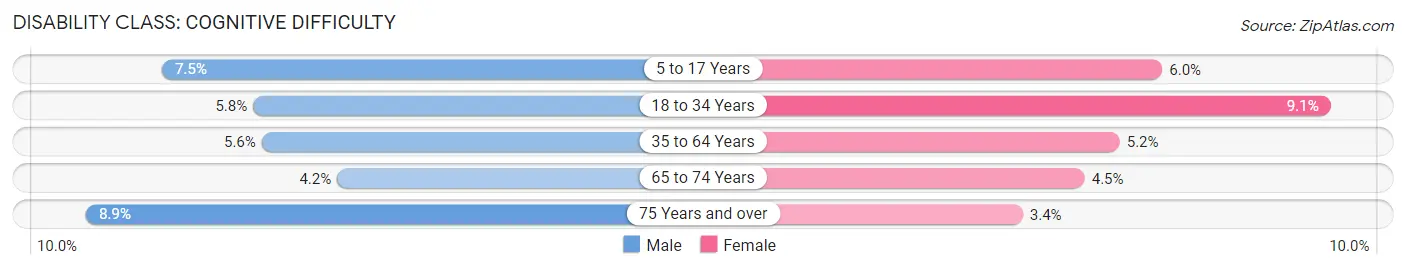
| Age Bracket | Male | Female |
| 5 to 17 Years | 298 (7.4%) | 230 (5.9%) |
| 18 to 34 Years | 297 (5.8%) | 442 (9.1%) |
| 35 to 64 Years | 623 (5.6%) | 618 (5.2%) |
| 65 to 74 Years | 170 (4.2%) | 194 (4.5%) |
| 75 Years and over | 214 (8.9%) | 97 (3.4%) |
Disability Class: Ambulatory Difficulty
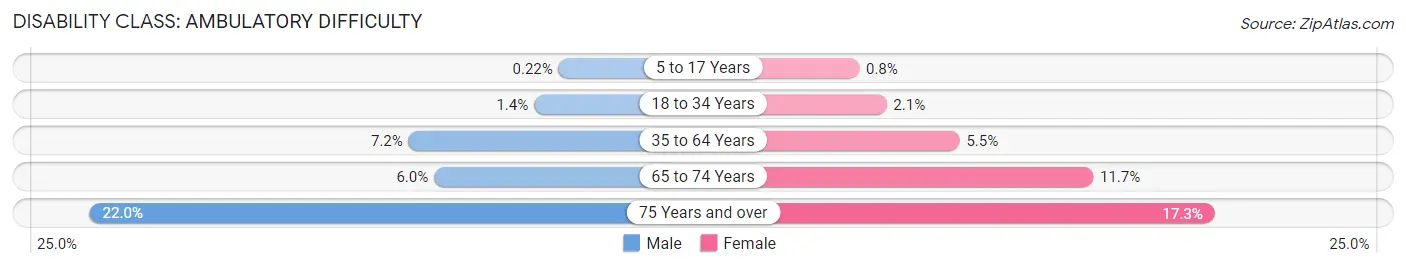
| Age Bracket | Male | Female |
| 5 to 17 Years | 9 (0.2%) | 31 (0.8%) |
| 18 to 34 Years | 70 (1.4%) | 101 (2.1%) |
| 35 to 64 Years | 799 (7.2%) | 655 (5.5%) |
| 65 to 74 Years | 243 (6.0%) | 502 (11.7%) |
| 75 Years and over | 531 (22.0%) | 500 (17.3%) |
Disability Class: Self-Care Difficulty
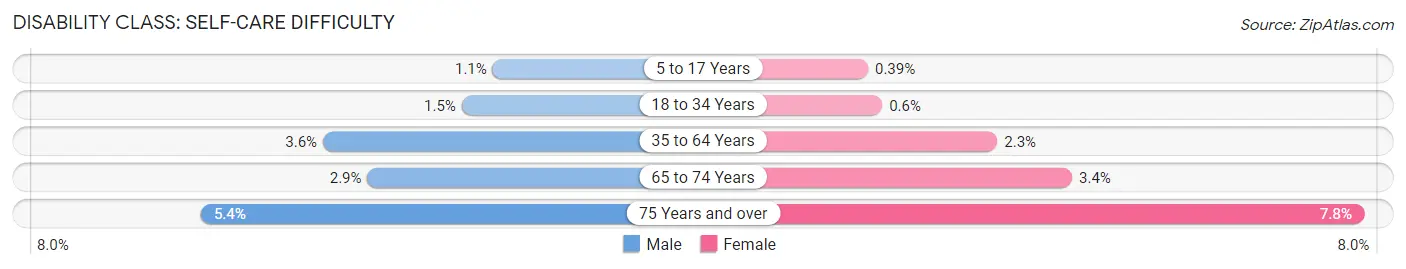
| Age Bracket | Male | Female |
| 5 to 17 Years | 42 (1.1%) | 15 (0.4%) |
| 18 to 34 Years | 78 (1.5%) | 29 (0.6%) |
| 35 to 64 Years | 397 (3.6%) | 277 (2.3%) |
| 65 to 74 Years | 118 (2.9%) | 147 (3.4%) |
| 75 Years and over | 130 (5.4%) | 224 (7.7%) |
Technology Access in Windsor County
Computing Device Access in Windsor County
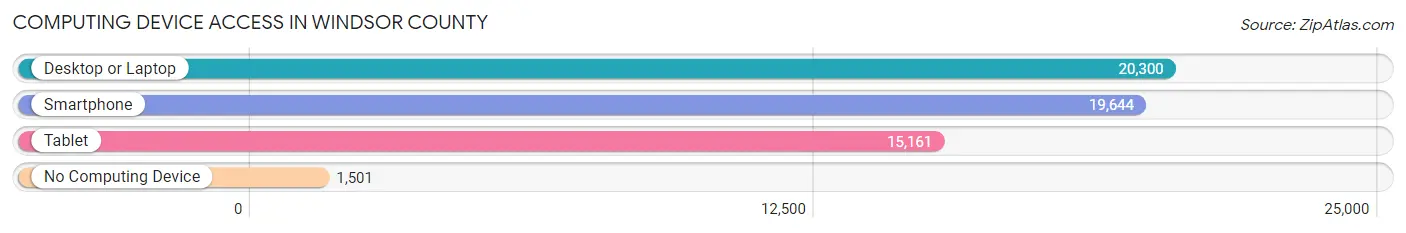
| Device Type | # Households | % Households |
| Desktop or Laptop | 20,300 | 82.7% |
| Smartphone | 19,644 | 80.1% |
| Tablet | 15,161 | 61.8% |
| No Computing Device | 1,501 | 6.1% |
| Total | 24,536 | 100.0% |
Internet Access in Windsor County
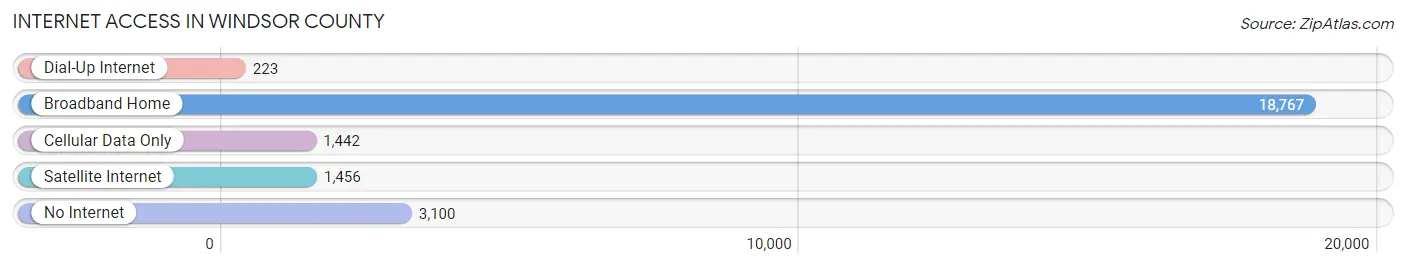
| Internet Type | # Households | % Households |
| Dial-Up Internet | 223 | 0.9% |
| Broadband Home | 18,767 | 76.5% |
| Cellular Data Only | 1,442 | 5.9% |
| Satellite Internet | 1,456 | 5.9% |
| No Internet | 3,100 | 12.6% |
| Total | 24,536 | 100.0% |
Windsor County Summary
Windsor County is located in the state of Vermont in the United States. It is the second largest county in the state, covering an area of 1,692 square miles. The county is bordered by the states of New Hampshire and Massachusetts to the east, and the counties of Rutland, Addison, and Orange to the south, west, and north, respectively. As of the 2010 census, the population of Windsor County was 56,670.
Geography
Windsor County is located in the southeastern corner of Vermont, and is part of the Connecticut River Valley. The county is divided into two distinct regions: the Connecticut River Valley and the Green Mountains. The Connecticut River Valley is a flat, low-lying area that is home to the majority of the county’s population. The Green Mountains are a rugged, mountainous region that is home to the highest point in the county, Mount Ascutney, which stands at 3,144 feet. The county is also home to several rivers, including the Connecticut, White, and Ottauquechee Rivers.
Economy
Windsor County’s economy is largely based on agriculture and tourism. The county is home to several dairy farms, as well as a number of apple orchards. Tourism is also an important part of the county’s economy, with many visitors coming to the area to enjoy the natural beauty of the Green Mountains and the Connecticut River Valley. The county is also home to several ski resorts, including Killington and Okemo.
Demographics
As of the 2010 census, the population of Windsor County was 56,670. The population is largely white (94.3%), with small percentages of African Americans (1.2%), Asians (1.2%), and Native Americans (0.4%). The median household income in the county is $50,945, and the median age is 42.7 years.
History
Windsor County was established in 1781, and was named after Windsor, England. The county was originally part of the state of New York, but was ceded to Vermont in 1777. The county was home to several Native American tribes, including the Abenaki, Mohawk, and Pennacook. The county was also home to several Revolutionary War battles, including the Battle of Hubbardton and the Battle of Bennington. The county was also home to several prominent figures in American history, including Ethan Allen and Robert Frost.
Common Questions
What is the Total Population of Windsor County?
Total Population of Windsor County is 57,832.
What is the Total Male Population of Windsor County?
Total Male Population of Windsor County is 28,520.
What is the Total Female Population of Windsor County?
Total Female Population of Windsor County is 29,312.
What is the Ratio of Males per 100 Females in Windsor County?
There are 97.30 Males per 100 Females in Windsor County.
What is the Ratio of Females per 100 Males in Windsor County?
There are 102.78 Females per 100 Males in Windsor County.
What is the Median Population Age in Windsor County?
Median Population Age in Windsor County is 47.8 Years.
What is the Average Family Size in Windsor County
Average Family Size in Windsor County is 3.0 People.
What is the Average Household Size in Windsor County
Average Household Size in Windsor County is 2.3 People.
What is Per Capita Income in Windsor County?
Per Capita income in Windsor County is $43,180.
What is the Median Family Income in Windsor County?
Median Family Income in Windsor County is $94,699.
What is the Median Household income in Windsor County?
Median Household Income in Windsor County is $69,492.
What is Income or Wage Gap in Windsor County?
Income or Wage Gap in Windsor County is 15.2%.
Women in Windsor County earn 84.8 cents for every dollar earned by a man.
What is Family Income Deficit in Windsor County?
Family Income Deficit in Windsor County is $9,906.
Families that are below poverty line in Windsor County earn $9,906 less on average than the poverty threshold level.
What is Inequality or Gini Index in Windsor County?
Inequality or Gini Index in Windsor County is 0.47.
How Large is the Labor Force in Windsor County?
There are 30,343 People in the Labor Forcein in Windsor County.
What is the Percentage of People in the Labor Force in Windsor County?
62.2% of People are in the Labor Force in Windsor County.
What is the Unemployment Rate in Windsor County?
Unemployment Rate in Windsor County is 3.7%.