Windham County, VT
Windham County Overview
45,857
TOTAL POPULATION
22,648
MALE POPULATION
23,209
FEMALE POPULATION
97.58
MALES / 100 FEMALES
102.48
FEMALES / 100 MALES
47.0
MEDIAN AGE
3.0
AVG FAMILY SIZE
2.3
AVG HOUSEHOLD SIZE
$40,284
PER CAPITA INCOME
$86,291
AVG FAMILY INCOME
$65,473
AVG HOUSEHOLD INCOME
11.2%
WAGE / INCOME GAP [ % ]
88.8¢/ $1
WAGE / INCOME GAP [ $ ]
$9,423
FAMILY INCOME DEFICIT
0.47
INEQUALITY / GINI INDEX
24,576
LABOR FORCE [ PEOPLE ]
62.8%
PERCENT IN LABOR FORCE
4.4%
UNEMPLOYMENT RATE
Windham County Area Codes
Race in Windham County
The most populous races in Windham County are White / Caucasian (42,455 | 92.6%), Two or more Races (2,030 | 4.4%), and Hispanic or Latino (1,177 | 2.6%).
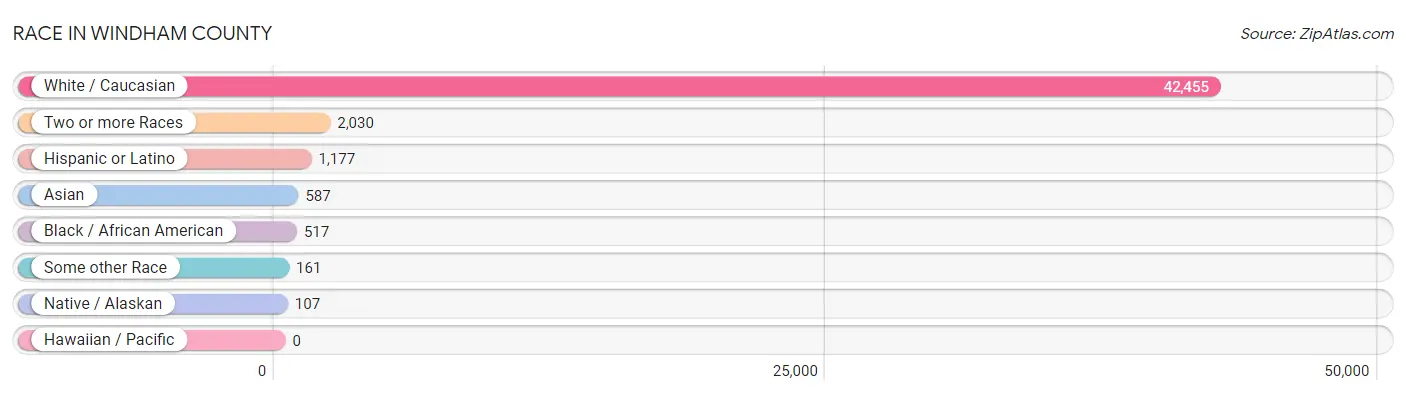
| Race | # Population | % Population |
| Asian | 587 | 1.3% |
| Black / African American | 517 | 1.1% |
| Hawaiian / Pacific | 0 | 0.0% |
| Hispanic or Latino | 1,177 | 2.6% |
| Native / Alaskan | 107 | 0.2% |
| White / Caucasian | 42,455 | 92.6% |
| Two or more Races | 2,030 | 4.4% |
| Some other Race | 161 | 0.4% |
| Total | 45,857 | 100.0% |
Ancestry in Windham County
The most populous ancestries reported in Windham County are English (8,218 | 17.9%), Irish (7,661 | 16.7%), German (4,773 | 10.4%), French (3,462 | 7.5%), and Italian (3,355 | 7.3%), together accounting for 59.9% of all Windham County residents.
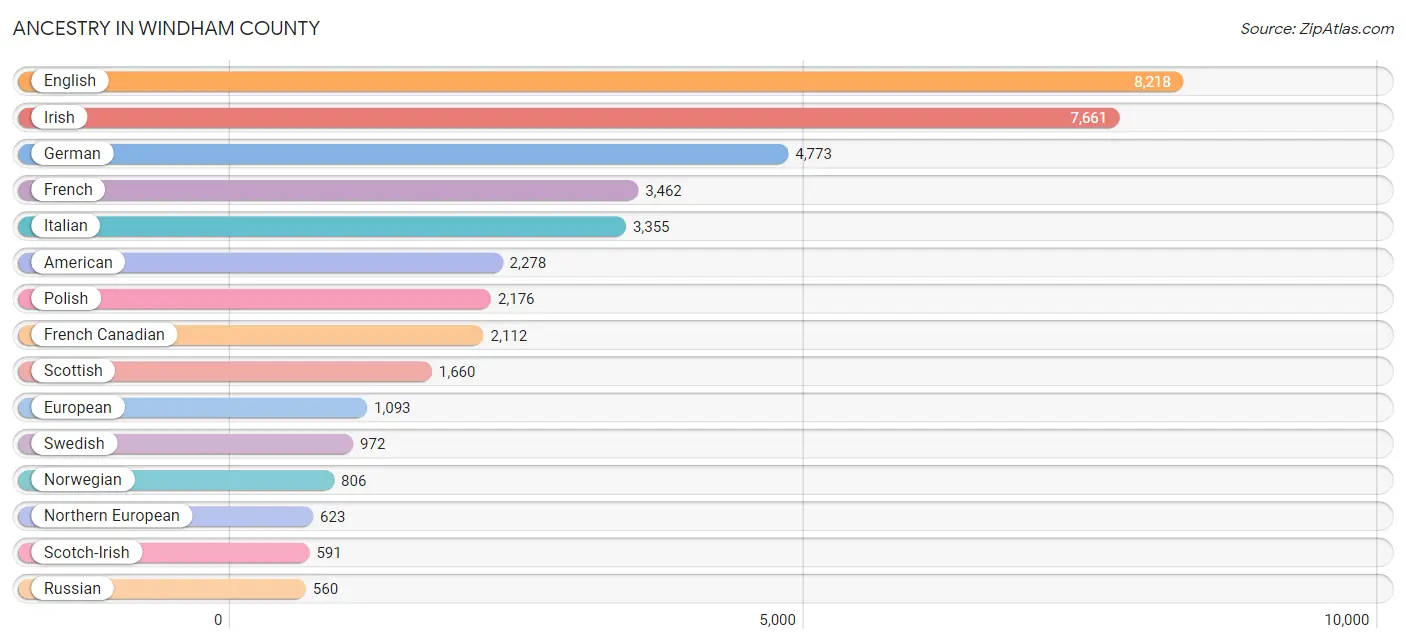
| Ancestry | # Population | % Population |
| African | 6 | 0.0% |
| Albanian | 12 | 0.0% |
| American | 2,278 | 5.0% |
| Arab | 120 | 0.3% |
| Argentinean | 3 | 0.0% |
| Armenian | 93 | 0.2% |
| Austrian | 170 | 0.4% |
| Belgian | 57 | 0.1% |
| Bhutanese | 89 | 0.2% |
| Blackfeet | 76 | 0.2% |
| Bolivian | 70 | 0.2% |
| Brazilian | 6 | 0.0% |
| British | 527 | 1.1% |
| Burmese | 190 | 0.4% |
| Canadian | 187 | 0.4% |
| Cape Verdean | 24 | 0.1% |
| Celtic | 50 | 0.1% |
| Central American | 111 | 0.2% |
| Central American Indian | 16 | 0.0% |
| Cherokee | 72 | 0.2% |
| Chilean | 3 | 0.0% |
| Chippewa | 11 | 0.0% |
| Colombian | 15 | 0.0% |
| Costa Rican | 3 | 0.0% |
| Cree | 14 | 0.0% |
| Croatian | 2 | 0.0% |
| Cuban | 42 | 0.1% |
| Czech | 222 | 0.5% |
| Czechoslovakian | 20 | 0.0% |
| Danish | 129 | 0.3% |
| Dominican | 30 | 0.1% |
| Dutch | 474 | 1.0% |
| Eastern European | 494 | 1.1% |
| Ecuadorian | 6 | 0.0% |
| English | 8,218 | 17.9% |
| Estonian | 2 | 0.0% |
| Ethiopian | 2 | 0.0% |
| European | 1,093 | 2.4% |
| Filipino | 3 | 0.0% |
| Finnish | 165 | 0.4% |
| French | 3,462 | 7.5% |
| French American Indian | 15 | 0.0% |
| French Canadian | 2,112 | 4.6% |
| German | 4,773 | 10.4% |
| Greek | 165 | 0.4% |
| Guatemalan | 16 | 0.0% |
| Haitian | 24 | 0.1% |
| Hungarian | 213 | 0.5% |
| Icelander | 4 | 0.0% |
| Indian (Asian) | 224 | 0.5% |
| Indonesian | 22 | 0.1% |
| Iranian | 1 | 0.0% |
| Irish | 7,661 | 16.7% |
| Iroquois | 14 | 0.0% |
| Israeli | 37 | 0.1% |
| Italian | 3,355 | 7.3% |
| Jamaican | 161 | 0.4% |
| Jordanian | 29 | 0.1% |
| Korean | 111 | 0.2% |
| Latvian | 11 | 0.0% |
| Lebanese | 79 | 0.2% |
| Lithuanian | 245 | 0.5% |
| Luxembourger | 4 | 0.0% |
| Mexican | 185 | 0.4% |
| Native Hawaiian | 18 | 0.0% |
| Nicaraguan | 82 | 0.2% |
| Nigerian | 25 | 0.1% |
| Northern European | 623 | 1.4% |
| Norwegian | 806 | 1.8% |
| Pakistani | 31 | 0.1% |
| Polish | 2,176 | 4.8% |
| Portuguese | 464 | 1.0% |
| Puerto Rican | 439 | 1.0% |
| Romanian | 139 | 0.3% |
| Russian | 560 | 1.2% |
| Salvadoran | 10 | 0.0% |
| Samoan | 31 | 0.1% |
| Scandinavian | 108 | 0.2% |
| Scotch-Irish | 591 | 1.3% |
| Scottish | 1,660 | 3.6% |
| Serbian | 3 | 0.0% |
| Sioux | 84 | 0.2% |
| Slavic | 32 | 0.1% |
| Slovak | 106 | 0.2% |
| Somali | 12 | 0.0% |
| South American | 129 | 0.3% |
| Spaniard | 128 | 0.3% |
| Spanish | 50 | 0.1% |
| Sri Lankan | 56 | 0.1% |
| Subsaharan African | 89 | 0.2% |
| Swedish | 972 | 2.1% |
| Swiss | 161 | 0.4% |
| Syrian | 12 | 0.0% |
| Thai | 17 | 0.0% |
| Turkish | 16 | 0.0% |
| Ukrainian | 307 | 0.7% |
| Venezuelan | 32 | 0.1% |
| Vietnamese | 2 | 0.0% |
| Welsh | 428 | 0.9% |
| Yugoslavian | 15 | 0.0% | View All 100 Rows |
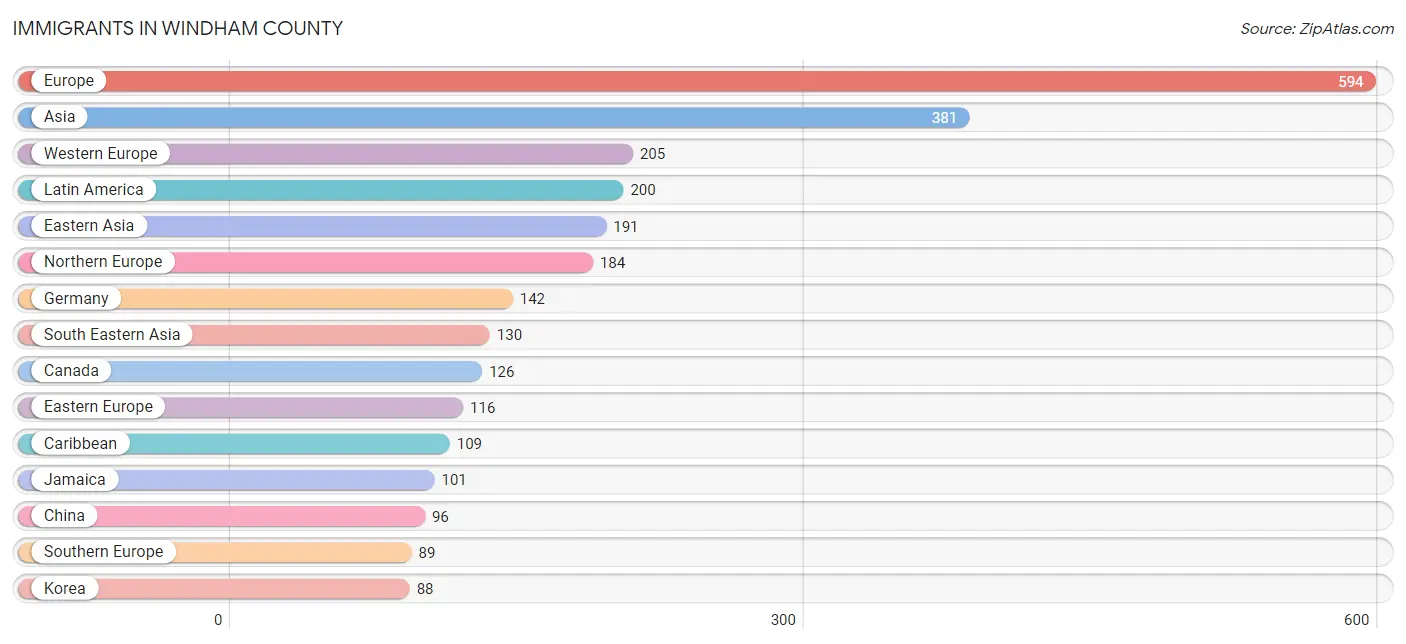
Immigrants in Windham County
The most numerous immigrant groups reported in Windham County came from Europe (594 | 1.3%), Asia (381 | 0.8%), Western Europe (205 | 0.4%), Latin America (200 | 0.4%), and Eastern Asia (191 | 0.4%), together accounting for 3.4% of all Windham County residents.
| Immigration Origin | # Population | % Population |
| Afghanistan | 1 | 0.0% |
| Africa | 52 | 0.1% |
| Asia | 381 | 0.8% |
| Australia | 40 | 0.1% |
| Austria | 22 | 0.1% |
| Belarus | 5 | 0.0% |
| Belgium | 28 | 0.1% |
| Bolivia | 8 | 0.0% |
| Brazil | 7 | 0.0% |
| Canada | 126 | 0.3% |
| Caribbean | 109 | 0.2% |
| Central America | 41 | 0.1% |
| Chile | 3 | 0.0% |
| China | 96 | 0.2% |
| Costa Rica | 3 | 0.0% |
| Cuba | 5 | 0.0% |
| Czechoslovakia | 9 | 0.0% |
| Eastern Africa | 40 | 0.1% |
| Eastern Asia | 191 | 0.4% |
| Eastern Europe | 116 | 0.3% |
| Egypt | 3 | 0.0% |
| England | 64 | 0.1% |
| Ethiopia | 2 | 0.0% |
| Europe | 594 | 1.3% |
| France | 9 | 0.0% |
| Germany | 142 | 0.3% |
| Greece | 5 | 0.0% |
| Guatemala | 16 | 0.0% |
| Hong Kong | 14 | 0.0% |
| India | 6 | 0.0% |
| Indonesia | 25 | 0.1% |
| Ireland | 12 | 0.0% |
| Israel | 30 | 0.1% |
| Italy | 53 | 0.1% |
| Jamaica | 101 | 0.2% |
| Japan | 7 | 0.0% |
| Jordan | 21 | 0.1% |
| Kenya | 12 | 0.0% |
| Korea | 88 | 0.2% |
| Laos | 10 | 0.0% |
| Latin America | 200 | 0.4% |
| Malaysia | 4 | 0.0% |
| Mexico | 22 | 0.1% |
| Middle Africa | 3 | 0.0% |
| Moldova | 12 | 0.0% |
| Morocco | 6 | 0.0% |
| Netherlands | 2 | 0.0% |
| Northern Africa | 9 | 0.0% |
| Northern Europe | 184 | 0.4% |
| Oceania | 52 | 0.1% |
| Pakistan | 2 | 0.0% |
| Philippines | 48 | 0.1% |
| Poland | 54 | 0.1% |
| Portugal | 17 | 0.0% |
| Romania | 22 | 0.1% |
| Russia | 14 | 0.0% |
| Scotland | 2 | 0.0% |
| South America | 50 | 0.1% |
| South Central Asia | 9 | 0.0% |
| South Eastern Asia | 130 | 0.3% |
| Southern Europe | 89 | 0.2% |
| Spain | 7 | 0.0% |
| Sweden | 25 | 0.1% |
| Switzerland | 2 | 0.0% |
| Taiwan | 18 | 0.0% |
| Thailand | 6 | 0.0% |
| Venezuela | 32 | 0.1% |
| Vietnam | 27 | 0.1% |
| Western Asia | 51 | 0.1% |
| Western Europe | 205 | 0.4% |
| Zimbabwe | 9 | 0.0% | View All 71 Rows |
Sex and Age in Windham County
Sex and Age in Windham County
The most populous age groups in Windham County are 60 to 64 Years (2,004 | 8.8%) for men and 55 to 59 Years (2,010 | 8.7%) for women.
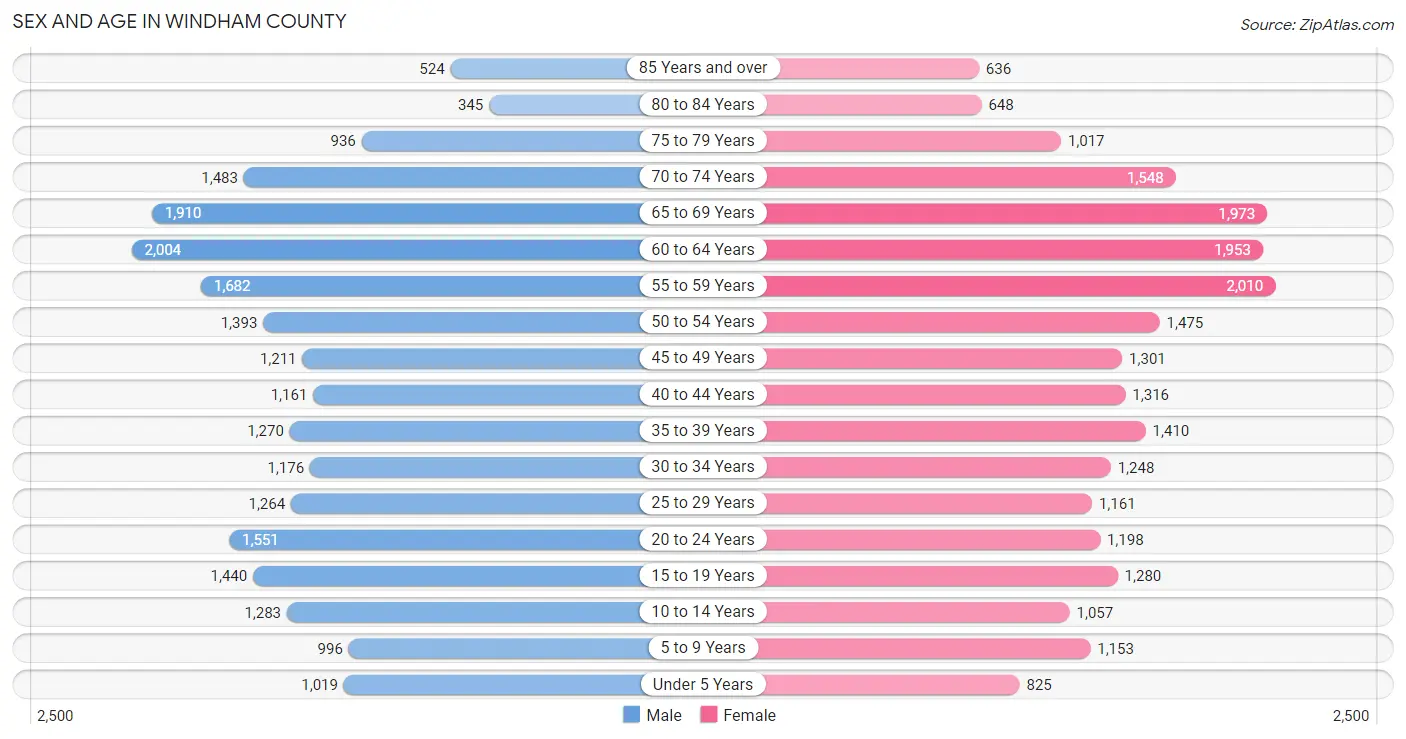
| Age Bracket | Male | Female |
| Under 5 Years | 1,019 (4.5%) | 825 (3.5%) |
| 5 to 9 Years | 996 (4.4%) | 1,153 (5.0%) |
| 10 to 14 Years | 1,283 (5.7%) | 1,057 (4.5%) |
| 15 to 19 Years | 1,440 (6.4%) | 1,280 (5.5%) |
| 20 to 24 Years | 1,551 (6.9%) | 1,198 (5.2%) |
| 25 to 29 Years | 1,264 (5.6%) | 1,161 (5.0%) |
| 30 to 34 Years | 1,176 (5.2%) | 1,248 (5.4%) |
| 35 to 39 Years | 1,270 (5.6%) | 1,410 (6.1%) |
| 40 to 44 Years | 1,161 (5.1%) | 1,316 (5.7%) |
| 45 to 49 Years | 1,211 (5.3%) | 1,301 (5.6%) |
| 50 to 54 Years | 1,393 (6.1%) | 1,475 (6.4%) |
| 55 to 59 Years | 1,682 (7.4%) | 2,010 (8.7%) |
| 60 to 64 Years | 2,004 (8.8%) | 1,953 (8.4%) |
| 65 to 69 Years | 1,910 (8.4%) | 1,973 (8.5%) |
| 70 to 74 Years | 1,483 (6.6%) | 1,548 (6.7%) |
| 75 to 79 Years | 936 (4.1%) | 1,017 (4.4%) |
| 80 to 84 Years | 345 (1.5%) | 648 (2.8%) |
| 85 Years and over | 524 (2.3%) | 636 (2.7%) |
| Total | 22,648 (100.0%) | 23,209 (100.0%) |
Families and Households in Windham County
Median Family Size in Windham County
The median family size in Windham County is 2.95 persons per family, with single male/father families (713 | 6.8%) accounting for the largest median family size of 3.12 persons per family. On the other hand, married-couple families (7,787 | 74.3%) represent the smallest median family size with 2.90 persons per family.
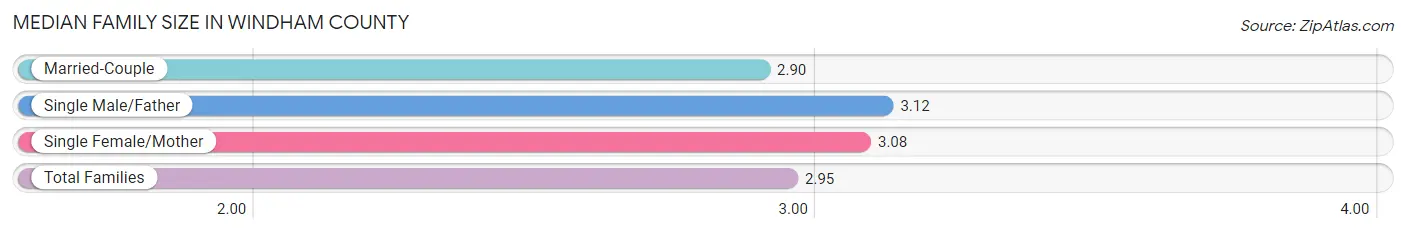
| Family Type | # Families | Family Size |
| Married-Couple | 7,787 (74.3%) | 2.90 |
| Single Male/Father | 713 (6.8%) | 3.12 |
| Single Female/Mother | 1,985 (18.9%) | 3.08 |
| Total Families | 10,485 (100.0%) | 2.95 |
Median Household Size in Windham County
The median household size in Windham County is 2.27 persons per household, with single male/father households (713 | 3.7%) accounting for the largest median household size of 3.48 persons per household. non-family households (8,897 | 45.9%) represent the smallest median household size with 1.32 persons per household.
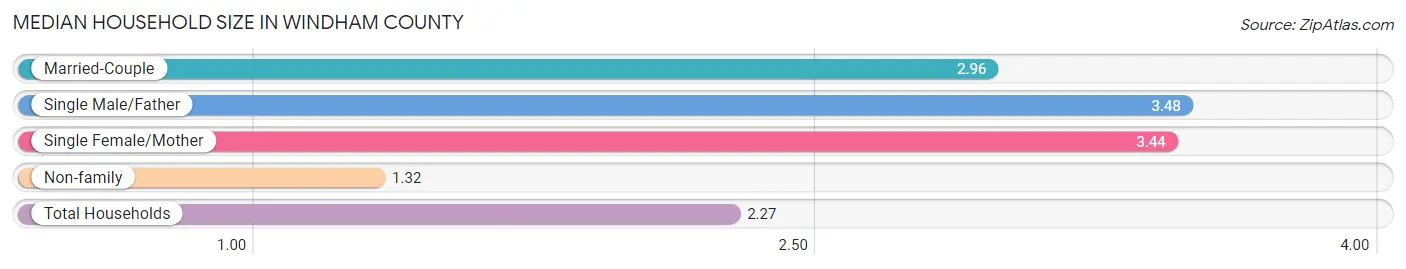
| Household Type | # Households | Household Size |
| Married-Couple | 7,787 (40.2%) | 2.96 |
| Single Male/Father | 713 (3.7%) | 3.48 |
| Single Female/Mother | 1,985 (10.2%) | 3.44 |
| Non-family | 8,897 (45.9%) | 1.32 |
| Total Households | 19,382 (100.0%) | 2.27 |
Household Size by Marriage Status in Windham County
Out of a total of 19,382 households in Windham County, 10,485 (54.1%) are family households, while 8,897 (45.9%) are nonfamily households. The most numerous type of family households are 2-person households, comprising 6,057, and the most common type of nonfamily households are 1-person households, comprising 7,056.
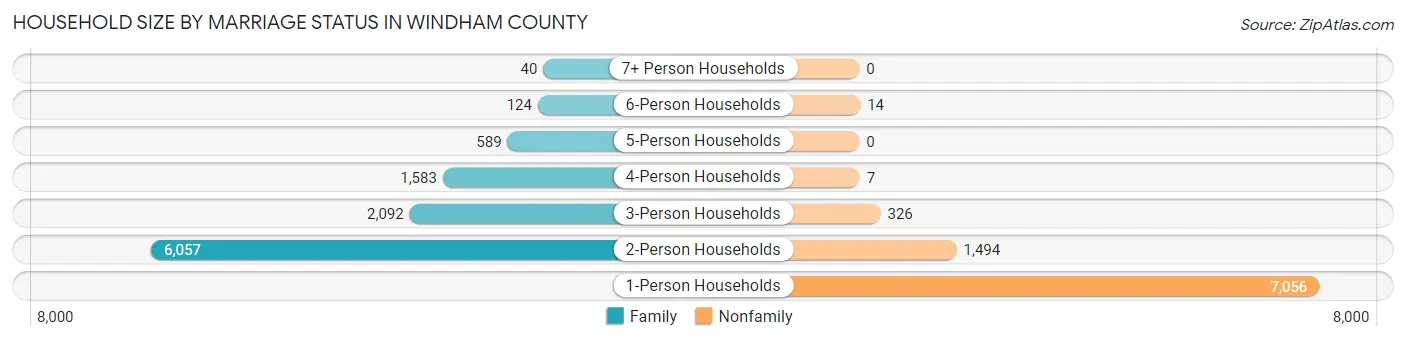
| Household Size | Family Households | Nonfamily Households |
| 1-Person Households | - | 7,056 (36.4%) |
| 2-Person Households | 6,057 (31.2%) | 1,494 (7.7%) |
| 3-Person Households | 2,092 (10.8%) | 326 (1.7%) |
| 4-Person Households | 1,583 (8.2%) | 7 (0.0%) |
| 5-Person Households | 589 (3.0%) | 0 (0.0%) |
| 6-Person Households | 124 (0.6%) | 14 (0.1%) |
| 7+ Person Households | 40 (0.2%) | 0 (0.0%) |
| Total | 10,485 (54.1%) | 8,897 (45.9%) |
Female Fertility in Windham County
Fertility by Age in Windham County
Average fertility rate in Windham County is 50.0 births per 1,000 women. Women in the age bracket of 20 to 34 years have the highest fertility rate with 84.0 births per 1,000 women. Women in the age bracket of 20 to 34 years acount for 65.7% of all women with births.
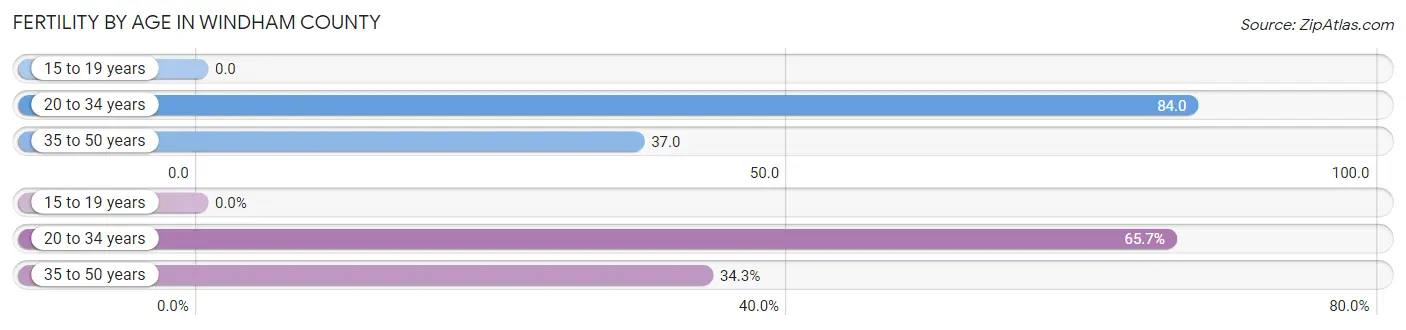
| Age Bracket | Women with Births | Births / 1,000 Women |
| 15 to 19 years | 0 (0.0%) | 0.0 |
| 20 to 34 years | 303 (65.7%) | 84.0 |
| 35 to 50 years | 158 (34.3%) | 37.0 |
| Total | 461 (100.0%) | 50.0 |
Fertility by Age by Marriage Status in Windham County
71.8% of women with births (461) in Windham County are married. The highest percentage of unmarried women with births falls into 20 to 34 years age bracket with 40.3% of them unmarried at the time of birth, while the lowest percentage of unmarried women with births belong to 35 to 50 years age bracket with 5.1% of them unmarried.
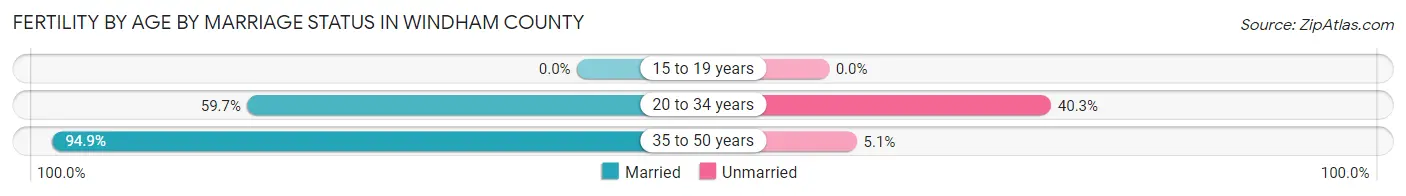
| Age Bracket | Married | Unmarried |
| 15 to 19 years | 0 (0.0%) | 0 (0.0%) |
| 20 to 34 years | 181 (59.7%) | 122 (40.3%) |
| 35 to 50 years | 150 (94.9%) | 8 (5.1%) |
| Total | 331 (71.8%) | 130 (28.2%) |
Fertility by Education in Windham County
Average fertility rate in Windham County is 50.0 births per 1,000 women. Women with the education attainment of high school diploma have the highest fertility rate of 86.0 births per 1,000 women, while women with the education attainment of less than high school have the lowest fertility at 31.0 births per 1,000 women. Women with the education attainment of high school diploma represent 42.3% of all women with births.
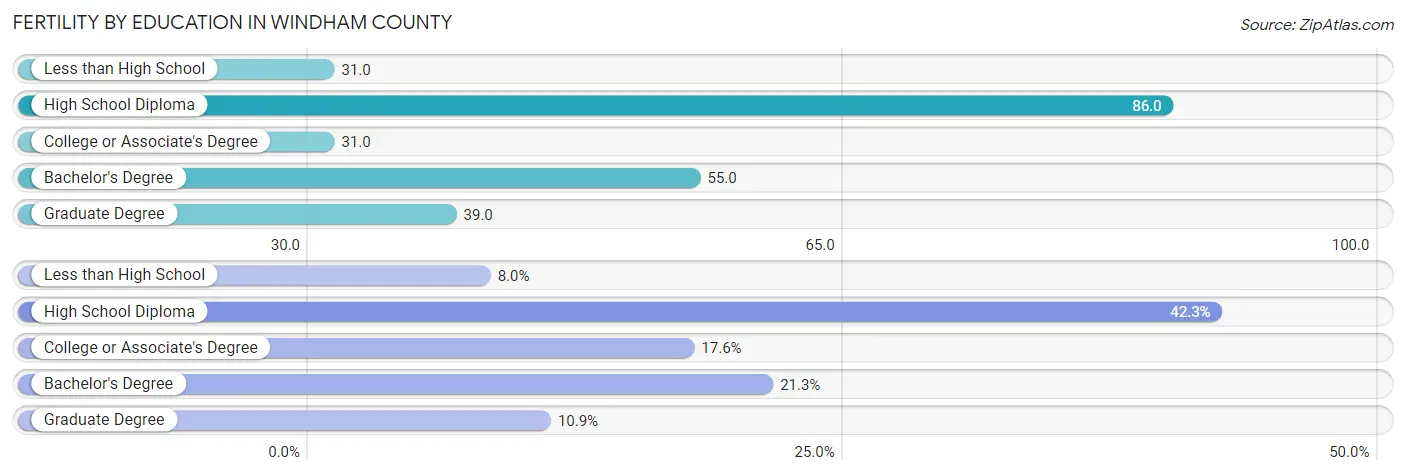
| Educational Attainment | Women with Births | Births / 1,000 Women |
| Less than High School | 37 (8.0%) | 31.0 |
| High School Diploma | 195 (42.3%) | 86.0 |
| College or Associate's Degree | 81 (17.6%) | 31.0 |
| Bachelor's Degree | 98 (21.3%) | 55.0 |
| Graduate Degree | 50 (10.8%) | 39.0 |
| Total | 461 (100.0%) | 50.0 |
Fertility by Education by Marriage Status in Windham County
28.2% of women with births in Windham County are unmarried. Women with the educational attainment of bachelor's degree are most likely to be married with 100.0% of them married at childbirth, while women with the educational attainment of high school diploma are least likely to be married with 61.5% of them unmarried at childbirth.
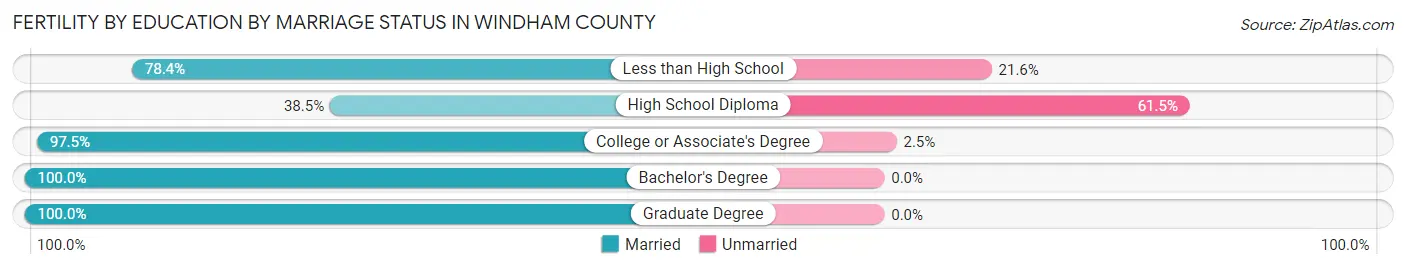
| Educational Attainment | Married | Unmarried |
| Less than High School | 29 (78.4%) | 8 (21.6%) |
| High School Diploma | 75 (38.5%) | 120 (61.5%) |
| College or Associate's Degree | 79 (97.5%) | 2 (2.5%) |
| Bachelor's Degree | 98 (100.0%) | 0 (0.0%) |
| Graduate Degree | 50 (100.0%) | 0 (0.0%) |
| Total | 331 (71.8%) | 130 (28.2%) |
Income in Windham County
Income Overview in Windham County
Per Capita Income in Windham County is $40,284, while median incomes of families and households are $86,291 and $65,473 respectively.
| Characteristic | Number | Measure |
| Per Capita Income | 45,857 | $40,284 |
| Median Family Income | 10,485 | $86,291 |
| Mean Family Income | 10,485 | $108,021 |
| Median Household Income | 19,382 | $65,473 |
| Mean Household Income | 19,382 | $90,021 |
| Income Deficit | 10,485 | $9,423 |
| Wage / Income Gap (%) | 45,857 | 11.22% |
| Wage / Income Gap ($) | 45,857 | 88.78¢ per $1 |
| Gini / Inequality Index | 45,857 | 0.47 |
Earnings by Sex in Windham County
Average Earnings in Windham County are $35,092, $37,348 for men and $33,157 for women, a difference of 11.2%.
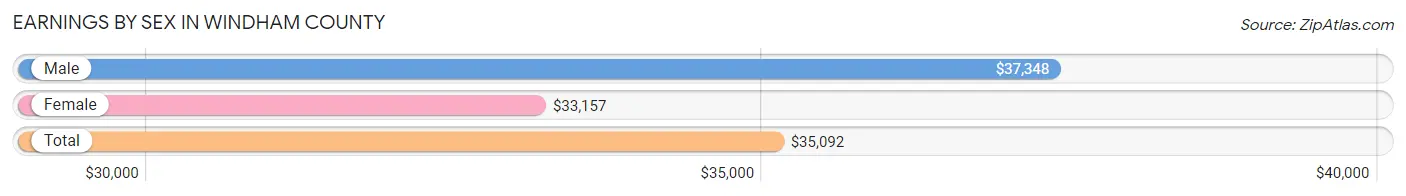
| Sex | Number | Average Earnings |
| Male | 13,119 (49.3%) | $37,348 |
| Female | 13,488 (50.7%) | $33,157 |
| Total | 26,607 (100.0%) | $35,092 |
Earnings by Sex by Income Bracket in Windham County
The most common earnings brackets in Windham County are $100,000+ for men (1,602 | 12.2%) and $75,000 to $99,999 for women (1,150 | 8.5%).
| Income | Male | Female |
| $2,499 or less | 1,073 (8.2%) | 966 (7.2%) |
| $2,500 to $4,999 | 481 (3.7%) | 548 (4.1%) |
| $5,000 to $7,499 | 609 (4.6%) | 629 (4.7%) |
| $7,500 to $9,999 | 328 (2.5%) | 434 (3.2%) |
| $10,000 to $12,499 | 397 (3.0%) | 649 (4.8%) |
| $12,500 to $14,999 | 443 (3.4%) | 463 (3.4%) |
| $15,000 to $17,499 | 315 (2.4%) | 290 (2.1%) |
| $17,500 to $19,999 | 176 (1.3%) | 401 (3.0%) |
| $20,000 to $22,499 | 313 (2.4%) | 355 (2.6%) |
| $22,500 to $24,999 | 337 (2.6%) | 672 (5.0%) |
| $25,000 to $29,999 | 998 (7.6%) | 836 (6.2%) |
| $30,000 to $34,999 | 758 (5.8%) | 804 (6.0%) |
| $35,000 to $39,999 | 793 (6.0%) | 775 (5.8%) |
| $40,000 to $44,999 | 811 (6.2%) | 837 (6.2%) |
| $45,000 to $49,999 | 605 (4.6%) | 533 (4.0%) |
| $50,000 to $54,999 | 526 (4.0%) | 622 (4.6%) |
| $55,000 to $64,999 | 1,093 (8.3%) | 960 (7.1%) |
| $65,000 to $74,999 | 505 (3.8%) | 843 (6.2%) |
| $75,000 to $99,999 | 956 (7.3%) | 1,150 (8.5%) |
| $100,000+ | 1,602 (12.2%) | 721 (5.3%) |
| Total | 13,119 (100.0%) | 13,488 (100.0%) |
Earnings by Sex by Educational Attainment in Windham County
Average earnings in Windham County are $43,530 for men and $36,859 for women, a difference of 15.3%. Men with an educational attainment of graduate degree enjoy the highest average annual earnings of $77,446, while those with less than high school education earn the least with $32,737. Women with an educational attainment of graduate degree earn the most with the average annual earnings of $60,718, while those with less than high school education have the smallest earnings of $24,234.
| Educational Attainment | Male Income | Female Income |
| Less than High School | $32,737 | $24,234 |
| High School Diploma | $39,242 | $29,951 |
| College or Associate's Degree | $43,086 | $33,158 |
| Bachelor's Degree | $44,382 | $36,071 |
| Graduate Degree | $77,446 | $60,718 |
| Total | $43,530 | $36,859 |
Family Income in Windham County
Family Income Brackets in Windham County
According to the Windham County family income data, there are 2,128 families falling into the $100,000 to $149,999 income range, which is the most common income bracket and makes up 20.3% of all families. Conversely, the $10,000 to $14,999 income bracket is the least frequent group with only 94 families (0.9%) belonging to this category.
| Income Bracket | # Families | % Families |
| Less than $10,000 | 304 | 2.9% |
| $10,000 to $14,999 | 94 | 0.9% |
| $15,000 to $24,999 | 493 | 4.7% |
| $25,000 to $34,999 | 671 | 6.4% |
| $35,000 to $49,999 | 1,038 | 9.9% |
| $50,000 to $74,999 | 1,772 | 16.9% |
| $75,000 to $99,999 | 1,803 | 17.2% |
| $100,000 to $149,999 | 2,128 | 20.3% |
| $150,000 to $199,999 | 1,059 | 10.1% |
| $200,000+ | 1,122 | 10.7% |
Family Income by Famaliy Size in Windham County
7+ person families (28 | 0.3%) account for the highest median family income in Windham County with $119,167 per family, while 2-person families (6,399 | 61.0%) have the highest median income of $39,250 per family member.
| Income Bracket | # Families | Median Income |
| 2-Person Families | 6,399 (61.0%) | $78,501 |
| 3-Person Families | 2,215 (21.1%) | $94,884 |
| 4-Person Families | 1,285 (12.3%) | $93,992 |
| 5-Person Families | 459 (4.4%) | $108,836 |
| 6-Person Families | 99 (0.9%) | $64,671 |
| 7+ Person Families | 28 (0.3%) | $119,167 |
| Total | 10,485 (100.0%) | $86,291 |
Family Income by Number of Earners in Windham County
The median family income in Windham County is $86,291, with families comprising 3+ earners (955) having the highest median family income of $124,313, while families with no earners (1,498) have the lowest median family income of $52,411, accounting for 9.1% and 14.3% of families, respectively.
| Number of Earners | # Families | Median Income |
| No Earners | 1,498 (14.3%) | $52,411 |
| 1 Earner | 3,662 (34.9%) | $64,789 |
| 2 Earners | 4,370 (41.7%) | $100,274 |
| 3+ Earners | 955 (9.1%) | $124,313 |
| Total | 10,485 (100.0%) | $86,291 |
Household Income in Windham County
Household Income Brackets in Windham County
With 3,295 households falling in the category, the $50,000 to $74,999 income range is the most frequent in Windham County, accounting for 17.0% of all households. In contrast, only 601 households (3.1%) fall into the less than $10,000 income bracket, making it the least populous group.
| Income Bracket | # Households | % Households |
| Less than $10,000 | 601 | 3.1% |
| $10,000 to $14,999 | 1,105 | 5.7% |
| $15,000 to $24,999 | 1,512 | 7.8% |
| $25,000 to $34,999 | 1,861 | 9.6% |
| $35,000 to $49,999 | 2,520 | 13.0% |
| $50,000 to $74,999 | 3,295 | 17.0% |
| $75,000 to $99,999 | 2,830 | 14.6% |
| $100,000 to $149,999 | 2,810 | 14.5% |
| $150,000 to $199,999 | 1,415 | 7.3% |
| $200,000+ | 1,434 | 7.4% |
Household Income by Householder Age in Windham County
The median household income in Windham County is $65,473, with the highest median household income of $73,446 found in the 45 to 64 years age bracket for the primary householder. A total of 7,355 households (38.0%) fall into this category. Meanwhile, the 65+ years age bracket for the primary householder has the lowest median household income of $52,724, with 7,174 households (37.0%) in this group.
| Income Bracket | # Households | Median Income |
| 15 to 24 Years | 371 (1.9%) | $70,777 |
| 25 to 44 Years | 4,482 (23.1%) | $71,484 |
| 45 to 64 Years | 7,355 (38.0%) | $73,446 |
| 65+ Years | 7,174 (37.0%) | $52,724 |
| Total | 19,382 (100.0%) | $65,473 |
Poverty in Windham County
Income Below Poverty by Sex and Age in Windham County
With 11.4% poverty level for males and 13.7% for females among the residents of Windham County, 5 year old males and under 5 year old females are the most vulnerable to poverty, with 108 males (48.2%) and 206 females (26.0%) in their respective age groups living below the poverty level.
| Age Bracket | Male | Female |
| Under 5 Years | 225 (22.4%) | 206 (26.0%) |
| 5 Years | 108 (48.2%) | 48 (21.4%) |
| 6 to 11 Years | 146 (12.8%) | 198 (15.5%) |
| 12 to 14 Years | 122 (14.2%) | 84 (14.7%) |
| 15 Years | 7 (4.5%) | 0 (0.0%) |
| 16 and 17 Years | 102 (17.5%) | 62 (12.8%) |
| 18 to 24 Years | 162 (9.8%) | 374 (25.2%) |
| 25 to 34 Years | 171 (7.4%) | 525 (22.6%) |
| 35 to 44 Years | 269 (11.1%) | 298 (11.0%) |
| 45 to 54 Years | 438 (16.9%) | 381 (13.7%) |
| 55 to 64 Years | 404 (11.0%) | 396 (10.0%) |
| 65 to 74 Years | 234 (6.9%) | 273 (7.8%) |
| 75 Years and over | 103 (5.8%) | 227 (10.5%) |
| Total | 2,491 (11.4%) | 3,072 (13.7%) |
Income Above Poverty by Sex and Age in Windham County
According to the poverty statistics in Windham County, males aged 15 years and females aged 15 years are the age groups that are most secure financially, with 95.5% of males and 100.0% of females in these age groups living above the poverty line.
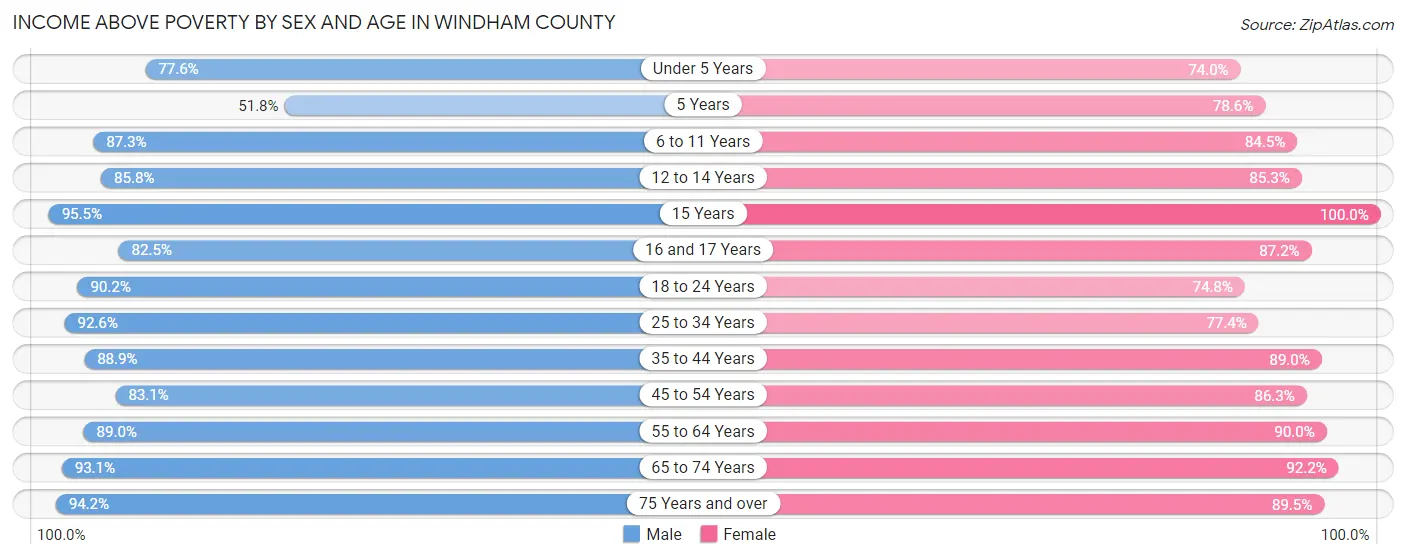
| Age Bracket | Male | Female |
| Under 5 Years | 778 (77.6%) | 586 (74.0%) |
| 5 Years | 116 (51.8%) | 176 (78.6%) |
| 6 to 11 Years | 999 (87.3%) | 1,081 (84.5%) |
| 12 to 14 Years | 736 (85.8%) | 489 (85.3%) |
| 15 Years | 149 (95.5%) | 233 (100.0%) |
| 16 and 17 Years | 482 (82.5%) | 421 (87.2%) |
| 18 to 24 Years | 1,488 (90.2%) | 1,110 (74.8%) |
| 25 to 34 Years | 2,135 (92.6%) | 1,795 (77.4%) |
| 35 to 44 Years | 2,162 (88.9%) | 2,422 (89.0%) |
| 45 to 54 Years | 2,159 (83.1%) | 2,391 (86.3%) |
| 55 to 64 Years | 3,279 (89.0%) | 3,554 (90.0%) |
| 65 to 74 Years | 3,153 (93.1%) | 3,234 (92.2%) |
| 75 Years and over | 1,675 (94.2%) | 1,937 (89.5%) |
| Total | 19,311 (88.6%) | 19,429 (86.4%) |
Income Below Poverty Among Married-Couple Families in Windham County
The poverty statistics for married-couple families in Windham County show that 2.4% or 190 of the total 7,787 families live below the poverty line. Families with 1 or 2 children have the highest poverty rate of 2.7%, comprising of 48 families. On the other hand, families with 5 or more children have the lowest poverty rate of 0.0%, which includes 0 families.
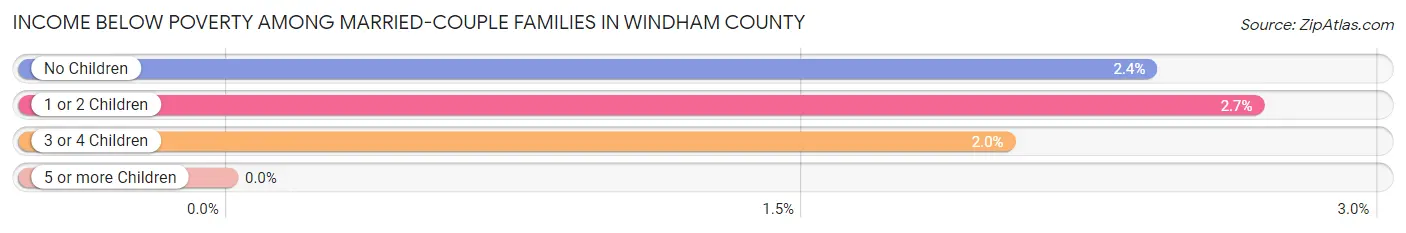
| Children | Above Poverty | Below Poverty |
| No Children | 5,500 (97.6%) | 135 (2.4%) |
| 1 or 2 Children | 1,746 (97.3%) | 48 (2.7%) |
| 3 or 4 Children | 338 (98.0%) | 7 (2.0%) |
| 5 or more Children | 13 (100.0%) | 0 (0.0%) |
| Total | 7,597 (97.6%) | 190 (2.4%) |
Income Below Poverty Among Single-Parent Households in Windham County
According to the poverty data in Windham County, 16.6% or 118 single-father households and 21.6% or 428 single-mother households are living below the poverty line. Among single-father households, those with 1 or 2 children have the highest poverty rate, with 101 households (26.2%) experiencing poverty. Likewise, among single-mother households, those with 3 or 4 children have the highest poverty rate, with 100 households (69.9%) falling below the poverty line.
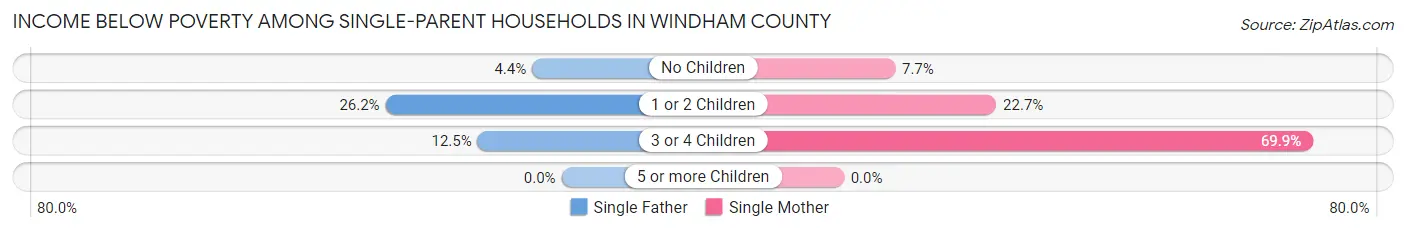
| Children | Single Father | Single Mother |
| No Children | 13 (4.4%) | 46 (7.6%) |
| 1 or 2 Children | 101 (26.2%) | 282 (22.7%) |
| 3 or 4 Children | 4 (12.5%) | 100 (69.9%) |
| 5 or more Children | 0 (0.0%) | 0 (0.0%) |
| Total | 118 (16.6%) | 428 (21.6%) |
Income Below Poverty Among Married-Couple vs Single-Parent Households in Windham County
The poverty data for Windham County shows that 190 of the married-couple family households (2.4%) and 546 of the single-parent households (20.2%) are living below the poverty level. Within the married-couple family households, those with 1 or 2 children have the highest poverty rate, with 48 households (2.7%) falling below the poverty line. Among the single-parent households, those with 3 or 4 children have the highest poverty rate, with 104 household (59.4%) living below poverty.
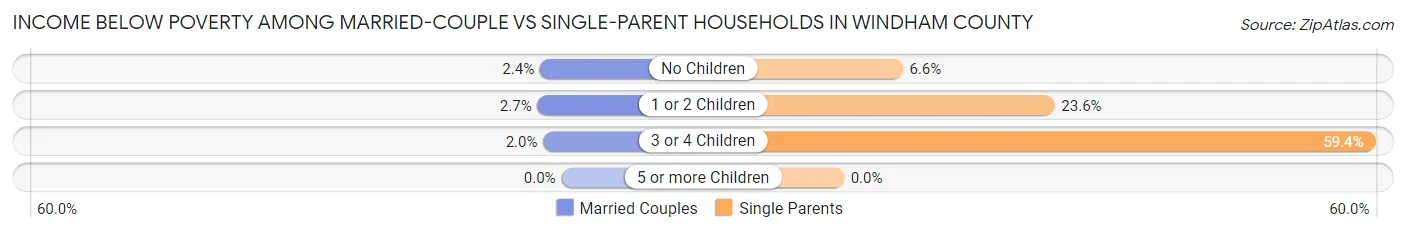
| Children | Married-Couple Families | Single-Parent Households |
| No Children | 135 (2.4%) | 59 (6.6%) |
| 1 or 2 Children | 48 (2.7%) | 383 (23.5%) |
| 3 or 4 Children | 7 (2.0%) | 104 (59.4%) |
| 5 or more Children | 0 (0.0%) | 0 (0.0%) |
| Total | 190 (2.4%) | 546 (20.2%) |
Employment Characteristics in Windham County
Employment by Class of Employer in Windham County
Among the 22,579 employed individuals in Windham County, private company employees (11,784 | 52.2%), not-for-profit organizations (3,519 | 15.6%), and self-employed (not incorporated) (2,961 | 13.1%) make up the most common classes of employment.
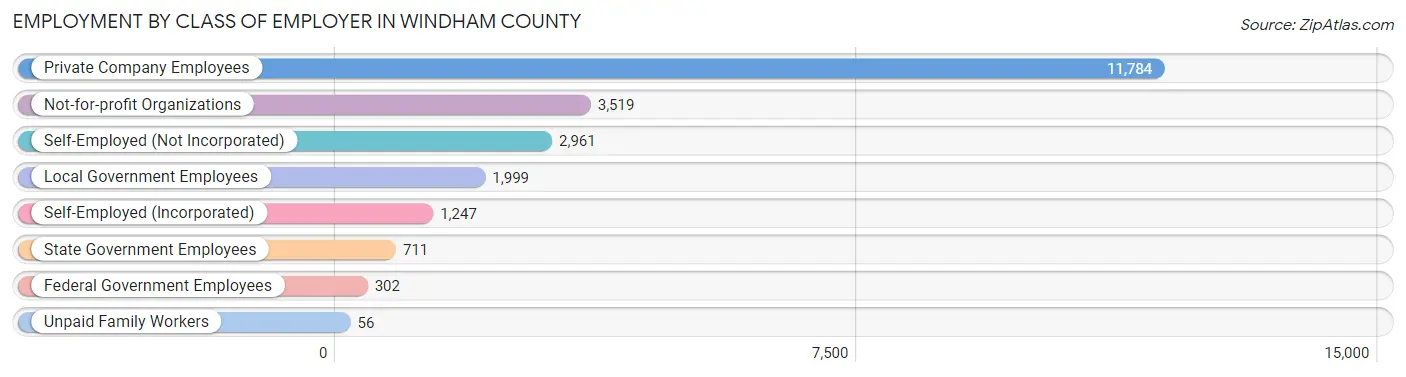
| Employer Class | # Employees | % Employees |
| Private Company Employees | 11,784 | 52.2% |
| Self-Employed (Incorporated) | 1,247 | 5.5% |
| Self-Employed (Not Incorporated) | 2,961 | 13.1% |
| Not-for-profit Organizations | 3,519 | 15.6% |
| Local Government Employees | 1,999 | 8.8% |
| State Government Employees | 711 | 3.2% |
| Federal Government Employees | 302 | 1.3% |
| Unpaid Family Workers | 56 | 0.3% |
| Total | 22,579 | 100.0% |
Employment Status by Age in Windham County
According to the labor force statistics for Windham County, out of the total population over 16 years of age (39,133), 62.8% or 24,576 individuals are in the labor force, with 4.4% or 1,081 of them unemployed. The age group with the highest labor force participation rate is 25 to 29 years, with 91.8% or 2,226 individuals in the labor force. Within the labor force, the 30 to 34 years age range has the highest percentage of unemployed individuals, with 9.0% or 181 of them being unemployed.
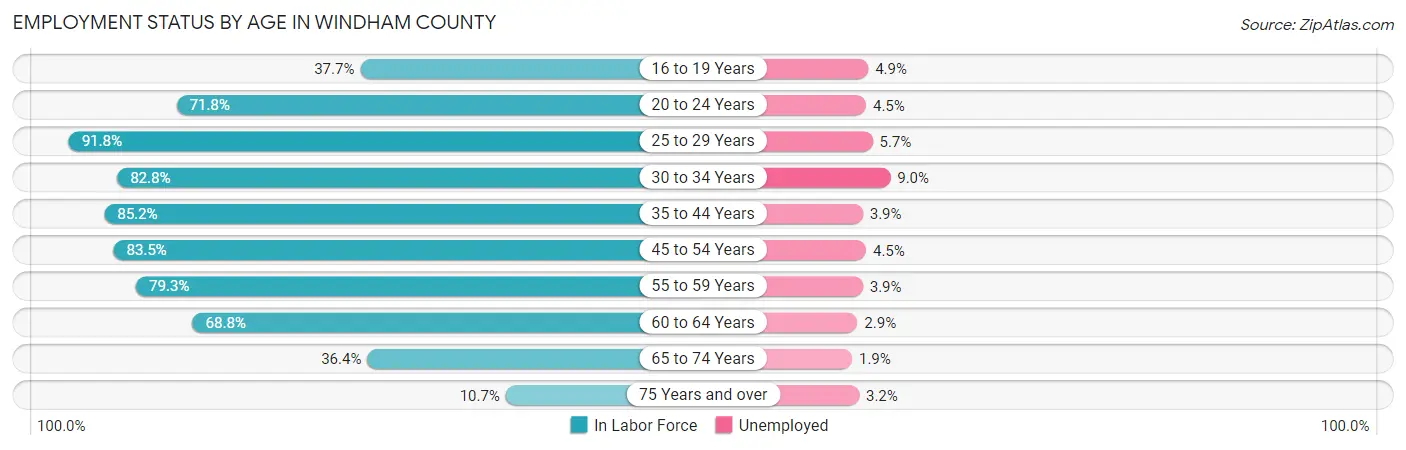
| Age Bracket | In Labor Force | Unemployed |
| 16 to 19 Years | 878 (37.7%) | 43 (4.9%) |
| 20 to 24 Years | 1,974 (71.8%) | 89 (4.5%) |
| 25 to 29 Years | 2,226 (91.8%) | 127 (5.7%) |
| 30 to 34 Years | 2,007 (82.8%) | 181 (9.0%) |
| 35 to 44 Years | 4,394 (85.2%) | 171 (3.9%) |
| 45 to 54 Years | 4,492 (83.5%) | 202 (4.5%) |
| 55 to 59 Years | 2,928 (79.3%) | 114 (3.9%) |
| 60 to 64 Years | 2,722 (68.8%) | 79 (2.9%) |
| 65 to 74 Years | 2,517 (36.4%) | 48 (1.9%) |
| 75 Years and over | 439 (10.7%) | 14 (3.2%) |
| Total | 24,576 (62.8%) | 1,081 (4.4%) |
Employment Status by Educational Attainment in Windham County
According to labor force statistics for Windham County, 81.5% of individuals (18,774) out of the total population between 25 and 64 years of age (23,035) are in the labor force, with 4.7% or 882 of them being unemployed. The group with the highest labor force participation rate are those with the educational attainment of bachelor's degree or higher, with 87.3% or 7,952 individuals in the labor force. Within the labor force, individuals with less than high school education have the highest percentage of unemployment, with 7.9% or 57 of them being unemployed.
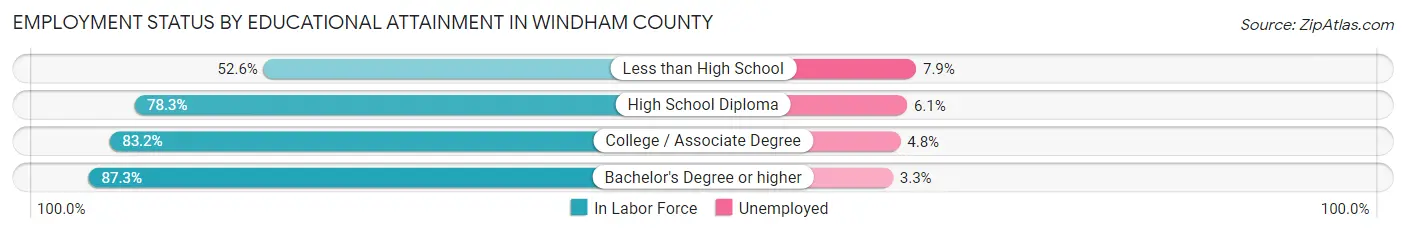
| Educational Attainment | In Labor Force | Unemployed |
| Less than High School | 724 (52.6%) | 109 (7.9%) |
| High School Diploma | 5,590 (78.3%) | 435 (6.1%) |
| College / Associate Degree | 4,501 (83.2%) | 260 (4.8%) |
| Bachelor's Degree or higher | 7,952 (87.3%) | 301 (3.3%) |
| Total | 18,774 (81.5%) | 1,083 (4.7%) |
Employment Occupations by Sex in Windham County
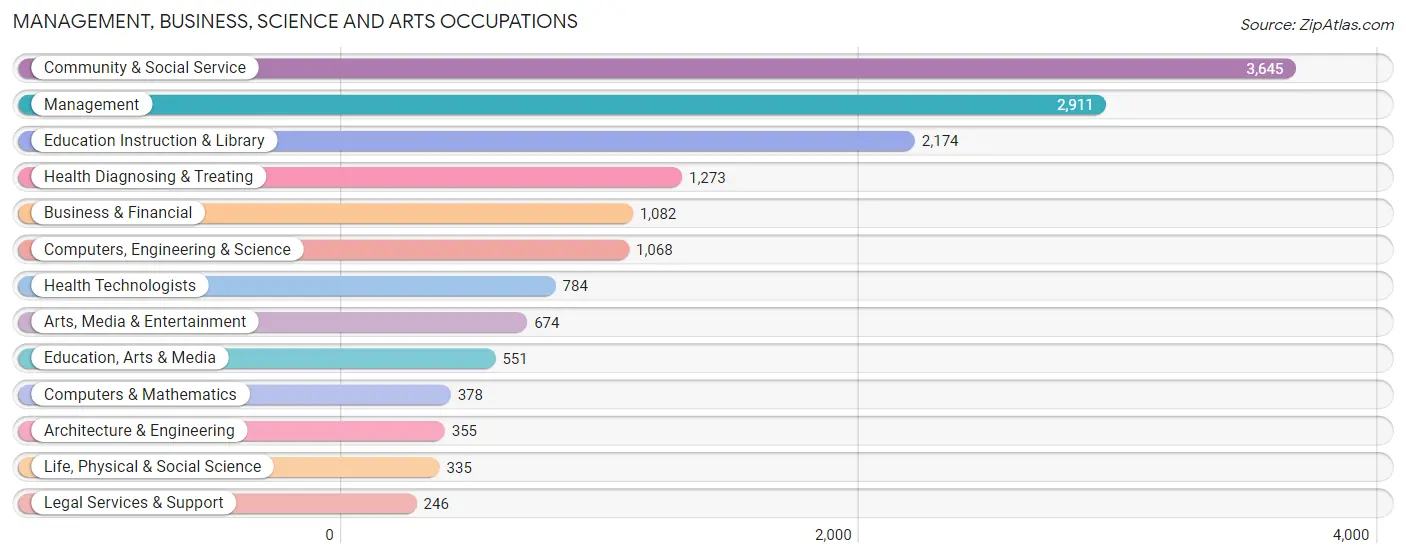
Management, Business, Science and Arts Occupations
The most common Management, Business, Science and Arts occupations in Windham County are Community & Social Service (3,645 | 15.5%), Management (2,911 | 12.4%), Education Instruction & Library (2,174 | 9.2%), Health Diagnosing & Treating (1,273 | 5.4%), and Business & Financial (1,082 | 4.6%).
Management, Business, Science and Arts Occupations by Sex
Within the Management, Business, Science and Arts occupations in Windham County, the most male-oriented occupations are Architecture & Engineering (85.1%), Computers & Mathematics (71.2%), and Computers, Engineering & Science (68.5%), while the most female-oriented occupations are Education Instruction & Library (78.3%), Health Technologists (77.7%), and Health Diagnosing & Treating (76.9%).
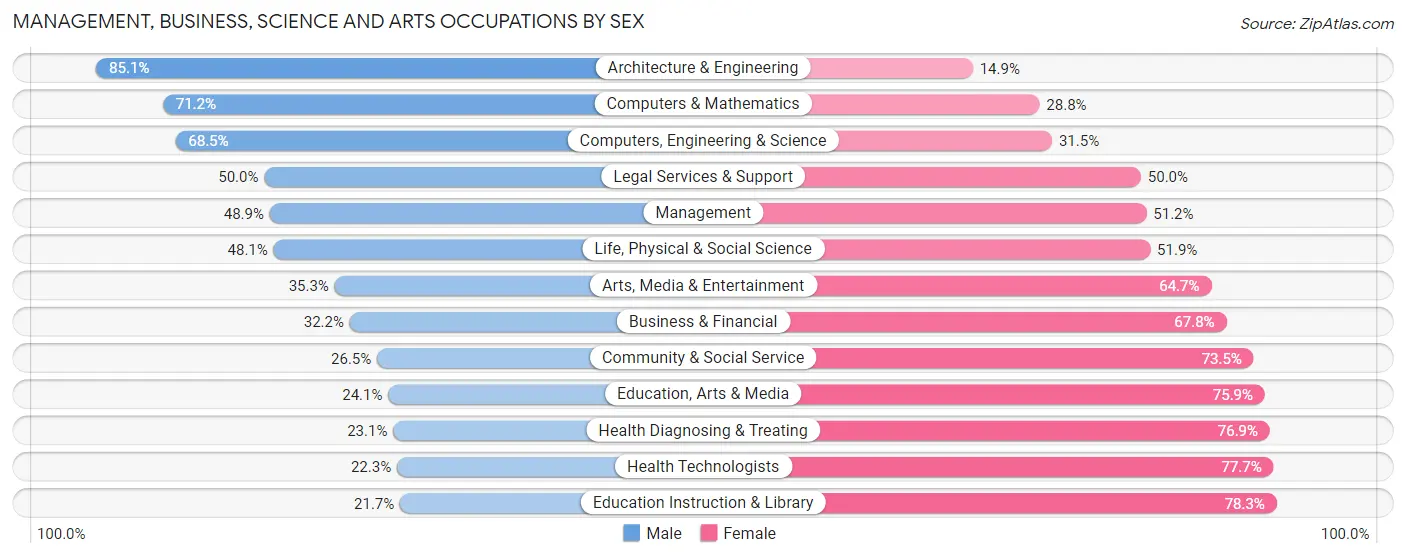
| Occupation | Male | Female |
| Management | 1,422 (48.8%) | 1,489 (51.1%) |
| Business & Financial | 348 (32.2%) | 734 (67.8%) |
| Computers, Engineering & Science | 732 (68.5%) | 336 (31.5%) |
| Computers & Mathematics | 269 (71.2%) | 109 (28.8%) |
| Architecture & Engineering | 302 (85.1%) | 53 (14.9%) |
| Life, Physical & Social Science | 161 (48.1%) | 174 (51.9%) |
| Community & Social Service | 965 (26.5%) | 2,680 (73.5%) |
| Education, Arts & Media | 133 (24.1%) | 418 (75.9%) |
| Legal Services & Support | 123 (50.0%) | 123 (50.0%) |
| Education Instruction & Library | 471 (21.7%) | 1,703 (78.3%) |
| Arts, Media & Entertainment | 238 (35.3%) | 436 (64.7%) |
| Health Diagnosing & Treating | 294 (23.1%) | 979 (76.9%) |
| Health Technologists | 175 (22.3%) | 609 (77.7%) |
| Total (Category) | 3,761 (37.7%) | 6,218 (62.3%) |
| Total (Overall) | 11,386 (48.4%) | 12,126 (51.6%) |
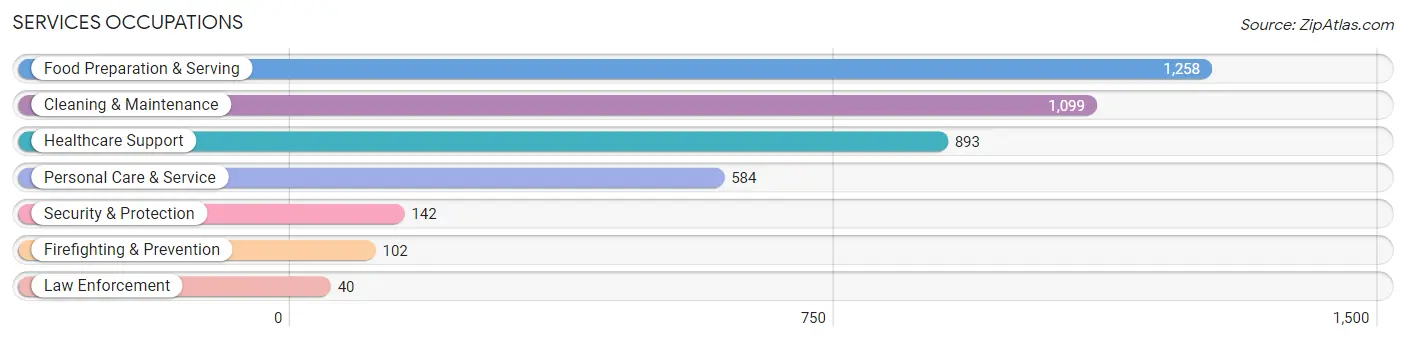
Services Occupations
The most common Services occupations in Windham County are Food Preparation & Serving (1,258 | 5.3%), Cleaning & Maintenance (1,099 | 4.7%), Healthcare Support (893 | 3.8%), Personal Care & Service (584 | 2.5%), and Security & Protection (142 | 0.6%).
Services Occupations by Sex
Within the Services occupations in Windham County, the most male-oriented occupations are Firefighting & Prevention (68.6%), Security & Protection (66.2%), and Law Enforcement (60.0%), while the most female-oriented occupations are Healthcare Support (73.2%), Food Preparation & Serving (64.1%), and Personal Care & Service (58.1%).
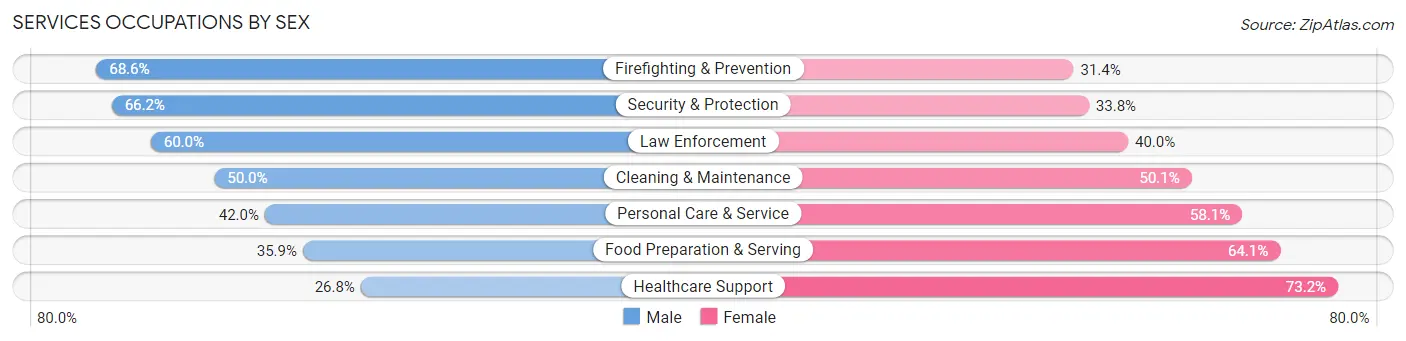
| Occupation | Male | Female |
| Healthcare Support | 239 (26.8%) | 654 (73.2%) |
| Security & Protection | 94 (66.2%) | 48 (33.8%) |
| Firefighting & Prevention | 70 (68.6%) | 32 (31.4%) |
| Law Enforcement | 24 (60.0%) | 16 (40.0%) |
| Food Preparation & Serving | 452 (35.9%) | 806 (64.1%) |
| Cleaning & Maintenance | 549 (49.9%) | 550 (50.0%) |
| Personal Care & Service | 245 (41.9%) | 339 (58.1%) |
| Total (Category) | 1,579 (39.7%) | 2,397 (60.3%) |
| Total (Overall) | 11,386 (48.4%) | 12,126 (51.6%) |
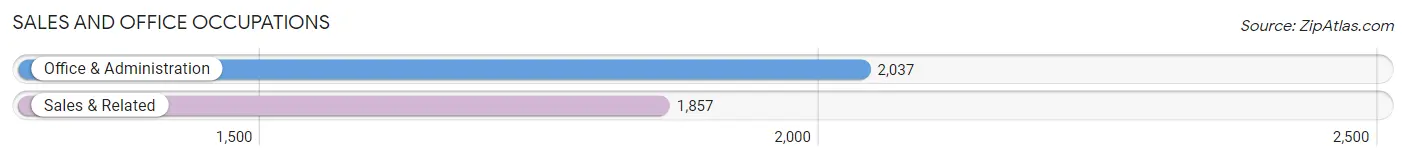
Sales and Office Occupations
The most common Sales and Office occupations in Windham County are Office & Administration (2,037 | 8.7%), and Sales & Related (1,857 | 7.9%).
Sales and Office Occupations by Sex
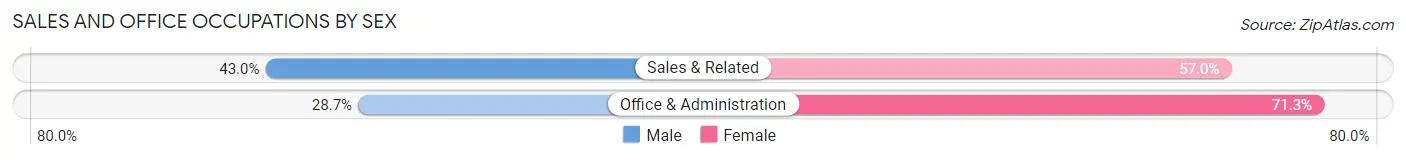
| Occupation | Male | Female |
| Sales & Related | 798 (43.0%) | 1,059 (57.0%) |
| Office & Administration | 585 (28.7%) | 1,452 (71.3%) |
| Total (Category) | 1,383 (35.5%) | 2,511 (64.5%) |
| Total (Overall) | 11,386 (48.4%) | 12,126 (51.6%) |
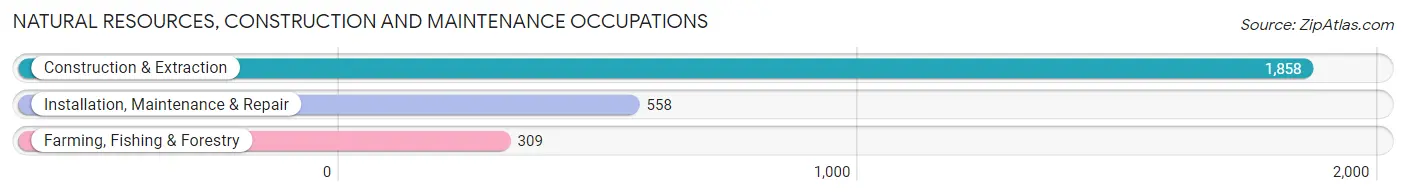
Natural Resources, Construction and Maintenance Occupations
The most common Natural Resources, Construction and Maintenance occupations in Windham County are Construction & Extraction (1,858 | 7.9%), Installation, Maintenance & Repair (558 | 2.4%), and Farming, Fishing & Forestry (309 | 1.3%).
Natural Resources, Construction and Maintenance Occupations by Sex
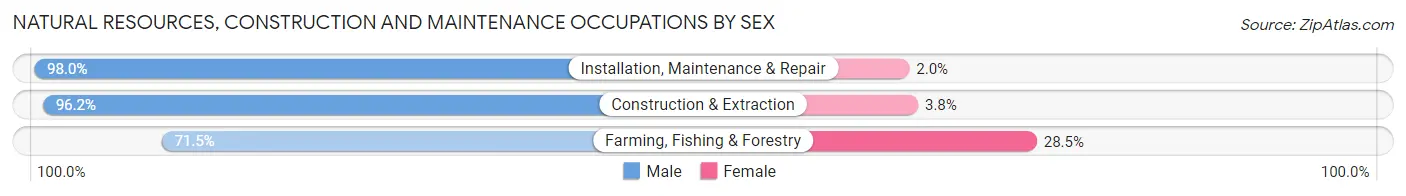
| Occupation | Male | Female |
| Farming, Fishing & Forestry | 221 (71.5%) | 88 (28.5%) |
| Construction & Extraction | 1,788 (96.2%) | 70 (3.8%) |
| Installation, Maintenance & Repair | 547 (98.0%) | 11 (2.0%) |
| Total (Category) | 2,556 (93.8%) | 169 (6.2%) |
| Total (Overall) | 11,386 (48.4%) | 12,126 (51.6%) |
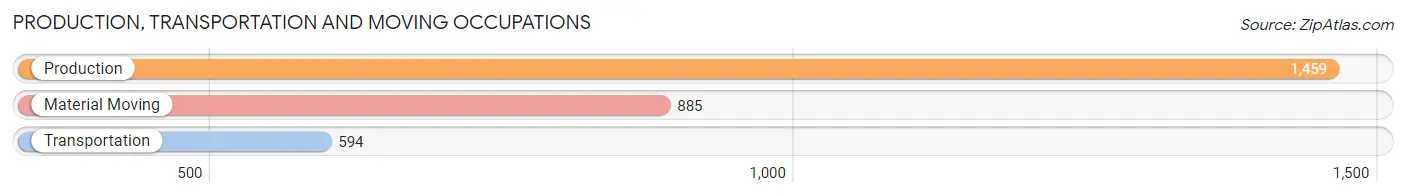
Production, Transportation and Moving Occupations
The most common Production, Transportation and Moving occupations in Windham County are Production (1,459 | 6.2%), Material Moving (885 | 3.8%), and Transportation (594 | 2.5%).
Production, Transportation and Moving Occupations by Sex
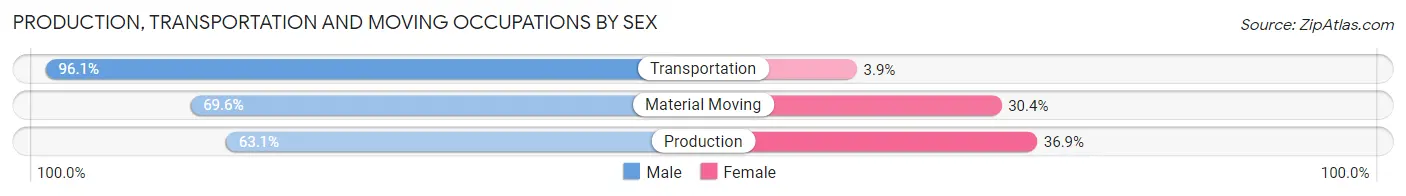
| Occupation | Male | Female |
| Production | 920 (63.1%) | 539 (36.9%) |
| Transportation | 571 (96.1%) | 23 (3.9%) |
| Material Moving | 616 (69.6%) | 269 (30.4%) |
| Total (Category) | 2,107 (71.7%) | 831 (28.3%) |
| Total (Overall) | 11,386 (48.4%) | 12,126 (51.6%) |
Employment Industries by Sex in Windham County
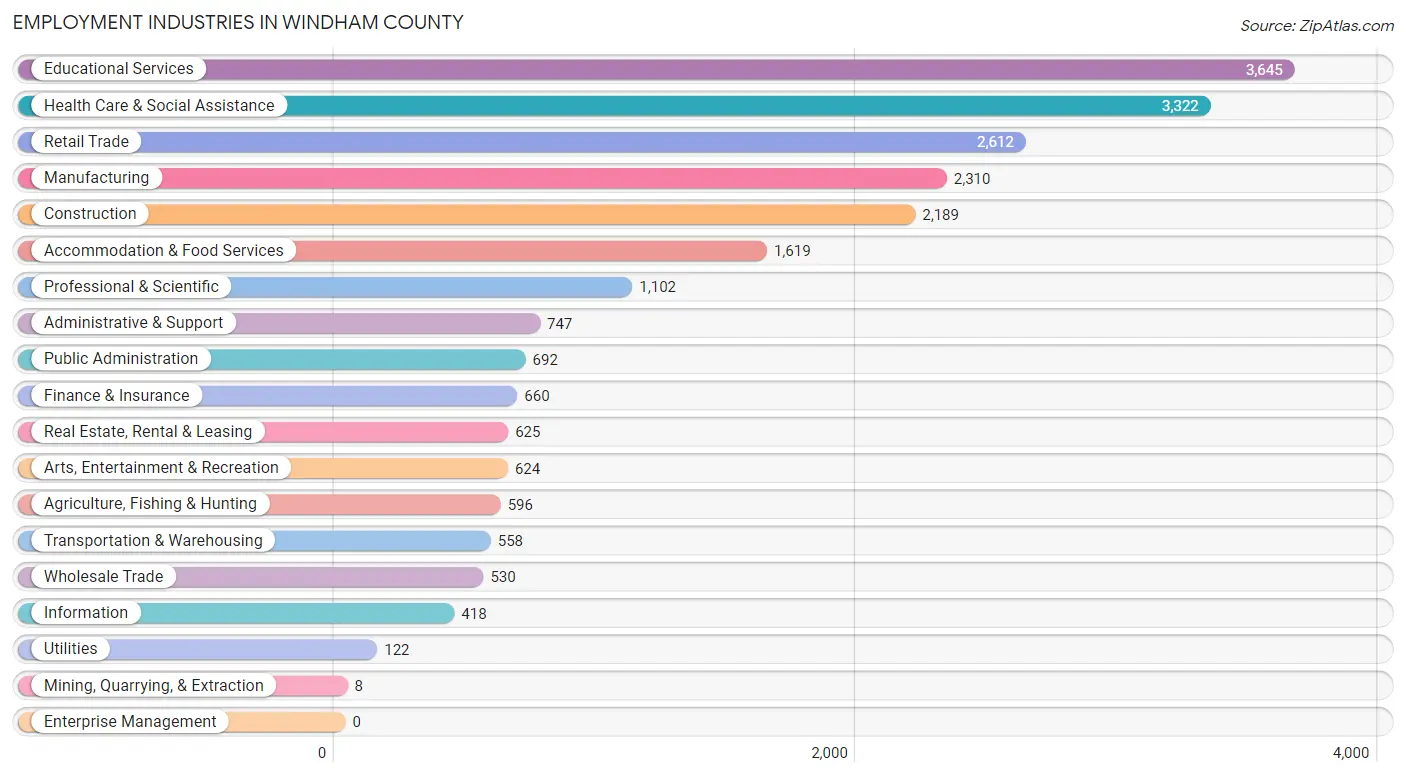
Employment Industries in Windham County
The major employment industries in Windham County include Educational Services (3,645 | 15.5%), Health Care & Social Assistance (3,322 | 14.1%), Retail Trade (2,612 | 11.1%), Manufacturing (2,310 | 9.8%), and Construction (2,189 | 9.3%).
Employment Industries by Sex in Windham County
The Windham County industries that see more men than women are Construction (92.4%), Utilities (74.6%), and Agriculture, Fishing & Hunting (74.0%), whereas the industries that tend to have a higher number of women are Mining, Quarrying, & Extraction (100.0%), Health Care & Social Assistance (78.4%), and Finance & Insurance (70.9%).
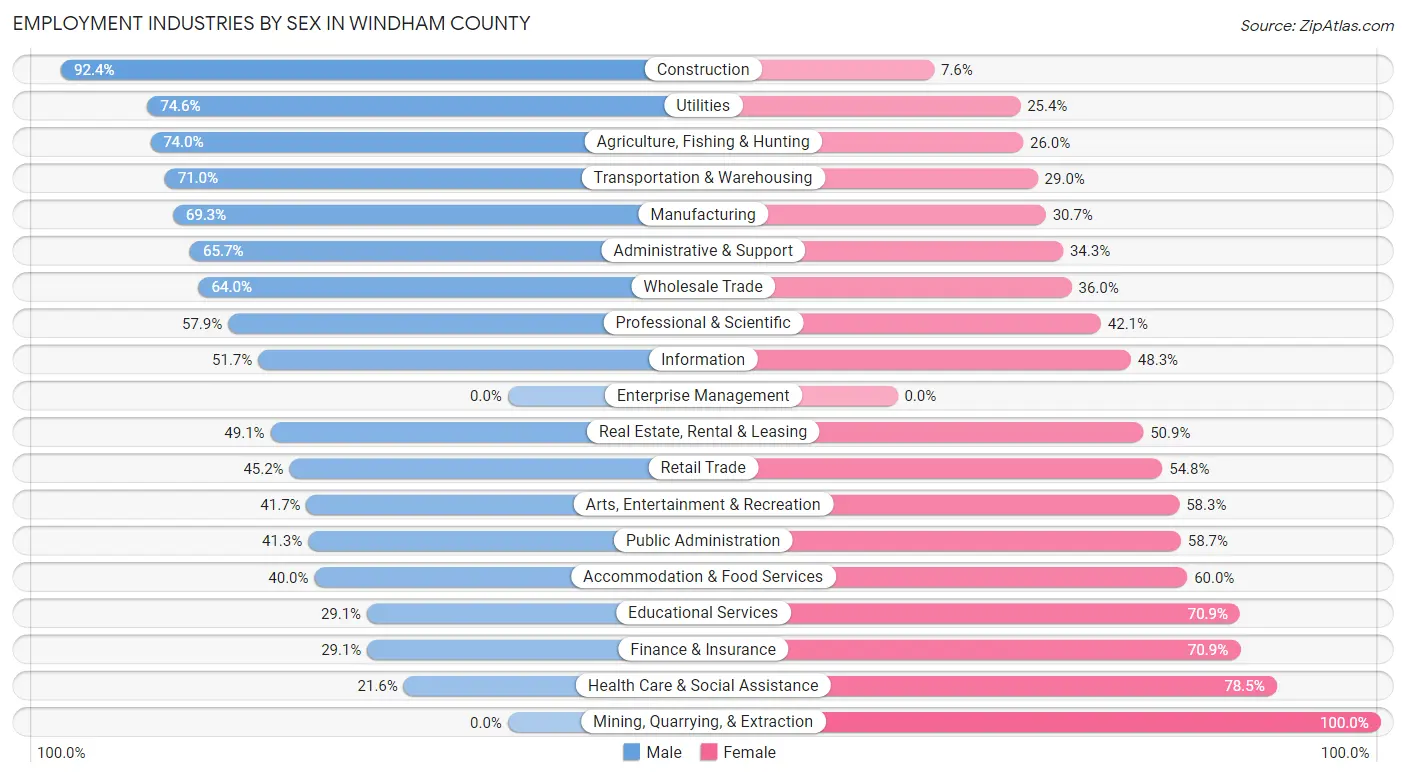
| Industry | Male | Female |
| Agriculture, Fishing & Hunting | 441 (74.0%) | 155 (26.0%) |
| Mining, Quarrying, & Extraction | 0 (0.0%) | 8 (100.0%) |
| Construction | 2,023 (92.4%) | 166 (7.6%) |
| Manufacturing | 1,601 (69.3%) | 709 (30.7%) |
| Wholesale Trade | 339 (64.0%) | 191 (36.0%) |
| Retail Trade | 1,180 (45.2%) | 1,432 (54.8%) |
| Transportation & Warehousing | 396 (71.0%) | 162 (29.0%) |
| Utilities | 91 (74.6%) | 31 (25.4%) |
| Information | 216 (51.7%) | 202 (48.3%) |
| Finance & Insurance | 192 (29.1%) | 468 (70.9%) |
| Real Estate, Rental & Leasing | 307 (49.1%) | 318 (50.9%) |
| Professional & Scientific | 638 (57.9%) | 464 (42.1%) |
| Enterprise Management | 0 (0.0%) | 0 (0.0%) |
| Administrative & Support | 491 (65.7%) | 256 (34.3%) |
| Educational Services | 1,062 (29.1%) | 2,583 (70.9%) |
| Health Care & Social Assistance | 716 (21.5%) | 2,606 (78.4%) |
| Arts, Entertainment & Recreation | 260 (41.7%) | 364 (58.3%) |
| Accommodation & Food Services | 648 (40.0%) | 971 (60.0%) |
| Public Administration | 286 (41.3%) | 406 (58.7%) |
| Total | 11,386 (48.4%) | 12,126 (51.6%) |
Education in Windham County
School Enrollment in Windham County
The most common levels of schooling among the 9,061 students in Windham County are college / undergraduate (2,274 | 25.1%), high school (1,953 | 21.5%), and middle school (1,849 | 20.4%).
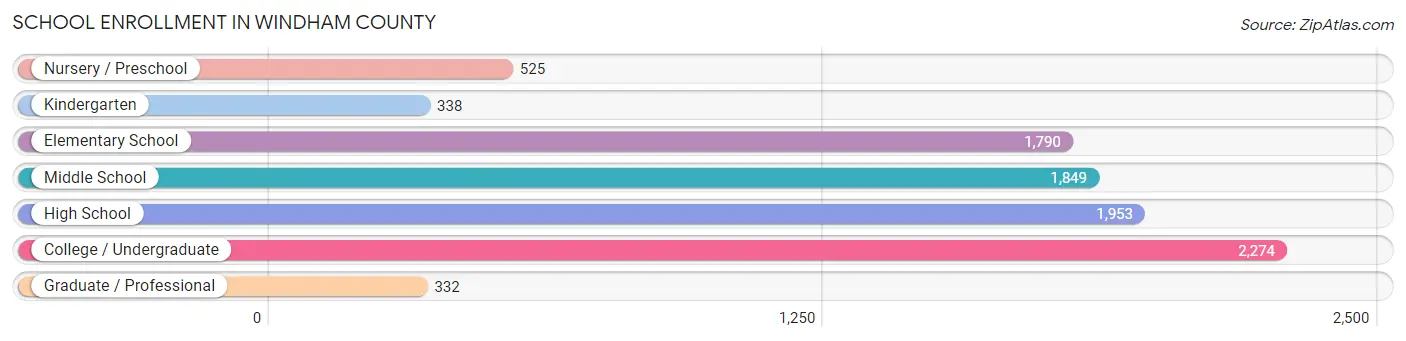
| School Level | # Students | % Students |
| Nursery / Preschool | 525 | 5.8% |
| Kindergarten | 338 | 3.7% |
| Elementary School | 1,790 | 19.8% |
| Middle School | 1,849 | 20.4% |
| High School | 1,953 | 21.5% |
| College / Undergraduate | 2,274 | 25.1% |
| Graduate / Professional | 332 | 3.7% |
| Total | 9,061 | 100.0% |
School Enrollment by Age by Funding Source in Windham County
Out of a total of 9,061 students who are enrolled in schools in Windham County, 2,537 (28.0%) attend a private institution, while the remaining 6,524 (72.0%) are enrolled in public schools. The age group of 3 to 4 year olds has the highest likelihood of being enrolled in private schools, with 172 (52.8% in the age bracket) enrolled. Conversely, the age group of 5 to 9 year old has the lowest likelihood of being enrolled in a private school, with 1,828 (88.1% in the age bracket) attending a public institution.
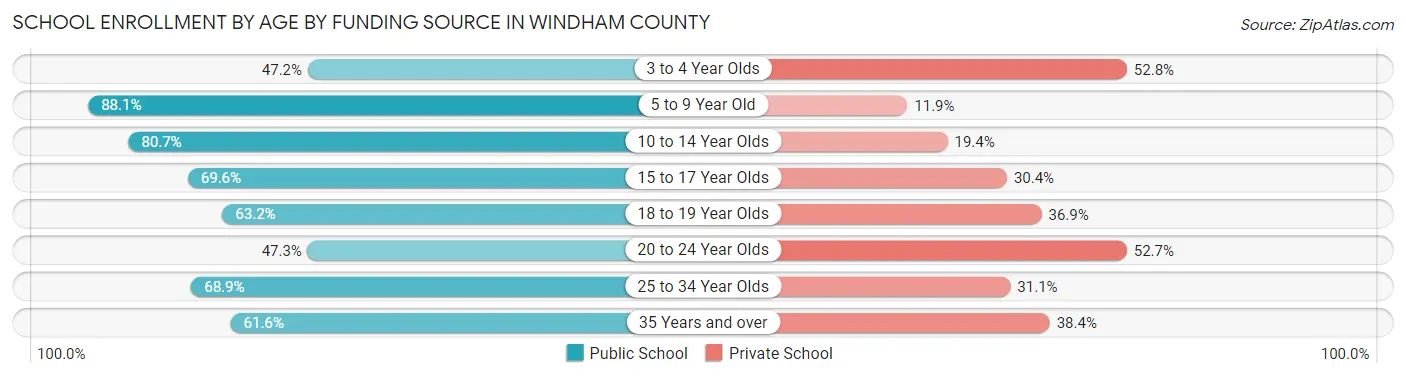
| Age Bracket | Public School | Private School |
| 3 to 4 Year Olds | 154 (47.2%) | 172 (52.8%) |
| 5 to 9 Year Old | 1,828 (88.1%) | 246 (11.9%) |
| 10 to 14 Year Olds | 1,842 (80.6%) | 442 (19.4%) |
| 15 to 17 Year Olds | 977 (69.6%) | 427 (30.4%) |
| 18 to 19 Year Olds | 622 (63.1%) | 363 (36.8%) |
| 20 to 24 Year Olds | 529 (47.3%) | 590 (52.7%) |
| 25 to 34 Year Olds | 344 (68.9%) | 155 (31.1%) |
| 35 Years and over | 228 (61.6%) | 142 (38.4%) |
| Total | 6,524 (72.0%) | 2,537 (28.0%) |
Educational Attainment by Field of Study in Windham County
Visual & performing arts (1,817 | 11.9%), social sciences (1,746 | 11.4%), education (1,574 | 10.3%), liberal arts & history (1,522 | 10.0%), and literature & languages (1,486 | 9.7%) are the most common fields of study among 15,301 individuals in Windham County who have obtained a bachelor's degree or higher.
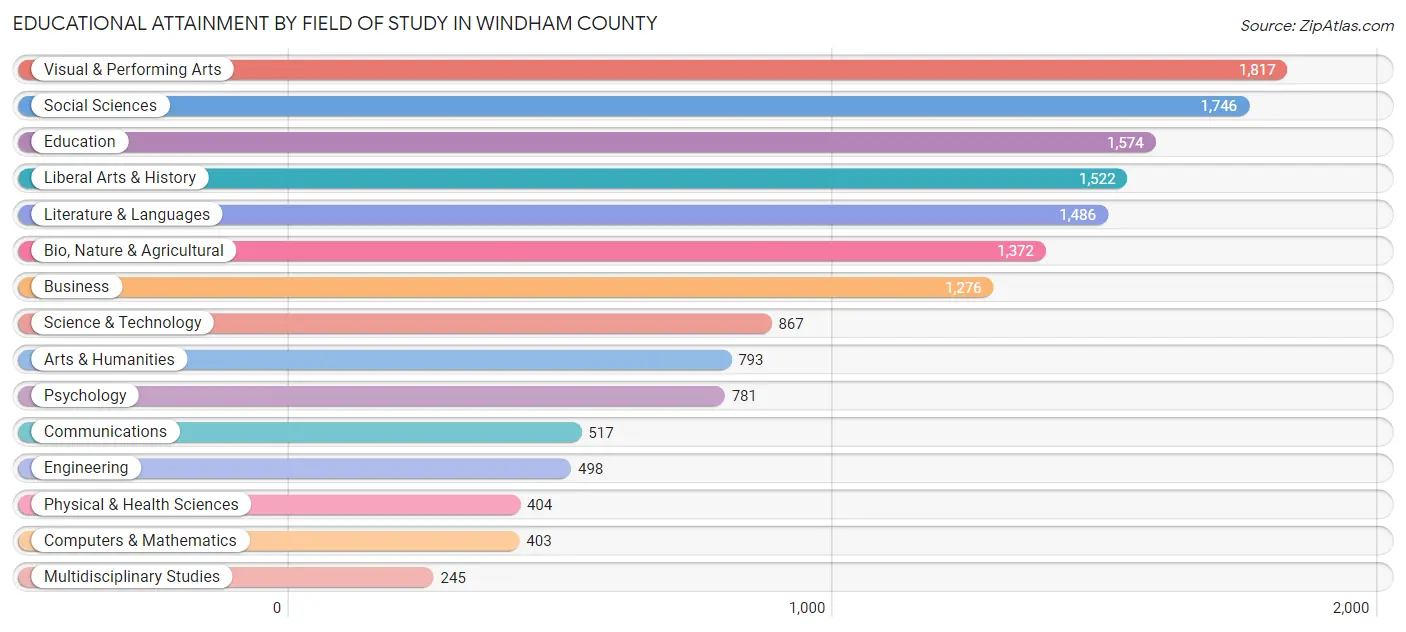
| Field of Study | # Graduates | % Graduates |
| Computers & Mathematics | 403 | 2.6% |
| Bio, Nature & Agricultural | 1,372 | 9.0% |
| Physical & Health Sciences | 404 | 2.6% |
| Psychology | 781 | 5.1% |
| Social Sciences | 1,746 | 11.4% |
| Engineering | 498 | 3.3% |
| Multidisciplinary Studies | 245 | 1.6% |
| Science & Technology | 867 | 5.7% |
| Business | 1,276 | 8.3% |
| Education | 1,574 | 10.3% |
| Literature & Languages | 1,486 | 9.7% |
| Liberal Arts & History | 1,522 | 10.0% |
| Visual & Performing Arts | 1,817 | 11.9% |
| Communications | 517 | 3.4% |
| Arts & Humanities | 793 | 5.2% |
| Total | 15,301 | 100.0% |
Transportation & Commute in Windham County
Vehicle Availability by Sex in Windham County
The most prevalent vehicle ownership categories in Windham County are males with 2 vehicles (4,961, accounting for 46.4%) and females with 2 vehicles (4,685, making up 43.2%).
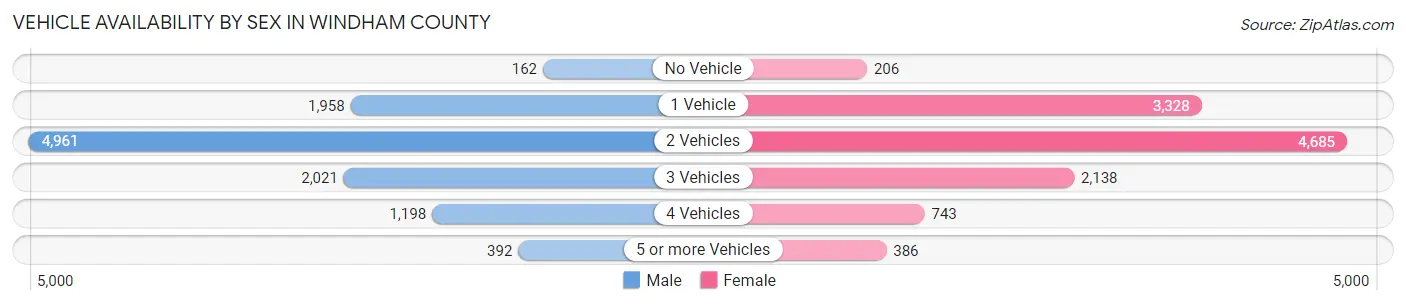
| Vehicles Available | Male | Female |
| No Vehicle | 162 (1.5%) | 206 (1.8%) |
| 1 Vehicle | 1,958 (18.3%) | 3,328 (29.0%) |
| 2 Vehicles | 4,961 (46.4%) | 4,685 (40.8%) |
| 3 Vehicles | 2,021 (18.9%) | 2,138 (18.6%) |
| 4 Vehicles | 1,198 (11.2%) | 743 (6.5%) |
| 5 or more Vehicles | 392 (3.7%) | 386 (3.4%) |
| Total | 10,692 (100.0%) | 11,486 (100.0%) |
Commute Time in Windham County
The most frequently occuring commute durations in Windham County are 15 to 19 minutes (3,107 commuters, 16.4%), 5 to 9 minutes (2,978 commuters, 15.7%), and 10 to 14 minutes (2,951 commuters, 15.6%).
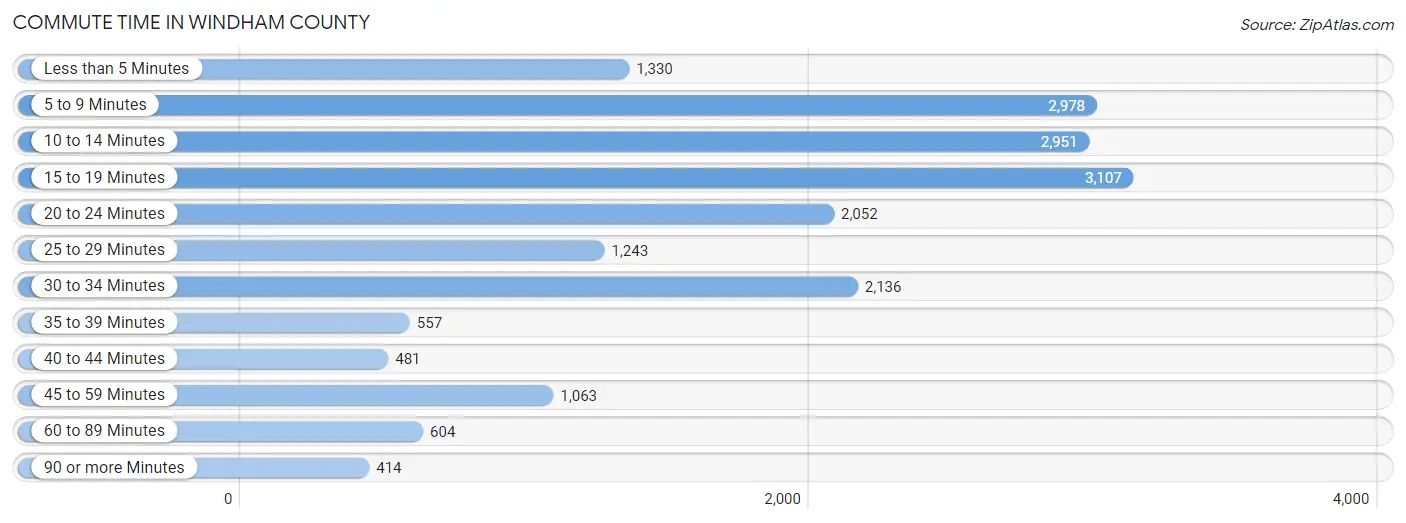
| Commute Time | # Commuters | % Commuters |
| Less than 5 Minutes | 1,330 | 7.0% |
| 5 to 9 Minutes | 2,978 | 15.7% |
| 10 to 14 Minutes | 2,951 | 15.6% |
| 15 to 19 Minutes | 3,107 | 16.4% |
| 20 to 24 Minutes | 2,052 | 10.8% |
| 25 to 29 Minutes | 1,243 | 6.6% |
| 30 to 34 Minutes | 2,136 | 11.3% |
| 35 to 39 Minutes | 557 | 2.9% |
| 40 to 44 Minutes | 481 | 2.5% |
| 45 to 59 Minutes | 1,063 | 5.6% |
| 60 to 89 Minutes | 604 | 3.2% |
| 90 or more Minutes | 414 | 2.2% |
Commute Time by Sex in Windham County
The most common commute times in Windham County are 10 to 14 minutes (1,637 commuters, 17.6%) for males and 15 to 19 minutes (1,641 commuters, 17.0%) for females.
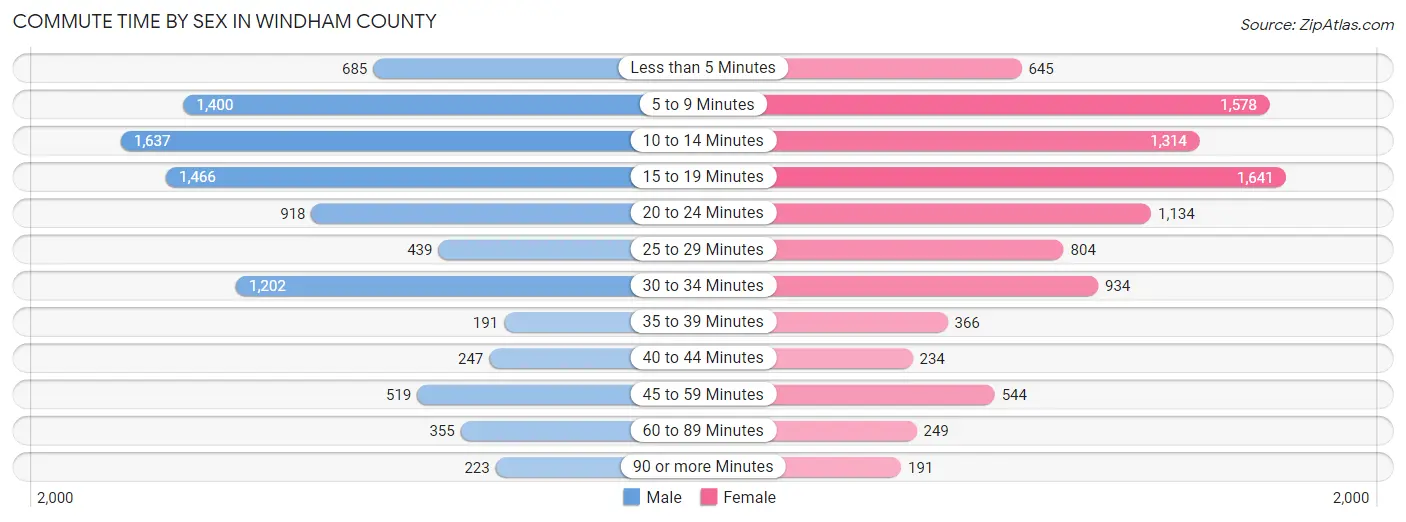
| Commute Time | Male | Female |
| Less than 5 Minutes | 685 (7.4%) | 645 (6.7%) |
| 5 to 9 Minutes | 1,400 (15.1%) | 1,578 (16.4%) |
| 10 to 14 Minutes | 1,637 (17.6%) | 1,314 (13.6%) |
| 15 to 19 Minutes | 1,466 (15.8%) | 1,641 (17.0%) |
| 20 to 24 Minutes | 918 (9.9%) | 1,134 (11.8%) |
| 25 to 29 Minutes | 439 (4.7%) | 804 (8.4%) |
| 30 to 34 Minutes | 1,202 (13.0%) | 934 (9.7%) |
| 35 to 39 Minutes | 191 (2.1%) | 366 (3.8%) |
| 40 to 44 Minutes | 247 (2.7%) | 234 (2.4%) |
| 45 to 59 Minutes | 519 (5.6%) | 544 (5.7%) |
| 60 to 89 Minutes | 355 (3.8%) | 249 (2.6%) |
| 90 or more Minutes | 223 (2.4%) | 191 (2.0%) |
Time of Departure to Work by Sex in Windham County
The most frequent times of departure to work in Windham County are 8:00 AM to 8:29 AM (1,260, 13.6%) for males and 8:00 AM to 8:29 AM (2,016, 20.9%) for females.
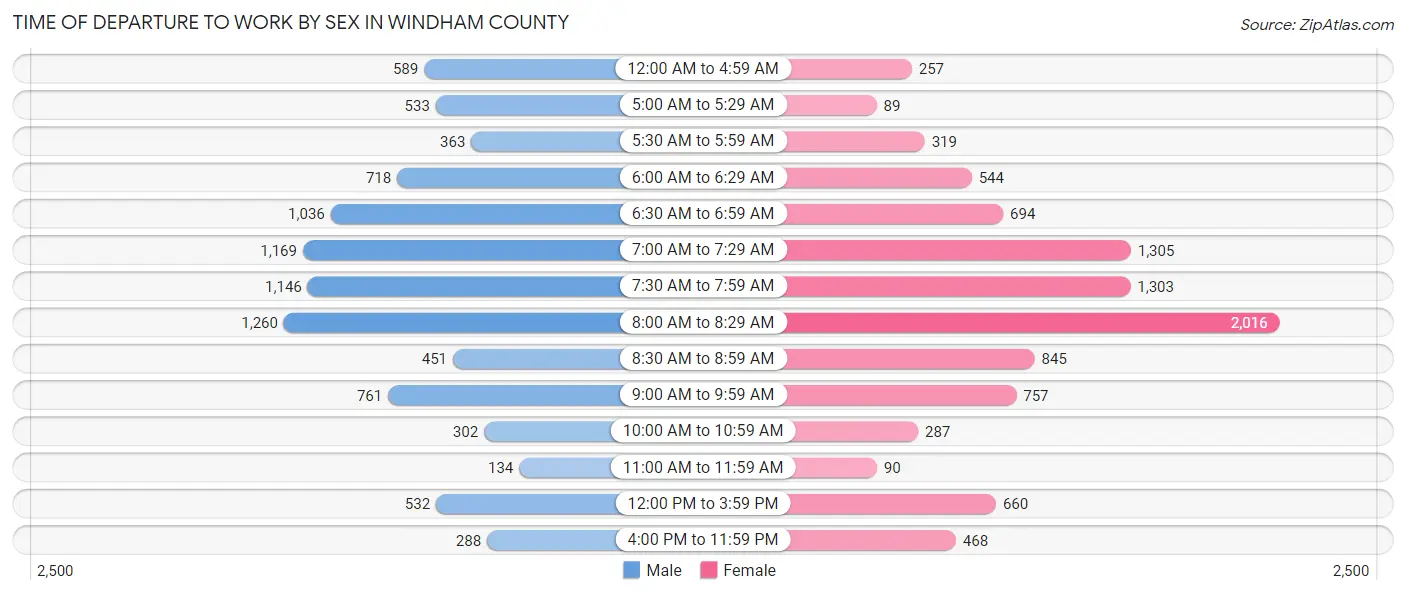
| Time of Departure | Male | Female |
| 12:00 AM to 4:59 AM | 589 (6.4%) | 257 (2.7%) |
| 5:00 AM to 5:29 AM | 533 (5.7%) | 89 (0.9%) |
| 5:30 AM to 5:59 AM | 363 (3.9%) | 319 (3.3%) |
| 6:00 AM to 6:29 AM | 718 (7.7%) | 544 (5.7%) |
| 6:30 AM to 6:59 AM | 1,036 (11.2%) | 694 (7.2%) |
| 7:00 AM to 7:29 AM | 1,169 (12.6%) | 1,305 (13.6%) |
| 7:30 AM to 7:59 AM | 1,146 (12.3%) | 1,303 (13.5%) |
| 8:00 AM to 8:29 AM | 1,260 (13.6%) | 2,016 (20.9%) |
| 8:30 AM to 8:59 AM | 451 (4.9%) | 845 (8.8%) |
| 9:00 AM to 9:59 AM | 761 (8.2%) | 757 (7.9%) |
| 10:00 AM to 10:59 AM | 302 (3.3%) | 287 (3.0%) |
| 11:00 AM to 11:59 AM | 134 (1.4%) | 90 (0.9%) |
| 12:00 PM to 3:59 PM | 532 (5.7%) | 660 (6.9%) |
| 4:00 PM to 11:59 PM | 288 (3.1%) | 468 (4.9%) |
| Total | 9,282 (100.0%) | 9,634 (100.0%) |
Housing Occupancy in Windham County
Occupancy by Ownership in Windham County
Of the total 19,382 dwellings in Windham County, owner-occupied units account for 13,910 (71.8%), while renter-occupied units make up 5,472 (28.2%).
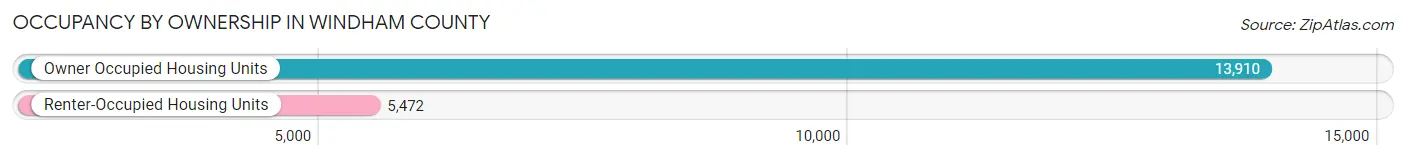
| Occupancy | # Housing Units | % Housing Units |
| Owner Occupied Housing Units | 13,910 | 71.8% |
| Renter-Occupied Housing Units | 5,472 | 28.2% |
| Total Occupied Housing Units | 19,382 | 100.0% |
Occupancy by Household Size in Windham County
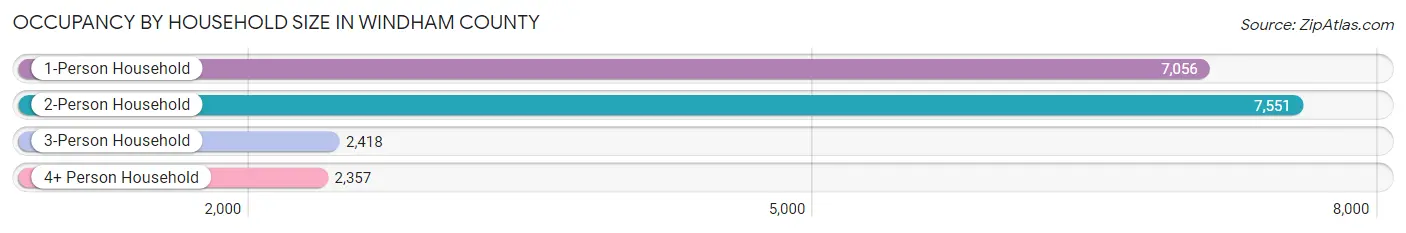
| Household Size | # Housing Units | % Housing Units |
| 1-Person Household | 7,056 | 36.4% |
| 2-Person Household | 7,551 | 39.0% |
| 3-Person Household | 2,418 | 12.5% |
| 4+ Person Household | 2,357 | 12.2% |
| Total Housing Units | 19,382 | 100.0% |
Occupancy by Ownership by Household Size in Windham County
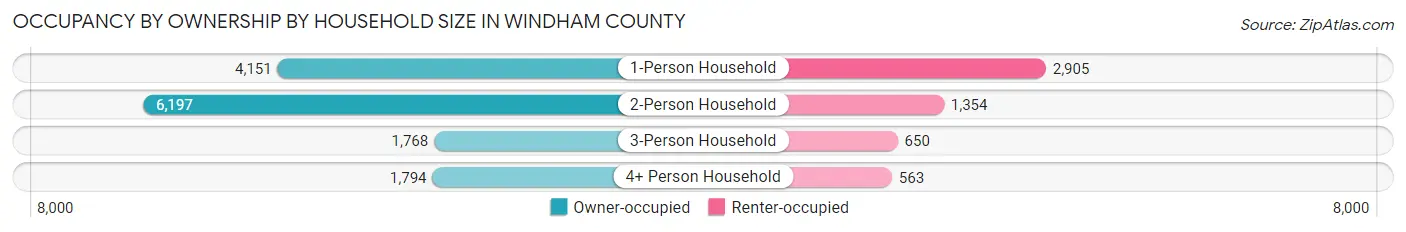
| Household Size | Owner-occupied | Renter-occupied |
| 1-Person Household | 4,151 (58.8%) | 2,905 (41.2%) |
| 2-Person Household | 6,197 (82.1%) | 1,354 (17.9%) |
| 3-Person Household | 1,768 (73.1%) | 650 (26.9%) |
| 4+ Person Household | 1,794 (76.1%) | 563 (23.9%) |
| Total Housing Units | 13,910 (71.8%) | 5,472 (28.2%) |
Occupancy by Educational Attainment in Windham County
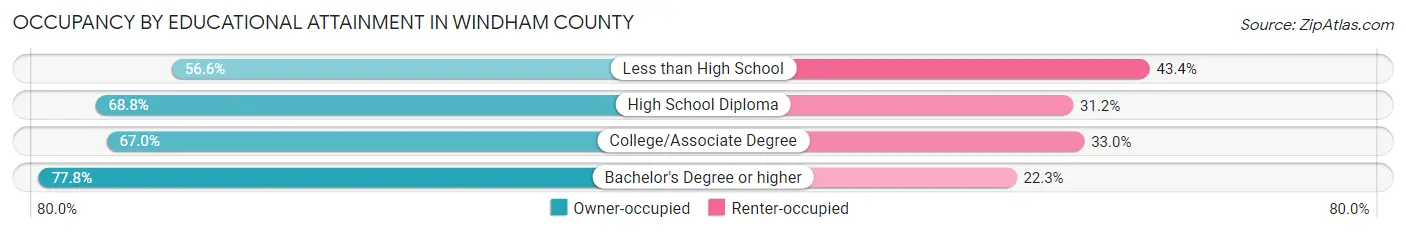
| Household Size | Owner-occupied | Renter-occupied |
| Less than High School | 504 (56.6%) | 386 (43.4%) |
| High School Diploma | 3,544 (68.8%) | 1,610 (31.2%) |
| College/Associate Degree | 3,165 (67.0%) | 1,559 (33.0%) |
| Bachelor's Degree or higher | 6,697 (77.7%) | 1,917 (22.3%) |
Occupancy by Age of Householder in Windham County
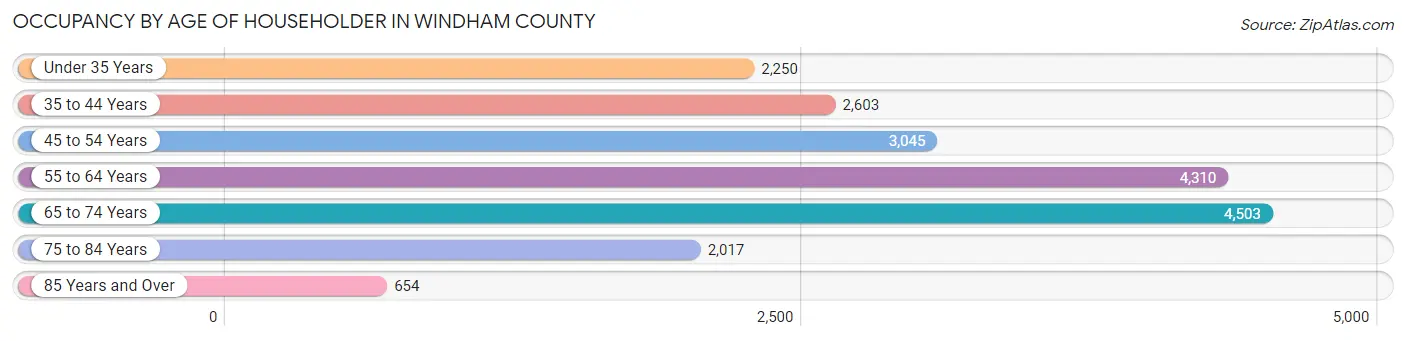
| Age Bracket | # Households | % Households |
| Under 35 Years | 2,250 | 11.6% |
| 35 to 44 Years | 2,603 | 13.4% |
| 45 to 54 Years | 3,045 | 15.7% |
| 55 to 64 Years | 4,310 | 22.2% |
| 65 to 74 Years | 4,503 | 23.2% |
| 75 to 84 Years | 2,017 | 10.4% |
| 85 Years and Over | 654 | 3.4% |
| Total | 19,382 | 100.0% |
Housing Finances in Windham County
Median Income by Occupancy in Windham County
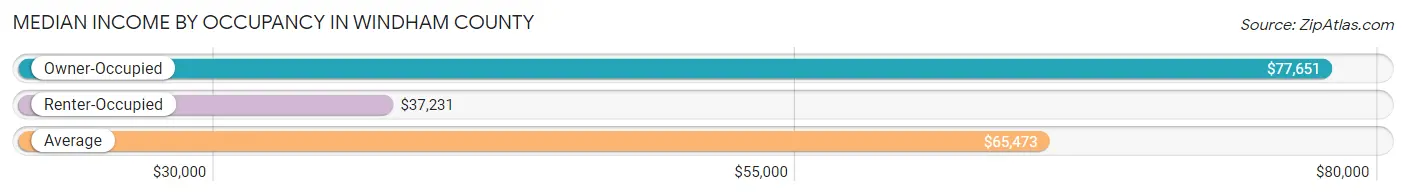
| Occupancy Type | # Households | Median Income |
| Owner-Occupied | 13,910 (71.8%) | $77,651 |
| Renter-Occupied | 5,472 (28.2%) | $37,231 |
| Average | 19,382 (100.0%) | $65,473 |
Occupancy by Householder Income Bracket in Windham County
| Income Bracket | Owner-occupied | Renter-occupied |
| Less than $5,000 | 106 (0.8%) | 154 (2.8%) |
| $5,000 to $9,999 | 191 (1.4%) | 153 (2.8%) |
| $10,000 to $14,999 | 310 (2.2%) | 790 (14.4%) |
| $15,000 to $19,999 | 281 (2.0%) | 470 (8.6%) |
| $20,000 to $24,999 | 456 (3.3%) | 312 (5.7%) |
| $25,000 to $34,999 | 1,232 (8.9%) | 625 (11.4%) |
| $35,000 to $49,999 | 1,600 (11.5%) | 922 (16.9%) |
| $50,000 to $74,999 | 2,503 (18.0%) | 795 (14.5%) |
| $75,000 to $99,999 | 2,373 (17.1%) | 462 (8.4%) |
| $100,000 to $149,999 | 2,334 (16.8%) | 468 (8.6%) |
| $150,000 or more | 2,524 (18.1%) | 321 (5.9%) |
| Total | 13,910 (100.0%) | 5,472 (100.0%) |
Monthly Housing Cost Tiers in Windham County
| Monthly Cost | Owner-occupied | Renter-occupied |
| Less than $300 | 191 (1.4%) | 401 (7.3%) |
| $300 to $499 | 533 (3.8%) | 324 (5.9%) |
| $500 to $799 | 2,264 (16.3%) | 617 (11.3%) |
| $800 to $999 | 1,687 (12.1%) | 984 (18.0%) |
| $1,000 to $1,499 | 3,646 (26.2%) | 1,993 (36.4%) |
| $1,500 to $1,999 | 2,844 (20.4%) | 422 (7.7%) |
| $2,000 to $2,499 | 1,606 (11.6%) | 106 (1.9%) |
| $2,500 to $2,999 | 618 (4.4%) | 47 (0.9%) |
| $3,000 or more | 521 (3.7%) | 88 (1.6%) |
| Total | 13,910 (100.0%) | 5,472 (100.0%) |
Physical Housing Characteristics in Windham County
Housing Structures in Windham County
| Structure Type | # Housing Units | % Housing Units |
| Single Unit, Detached | 13,678 | 70.6% |
| Single Unit, Attached | 456 | 2.4% |
| 2 Unit Apartments | 1,178 | 6.1% |
| 3 or 4 Unit Apartments | 1,017 | 5.2% |
| 5 to 9 Unit Apartments | 992 | 5.1% |
| 10 or more Apartments | 1,034 | 5.3% |
| Mobile Home / Other | 1,027 | 5.3% |
| Total | 19,382 | 100.0% |
Housing Structures by Occupancy in Windham County
| Structure Type | Owner-occupied | Renter-occupied |
| Single Unit, Detached | 12,172 (89.0%) | 1,506 (11.0%) |
| Single Unit, Attached | 240 (52.6%) | 216 (47.4%) |
| 2 Unit Apartments | 436 (37.0%) | 742 (63.0%) |
| 3 or 4 Unit Apartments | 95 (9.3%) | 922 (90.7%) |
| 5 to 9 Unit Apartments | 4 (0.4%) | 988 (99.6%) |
| 10 or more Apartments | 117 (11.3%) | 917 (88.7%) |
| Mobile Home / Other | 846 (82.4%) | 181 (17.6%) |
| Total | 13,910 (71.8%) | 5,472 (28.2%) |
Housing Structures by Number of Rooms in Windham County
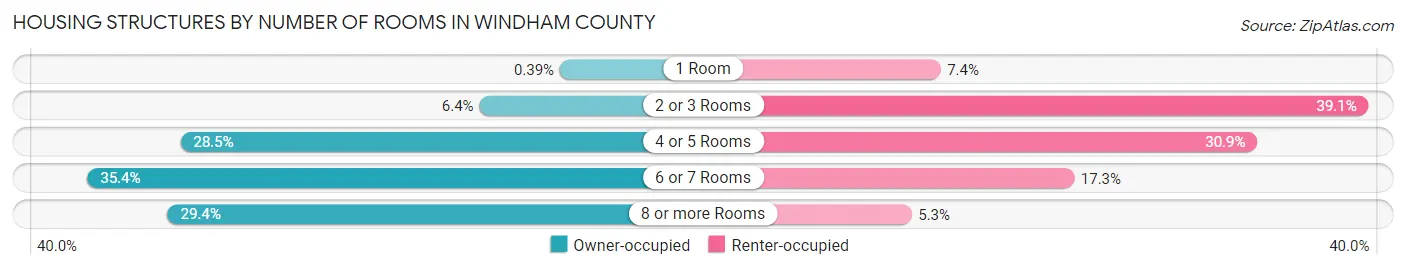
| Number of Rooms | Owner-occupied | Renter-occupied |
| 1 Room | 54 (0.4%) | 406 (7.4%) |
| 2 or 3 Rooms | 883 (6.4%) | 2,140 (39.1%) |
| 4 or 5 Rooms | 3,962 (28.5%) | 1,690 (30.9%) |
| 6 or 7 Rooms | 4,918 (35.4%) | 947 (17.3%) |
| 8 or more Rooms | 4,093 (29.4%) | 289 (5.3%) |
| Total | 13,910 (100.0%) | 5,472 (100.0%) |
Housing Structure by Heating Type in Windham County
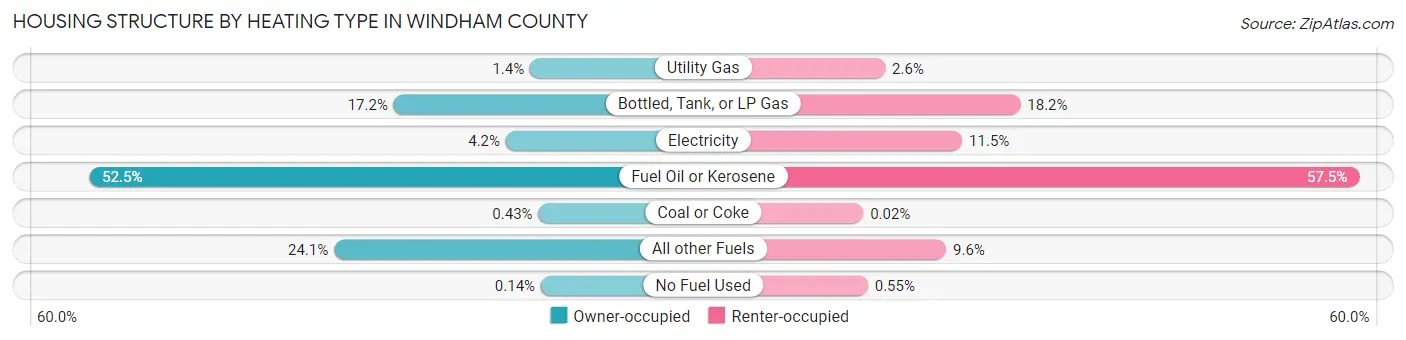
| Heating Type | Owner-occupied | Renter-occupied |
| Utility Gas | 195 (1.4%) | 140 (2.6%) |
| Bottled, Tank, or LP Gas | 2,392 (17.2%) | 998 (18.2%) |
| Electricity | 584 (4.2%) | 629 (11.5%) |
| Fuel Oil or Kerosene | 7,304 (52.5%) | 3,147 (57.5%) |
| Coal or Coke | 60 (0.4%) | 1 (0.0%) |
| All other Fuels | 3,355 (24.1%) | 527 (9.6%) |
| No Fuel Used | 20 (0.1%) | 30 (0.5%) |
| Total | 13,910 (100.0%) | 5,472 (100.0%) |
Household Vehicle Usage in Windham County
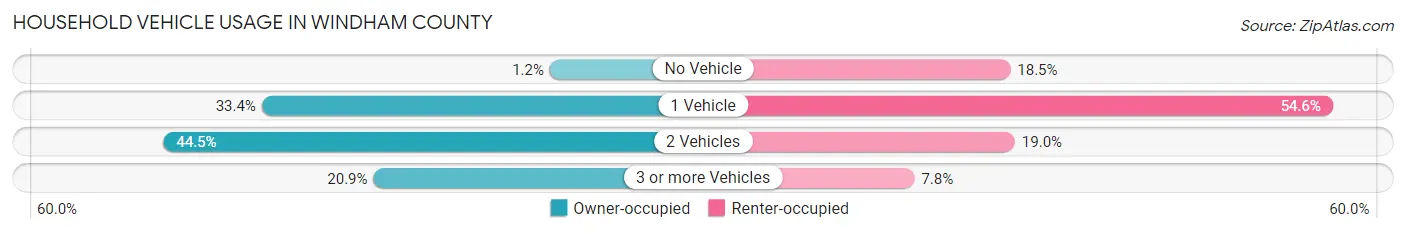
| Vehicles per Household | Owner-occupied | Renter-occupied |
| No Vehicle | 163 (1.2%) | 1,014 (18.5%) |
| 1 Vehicle | 4,652 (33.4%) | 2,990 (54.6%) |
| 2 Vehicles | 6,183 (44.5%) | 1,042 (19.0%) |
| 3 or more Vehicles | 2,912 (20.9%) | 426 (7.8%) |
| Total | 13,910 (100.0%) | 5,472 (100.0%) |
Real Estate & Mortgages in Windham County
Real Estate and Mortgage Overview in Windham County
| Characteristic | Without Mortgage | With Mortgage |
| Housing Units | 5,561 | 8,349 |
| Median Property Value | $255,500 | $246,700 |
| Median Household Income | $66,176 | $1,504 |
| Monthly Housing Costs | $801 | $490 |
| Real Estate Taxes | $4,960 | $69 |
Property Value by Mortgage Status in Windham County
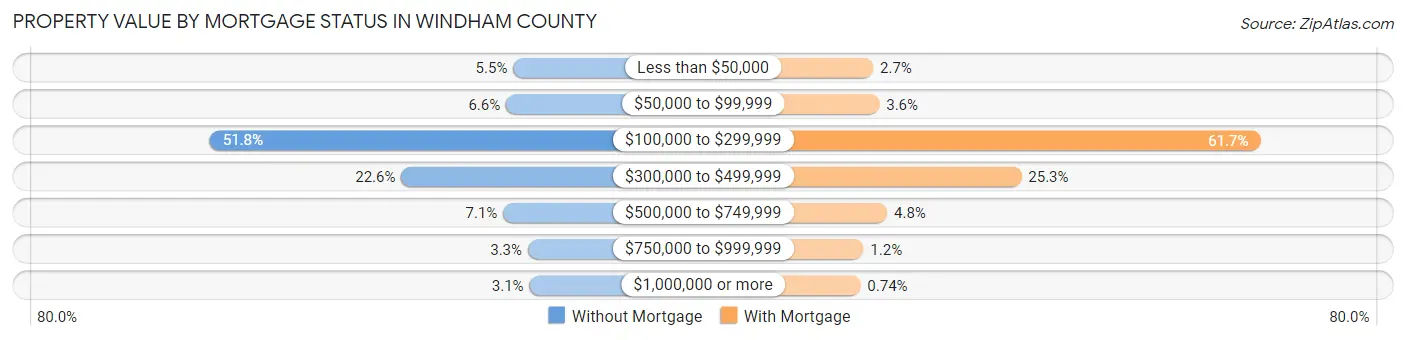
| Property Value | Without Mortgage | With Mortgage |
| Less than $50,000 | 308 (5.5%) | 223 (2.7%) |
| $50,000 to $99,999 | 369 (6.6%) | 302 (3.6%) |
| $100,000 to $299,999 | 2,879 (51.8%) | 5,150 (61.7%) |
| $300,000 to $499,999 | 1,257 (22.6%) | 2,110 (25.3%) |
| $500,000 to $749,999 | 393 (7.1%) | 402 (4.8%) |
| $750,000 to $999,999 | 184 (3.3%) | 100 (1.2%) |
| $1,000,000 or more | 171 (3.1%) | 62 (0.7%) |
| Total | 5,561 (100.0%) | 8,349 (100.0%) |
Household Income by Mortgage Status in Windham County
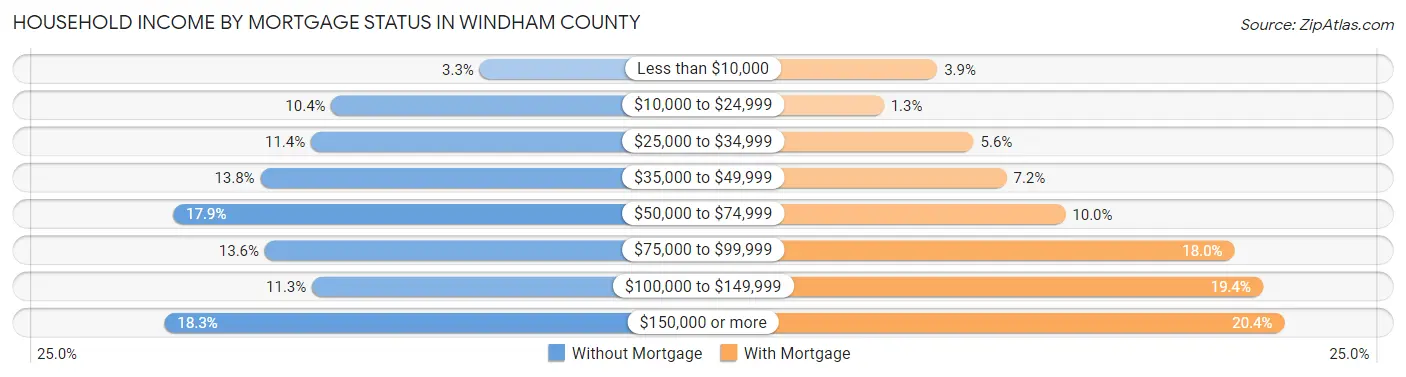
| Household Income | Without Mortgage | With Mortgage |
| Less than $10,000 | 185 (3.3%) | 325 (3.9%) |
| $10,000 to $24,999 | 578 (10.4%) | 112 (1.3%) |
| $25,000 to $34,999 | 632 (11.4%) | 469 (5.6%) |
| $35,000 to $49,999 | 766 (13.8%) | 600 (7.2%) |
| $50,000 to $74,999 | 997 (17.9%) | 834 (10.0%) |
| $75,000 to $99,999 | 754 (13.6%) | 1,506 (18.0%) |
| $100,000 to $149,999 | 629 (11.3%) | 1,619 (19.4%) |
| $150,000 or more | 1,020 (18.3%) | 1,705 (20.4%) |
| Total | 5,561 (100.0%) | 8,349 (100.0%) |
Property Value to Household Income Ratio in Windham County
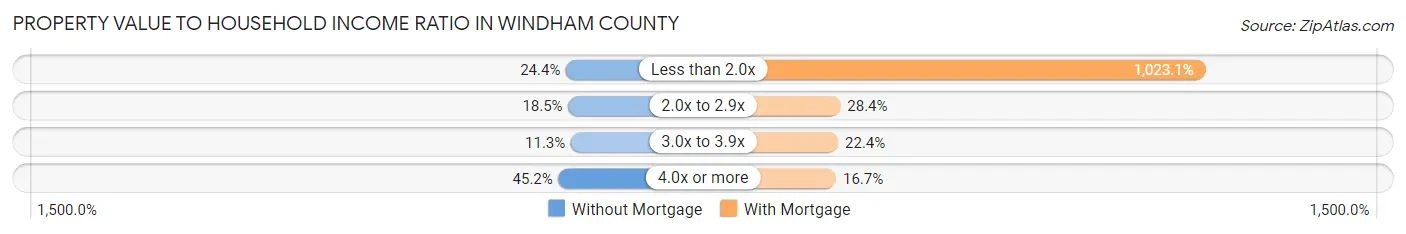
| Value-to-Income Ratio | Without Mortgage | With Mortgage |
| Less than 2.0x | 1,359 (24.4%) | 85,422 (1,023.1%) |
| 2.0x to 2.9x | 1,029 (18.5%) | 2,368 (28.4%) |
| 3.0x to 3.9x | 627 (11.3%) | 1,868 (22.4%) |
| 4.0x or more | 2,514 (45.2%) | 1,395 (16.7%) |
| Total | 5,561 (100.0%) | 8,349 (100.0%) |
Real Estate Taxes by Mortgage Status in Windham County
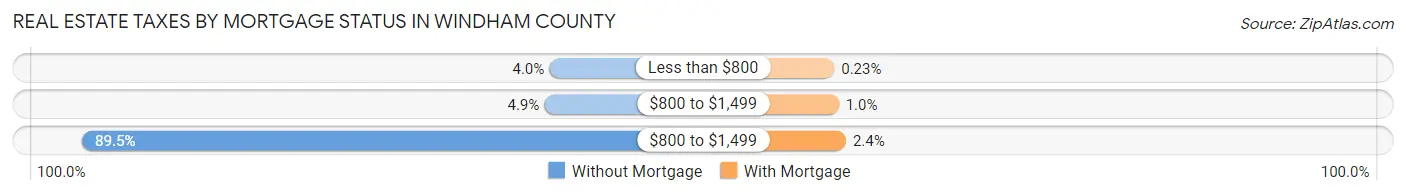
| Property Taxes | Without Mortgage | With Mortgage |
| Less than $800 | 223 (4.0%) | 19 (0.2%) |
| $800 to $1,499 | 274 (4.9%) | 86 (1.0%) |
| $800 to $1,499 | 4,976 (89.5%) | 197 (2.4%) |
| Total | 5,561 (100.0%) | 8,349 (100.0%) |
Health & Disability in Windham County
Health Insurance Coverage by Age in Windham County
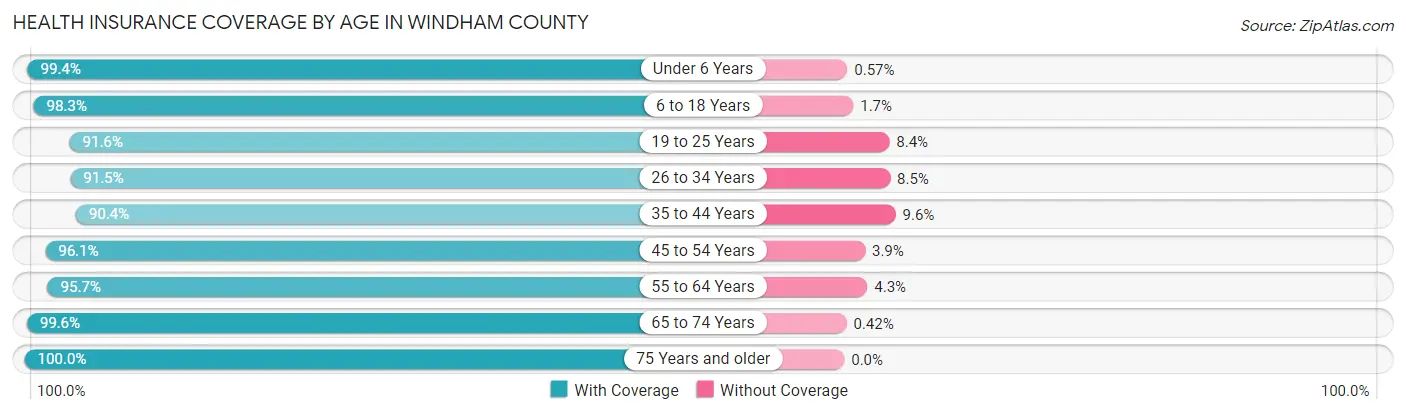
| Age Bracket | With Coverage | Without Coverage |
| Under 6 Years | 2,279 (99.4%) | 13 (0.6%) |
| 6 to 18 Years | 6,016 (98.3%) | 103 (1.7%) |
| 19 to 25 Years | 3,631 (91.6%) | 333 (8.4%) |
| 26 to 34 Years | 3,834 (91.5%) | 358 (8.5%) |
| 35 to 44 Years | 4,660 (90.4%) | 493 (9.6%) |
| 45 to 54 Years | 5,162 (96.1%) | 208 (3.9%) |
| 55 to 64 Years | 7,305 (95.7%) | 328 (4.3%) |
| 65 to 74 Years | 6,865 (99.6%) | 29 (0.4%) |
| 75 Years and older | 3,942 (100.0%) | 0 (0.0%) |
| Total | 43,694 (95.9%) | 1,865 (4.1%) |
Health Insurance Coverage by Citizenship Status in Windham County
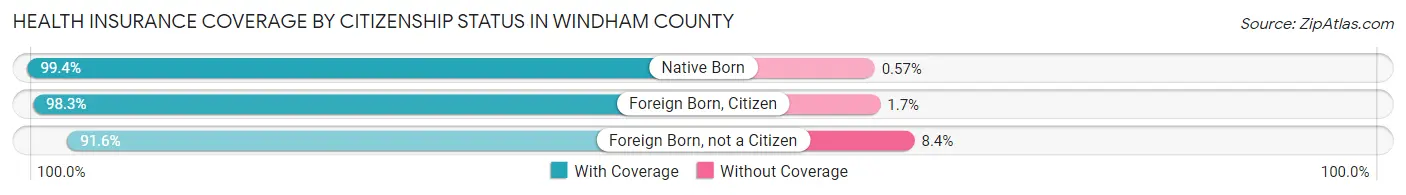
| Citizenship Status | With Coverage | Without Coverage |
| Native Born | 2,279 (99.4%) | 13 (0.6%) |
| Foreign Born, Citizen | 6,016 (98.3%) | 103 (1.7%) |
| Foreign Born, not a Citizen | 3,631 (91.6%) | 333 (8.4%) |
Health Insurance Coverage by Household Income in Windham County
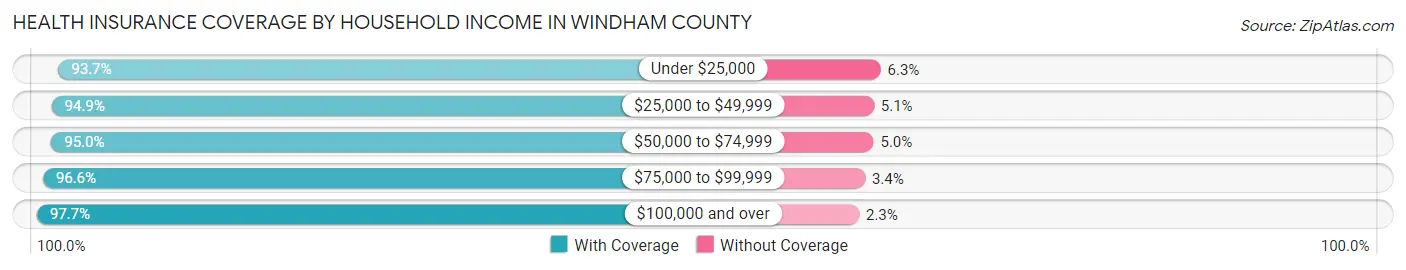
| Household Income | With Coverage | Without Coverage |
| Under $25,000 | 4,618 (93.7%) | 312 (6.3%) |
| $25,000 to $49,999 | 7,299 (94.9%) | 390 (5.1%) |
| $50,000 to $74,999 | 7,581 (95.0%) | 400 (5.0%) |
| $75,000 to $99,999 | 7,026 (96.6%) | 248 (3.4%) |
| $100,000 and over | 15,802 (97.7%) | 370 (2.3%) |
Public vs Private Health Insurance Coverage by Age in Windham County
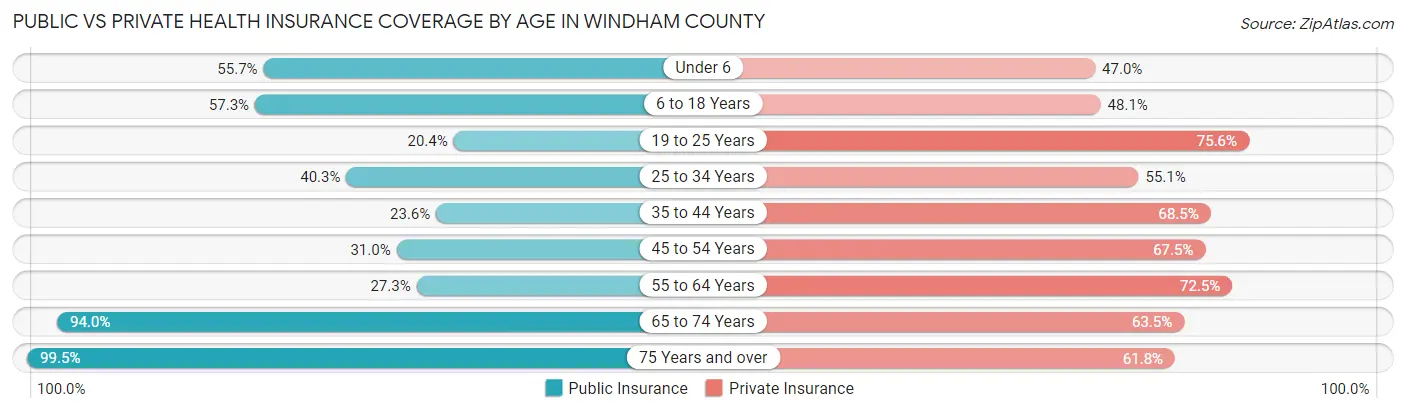
| Age Bracket | Public Insurance | Private Insurance |
| Under 6 | 1,276 (55.7%) | 1,078 (47.0%) |
| 6 to 18 Years | 3,503 (57.3%) | 2,940 (48.0%) |
| 19 to 25 Years | 808 (20.4%) | 2,995 (75.5%) |
| 25 to 34 Years | 1,689 (40.3%) | 2,309 (55.1%) |
| 35 to 44 Years | 1,217 (23.6%) | 3,527 (68.4%) |
| 45 to 54 Years | 1,663 (31.0%) | 3,622 (67.4%) |
| 55 to 64 Years | 2,081 (27.3%) | 5,530 (72.5%) |
| 65 to 74 Years | 6,478 (94.0%) | 4,379 (63.5%) |
| 75 Years and over | 3,923 (99.5%) | 2,437 (61.8%) |
| Total | 22,638 (49.7%) | 28,817 (63.2%) |
Disability Status by Sex by Age in Windham County
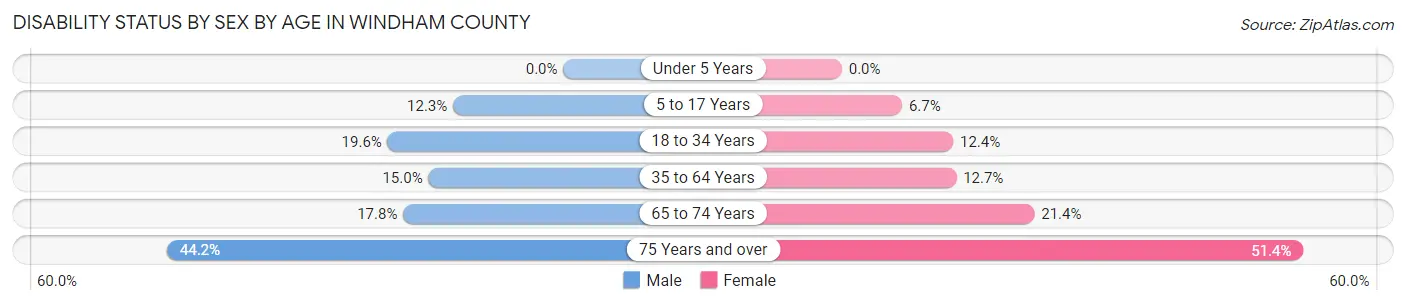
| Age Bracket | Male | Female |
| Under 5 Years | 0 (0.0%) | 0 (0.0%) |
| 5 to 17 Years | 369 (12.3%) | 192 (6.7%) |
| 18 to 34 Years | 918 (19.6%) | 516 (12.4%) |
| 35 to 64 Years | 1,308 (15.0%) | 1,203 (12.7%) |
| 65 to 74 Years | 604 (17.8%) | 752 (21.4%) |
| 75 Years and over | 785 (44.2%) | 1,112 (51.4%) |
Disability Class by Sex by Age in Windham County
Disability Class: Hearing Difficulty
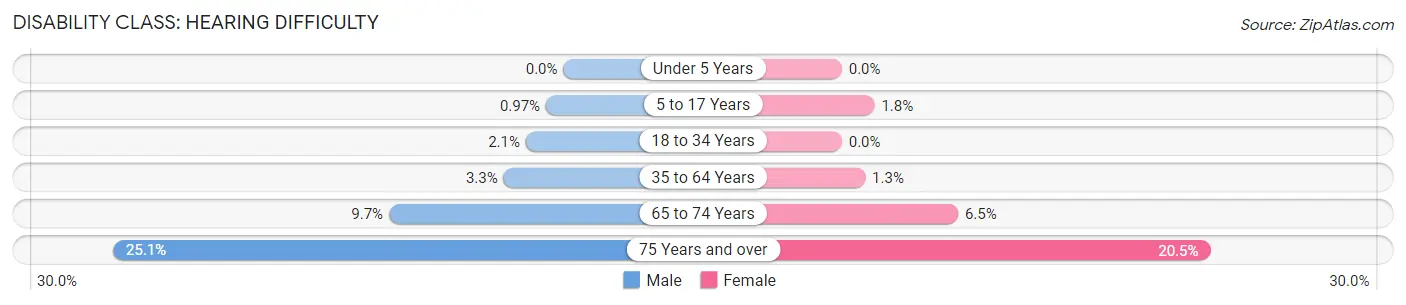
| Age Bracket | Male | Female |
| Under 5 Years | 0 (0.0%) | 0 (0.0%) |
| 5 to 17 Years | 29 (1.0%) | 52 (1.8%) |
| 18 to 34 Years | 98 (2.1%) | 0 (0.0%) |
| 35 to 64 Years | 290 (3.3%) | 123 (1.3%) |
| 65 to 74 Years | 329 (9.7%) | 227 (6.5%) |
| 75 Years and over | 446 (25.1%) | 444 (20.5%) |
Disability Class: Vision Difficulty
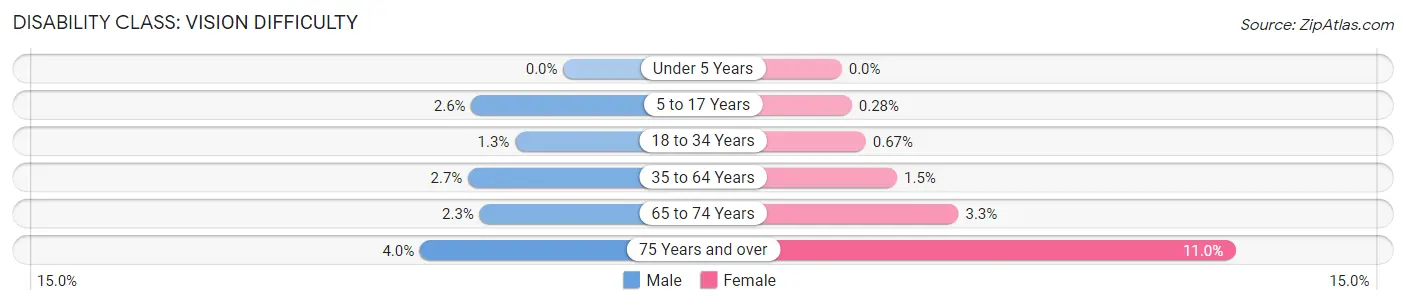
| Age Bracket | Male | Female |
| Under 5 Years | 0 (0.0%) | 0 (0.0%) |
| 5 to 17 Years | 77 (2.6%) | 8 (0.3%) |
| 18 to 34 Years | 63 (1.3%) | 28 (0.7%) |
| 35 to 64 Years | 231 (2.6%) | 145 (1.5%) |
| 65 to 74 Years | 79 (2.3%) | 114 (3.3%) |
| 75 Years and over | 71 (4.0%) | 237 (11.0%) |
Disability Class: Cognitive Difficulty
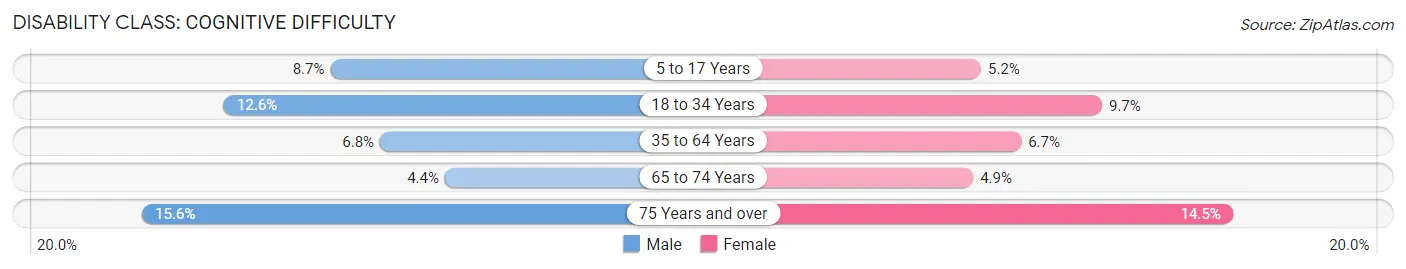
| Age Bracket | Male | Female |
| 5 to 17 Years | 260 (8.6%) | 148 (5.2%) |
| 18 to 34 Years | 591 (12.6%) | 402 (9.7%) |
| 35 to 64 Years | 593 (6.8%) | 629 (6.7%) |
| 65 to 74 Years | 149 (4.4%) | 171 (4.9%) |
| 75 Years and over | 278 (15.6%) | 314 (14.5%) |
Disability Class: Ambulatory Difficulty
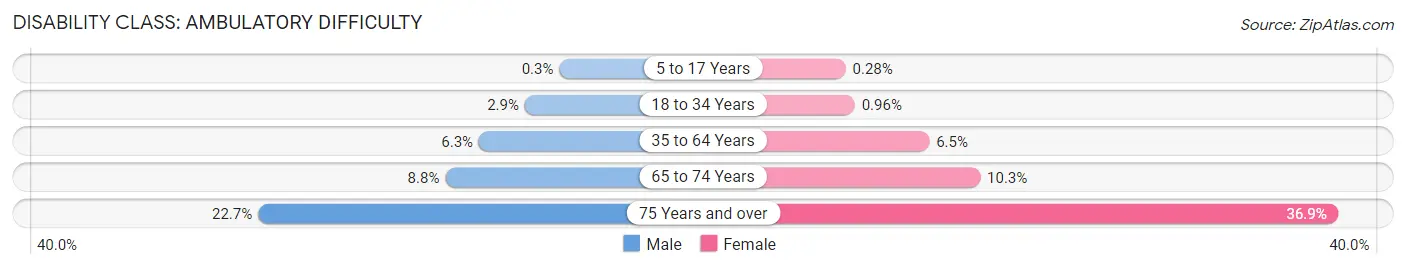
| Age Bracket | Male | Female |
| 5 to 17 Years | 9 (0.3%) | 8 (0.3%) |
| 18 to 34 Years | 134 (2.9%) | 40 (1.0%) |
| 35 to 64 Years | 546 (6.3%) | 613 (6.5%) |
| 65 to 74 Years | 297 (8.8%) | 360 (10.3%) |
| 75 Years and over | 403 (22.7%) | 798 (36.9%) |
Disability Class: Self-Care Difficulty
| Age Bracket | Male | Female |
| 5 to 17 Years | 50 (1.7%) | 14 (0.5%) |
| 18 to 34 Years | 170 (3.6%) | 48 (1.1%) |
| 35 to 64 Years | 229 (2.6%) | 100 (1.1%) |
| 65 to 74 Years | 81 (2.4%) | 134 (3.8%) |
| 75 Years and over | 243 (13.7%) | 240 (11.1%) |
Technology Access in Windham County
Computing Device Access in Windham County
| Device Type | # Households | % Households |
| Desktop or Laptop | 16,254 | 83.9% |
| Smartphone | 15,260 | 78.7% |
| Tablet | 10,963 | 56.6% |
| No Computing Device | 1,361 | 7.0% |
| Total | 19,382 | 100.0% |
Internet Access in Windham County
| Internet Type | # Households | % Households |
| Dial-Up Internet | 166 | 0.9% |
| Broadband Home | 12,416 | 64.1% |
| Cellular Data Only | 1,458 | 7.5% |
| Satellite Internet | 882 | 4.5% |
| No Internet | 4,587 | 23.7% |
| Total | 19,382 | 100.0% |
Windham County Summary
Windham County, Vermont is located in the southeastern corner of the state and is bordered by Massachusetts to the south, New Hampshire to the east, and the Connecticut River to the west. The county is home to a population of approximately 44,000 people, making it the second least populous county in the state. The county seat is the town of Newfane, and the largest city is Brattleboro.
Windham County is known for its rural landscape, with rolling hills, forests, and small towns. The county is home to several state parks, including the Green Mountain National Forest, the Molly Stark State Park, and the Grafton Ponds State Park. The county is also home to several ski resorts, including Stratton Mountain, Bromley Mountain, and Magic Mountain.
The economy of Windham County is largely based on agriculture, tourism, and manufacturing. The county is home to several dairy farms, as well as a number of apple orchards. Tourism is a major industry in the county, with visitors coming to enjoy the outdoor activities, such as skiing, hiking, and camping. Manufacturing is also an important part of the economy, with several companies producing furniture, paper products, and other goods.
The demographics of Windham County are diverse, with a population that is largely white (90.3%), followed by Hispanic (3.3%), African American (2.2%), and Asian (1.2%). The median household income in the county is $50,845, and the median home value is $219,000. The unemployment rate in the county is 4.2%, which is lower than the national average.
Windham County is a beautiful and diverse area of Vermont, with a rich history and a vibrant economy. The county is home to a variety of outdoor activities, as well as a number of businesses and industries. The county is also home to a diverse population, with a variety of backgrounds and cultures. Windham County is a great place to live, work, and play.
Common Questions
What is the Total Population of Windham County?
Total Population of Windham County is 45,857.
What is the Total Male Population of Windham County?
Total Male Population of Windham County is 22,648.
What is the Total Female Population of Windham County?
Total Female Population of Windham County is 23,209.
What is the Ratio of Males per 100 Females in Windham County?
There are 97.58 Males per 100 Females in Windham County.
What is the Ratio of Females per 100 Males in Windham County?
There are 102.48 Females per 100 Males in Windham County.
What is the Median Population Age in Windham County?
Median Population Age in Windham County is 47.0 Years.
What is the Average Family Size in Windham County
Average Family Size in Windham County is 3.0 People.
What is the Average Household Size in Windham County
Average Household Size in Windham County is 2.3 People.
What is Per Capita Income in Windham County?
Per Capita income in Windham County is $40,284.
What is the Median Family Income in Windham County?
Median Family Income in Windham County is $86,291.
What is the Median Household income in Windham County?
Median Household Income in Windham County is $65,473.
What is Income or Wage Gap in Windham County?
Income or Wage Gap in Windham County is 11.2%.
Women in Windham County earn 88.8 cents for every dollar earned by a man.
What is Family Income Deficit in Windham County?
Family Income Deficit in Windham County is $9,423.
Families that are below poverty line in Windham County earn $9,423 less on average than the poverty threshold level.
What is Inequality or Gini Index in Windham County?
Inequality or Gini Index in Windham County is 0.47.
How Large is the Labor Force in Windham County?
There are 24,576 People in the Labor Forcein in Windham County.
What is the Percentage of People in the Labor Force in Windham County?
62.8% of People are in the Labor Force in Windham County.
What is the Unemployment Rate in Windham County?
Unemployment Rate in Windham County is 4.4%.