Washington County, VT
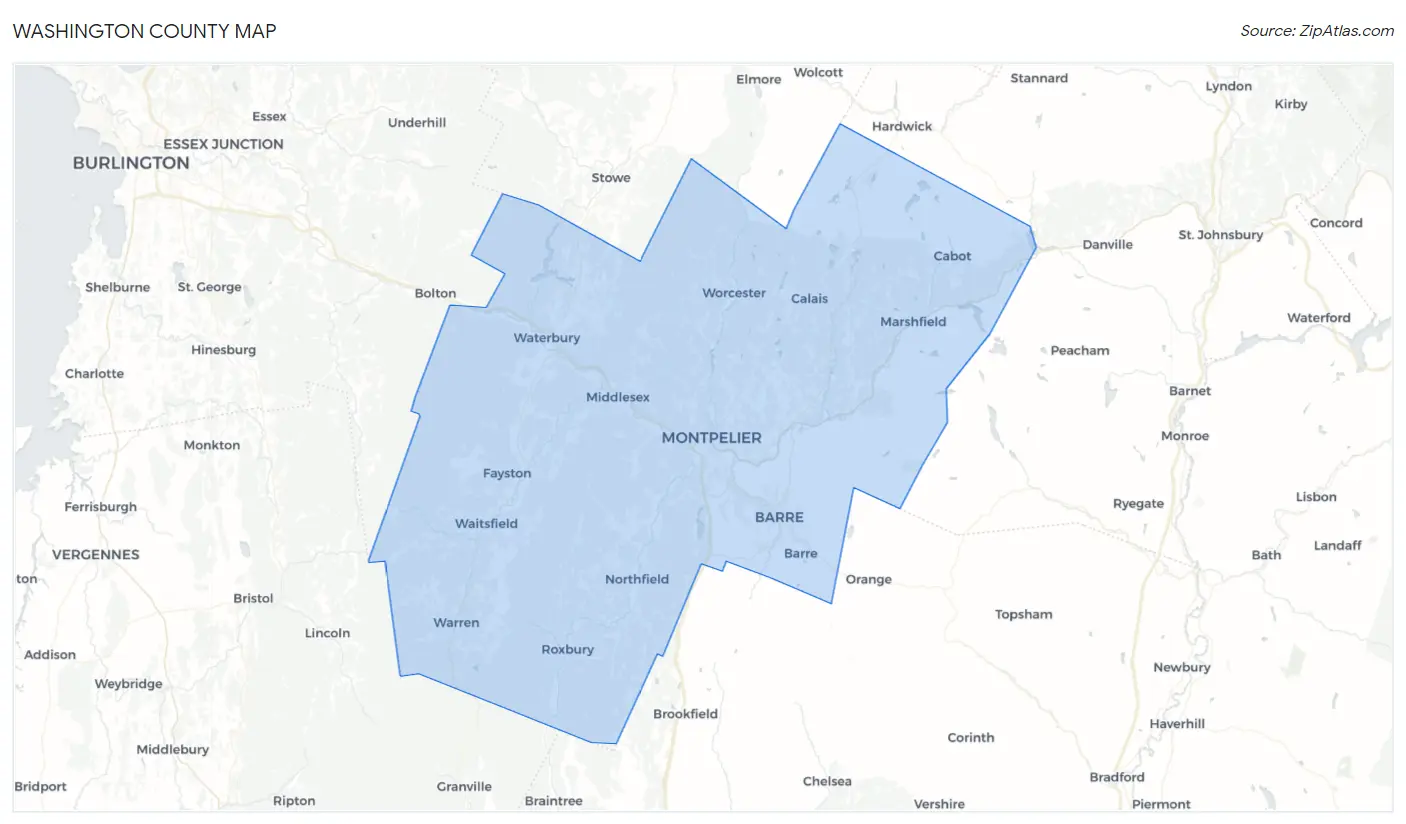
Washington County Map
Washington County Overview
59,768
TOTAL POPULATION
29,775
MALE POPULATION
29,993
FEMALE POPULATION
99.27
MALES / 100 FEMALES
100.73
FEMALES / 100 MALES
43.8
MEDIAN AGE
2.9
AVG FAMILY SIZE
2.3
AVG HOUSEHOLD SIZE
$43,002
PER CAPITA INCOME
$99,315
AVG FAMILY INCOME
$77,278
AVG HOUSEHOLD INCOME
2.3%
WAGE / INCOME GAP [ % ]
97.7¢/ $1
WAGE / INCOME GAP [ $ ]
$11,703
FAMILY INCOME DEFICIT
0.44
INEQUALITY / GINI INDEX
32,501
LABOR FORCE [ PEOPLE ]
64.7%
PERCENT IN LABOR FORCE
3.0%
UNEMPLOYMENT RATE
Washington County Area Codes
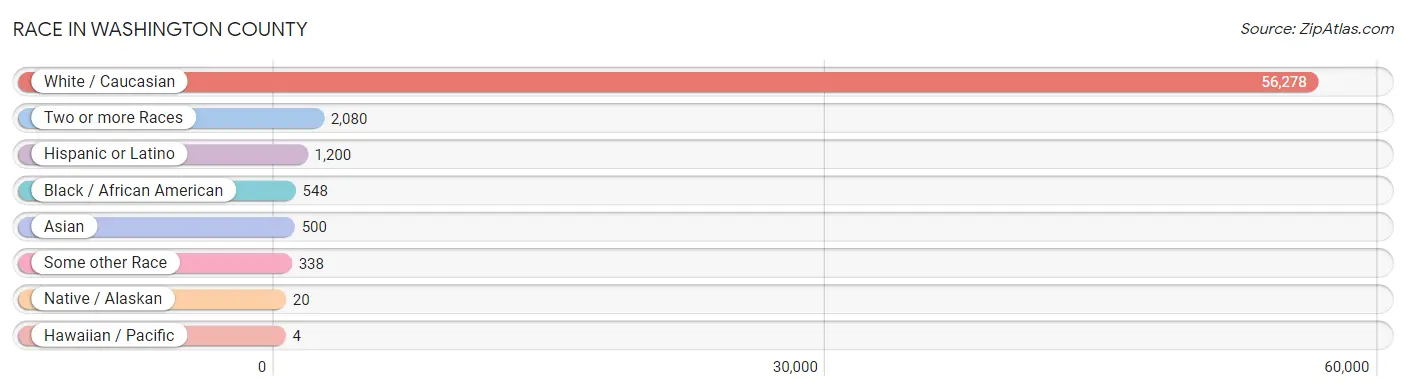
Race in Washington County
The most populous races in Washington County are White / Caucasian (56,278 | 94.2%), Two or more Races (2,080 | 3.5%), and Hispanic or Latino (1,200 | 2.0%).
| Race | # Population | % Population |
| Asian | 500 | 0.8% |
| Black / African American | 548 | 0.9% |
| Hawaiian / Pacific | 4 | 0.0% |
| Hispanic or Latino | 1,200 | 2.0% |
| Native / Alaskan | 20 | 0.0% |
| White / Caucasian | 56,278 | 94.2% |
| Two or more Races | 2,080 | 3.5% |
| Some other Race | 338 | 0.6% |
| Total | 59,768 | 100.0% |
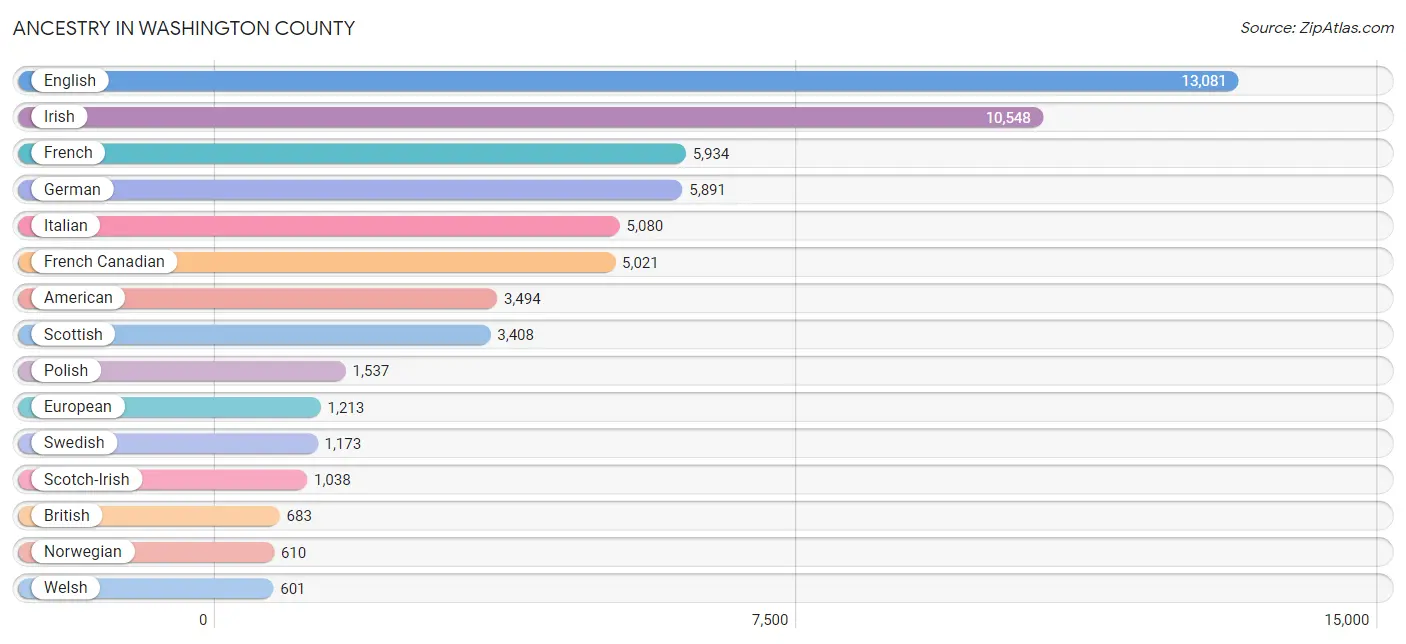
Ancestry in Washington County
The most populous ancestries reported in Washington County are English (13,081 | 21.9%), Irish (10,548 | 17.6%), French (5,934 | 9.9%), German (5,891 | 9.9%), and Italian (5,080 | 8.5%), together accounting for 67.8% of all Washington County residents.
| Ancestry | # Population | % Population |
| African | 19 | 0.0% |
| American | 3,494 | 5.9% |
| Apache | 7 | 0.0% |
| Arab | 194 | 0.3% |
| Armenian | 119 | 0.2% |
| Assyrian / Chaldean / Syriac | 5 | 0.0% |
| Australian | 11 | 0.0% |
| Austrian | 275 | 0.5% |
| Barbadian | 11 | 0.0% |
| Belgian | 8 | 0.0% |
| Bhutanese | 153 | 0.3% |
| Blackfeet | 12 | 0.0% |
| Brazilian | 2 | 0.0% |
| British | 683 | 1.1% |
| Bulgarian | 39 | 0.1% |
| Burmese | 109 | 0.2% |
| Cajun | 4 | 0.0% |
| Canadian | 295 | 0.5% |
| Cape Verdean | 2 | 0.0% |
| Celtic | 85 | 0.1% |
| Central American | 39 | 0.1% |
| Central American Indian | 12 | 0.0% |
| Cherokee | 33 | 0.1% |
| Chilean | 16 | 0.0% |
| Chippewa | 6 | 0.0% |
| Choctaw | 12 | 0.0% |
| Colombian | 39 | 0.1% |
| Croatian | 31 | 0.1% |
| Cuban | 40 | 0.1% |
| Czech | 85 | 0.1% |
| Czechoslovakian | 39 | 0.1% |
| Danish | 212 | 0.4% |
| Dominican | 7 | 0.0% |
| Dutch | 475 | 0.8% |
| Eastern European | 449 | 0.7% |
| Ecuadorian | 30 | 0.1% |
| English | 13,081 | 21.9% |
| Ethiopian | 15 | 0.0% |
| European | 1,213 | 2.0% |
| Finnish | 189 | 0.3% |
| French | 5,934 | 9.9% |
| French American Indian | 23 | 0.0% |
| French Canadian | 5,021 | 8.4% |
| German | 5,891 | 9.9% |
| Greek | 328 | 0.5% |
| Haitian | 47 | 0.1% |
| Honduran | 4 | 0.0% |
| Hungarian | 307 | 0.5% |
| Icelander | 10 | 0.0% |
| Indian (Asian) | 155 | 0.3% |
| Iranian | 22 | 0.0% |
| Irish | 10,548 | 17.6% |
| Iroquois | 16 | 0.0% |
| Israeli | 56 | 0.1% |
| Italian | 5,080 | 8.5% |
| Jamaican | 22 | 0.0% |
| Korean | 122 | 0.2% |
| Laotian | 11 | 0.0% |
| Latvian | 42 | 0.1% |
| Lebanese | 160 | 0.3% |
| Lithuanian | 329 | 0.5% |
| Maltese | 21 | 0.0% |
| Mexican | 370 | 0.6% |
| Moroccan | 10 | 0.0% |
| Native Hawaiian | 4 | 0.0% |
| Navajo | 8 | 0.0% |
| New Zealander | 6 | 0.0% |
| Nicaraguan | 4 | 0.0% |
| Northern European | 118 | 0.2% |
| Norwegian | 610 | 1.0% |
| Pakistani | 36 | 0.1% |
| Pennsylvania German | 14 | 0.0% |
| Peruvian | 12 | 0.0% |
| Polish | 1,537 | 2.6% |
| Portuguese | 149 | 0.3% |
| Puerto Rican | 147 | 0.3% |
| Romanian | 34 | 0.1% |
| Russian | 483 | 0.8% |
| Salvadoran | 31 | 0.1% |
| Scandinavian | 141 | 0.2% |
| Scotch-Irish | 1,038 | 1.7% |
| Scottish | 3,408 | 5.7% |
| Serbian | 16 | 0.0% |
| Shoshone | 19 | 0.0% |
| Slavic | 21 | 0.0% |
| Slovak | 108 | 0.2% |
| Slovene | 3 | 0.0% |
| South American | 97 | 0.2% |
| Spaniard | 221 | 0.4% |
| Spanish | 104 | 0.2% |
| Sri Lankan | 29 | 0.1% |
| Subsaharan African | 75 | 0.1% |
| Swedish | 1,173 | 2.0% |
| Swiss | 212 | 0.4% |
| Syrian | 12 | 0.0% |
| Thai | 161 | 0.3% |
| Turkish | 5 | 0.0% |
| Ukrainian | 103 | 0.2% |
| Vietnamese | 3 | 0.0% |
| Welsh | 601 | 1.0% |
| Yugoslavian | 74 | 0.1% | View All 101 Rows |
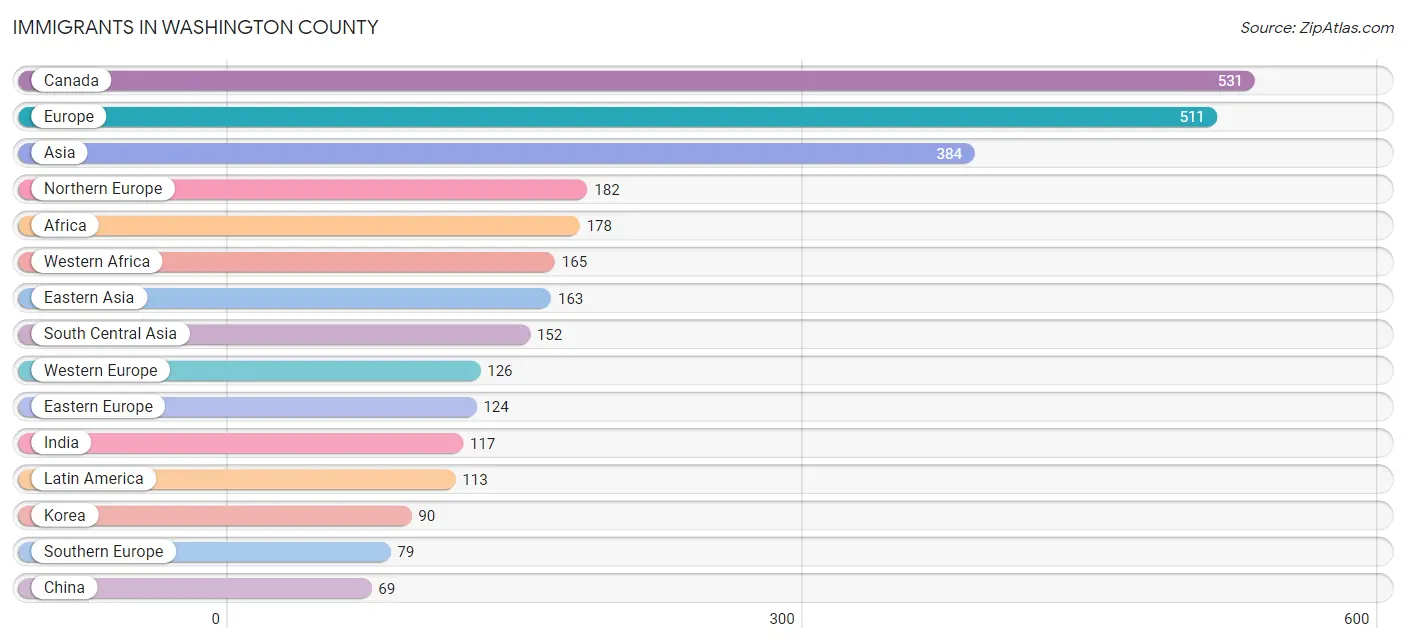
Immigrants in Washington County
The most numerous immigrant groups reported in Washington County came from Canada (531 | 0.9%), Europe (511 | 0.9%), Asia (384 | 0.6%), Northern Europe (182 | 0.3%), and Africa (178 | 0.3%), together accounting for 3.0% of all Washington County residents.
| Immigration Origin | # Population | % Population |
| Africa | 178 | 0.3% |
| Asia | 384 | 0.6% |
| Austria | 29 | 0.1% |
| Barbados | 11 | 0.0% |
| Bosnia and Herzegovina | 42 | 0.1% |
| Brazil | 2 | 0.0% |
| Canada | 531 | 0.9% |
| Caribbean | 48 | 0.1% |
| Central America | 26 | 0.0% |
| Chile | 1 | 0.0% |
| China | 69 | 0.1% |
| Colombia | 18 | 0.0% |
| Cuba | 3 | 0.0% |
| Denmark | 16 | 0.0% |
| Dominican Republic | 7 | 0.0% |
| Eastern Africa | 5 | 0.0% |
| Eastern Asia | 163 | 0.3% |
| Eastern Europe | 124 | 0.2% |
| Egypt | 2 | 0.0% |
| El Salvador | 6 | 0.0% |
| England | 36 | 0.1% |
| Ethiopia | 5 | 0.0% |
| Europe | 511 | 0.9% |
| France | 22 | 0.0% |
| Germany | 40 | 0.1% |
| Guyana | 8 | 0.0% |
| Haiti | 5 | 0.0% |
| Hong Kong | 17 | 0.0% |
| India | 117 | 0.2% |
| Iraq | 5 | 0.0% |
| Ireland | 7 | 0.0% |
| Israel | 3 | 0.0% |
| Italy | 46 | 0.1% |
| Jamaica | 22 | 0.0% |
| Japan | 4 | 0.0% |
| Kazakhstan | 4 | 0.0% |
| Korea | 90 | 0.2% |
| Latin America | 113 | 0.2% |
| Latvia | 3 | 0.0% |
| Lithuania | 3 | 0.0% |
| Malaysia | 9 | 0.0% |
| Mexico | 16 | 0.0% |
| Morocco | 6 | 0.0% |
| Netherlands | 8 | 0.0% |
| Nicaragua | 4 | 0.0% |
| Northern Africa | 8 | 0.0% |
| Northern Europe | 182 | 0.3% |
| Peru | 10 | 0.0% |
| Philippines | 41 | 0.1% |
| Poland | 22 | 0.0% |
| Romania | 9 | 0.0% |
| Russia | 45 | 0.1% |
| Scotland | 19 | 0.0% |
| South America | 39 | 0.1% |
| South Central Asia | 152 | 0.3% |
| South Eastern Asia | 61 | 0.1% |
| Southern Europe | 79 | 0.1% |
| Spain | 33 | 0.1% |
| Sri Lanka | 26 | 0.0% |
| Switzerland | 27 | 0.1% |
| Taiwan | 15 | 0.0% |
| Thailand | 11 | 0.0% |
| Uzbekistan | 5 | 0.0% |
| Western Africa | 165 | 0.3% |
| Western Asia | 8 | 0.0% |
| Western Europe | 126 | 0.2% | View All 66 Rows |
Sex and Age in Washington County
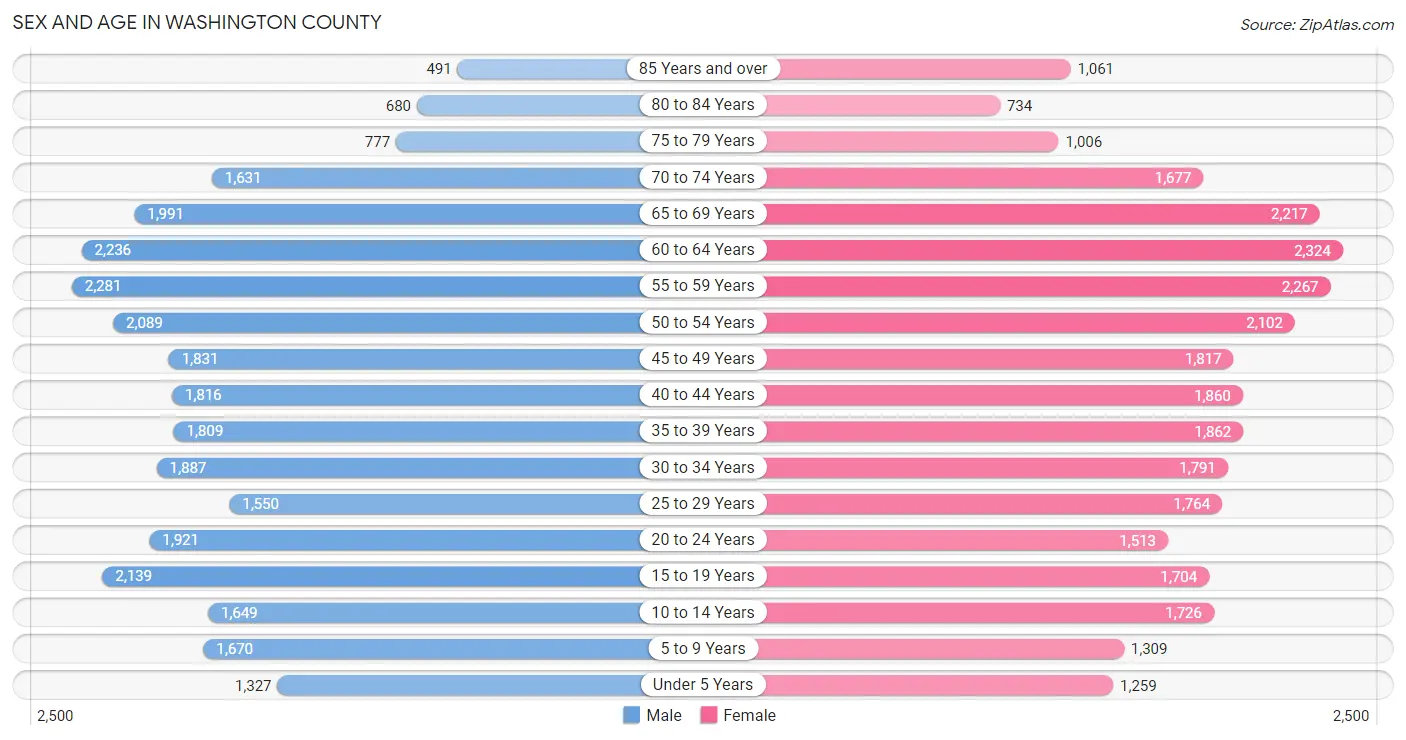
Sex and Age in Washington County
The most populous age groups in Washington County are 55 to 59 Years (2,281 | 7.7%) for men and 60 to 64 Years (2,324 | 7.7%) for women.
| Age Bracket | Male | Female |
| Under 5 Years | 1,327 (4.5%) | 1,259 (4.2%) |
| 5 to 9 Years | 1,670 (5.6%) | 1,309 (4.4%) |
| 10 to 14 Years | 1,649 (5.5%) | 1,726 (5.8%) |
| 15 to 19 Years | 2,139 (7.2%) | 1,704 (5.7%) |
| 20 to 24 Years | 1,921 (6.5%) | 1,513 (5.0%) |
| 25 to 29 Years | 1,550 (5.2%) | 1,764 (5.9%) |
| 30 to 34 Years | 1,887 (6.3%) | 1,791 (6.0%) |
| 35 to 39 Years | 1,809 (6.1%) | 1,862 (6.2%) |
| 40 to 44 Years | 1,816 (6.1%) | 1,860 (6.2%) |
| 45 to 49 Years | 1,831 (6.1%) | 1,817 (6.1%) |
| 50 to 54 Years | 2,089 (7.0%) | 2,102 (7.0%) |
| 55 to 59 Years | 2,281 (7.7%) | 2,267 (7.6%) |
| 60 to 64 Years | 2,236 (7.5%) | 2,324 (7.7%) |
| 65 to 69 Years | 1,991 (6.7%) | 2,217 (7.4%) |
| 70 to 74 Years | 1,631 (5.5%) | 1,677 (5.6%) |
| 75 to 79 Years | 777 (2.6%) | 1,006 (3.4%) |
| 80 to 84 Years | 680 (2.3%) | 734 (2.5%) |
| 85 Years and over | 491 (1.7%) | 1,061 (3.5%) |
| Total | 29,775 (100.0%) | 29,993 (100.0%) |
Families and Households in Washington County
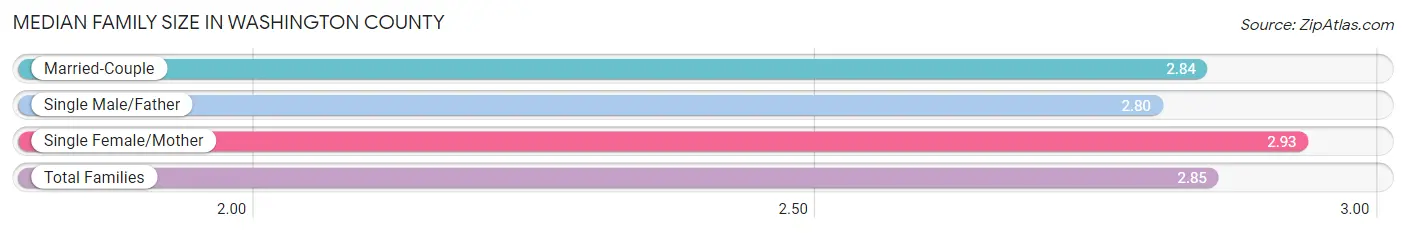
Median Family Size in Washington County
The median family size in Washington County is 2.85 persons per family, with single female/mother families (2,412 | 16.1%) accounting for the largest median family size of 2.93 persons per family. On the other hand, single male/father families (1,149 | 7.7%) represent the smallest median family size with 2.80 persons per family.
| Family Type | # Families | Family Size |
| Married-Couple | 11,415 (76.2%) | 2.84 |
| Single Male/Father | 1,149 (7.7%) | 2.80 |
| Single Female/Mother | 2,412 (16.1%) | 2.93 |
| Total Families | 14,976 (100.0%) | 2.85 |
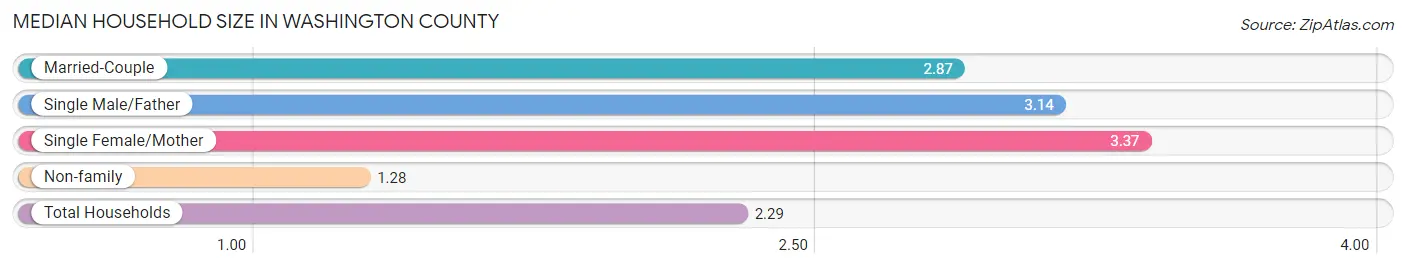
Median Household Size in Washington County
The median household size in Washington County is 2.29 persons per household, with single female/mother households (2,412 | 9.6%) accounting for the largest median household size of 3.37 persons per household. non-family households (10,190 | 40.5%) represent the smallest median household size with 1.28 persons per household.
| Household Type | # Households | Household Size |
| Married-Couple | 11,415 (45.4%) | 2.87 |
| Single Male/Father | 1,149 (4.6%) | 3.14 |
| Single Female/Mother | 2,412 (9.6%) | 3.37 |
| Non-family | 10,190 (40.5%) | 1.28 |
| Total Households | 25,166 (100.0%) | 2.29 |
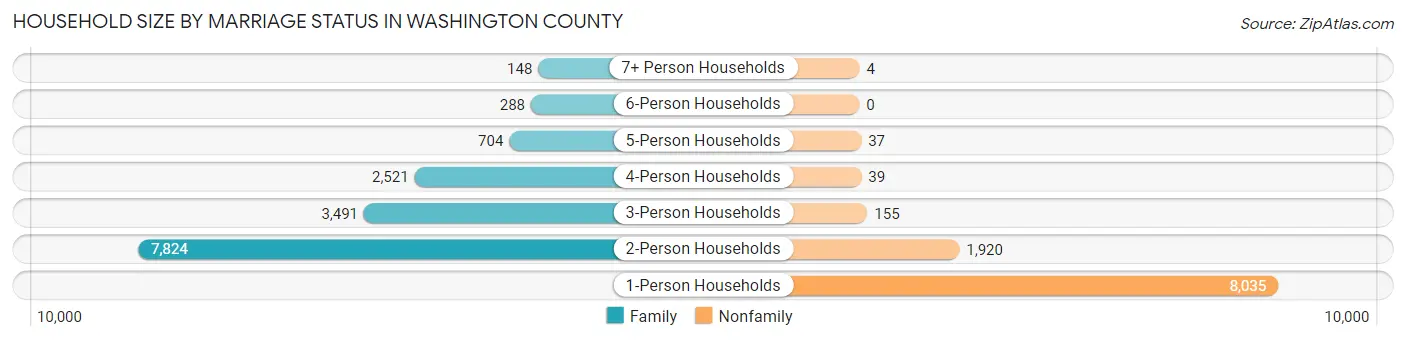
Household Size by Marriage Status in Washington County
Out of a total of 25,166 households in Washington County, 14,976 (59.5%) are family households, while 10,190 (40.5%) are nonfamily households. The most numerous type of family households are 2-person households, comprising 7,824, and the most common type of nonfamily households are 1-person households, comprising 8,035.
| Household Size | Family Households | Nonfamily Households |
| 1-Person Households | - | 8,035 (31.9%) |
| 2-Person Households | 7,824 (31.1%) | 1,920 (7.6%) |
| 3-Person Households | 3,491 (13.9%) | 155 (0.6%) |
| 4-Person Households | 2,521 (10.0%) | 39 (0.2%) |
| 5-Person Households | 704 (2.8%) | 37 (0.2%) |
| 6-Person Households | 288 (1.1%) | 0 (0.0%) |
| 7+ Person Households | 148 (0.6%) | 4 (0.0%) |
| Total | 14,976 (59.5%) | 10,190 (40.5%) |
Female Fertility in Washington County
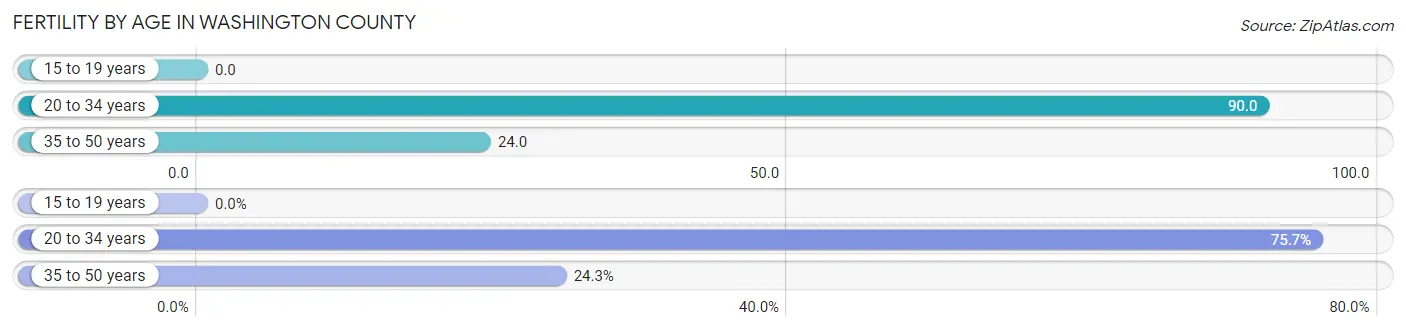
Fertility by Age in Washington County
Average fertility rate in Washington County is 47.0 births per 1,000 women. Women in the age bracket of 20 to 34 years have the highest fertility rate with 90.0 births per 1,000 women. Women in the age bracket of 20 to 34 years acount for 75.7% of all women with births.
| Age Bracket | Women with Births | Births / 1,000 Women |
| 15 to 19 years | 0 (0.0%) | 0.0 |
| 20 to 34 years | 457 (75.7%) | 90.0 |
| 35 to 50 years | 147 (24.3%) | 24.0 |
| Total | 604 (100.0%) | 47.0 |
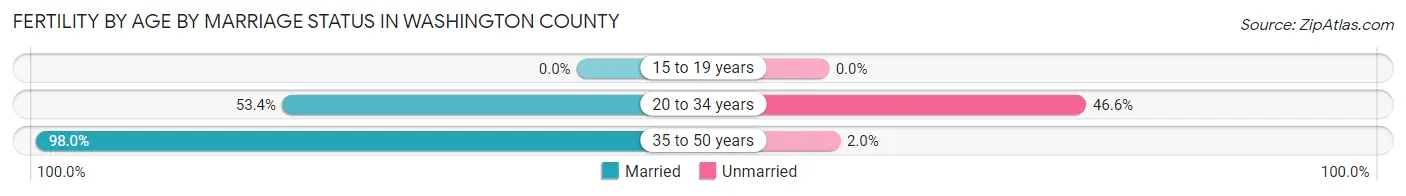
Fertility by Age by Marriage Status in Washington County
64.2% of women with births (604) in Washington County are married. The highest percentage of unmarried women with births falls into 20 to 34 years age bracket with 46.6% of them unmarried at the time of birth, while the lowest percentage of unmarried women with births belong to 35 to 50 years age bracket with 2.0% of them unmarried.
| Age Bracket | Married | Unmarried |
| 15 to 19 years | 0 (0.0%) | 0 (0.0%) |
| 20 to 34 years | 244 (53.4%) | 213 (46.6%) |
| 35 to 50 years | 144 (98.0%) | 3 (2.0%) |
| Total | 388 (64.2%) | 216 (35.8%) |
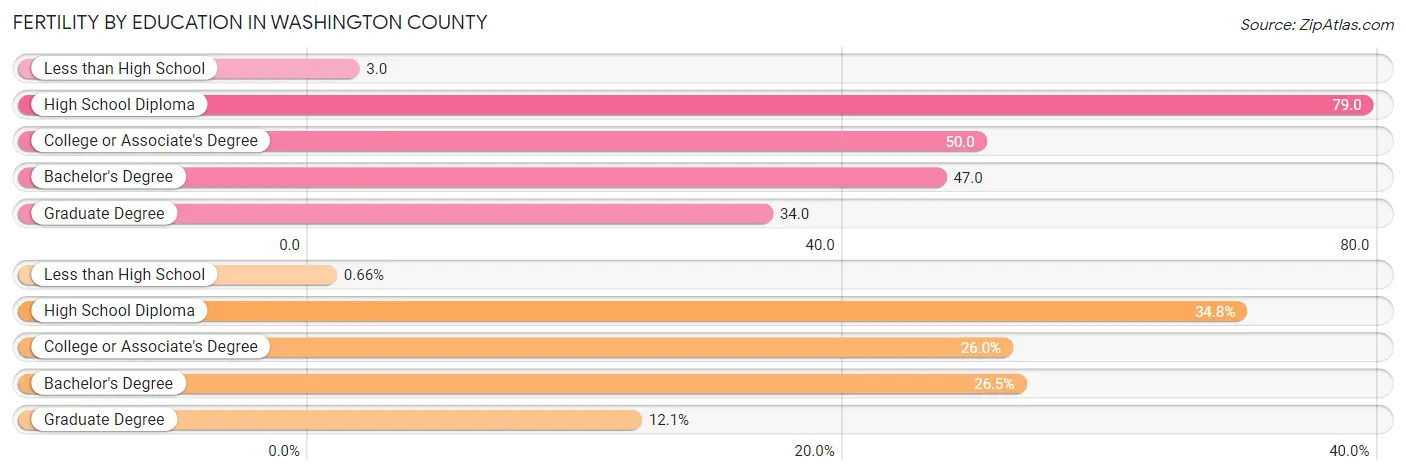
Fertility by Education in Washington County
Average fertility rate in Washington County is 47.0 births per 1,000 women. Women with the education attainment of high school diploma have the highest fertility rate of 79.0 births per 1,000 women, while women with the education attainment of less than high school have the lowest fertility at 3.0 births per 1,000 women. Women with the education attainment of high school diploma represent 34.8% of all women with births.
| Educational Attainment | Women with Births | Births / 1,000 Women |
| Less than High School | 4 (0.7%) | 3.0 |
| High School Diploma | 210 (34.8%) | 79.0 |
| College or Associate's Degree | 157 (26.0%) | 50.0 |
| Bachelor's Degree | 160 (26.5%) | 47.0 |
| Graduate Degree | 73 (12.1%) | 34.0 |
| Total | 604 (100.0%) | 47.0 |
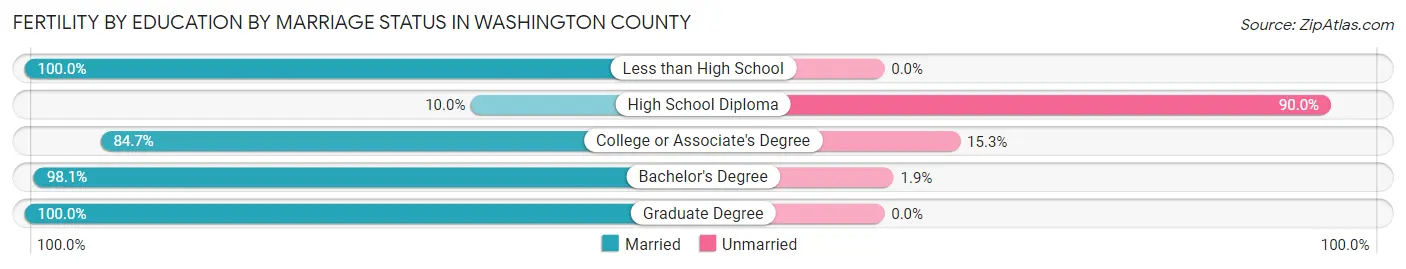
Fertility by Education by Marriage Status in Washington County
35.8% of women with births in Washington County are unmarried. Women with the educational attainment of less than high school are most likely to be married with 100.0% of them married at childbirth, while women with the educational attainment of high school diploma are least likely to be married with 90.0% of them unmarried at childbirth.
| Educational Attainment | Married | Unmarried |
| Less than High School | 4 (100.0%) | 0 (0.0%) |
| High School Diploma | 21 (10.0%) | 189 (90.0%) |
| College or Associate's Degree | 133 (84.7%) | 24 (15.3%) |
| Bachelor's Degree | 157 (98.1%) | 3 (1.9%) |
| Graduate Degree | 73 (100.0%) | 0 (0.0%) |
| Total | 388 (64.2%) | 216 (35.8%) |
Income in Washington County
Income Overview in Washington County
Per Capita Income in Washington County is $43,002, while median incomes of families and households are $99,315 and $77,278 respectively.
| Characteristic | Number | Measure |
| Per Capita Income | 59,768 | $43,002 |
| Median Family Income | 14,976 | $99,315 |
| Mean Family Income | 14,976 | $119,837 |
| Median Household Income | 25,166 | $77,278 |
| Mean Household Income | 25,166 | $98,630 |
| Income Deficit | 14,976 | $11,703 |
| Wage / Income Gap (%) | 59,768 | 2.31% |
| Wage / Income Gap ($) | 59,768 | 97.69¢ per $1 |
| Gini / Inequality Index | 59,768 | 0.44 |
Earnings by Sex in Washington County
Average Earnings in Washington County are $44,997, $45,515 for men and $44,465 for women, a difference of 2.3%.
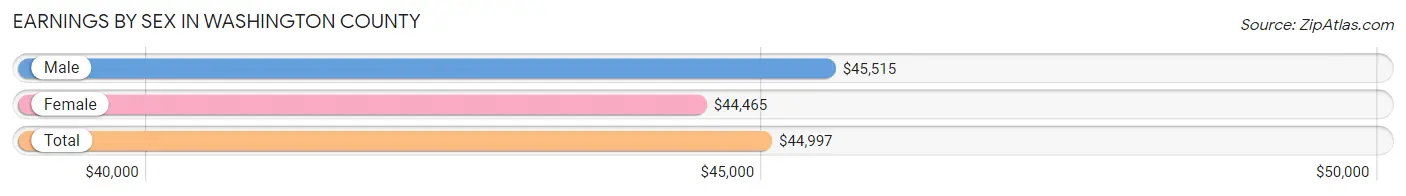
| Sex | Number | Average Earnings |
| Male | 17,955 (51.9%) | $45,515 |
| Female | 16,656 (48.1%) | $44,465 |
| Total | 34,611 (100.0%) | $44,997 |
Earnings by Sex by Income Bracket in Washington County
The most common earnings brackets in Washington County are $100,000+ for men (2,258 | 12.6%) and $55,000 to $64,999 for women (1,961 | 11.8%).
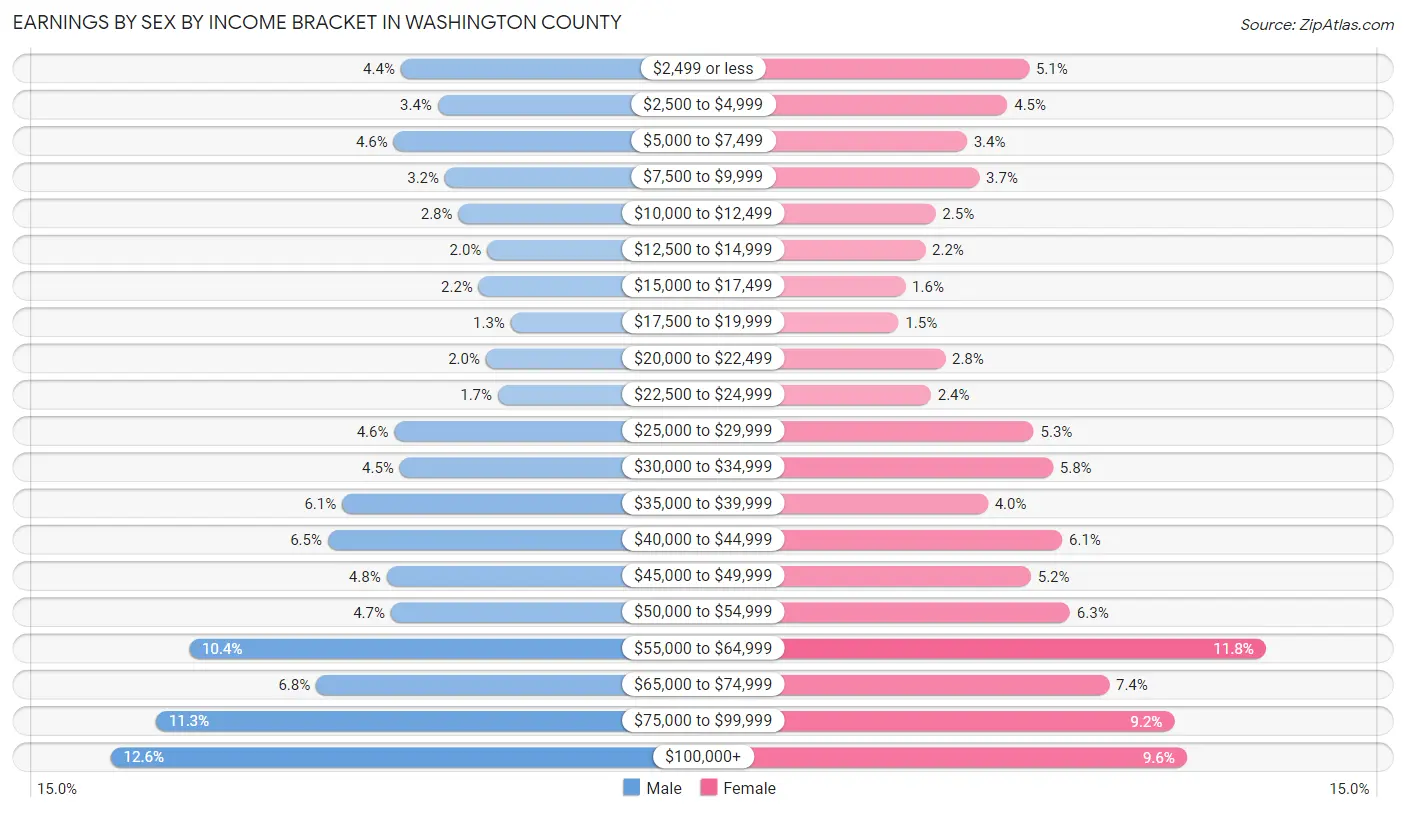
| Income | Male | Female |
| $2,499 or less | 795 (4.4%) | 852 (5.1%) |
| $2,500 to $4,999 | 609 (3.4%) | 752 (4.5%) |
| $5,000 to $7,499 | 832 (4.6%) | 562 (3.4%) |
| $7,500 to $9,999 | 572 (3.2%) | 620 (3.7%) |
| $10,000 to $12,499 | 505 (2.8%) | 414 (2.5%) |
| $12,500 to $14,999 | 359 (2.0%) | 366 (2.2%) |
| $15,000 to $17,499 | 402 (2.2%) | 273 (1.6%) |
| $17,500 to $19,999 | 240 (1.3%) | 241 (1.5%) |
| $20,000 to $22,499 | 366 (2.0%) | 459 (2.8%) |
| $22,500 to $24,999 | 305 (1.7%) | 393 (2.4%) |
| $25,000 to $29,999 | 828 (4.6%) | 875 (5.2%) |
| $30,000 to $34,999 | 801 (4.5%) | 964 (5.8%) |
| $35,000 to $39,999 | 1,091 (6.1%) | 659 (4.0%) |
| $40,000 to $44,999 | 1,164 (6.5%) | 1,008 (6.0%) |
| $45,000 to $49,999 | 868 (4.8%) | 861 (5.2%) |
| $50,000 to $54,999 | 845 (4.7%) | 1,044 (6.3%) |
| $55,000 to $64,999 | 1,863 (10.4%) | 1,961 (11.8%) |
| $65,000 to $74,999 | 1,222 (6.8%) | 1,228 (7.4%) |
| $75,000 to $99,999 | 2,030 (11.3%) | 1,533 (9.2%) |
| $100,000+ | 2,258 (12.6%) | 1,591 (9.6%) |
| Total | 17,955 (100.0%) | 16,656 (100.0%) |
Earnings by Sex by Educational Attainment in Washington County
Average earnings in Washington County are $52,649 for men and $50,155 for women, a difference of 4.7%. Men with an educational attainment of graduate degree enjoy the highest average annual earnings of $80,966, while those with high school diploma education earn the least with $43,317. Women with an educational attainment of graduate degree earn the most with the average annual earnings of $62,970, while those with less than high school education have the smallest earnings of $23,800.
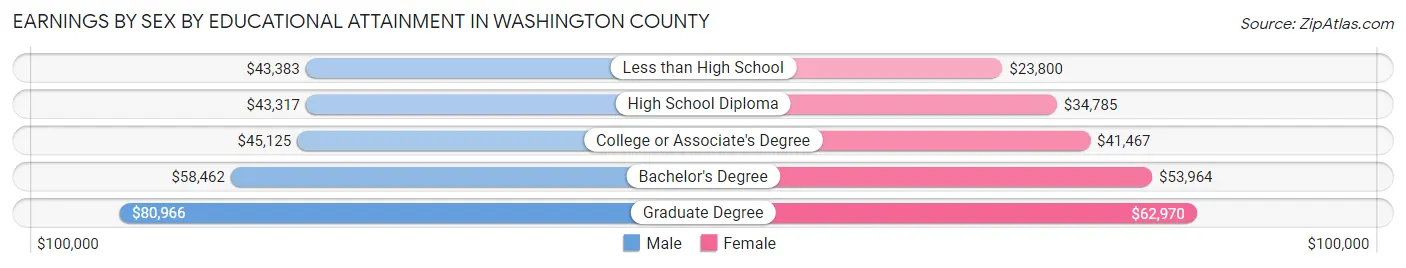
| Educational Attainment | Male Income | Female Income |
| Less than High School | $43,383 | $23,800 |
| High School Diploma | $43,317 | $34,785 |
| College or Associate's Degree | $45,125 | $41,467 |
| Bachelor's Degree | $58,462 | $53,964 |
| Graduate Degree | $80,966 | $62,970 |
| Total | $52,649 | $50,155 |
Family Income in Washington County
Family Income Brackets in Washington County
According to the Washington County family income data, there are 3,774 families falling into the $100,000 to $149,999 income range, which is the most common income bracket and makes up 25.2% of all families. Conversely, the $10,000 to $14,999 income bracket is the least frequent group with only 240 families (1.6%) belonging to this category.
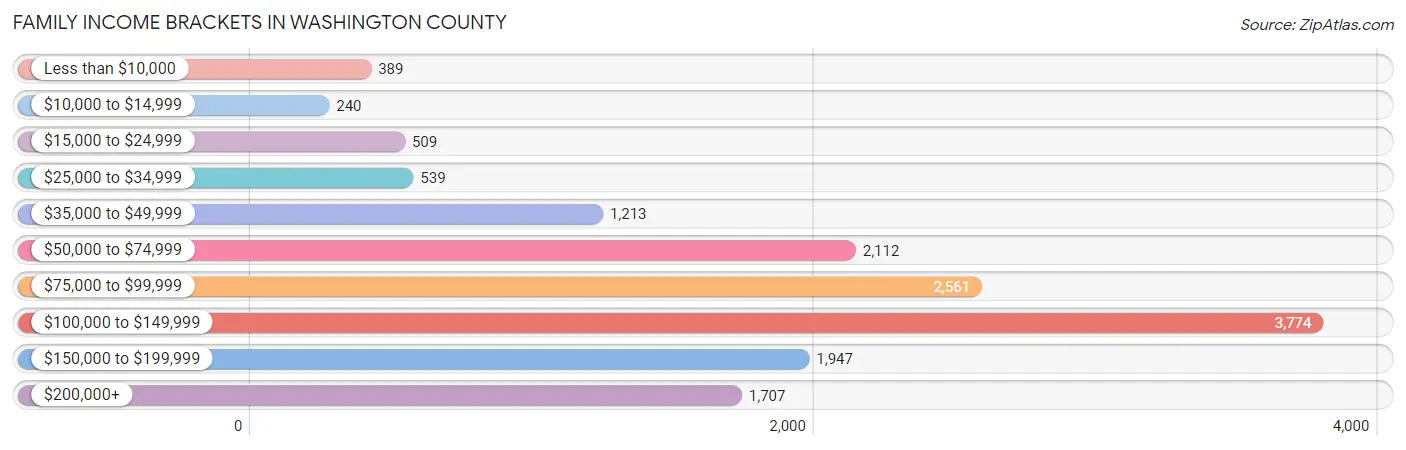
| Income Bracket | # Families | % Families |
| Less than $10,000 | 389 | 2.6% |
| $10,000 to $14,999 | 240 | 1.6% |
| $15,000 to $24,999 | 509 | 3.4% |
| $25,000 to $34,999 | 539 | 3.6% |
| $35,000 to $49,999 | 1,213 | 8.1% |
| $50,000 to $74,999 | 2,112 | 14.1% |
| $75,000 to $99,999 | 2,561 | 17.1% |
| $100,000 to $149,999 | 3,774 | 25.2% |
| $150,000 to $199,999 | 1,947 | 13.0% |
| $200,000+ | 1,707 | 11.4% |
Family Income by Famaliy Size in Washington County
4-person families (2,286 | 15.3%) account for the highest median family income in Washington County with $122,857 per family, while 2-person families (8,382 | 56.0%) have the highest median income of $46,264 per family member.
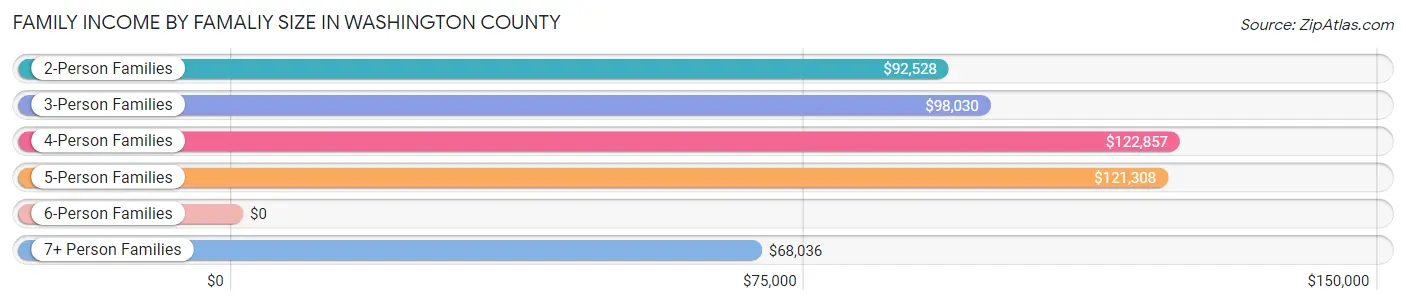
| Income Bracket | # Families | Median Income |
| 2-Person Families | 8,382 (56.0%) | $92,528 |
| 3-Person Families | 3,455 (23.1%) | $98,030 |
| 4-Person Families | 2,286 (15.3%) | $122,857 |
| 5-Person Families | 499 (3.3%) | $121,308 |
| 6-Person Families | 284 (1.9%) | $0 |
| 7+ Person Families | 70 (0.5%) | $68,036 |
| Total | 14,976 (100.0%) | $99,315 |
Family Income by Number of Earners in Washington County
The median family income in Washington County is $99,315, with families comprising 3+ earners (1,303) having the highest median family income of $153,299, while families with no earners (2,457) have the lowest median family income of $49,646, accounting for 8.7% and 16.4% of families, respectively.
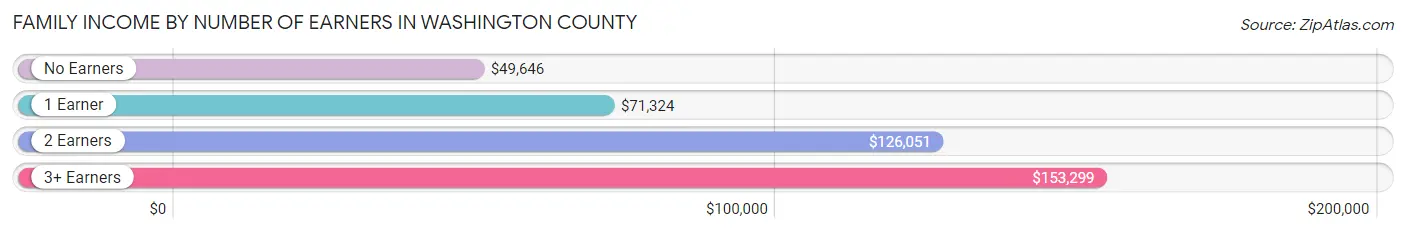
| Number of Earners | # Families | Median Income |
| No Earners | 2,457 (16.4%) | $49,646 |
| 1 Earner | 4,075 (27.2%) | $71,324 |
| 2 Earners | 7,141 (47.7%) | $126,051 |
| 3+ Earners | 1,303 (8.7%) | $153,299 |
| Total | 14,976 (100.0%) | $99,315 |
Household Income in Washington County
Household Income Brackets in Washington County
With 4,958 households falling in the category, the $100,000 to $149,999 income range is the most frequent in Washington County, accounting for 19.7% of all households. In contrast, only 830 households (3.3%) fall into the less than $10,000 income bracket, making it the least populous group.
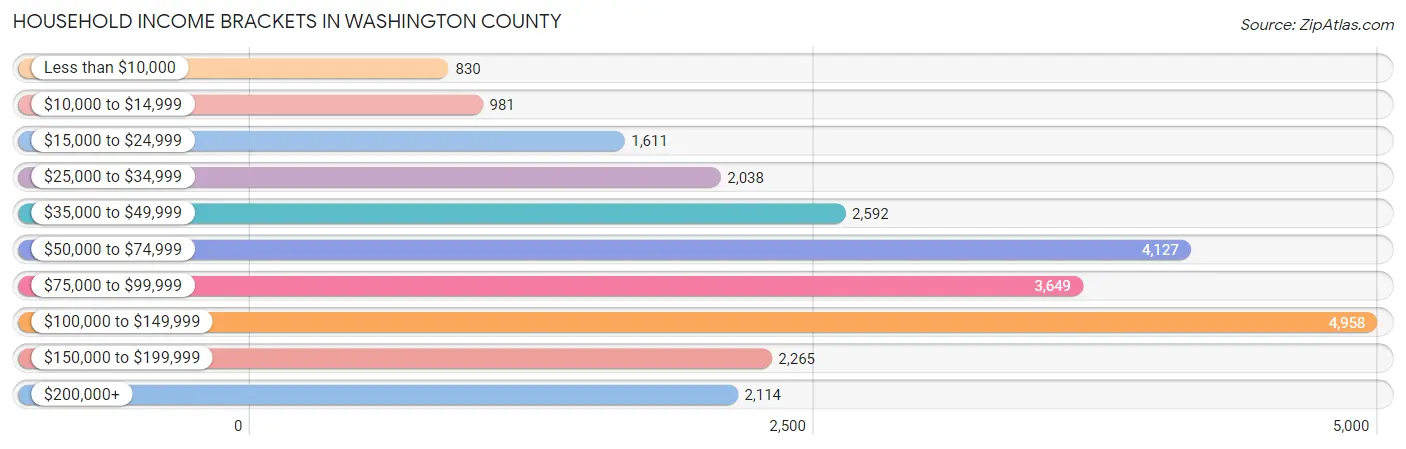
| Income Bracket | # Households | % Households |
| Less than $10,000 | 830 | 3.3% |
| $10,000 to $14,999 | 981 | 3.9% |
| $15,000 to $24,999 | 1,611 | 6.4% |
| $25,000 to $34,999 | 2,038 | 8.1% |
| $35,000 to $49,999 | 2,592 | 10.3% |
| $50,000 to $74,999 | 4,127 | 16.4% |
| $75,000 to $99,999 | 3,649 | 14.5% |
| $100,000 to $149,999 | 4,958 | 19.7% |
| $150,000 to $199,999 | 2,265 | 9.0% |
| $200,000+ | 2,114 | 8.4% |
Household Income by Householder Age in Washington County
The median household income in Washington County is $77,278, with the highest median household income of $87,015 found in the 45 to 64 years age bracket for the primary householder. A total of 9,904 households (39.4%) fall into this category. Meanwhile, the 15 to 24 years age bracket for the primary householder has the lowest median household income of $46,667, with 368 households (1.5%) in this group.
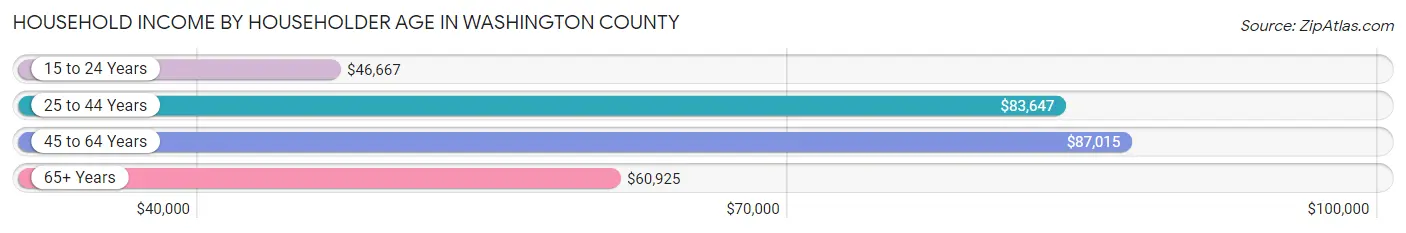
| Income Bracket | # Households | Median Income |
| 15 to 24 Years | 368 (1.5%) | $46,667 |
| 25 to 44 Years | 7,285 (28.9%) | $83,647 |
| 45 to 64 Years | 9,904 (39.4%) | $87,015 |
| 65+ Years | 7,609 (30.2%) | $60,925 |
| Total | 25,166 (100.0%) | $77,278 |
Poverty in Washington County
Income Below Poverty by Sex and Age in Washington County
With 9.8% poverty level for males and 10.0% for females among the residents of Washington County, 15 year old males and 16 and 17 year old females are the most vulnerable to poverty, with 51 males (18.5%) and 126 females (19.4%) in their respective age groups living below the poverty level.
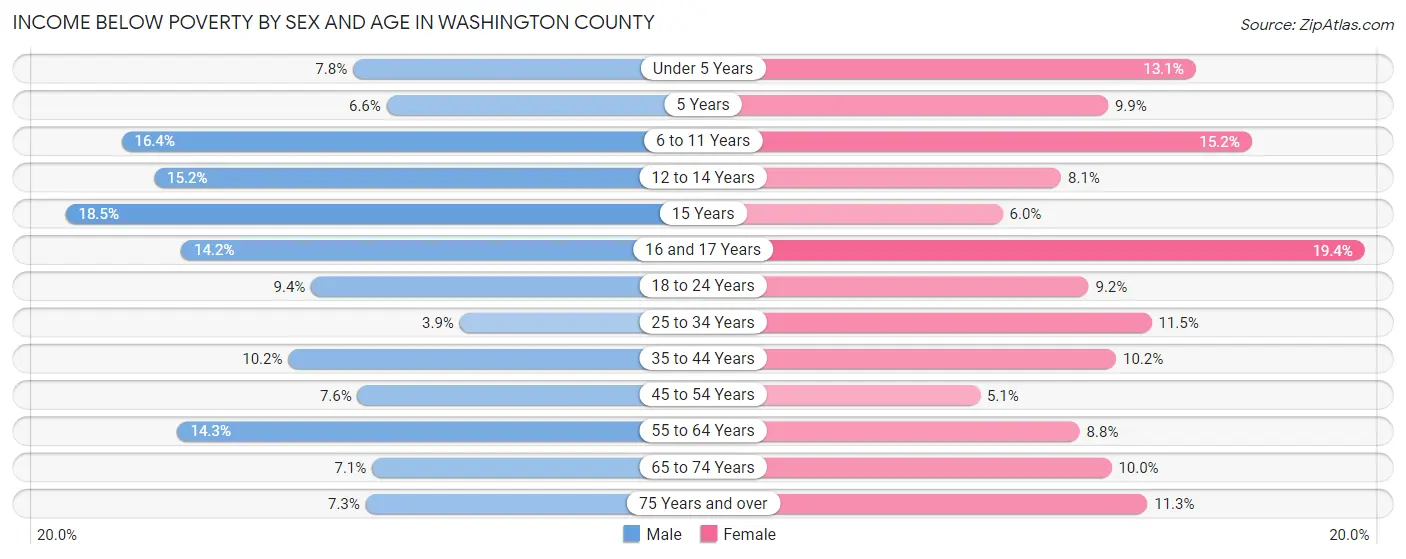
| Age Bracket | Male | Female |
| Under 5 Years | 95 (7.8%) | 164 (13.1%) |
| 5 Years | 21 (6.6%) | 17 (9.9%) |
| 6 to 11 Years | 323 (16.4%) | 280 (15.2%) |
| 12 to 14 Years | 153 (15.2%) | 79 (8.1%) |
| 15 Years | 51 (18.5%) | 19 (6.0%) |
| 16 and 17 Years | 105 (14.2%) | 126 (19.4%) |
| 18 to 24 Years | 206 (9.4%) | 163 (9.2%) |
| 25 to 34 Years | 130 (3.8%) | 409 (11.5%) |
| 35 to 44 Years | 369 (10.2%) | 379 (10.2%) |
| 45 to 54 Years | 299 (7.6%) | 201 (5.1%) |
| 55 to 64 Years | 646 (14.3%) | 403 (8.8%) |
| 65 to 74 Years | 256 (7.1%) | 383 (10.0%) |
| 75 Years and over | 133 (7.3%) | 293 (11.3%) |
| Total | 2,787 (9.8%) | 2,916 (10.0%) |
Income Above Poverty by Sex and Age in Washington County
According to the poverty statistics in Washington County, males aged 25 to 34 years and females aged 45 to 54 years are the age groups that are most secure financially, with 96.2% of males and 94.9% of females in these age groups living above the poverty line.
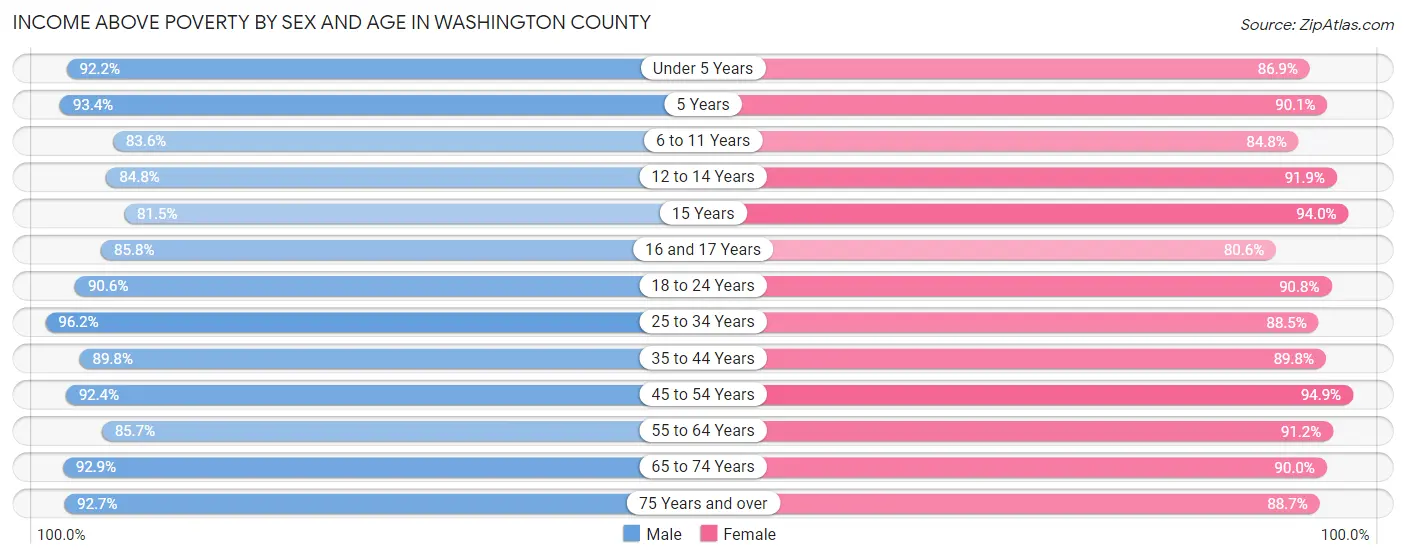
| Age Bracket | Male | Female |
| Under 5 Years | 1,122 (92.2%) | 1,085 (86.9%) |
| 5 Years | 299 (93.4%) | 155 (90.1%) |
| 6 to 11 Years | 1,647 (83.6%) | 1,561 (84.8%) |
| 12 to 14 Years | 854 (84.8%) | 892 (91.9%) |
| 15 Years | 225 (81.5%) | 299 (94.0%) |
| 16 and 17 Years | 635 (85.8%) | 523 (80.6%) |
| 18 to 24 Years | 1,994 (90.6%) | 1,616 (90.8%) |
| 25 to 34 Years | 3,250 (96.2%) | 3,146 (88.5%) |
| 35 to 44 Years | 3,246 (89.8%) | 3,343 (89.8%) |
| 45 to 54 Years | 3,616 (92.4%) | 3,718 (94.9%) |
| 55 to 64 Years | 3,865 (85.7%) | 4,162 (91.2%) |
| 65 to 74 Years | 3,349 (92.9%) | 3,444 (90.0%) |
| 75 Years and over | 1,678 (92.7%) | 2,290 (88.7%) |
| Total | 25,780 (90.2%) | 26,234 (90.0%) |
Income Below Poverty Among Married-Couple Families in Washington County
The poverty statistics for married-couple families in Washington County show that 2.4% or 277 of the total 11,415 families live below the poverty line. Families with no children have the highest poverty rate of 2.8%, comprising of 207 families. On the other hand, families with 5 or more children have the lowest poverty rate of 0.0%, which includes 0 families.
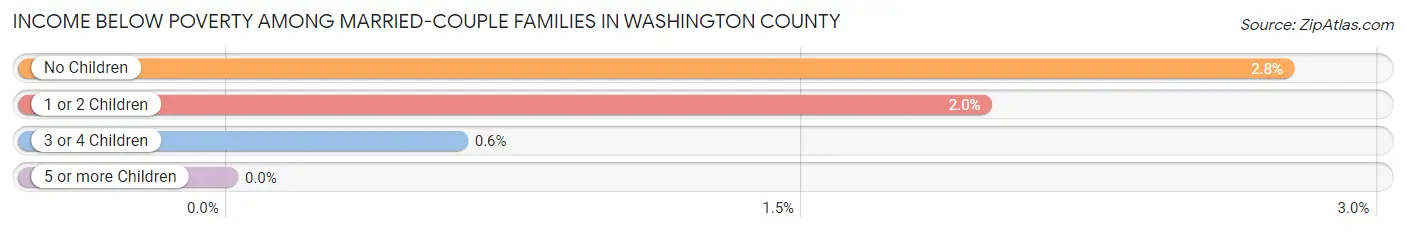
| Children | Above Poverty | Below Poverty |
| No Children | 7,297 (97.2%) | 207 (2.8%) |
| 1 or 2 Children | 3,338 (98.0%) | 67 (2.0%) |
| 3 or 4 Children | 493 (99.4%) | 3 (0.6%) |
| 5 or more Children | 10 (100.0%) | 0 (0.0%) |
| Total | 11,138 (97.6%) | 277 (2.4%) |
Income Below Poverty Among Single-Parent Households in Washington County
According to the poverty data in Washington County, 22.4% or 257 single-father households and 17.4% or 419 single-mother households are living below the poverty line. Among single-father households, those with 5 or more children have the highest poverty rate, with 53 households (100.0%) experiencing poverty. Likewise, among single-mother households, those with 5 or more children have the highest poverty rate, with 8 households (80.0%) falling below the poverty line.
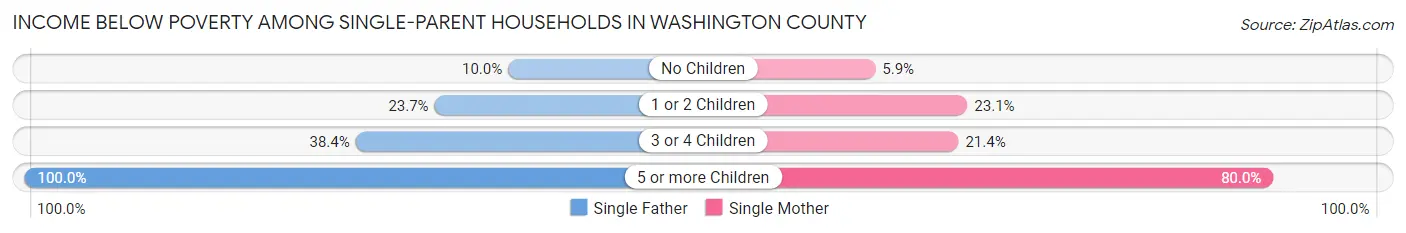
| Children | Single Father | Single Mother |
| No Children | 48 (10.0%) | 48 (5.9%) |
| 1 or 2 Children | 128 (23.7%) | 320 (23.1%) |
| 3 or 4 Children | 28 (38.4%) | 43 (21.4%) |
| 5 or more Children | 53 (100.0%) | 8 (80.0%) |
| Total | 257 (22.4%) | 419 (17.4%) |
Income Below Poverty Among Married-Couple vs Single-Parent Households in Washington County
The poverty data for Washington County shows that 277 of the married-couple family households (2.4%) and 676 of the single-parent households (19.0%) are living below the poverty level. Within the married-couple family households, those with no children have the highest poverty rate, with 207 households (2.8%) falling below the poverty line. Among the single-parent households, those with 5 or more children have the highest poverty rate, with 61 household (96.8%) living below poverty.
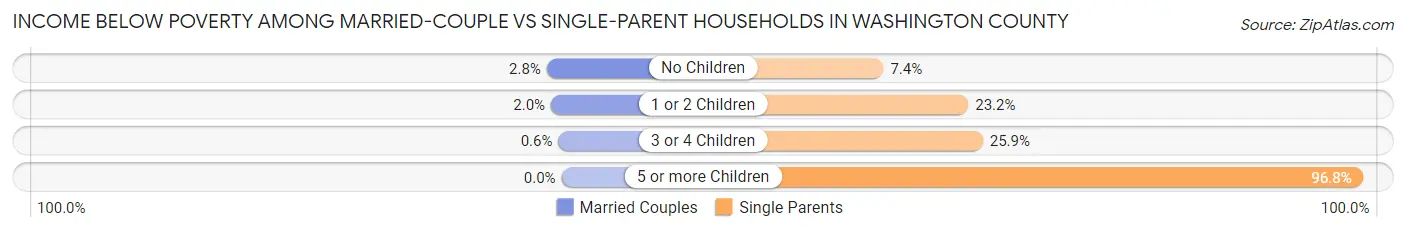
| Children | Married-Couple Families | Single-Parent Households |
| No Children | 207 (2.8%) | 96 (7.4%) |
| 1 or 2 Children | 67 (2.0%) | 448 (23.2%) |
| 3 or 4 Children | 3 (0.6%) | 71 (25.9%) |
| 5 or more Children | 0 (0.0%) | 61 (96.8%) |
| Total | 277 (2.4%) | 676 (19.0%) |
Employment Characteristics in Washington County
Employment by Class of Employer in Washington County
Among the 30,906 employed individuals in Washington County, private company employees (15,443 | 50.0%), not-for-profit organizations (5,016 | 16.2%), and state government employees (3,096 | 10.0%) make up the most common classes of employment.
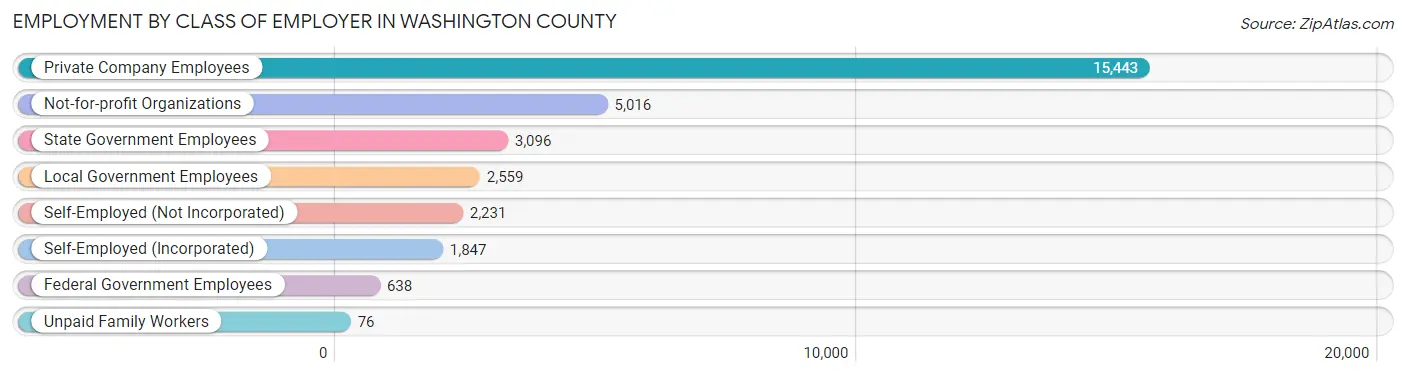
| Employer Class | # Employees | % Employees |
| Private Company Employees | 15,443 | 50.0% |
| Self-Employed (Incorporated) | 1,847 | 6.0% |
| Self-Employed (Not Incorporated) | 2,231 | 7.2% |
| Not-for-profit Organizations | 5,016 | 16.2% |
| Local Government Employees | 2,559 | 8.3% |
| State Government Employees | 3,096 | 10.0% |
| Federal Government Employees | 638 | 2.1% |
| Unpaid Family Workers | 76 | 0.3% |
| Total | 30,906 | 100.0% |
Employment Status by Age in Washington County
According to the labor force statistics for Washington County, out of the total population over 16 years of age (50,234), 64.7% or 32,501 individuals are in the labor force, with 3.0% or 975 of them unemployed. The age group with the highest labor force participation rate is 25 to 29 years, with 87.0% or 2,883 individuals in the labor force. Within the labor force, the 20 to 24 years age range has the highest percentage of unemployed individuals, with 7.2% or 184 of them being unemployed.
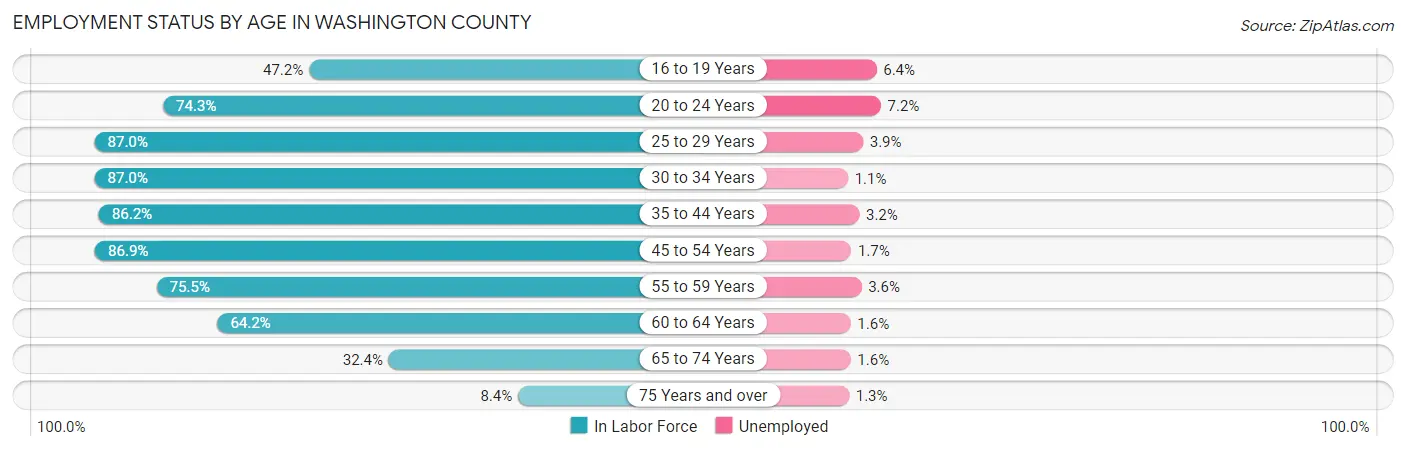
| Age Bracket | In Labor Force | Unemployed |
| 16 to 19 Years | 1,534 (47.2%) | 98 (6.4%) |
| 20 to 24 Years | 2,551 (74.3%) | 184 (7.2%) |
| 25 to 29 Years | 2,883 (87.0%) | 112 (3.9%) |
| 30 to 34 Years | 3,200 (87.0%) | 35 (1.1%) |
| 35 to 44 Years | 6,333 (86.2%) | 203 (3.2%) |
| 45 to 54 Years | 6,812 (86.9%) | 116 (1.7%) |
| 55 to 59 Years | 3,434 (75.5%) | 124 (3.6%) |
| 60 to 64 Years | 2,928 (64.2%) | 47 (1.6%) |
| 65 to 74 Years | 2,435 (32.4%) | 39 (1.6%) |
| 75 Years and over | 399 (8.4%) | 5 (1.3%) |
| Total | 32,501 (64.7%) | 975 (3.0%) |
Employment Status by Educational Attainment in Washington County
According to labor force statistics for Washington County, 81.8% of individuals (25,592) out of the total population between 25 and 64 years of age (31,286) are in the labor force, with 2.5% or 640 of them being unemployed. The group with the highest labor force participation rate are those with the educational attainment of bachelor's degree or higher, with 89.0% or 13,207 individuals in the labor force. Within the labor force, individuals with high school diploma education have the highest percentage of unemployment, with 5.8% or 336 of them being unemployed.
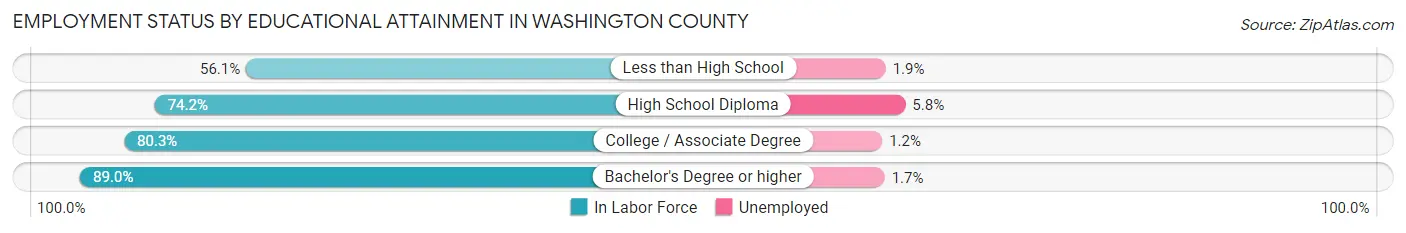
| Educational Attainment | In Labor Force | Unemployed |
| Less than High School | 820 (56.1%) | 28 (1.9%) |
| High School Diploma | 5,791 (74.2%) | 453 (5.8%) |
| College / Associate Degree | 5,766 (80.3%) | 86 (1.2%) |
| Bachelor's Degree or higher | 13,207 (89.0%) | 252 (1.7%) |
| Total | 25,592 (81.8%) | 782 (2.5%) |
Employment Occupations by Sex in Washington County
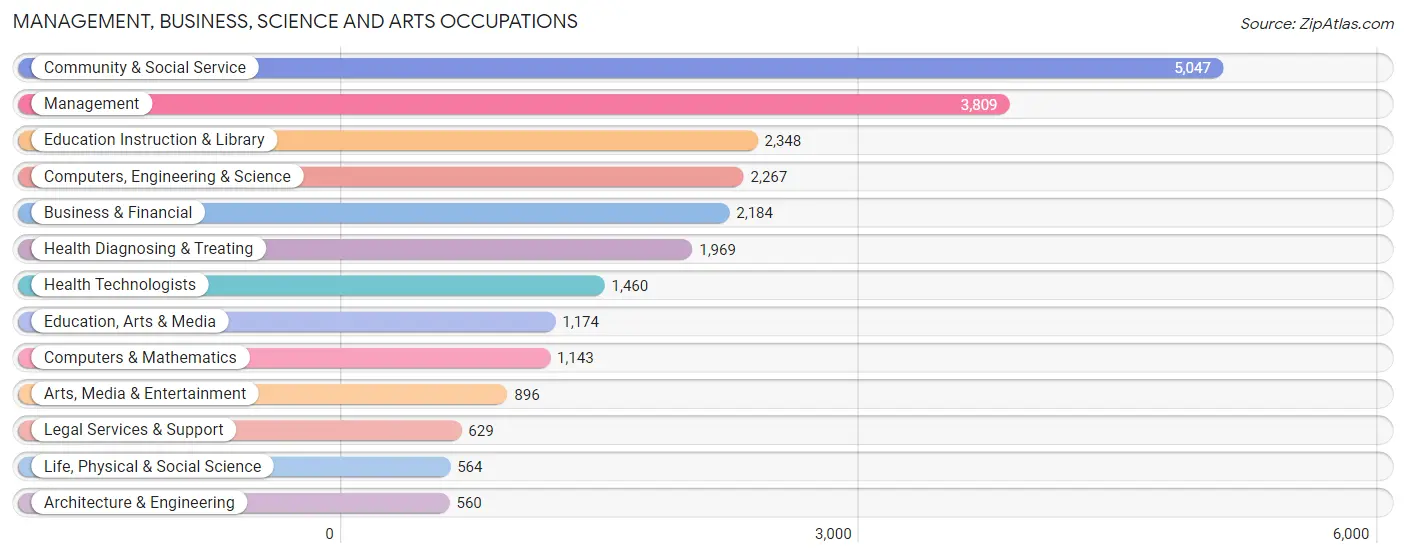
Management, Business, Science and Arts Occupations
The most common Management, Business, Science and Arts occupations in Washington County are Community & Social Service (5,047 | 16.1%), Management (3,809 | 12.1%), Education Instruction & Library (2,348 | 7.5%), Computers, Engineering & Science (2,267 | 7.2%), and Business & Financial (2,184 | 7.0%).
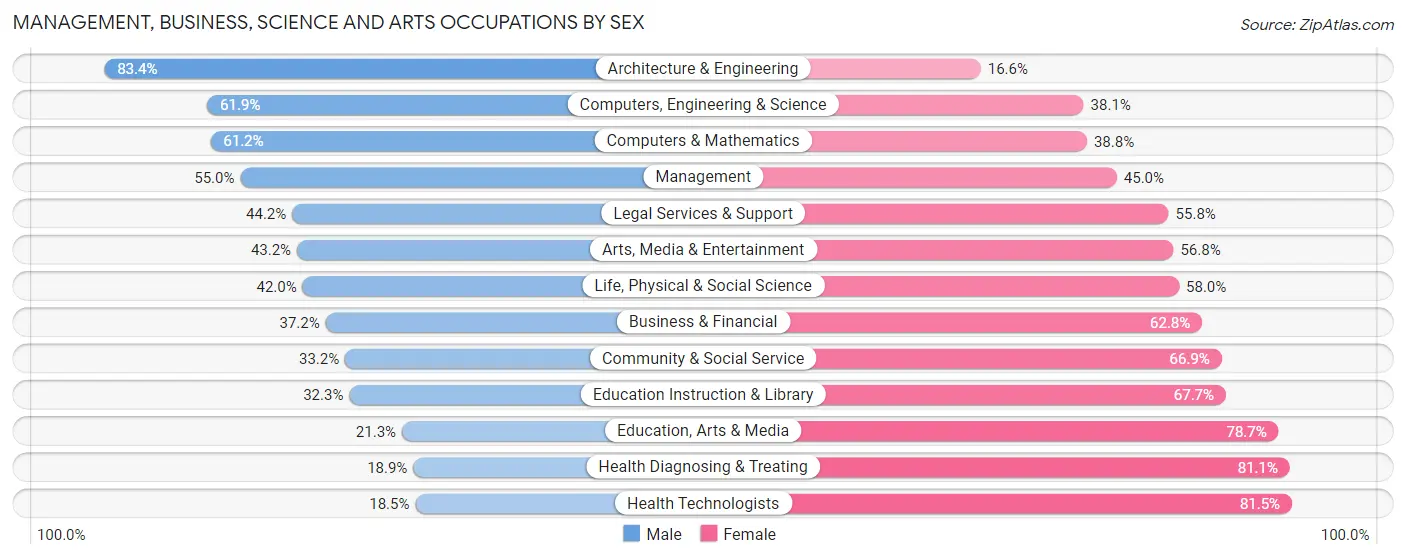
Management, Business, Science and Arts Occupations by Sex
Within the Management, Business, Science and Arts occupations in Washington County, the most male-oriented occupations are Architecture & Engineering (83.4%), Computers, Engineering & Science (61.9%), and Computers & Mathematics (61.2%), while the most female-oriented occupations are Health Technologists (81.5%), Health Diagnosing & Treating (81.1%), and Education, Arts & Media (78.7%).
| Occupation | Male | Female |
| Management | 2,095 (55.0%) | 1,714 (45.0%) |
| Business & Financial | 813 (37.2%) | 1,371 (62.8%) |
| Computers, Engineering & Science | 1,404 (61.9%) | 863 (38.1%) |
| Computers & Mathematics | 700 (61.2%) | 443 (38.8%) |
| Architecture & Engineering | 467 (83.4%) | 93 (16.6%) |
| Life, Physical & Social Science | 237 (42.0%) | 327 (58.0%) |
| Community & Social Service | 1,673 (33.2%) | 3,374 (66.8%) |
| Education, Arts & Media | 250 (21.3%) | 924 (78.7%) |
| Legal Services & Support | 278 (44.2%) | 351 (55.8%) |
| Education Instruction & Library | 758 (32.3%) | 1,590 (67.7%) |
| Arts, Media & Entertainment | 387 (43.2%) | 509 (56.8%) |
| Health Diagnosing & Treating | 373 (18.9%) | 1,596 (81.1%) |
| Health Technologists | 270 (18.5%) | 1,190 (81.5%) |
| Total (Category) | 6,358 (41.6%) | 8,918 (58.4%) |
| Total (Overall) | 16,059 (51.1%) | 15,359 (48.9%) |
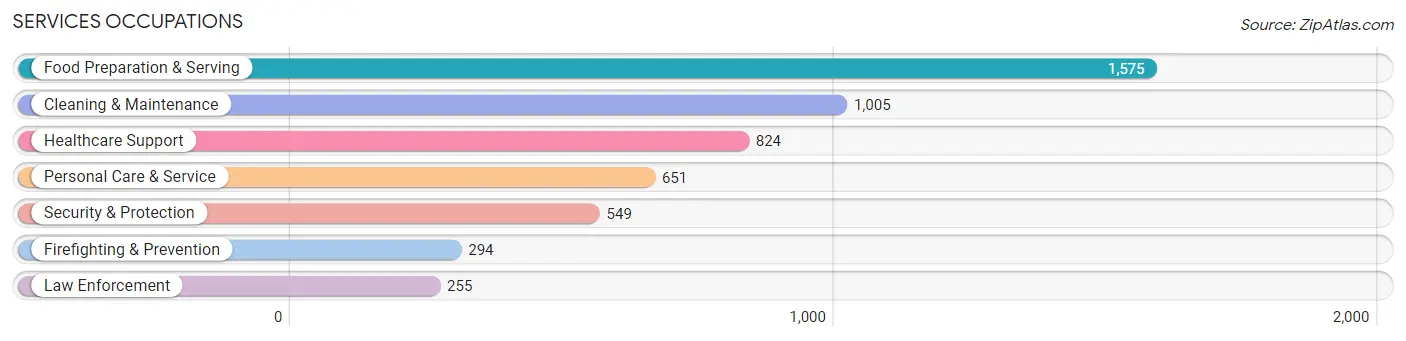
Services Occupations
The most common Services occupations in Washington County are Food Preparation & Serving (1,575 | 5.0%), Cleaning & Maintenance (1,005 | 3.2%), Healthcare Support (824 | 2.6%), Personal Care & Service (651 | 2.1%), and Security & Protection (549 | 1.8%).
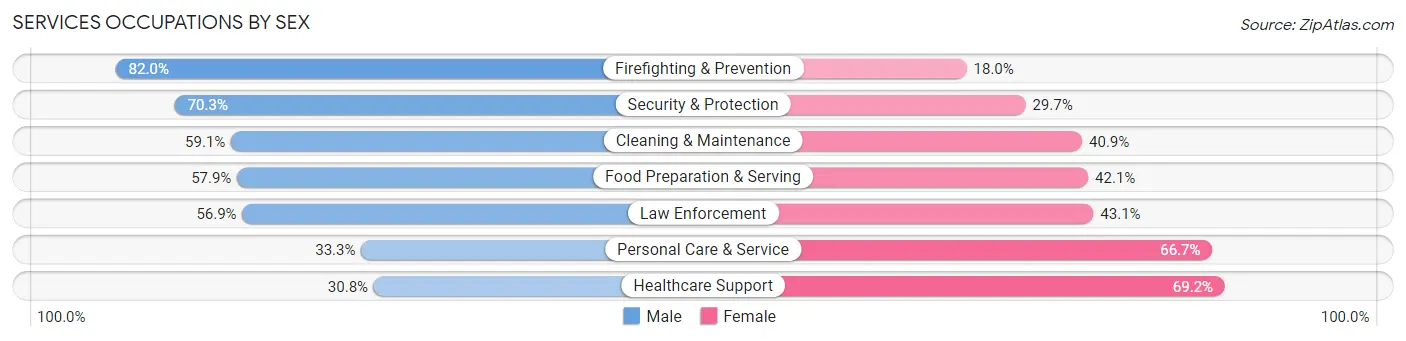
Services Occupations by Sex
Within the Services occupations in Washington County, the most male-oriented occupations are Firefighting & Prevention (82.0%), Security & Protection (70.3%), and Cleaning & Maintenance (59.1%), while the most female-oriented occupations are Healthcare Support (69.2%), Personal Care & Service (66.7%), and Law Enforcement (43.1%).
| Occupation | Male | Female |
| Healthcare Support | 254 (30.8%) | 570 (69.2%) |
| Security & Protection | 386 (70.3%) | 163 (29.7%) |
| Firefighting & Prevention | 241 (82.0%) | 53 (18.0%) |
| Law Enforcement | 145 (56.9%) | 110 (43.1%) |
| Food Preparation & Serving | 912 (57.9%) | 663 (42.1%) |
| Cleaning & Maintenance | 594 (59.1%) | 411 (40.9%) |
| Personal Care & Service | 217 (33.3%) | 434 (66.7%) |
| Total (Category) | 2,363 (51.3%) | 2,241 (48.7%) |
| Total (Overall) | 16,059 (51.1%) | 15,359 (48.9%) |
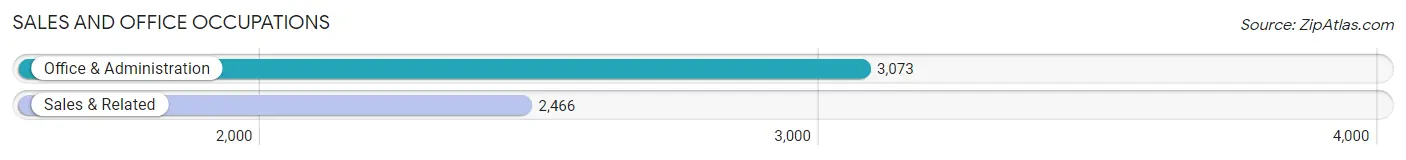
Sales and Office Occupations
The most common Sales and Office occupations in Washington County are Office & Administration (3,073 | 9.8%), and Sales & Related (2,466 | 7.9%).
Sales and Office Occupations by Sex
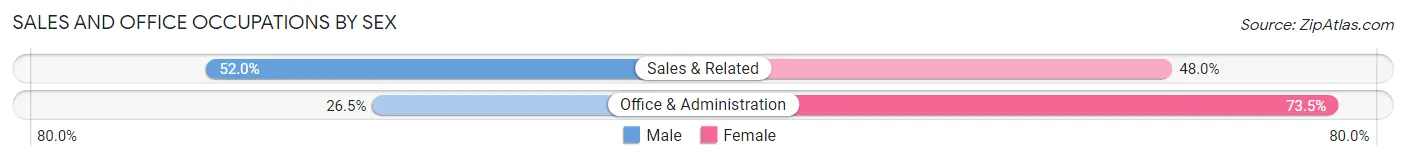
| Occupation | Male | Female |
| Sales & Related | 1,283 (52.0%) | 1,183 (48.0%) |
| Office & Administration | 815 (26.5%) | 2,258 (73.5%) |
| Total (Category) | 2,098 (37.9%) | 3,441 (62.1%) |
| Total (Overall) | 16,059 (51.1%) | 15,359 (48.9%) |
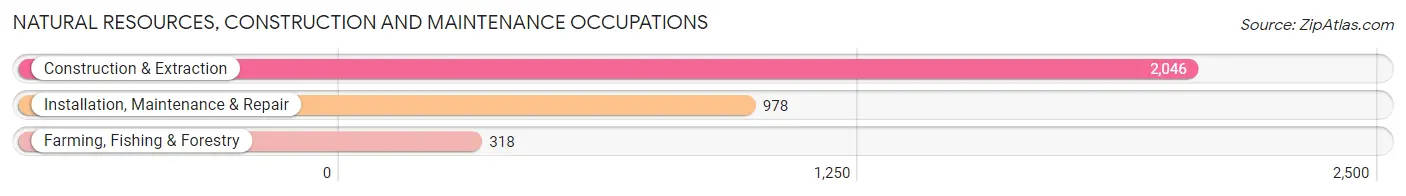
Natural Resources, Construction and Maintenance Occupations
The most common Natural Resources, Construction and Maintenance occupations in Washington County are Construction & Extraction (2,046 | 6.5%), Installation, Maintenance & Repair (978 | 3.1%), and Farming, Fishing & Forestry (318 | 1.0%).
Natural Resources, Construction and Maintenance Occupations by Sex
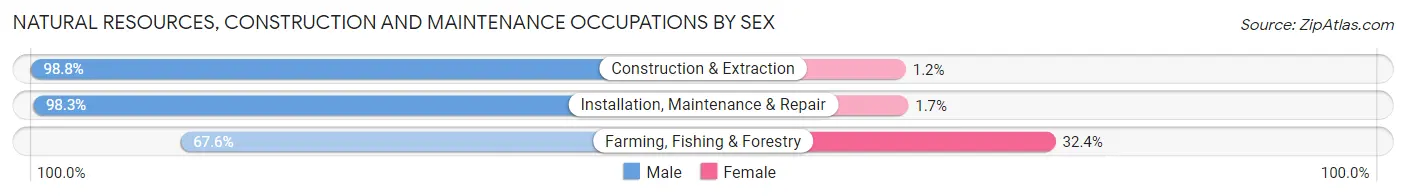
| Occupation | Male | Female |
| Farming, Fishing & Forestry | 215 (67.6%) | 103 (32.4%) |
| Construction & Extraction | 2,021 (98.8%) | 25 (1.2%) |
| Installation, Maintenance & Repair | 961 (98.3%) | 17 (1.7%) |
| Total (Category) | 3,197 (95.7%) | 145 (4.3%) |
| Total (Overall) | 16,059 (51.1%) | 15,359 (48.9%) |
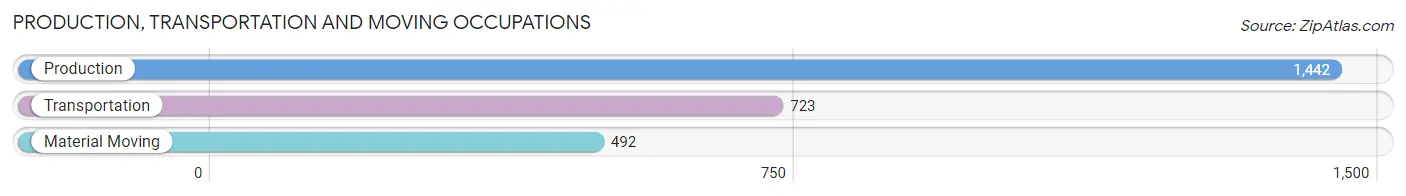
Production, Transportation and Moving Occupations
The most common Production, Transportation and Moving occupations in Washington County are Production (1,442 | 4.6%), Transportation (723 | 2.3%), and Material Moving (492 | 1.6%).
Production, Transportation and Moving Occupations by Sex
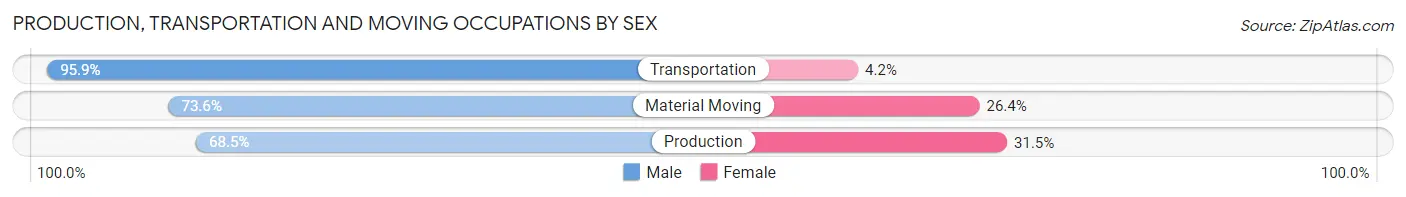
| Occupation | Male | Female |
| Production | 988 (68.5%) | 454 (31.5%) |
| Transportation | 693 (95.9%) | 30 (4.2%) |
| Material Moving | 362 (73.6%) | 130 (26.4%) |
| Total (Category) | 2,043 (76.9%) | 614 (23.1%) |
| Total (Overall) | 16,059 (51.1%) | 15,359 (48.9%) |
Employment Industries by Sex in Washington County
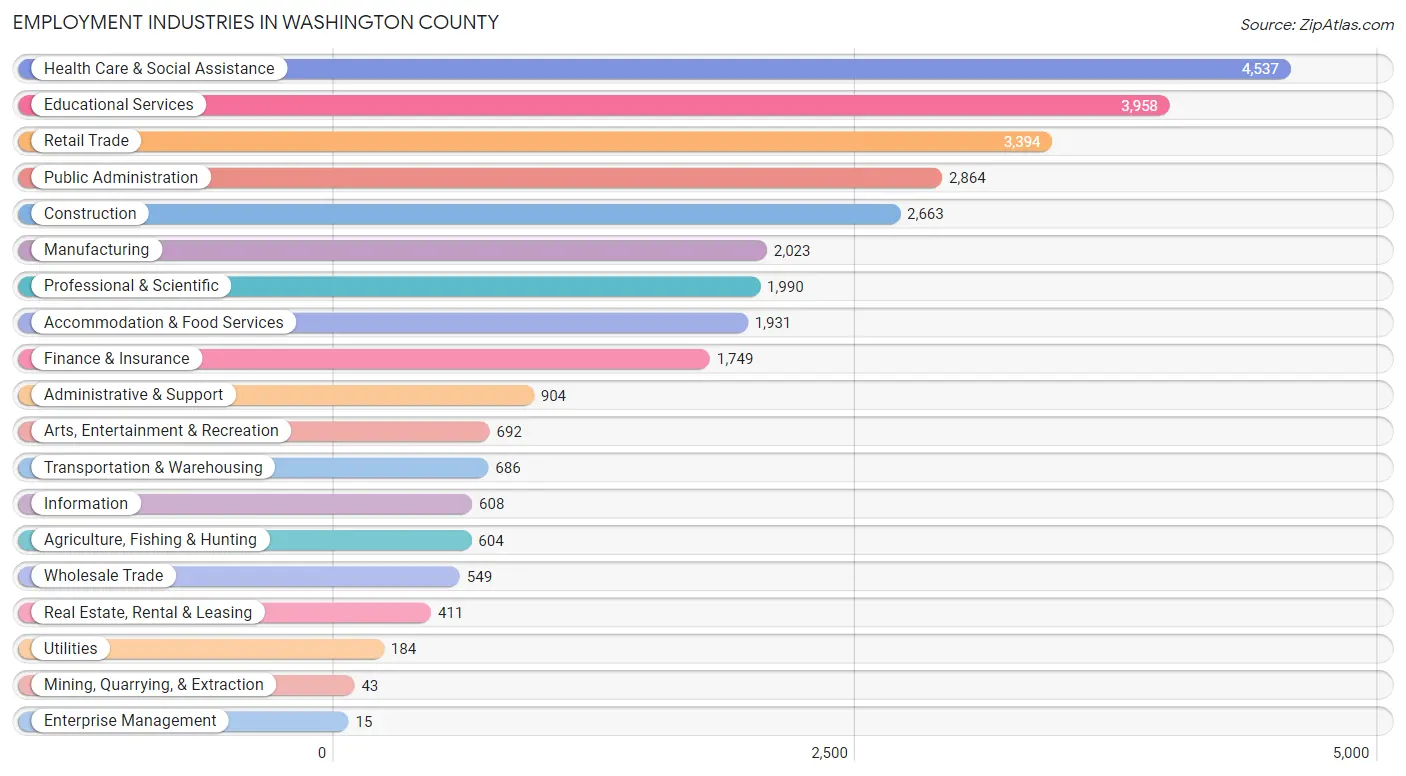
Employment Industries in Washington County
The major employment industries in Washington County include Health Care & Social Assistance (4,537 | 14.4%), Educational Services (3,958 | 12.6%), Retail Trade (3,394 | 10.8%), Public Administration (2,864 | 9.1%), and Construction (2,663 | 8.5%).
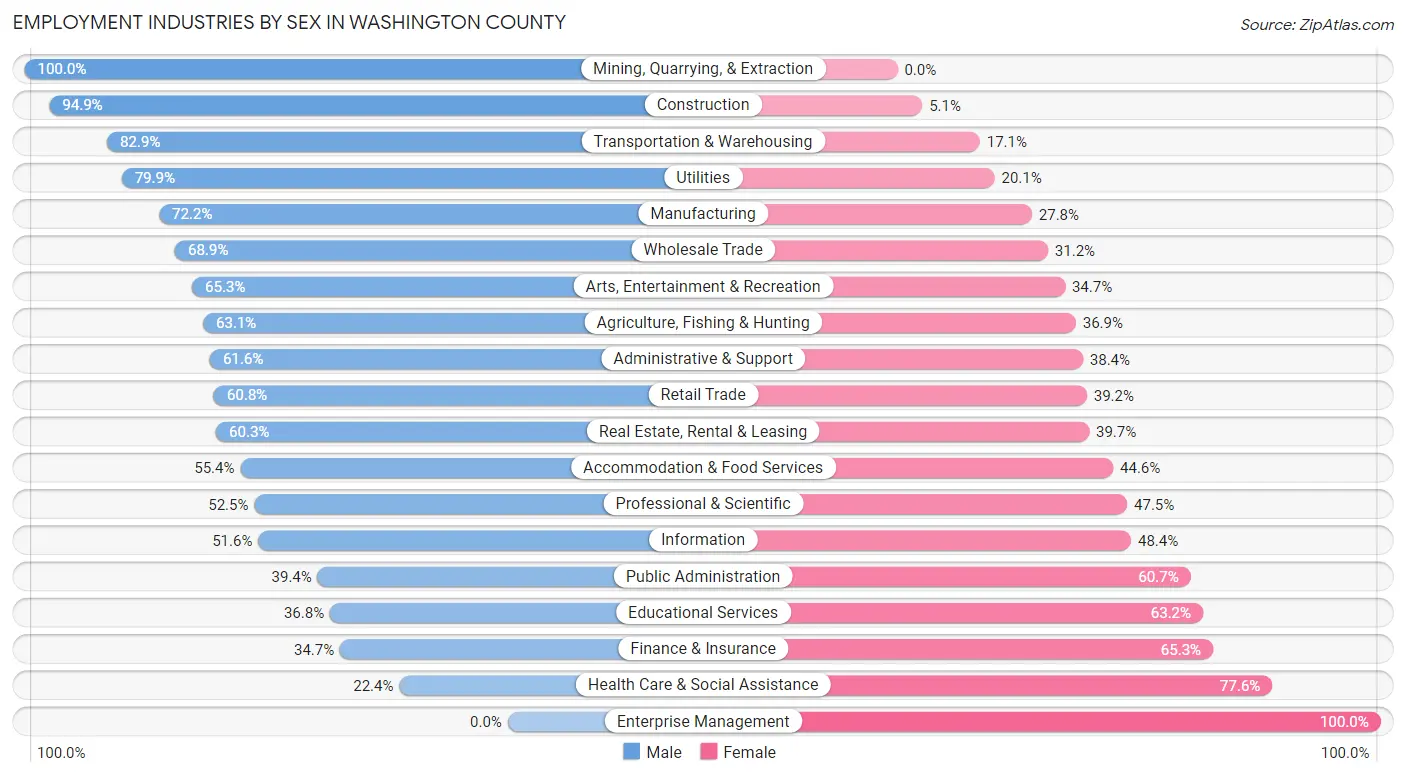
Employment Industries by Sex in Washington County
The Washington County industries that see more men than women are Mining, Quarrying, & Extraction (100.0%), Construction (94.9%), and Transportation & Warehousing (82.9%), whereas the industries that tend to have a higher number of women are Enterprise Management (100.0%), Health Care & Social Assistance (77.6%), and Finance & Insurance (65.3%).
| Industry | Male | Female |
| Agriculture, Fishing & Hunting | 381 (63.1%) | 223 (36.9%) |
| Mining, Quarrying, & Extraction | 43 (100.0%) | 0 (0.0%) |
| Construction | 2,526 (94.9%) | 137 (5.1%) |
| Manufacturing | 1,460 (72.2%) | 563 (27.8%) |
| Wholesale Trade | 378 (68.9%) | 171 (31.1%) |
| Retail Trade | 2,064 (60.8%) | 1,330 (39.2%) |
| Transportation & Warehousing | 569 (82.9%) | 117 (17.1%) |
| Utilities | 147 (79.9%) | 37 (20.1%) |
| Information | 314 (51.6%) | 294 (48.4%) |
| Finance & Insurance | 607 (34.7%) | 1,142 (65.3%) |
| Real Estate, Rental & Leasing | 248 (60.3%) | 163 (39.7%) |
| Professional & Scientific | 1,044 (52.5%) | 946 (47.5%) |
| Enterprise Management | 0 (0.0%) | 15 (100.0%) |
| Administrative & Support | 557 (61.6%) | 347 (38.4%) |
| Educational Services | 1,456 (36.8%) | 2,502 (63.2%) |
| Health Care & Social Assistance | 1,018 (22.4%) | 3,519 (77.6%) |
| Arts, Entertainment & Recreation | 452 (65.3%) | 240 (34.7%) |
| Accommodation & Food Services | 1,069 (55.4%) | 862 (44.6%) |
| Public Administration | 1,127 (39.4%) | 1,737 (60.7%) |
| Total | 16,059 (51.1%) | 15,359 (48.9%) |
Education in Washington County
School Enrollment in Washington County
The most common levels of schooling among the 12,934 students in Washington County are college / undergraduate (3,101 | 24.0%), high school (2,930 | 22.7%), and middle school (2,516 | 19.5%).
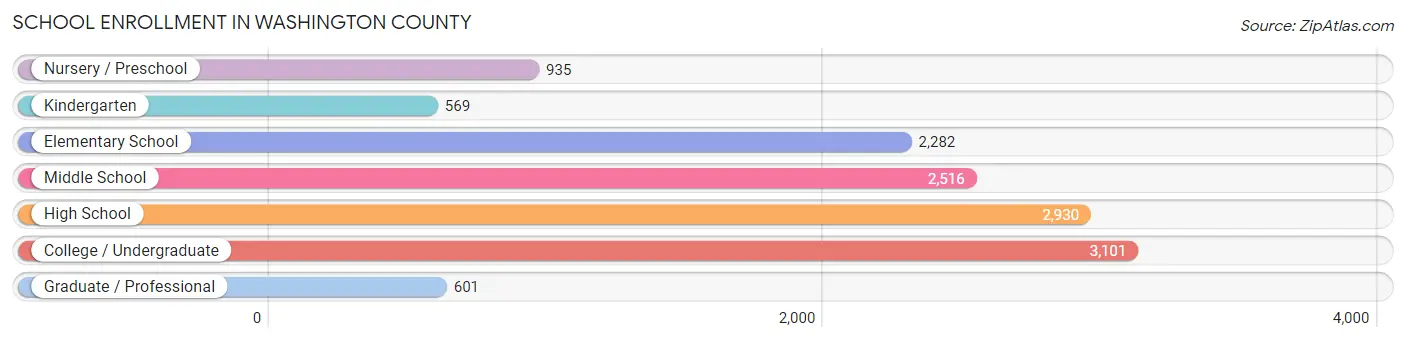
| School Level | # Students | % Students |
| Nursery / Preschool | 935 | 7.2% |
| Kindergarten | 569 | 4.4% |
| Elementary School | 2,282 | 17.6% |
| Middle School | 2,516 | 19.5% |
| High School | 2,930 | 22.7% |
| College / Undergraduate | 3,101 | 24.0% |
| Graduate / Professional | 601 | 4.6% |
| Total | 12,934 | 100.0% |
School Enrollment by Age by Funding Source in Washington County
Out of a total of 12,934 students who are enrolled in schools in Washington County, 3,531 (27.3%) attend a private institution, while the remaining 9,403 (72.7%) are enrolled in public schools. The age group of 20 to 24 year olds has the highest likelihood of being enrolled in private schools, with 1,103 (70.8% in the age bracket) enrolled. Conversely, the age group of 5 to 9 year old has the lowest likelihood of being enrolled in a private school, with 2,600 (90.6% in the age bracket) attending a public institution.
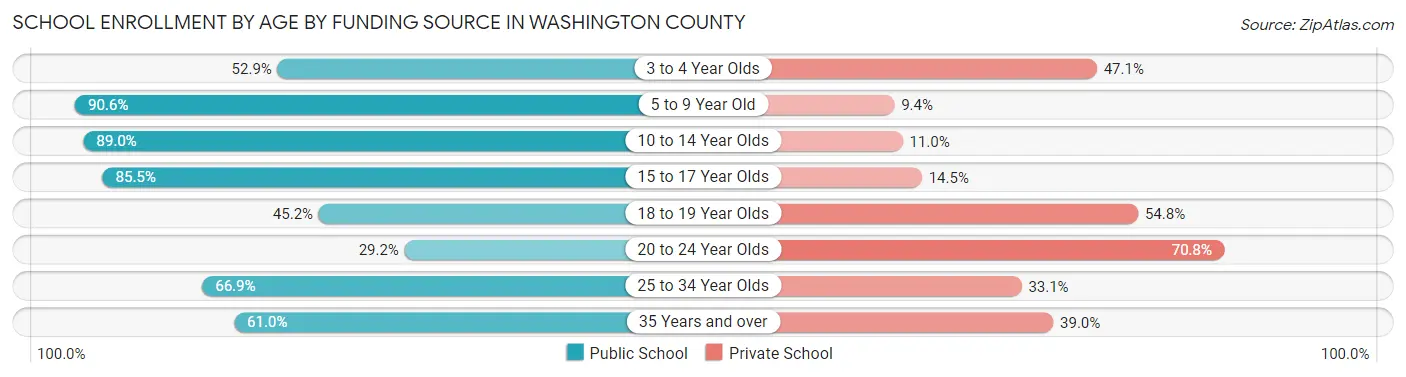
| Age Bracket | Public School | Private School |
| 3 to 4 Year Olds | 342 (52.9%) | 305 (47.1%) |
| 5 to 9 Year Old | 2,600 (90.6%) | 270 (9.4%) |
| 10 to 14 Year Olds | 2,828 (89.0%) | 348 (11.0%) |
| 15 to 17 Year Olds | 1,693 (85.5%) | 288 (14.5%) |
| 18 to 19 Year Olds | 604 (45.2%) | 733 (54.8%) |
| 20 to 24 Year Olds | 455 (29.2%) | 1,103 (70.8%) |
| 25 to 34 Year Olds | 493 (66.9%) | 244 (33.1%) |
| 35 Years and over | 383 (61.0%) | 245 (39.0%) |
| Total | 9,403 (72.7%) | 3,531 (27.3%) |
Educational Attainment by Field of Study in Washington County
Education (2,623 | 11.9%), business (2,399 | 10.9%), social sciences (2,367 | 10.8%), bio, nature & agricultural (2,195 | 10.0%), and science & technology (2,060 | 9.4%) are the most common fields of study among 21,957 individuals in Washington County who have obtained a bachelor's degree or higher.
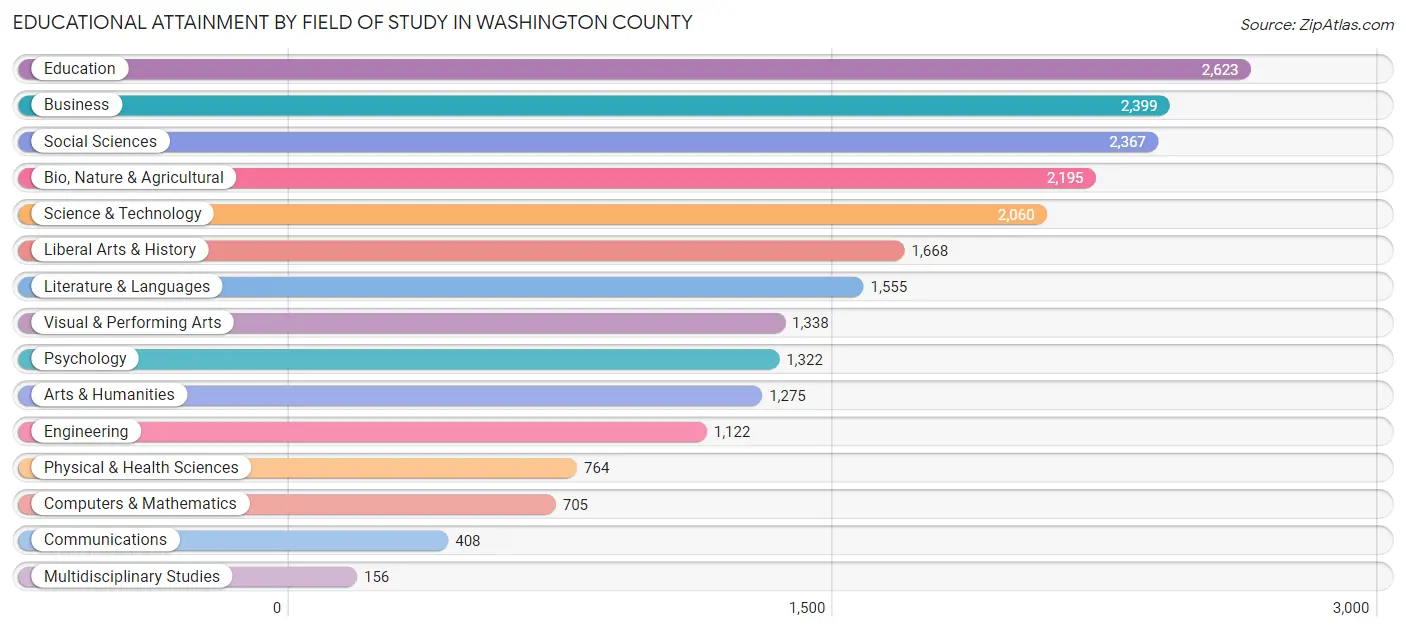
| Field of Study | # Graduates | % Graduates |
| Computers & Mathematics | 705 | 3.2% |
| Bio, Nature & Agricultural | 2,195 | 10.0% |
| Physical & Health Sciences | 764 | 3.5% |
| Psychology | 1,322 | 6.0% |
| Social Sciences | 2,367 | 10.8% |
| Engineering | 1,122 | 5.1% |
| Multidisciplinary Studies | 156 | 0.7% |
| Science & Technology | 2,060 | 9.4% |
| Business | 2,399 | 10.9% |
| Education | 2,623 | 11.9% |
| Literature & Languages | 1,555 | 7.1% |
| Liberal Arts & History | 1,668 | 7.6% |
| Visual & Performing Arts | 1,338 | 6.1% |
| Communications | 408 | 1.9% |
| Arts & Humanities | 1,275 | 5.8% |
| Total | 21,957 | 100.0% |
Transportation & Commute in Washington County
Vehicle Availability by Sex in Washington County
The most prevalent vehicle ownership categories in Washington County are males with 2 vehicles (8,325, accounting for 53.3%) and females with 2 vehicles (7,214, making up 56.1%).
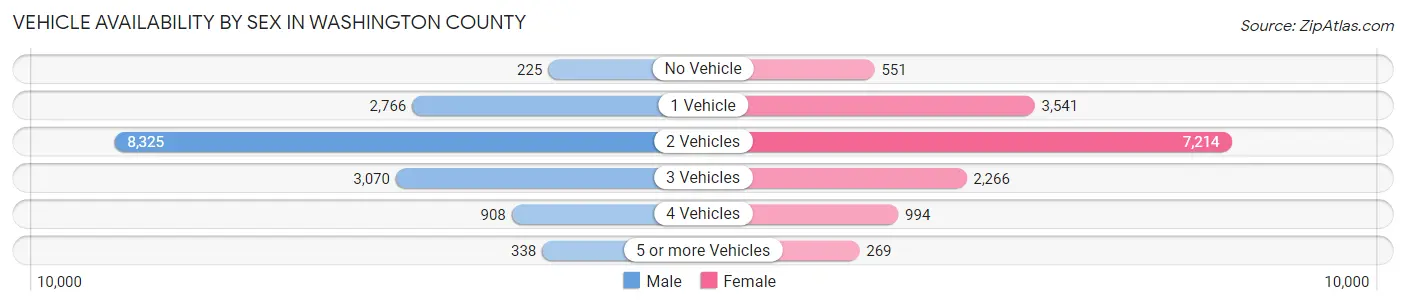
| Vehicles Available | Male | Female |
| No Vehicle | 225 (1.4%) | 551 (3.7%) |
| 1 Vehicle | 2,766 (17.7%) | 3,541 (23.9%) |
| 2 Vehicles | 8,325 (53.3%) | 7,214 (48.6%) |
| 3 Vehicles | 3,070 (19.6%) | 2,266 (15.3%) |
| 4 Vehicles | 908 (5.8%) | 994 (6.7%) |
| 5 or more Vehicles | 338 (2.2%) | 269 (1.8%) |
| Total | 15,632 (100.0%) | 14,835 (100.0%) |
Commute Time in Washington County
The most frequently occuring commute durations in Washington County are 15 to 19 minutes (4,096 commuters, 15.8%), 10 to 14 minutes (3,894 commuters, 15.0%), and 5 to 9 minutes (3,729 commuters, 14.3%).
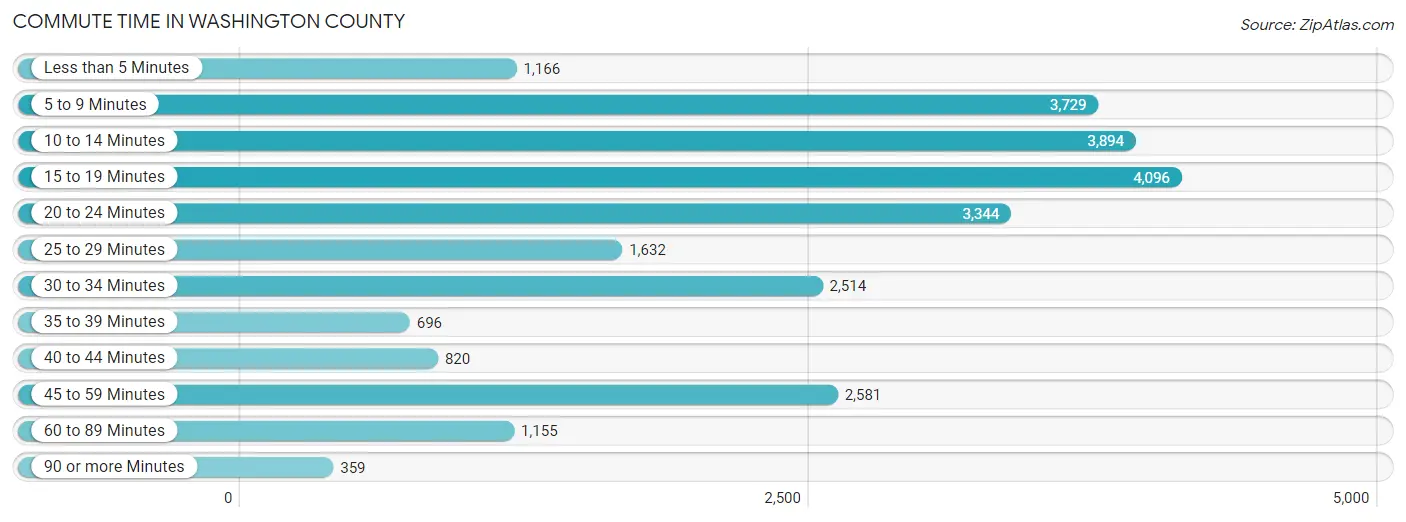
| Commute Time | # Commuters | % Commuters |
| Less than 5 Minutes | 1,166 | 4.5% |
| 5 to 9 Minutes | 3,729 | 14.3% |
| 10 to 14 Minutes | 3,894 | 15.0% |
| 15 to 19 Minutes | 4,096 | 15.8% |
| 20 to 24 Minutes | 3,344 | 12.9% |
| 25 to 29 Minutes | 1,632 | 6.3% |
| 30 to 34 Minutes | 2,514 | 9.7% |
| 35 to 39 Minutes | 696 | 2.7% |
| 40 to 44 Minutes | 820 | 3.2% |
| 45 to 59 Minutes | 2,581 | 9.9% |
| 60 to 89 Minutes | 1,155 | 4.4% |
| 90 or more Minutes | 359 | 1.4% |
Commute Time by Sex in Washington County
The most common commute times in Washington County are 10 to 14 minutes (2,286 commuters, 16.8%) for males and 15 to 19 minutes (2,145 commuters, 17.4%) for females.
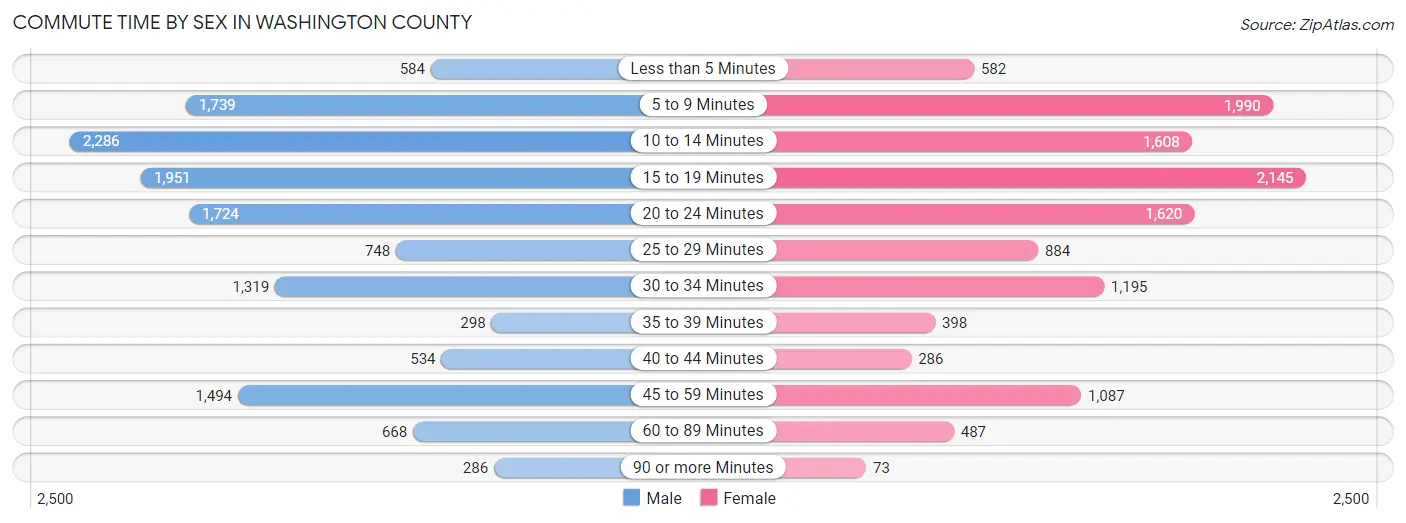
| Commute Time | Male | Female |
| Less than 5 Minutes | 584 (4.3%) | 582 (4.7%) |
| 5 to 9 Minutes | 1,739 (12.8%) | 1,990 (16.1%) |
| 10 to 14 Minutes | 2,286 (16.8%) | 1,608 (13.0%) |
| 15 to 19 Minutes | 1,951 (14.3%) | 2,145 (17.4%) |
| 20 to 24 Minutes | 1,724 (12.7%) | 1,620 (13.1%) |
| 25 to 29 Minutes | 748 (5.5%) | 884 (7.1%) |
| 30 to 34 Minutes | 1,319 (9.7%) | 1,195 (9.7%) |
| 35 to 39 Minutes | 298 (2.2%) | 398 (3.2%) |
| 40 to 44 Minutes | 534 (3.9%) | 286 (2.3%) |
| 45 to 59 Minutes | 1,494 (11.0%) | 1,087 (8.8%) |
| 60 to 89 Minutes | 668 (4.9%) | 487 (3.9%) |
| 90 or more Minutes | 286 (2.1%) | 73 (0.6%) |
Time of Departure to Work by Sex in Washington County
The most frequent times of departure to work in Washington County are 7:00 AM to 7:29 AM (2,142, 15.7%) for males and 7:00 AM to 7:29 AM (2,561, 20.7%) for females.
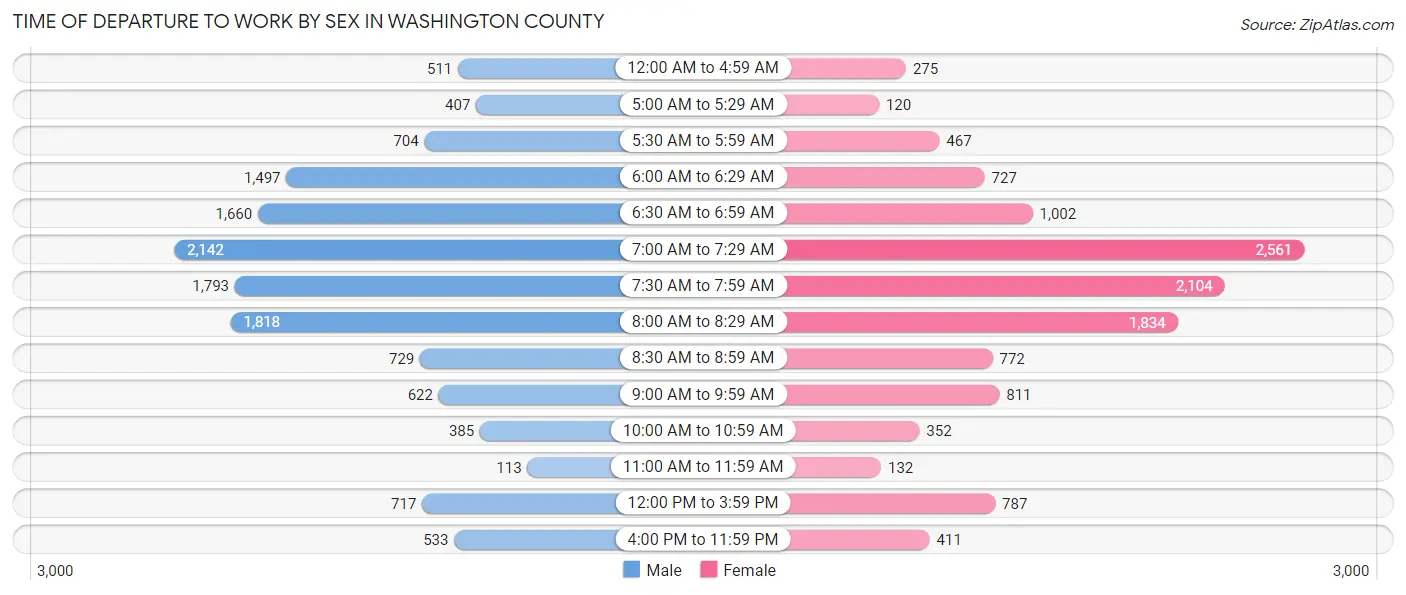
| Time of Departure | Male | Female |
| 12:00 AM to 4:59 AM | 511 (3.7%) | 275 (2.2%) |
| 5:00 AM to 5:29 AM | 407 (3.0%) | 120 (1.0%) |
| 5:30 AM to 5:59 AM | 704 (5.2%) | 467 (3.8%) |
| 6:00 AM to 6:29 AM | 1,497 (11.0%) | 727 (5.9%) |
| 6:30 AM to 6:59 AM | 1,660 (12.2%) | 1,002 (8.1%) |
| 7:00 AM to 7:29 AM | 2,142 (15.7%) | 2,561 (20.7%) |
| 7:30 AM to 7:59 AM | 1,793 (13.2%) | 2,104 (17.0%) |
| 8:00 AM to 8:29 AM | 1,818 (13.3%) | 1,834 (14.8%) |
| 8:30 AM to 8:59 AM | 729 (5.3%) | 772 (6.2%) |
| 9:00 AM to 9:59 AM | 622 (4.6%) | 811 (6.6%) |
| 10:00 AM to 10:59 AM | 385 (2.8%) | 352 (2.9%) |
| 11:00 AM to 11:59 AM | 113 (0.8%) | 132 (1.1%) |
| 12:00 PM to 3:59 PM | 717 (5.3%) | 787 (6.4%) |
| 4:00 PM to 11:59 PM | 533 (3.9%) | 411 (3.3%) |
| Total | 13,631 (100.0%) | 12,355 (100.0%) |
Housing Occupancy in Washington County
Occupancy by Ownership in Washington County
Of the total 25,166 dwellings in Washington County, owner-occupied units account for 18,285 (72.7%), while renter-occupied units make up 6,881 (27.3%).
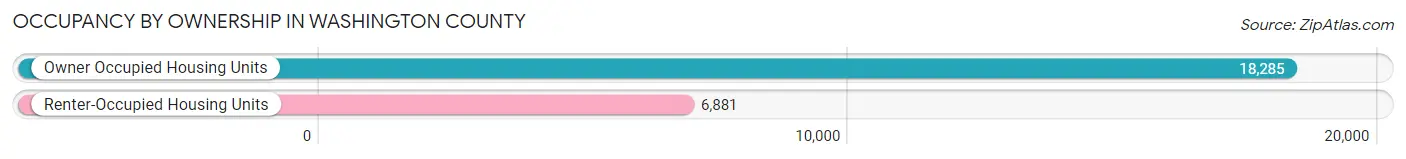
| Occupancy | # Housing Units | % Housing Units |
| Owner Occupied Housing Units | 18,285 | 72.7% |
| Renter-Occupied Housing Units | 6,881 | 27.3% |
| Total Occupied Housing Units | 25,166 | 100.0% |
Occupancy by Household Size in Washington County
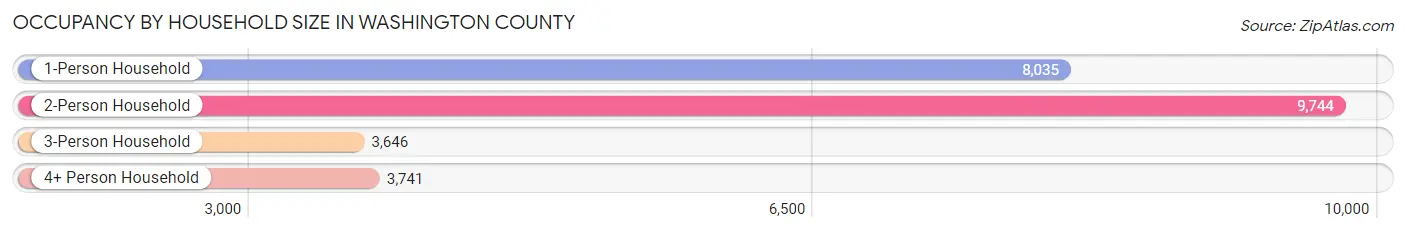
| Household Size | # Housing Units | % Housing Units |
| 1-Person Household | 8,035 | 31.9% |
| 2-Person Household | 9,744 | 38.7% |
| 3-Person Household | 3,646 | 14.5% |
| 4+ Person Household | 3,741 | 14.9% |
| Total Housing Units | 25,166 | 100.0% |
Occupancy by Ownership by Household Size in Washington County
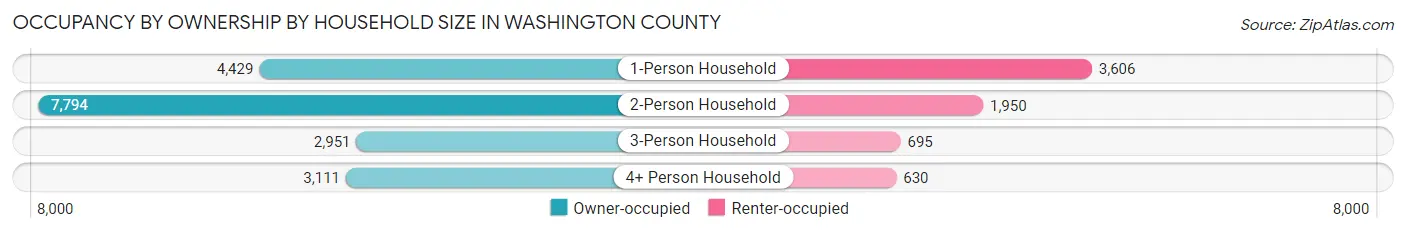
| Household Size | Owner-occupied | Renter-occupied |
| 1-Person Household | 4,429 (55.1%) | 3,606 (44.9%) |
| 2-Person Household | 7,794 (80.0%) | 1,950 (20.0%) |
| 3-Person Household | 2,951 (80.9%) | 695 (19.1%) |
| 4+ Person Household | 3,111 (83.2%) | 630 (16.8%) |
| Total Housing Units | 18,285 (72.7%) | 6,881 (27.3%) |
Occupancy by Educational Attainment in Washington County
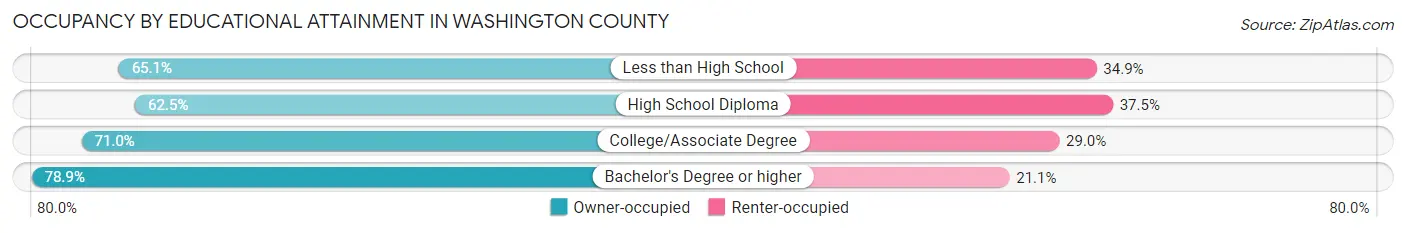
| Household Size | Owner-occupied | Renter-occupied |
| Less than High School | 557 (65.1%) | 299 (34.9%) |
| High School Diploma | 3,718 (62.5%) | 2,233 (37.5%) |
| College/Associate Degree | 4,244 (71.0%) | 1,735 (29.0%) |
| Bachelor's Degree or higher | 9,766 (78.9%) | 2,614 (21.1%) |
Occupancy by Age of Householder in Washington County
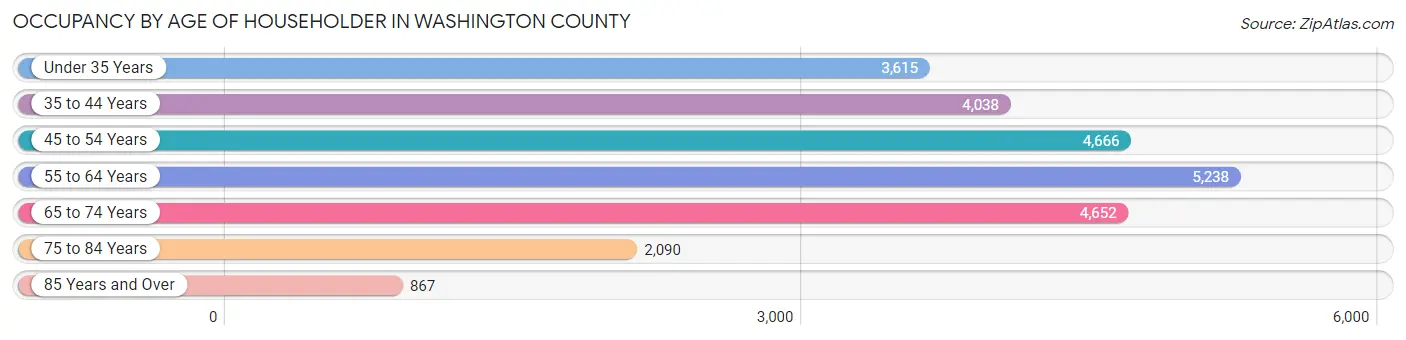
| Age Bracket | # Households | % Households |
| Under 35 Years | 3,615 | 14.4% |
| 35 to 44 Years | 4,038 | 16.1% |
| 45 to 54 Years | 4,666 | 18.5% |
| 55 to 64 Years | 5,238 | 20.8% |
| 65 to 74 Years | 4,652 | 18.5% |
| 75 to 84 Years | 2,090 | 8.3% |
| 85 Years and Over | 867 | 3.5% |
| Total | 25,166 | 100.0% |
Housing Finances in Washington County
Median Income by Occupancy in Washington County
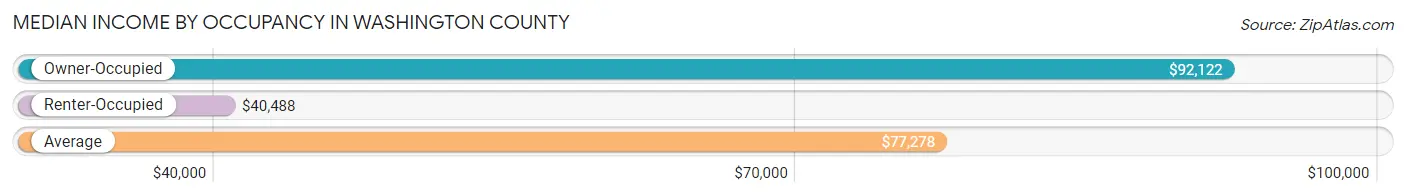
| Occupancy Type | # Households | Median Income |
| Owner-Occupied | 18,285 (72.7%) | $92,122 |
| Renter-Occupied | 6,881 (27.3%) | $40,488 |
| Average | 25,166 (100.0%) | $77,278 |
Occupancy by Householder Income Bracket in Washington County
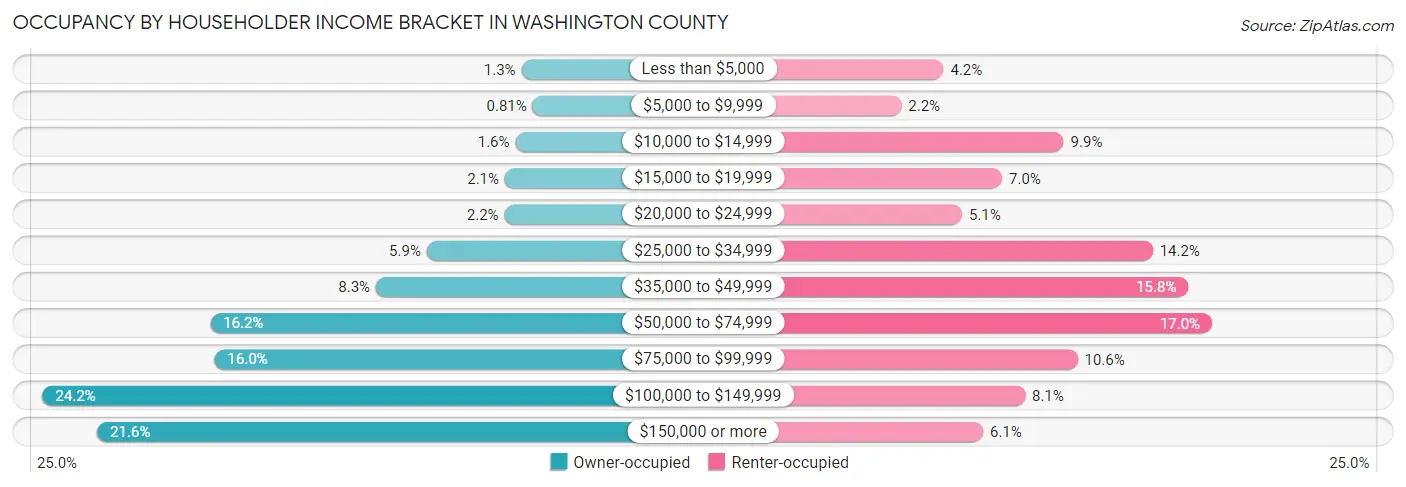
| Income Bracket | Owner-occupied | Renter-occupied |
| Less than $5,000 | 245 (1.3%) | 288 (4.2%) |
| $5,000 to $9,999 | 148 (0.8%) | 150 (2.2%) |
| $10,000 to $14,999 | 298 (1.6%) | 682 (9.9%) |
| $15,000 to $19,999 | 389 (2.1%) | 480 (7.0%) |
| $20,000 to $24,999 | 394 (2.1%) | 349 (5.1%) |
| $25,000 to $34,999 | 1,070 (5.9%) | 974 (14.1%) |
| $35,000 to $49,999 | 1,513 (8.3%) | 1,090 (15.8%) |
| $50,000 to $74,999 | 2,955 (16.2%) | 1,168 (17.0%) |
| $75,000 to $99,999 | 2,918 (16.0%) | 727 (10.6%) |
| $100,000 to $149,999 | 4,415 (24.1%) | 555 (8.1%) |
| $150,000 or more | 3,940 (21.5%) | 418 (6.1%) |
| Total | 18,285 (100.0%) | 6,881 (100.0%) |
Monthly Housing Cost Tiers in Washington County
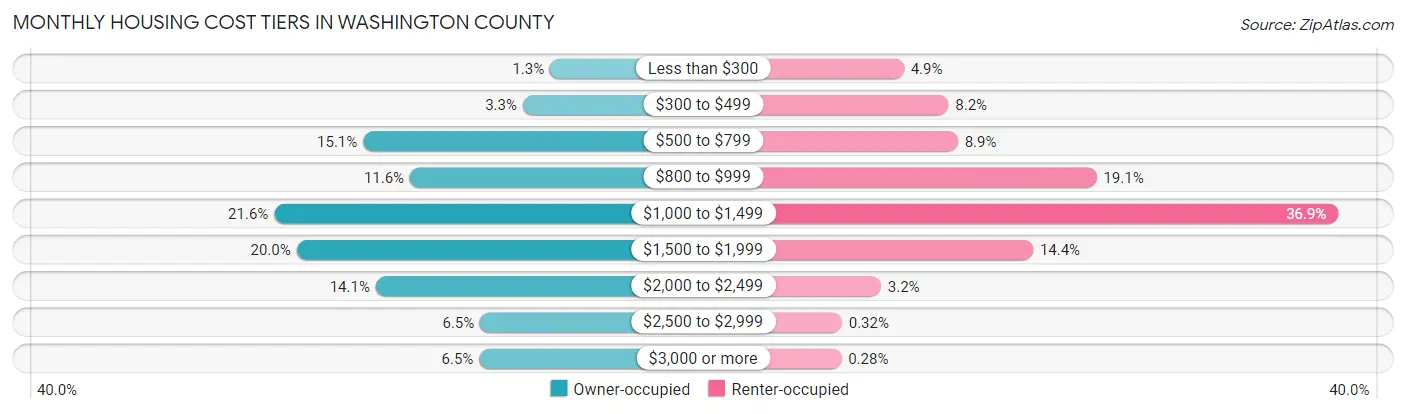
| Monthly Cost | Owner-occupied | Renter-occupied |
| Less than $300 | 238 (1.3%) | 336 (4.9%) |
| $300 to $499 | 606 (3.3%) | 562 (8.2%) |
| $500 to $799 | 2,755 (15.1%) | 610 (8.9%) |
| $800 to $999 | 2,125 (11.6%) | 1,313 (19.1%) |
| $1,000 to $1,499 | 3,954 (21.6%) | 2,538 (36.9%) |
| $1,500 to $1,999 | 3,651 (20.0%) | 991 (14.4%) |
| $2,000 to $2,499 | 2,585 (14.1%) | 220 (3.2%) |
| $2,500 to $2,999 | 1,179 (6.5%) | 22 (0.3%) |
| $3,000 or more | 1,192 (6.5%) | 19 (0.3%) |
| Total | 18,285 (100.0%) | 6,881 (100.0%) |
Physical Housing Characteristics in Washington County
Housing Structures in Washington County
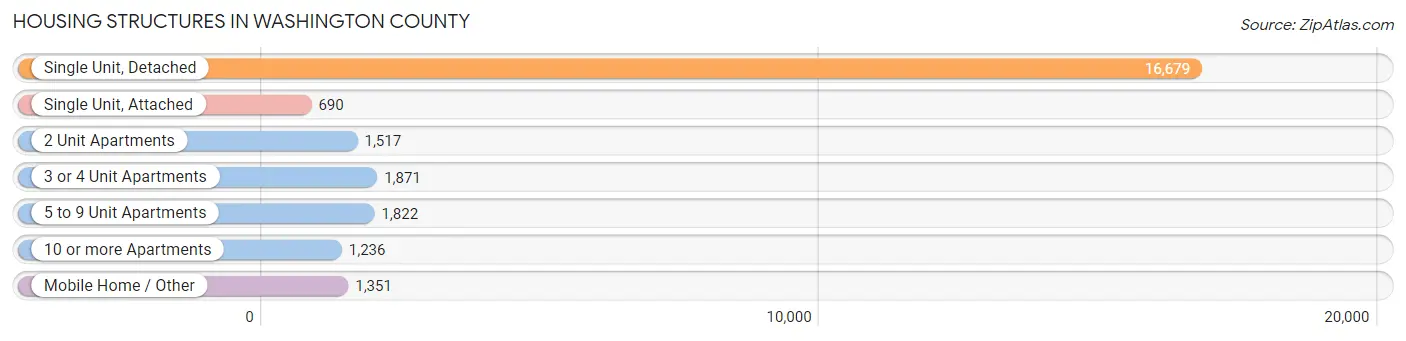
| Structure Type | # Housing Units | % Housing Units |
| Single Unit, Detached | 16,679 | 66.3% |
| Single Unit, Attached | 690 | 2.7% |
| 2 Unit Apartments | 1,517 | 6.0% |
| 3 or 4 Unit Apartments | 1,871 | 7.4% |
| 5 to 9 Unit Apartments | 1,822 | 7.2% |
| 10 or more Apartments | 1,236 | 4.9% |
| Mobile Home / Other | 1,351 | 5.4% |
| Total | 25,166 | 100.0% |
Housing Structures by Occupancy in Washington County
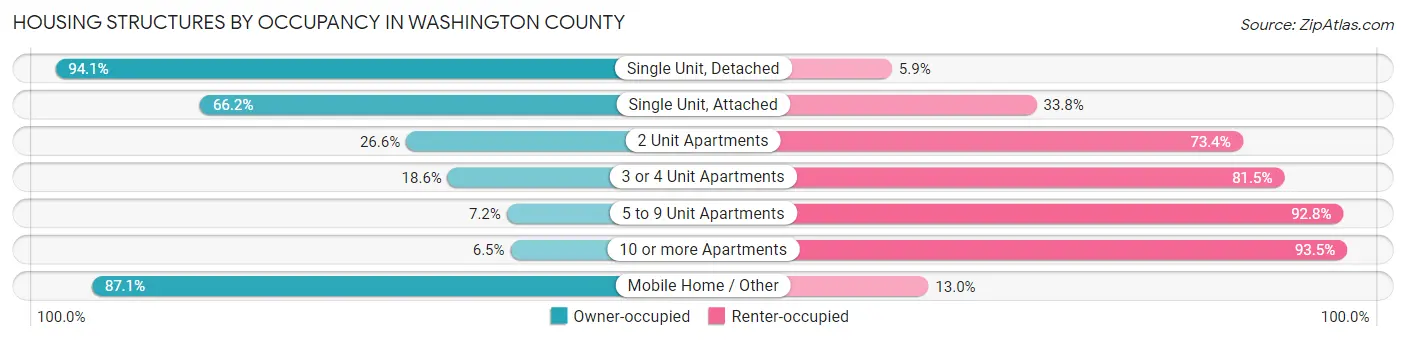
| Structure Type | Owner-occupied | Renter-occupied |
| Single Unit, Detached | 15,691 (94.1%) | 988 (5.9%) |
| Single Unit, Attached | 457 (66.2%) | 233 (33.8%) |
| 2 Unit Apartments | 403 (26.6%) | 1,114 (73.4%) |
| 3 or 4 Unit Apartments | 347 (18.5%) | 1,524 (81.5%) |
| 5 to 9 Unit Apartments | 131 (7.2%) | 1,691 (92.8%) |
| 10 or more Apartments | 80 (6.5%) | 1,156 (93.5%) |
| Mobile Home / Other | 1,176 (87.1%) | 175 (13.0%) |
| Total | 18,285 (72.7%) | 6,881 (27.3%) |
Housing Structures by Number of Rooms in Washington County
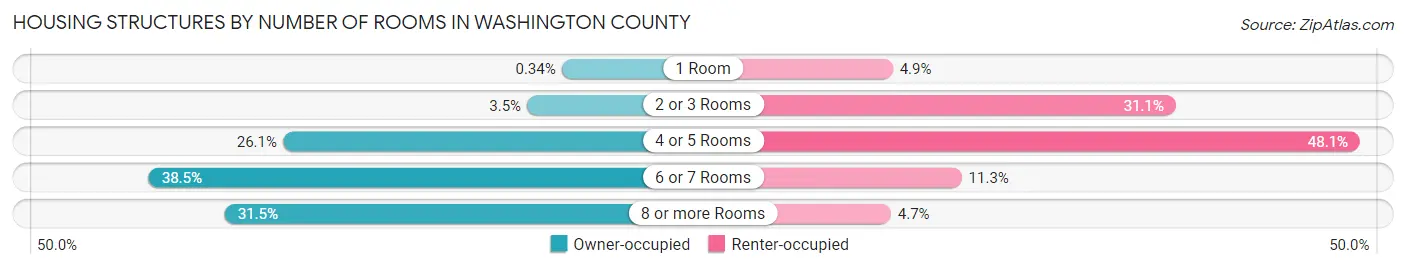
| Number of Rooms | Owner-occupied | Renter-occupied |
| 1 Room | 63 (0.3%) | 336 (4.9%) |
| 2 or 3 Rooms | 648 (3.5%) | 2,137 (31.1%) |
| 4 or 5 Rooms | 4,776 (26.1%) | 3,309 (48.1%) |
| 6 or 7 Rooms | 7,042 (38.5%) | 775 (11.3%) |
| 8 or more Rooms | 5,756 (31.5%) | 324 (4.7%) |
| Total | 18,285 (100.0%) | 6,881 (100.0%) |
Housing Structure by Heating Type in Washington County
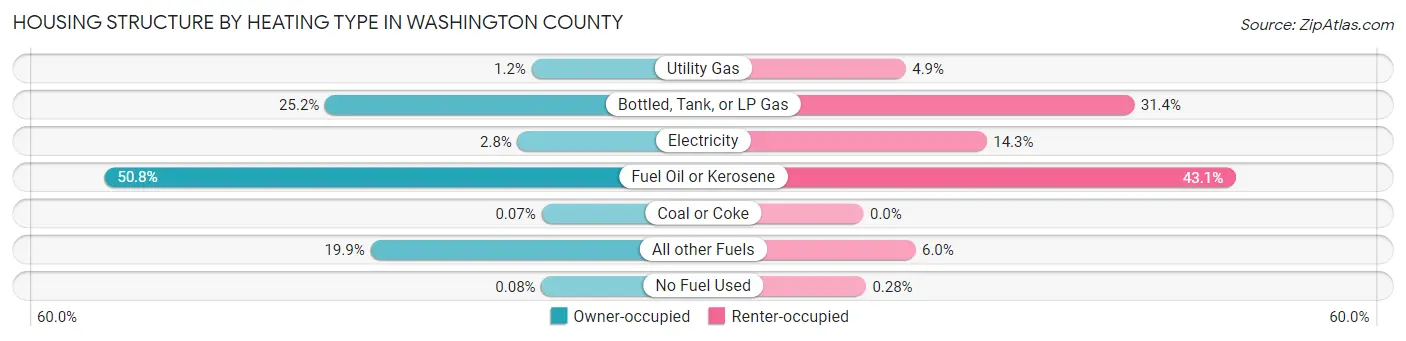
| Heating Type | Owner-occupied | Renter-occupied |
| Utility Gas | 222 (1.2%) | 337 (4.9%) |
| Bottled, Tank, or LP Gas | 4,598 (25.2%) | 2,160 (31.4%) |
| Electricity | 518 (2.8%) | 983 (14.3%) |
| Fuel Oil or Kerosene | 9,281 (50.8%) | 2,967 (43.1%) |
| Coal or Coke | 12 (0.1%) | 0 (0.0%) |
| All other Fuels | 3,639 (19.9%) | 415 (6.0%) |
| No Fuel Used | 15 (0.1%) | 19 (0.3%) |
| Total | 18,285 (100.0%) | 6,881 (100.0%) |
Household Vehicle Usage in Washington County
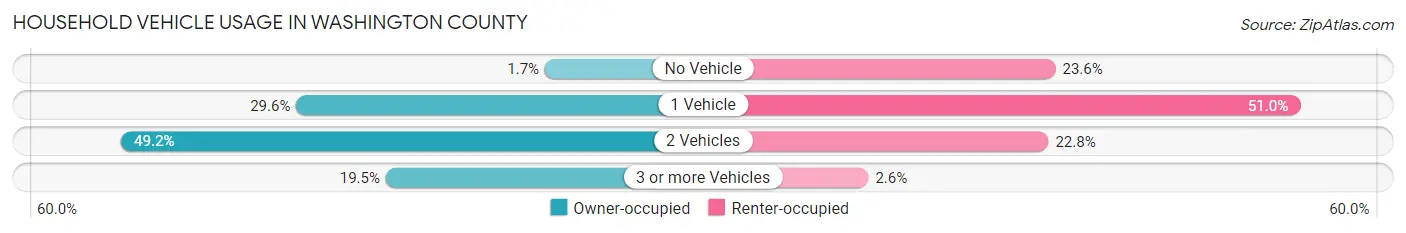
| Vehicles per Household | Owner-occupied | Renter-occupied |
| No Vehicle | 313 (1.7%) | 1,623 (23.6%) |
| 1 Vehicle | 5,406 (29.6%) | 3,507 (51.0%) |
| 2 Vehicles | 8,993 (49.2%) | 1,569 (22.8%) |
| 3 or more Vehicles | 3,573 (19.5%) | 182 (2.6%) |
| Total | 18,285 (100.0%) | 6,881 (100.0%) |
Real Estate & Mortgages in Washington County
Real Estate and Mortgage Overview in Washington County
| Characteristic | Without Mortgage | With Mortgage |
| Housing Units | 6,955 | 11,330 |
| Median Property Value | $251,300 | $288,900 |
| Median Household Income | $68,006 | $2,948 |
| Monthly Housing Costs | $807 | $1,174 |
| Real Estate Taxes | $5,159 | $88 |
Property Value by Mortgage Status in Washington County
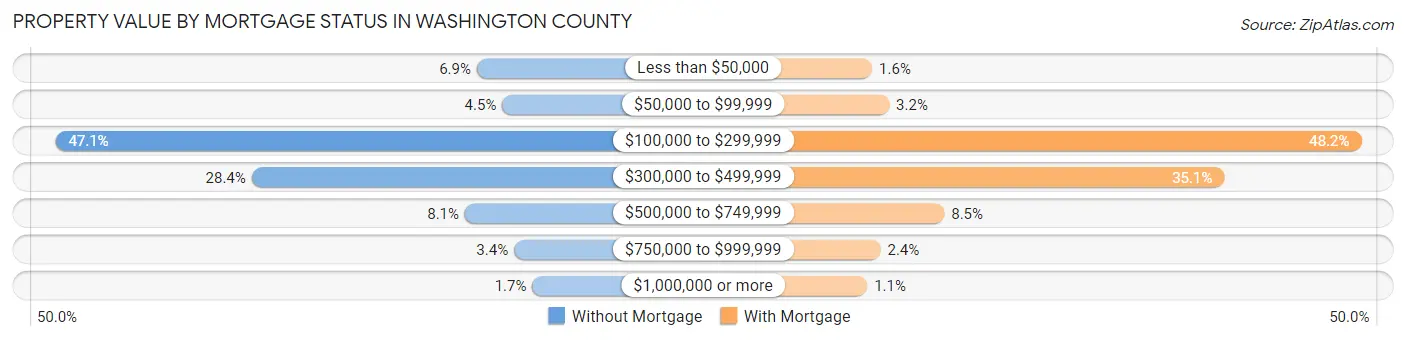
| Property Value | Without Mortgage | With Mortgage |
| Less than $50,000 | 482 (6.9%) | 179 (1.6%) |
| $50,000 to $99,999 | 314 (4.5%) | 362 (3.2%) |
| $100,000 to $299,999 | 3,273 (47.1%) | 5,458 (48.2%) |
| $300,000 to $499,999 | 1,974 (28.4%) | 3,978 (35.1%) |
| $500,000 to $749,999 | 561 (8.1%) | 957 (8.5%) |
| $750,000 to $999,999 | 236 (3.4%) | 270 (2.4%) |
| $1,000,000 or more | 115 (1.7%) | 126 (1.1%) |
| Total | 6,955 (100.0%) | 11,330 (100.0%) |
Household Income by Mortgage Status in Washington County
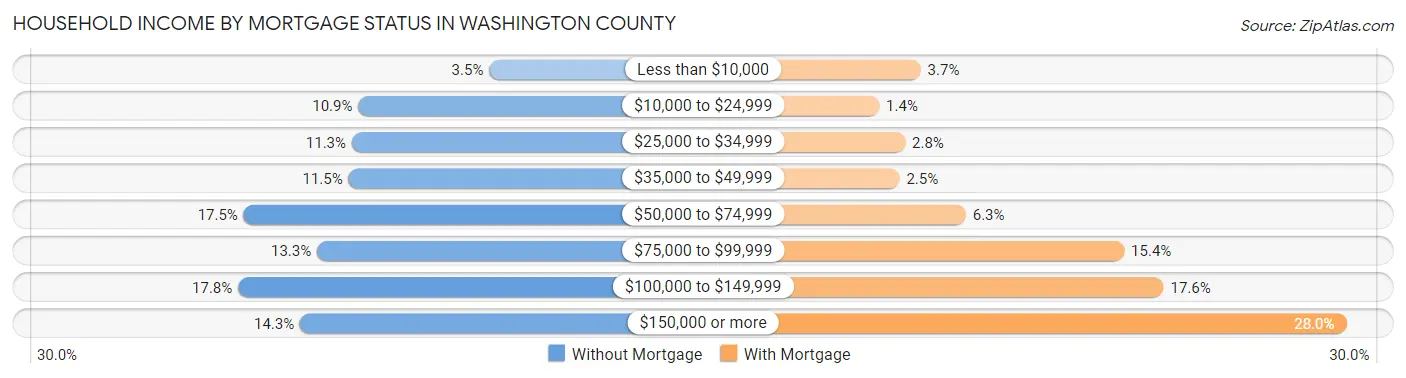
| Household Income | Without Mortgage | With Mortgage |
| Less than $10,000 | 240 (3.5%) | 421 (3.7%) |
| $10,000 to $24,999 | 760 (10.9%) | 153 (1.3%) |
| $25,000 to $34,999 | 786 (11.3%) | 321 (2.8%) |
| $35,000 to $49,999 | 799 (11.5%) | 284 (2.5%) |
| $50,000 to $74,999 | 1,216 (17.5%) | 714 (6.3%) |
| $75,000 to $99,999 | 924 (13.3%) | 1,739 (15.3%) |
| $100,000 to $149,999 | 1,238 (17.8%) | 1,994 (17.6%) |
| $150,000 or more | 992 (14.3%) | 3,177 (28.0%) |
| Total | 6,955 (100.0%) | 11,330 (100.0%) |
Property Value to Household Income Ratio in Washington County
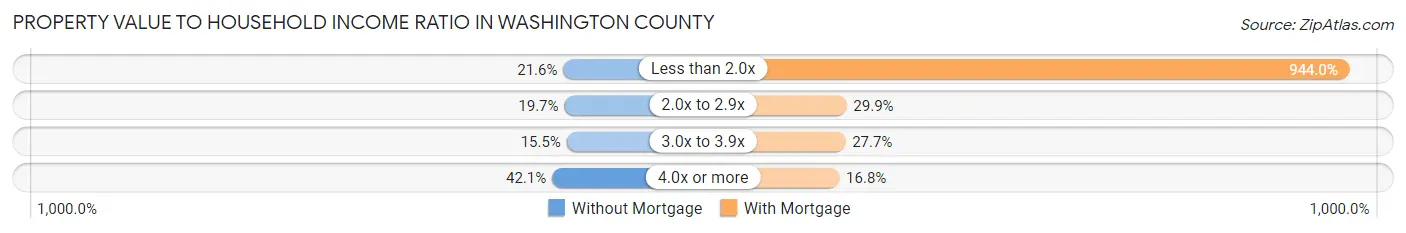
| Value-to-Income Ratio | Without Mortgage | With Mortgage |
| Less than 2.0x | 1,503 (21.6%) | 106,952 (944.0%) |
| 2.0x to 2.9x | 1,371 (19.7%) | 3,391 (29.9%) |
| 3.0x to 3.9x | 1,078 (15.5%) | 3,142 (27.7%) |
| 4.0x or more | 2,926 (42.1%) | 1,905 (16.8%) |
| Total | 6,955 (100.0%) | 11,330 (100.0%) |
Real Estate Taxes by Mortgage Status in Washington County
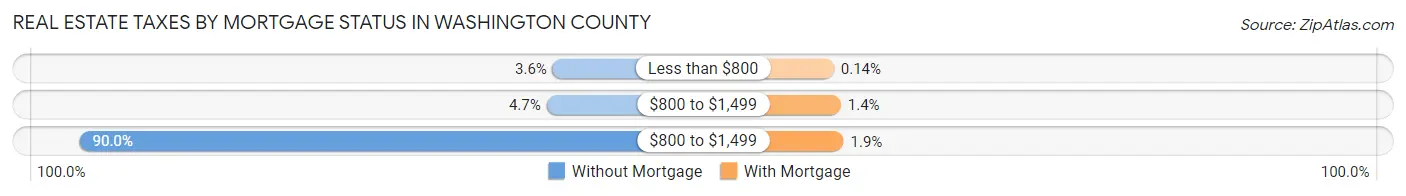
| Property Taxes | Without Mortgage | With Mortgage |
| Less than $800 | 247 (3.5%) | 16 (0.1%) |
| $800 to $1,499 | 325 (4.7%) | 162 (1.4%) |
| $800 to $1,499 | 6,256 (89.9%) | 217 (1.9%) |
| Total | 6,955 (100.0%) | 11,330 (100.0%) |
Health & Disability in Washington County
Health Insurance Coverage by Age in Washington County
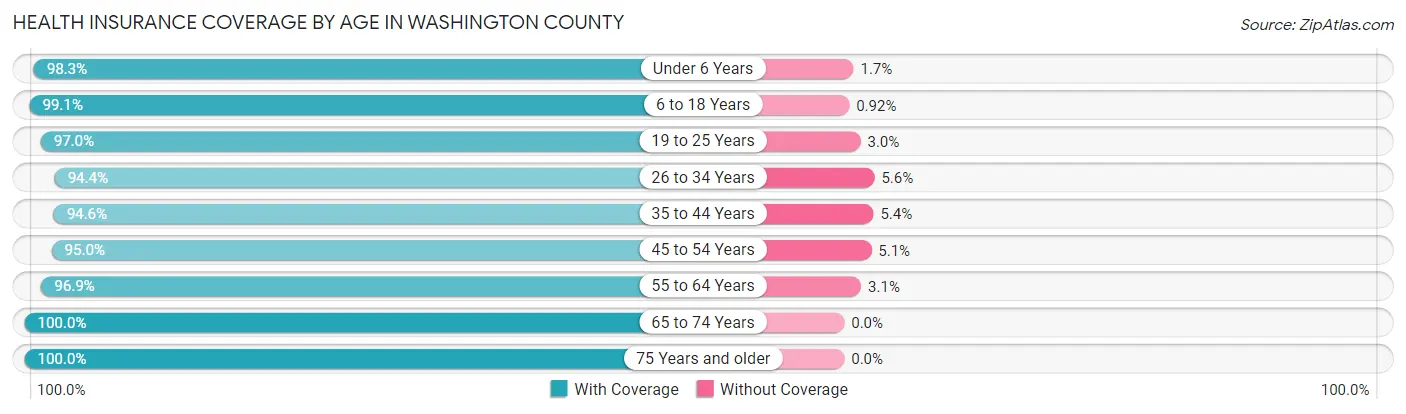
| Age Bracket | With Coverage | Without Coverage |
| Under 6 Years | 3,037 (98.3%) | 53 (1.7%) |
| 6 to 18 Years | 8,714 (99.1%) | 81 (0.9%) |
| 19 to 25 Years | 4,806 (97.0%) | 150 (3.0%) |
| 26 to 34 Years | 5,931 (94.4%) | 354 (5.6%) |
| 35 to 44 Years | 6,917 (94.6%) | 398 (5.4%) |
| 45 to 54 Years | 7,406 (95.0%) | 394 (5.1%) |
| 55 to 64 Years | 8,791 (96.9%) | 285 (3.1%) |
| 65 to 74 Years | 7,432 (100.0%) | 0 (0.0%) |
| 75 Years and older | 4,394 (100.0%) | 0 (0.0%) |
| Total | 57,428 (97.1%) | 1,715 (2.9%) |
Health Insurance Coverage by Citizenship Status in Washington County
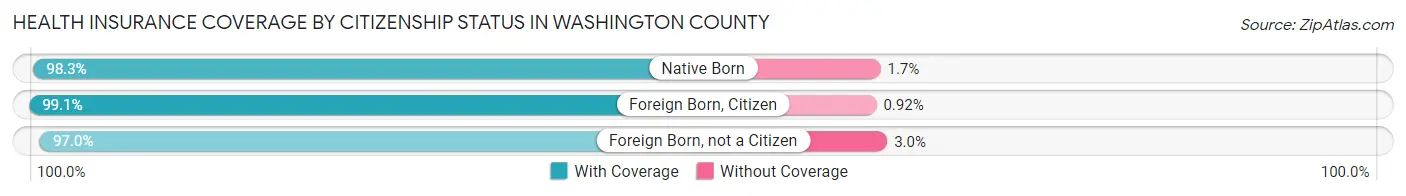
| Citizenship Status | With Coverage | Without Coverage |
| Native Born | 3,037 (98.3%) | 53 (1.7%) |
| Foreign Born, Citizen | 8,714 (99.1%) | 81 (0.9%) |
| Foreign Born, not a Citizen | 4,806 (97.0%) | 150 (3.0%) |
Health Insurance Coverage by Household Income in Washington County
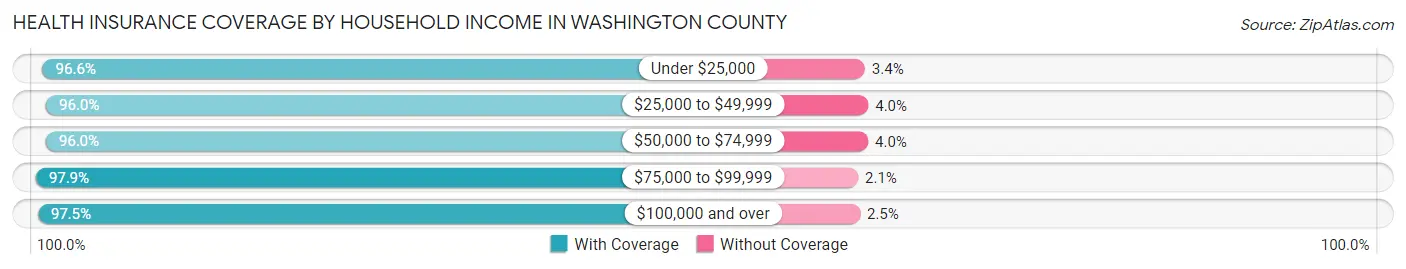
| Household Income | With Coverage | Without Coverage |
| Under $25,000 | 4,822 (96.6%) | 169 (3.4%) |
| $25,000 to $49,999 | 8,092 (96.0%) | 340 (4.0%) |
| $50,000 to $74,999 | 8,070 (96.0%) | 335 (4.0%) |
| $75,000 to $99,999 | 8,567 (97.9%) | 186 (2.1%) |
| $100,000 and over | 26,160 (97.5%) | 665 (2.5%) |
Public vs Private Health Insurance Coverage by Age in Washington County
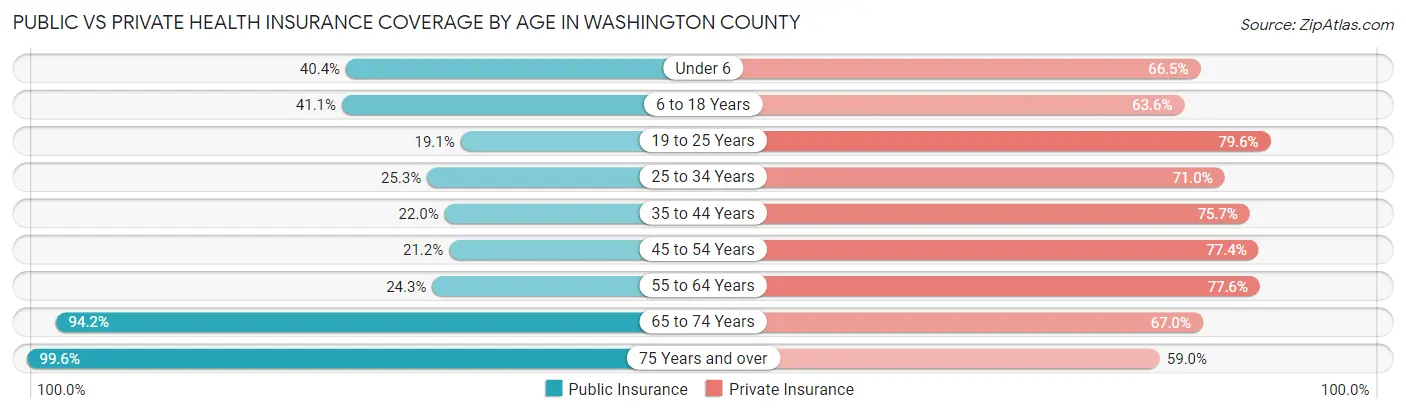
| Age Bracket | Public Insurance | Private Insurance |
| Under 6 | 1,247 (40.4%) | 2,056 (66.5%) |
| 6 to 18 Years | 3,616 (41.1%) | 5,591 (63.6%) |
| 19 to 25 Years | 946 (19.1%) | 3,943 (79.6%) |
| 25 to 34 Years | 1,590 (25.3%) | 4,464 (71.0%) |
| 35 to 44 Years | 1,612 (22.0%) | 5,538 (75.7%) |
| 45 to 54 Years | 1,654 (21.2%) | 6,035 (77.4%) |
| 55 to 64 Years | 2,209 (24.3%) | 7,042 (77.6%) |
| 65 to 74 Years | 7,004 (94.2%) | 4,980 (67.0%) |
| 75 Years and over | 4,378 (99.6%) | 2,594 (59.0%) |
| Total | 24,256 (41.0%) | 42,243 (71.4%) |
Disability Status by Sex by Age in Washington County
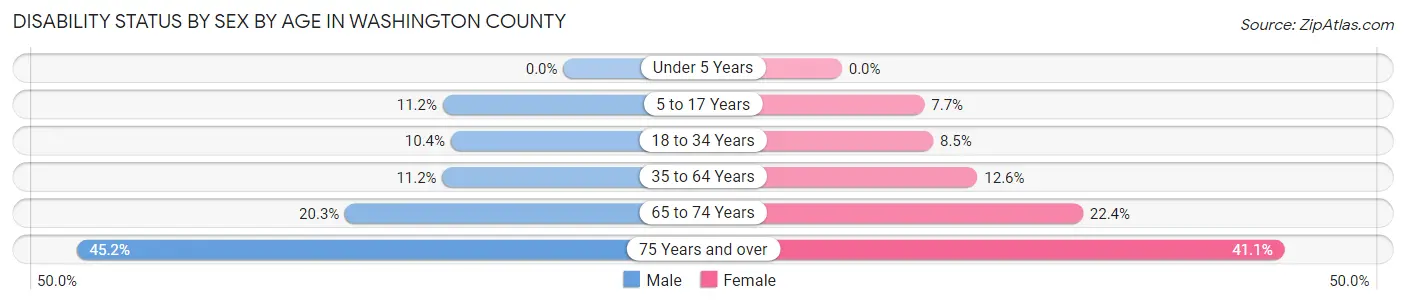
| Age Bracket | Male | Female |
| Under 5 Years | 0 (0.0%) | 0 (0.0%) |
| 5 to 17 Years | 485 (11.2%) | 308 (7.7%) |
| 18 to 34 Years | 668 (10.4%) | 490 (8.5%) |
| 35 to 64 Years | 1,345 (11.2%) | 1,535 (12.6%) |
| 65 to 74 Years | 730 (20.3%) | 856 (22.4%) |
| 75 Years and over | 818 (45.2%) | 1,061 (41.1%) |
Disability Class by Sex by Age in Washington County
Disability Class: Hearing Difficulty
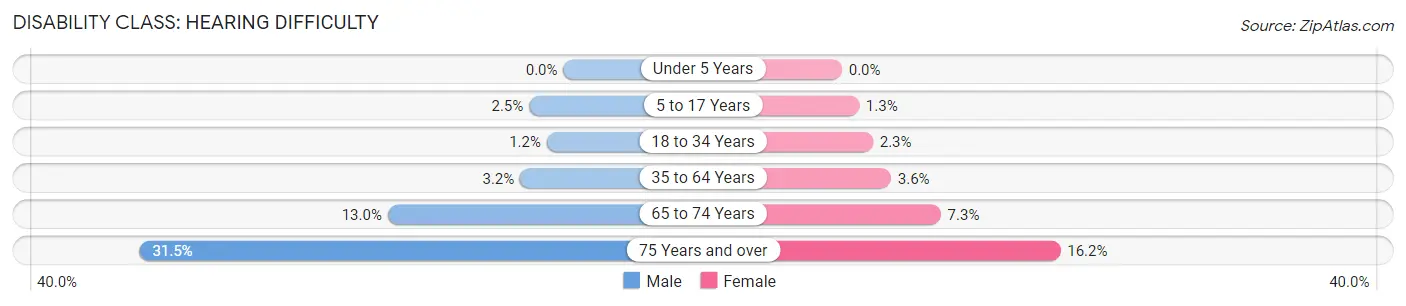
| Age Bracket | Male | Female |
| Under 5 Years | 0 (0.0%) | 0 (0.0%) |
| 5 to 17 Years | 110 (2.5%) | 51 (1.3%) |
| 18 to 34 Years | 79 (1.2%) | 133 (2.3%) |
| 35 to 64 Years | 385 (3.2%) | 444 (3.6%) |
| 65 to 74 Years | 470 (13.0%) | 281 (7.3%) |
| 75 Years and over | 570 (31.5%) | 419 (16.2%) |
Disability Class: Vision Difficulty
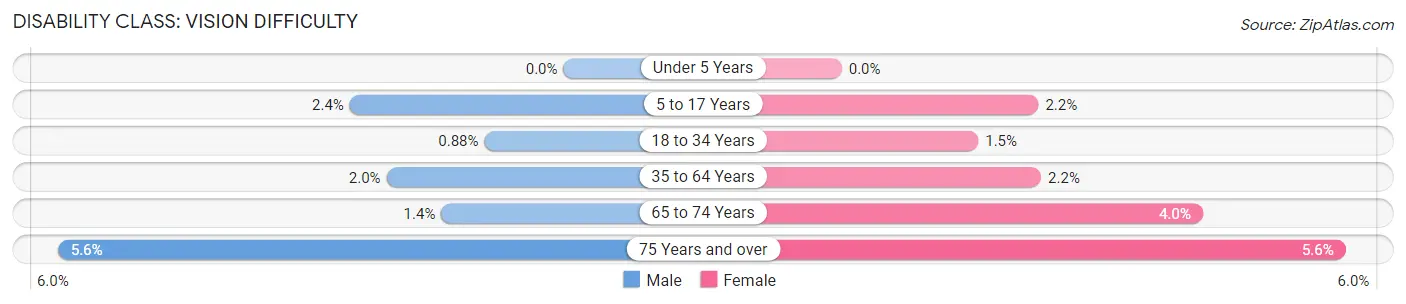
| Age Bracket | Male | Female |
| Under 5 Years | 0 (0.0%) | 0 (0.0%) |
| 5 to 17 Years | 103 (2.4%) | 88 (2.2%) |
| 18 to 34 Years | 56 (0.9%) | 88 (1.5%) |
| 35 to 64 Years | 236 (2.0%) | 271 (2.2%) |
| 65 to 74 Years | 49 (1.4%) | 154 (4.0%) |
| 75 Years and over | 102 (5.6%) | 145 (5.6%) |
Disability Class: Cognitive Difficulty
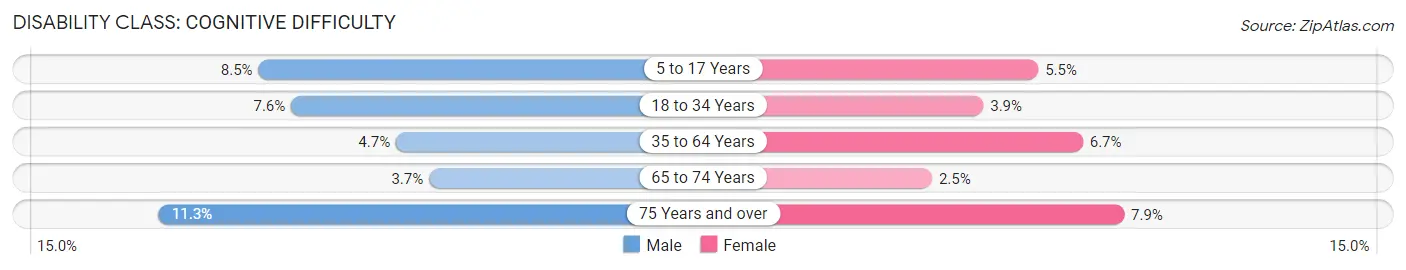
| Age Bracket | Male | Female |
| 5 to 17 Years | 368 (8.5%) | 220 (5.5%) |
| 18 to 34 Years | 485 (7.6%) | 228 (3.9%) |
| 35 to 64 Years | 559 (4.7%) | 819 (6.7%) |
| 65 to 74 Years | 135 (3.7%) | 96 (2.5%) |
| 75 Years and over | 204 (11.3%) | 203 (7.9%) |
Disability Class: Ambulatory Difficulty
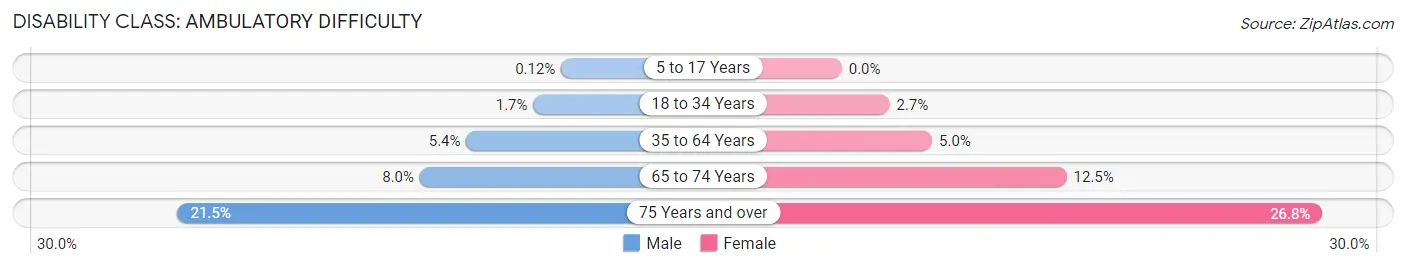
| Age Bracket | Male | Female |
| 5 to 17 Years | 5 (0.1%) | 0 (0.0%) |
| 18 to 34 Years | 107 (1.7%) | 154 (2.7%) |
| 35 to 64 Years | 647 (5.4%) | 614 (5.0%) |
| 65 to 74 Years | 288 (8.0%) | 479 (12.5%) |
| 75 Years and over | 389 (21.5%) | 691 (26.8%) |
Disability Class: Self-Care Difficulty
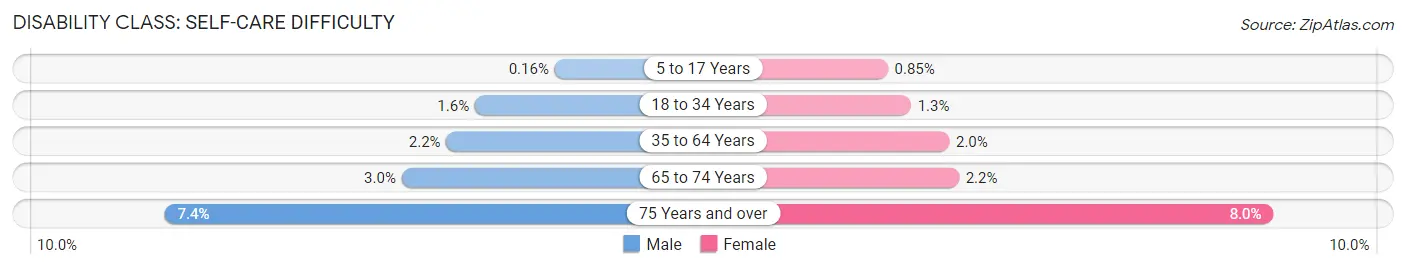
| Age Bracket | Male | Female |
| 5 to 17 Years | 7 (0.2%) | 34 (0.9%) |
| 18 to 34 Years | 105 (1.6%) | 74 (1.3%) |
| 35 to 64 Years | 260 (2.2%) | 243 (2.0%) |
| 65 to 74 Years | 108 (3.0%) | 83 (2.2%) |
| 75 Years and over | 134 (7.4%) | 207 (8.0%) |
Technology Access in Washington County
Computing Device Access in Washington County
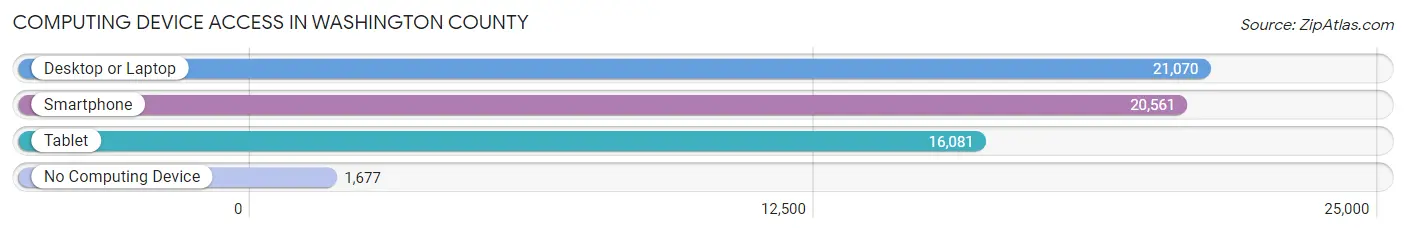
| Device Type | # Households | % Households |
| Desktop or Laptop | 21,070 | 83.7% |
| Smartphone | 20,561 | 81.7% |
| Tablet | 16,081 | 63.9% |
| No Computing Device | 1,677 | 6.7% |
| Total | 25,166 | 100.0% |
Internet Access in Washington County
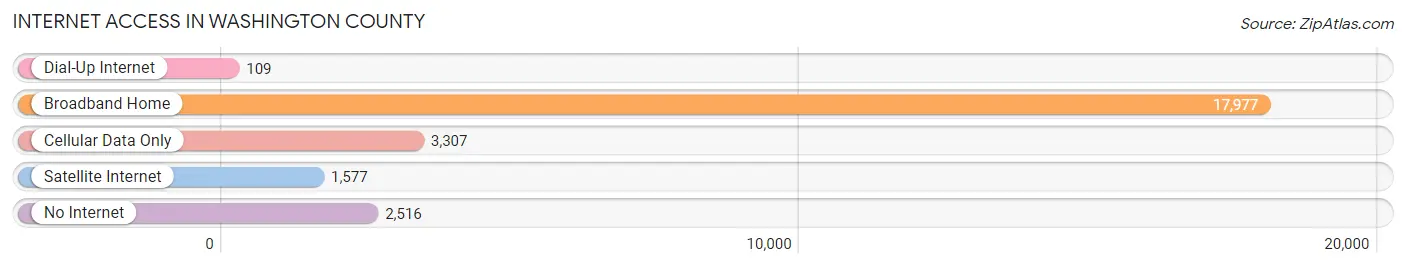
| Internet Type | # Households | % Households |
| Dial-Up Internet | 109 | 0.4% |
| Broadband Home | 17,977 | 71.4% |
| Cellular Data Only | 3,307 | 13.1% |
| Satellite Internet | 1,577 | 6.3% |
| No Internet | 2,516 | 10.0% |
| Total | 25,166 | 100.0% |
Washington County Summary
Washington County, Vermont is located in the northeastern corner of the state and is bordered by Canada to the north, the state of New York to the east, and the state of Massachusetts to the south. The county is home to a population of approximately 59,000 people, and is the least populous county in the state. The county seat is the town of Montpelier, which is also the state capital.
Geography
Washington County is located in the Green Mountains region of Vermont, and is characterized by rolling hills, forests, and numerous rivers and streams. The highest point in the county is Mount Mansfield, which is 4,393 feet above sea level. The county is home to several state parks, including Groton State Forest, Camel’s Hump State Park, and Little River State Park.
Economy
Washington County’s economy is largely based on agriculture, forestry, and tourism. The county is home to several dairy farms, as well as a number of apple orchards. The county is also home to several ski resorts, including Stowe Mountain Resort and Smugglers’ Notch Resort. Tourism is a major contributor to the county’s economy, with visitors coming from all over the world to enjoy the area’s natural beauty.
Demographics
As of the 2010 census, the population of Washington County was 59,521. The racial makeup of the county was 95.3% White, 1.2% African American, 0.5% Native American, 0.7% Asian, 0.1% Pacific Islander, 0.7% from other races, and 1.5% from two or more races. Hispanic or Latino of any race were 2.2% of the population.
The median income for a household in the county was $50,945, and the median income for a family was $62,917. The per capita income for the county was $27,845. About 8.2% of families and 11.2% of the population were below the poverty line, including 14.2% of those under age 18 and 6.2% of those age 65 or over.
Education
Washington County is served by the Washington Central Supervisory Union, which includes seven public school districts. The county is also home to several private schools, including the Vermont Academy, the Vermont Commons School, and the Montpelier-based Vermont College of Fine Arts.
Conclusion
Washington County, Vermont is a rural county located in the northeastern corner of the state. The county is home to a population of approximately 59,000 people, and is characterized by rolling hills, forests, and numerous rivers and streams. The county’s economy is largely based on agriculture, forestry, and tourism, and the county is home to several ski resorts and state parks. The county is served by seven public school districts, as well as several private schools.
Common Questions
What is the Total Population of Washington County?
Total Population of Washington County is 59,768.
What is the Total Male Population of Washington County?
Total Male Population of Washington County is 29,775.
What is the Total Female Population of Washington County?
Total Female Population of Washington County is 29,993.
What is the Ratio of Males per 100 Females in Washington County?
There are 99.27 Males per 100 Females in Washington County.
What is the Ratio of Females per 100 Males in Washington County?
There are 100.73 Females per 100 Males in Washington County.
What is the Median Population Age in Washington County?
Median Population Age in Washington County is 43.8 Years.
What is the Average Family Size in Washington County
Average Family Size in Washington County is 2.9 People.
What is the Average Household Size in Washington County
Average Household Size in Washington County is 2.3 People.
What is Per Capita Income in Washington County?
Per Capita income in Washington County is $43,002.
What is the Median Family Income in Washington County?
Median Family Income in Washington County is $99,315.
What is the Median Household income in Washington County?
Median Household Income in Washington County is $77,278.
What is Income or Wage Gap in Washington County?
Income or Wage Gap in Washington County is 2.3%.
Women in Washington County earn 97.7 cents for every dollar earned by a man.
What is Family Income Deficit in Washington County?
Family Income Deficit in Washington County is $11,703.
Families that are below poverty line in Washington County earn $11,703 less on average than the poverty threshold level.
What is Inequality or Gini Index in Washington County?
Inequality or Gini Index in Washington County is 0.44.
How Large is the Labor Force in Washington County?
There are 32,501 People in the Labor Forcein in Washington County.
What is the Percentage of People in the Labor Force in Washington County?
64.7% of People are in the Labor Force in Washington County.
What is the Unemployment Rate in Washington County?
Unemployment Rate in Washington County is 3.0%.