Rutland County, VT
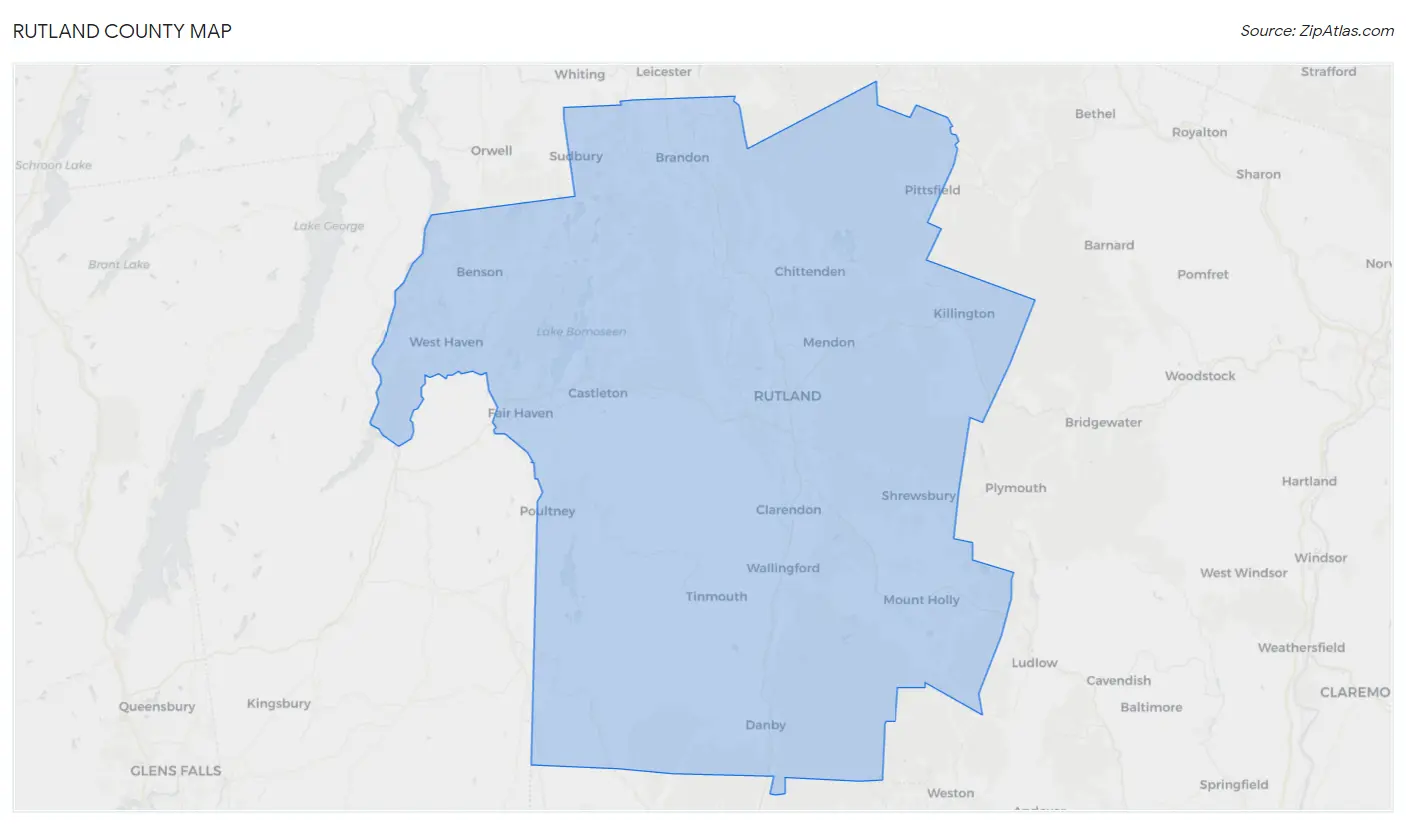
Rutland County Map
Rutland County Overview
60,585
TOTAL POPULATION
30,326
MALE POPULATION
30,259
FEMALE POPULATION
100.22
MALES / 100 FEMALES
99.78
FEMALES / 100 MALES
47.7
MEDIAN AGE
3.0
AVG FAMILY SIZE
2.3
AVG HOUSEHOLD SIZE
$36,845
PER CAPITA INCOME
$85,545
AVG FAMILY INCOME
$62,641
AVG HOUSEHOLD INCOME
18.3%
WAGE / INCOME GAP [ % ]
81.7¢/ $1
WAGE / INCOME GAP [ $ ]
$7,445
FAMILY INCOME DEFICIT
0.46
INEQUALITY / GINI INDEX
30,550
LABOR FORCE [ PEOPLE ]
59.5%
PERCENT IN LABOR FORCE
4.3%
UNEMPLOYMENT RATE
Rutland County Area Codes
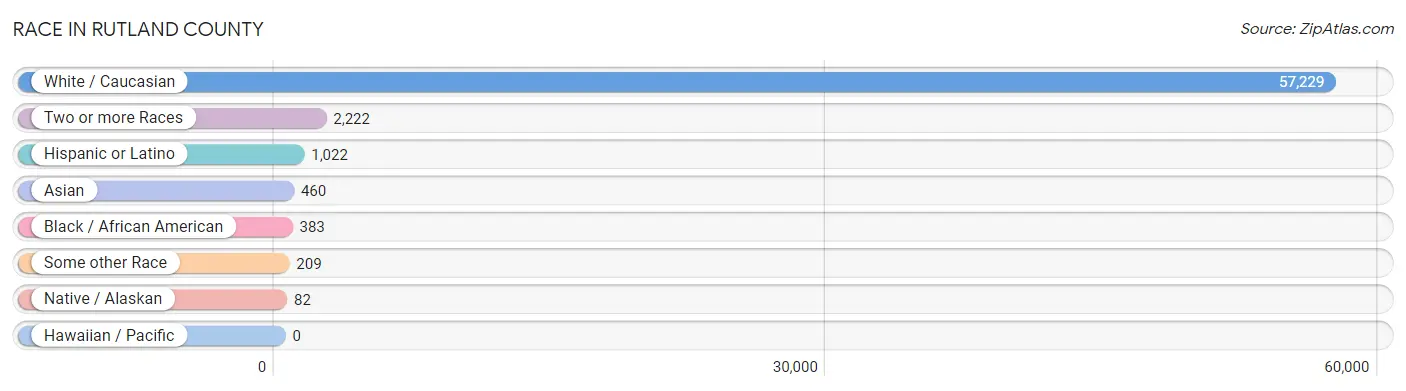
Race in Rutland County
The most populous races in Rutland County are White / Caucasian (57,229 | 94.5%), Two or more Races (2,222 | 3.7%), and Hispanic or Latino (1,022 | 1.7%).
| Race | # Population | % Population |
| Asian | 460 | 0.8% |
| Black / African American | 383 | 0.6% |
| Hawaiian / Pacific | 0 | 0.0% |
| Hispanic or Latino | 1,022 | 1.7% |
| Native / Alaskan | 82 | 0.1% |
| White / Caucasian | 57,229 | 94.5% |
| Two or more Races | 2,222 | 3.7% |
| Some other Race | 209 | 0.3% |
| Total | 60,585 | 100.0% |
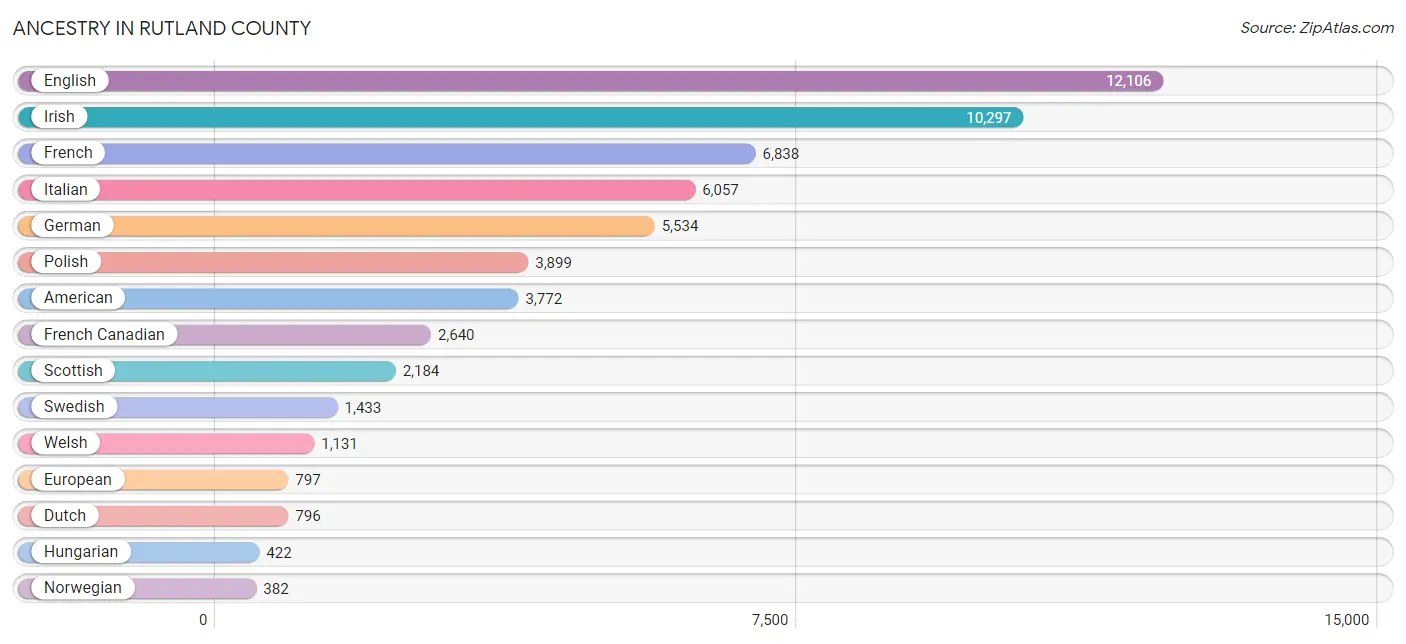
Ancestry in Rutland County
The most populous ancestries reported in Rutland County are English (12,106 | 20.0%), Irish (10,297 | 17.0%), French (6,838 | 11.3%), Italian (6,057 | 10.0%), and German (5,534 | 9.1%), together accounting for 67.4% of all Rutland County residents.
| Ancestry | # Population | % Population |
| African | 15 | 0.0% |
| Albanian | 7 | 0.0% |
| American | 3,772 | 6.2% |
| Apache | 14 | 0.0% |
| Arab | 51 | 0.1% |
| Armenian | 4 | 0.0% |
| Assyrian / Chaldean / Syriac | 2 | 0.0% |
| Australian | 31 | 0.1% |
| Austrian | 135 | 0.2% |
| Belgian | 34 | 0.1% |
| Bhutanese | 64 | 0.1% |
| Blackfeet | 71 | 0.1% |
| Bolivian | 26 | 0.0% |
| Brazilian | 16 | 0.0% |
| British | 238 | 0.4% |
| Burmese | 23 | 0.0% |
| Cajun | 6 | 0.0% |
| Canadian | 284 | 0.5% |
| Cape Verdean | 31 | 0.1% |
| Celtic | 9 | 0.0% |
| Central American | 12 | 0.0% |
| Cherokee | 87 | 0.1% |
| Cheyenne | 1 | 0.0% |
| Chippewa | 5 | 0.0% |
| Colombian | 16 | 0.0% |
| Cree | 16 | 0.0% |
| Croatian | 6 | 0.0% |
| Cuban | 60 | 0.1% |
| Czech | 124 | 0.2% |
| Czechoslovakian | 75 | 0.1% |
| Danish | 126 | 0.2% |
| Dominican | 1 | 0.0% |
| Dutch | 796 | 1.3% |
| Eastern European | 109 | 0.2% |
| Ecuadorian | 3 | 0.0% |
| Egyptian | 2 | 0.0% |
| English | 12,106 | 20.0% |
| Estonian | 2 | 0.0% |
| European | 797 | 1.3% |
| Finnish | 301 | 0.5% |
| French | 6,838 | 11.3% |
| French American Indian | 11 | 0.0% |
| French Canadian | 2,640 | 4.4% |
| German | 5,534 | 9.1% |
| Greek | 204 | 0.3% |
| Haitian | 9 | 0.0% |
| Hungarian | 422 | 0.7% |
| Icelander | 6 | 0.0% |
| Indian (Asian) | 137 | 0.2% |
| Iranian | 19 | 0.0% |
| Irish | 10,297 | 17.0% |
| Iroquois | 4 | 0.0% |
| Italian | 6,057 | 10.0% |
| Jamaican | 48 | 0.1% |
| Japanese | 47 | 0.1% |
| Korean | 180 | 0.3% |
| Latvian | 7 | 0.0% |
| Lebanese | 3 | 0.0% |
| Lithuanian | 149 | 0.3% |
| Luxembourger | 10 | 0.0% |
| Malaysian | 86 | 0.1% |
| Menominee | 12 | 0.0% |
| Mexican | 315 | 0.5% |
| Mexican American Indian | 4 | 0.0% |
| Moroccan | 9 | 0.0% |
| Nigerian | 20 | 0.0% |
| Northern European | 99 | 0.2% |
| Norwegian | 382 | 0.6% |
| Ottawa | 12 | 0.0% |
| Pakistani | 18 | 0.0% |
| Panamanian | 4 | 0.0% |
| Pennsylvania German | 22 | 0.0% |
| Peruvian | 86 | 0.1% |
| Polish | 3,899 | 6.4% |
| Portuguese | 138 | 0.2% |
| Puerto Rican | 302 | 0.5% |
| Romanian | 34 | 0.1% |
| Russian | 314 | 0.5% |
| Salvadoran | 8 | 0.0% |
| Scandinavian | 126 | 0.2% |
| Scotch-Irish | 339 | 0.6% |
| Scottish | 2,184 | 3.6% |
| Seminole | 3 | 0.0% |
| Senegalese | 22 | 0.0% |
| Serbian | 59 | 0.1% |
| Sioux | 1 | 0.0% |
| Slavic | 19 | 0.0% |
| Slovak | 94 | 0.2% |
| Slovene | 10 | 0.0% |
| South African | 7 | 0.0% |
| South American | 188 | 0.3% |
| South American Indian | 86 | 0.1% |
| Spaniard | 45 | 0.1% |
| Spanish | 56 | 0.1% |
| Sri Lankan | 33 | 0.1% |
| Subsaharan African | 100 | 0.2% |
| Swedish | 1,433 | 2.4% |
| Swiss | 153 | 0.3% |
| Syrian | 37 | 0.1% |
| Thai | 128 | 0.2% |
| Ukrainian | 105 | 0.2% |
| Venezuelan | 57 | 0.1% |
| Welsh | 1,131 | 1.9% |
| Yugoslavian | 19 | 0.0% | View All 104 Rows |
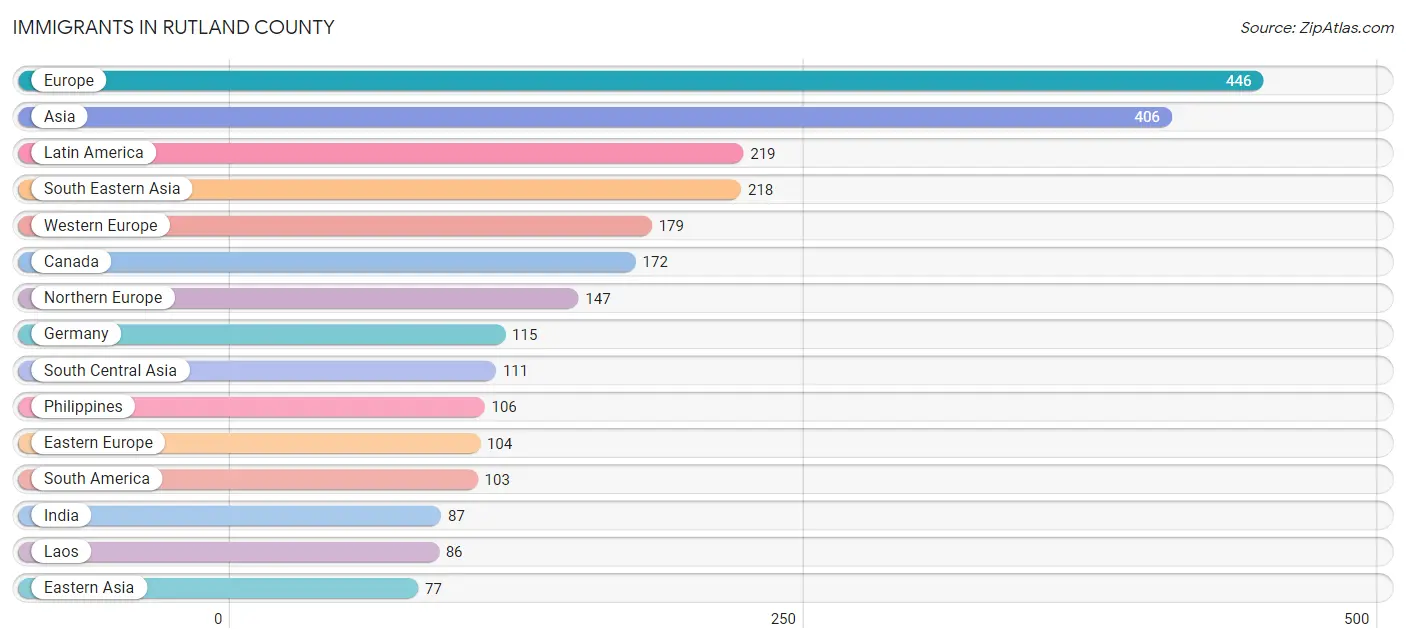
Immigrants in Rutland County
The most numerous immigrant groups reported in Rutland County came from Europe (446 | 0.7%), Asia (406 | 0.7%), Latin America (219 | 0.4%), South Eastern Asia (218 | 0.4%), and Western Europe (179 | 0.3%), together accounting for 2.4% of all Rutland County residents.
| Immigration Origin | # Population | % Population |
| Africa | 37 | 0.1% |
| Asia | 406 | 0.7% |
| Australia | 26 | 0.0% |
| Austria | 12 | 0.0% |
| Barbados | 9 | 0.0% |
| Belgium | 2 | 0.0% |
| Bolivia | 18 | 0.0% |
| Bosnia and Herzegovina | 5 | 0.0% |
| Brazil | 18 | 0.0% |
| Cambodia | 11 | 0.0% |
| Canada | 172 | 0.3% |
| Caribbean | 56 | 0.1% |
| Central America | 60 | 0.1% |
| Chile | 2 | 0.0% |
| China | 61 | 0.1% |
| Denmark | 7 | 0.0% |
| Eastern Africa | 12 | 0.0% |
| Eastern Asia | 77 | 0.1% |
| Eastern Europe | 104 | 0.2% |
| Ecuador | 23 | 0.0% |
| El Salvador | 8 | 0.0% |
| England | 33 | 0.1% |
| Europe | 446 | 0.7% |
| France | 16 | 0.0% |
| Germany | 115 | 0.2% |
| Guatemala | 9 | 0.0% |
| Haiti | 43 | 0.1% |
| Hong Kong | 3 | 0.0% |
| Hungary | 20 | 0.0% |
| India | 87 | 0.1% |
| Ireland | 28 | 0.1% |
| Italy | 7 | 0.0% |
| Jamaica | 4 | 0.0% |
| Japan | 9 | 0.0% |
| Korea | 7 | 0.0% |
| Laos | 86 | 0.1% |
| Latin America | 219 | 0.4% |
| Mexico | 32 | 0.1% |
| Moldova | 8 | 0.0% |
| Morocco | 9 | 0.0% |
| Netherlands | 21 | 0.0% |
| Northern Africa | 9 | 0.0% |
| Northern Europe | 147 | 0.2% |
| Oceania | 26 | 0.0% |
| Pakistan | 24 | 0.0% |
| Panama | 11 | 0.0% |
| Peru | 33 | 0.1% |
| Philippines | 106 | 0.2% |
| Poland | 40 | 0.1% |
| Portugal | 9 | 0.0% |
| Russia | 14 | 0.0% |
| Scotland | 36 | 0.1% |
| Senegal | 16 | 0.0% |
| Serbia | 7 | 0.0% |
| South America | 103 | 0.2% |
| South Central Asia | 111 | 0.2% |
| South Eastern Asia | 218 | 0.4% |
| Southern Europe | 16 | 0.0% |
| Sweden | 5 | 0.0% |
| Switzerland | 13 | 0.0% |
| Thailand | 15 | 0.0% |
| Ukraine | 8 | 0.0% |
| Venezuela | 9 | 0.0% |
| Western Africa | 16 | 0.0% |
| Western Europe | 179 | 0.3% | View All 65 Rows |
Sex and Age in Rutland County
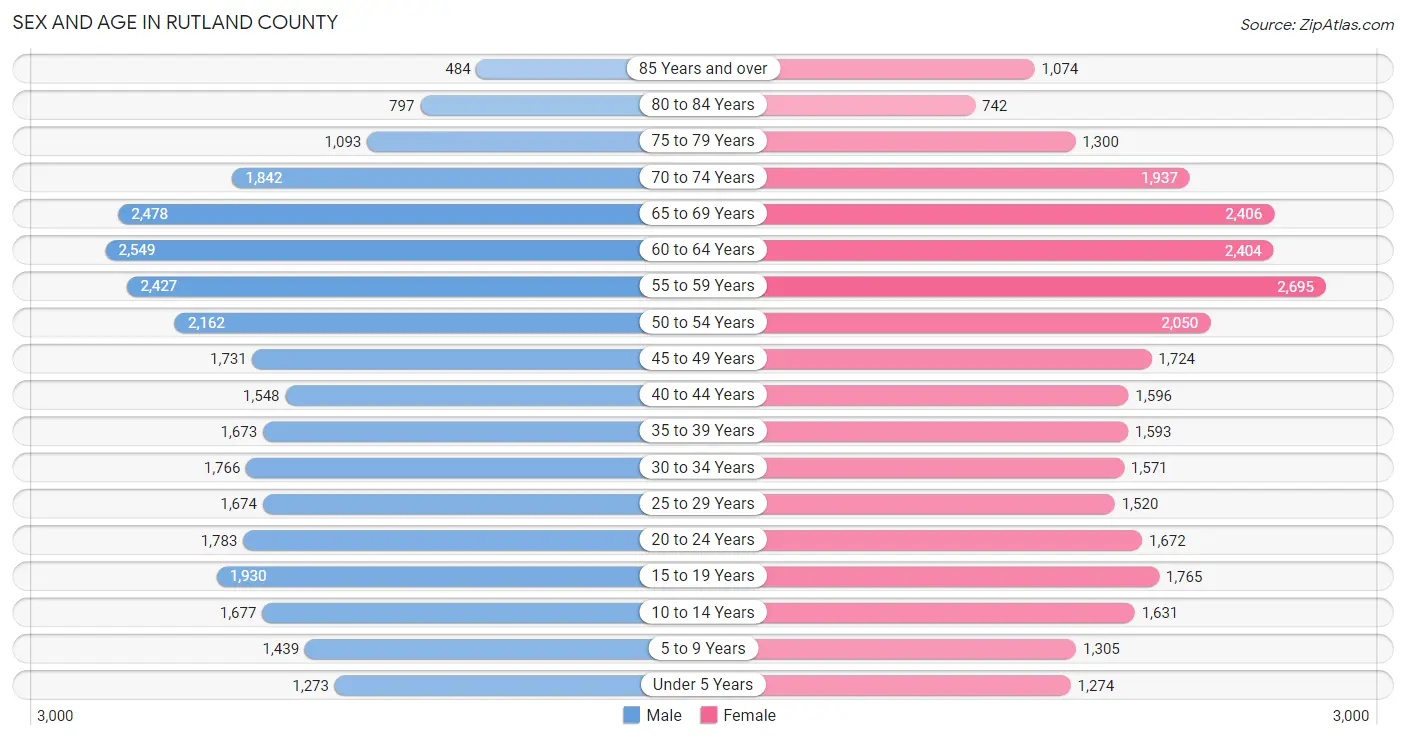
Sex and Age in Rutland County
The most populous age groups in Rutland County are 60 to 64 Years (2,549 | 8.4%) for men and 55 to 59 Years (2,695 | 8.9%) for women.
| Age Bracket | Male | Female |
| Under 5 Years | 1,273 (4.2%) | 1,274 (4.2%) |
| 5 to 9 Years | 1,439 (4.8%) | 1,305 (4.3%) |
| 10 to 14 Years | 1,677 (5.5%) | 1,631 (5.4%) |
| 15 to 19 Years | 1,930 (6.4%) | 1,765 (5.8%) |
| 20 to 24 Years | 1,783 (5.9%) | 1,672 (5.5%) |
| 25 to 29 Years | 1,674 (5.5%) | 1,520 (5.0%) |
| 30 to 34 Years | 1,766 (5.8%) | 1,571 (5.2%) |
| 35 to 39 Years | 1,673 (5.5%) | 1,593 (5.3%) |
| 40 to 44 Years | 1,548 (5.1%) | 1,596 (5.3%) |
| 45 to 49 Years | 1,731 (5.7%) | 1,724 (5.7%) |
| 50 to 54 Years | 2,162 (7.1%) | 2,050 (6.8%) |
| 55 to 59 Years | 2,427 (8.0%) | 2,695 (8.9%) |
| 60 to 64 Years | 2,549 (8.4%) | 2,404 (7.9%) |
| 65 to 69 Years | 2,478 (8.2%) | 2,406 (8.0%) |
| 70 to 74 Years | 1,842 (6.1%) | 1,937 (6.4%) |
| 75 to 79 Years | 1,093 (3.6%) | 1,300 (4.3%) |
| 80 to 84 Years | 797 (2.6%) | 742 (2.5%) |
| 85 Years and over | 484 (1.6%) | 1,074 (3.5%) |
| Total | 30,326 (100.0%) | 30,259 (100.0%) |
Families and Households in Rutland County
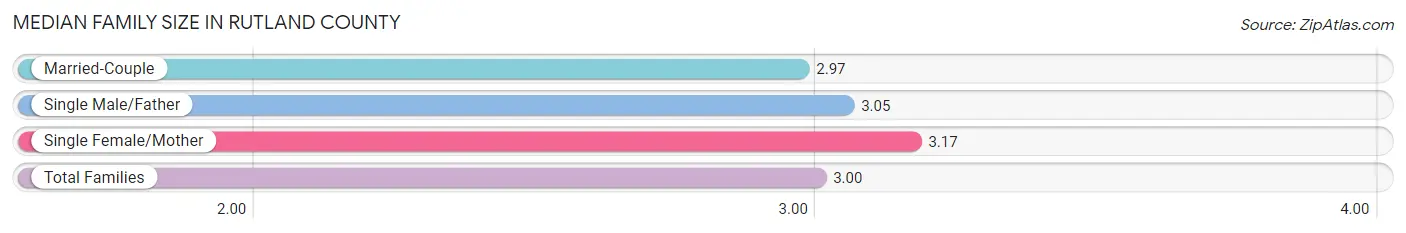
Median Family Size in Rutland County
The median family size in Rutland County is 3.00 persons per family, with single female/mother families (1,896 | 13.0%) accounting for the largest median family size of 3.17 persons per family. On the other hand, married-couple families (11,621 | 79.5%) represent the smallest median family size with 2.97 persons per family.
| Family Type | # Families | Family Size |
| Married-Couple | 11,621 (79.5%) | 2.97 |
| Single Male/Father | 1,091 (7.5%) | 3.05 |
| Single Female/Mother | 1,896 (13.0%) | 3.17 |
| Total Families | 14,608 (100.0%) | 3.00 |
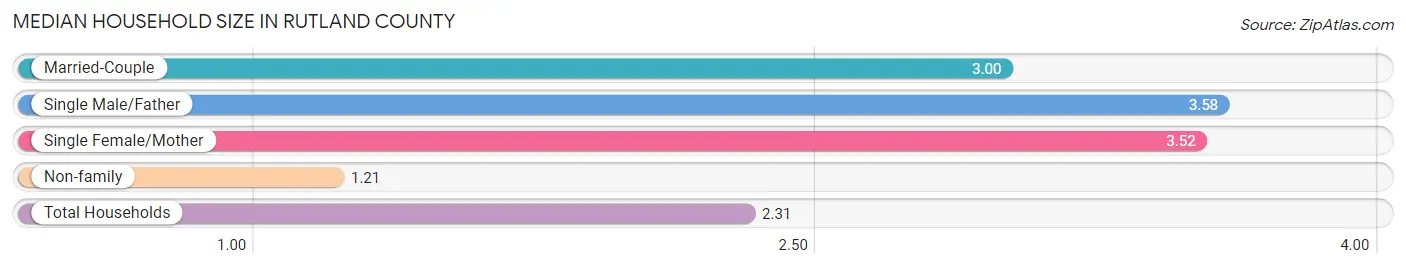
Median Household Size in Rutland County
The median household size in Rutland County is 2.31 persons per household, with single male/father households (1,091 | 4.3%) accounting for the largest median household size of 3.58 persons per household. non-family households (10,726 | 42.3%) represent the smallest median household size with 1.21 persons per household.
| Household Type | # Households | Household Size |
| Married-Couple | 11,621 (45.9%) | 3.00 |
| Single Male/Father | 1,091 (4.3%) | 3.58 |
| Single Female/Mother | 1,896 (7.5%) | 3.52 |
| Non-family | 10,726 (42.3%) | 1.21 |
| Total Households | 25,334 (100.0%) | 2.31 |
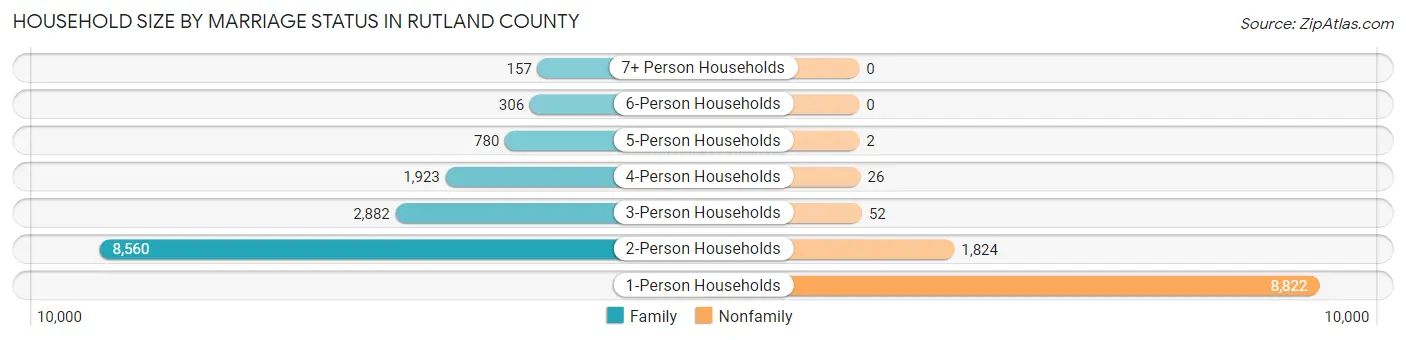
Household Size by Marriage Status in Rutland County
Out of a total of 25,334 households in Rutland County, 14,608 (57.7%) are family households, while 10,726 (42.3%) are nonfamily households. The most numerous type of family households are 2-person households, comprising 8,560, and the most common type of nonfamily households are 1-person households, comprising 8,822.
| Household Size | Family Households | Nonfamily Households |
| 1-Person Households | - | 8,822 (34.8%) |
| 2-Person Households | 8,560 (33.8%) | 1,824 (7.2%) |
| 3-Person Households | 2,882 (11.4%) | 52 (0.2%) |
| 4-Person Households | 1,923 (7.6%) | 26 (0.1%) |
| 5-Person Households | 780 (3.1%) | 2 (0.0%) |
| 6-Person Households | 306 (1.2%) | 0 (0.0%) |
| 7+ Person Households | 157 (0.6%) | 0 (0.0%) |
| Total | 14,608 (57.7%) | 10,726 (42.3%) |
Female Fertility in Rutland County
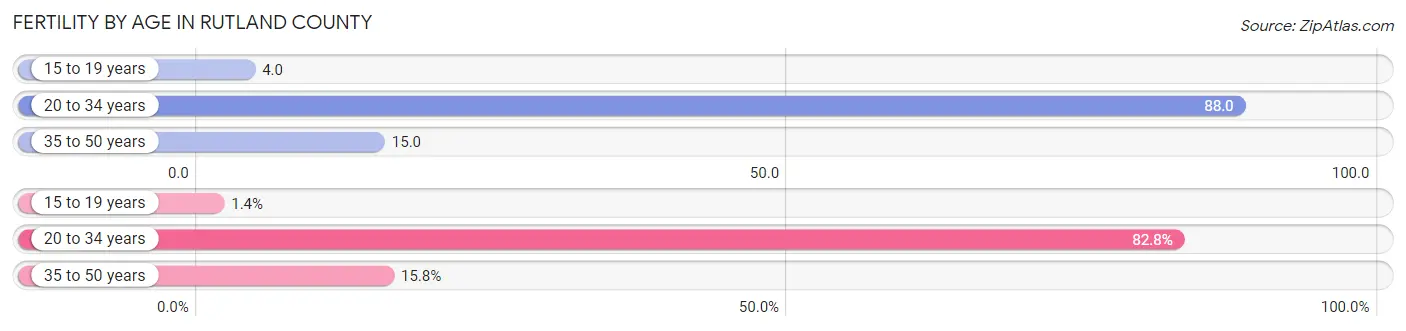
Fertility by Age in Rutland County
Average fertility rate in Rutland County is 42.0 births per 1,000 women. Women in the age bracket of 20 to 34 years have the highest fertility rate with 88.0 births per 1,000 women. Women in the age bracket of 20 to 34 years acount for 82.8% of all women with births.
| Age Bracket | Women with Births | Births / 1,000 Women |
| 15 to 19 years | 7 (1.4%) | 4.0 |
| 20 to 34 years | 420 (82.8%) | 88.0 |
| 35 to 50 years | 80 (15.8%) | 15.0 |
| Total | 507 (100.0%) | 42.0 |
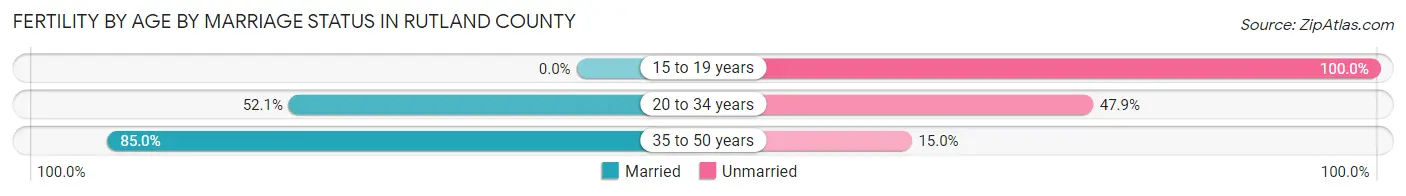
Fertility by Age by Marriage Status in Rutland County
56.6% of women with births (507) in Rutland County are married. The highest percentage of unmarried women with births falls into 15 to 19 years age bracket with 100.0% of them unmarried at the time of birth, while the lowest percentage of unmarried women with births belong to 35 to 50 years age bracket with 15.0% of them unmarried.
| Age Bracket | Married | Unmarried |
| 15 to 19 years | 0 (0.0%) | 7 (100.0%) |
| 20 to 34 years | 219 (52.1%) | 201 (47.9%) |
| 35 to 50 years | 68 (85.0%) | 12 (15.0%) |
| Total | 287 (56.6%) | 220 (43.4%) |
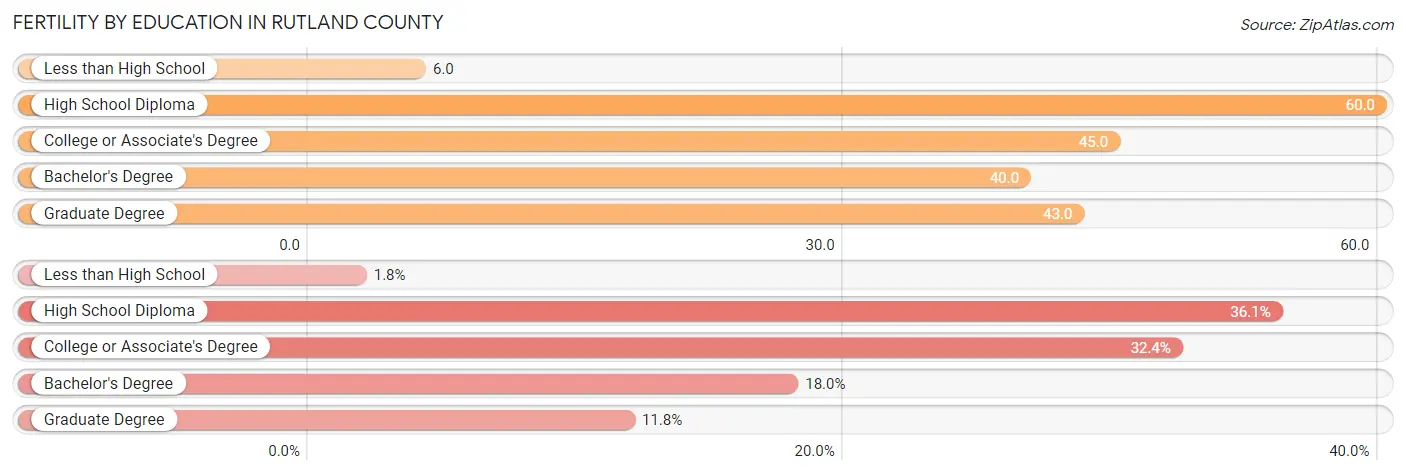
Fertility by Education in Rutland County
Average fertility rate in Rutland County is 42.0 births per 1,000 women. Women with the education attainment of high school diploma have the highest fertility rate of 60.0 births per 1,000 women, while women with the education attainment of less than high school have the lowest fertility at 6.0 births per 1,000 women. Women with the education attainment of high school diploma represent 36.1% of all women with births.
| Educational Attainment | Women with Births | Births / 1,000 Women |
| Less than High School | 9 (1.8%) | 6.0 |
| High School Diploma | 183 (36.1%) | 60.0 |
| College or Associate's Degree | 164 (32.4%) | 45.0 |
| Bachelor's Degree | 91 (17.9%) | 40.0 |
| Graduate Degree | 60 (11.8%) | 43.0 |
| Total | 507 (100.0%) | 42.0 |
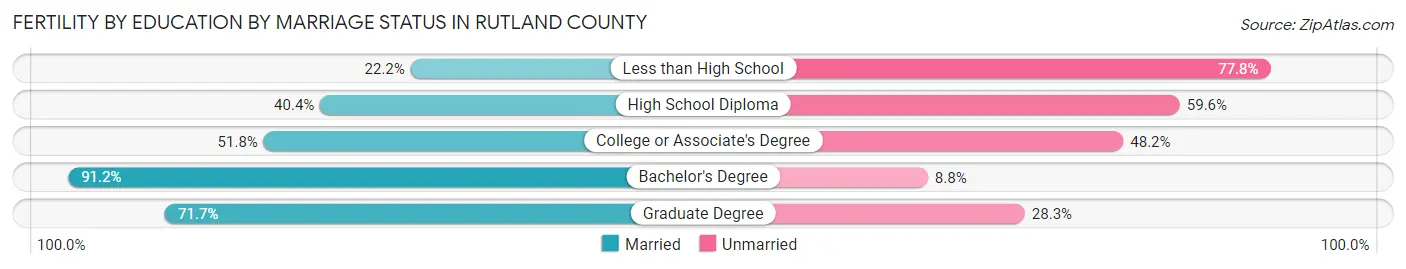
Fertility by Education by Marriage Status in Rutland County
43.4% of women with births in Rutland County are unmarried. Women with the educational attainment of bachelor's degree are most likely to be married with 91.2% of them married at childbirth, while women with the educational attainment of less than high school are least likely to be married with 77.8% of them unmarried at childbirth.
| Educational Attainment | Married | Unmarried |
| Less than High School | 2 (22.2%) | 7 (77.8%) |
| High School Diploma | 74 (40.4%) | 109 (59.6%) |
| College or Associate's Degree | 85 (51.8%) | 79 (48.2%) |
| Bachelor's Degree | 83 (91.2%) | 8 (8.8%) |
| Graduate Degree | 43 (71.7%) | 17 (28.3%) |
| Total | 287 (56.6%) | 220 (43.4%) |
Income in Rutland County
Income Overview in Rutland County
Per Capita Income in Rutland County is $36,845, while median incomes of families and households are $85,545 and $62,641 respectively.
| Characteristic | Number | Measure |
| Per Capita Income | 60,585 | $36,845 |
| Median Family Income | 14,608 | $85,545 |
| Mean Family Income | 14,608 | $106,162 |
| Median Household Income | 25,334 | $62,641 |
| Mean Household Income | 25,334 | $83,665 |
| Income Deficit | 14,608 | $7,445 |
| Wage / Income Gap (%) | 60,585 | 18.27% |
| Wage / Income Gap ($) | 60,585 | 81.73¢ per $1 |
| Gini / Inequality Index | 60,585 | 0.46 |
Earnings by Sex in Rutland County
Average Earnings in Rutland County are $38,569, $42,233 for men and $34,515 for women, a difference of 18.3%.
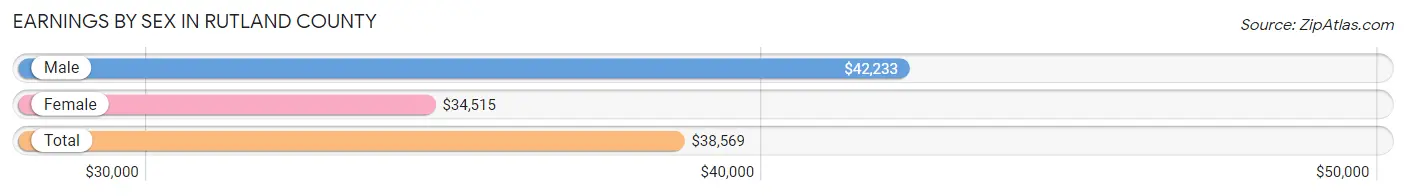
| Sex | Number | Average Earnings |
| Male | 17,095 (52.9%) | $42,233 |
| Female | 15,198 (47.1%) | $34,515 |
| Total | 32,293 (100.0%) | $38,569 |
Earnings by Sex by Income Bracket in Rutland County
The most common earnings brackets in Rutland County are $100,000+ for men (2,004 | 11.7%) and $75,000 to $99,999 for women (1,653 | 10.9%).
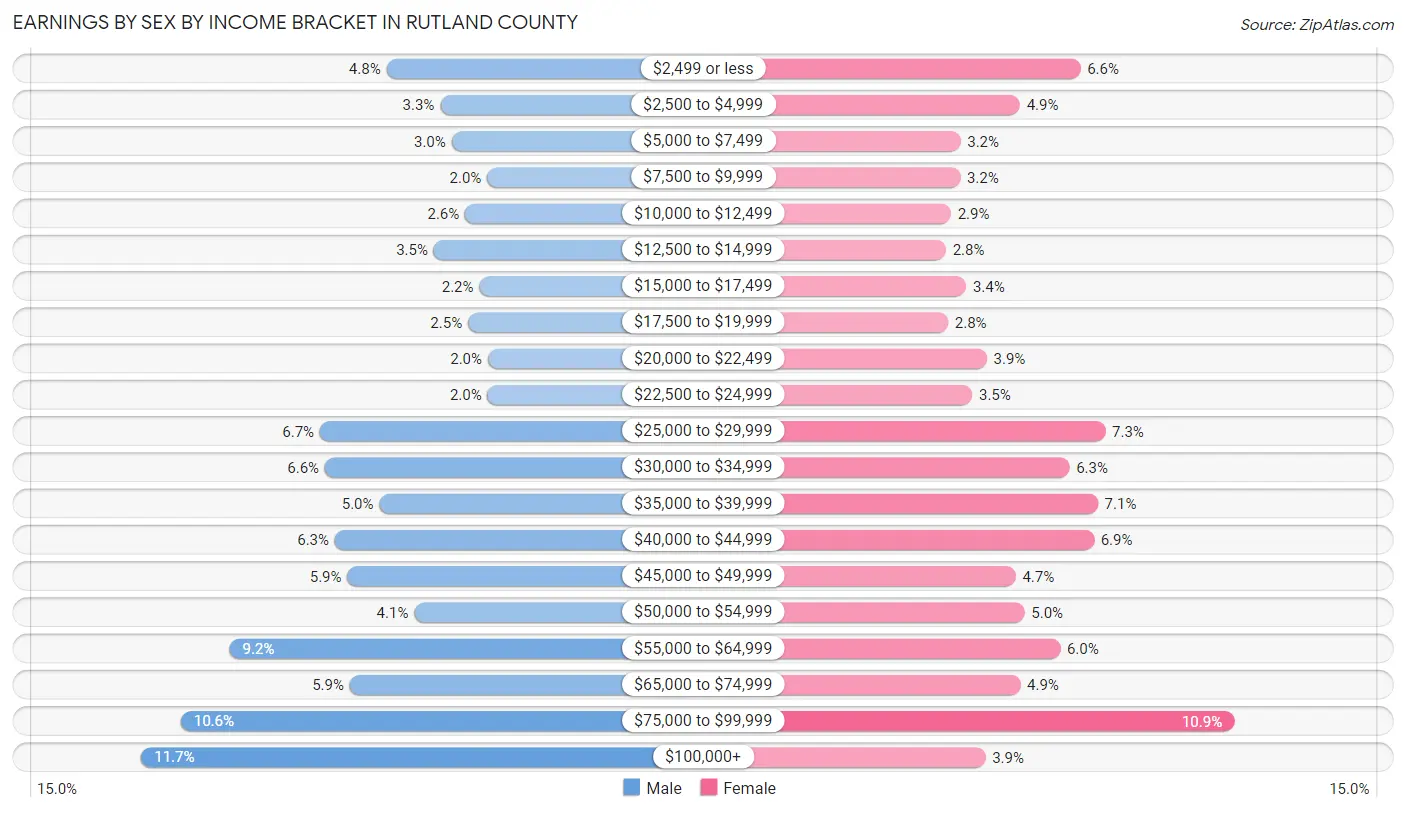
| Income | Male | Female |
| $2,499 or less | 825 (4.8%) | 997 (6.6%) |
| $2,500 to $4,999 | 568 (3.3%) | 739 (4.9%) |
| $5,000 to $7,499 | 513 (3.0%) | 485 (3.2%) |
| $7,500 to $9,999 | 342 (2.0%) | 484 (3.2%) |
| $10,000 to $12,499 | 448 (2.6%) | 444 (2.9%) |
| $12,500 to $14,999 | 599 (3.5%) | 423 (2.8%) |
| $15,000 to $17,499 | 380 (2.2%) | 509 (3.4%) |
| $17,500 to $19,999 | 435 (2.5%) | 432 (2.8%) |
| $20,000 to $22,499 | 338 (2.0%) | 597 (3.9%) |
| $22,500 to $24,999 | 340 (2.0%) | 535 (3.5%) |
| $25,000 to $29,999 | 1,145 (6.7%) | 1,103 (7.3%) |
| $30,000 to $34,999 | 1,122 (6.6%) | 950 (6.2%) |
| $35,000 to $39,999 | 860 (5.0%) | 1,071 (7.0%) |
| $40,000 to $44,999 | 1,074 (6.3%) | 1,055 (6.9%) |
| $45,000 to $49,999 | 1,014 (5.9%) | 721 (4.7%) |
| $50,000 to $54,999 | 693 (4.1%) | 758 (5.0%) |
| $55,000 to $64,999 | 1,580 (9.2%) | 911 (6.0%) |
| $65,000 to $74,999 | 1,001 (5.9%) | 740 (4.9%) |
| $75,000 to $99,999 | 1,814 (10.6%) | 1,653 (10.9%) |
| $100,000+ | 2,004 (11.7%) | 591 (3.9%) |
| Total | 17,095 (100.0%) | 15,198 (100.0%) |
Earnings by Sex by Educational Attainment in Rutland County
Average earnings in Rutland County are $47,160 for men and $39,440 for women, a difference of 16.4%. Men with an educational attainment of graduate degree enjoy the highest average annual earnings of $87,121, while those with less than high school education earn the least with $29,786. Women with an educational attainment of graduate degree earn the most with the average annual earnings of $60,600, while those with less than high school education have the smallest earnings of $20,660.
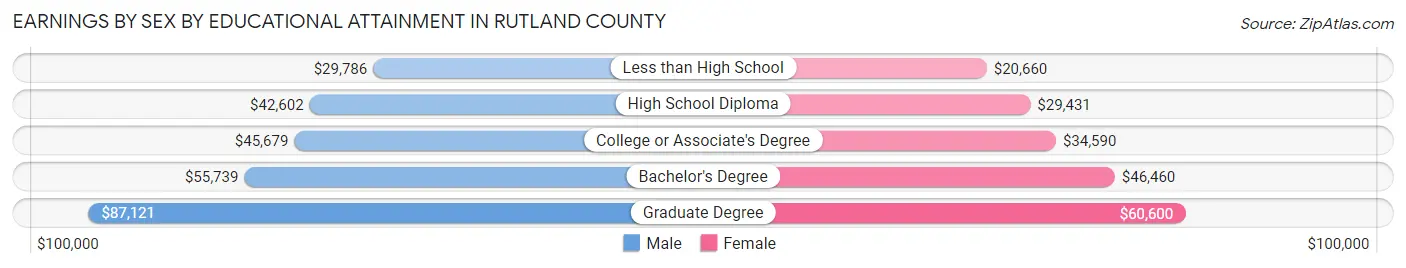
| Educational Attainment | Male Income | Female Income |
| Less than High School | $29,786 | $20,660 |
| High School Diploma | $42,602 | $29,431 |
| College or Associate's Degree | $45,679 | $34,590 |
| Bachelor's Degree | $55,739 | $46,460 |
| Graduate Degree | $87,121 | $60,600 |
| Total | $47,160 | $39,440 |
Family Income in Rutland County
Family Income Brackets in Rutland County
According to the Rutland County family income data, there are 3,462 families falling into the $100,000 to $149,999 income range, which is the most common income bracket and makes up 23.7% of all families. Conversely, the less than $10,000 income bracket is the least frequent group with only 248 families (1.7%) belonging to this category.
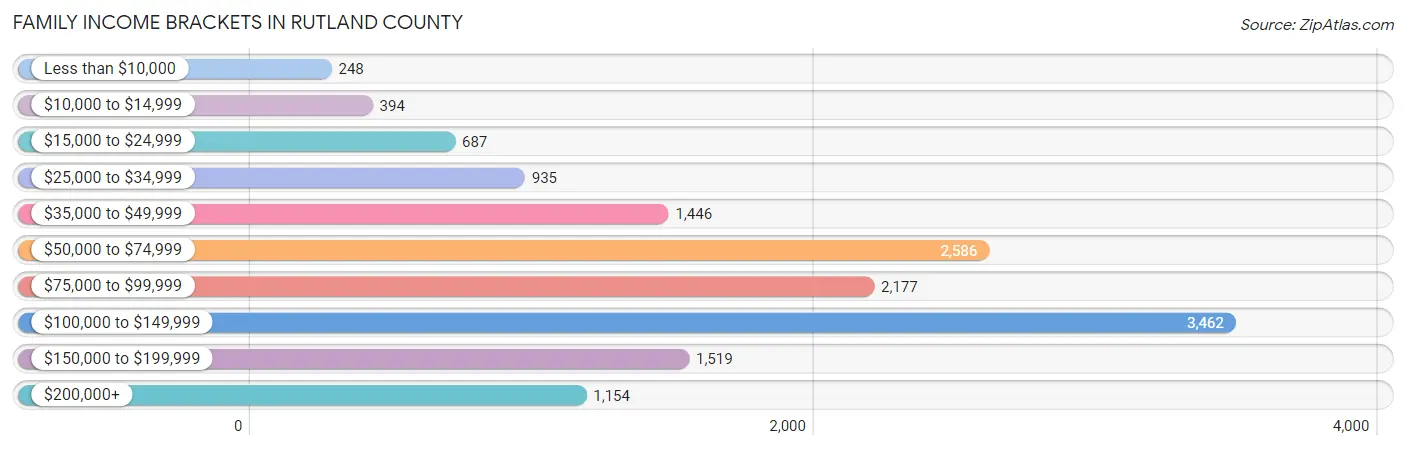
| Income Bracket | # Families | % Families |
| Less than $10,000 | 248 | 1.7% |
| $10,000 to $14,999 | 394 | 2.7% |
| $15,000 to $24,999 | 687 | 4.7% |
| $25,000 to $34,999 | 935 | 6.4% |
| $35,000 to $49,999 | 1,446 | 9.9% |
| $50,000 to $74,999 | 2,586 | 17.7% |
| $75,000 to $99,999 | 2,177 | 14.9% |
| $100,000 to $149,999 | 3,462 | 23.7% |
| $150,000 to $199,999 | 1,519 | 10.4% |
| $200,000+ | 1,154 | 7.9% |
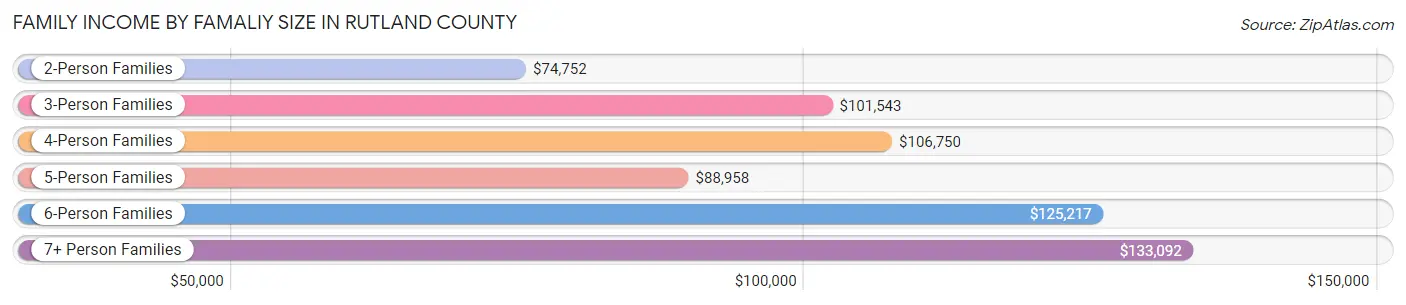
Family Income by Famaliy Size in Rutland County
7+ person families (134 | 0.9%) account for the highest median family income in Rutland County with $133,092 per family, while 2-person families (9,274 | 63.5%) have the highest median income of $37,376 per family member.
| Income Bracket | # Families | Median Income |
| 2-Person Families | 9,274 (63.5%) | $74,752 |
| 3-Person Families | 2,479 (17.0%) | $101,543 |
| 4-Person Families | 1,838 (12.6%) | $106,750 |
| 5-Person Families | 607 (4.2%) | $88,958 |
| 6-Person Families | 276 (1.9%) | $125,217 |
| 7+ Person Families | 134 (0.9%) | $133,092 |
| Total | 14,608 (100.0%) | $85,545 |
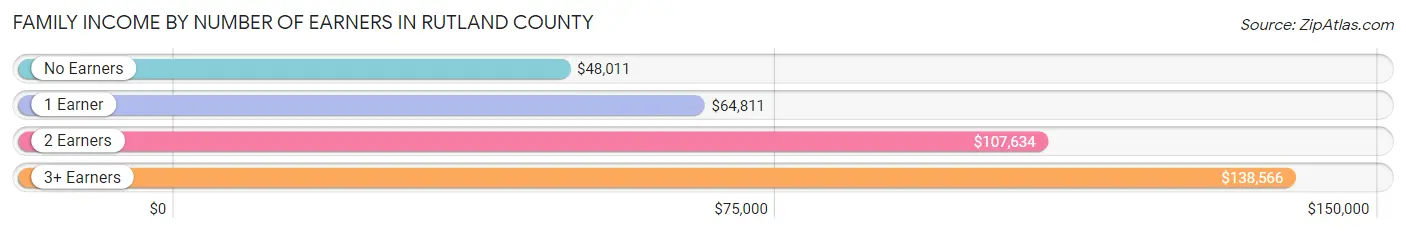
Family Income by Number of Earners in Rutland County
The median family income in Rutland County is $85,545, with families comprising 3+ earners (1,166) having the highest median family income of $138,566, while families with no earners (2,912) have the lowest median family income of $48,011, accounting for 8.0% and 19.9% of families, respectively.
| Number of Earners | # Families | Median Income |
| No Earners | 2,912 (19.9%) | $48,011 |
| 1 Earner | 4,026 (27.6%) | $64,811 |
| 2 Earners | 6,504 (44.5%) | $107,634 |
| 3+ Earners | 1,166 (8.0%) | $138,566 |
| Total | 14,608 (100.0%) | $85,545 |
Household Income in Rutland County
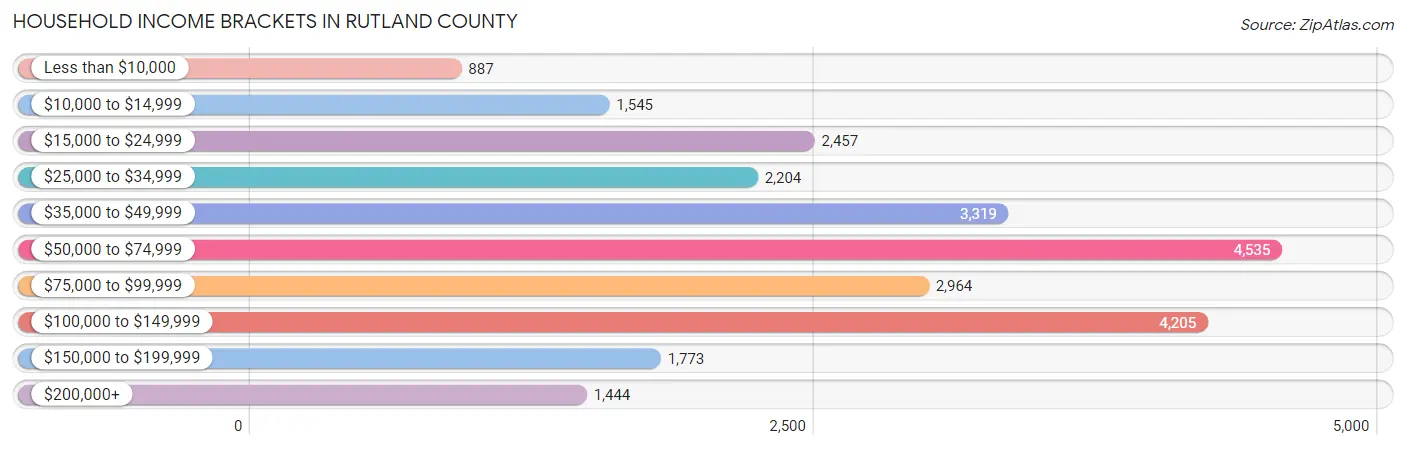
Household Income Brackets in Rutland County
With 4,535 households falling in the category, the $50,000 to $74,999 income range is the most frequent in Rutland County, accounting for 17.9% of all households. In contrast, only 887 households (3.5%) fall into the less than $10,000 income bracket, making it the least populous group.
| Income Bracket | # Households | % Households |
| Less than $10,000 | 887 | 3.5% |
| $10,000 to $14,999 | 1,545 | 6.1% |
| $15,000 to $24,999 | 2,457 | 9.7% |
| $25,000 to $34,999 | 2,204 | 8.7% |
| $35,000 to $49,999 | 3,319 | 13.1% |
| $50,000 to $74,999 | 4,535 | 17.9% |
| $75,000 to $99,999 | 2,964 | 11.7% |
| $100,000 to $149,999 | 4,205 | 16.6% |
| $150,000 to $199,999 | 1,773 | 7.0% |
| $200,000+ | 1,444 | 5.7% |
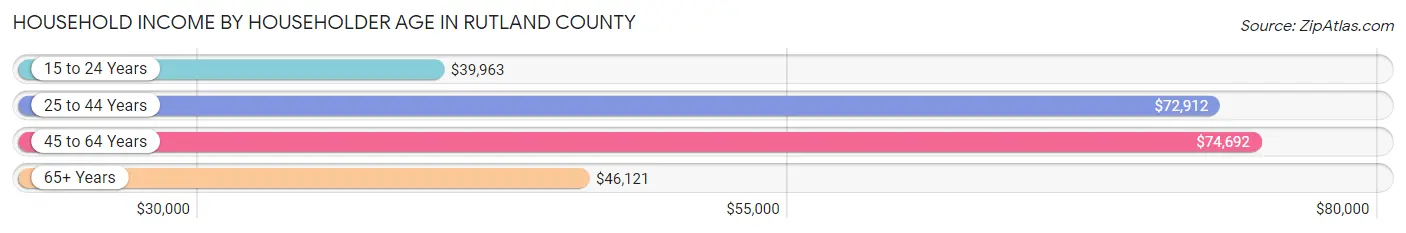
Household Income by Householder Age in Rutland County
The median household income in Rutland County is $62,641, with the highest median household income of $74,692 found in the 45 to 64 years age bracket for the primary householder. A total of 9,605 households (37.9%) fall into this category. Meanwhile, the 15 to 24 years age bracket for the primary householder has the lowest median household income of $39,963, with 605 households (2.4%) in this group.
| Income Bracket | # Households | Median Income |
| 15 to 24 Years | 605 (2.4%) | $39,963 |
| 25 to 44 Years | 5,972 (23.6%) | $72,912 |
| 45 to 64 Years | 9,605 (37.9%) | $74,692 |
| 65+ Years | 9,152 (36.1%) | $46,121 |
| Total | 25,334 (100.0%) | $62,641 |
Poverty in Rutland County
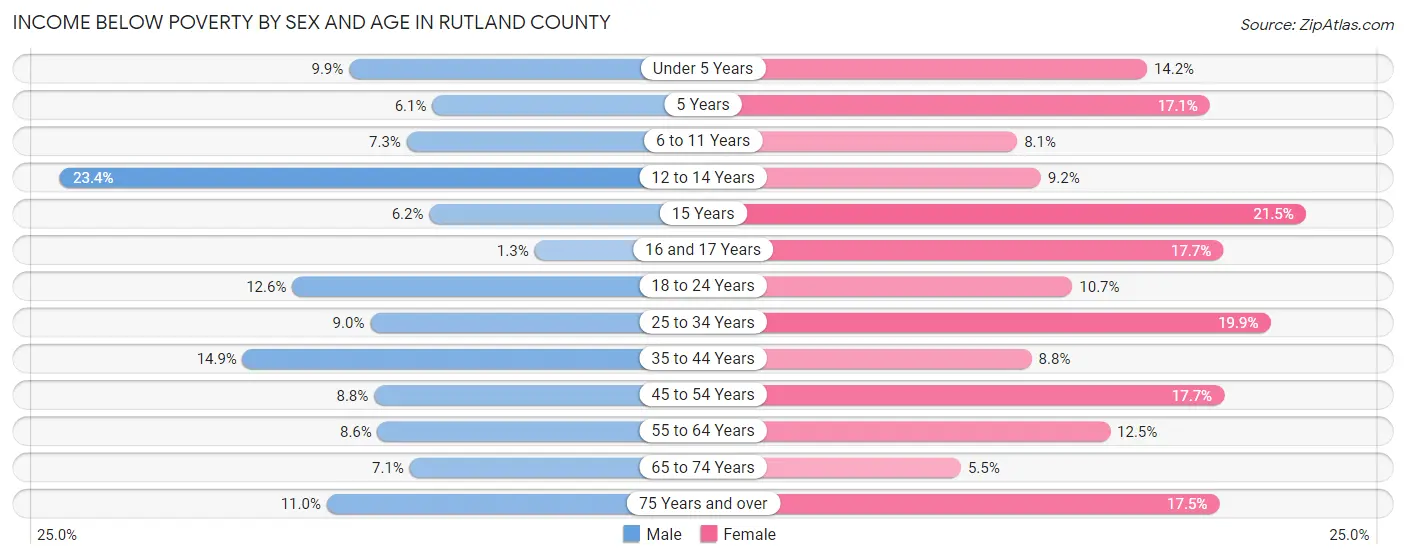
Income Below Poverty by Sex and Age in Rutland County
With 9.9% poverty level for males and 12.8% for females among the residents of Rutland County, 12 to 14 year old males and 15 year old females are the most vulnerable to poverty, with 254 males (23.4%) and 51 females (21.5%) in their respective age groups living below the poverty level.
| Age Bracket | Male | Female |
| Under 5 Years | 126 (9.9%) | 178 (14.2%) |
| 5 Years | 18 (6.1%) | 28 (17.1%) |
| 6 to 11 Years | 123 (7.3%) | 146 (8.1%) |
| 12 to 14 Years | 254 (23.4%) | 85 (9.2%) |
| 15 Years | 25 (6.2%) | 51 (21.5%) |
| 16 and 17 Years | 9 (1.3%) | 127 (17.7%) |
| 18 to 24 Years | 251 (12.6%) | 215 (10.7%) |
| 25 to 34 Years | 301 (9.0%) | 612 (19.9%) |
| 35 to 44 Years | 476 (14.9%) | 281 (8.8%) |
| 45 to 54 Years | 339 (8.8%) | 669 (17.7%) |
| 55 to 64 Years | 427 (8.6%) | 634 (12.4%) |
| 65 to 74 Years | 305 (7.1%) | 237 (5.5%) |
| 75 Years and over | 253 (11.0%) | 507 (17.5%) |
| Total | 2,907 (9.9%) | 3,770 (12.8%) |
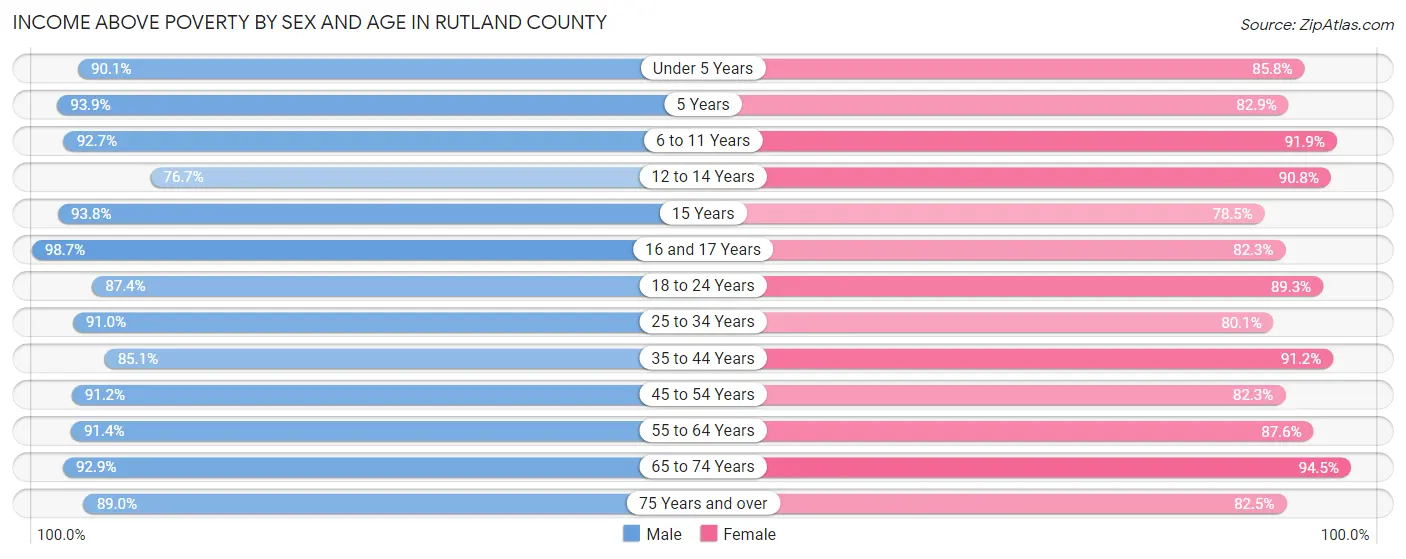
Income Above Poverty by Sex and Age in Rutland County
According to the poverty statistics in Rutland County, males aged 16 and 17 years and females aged 65 to 74 years are the age groups that are most secure financially, with 98.7% of males and 94.5% of females in these age groups living above the poverty line.
| Age Bracket | Male | Female |
| Under 5 Years | 1,142 (90.1%) | 1,079 (85.8%) |
| 5 Years | 278 (93.9%) | 136 (82.9%) |
| 6 to 11 Years | 1,569 (92.7%) | 1,648 (91.9%) |
| 12 to 14 Years | 834 (76.6%) | 835 (90.8%) |
| 15 Years | 377 (93.8%) | 186 (78.5%) |
| 16 and 17 Years | 664 (98.7%) | 591 (82.3%) |
| 18 to 24 Years | 1,744 (87.4%) | 1,795 (89.3%) |
| 25 to 34 Years | 3,058 (91.0%) | 2,467 (80.1%) |
| 35 to 44 Years | 2,723 (85.1%) | 2,908 (91.2%) |
| 45 to 54 Years | 3,523 (91.2%) | 3,105 (82.3%) |
| 55 to 64 Years | 4,529 (91.4%) | 4,460 (87.5%) |
| 65 to 74 Years | 3,972 (92.9%) | 4,050 (94.5%) |
| 75 Years and over | 2,051 (89.0%) | 2,388 (82.5%) |
| Total | 26,464 (90.1%) | 25,648 (87.2%) |
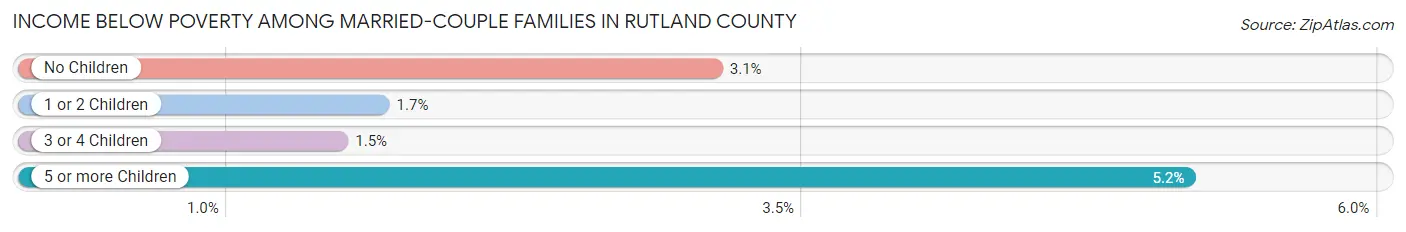
Income Below Poverty Among Married-Couple Families in Rutland County
The poverty statistics for married-couple families in Rutland County show that 2.7% or 315 of the total 11,621 families live below the poverty line. Families with 5 or more children have the highest poverty rate of 5.2%, comprising of 3 families. On the other hand, families with 3 or 4 children have the lowest poverty rate of 1.5%, which includes 9 families.
| Children | Above Poverty | Below Poverty |
| No Children | 8,100 (96.9%) | 260 (3.1%) |
| 1 or 2 Children | 2,553 (98.3%) | 43 (1.7%) |
| 3 or 4 Children | 598 (98.5%) | 9 (1.5%) |
| 5 or more Children | 55 (94.8%) | 3 (5.2%) |
| Total | 11,306 (97.3%) | 315 (2.7%) |
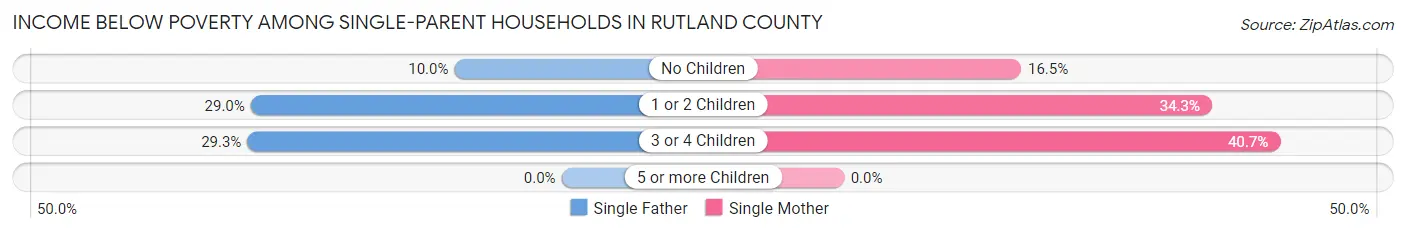
Income Below Poverty Among Single-Parent Households in Rutland County
According to the poverty data in Rutland County, 21.8% or 238 single-father households and 27.3% or 518 single-mother households are living below the poverty line. Among single-father households, those with 3 or 4 children have the highest poverty rate, with 12 households (29.3%) experiencing poverty. Likewise, among single-mother households, those with 3 or 4 children have the highest poverty rate, with 50 households (40.6%) falling below the poverty line.
| Children | Single Father | Single Mother |
| No Children | 41 (10.0%) | 130 (16.5%) |
| 1 or 2 Children | 185 (28.9%) | 338 (34.3%) |
| 3 or 4 Children | 12 (29.3%) | 50 (40.6%) |
| 5 or more Children | 0 (0.0%) | 0 (0.0%) |
| Total | 238 (21.8%) | 518 (27.3%) |
Income Below Poverty Among Married-Couple vs Single-Parent Households in Rutland County
The poverty data for Rutland County shows that 315 of the married-couple family households (2.7%) and 756 of the single-parent households (25.3%) are living below the poverty level. Within the married-couple family households, those with 5 or more children have the highest poverty rate, with 3 households (5.2%) falling below the poverty line. Among the single-parent households, those with 3 or 4 children have the highest poverty rate, with 62 household (37.8%) living below poverty.
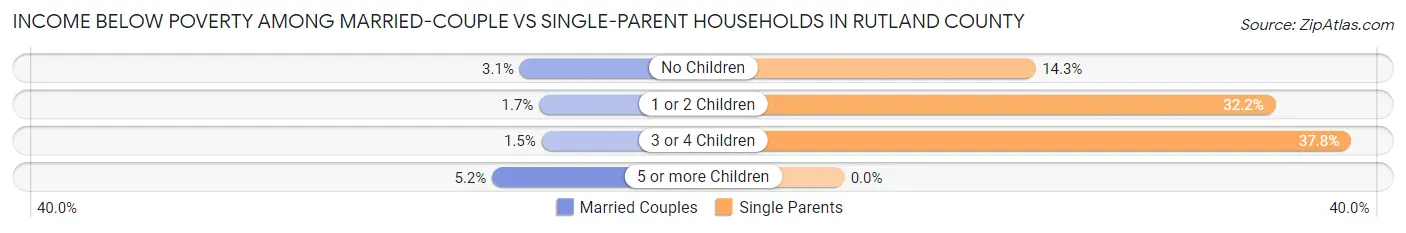
| Children | Married-Couple Families | Single-Parent Households |
| No Children | 260 (3.1%) | 171 (14.3%) |
| 1 or 2 Children | 43 (1.7%) | 523 (32.2%) |
| 3 or 4 Children | 9 (1.5%) | 62 (37.8%) |
| 5 or more Children | 3 (5.2%) | 0 (0.0%) |
| Total | 315 (2.7%) | 756 (25.3%) |
Employment Characteristics in Rutland County
Employment by Class of Employer in Rutland County
Among the 28,803 employed individuals in Rutland County, private company employees (17,457 | 60.6%), not-for-profit organizations (4,280 | 14.9%), and local government employees (2,272 | 7.9%) make up the most common classes of employment.
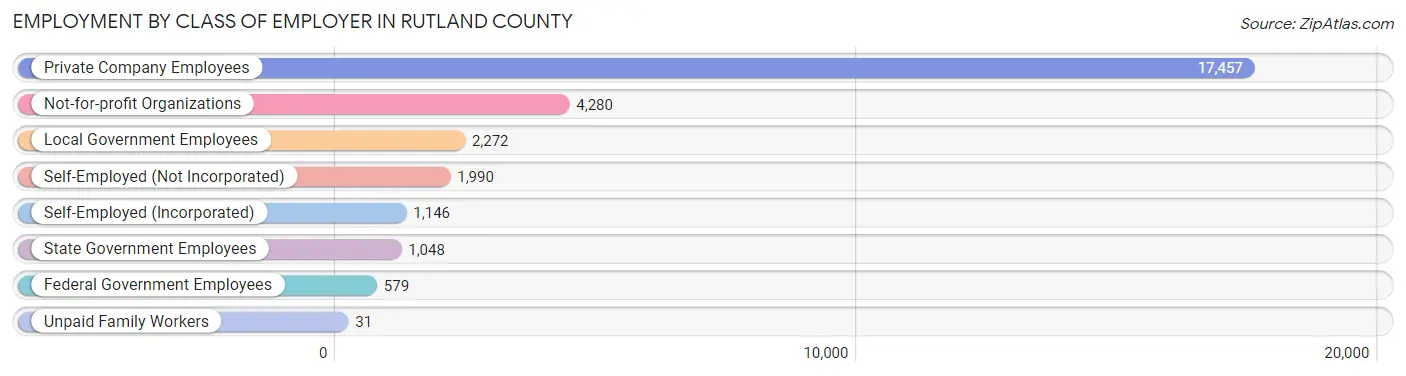
| Employer Class | # Employees | % Employees |
| Private Company Employees | 17,457 | 60.6% |
| Self-Employed (Incorporated) | 1,146 | 4.0% |
| Self-Employed (Not Incorporated) | 1,990 | 6.9% |
| Not-for-profit Organizations | 4,280 | 14.9% |
| Local Government Employees | 2,272 | 7.9% |
| State Government Employees | 1,048 | 3.6% |
| Federal Government Employees | 579 | 2.0% |
| Unpaid Family Workers | 31 | 0.1% |
| Total | 28,803 | 100.0% |
Employment Status by Age in Rutland County
According to the labor force statistics for Rutland County, out of the total population over 16 years of age (51,344), 59.5% or 30,550 individuals are in the labor force, with 4.3% or 1,314 of them unemployed. The age group with the highest labor force participation rate is 35 to 44 years, with 85.7% or 5,493 individuals in the labor force. Within the labor force, the 16 to 19 years age range has the highest percentage of unemployed individuals, with 9.3% or 122 of them being unemployed.
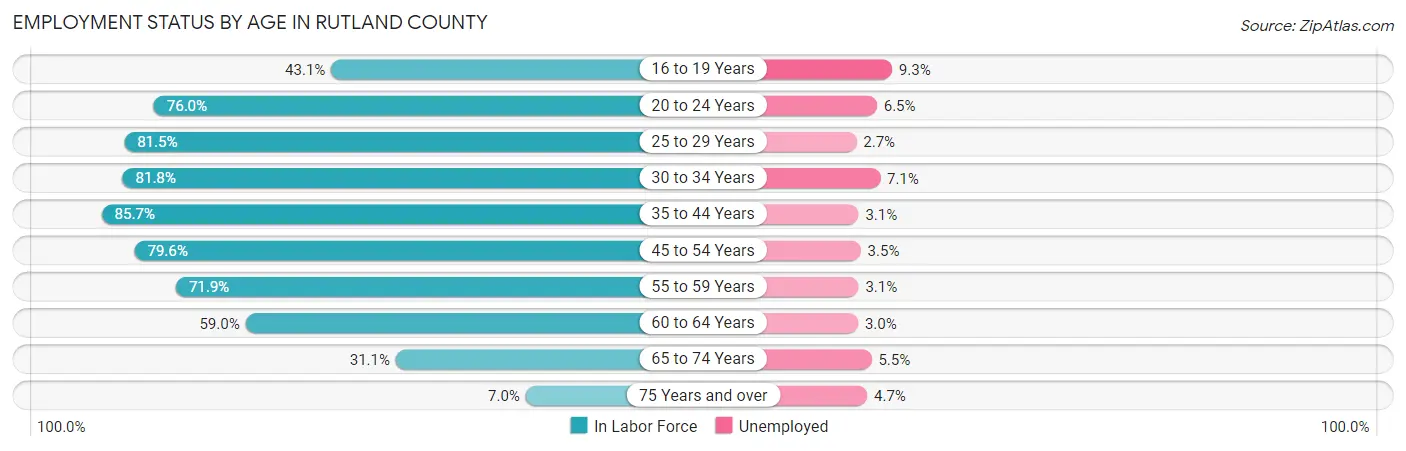
| Age Bracket | In Labor Force | Unemployed |
| 16 to 19 Years | 1,316 (43.1%) | 122 (9.3%) |
| 20 to 24 Years | 2,626 (76.0%) | 171 (6.5%) |
| 25 to 29 Years | 2,603 (81.5%) | 70 (2.7%) |
| 30 to 34 Years | 2,730 (81.8%) | 194 (7.1%) |
| 35 to 44 Years | 5,493 (85.7%) | 170 (3.1%) |
| 45 to 54 Years | 6,103 (79.6%) | 214 (3.5%) |
| 55 to 59 Years | 3,683 (71.9%) | 114 (3.1%) |
| 60 to 64 Years | 2,922 (59.0%) | 88 (3.0%) |
| 65 to 74 Years | 2,694 (31.1%) | 148 (5.5%) |
| 75 Years and over | 384 (7.0%) | 18 (4.7%) |
| Total | 30,550 (59.5%) | 1,314 (4.3%) |
Employment Status by Educational Attainment in Rutland County
According to labor force statistics for Rutland County, 76.7% of individuals (23,534) out of the total population between 25 and 64 years of age (30,683) are in the labor force, with 3.6% or 847 of them being unemployed. The group with the highest labor force participation rate are those with the educational attainment of bachelor's degree or higher, with 87.6% or 8,691 individuals in the labor force. Within the labor force, individuals with less than high school education have the highest percentage of unemployment, with 7.4% or 69 of them being unemployed.
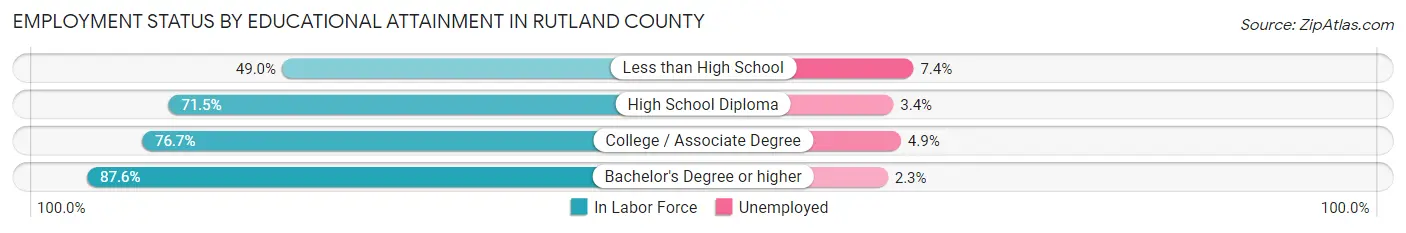
| Educational Attainment | In Labor Force | Unemployed |
| Less than High School | 933 (49.0%) | 141 (7.4%) |
| High School Diploma | 7,472 (71.5%) | 355 (3.4%) |
| College / Associate Degree | 6,448 (76.7%) | 412 (4.9%) |
| Bachelor's Degree or higher | 8,691 (87.6%) | 228 (2.3%) |
| Total | 23,534 (76.7%) | 1,105 (3.6%) |
Employment Occupations by Sex in Rutland County
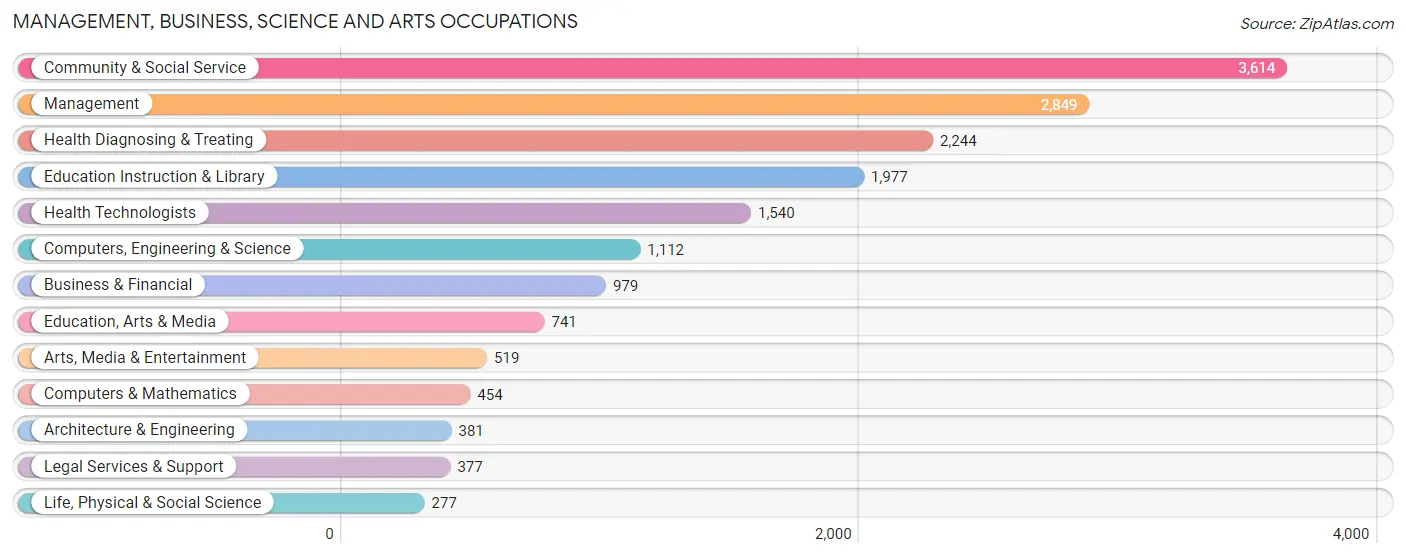
Management, Business, Science and Arts Occupations
The most common Management, Business, Science and Arts occupations in Rutland County are Community & Social Service (3,614 | 12.4%), Management (2,849 | 9.7%), Health Diagnosing & Treating (2,244 | 7.7%), Education Instruction & Library (1,977 | 6.8%), and Health Technologists (1,540 | 5.3%).
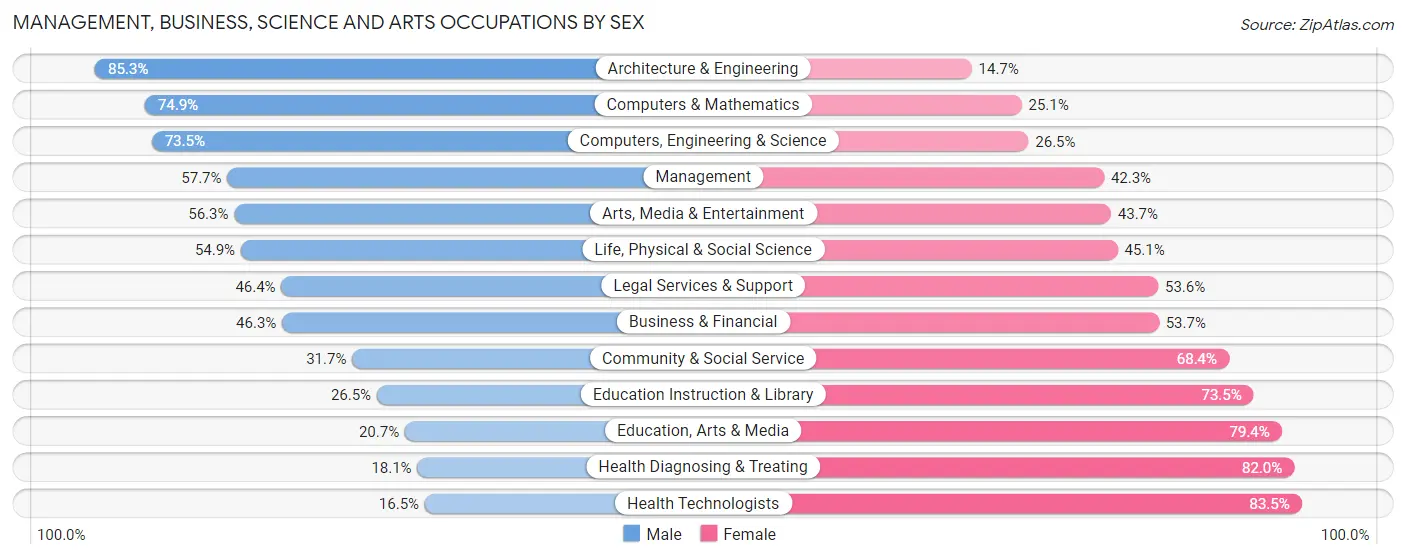
Management, Business, Science and Arts Occupations by Sex
Within the Management, Business, Science and Arts occupations in Rutland County, the most male-oriented occupations are Architecture & Engineering (85.3%), Computers & Mathematics (74.9%), and Computers, Engineering & Science (73.5%), while the most female-oriented occupations are Health Technologists (83.5%), Health Diagnosing & Treating (82.0%), and Education, Arts & Media (79.3%).
| Occupation | Male | Female |
| Management | 1,644 (57.7%) | 1,205 (42.3%) |
| Business & Financial | 453 (46.3%) | 526 (53.7%) |
| Computers, Engineering & Science | 817 (73.5%) | 295 (26.5%) |
| Computers & Mathematics | 340 (74.9%) | 114 (25.1%) |
| Architecture & Engineering | 325 (85.3%) | 56 (14.7%) |
| Life, Physical & Social Science | 152 (54.9%) | 125 (45.1%) |
| Community & Social Service | 1,144 (31.7%) | 2,470 (68.3%) |
| Education, Arts & Media | 153 (20.6%) | 588 (79.3%) |
| Legal Services & Support | 175 (46.4%) | 202 (53.6%) |
| Education Instruction & Library | 524 (26.5%) | 1,453 (73.5%) |
| Arts, Media & Entertainment | 292 (56.3%) | 227 (43.7%) |
| Health Diagnosing & Treating | 405 (18.0%) | 1,839 (82.0%) |
| Health Technologists | 254 (16.5%) | 1,286 (83.5%) |
| Total (Category) | 4,463 (41.3%) | 6,335 (58.7%) |
| Total (Overall) | 15,440 (52.8%) | 13,804 (47.2%) |
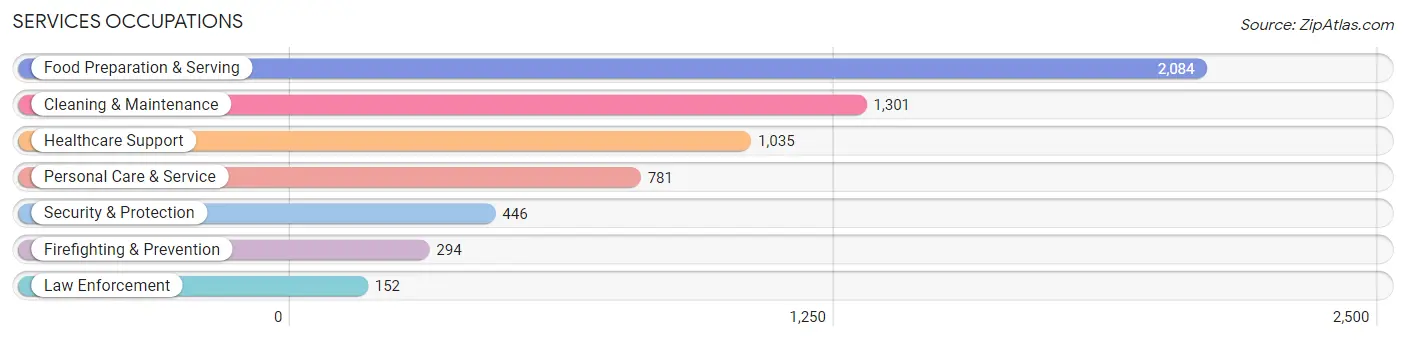
Services Occupations
The most common Services occupations in Rutland County are Food Preparation & Serving (2,084 | 7.1%), Cleaning & Maintenance (1,301 | 4.4%), Healthcare Support (1,035 | 3.5%), Personal Care & Service (781 | 2.7%), and Security & Protection (446 | 1.5%).
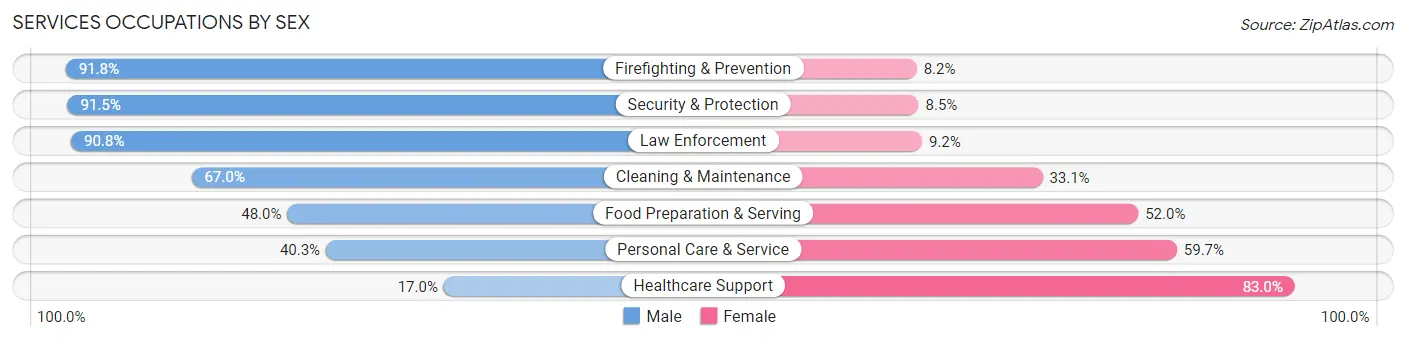
Services Occupations by Sex
Within the Services occupations in Rutland County, the most male-oriented occupations are Firefighting & Prevention (91.8%), Security & Protection (91.5%), and Law Enforcement (90.8%), while the most female-oriented occupations are Healthcare Support (83.0%), Personal Care & Service (59.7%), and Food Preparation & Serving (52.0%).
| Occupation | Male | Female |
| Healthcare Support | 176 (17.0%) | 859 (83.0%) |
| Security & Protection | 408 (91.5%) | 38 (8.5%) |
| Firefighting & Prevention | 270 (91.8%) | 24 (8.2%) |
| Law Enforcement | 138 (90.8%) | 14 (9.2%) |
| Food Preparation & Serving | 1,000 (48.0%) | 1,084 (52.0%) |
| Cleaning & Maintenance | 871 (66.9%) | 430 (33.1%) |
| Personal Care & Service | 315 (40.3%) | 466 (59.7%) |
| Total (Category) | 2,770 (49.0%) | 2,877 (50.9%) |
| Total (Overall) | 15,440 (52.8%) | 13,804 (47.2%) |
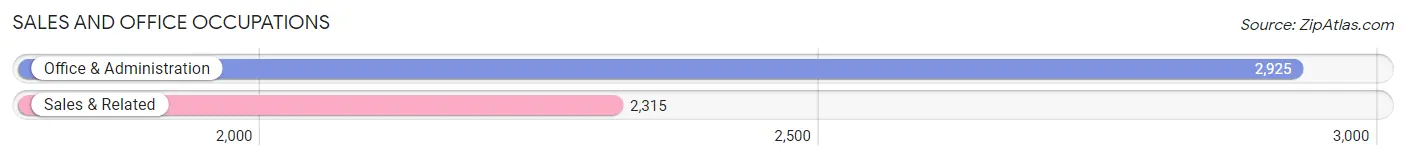
Sales and Office Occupations
The most common Sales and Office occupations in Rutland County are Office & Administration (2,925 | 10.0%), and Sales & Related (2,315 | 7.9%).
Sales and Office Occupations by Sex
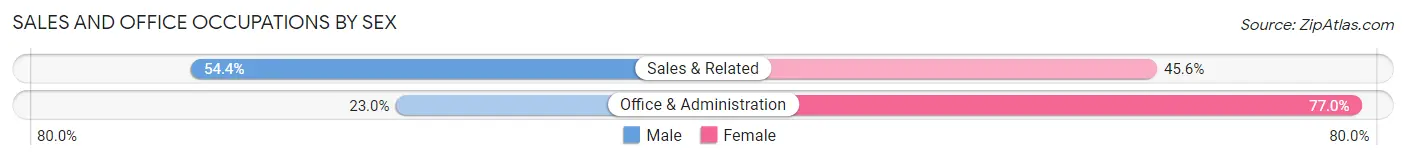
| Occupation | Male | Female |
| Sales & Related | 1,259 (54.4%) | 1,056 (45.6%) |
| Office & Administration | 672 (23.0%) | 2,253 (77.0%) |
| Total (Category) | 1,931 (36.8%) | 3,309 (63.1%) |
| Total (Overall) | 15,440 (52.8%) | 13,804 (47.2%) |
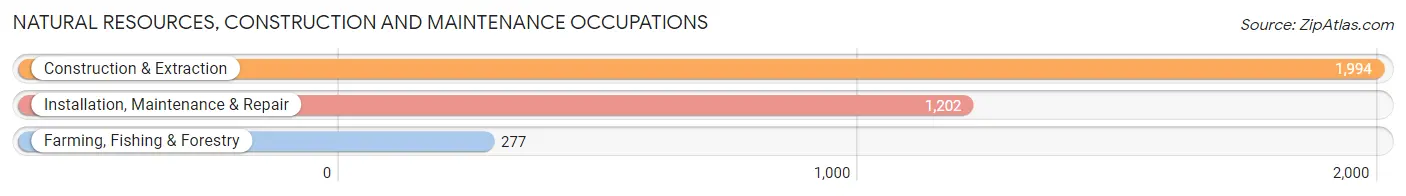
Natural Resources, Construction and Maintenance Occupations
The most common Natural Resources, Construction and Maintenance occupations in Rutland County are Construction & Extraction (1,994 | 6.8%), Installation, Maintenance & Repair (1,202 | 4.1%), and Farming, Fishing & Forestry (277 | 0.9%).
Natural Resources, Construction and Maintenance Occupations by Sex
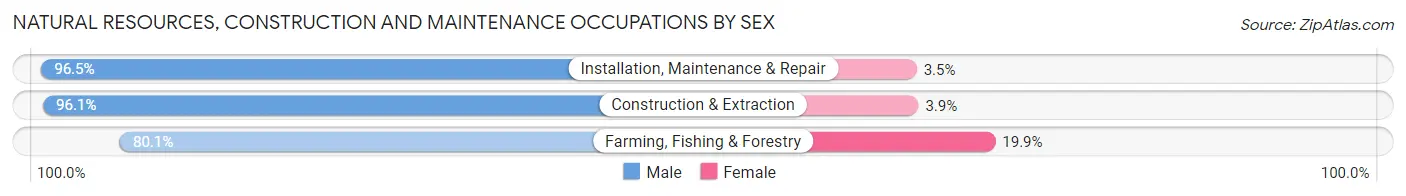
| Occupation | Male | Female |
| Farming, Fishing & Forestry | 222 (80.1%) | 55 (19.9%) |
| Construction & Extraction | 1,917 (96.1%) | 77 (3.9%) |
| Installation, Maintenance & Repair | 1,160 (96.5%) | 42 (3.5%) |
| Total (Category) | 3,299 (95.0%) | 174 (5.0%) |
| Total (Overall) | 15,440 (52.8%) | 13,804 (47.2%) |
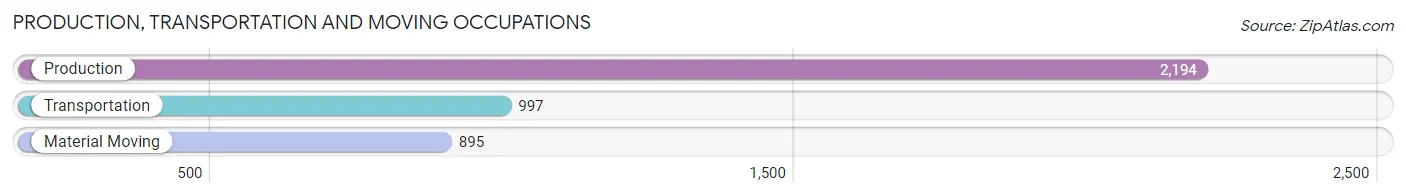
Production, Transportation and Moving Occupations
The most common Production, Transportation and Moving occupations in Rutland County are Production (2,194 | 7.5%), Transportation (997 | 3.4%), and Material Moving (895 | 3.1%).
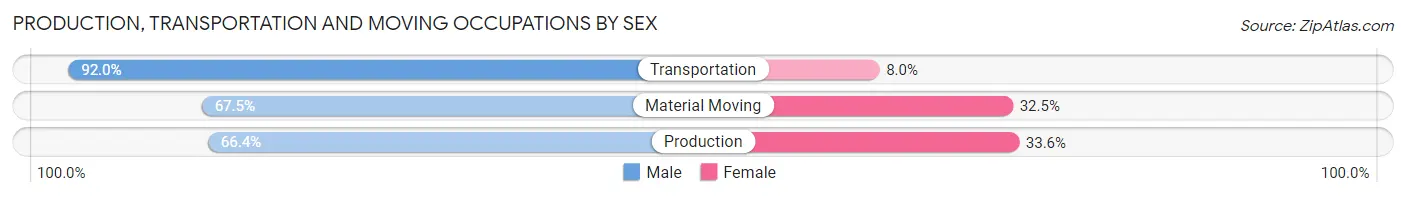
Production, Transportation and Moving Occupations by Sex
| Occupation | Male | Female |
| Production | 1,456 (66.4%) | 738 (33.6%) |
| Transportation | 917 (92.0%) | 80 (8.0%) |
| Material Moving | 604 (67.5%) | 291 (32.5%) |
| Total (Category) | 2,977 (72.9%) | 1,109 (27.1%) |
| Total (Overall) | 15,440 (52.8%) | 13,804 (47.2%) |
Employment Industries by Sex in Rutland County
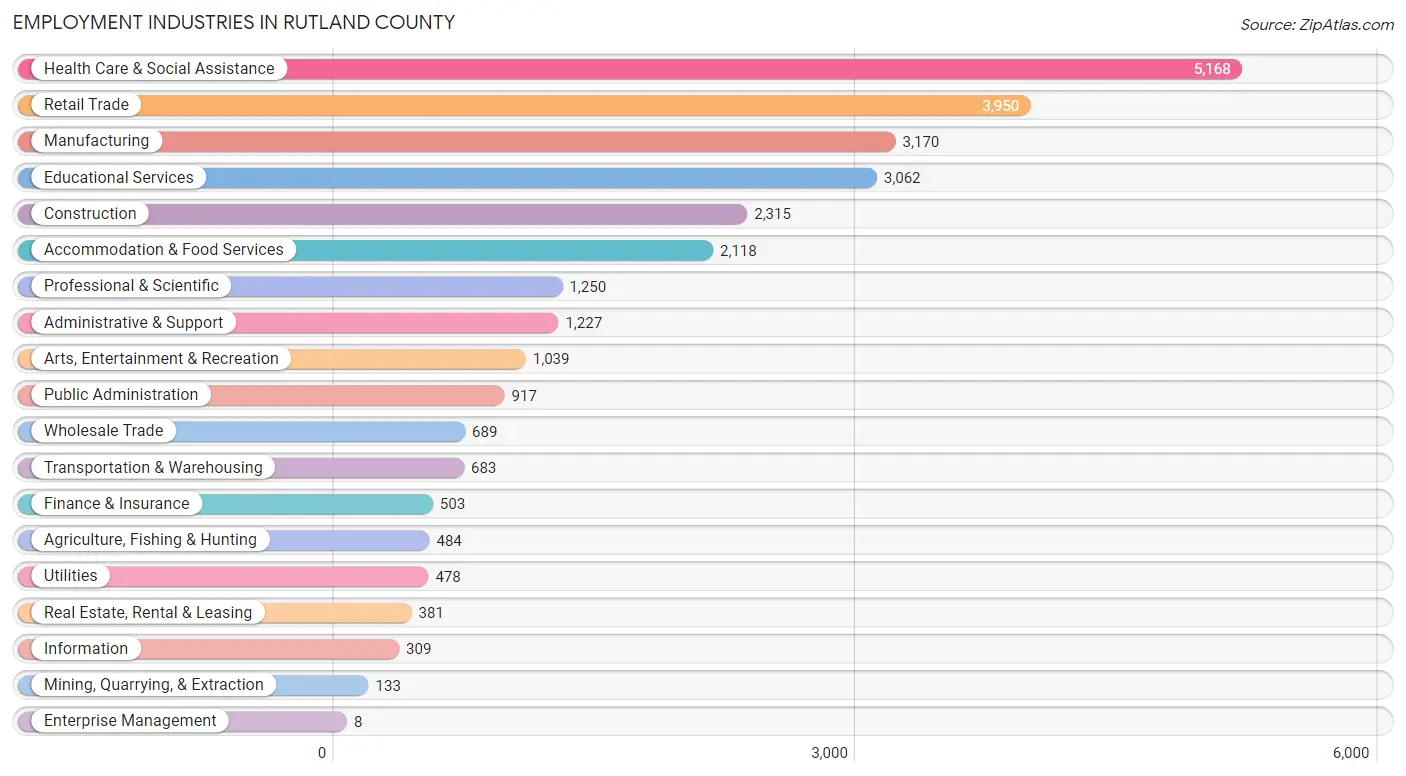
Employment Industries in Rutland County
The major employment industries in Rutland County include Health Care & Social Assistance (5,168 | 17.7%), Retail Trade (3,950 | 13.5%), Manufacturing (3,170 | 10.8%), Educational Services (3,062 | 10.5%), and Construction (2,315 | 7.9%).
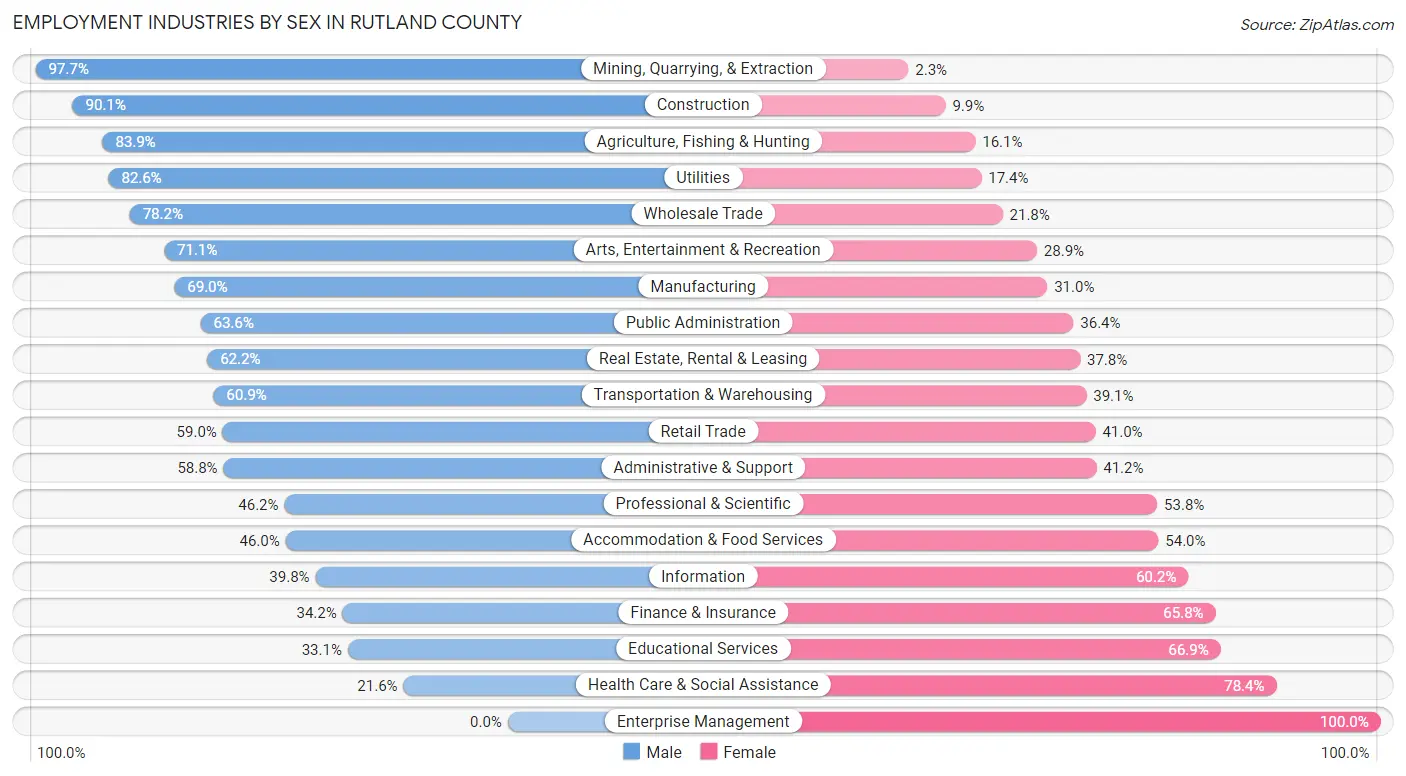
Employment Industries by Sex in Rutland County
The Rutland County industries that see more men than women are Mining, Quarrying, & Extraction (97.7%), Construction (90.1%), and Agriculture, Fishing & Hunting (83.9%), whereas the industries that tend to have a higher number of women are Enterprise Management (100.0%), Health Care & Social Assistance (78.4%), and Educational Services (66.9%).
| Industry | Male | Female |
| Agriculture, Fishing & Hunting | 406 (83.9%) | 78 (16.1%) |
| Mining, Quarrying, & Extraction | 130 (97.7%) | 3 (2.3%) |
| Construction | 2,085 (90.1%) | 230 (9.9%) |
| Manufacturing | 2,187 (69.0%) | 983 (31.0%) |
| Wholesale Trade | 539 (78.2%) | 150 (21.8%) |
| Retail Trade | 2,331 (59.0%) | 1,619 (41.0%) |
| Transportation & Warehousing | 416 (60.9%) | 267 (39.1%) |
| Utilities | 395 (82.6%) | 83 (17.4%) |
| Information | 123 (39.8%) | 186 (60.2%) |
| Finance & Insurance | 172 (34.2%) | 331 (65.8%) |
| Real Estate, Rental & Leasing | 237 (62.2%) | 144 (37.8%) |
| Professional & Scientific | 578 (46.2%) | 672 (53.8%) |
| Enterprise Management | 0 (0.0%) | 8 (100.0%) |
| Administrative & Support | 722 (58.8%) | 505 (41.2%) |
| Educational Services | 1,014 (33.1%) | 2,048 (66.9%) |
| Health Care & Social Assistance | 1,116 (21.6%) | 4,052 (78.4%) |
| Arts, Entertainment & Recreation | 739 (71.1%) | 300 (28.9%) |
| Accommodation & Food Services | 974 (46.0%) | 1,144 (54.0%) |
| Public Administration | 583 (63.6%) | 334 (36.4%) |
| Total | 15,440 (52.8%) | 13,804 (47.2%) |
Education in Rutland County
School Enrollment in Rutland County
The most common levels of schooling among the 11,561 students in Rutland County are high school (2,596 | 22.5%), middle school (2,547 | 22.0%), and college / undergraduate (2,424 | 21.0%).
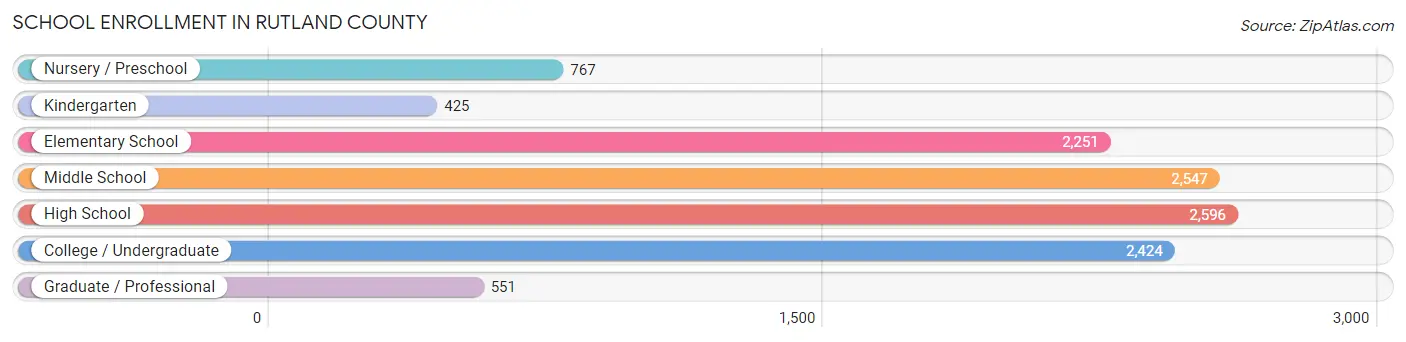
| School Level | # Students | % Students |
| Nursery / Preschool | 767 | 6.6% |
| Kindergarten | 425 | 3.7% |
| Elementary School | 2,251 | 19.5% |
| Middle School | 2,547 | 22.0% |
| High School | 2,596 | 22.5% |
| College / Undergraduate | 2,424 | 21.0% |
| Graduate / Professional | 551 | 4.8% |
| Total | 11,561 | 100.0% |
School Enrollment by Age by Funding Source in Rutland County
Out of a total of 11,561 students who are enrolled in schools in Rutland County, 1,503 (13.0%) attend a private institution, while the remaining 10,058 (87.0%) are enrolled in public schools. The age group of 35 years and over has the highest likelihood of being enrolled in private schools, with 212 (39.2% in the age bracket) enrolled. Conversely, the age group of 5 to 9 year old has the lowest likelihood of being enrolled in a private school, with 2,395 (92.2% in the age bracket) attending a public institution.
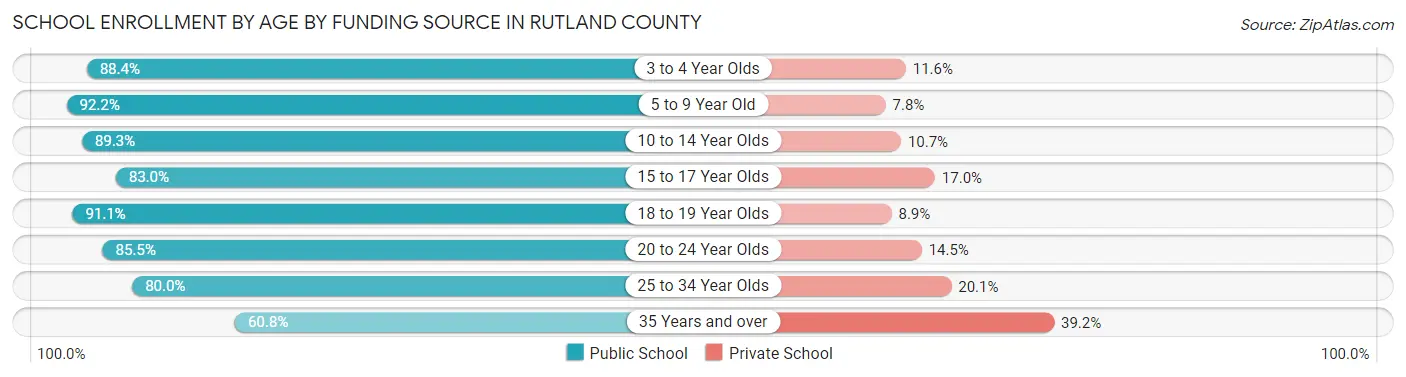
| Age Bracket | Public School | Private School |
| 3 to 4 Year Olds | 512 (88.4%) | 67 (11.6%) |
| 5 to 9 Year Old | 2,395 (92.2%) | 203 (7.8%) |
| 10 to 14 Year Olds | 2,697 (89.3%) | 322 (10.7%) |
| 15 to 17 Year Olds | 1,622 (83.0%) | 332 (17.0%) |
| 18 to 19 Year Olds | 1,195 (91.1%) | 117 (8.9%) |
| 20 to 24 Year Olds | 965 (85.5%) | 164 (14.5%) |
| 25 to 34 Year Olds | 343 (79.9%) | 86 (20.1%) |
| 35 Years and over | 329 (60.8%) | 212 (39.2%) |
| Total | 10,058 (87.0%) | 1,503 (13.0%) |
Educational Attainment by Field of Study in Rutland County
Education (2,398 | 15.1%), business (2,332 | 14.7%), science & technology (1,861 | 11.8%), literature & languages (1,232 | 7.8%), and bio, nature & agricultural (1,135 | 7.2%) are the most common fields of study among 15,827 individuals in Rutland County who have obtained a bachelor's degree or higher.
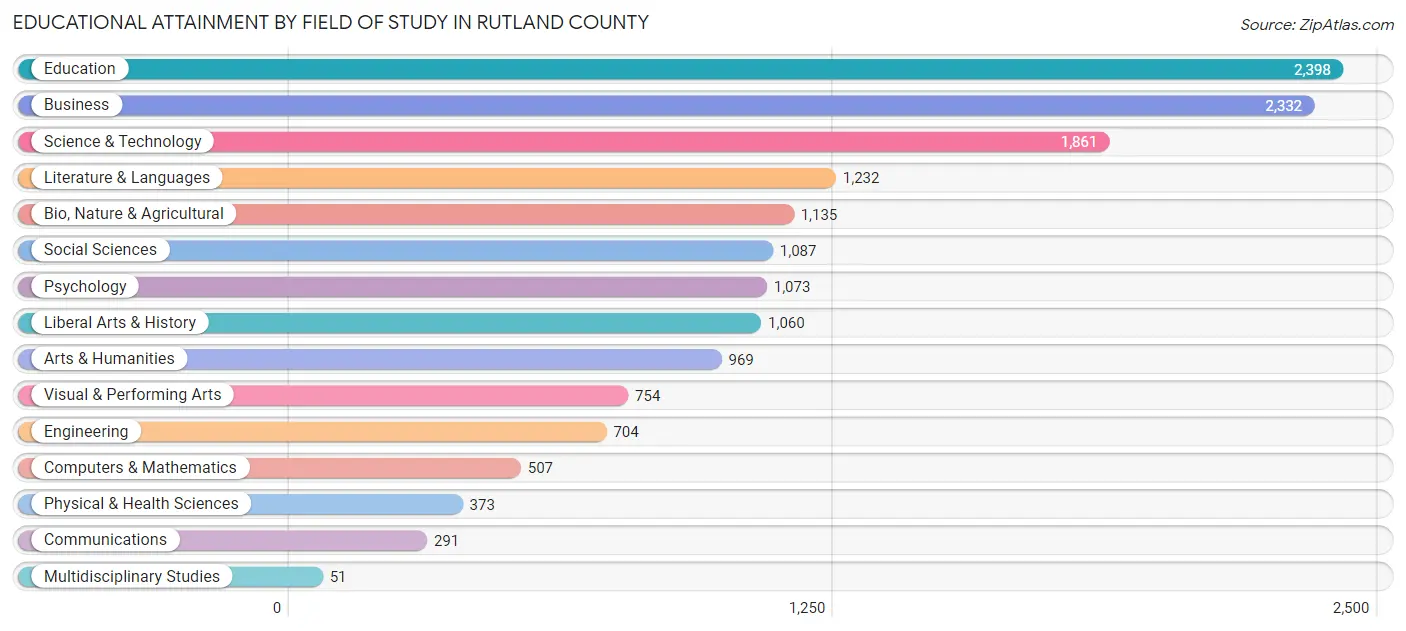
| Field of Study | # Graduates | % Graduates |
| Computers & Mathematics | 507 | 3.2% |
| Bio, Nature & Agricultural | 1,135 | 7.2% |
| Physical & Health Sciences | 373 | 2.4% |
| Psychology | 1,073 | 6.8% |
| Social Sciences | 1,087 | 6.9% |
| Engineering | 704 | 4.4% |
| Multidisciplinary Studies | 51 | 0.3% |
| Science & Technology | 1,861 | 11.8% |
| Business | 2,332 | 14.7% |
| Education | 2,398 | 15.1% |
| Literature & Languages | 1,232 | 7.8% |
| Liberal Arts & History | 1,060 | 6.7% |
| Visual & Performing Arts | 754 | 4.8% |
| Communications | 291 | 1.8% |
| Arts & Humanities | 969 | 6.1% |
| Total | 15,827 | 100.0% |
Transportation & Commute in Rutland County
Vehicle Availability by Sex in Rutland County
The most prevalent vehicle ownership categories in Rutland County are males with 2 vehicles (6,950, accounting for 46.4%) and females with 2 vehicles (6,420, making up 51.9%).
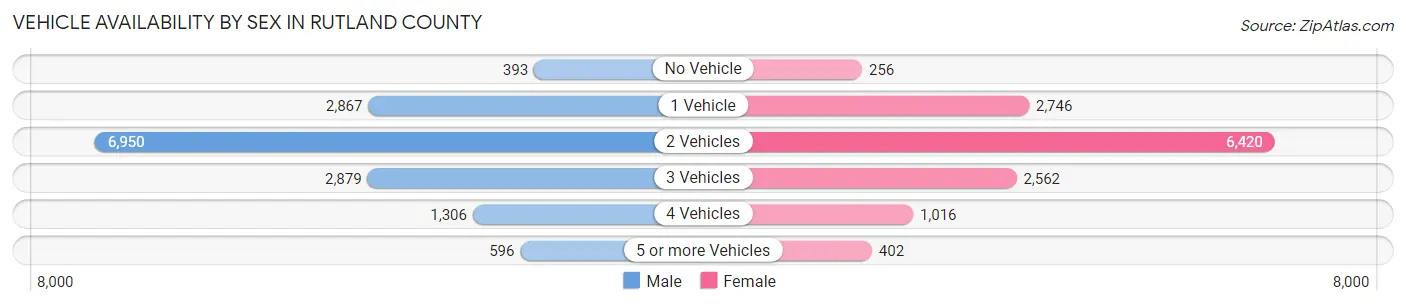
| Vehicles Available | Male | Female |
| No Vehicle | 393 (2.6%) | 256 (1.9%) |
| 1 Vehicle | 2,867 (19.1%) | 2,746 (20.5%) |
| 2 Vehicles | 6,950 (46.4%) | 6,420 (47.9%) |
| 3 Vehicles | 2,879 (19.2%) | 2,562 (19.1%) |
| 4 Vehicles | 1,306 (8.7%) | 1,016 (7.6%) |
| 5 or more Vehicles | 596 (4.0%) | 402 (3.0%) |
| Total | 14,991 (100.0%) | 13,402 (100.0%) |
Commute Time in Rutland County
The most frequently occuring commute durations in Rutland County are 15 to 19 minutes (4,731 commuters, 17.9%), 10 to 14 minutes (4,594 commuters, 17.3%), and 5 to 9 minutes (3,545 commuters, 13.4%).
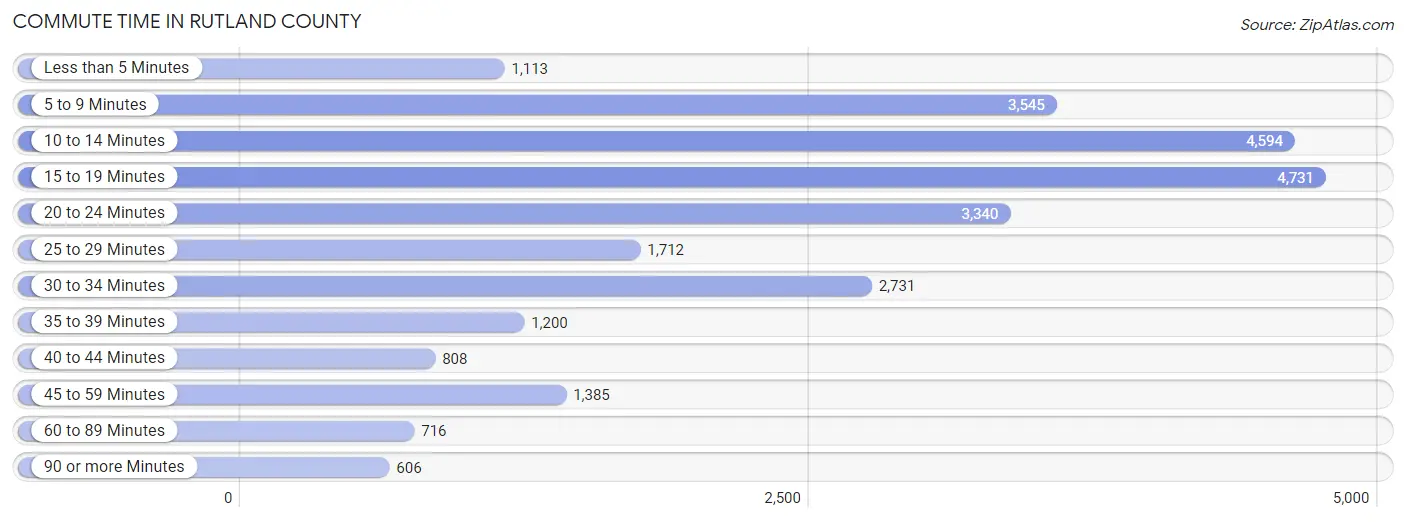
| Commute Time | # Commuters | % Commuters |
| Less than 5 Minutes | 1,113 | 4.2% |
| 5 to 9 Minutes | 3,545 | 13.4% |
| 10 to 14 Minutes | 4,594 | 17.3% |
| 15 to 19 Minutes | 4,731 | 17.9% |
| 20 to 24 Minutes | 3,340 | 12.6% |
| 25 to 29 Minutes | 1,712 | 6.5% |
| 30 to 34 Minutes | 2,731 | 10.3% |
| 35 to 39 Minutes | 1,200 | 4.5% |
| 40 to 44 Minutes | 808 | 3.0% |
| 45 to 59 Minutes | 1,385 | 5.2% |
| 60 to 89 Minutes | 716 | 2.7% |
| 90 or more Minutes | 606 | 2.3% |
Commute Time by Sex in Rutland County
The most common commute times in Rutland County are 15 to 19 minutes (2,411 commuters, 17.1%) for males and 10 to 14 minutes (2,450 commuters, 19.9%) for females.
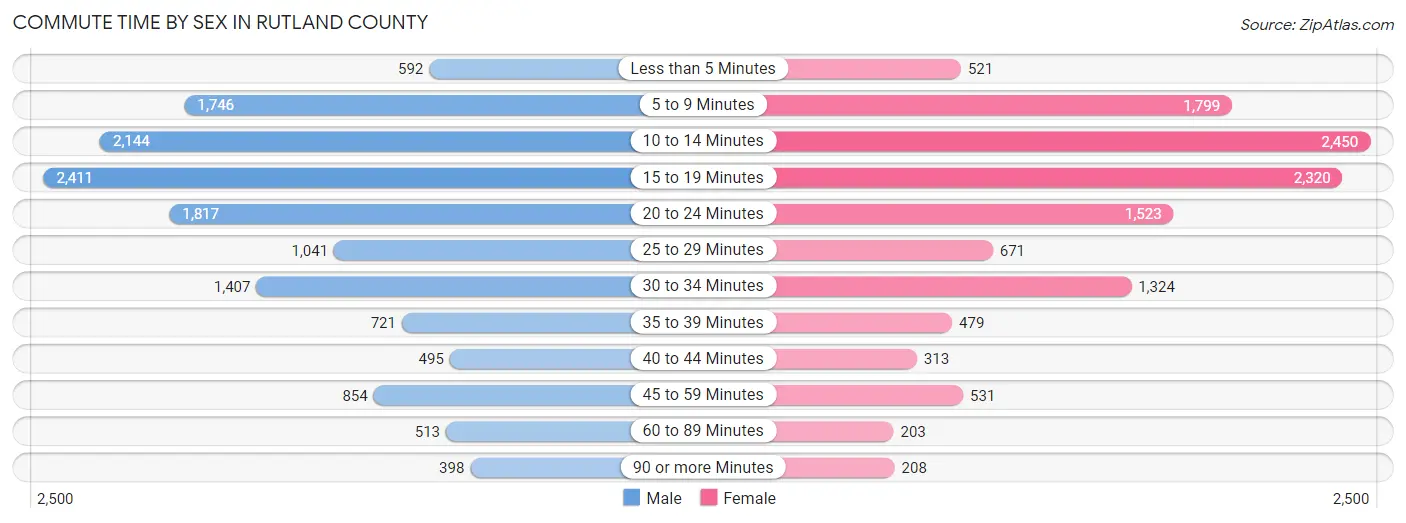
| Commute Time | Male | Female |
| Less than 5 Minutes | 592 (4.2%) | 521 (4.2%) |
| 5 to 9 Minutes | 1,746 (12.3%) | 1,799 (14.6%) |
| 10 to 14 Minutes | 2,144 (15.2%) | 2,450 (19.9%) |
| 15 to 19 Minutes | 2,411 (17.1%) | 2,320 (18.8%) |
| 20 to 24 Minutes | 1,817 (12.9%) | 1,523 (12.3%) |
| 25 to 29 Minutes | 1,041 (7.4%) | 671 (5.4%) |
| 30 to 34 Minutes | 1,407 (10.0%) | 1,324 (10.7%) |
| 35 to 39 Minutes | 721 (5.1%) | 479 (3.9%) |
| 40 to 44 Minutes | 495 (3.5%) | 313 (2.5%) |
| 45 to 59 Minutes | 854 (6.0%) | 531 (4.3%) |
| 60 to 89 Minutes | 513 (3.6%) | 203 (1.6%) |
| 90 or more Minutes | 398 (2.8%) | 208 (1.7%) |
Time of Departure to Work by Sex in Rutland County
The most frequent times of departure to work in Rutland County are 7:00 AM to 7:29 AM (2,433, 17.2%) for males and 7:00 AM to 7:29 AM (2,316, 18.8%) for females.
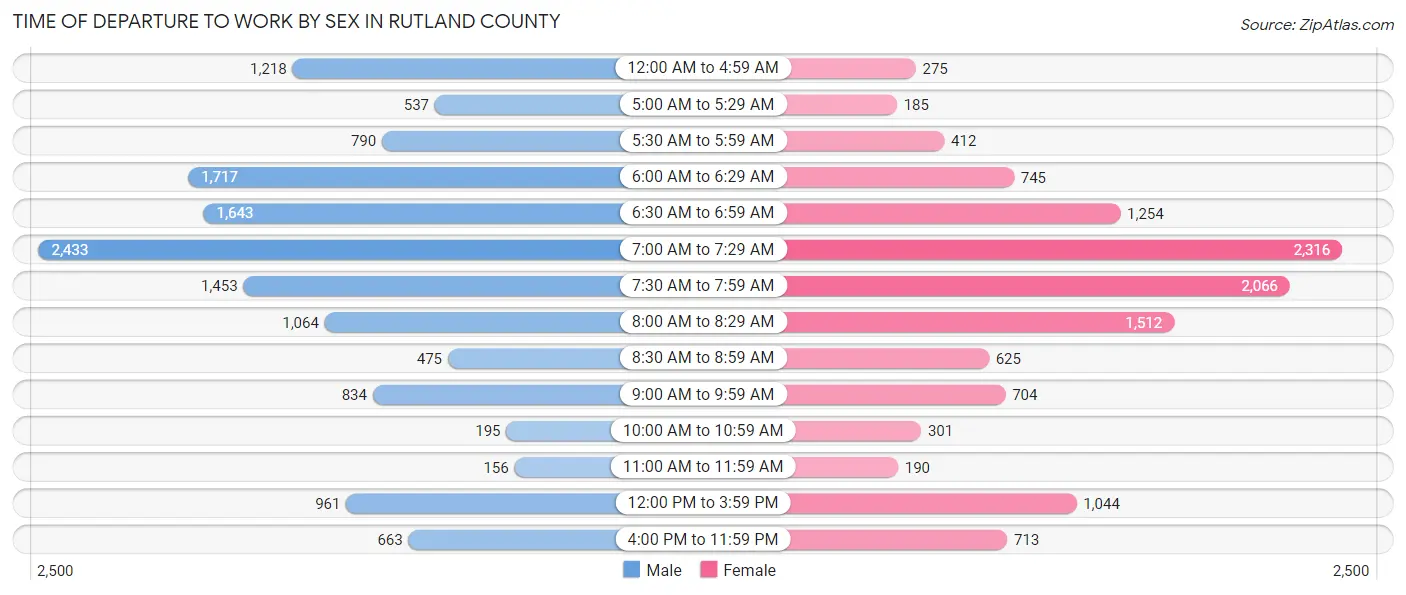
| Time of Departure | Male | Female |
| 12:00 AM to 4:59 AM | 1,218 (8.6%) | 275 (2.2%) |
| 5:00 AM to 5:29 AM | 537 (3.8%) | 185 (1.5%) |
| 5:30 AM to 5:59 AM | 790 (5.6%) | 412 (3.3%) |
| 6:00 AM to 6:29 AM | 1,717 (12.1%) | 745 (6.0%) |
| 6:30 AM to 6:59 AM | 1,643 (11.6%) | 1,254 (10.2%) |
| 7:00 AM to 7:29 AM | 2,433 (17.2%) | 2,316 (18.8%) |
| 7:30 AM to 7:59 AM | 1,453 (10.3%) | 2,066 (16.7%) |
| 8:00 AM to 8:29 AM | 1,064 (7.5%) | 1,512 (12.2%) |
| 8:30 AM to 8:59 AM | 475 (3.4%) | 625 (5.1%) |
| 9:00 AM to 9:59 AM | 834 (5.9%) | 704 (5.7%) |
| 10:00 AM to 10:59 AM | 195 (1.4%) | 301 (2.4%) |
| 11:00 AM to 11:59 AM | 156 (1.1%) | 190 (1.5%) |
| 12:00 PM to 3:59 PM | 961 (6.8%) | 1,044 (8.5%) |
| 4:00 PM to 11:59 PM | 663 (4.7%) | 713 (5.8%) |
| Total | 14,139 (100.0%) | 12,342 (100.0%) |
Housing Occupancy in Rutland County
Occupancy by Ownership in Rutland County
Of the total 25,334 dwellings in Rutland County, owner-occupied units account for 18,314 (72.3%), while renter-occupied units make up 7,020 (27.7%).
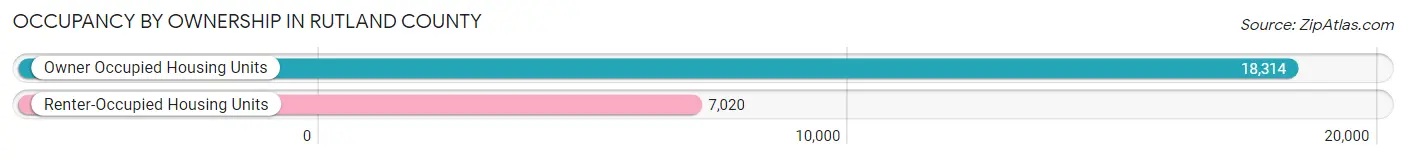
| Occupancy | # Housing Units | % Housing Units |
| Owner Occupied Housing Units | 18,314 | 72.3% |
| Renter-Occupied Housing Units | 7,020 | 27.7% |
| Total Occupied Housing Units | 25,334 | 100.0% |
Occupancy by Household Size in Rutland County
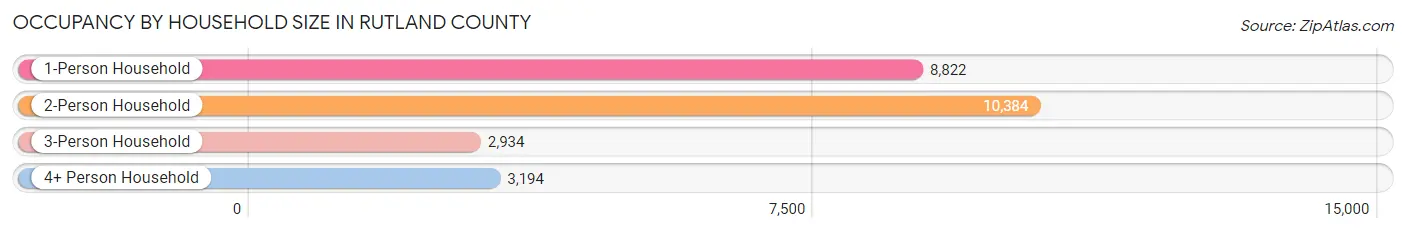
| Household Size | # Housing Units | % Housing Units |
| 1-Person Household | 8,822 | 34.8% |
| 2-Person Household | 10,384 | 41.0% |
| 3-Person Household | 2,934 | 11.6% |
| 4+ Person Household | 3,194 | 12.6% |
| Total Housing Units | 25,334 | 100.0% |
Occupancy by Ownership by Household Size in Rutland County
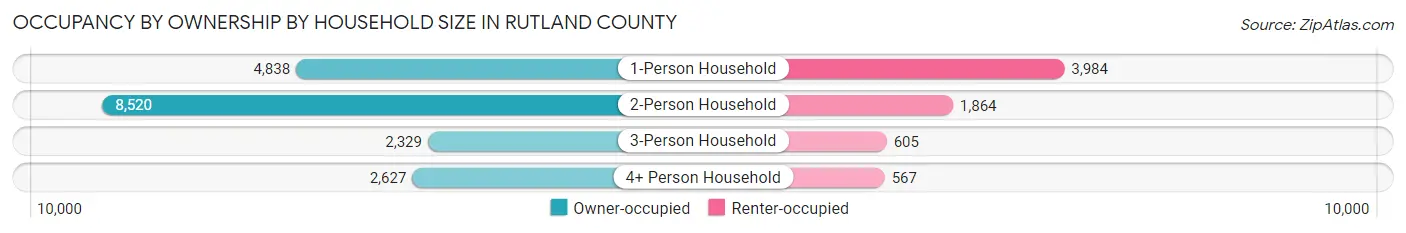
| Household Size | Owner-occupied | Renter-occupied |
| 1-Person Household | 4,838 (54.8%) | 3,984 (45.2%) |
| 2-Person Household | 8,520 (82.1%) | 1,864 (17.9%) |
| 3-Person Household | 2,329 (79.4%) | 605 (20.6%) |
| 4+ Person Household | 2,627 (82.3%) | 567 (17.7%) |
| Total Housing Units | 18,314 (72.3%) | 7,020 (27.7%) |
Occupancy by Educational Attainment in Rutland County
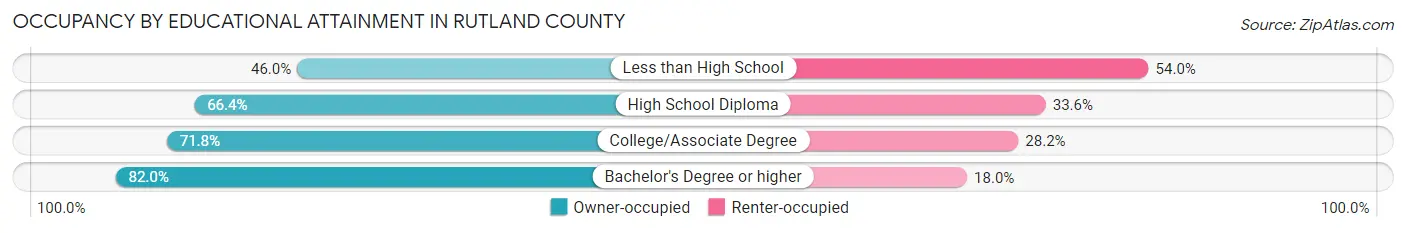
| Household Size | Owner-occupied | Renter-occupied |
| Less than High School | 687 (46.0%) | 807 (54.0%) |
| High School Diploma | 5,091 (66.4%) | 2,580 (33.6%) |
| College/Associate Degree | 5,058 (71.8%) | 1,987 (28.2%) |
| Bachelor's Degree or higher | 7,478 (82.0%) | 1,646 (18.0%) |
Occupancy by Age of Householder in Rutland County
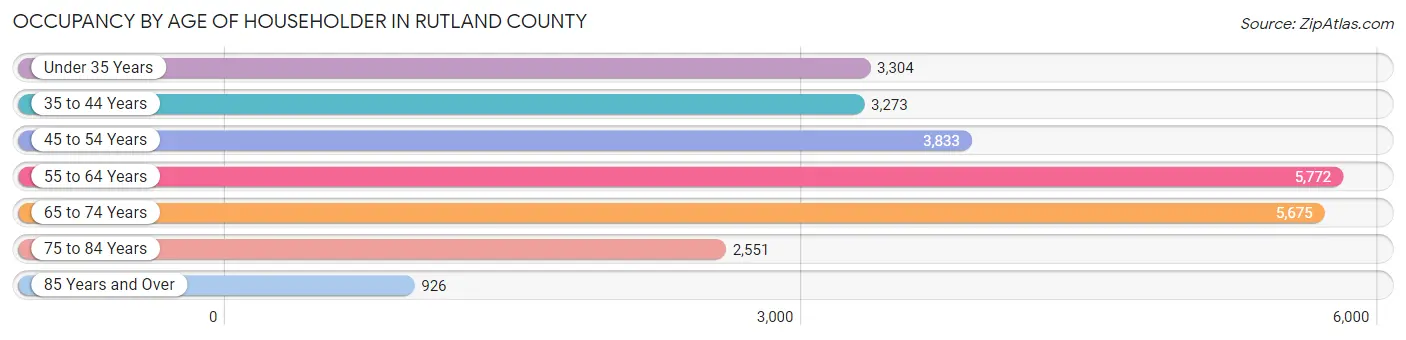
| Age Bracket | # Households | % Households |
| Under 35 Years | 3,304 | 13.0% |
| 35 to 44 Years | 3,273 | 12.9% |
| 45 to 54 Years | 3,833 | 15.1% |
| 55 to 64 Years | 5,772 | 22.8% |
| 65 to 74 Years | 5,675 | 22.4% |
| 75 to 84 Years | 2,551 | 10.1% |
| 85 Years and Over | 926 | 3.7% |
| Total | 25,334 | 100.0% |
Housing Finances in Rutland County
Median Income by Occupancy in Rutland County
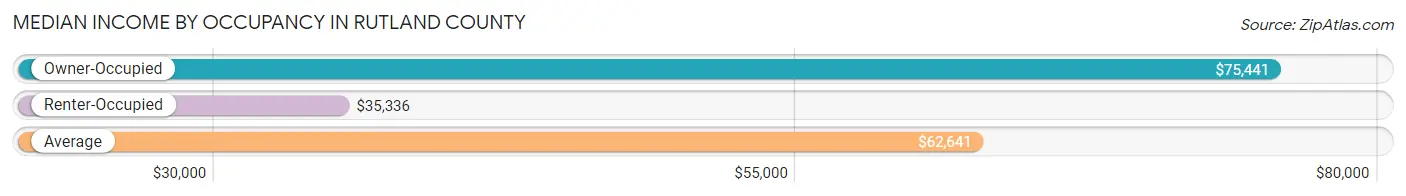
| Occupancy Type | # Households | Median Income |
| Owner-Occupied | 18,314 (72.3%) | $75,441 |
| Renter-Occupied | 7,020 (27.7%) | $35,336 |
| Average | 25,334 (100.0%) | $62,641 |
Occupancy by Householder Income Bracket in Rutland County
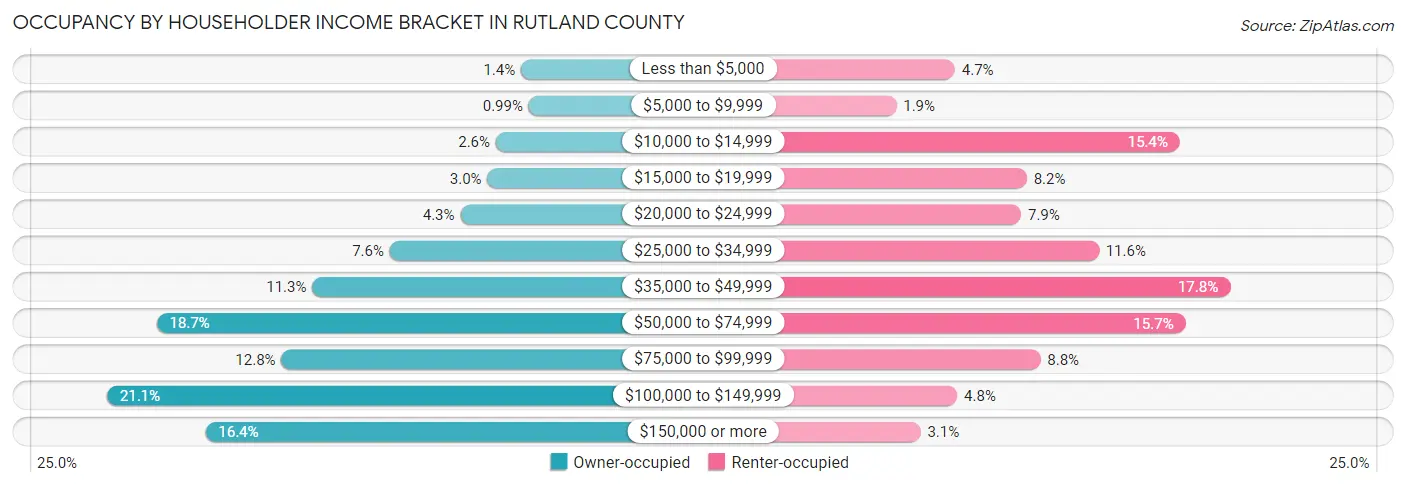
| Income Bracket | Owner-occupied | Renter-occupied |
| Less than $5,000 | 249 (1.4%) | 332 (4.7%) |
| $5,000 to $9,999 | 182 (1.0%) | 136 (1.9%) |
| $10,000 to $14,999 | 469 (2.6%) | 1,084 (15.4%) |
| $15,000 to $19,999 | 542 (3.0%) | 572 (8.2%) |
| $20,000 to $24,999 | 779 (4.3%) | 553 (7.9%) |
| $25,000 to $34,999 | 1,394 (7.6%) | 813 (11.6%) |
| $35,000 to $49,999 | 2,069 (11.3%) | 1,252 (17.8%) |
| $50,000 to $74,999 | 3,428 (18.7%) | 1,103 (15.7%) |
| $75,000 to $99,999 | 2,339 (12.8%) | 618 (8.8%) |
| $100,000 to $149,999 | 3,861 (21.1%) | 340 (4.8%) |
| $150,000 or more | 3,002 (16.4%) | 217 (3.1%) |
| Total | 18,314 (100.0%) | 7,020 (100.0%) |
Monthly Housing Cost Tiers in Rutland County
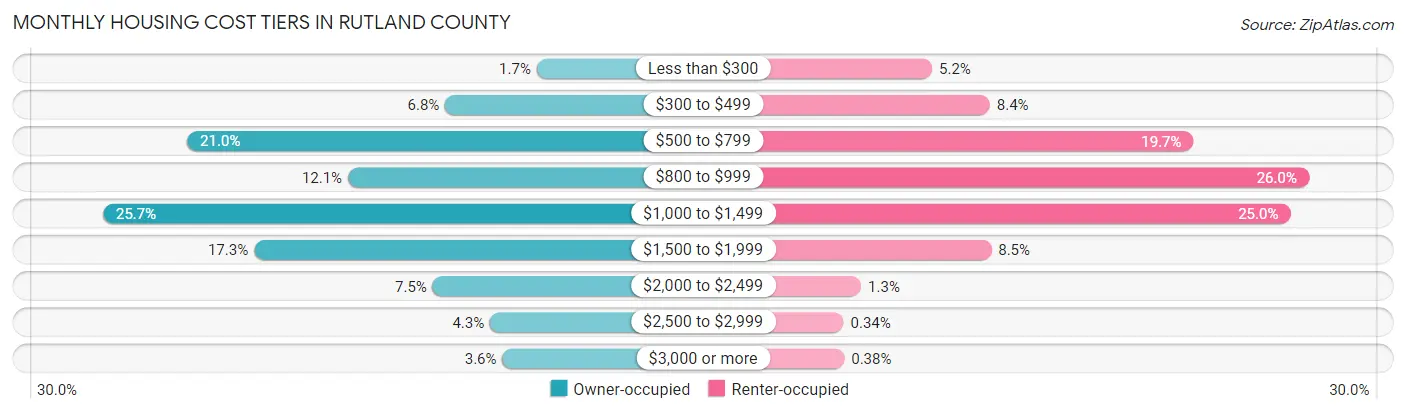
| Monthly Cost | Owner-occupied | Renter-occupied |
| Less than $300 | 313 (1.7%) | 367 (5.2%) |
| $300 to $499 | 1,239 (6.8%) | 591 (8.4%) |
| $500 to $799 | 3,849 (21.0%) | 1,380 (19.7%) |
| $800 to $999 | 2,223 (12.1%) | 1,827 (26.0%) |
| $1,000 to $1,499 | 4,703 (25.7%) | 1,756 (25.0%) |
| $1,500 to $1,999 | 3,173 (17.3%) | 597 (8.5%) |
| $2,000 to $2,499 | 1,367 (7.5%) | 92 (1.3%) |
| $2,500 to $2,999 | 786 (4.3%) | 24 (0.3%) |
| $3,000 or more | 661 (3.6%) | 27 (0.4%) |
| Total | 18,314 (100.0%) | 7,020 (100.0%) |
Physical Housing Characteristics in Rutland County
Housing Structures in Rutland County
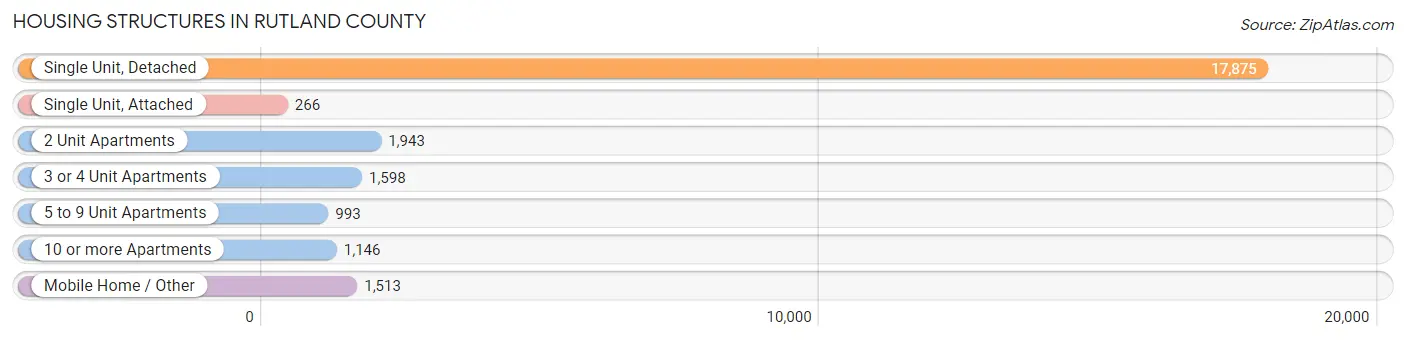
| Structure Type | # Housing Units | % Housing Units |
| Single Unit, Detached | 17,875 | 70.6% |
| Single Unit, Attached | 266 | 1.1% |
| 2 Unit Apartments | 1,943 | 7.7% |
| 3 or 4 Unit Apartments | 1,598 | 6.3% |
| 5 to 9 Unit Apartments | 993 | 3.9% |
| 10 or more Apartments | 1,146 | 4.5% |
| Mobile Home / Other | 1,513 | 6.0% |
| Total | 25,334 | 100.0% |
Housing Structures by Occupancy in Rutland County
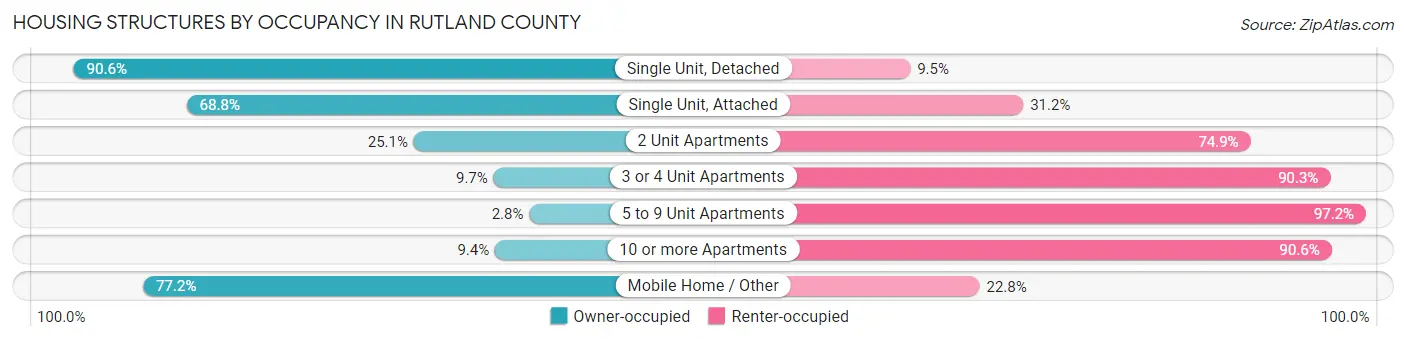
| Structure Type | Owner-occupied | Renter-occupied |
| Single Unit, Detached | 16,185 (90.5%) | 1,690 (9.5%) |
| Single Unit, Attached | 183 (68.8%) | 83 (31.2%) |
| 2 Unit Apartments | 487 (25.1%) | 1,456 (74.9%) |
| 3 or 4 Unit Apartments | 155 (9.7%) | 1,443 (90.3%) |
| 5 to 9 Unit Apartments | 28 (2.8%) | 965 (97.2%) |
| 10 or more Apartments | 108 (9.4%) | 1,038 (90.6%) |
| Mobile Home / Other | 1,168 (77.2%) | 345 (22.8%) |
| Total | 18,314 (72.3%) | 7,020 (27.7%) |
Housing Structures by Number of Rooms in Rutland County
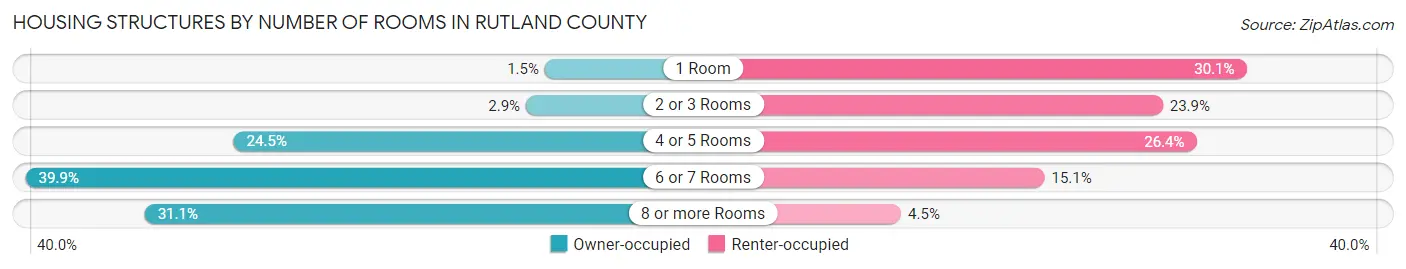
| Number of Rooms | Owner-occupied | Renter-occupied |
| 1 Room | 277 (1.5%) | 2,111 (30.1%) |
| 2 or 3 Rooms | 533 (2.9%) | 1,677 (23.9%) |
| 4 or 5 Rooms | 4,495 (24.5%) | 1,851 (26.4%) |
| 6 or 7 Rooms | 7,312 (39.9%) | 1,063 (15.1%) |
| 8 or more Rooms | 5,697 (31.1%) | 318 (4.5%) |
| Total | 18,314 (100.0%) | 7,020 (100.0%) |
Housing Structure by Heating Type in Rutland County
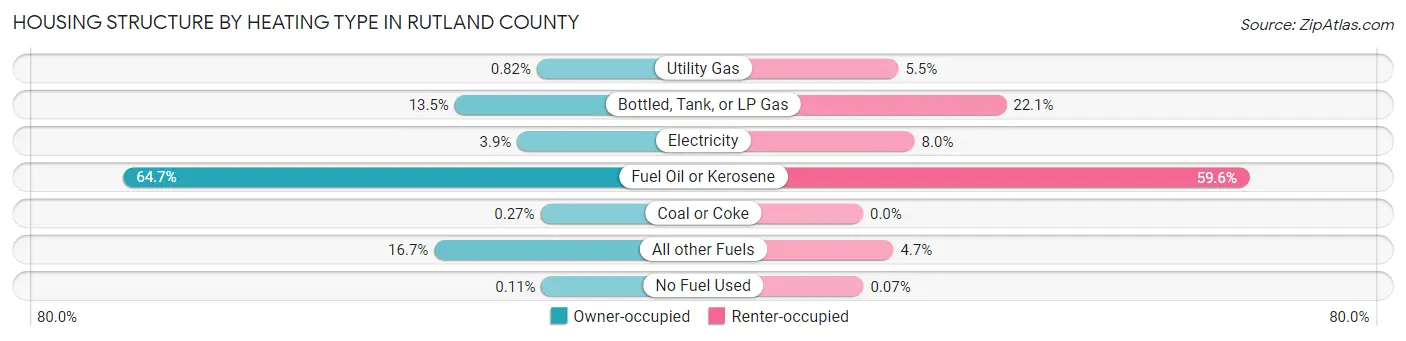
| Heating Type | Owner-occupied | Renter-occupied |
| Utility Gas | 151 (0.8%) | 385 (5.5%) |
| Bottled, Tank, or LP Gas | 2,475 (13.5%) | 1,554 (22.1%) |
| Electricity | 705 (3.8%) | 560 (8.0%) |
| Fuel Oil or Kerosene | 11,856 (64.7%) | 4,186 (59.6%) |
| Coal or Coke | 49 (0.3%) | 0 (0.0%) |
| All other Fuels | 3,057 (16.7%) | 330 (4.7%) |
| No Fuel Used | 21 (0.1%) | 5 (0.1%) |
| Total | 18,314 (100.0%) | 7,020 (100.0%) |
Household Vehicle Usage in Rutland County
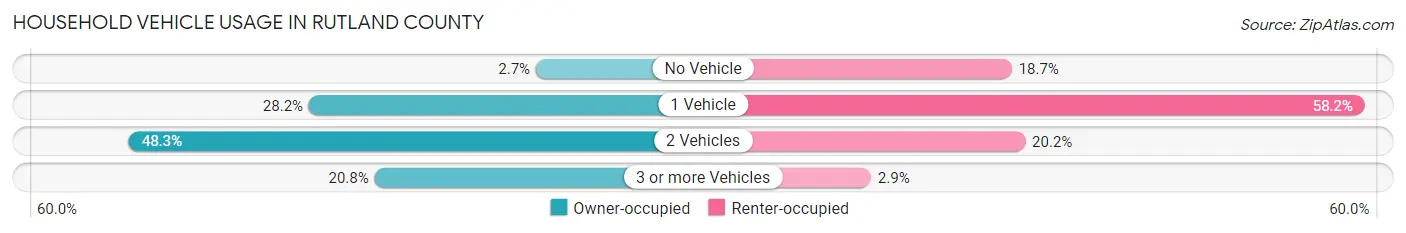
| Vehicles per Household | Owner-occupied | Renter-occupied |
| No Vehicle | 498 (2.7%) | 1,311 (18.7%) |
| 1 Vehicle | 5,156 (28.1%) | 4,088 (58.2%) |
| 2 Vehicles | 8,850 (48.3%) | 1,417 (20.2%) |
| 3 or more Vehicles | 3,810 (20.8%) | 204 (2.9%) |
| Total | 18,314 (100.0%) | 7,020 (100.0%) |
Real Estate & Mortgages in Rutland County
Real Estate and Mortgage Overview in Rutland County
| Characteristic | Without Mortgage | With Mortgage |
| Housing Units | 7,964 | 10,350 |
| Median Property Value | $201,000 | $205,400 |
| Median Household Income | $58,210 | $2,076 |
| Monthly Housing Costs | $723 | $659 |
| Real Estate Taxes | $3,903 | $74 |
Property Value by Mortgage Status in Rutland County
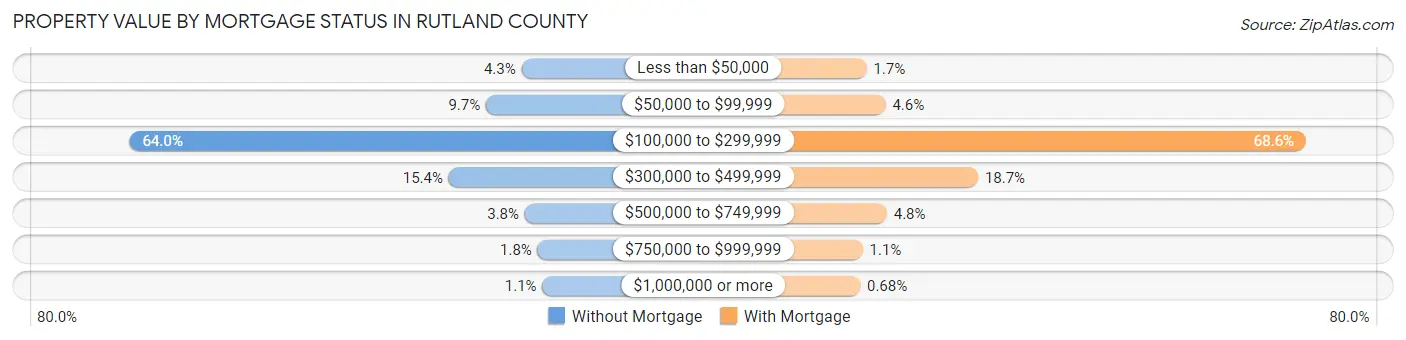
| Property Value | Without Mortgage | With Mortgage |
| Less than $50,000 | 340 (4.3%) | 172 (1.7%) |
| $50,000 to $99,999 | 771 (9.7%) | 472 (4.6%) |
| $100,000 to $299,999 | 5,098 (64.0%) | 7,102 (68.6%) |
| $300,000 to $499,999 | 1,223 (15.4%) | 1,930 (18.6%) |
| $500,000 to $749,999 | 300 (3.8%) | 493 (4.8%) |
| $750,000 to $999,999 | 145 (1.8%) | 111 (1.1%) |
| $1,000,000 or more | 87 (1.1%) | 70 (0.7%) |
| Total | 7,964 (100.0%) | 10,350 (100.0%) |
Household Income by Mortgage Status in Rutland County
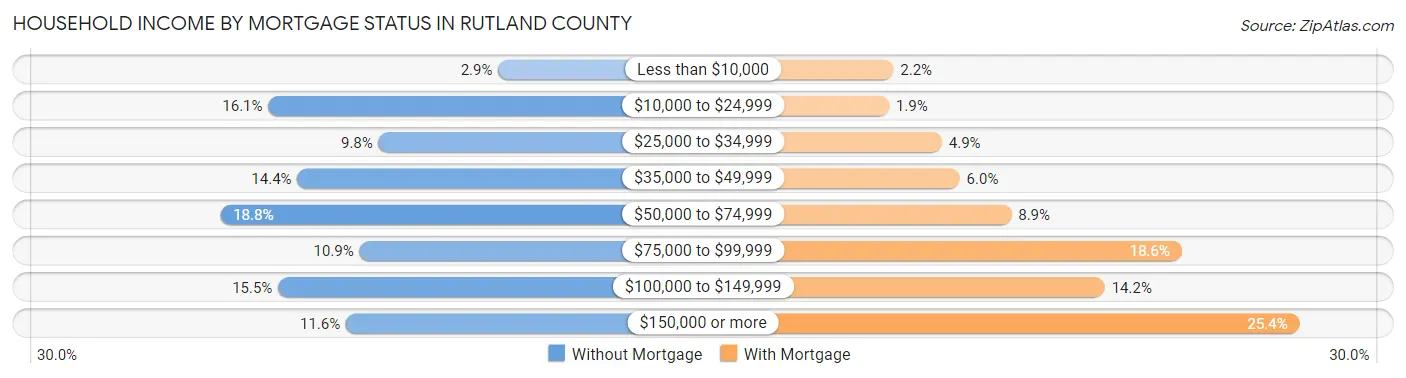
| Household Income | Without Mortgage | With Mortgage |
| Less than $10,000 | 233 (2.9%) | 224 (2.2%) |
| $10,000 to $24,999 | 1,280 (16.1%) | 198 (1.9%) |
| $25,000 to $34,999 | 778 (9.8%) | 510 (4.9%) |
| $35,000 to $49,999 | 1,148 (14.4%) | 616 (5.9%) |
| $50,000 to $74,999 | 1,499 (18.8%) | 921 (8.9%) |
| $75,000 to $99,999 | 865 (10.9%) | 1,929 (18.6%) |
| $100,000 to $149,999 | 1,235 (15.5%) | 1,474 (14.2%) |
| $150,000 or more | 926 (11.6%) | 2,626 (25.4%) |
| Total | 7,964 (100.0%) | 10,350 (100.0%) |
Property Value to Household Income Ratio in Rutland County
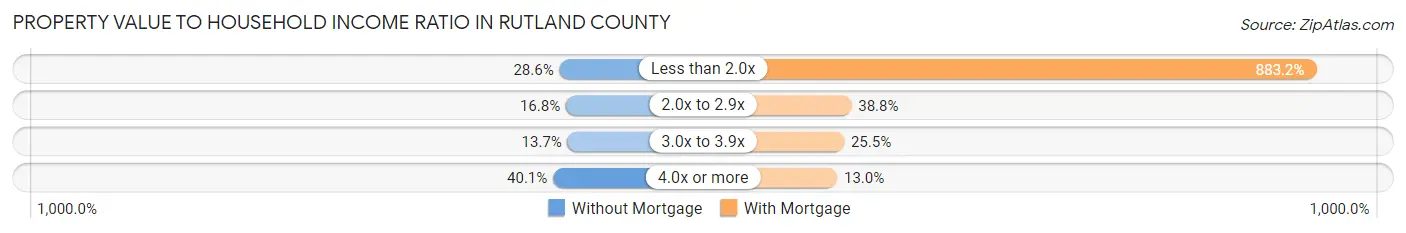
| Value-to-Income Ratio | Without Mortgage | With Mortgage |
| Less than 2.0x | 2,279 (28.6%) | 91,410 (883.2%) |
| 2.0x to 2.9x | 1,337 (16.8%) | 4,015 (38.8%) |
| 3.0x to 3.9x | 1,092 (13.7%) | 2,640 (25.5%) |
| 4.0x or more | 3,197 (40.1%) | 1,344 (13.0%) |
| Total | 7,964 (100.0%) | 10,350 (100.0%) |
Real Estate Taxes by Mortgage Status in Rutland County
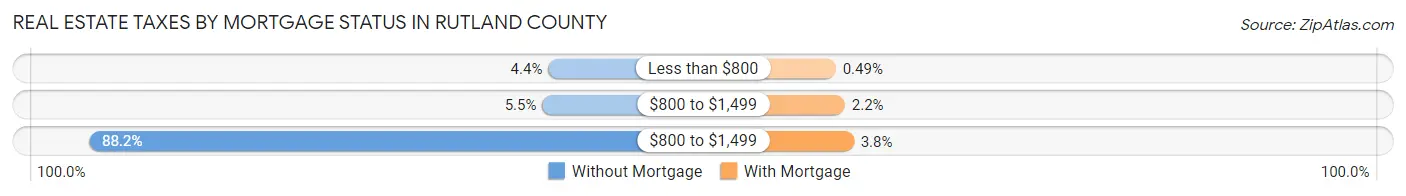
| Property Taxes | Without Mortgage | With Mortgage |
| Less than $800 | 347 (4.4%) | 51 (0.5%) |
| $800 to $1,499 | 434 (5.4%) | 224 (2.2%) |
| $800 to $1,499 | 7,026 (88.2%) | 391 (3.8%) |
| Total | 7,964 (100.0%) | 10,350 (100.0%) |
Health & Disability in Rutland County
Health Insurance Coverage by Age in Rutland County
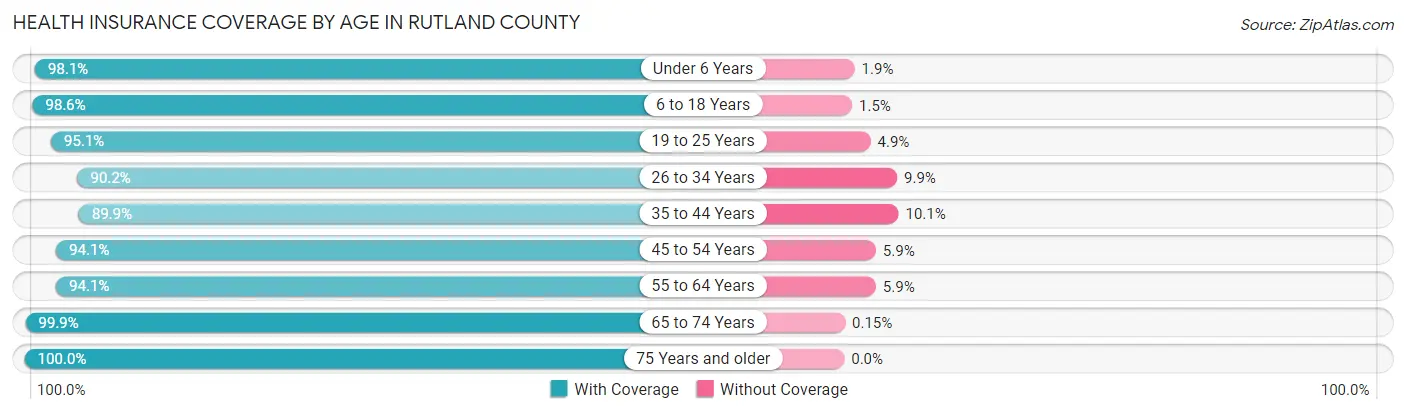
| Age Bracket | With Coverage | Without Coverage |
| Under 6 Years | 2,953 (98.1%) | 58 (1.9%) |
| 6 to 18 Years | 8,336 (98.6%) | 123 (1.5%) |
| 19 to 25 Years | 4,469 (95.1%) | 231 (4.9%) |
| 26 to 34 Years | 5,420 (90.1%) | 592 (9.9%) |
| 35 to 44 Years | 5,735 (89.9%) | 646 (10.1%) |
| 45 to 54 Years | 7,186 (94.1%) | 450 (5.9%) |
| 55 to 64 Years | 9,458 (94.1%) | 592 (5.9%) |
| 65 to 74 Years | 8,551 (99.9%) | 13 (0.2%) |
| 75 Years and older | 5,199 (100.0%) | 0 (0.0%) |
| Total | 57,307 (95.5%) | 2,705 (4.5%) |
Health Insurance Coverage by Citizenship Status in Rutland County
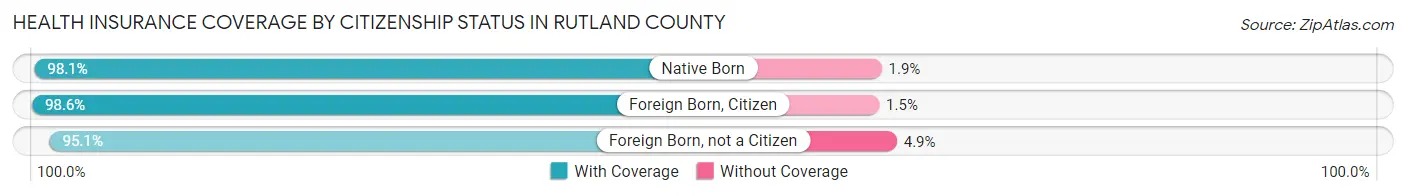
| Citizenship Status | With Coverage | Without Coverage |
| Native Born | 2,953 (98.1%) | 58 (1.9%) |
| Foreign Born, Citizen | 8,336 (98.6%) | 123 (1.5%) |
| Foreign Born, not a Citizen | 4,469 (95.1%) | 231 (4.9%) |
Health Insurance Coverage by Household Income in Rutland County
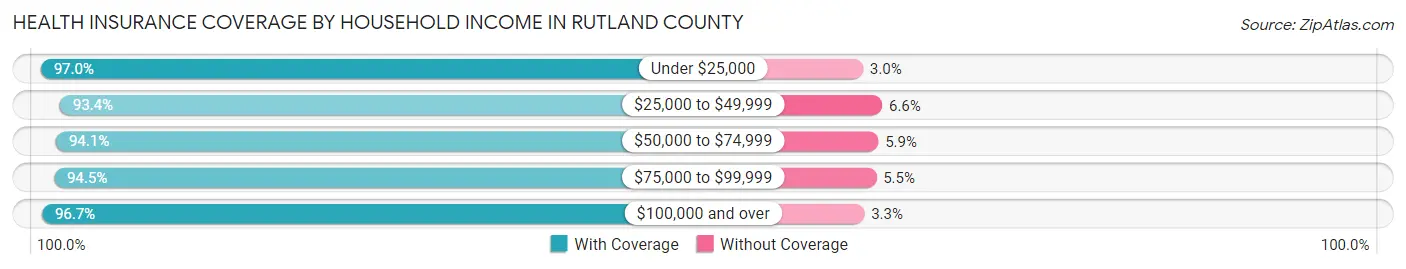
| Household Income | With Coverage | Without Coverage |
| Under $25,000 | 6,572 (97.0%) | 205 (3.0%) |
| $25,000 to $49,999 | 9,024 (93.4%) | 638 (6.6%) |
| $50,000 to $74,999 | 9,922 (94.1%) | 621 (5.9%) |
| $75,000 to $99,999 | 7,100 (94.5%) | 414 (5.5%) |
| $100,000 and over | 23,220 (96.7%) | 782 (3.3%) |
Public vs Private Health Insurance Coverage by Age in Rutland County
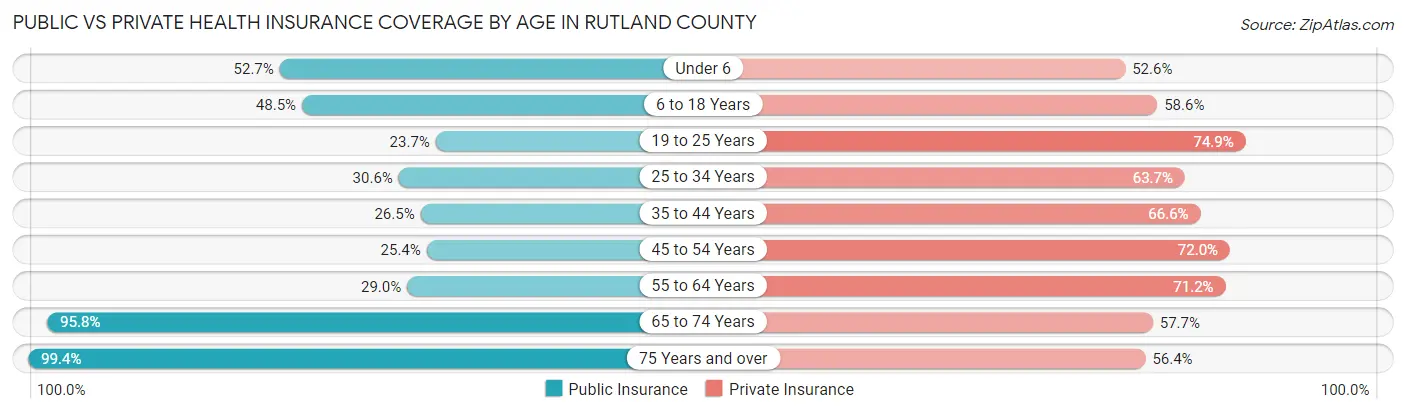
| Age Bracket | Public Insurance | Private Insurance |
| Under 6 | 1,586 (52.7%) | 1,584 (52.6%) |
| 6 to 18 Years | 4,105 (48.5%) | 4,953 (58.6%) |
| 19 to 25 Years | 1,114 (23.7%) | 3,522 (74.9%) |
| 25 to 34 Years | 1,838 (30.6%) | 3,827 (63.7%) |
| 35 to 44 Years | 1,692 (26.5%) | 4,247 (66.6%) |
| 45 to 54 Years | 1,938 (25.4%) | 5,500 (72.0%) |
| 55 to 64 Years | 2,916 (29.0%) | 7,156 (71.2%) |
| 65 to 74 Years | 8,205 (95.8%) | 4,944 (57.7%) |
| 75 Years and over | 5,165 (99.4%) | 2,930 (56.4%) |
| Total | 28,559 (47.6%) | 38,663 (64.4%) |
Disability Status by Sex by Age in Rutland County
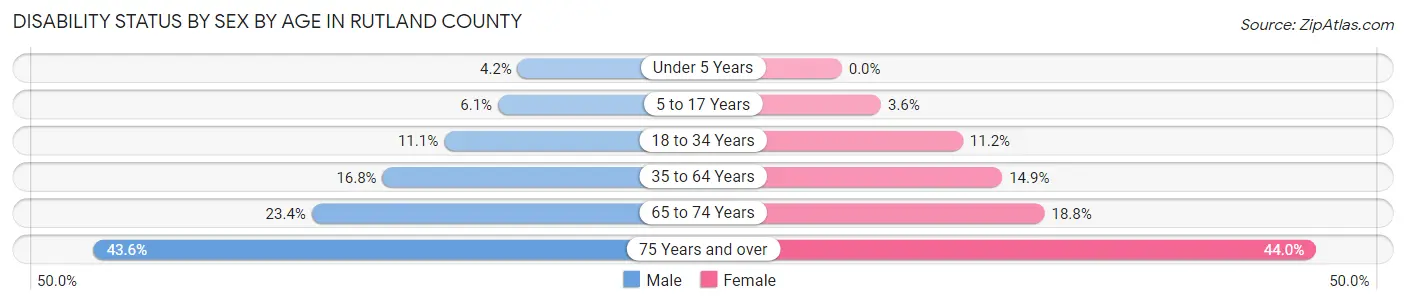
| Age Bracket | Male | Female |
| Under 5 Years | 54 (4.2%) | 0 (0.0%) |
| 5 to 17 Years | 254 (6.1%) | 142 (3.6%) |
| 18 to 34 Years | 665 (11.1%) | 624 (11.2%) |
| 35 to 64 Years | 2,016 (16.8%) | 1,795 (14.9%) |
| 65 to 74 Years | 999 (23.4%) | 807 (18.8%) |
| 75 Years and over | 1,004 (43.6%) | 1,274 (44.0%) |
Disability Class by Sex by Age in Rutland County
Disability Class: Hearing Difficulty
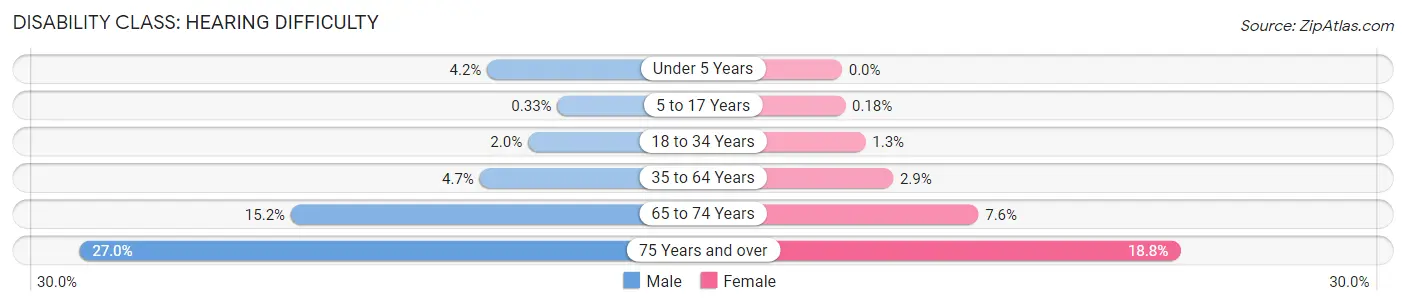
| Age Bracket | Male | Female |
| Under 5 Years | 54 (4.2%) | 0 (0.0%) |
| 5 to 17 Years | 14 (0.3%) | 7 (0.2%) |
| 18 to 34 Years | 118 (2.0%) | 73 (1.3%) |
| 35 to 64 Years | 560 (4.7%) | 344 (2.9%) |
| 65 to 74 Years | 649 (15.2%) | 326 (7.6%) |
| 75 Years and over | 621 (27.0%) | 545 (18.8%) |
Disability Class: Vision Difficulty
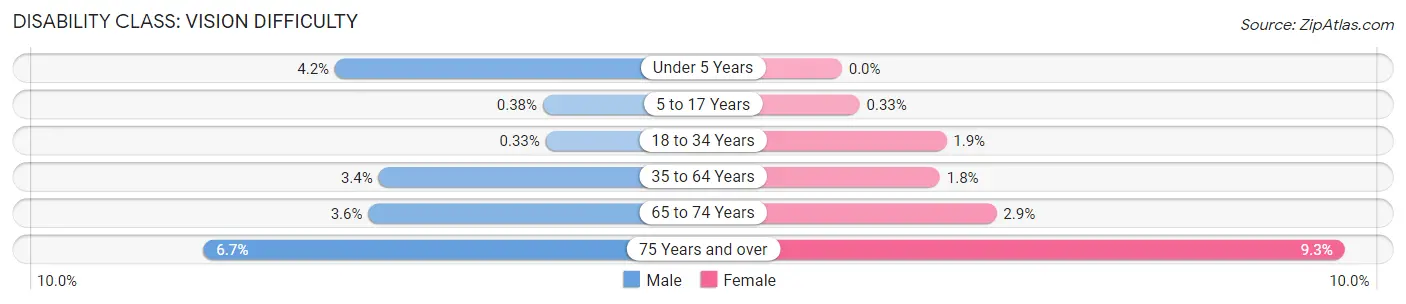
| Age Bracket | Male | Female |
| Under 5 Years | 54 (4.2%) | 0 (0.0%) |
| 5 to 17 Years | 16 (0.4%) | 13 (0.3%) |
| 18 to 34 Years | 20 (0.3%) | 108 (1.9%) |
| 35 to 64 Years | 412 (3.4%) | 220 (1.8%) |
| 65 to 74 Years | 155 (3.6%) | 123 (2.9%) |
| 75 Years and over | 154 (6.7%) | 270 (9.3%) |
Disability Class: Cognitive Difficulty
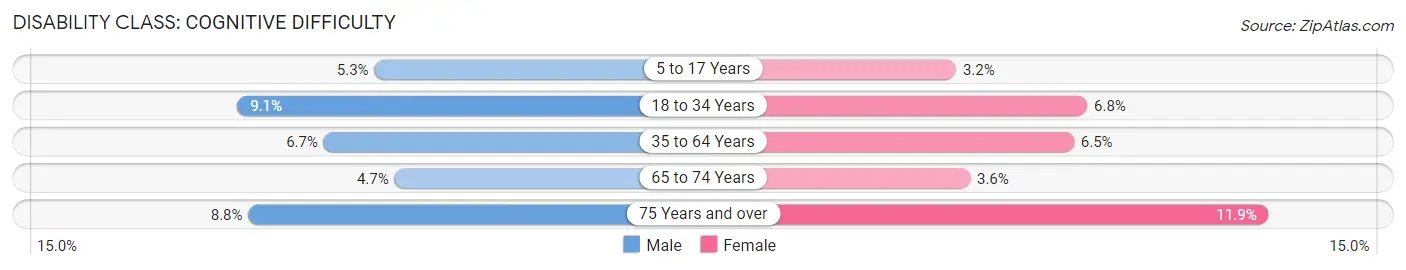
| Age Bracket | Male | Female |
| 5 to 17 Years | 220 (5.3%) | 124 (3.2%) |
| 18 to 34 Years | 545 (9.1%) | 379 (6.8%) |
| 35 to 64 Years | 801 (6.7%) | 779 (6.5%) |
| 65 to 74 Years | 201 (4.7%) | 153 (3.6%) |
| 75 Years and over | 202 (8.8%) | 344 (11.9%) |
Disability Class: Ambulatory Difficulty
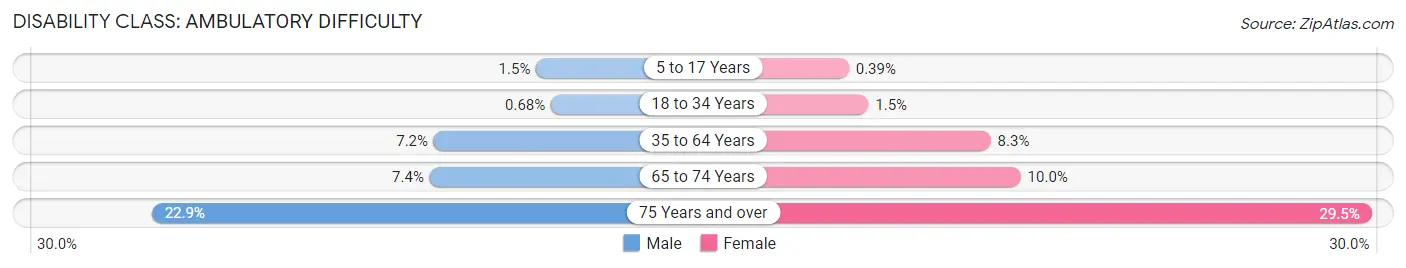
| Age Bracket | Male | Female |
| 5 to 17 Years | 63 (1.5%) | 15 (0.4%) |
| 18 to 34 Years | 41 (0.7%) | 82 (1.5%) |
| 35 to 64 Years | 866 (7.2%) | 999 (8.3%) |
| 65 to 74 Years | 318 (7.4%) | 427 (10.0%) |
| 75 Years and over | 528 (22.9%) | 854 (29.5%) |
Disability Class: Self-Care Difficulty
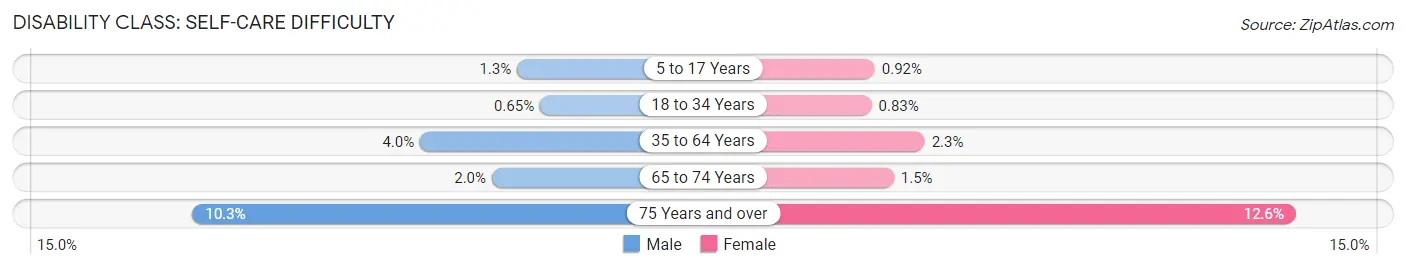
| Age Bracket | Male | Female |
| 5 to 17 Years | 54 (1.3%) | 36 (0.9%) |
| 18 to 34 Years | 39 (0.6%) | 46 (0.8%) |
| 35 to 64 Years | 479 (4.0%) | 279 (2.3%) |
| 65 to 74 Years | 85 (2.0%) | 62 (1.5%) |
| 75 Years and over | 238 (10.3%) | 366 (12.6%) |
Technology Access in Rutland County
Computing Device Access in Rutland County
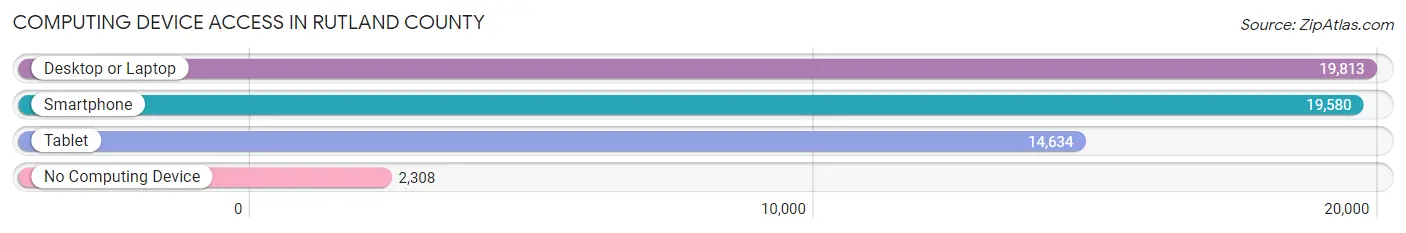
| Device Type | # Households | % Households |
| Desktop or Laptop | 19,813 | 78.2% |
| Smartphone | 19,580 | 77.3% |
| Tablet | 14,634 | 57.8% |
| No Computing Device | 2,308 | 9.1% |
| Total | 25,334 | 100.0% |
Internet Access in Rutland County
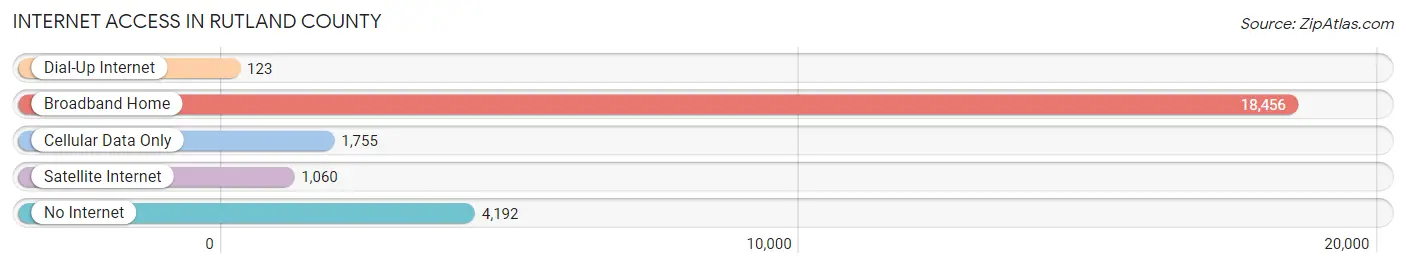
| Internet Type | # Households | % Households |
| Dial-Up Internet | 123 | 0.5% |
| Broadband Home | 18,456 | 72.9% |
| Cellular Data Only | 1,755 | 6.9% |
| Satellite Internet | 1,060 | 4.2% |
| No Internet | 4,192 | 16.6% |
| Total | 25,334 | 100.0% |
Rutland County Summary
Rutland County is located in the south-central region of Vermont, and is the second largest county in the state. It is bordered by Addison County to the north, Bennington County to the west, Windham County to the east, and Washington County to the south. The county seat is the city of Rutland, which is the third largest city in the state.
Geography
Rutland County is located in the Green Mountains region of Vermont, and is home to the highest peak in the state, Mount Mansfield. The county is mostly mountainous, with the Taconic Mountains to the west and the Green Mountains to the east. The county is drained by the Otter Creek, which flows through the city of Rutland. The county is also home to several lakes, including Lake Bomoseen, Lake St. Catherine, and Lake Hortonia.
Economy
Rutland County has a diverse economy, with a mix of manufacturing, agriculture, and tourism. The county is home to several large manufacturing companies, including OMYA, a global leader in calcium carbonate production, and General Electric, which produces aircraft engines and other industrial products. Agriculture is also an important part of the county’s economy, with dairy farming and apple orchards being the main crops. Tourism is also an important part of the economy, with the county being home to several ski resorts, including Killington and Pico Mountain.
Demographics
As of the 2010 census, Rutland County had a population of 61,642. The population is mostly white (94.3%), with small percentages of African American (1.3%), Asian (1.2%), and Native American (0.4%) populations. The median household income is $50,945, and the median age is 42.7.
History
Rutland County was established in 1781, and was named after the city of Rutland, which was named after the Earl of Rutland in England. The county was originally home to the Abenaki Native American tribe, and was later settled by European settlers in the late 1700s. The county was an important center of industry in the 19th century, with the construction of the Rutland and Burlington Railroad in 1849, and the opening of the OMYA plant in 1884. The county was also home to several Civil War battles, including the Battle of Hubbardton in 1777.
Rutland County has a long and rich history, and is an important part of the state of Vermont. The county is home to a diverse economy, with a mix of manufacturing, agriculture, and tourism. The county is also home to a diverse population, with a mix of white, African American, Asian, and Native American populations. Rutland County is an important part of the state of Vermont, and is an important part of the region’s history and culture.
Common Questions
What is the Total Population of Rutland County?
Total Population of Rutland County is 60,585.
What is the Total Male Population of Rutland County?
Total Male Population of Rutland County is 30,326.
What is the Total Female Population of Rutland County?
Total Female Population of Rutland County is 30,259.
What is the Ratio of Males per 100 Females in Rutland County?
There are 100.22 Males per 100 Females in Rutland County.
What is the Ratio of Females per 100 Males in Rutland County?
There are 99.78 Females per 100 Males in Rutland County.
What is the Median Population Age in Rutland County?
Median Population Age in Rutland County is 47.7 Years.
What is the Average Family Size in Rutland County
Average Family Size in Rutland County is 3.0 People.
What is the Average Household Size in Rutland County
Average Household Size in Rutland County is 2.3 People.
What is Per Capita Income in Rutland County?
Per Capita income in Rutland County is $36,845.
What is the Median Family Income in Rutland County?
Median Family Income in Rutland County is $85,545.
What is the Median Household income in Rutland County?
Median Household Income in Rutland County is $62,641.
What is Income or Wage Gap in Rutland County?
Income or Wage Gap in Rutland County is 18.3%.
Women in Rutland County earn 81.7 cents for every dollar earned by a man.
What is Family Income Deficit in Rutland County?
Family Income Deficit in Rutland County is $7,445.
Families that are below poverty line in Rutland County earn $7,445 less on average than the poverty threshold level.
What is Inequality or Gini Index in Rutland County?
Inequality or Gini Index in Rutland County is 0.46.
How Large is the Labor Force in Rutland County?
There are 30,550 People in the Labor Forcein in Rutland County.
What is the Percentage of People in the Labor Force in Rutland County?
59.5% of People are in the Labor Force in Rutland County.
What is the Unemployment Rate in Rutland County?
Unemployment Rate in Rutland County is 4.3%.