Orleans County, VT
Orleans County Overview
27,459
TOTAL POPULATION
13,899
MALE POPULATION
13,560
FEMALE POPULATION
102.50
MALES / 100 FEMALES
97.56
FEMALES / 100 MALES
45.6
MEDIAN AGE
2.9
AVG FAMILY SIZE
2.3
AVG HOUSEHOLD SIZE
$34,365
PER CAPITA INCOME
$79,806
AVG FAMILY INCOME
$63,981
AVG HOUSEHOLD INCOME
17.8%
WAGE / INCOME GAP [ % ]
82.2¢/ $1
WAGE / INCOME GAP [ $ ]
$8,947
FAMILY INCOME DEFICIT
0.42
INEQUALITY / GINI INDEX
14,228
LABOR FORCE [ PEOPLE ]
62.4%
PERCENT IN LABOR FORCE
6.1%
UNEMPLOYMENT RATE
Orleans County Area Codes
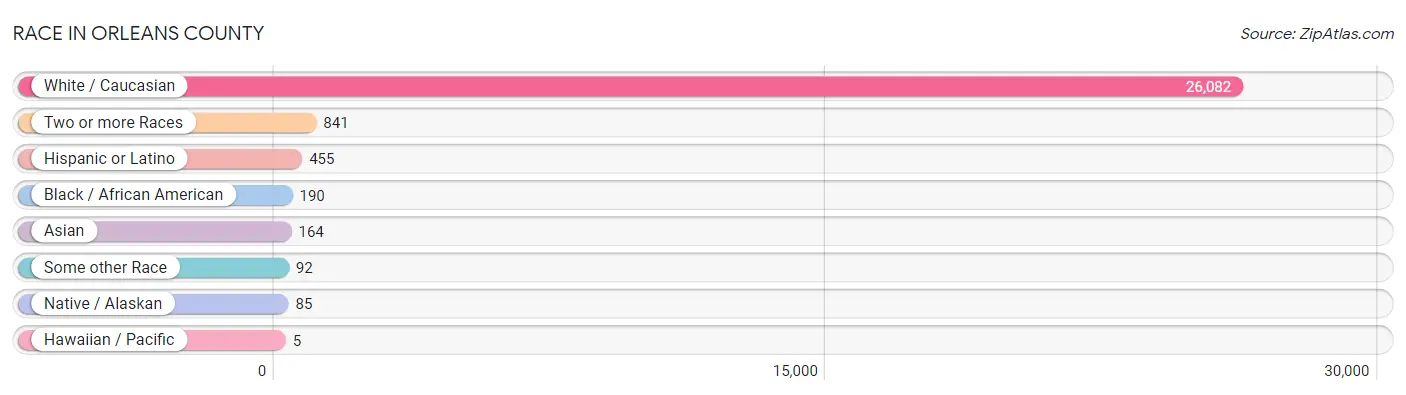
Race in Orleans County
The most populous races in Orleans County are White / Caucasian (26,082 | 95.0%), Two or more Races (841 | 3.1%), and Hispanic or Latino (455 | 1.7%).
| Race | # Population | % Population |
| Asian | 164 | 0.6% |
| Black / African American | 190 | 0.7% |
| Hawaiian / Pacific | 5 | 0.0% |
| Hispanic or Latino | 455 | 1.7% |
| Native / Alaskan | 85 | 0.3% |
| White / Caucasian | 26,082 | 95.0% |
| Two or more Races | 841 | 3.1% |
| Some other Race | 92 | 0.3% |
| Total | 27,459 | 100.0% |
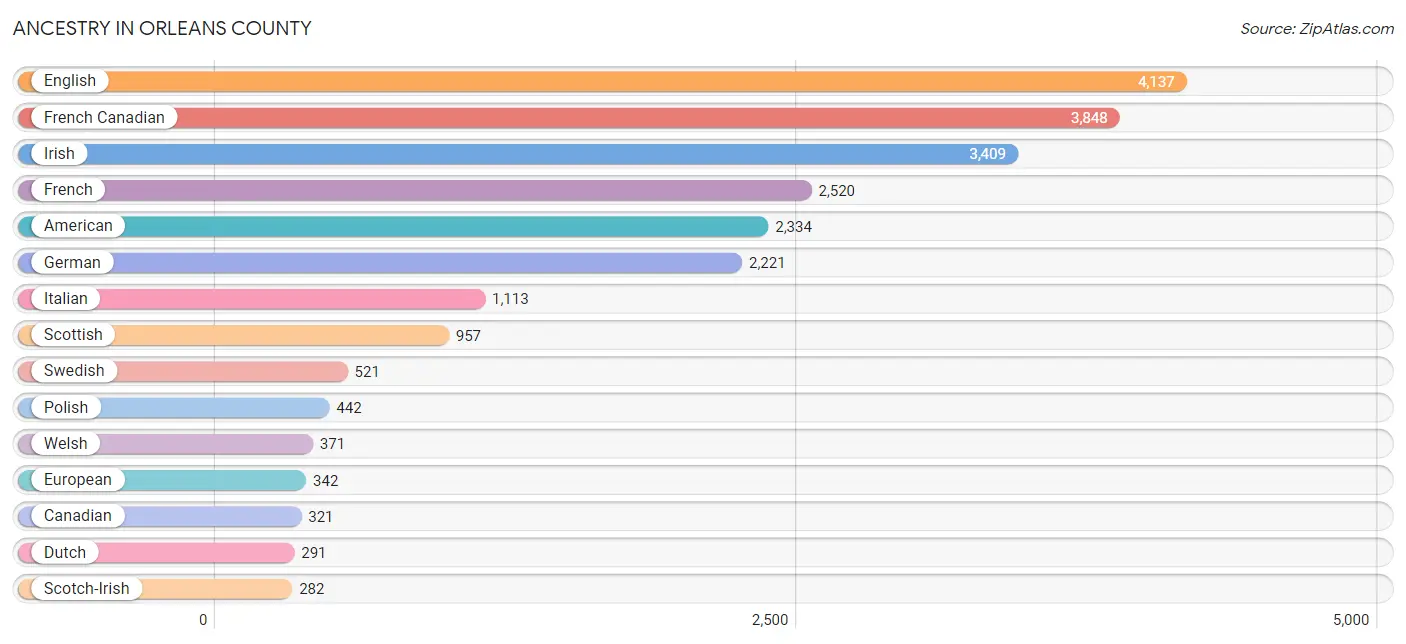
Ancestry in Orleans County
The most populous ancestries reported in Orleans County are English (4,137 | 15.1%), French Canadian (3,848 | 14.0%), Irish (3,409 | 12.4%), French (2,520 | 9.2%), and American (2,334 | 8.5%), together accounting for 59.2% of all Orleans County residents.
| Ancestry | # Population | % Population |
| African | 37 | 0.1% |
| Albanian | 2 | 0.0% |
| Alsatian | 13 | 0.1% |
| American | 2,334 | 8.5% |
| Arab | 6 | 0.0% |
| Argentinean | 18 | 0.1% |
| Armenian | 5 | 0.0% |
| Austrian | 21 | 0.1% |
| Belgian | 26 | 0.1% |
| Bhutanese | 11 | 0.0% |
| Blackfeet | 2 | 0.0% |
| Brazilian | 24 | 0.1% |
| British | 85 | 0.3% |
| Burmese | 74 | 0.3% |
| Canadian | 321 | 1.2% |
| Central American | 38 | 0.1% |
| Cherokee | 43 | 0.2% |
| Chickasaw | 31 | 0.1% |
| Chilean | 7 | 0.0% |
| Chippewa | 7 | 0.0% |
| Cuban | 25 | 0.1% |
| Czech | 53 | 0.2% |
| Danish | 43 | 0.2% |
| Dominican | 12 | 0.0% |
| Dutch | 291 | 1.1% |
| Eastern European | 26 | 0.1% |
| English | 4,137 | 15.1% |
| Estonian | 4 | 0.0% |
| European | 342 | 1.3% |
| Finnish | 44 | 0.2% |
| French | 2,520 | 9.2% |
| French American Indian | 12 | 0.0% |
| French Canadian | 3,848 | 14.0% |
| German | 2,221 | 8.1% |
| Greek | 49 | 0.2% |
| Guatemalan | 16 | 0.1% |
| Guyanese | 5 | 0.0% |
| Haitian | 48 | 0.2% |
| Honduran | 5 | 0.0% |
| Hungarian | 46 | 0.2% |
| Indian (Asian) | 22 | 0.1% |
| Iranian | 4 | 0.0% |
| Irish | 3,409 | 12.4% |
| Iroquois | 43 | 0.2% |
| Italian | 1,113 | 4.1% |
| Jamaican | 5 | 0.0% |
| Korean | 50 | 0.2% |
| Lebanese | 6 | 0.0% |
| Lithuanian | 73 | 0.3% |
| Luxembourger | 9 | 0.0% |
| Maltese | 2 | 0.0% |
| Mexican | 146 | 0.5% |
| Native Hawaiian | 5 | 0.0% |
| Nigerian | 34 | 0.1% |
| Northern European | 35 | 0.1% |
| Norwegian | 241 | 0.9% |
| Pakistani | 16 | 0.1% |
| Panamanian | 14 | 0.1% |
| Pennsylvania German | 17 | 0.1% |
| Peruvian | 40 | 0.2% |
| Pima | 1 | 0.0% |
| Polish | 442 | 1.6% |
| Portuguese | 108 | 0.4% |
| Puerto Rican | 110 | 0.4% |
| Romanian | 3 | 0.0% |
| Russian | 280 | 1.0% |
| Salvadoran | 3 | 0.0% |
| Scandinavian | 270 | 1.0% |
| Scotch-Irish | 282 | 1.0% |
| Scottish | 957 | 3.5% |
| Sioux | 2 | 0.0% |
| Slavic | 6 | 0.0% |
| Slovak | 4 | 0.0% |
| South American | 65 | 0.2% |
| South American Indian | 10 | 0.0% |
| Spaniard | 14 | 0.1% |
| Subsaharan African | 75 | 0.3% |
| Swedish | 521 | 1.9% |
| Swiss | 14 | 0.1% |
| Thai | 58 | 0.2% |
| Ukrainian | 70 | 0.3% |
| Welsh | 371 | 1.3% |
| West Indian | 17 | 0.1% | View All 83 Rows |
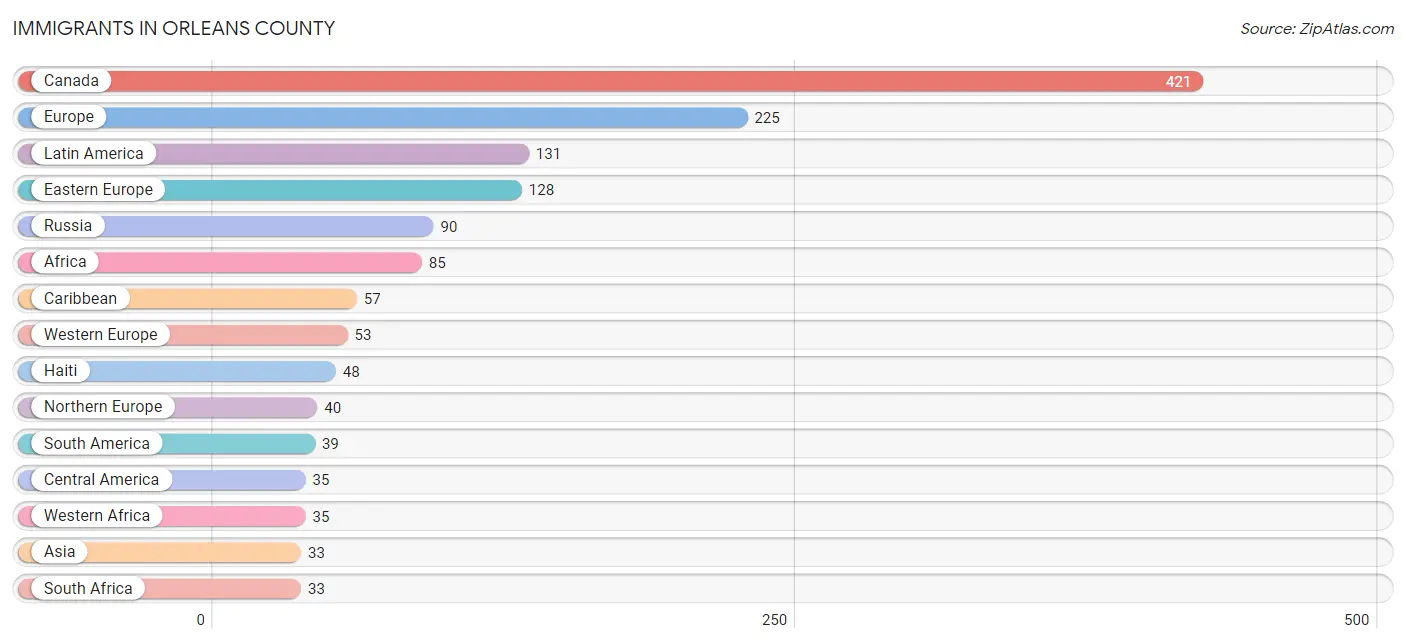
Immigrants in Orleans County
The most numerous immigrant groups reported in Orleans County came from Canada (421 | 1.5%), Europe (225 | 0.8%), Latin America (131 | 0.5%), Eastern Europe (128 | 0.5%), and Russia (90 | 0.3%), together accounting for 3.6% of all Orleans County residents.
| Immigration Origin | # Population | % Population |
| Africa | 85 | 0.3% |
| Argentina | 17 | 0.1% |
| Asia | 33 | 0.1% |
| Austria | 7 | 0.0% |
| Brazil | 7 | 0.0% |
| Canada | 421 | 1.5% |
| Caribbean | 57 | 0.2% |
| Central America | 35 | 0.1% |
| Chile | 15 | 0.1% |
| China | 2 | 0.0% |
| Congo | 9 | 0.0% |
| Cuba | 5 | 0.0% |
| Eastern Africa | 5 | 0.0% |
| Eastern Asia | 15 | 0.1% |
| Eastern Europe | 128 | 0.5% |
| Egypt | 3 | 0.0% |
| England | 10 | 0.0% |
| Europe | 225 | 0.8% |
| France | 20 | 0.1% |
| Germany | 25 | 0.1% |
| Guatemala | 16 | 0.1% |
| Haiti | 48 | 0.2% |
| Honduras | 5 | 0.0% |
| India | 1 | 0.0% |
| Ireland | 6 | 0.0% |
| Italy | 4 | 0.0% |
| Kazakhstan | 5 | 0.0% |
| Kenya | 1 | 0.0% |
| Korea | 13 | 0.1% |
| Latin America | 131 | 0.5% |
| Lithuania | 7 | 0.0% |
| Middle Africa | 9 | 0.0% |
| Netherlands | 1 | 0.0% |
| Nigeria | 29 | 0.1% |
| Northern Africa | 3 | 0.0% |
| Northern Europe | 40 | 0.2% |
| Panama | 14 | 0.1% |
| Philippines | 12 | 0.0% |
| Poland | 20 | 0.1% |
| Russia | 90 | 0.3% |
| Scotland | 5 | 0.0% |
| Sierra Leone | 6 | 0.0% |
| South Africa | 33 | 0.1% |
| South America | 39 | 0.1% |
| South Central Asia | 6 | 0.0% |
| South Eastern Asia | 12 | 0.0% |
| Southern Europe | 4 | 0.0% |
| Sweden | 5 | 0.0% |
| Trinidad and Tobago | 4 | 0.0% |
| Western Africa | 35 | 0.1% |
| Western Europe | 53 | 0.2% | View All 51 Rows |
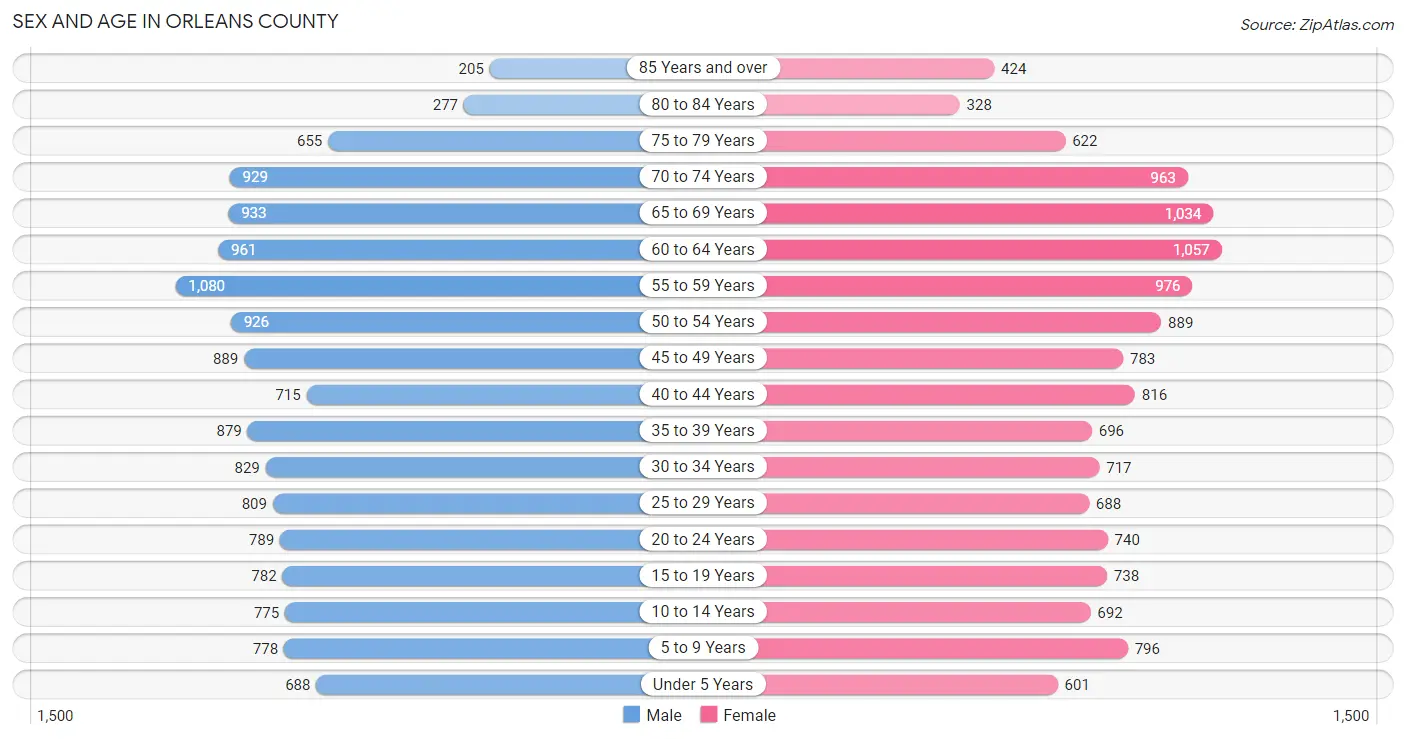
Sex and Age in Orleans County
Sex and Age in Orleans County
The most populous age groups in Orleans County are 55 to 59 Years (1,080 | 7.8%) for men and 60 to 64 Years (1,057 | 7.8%) for women.
| Age Bracket | Male | Female |
| Under 5 Years | 688 (5.0%) | 601 (4.4%) |
| 5 to 9 Years | 778 (5.6%) | 796 (5.9%) |
| 10 to 14 Years | 775 (5.6%) | 692 (5.1%) |
| 15 to 19 Years | 782 (5.6%) | 738 (5.4%) |
| 20 to 24 Years | 789 (5.7%) | 740 (5.5%) |
| 25 to 29 Years | 809 (5.8%) | 688 (5.1%) |
| 30 to 34 Years | 829 (6.0%) | 717 (5.3%) |
| 35 to 39 Years | 879 (6.3%) | 696 (5.1%) |
| 40 to 44 Years | 715 (5.1%) | 816 (6.0%) |
| 45 to 49 Years | 889 (6.4%) | 783 (5.8%) |
| 50 to 54 Years | 926 (6.7%) | 889 (6.6%) |
| 55 to 59 Years | 1,080 (7.8%) | 976 (7.2%) |
| 60 to 64 Years | 961 (6.9%) | 1,057 (7.8%) |
| 65 to 69 Years | 933 (6.7%) | 1,034 (7.6%) |
| 70 to 74 Years | 929 (6.7%) | 963 (7.1%) |
| 75 to 79 Years | 655 (4.7%) | 622 (4.6%) |
| 80 to 84 Years | 277 (2.0%) | 328 (2.4%) |
| 85 Years and over | 205 (1.5%) | 424 (3.1%) |
| Total | 13,899 (100.0%) | 13,560 (100.0%) |
Families and Households in Orleans County
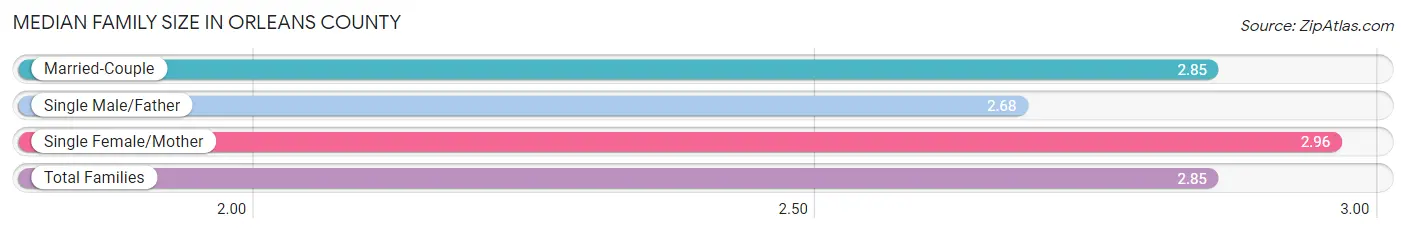
Median Family Size in Orleans County
The median family size in Orleans County is 2.85 persons per family, with single female/mother families (917 | 12.6%) accounting for the largest median family size of 2.96 persons per family. On the other hand, single male/father families (579 | 8.0%) represent the smallest median family size with 2.68 persons per family.
| Family Type | # Families | Family Size |
| Married-Couple | 5,760 (79.4%) | 2.85 |
| Single Male/Father | 579 (8.0%) | 2.68 |
| Single Female/Mother | 917 (12.6%) | 2.96 |
| Total Families | 7,256 (100.0%) | 2.85 |
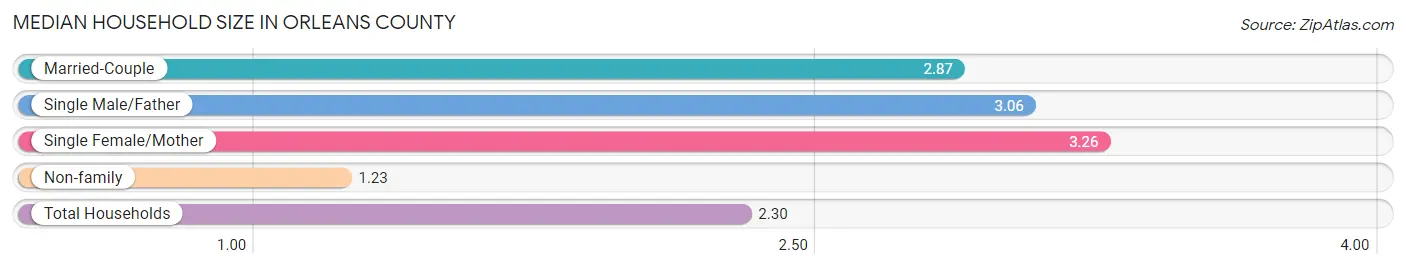
Median Household Size in Orleans County
The median household size in Orleans County is 2.30 persons per household, with single female/mother households (917 | 8.0%) accounting for the largest median household size of 3.26 persons per household. non-family households (4,272 | 37.1%) represent the smallest median household size with 1.23 persons per household.
| Household Type | # Households | Household Size |
| Married-Couple | 5,760 (50.0%) | 2.87 |
| Single Male/Father | 579 (5.0%) | 3.06 |
| Single Female/Mother | 917 (8.0%) | 3.26 |
| Non-family | 4,272 (37.1%) | 1.23 |
| Total Households | 11,528 (100.0%) | 2.30 |
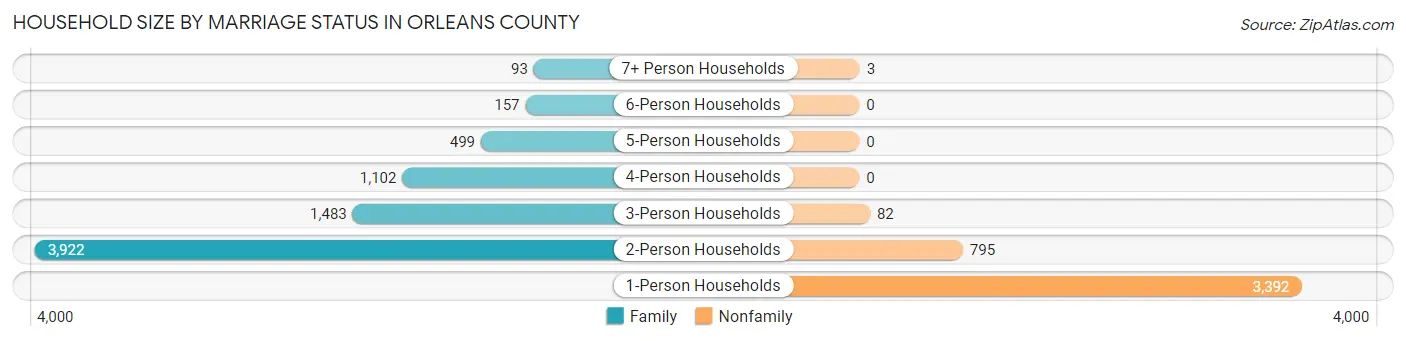
Household Size by Marriage Status in Orleans County
Out of a total of 11,528 households in Orleans County, 7,256 (62.9%) are family households, while 4,272 (37.1%) are nonfamily households. The most numerous type of family households are 2-person households, comprising 3,922, and the most common type of nonfamily households are 1-person households, comprising 3,392.
| Household Size | Family Households | Nonfamily Households |
| 1-Person Households | - | 3,392 (29.4%) |
| 2-Person Households | 3,922 (34.0%) | 795 (6.9%) |
| 3-Person Households | 1,483 (12.9%) | 82 (0.7%) |
| 4-Person Households | 1,102 (9.6%) | 0 (0.0%) |
| 5-Person Households | 499 (4.3%) | 0 (0.0%) |
| 6-Person Households | 157 (1.4%) | 0 (0.0%) |
| 7+ Person Households | 93 (0.8%) | 3 (0.0%) |
| Total | 7,256 (62.9%) | 4,272 (37.1%) |
Female Fertility in Orleans County
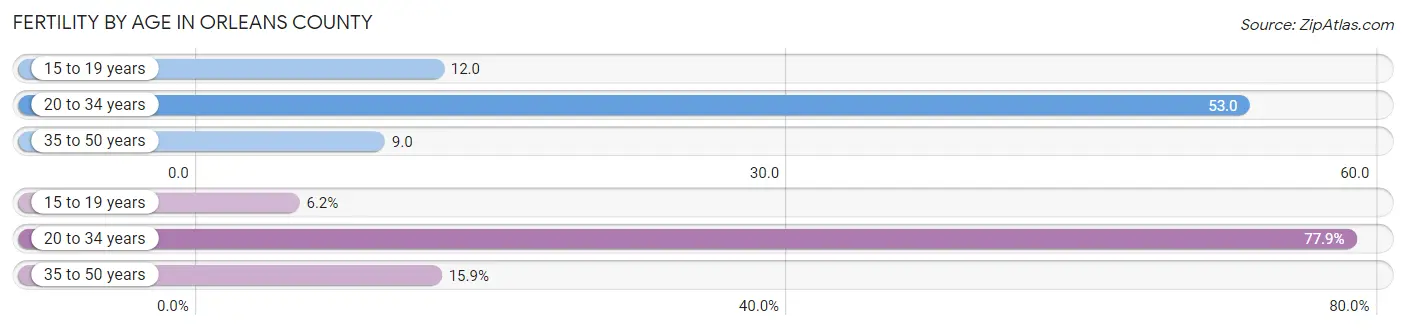
Fertility by Age in Orleans County
Average fertility rate in Orleans County is 27.0 births per 1,000 women. Women in the age bracket of 20 to 34 years have the highest fertility rate with 53.0 births per 1,000 women. Women in the age bracket of 20 to 34 years acount for 77.9% of all women with births.
| Age Bracket | Women with Births | Births / 1,000 Women |
| 15 to 19 years | 9 (6.2%) | 12.0 |
| 20 to 34 years | 113 (77.9%) | 53.0 |
| 35 to 50 years | 23 (15.9%) | 9.0 |
| Total | 145 (100.0%) | 27.0 |
Fertility by Age by Marriage Status in Orleans County
53.8% of women with births (145) in Orleans County are married. The highest percentage of unmarried women with births falls into 15 to 19 years age bracket with 100.0% of them unmarried at the time of birth, while the lowest percentage of unmarried women with births belong to 35 to 50 years age bracket with 34.8% of them unmarried.
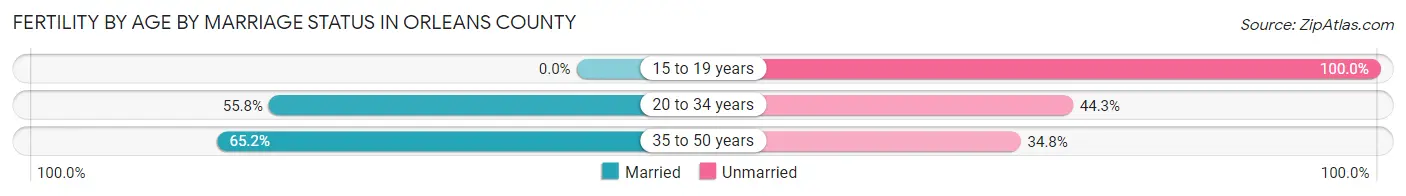
| Age Bracket | Married | Unmarried |
| 15 to 19 years | 0 (0.0%) | 9 (100.0%) |
| 20 to 34 years | 63 (55.7%) | 50 (44.3%) |
| 35 to 50 years | 15 (65.2%) | 8 (34.8%) |
| Total | 78 (53.8%) | 67 (46.2%) |
Fertility by Education in Orleans County
Average fertility rate in Orleans County is 27.0 births per 1,000 women. Women with the education attainment of graduate degree have the highest fertility rate of 57.0 births per 1,000 women, while women with the education attainment of bachelor's degree have the lowest fertility at 2.0 births per 1,000 women. Women with the education attainment of college or associate's degree represent 35.9% of all women with births.
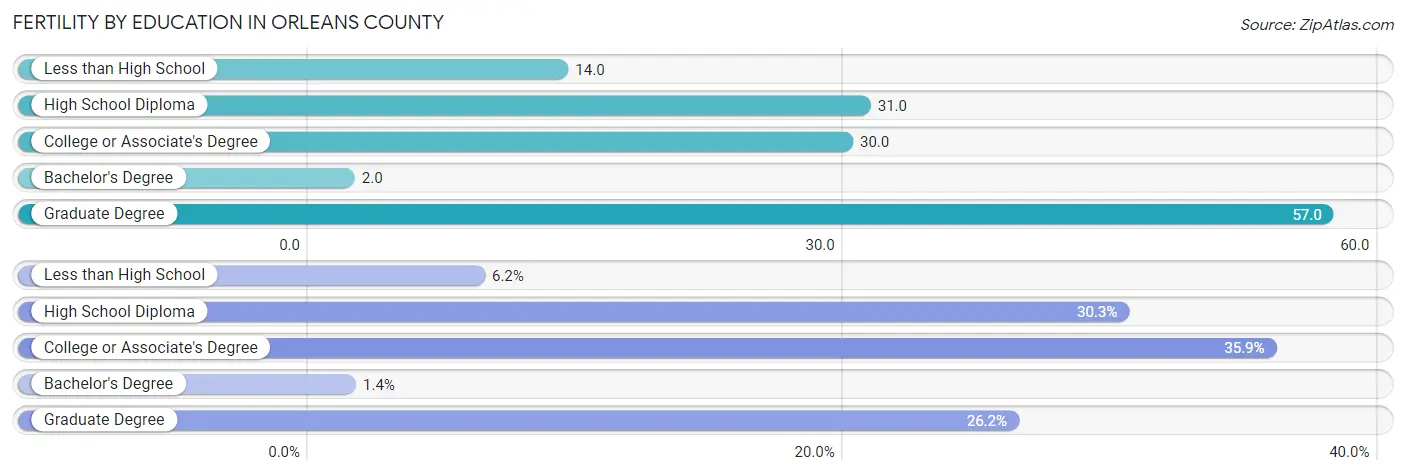
| Educational Attainment | Women with Births | Births / 1,000 Women |
| Less than High School | 9 (6.2%) | 14.0 |
| High School Diploma | 44 (30.3%) | 31.0 |
| College or Associate's Degree | 52 (35.9%) | 30.0 |
| Bachelor's Degree | 2 (1.4%) | 2.0 |
| Graduate Degree | 38 (26.2%) | 57.0 |
| Total | 145 (100.0%) | 27.0 |
Fertility by Education by Marriage Status in Orleans County
46.2% of women with births in Orleans County are unmarried. Women with the educational attainment of bachelor's degree are most likely to be married with 100.0% of them married at childbirth, while women with the educational attainment of less than high school are least likely to be married with 100.0% of them unmarried at childbirth.
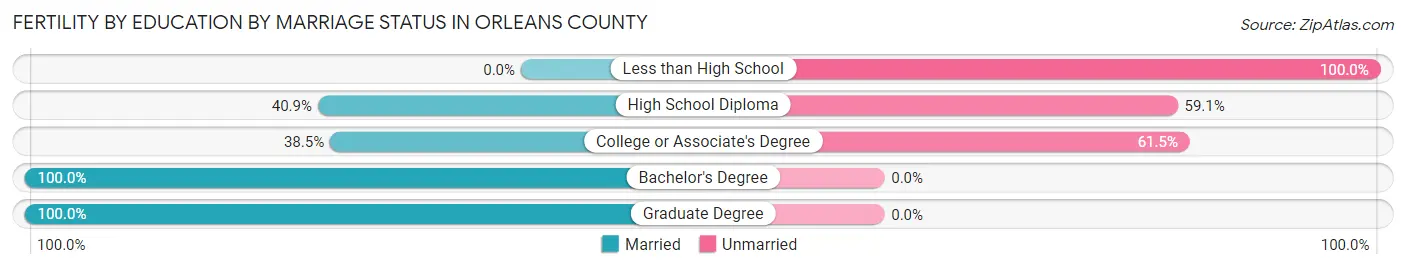
| Educational Attainment | Married | Unmarried |
| Less than High School | 0 (0.0%) | 9 (100.0%) |
| High School Diploma | 18 (40.9%) | 26 (59.1%) |
| College or Associate's Degree | 20 (38.5%) | 32 (61.5%) |
| Bachelor's Degree | 2 (100.0%) | 0 (0.0%) |
| Graduate Degree | 38 (100.0%) | 0 (0.0%) |
| Total | 78 (53.8%) | 67 (46.2%) |
Income in Orleans County
Income Overview in Orleans County
Per Capita Income in Orleans County is $34,365, while median incomes of families and households are $79,806 and $63,981 respectively.
| Characteristic | Number | Measure |
| Per Capita Income | 27,459 | $34,365 |
| Median Family Income | 7,256 | $79,806 |
| Mean Family Income | 7,256 | $91,895 |
| Median Household Income | 11,528 | $63,981 |
| Mean Household Income | 11,528 | $79,444 |
| Income Deficit | 7,256 | $8,947 |
| Wage / Income Gap (%) | 27,459 | 17.78% |
| Wage / Income Gap ($) | 27,459 | 82.22¢ per $1 |
| Gini / Inequality Index | 27,459 | 0.42 |
Earnings by Sex in Orleans County
Average Earnings in Orleans County are $36,071, $39,737 for men and $32,670 for women, a difference of 17.8%.
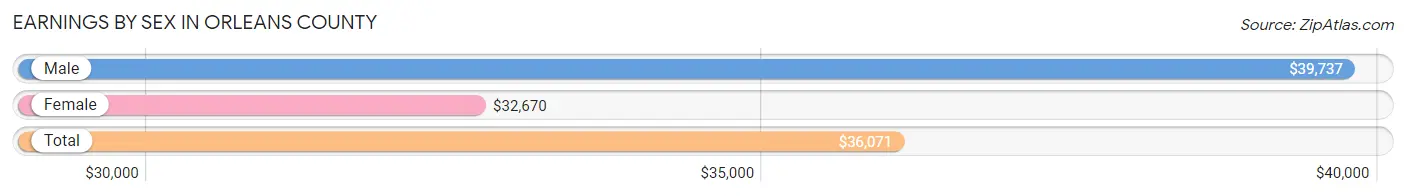
| Sex | Number | Average Earnings |
| Male | 7,844 (52.0%) | $39,737 |
| Female | 7,245 (48.0%) | $32,670 |
| Total | 15,089 (100.0%) | $36,071 |
Earnings by Sex by Income Bracket in Orleans County
The most common earnings brackets in Orleans County are $55,000 to $64,999 for men (767 | 9.8%) and $30,000 to $34,999 for women (685 | 9.5%).
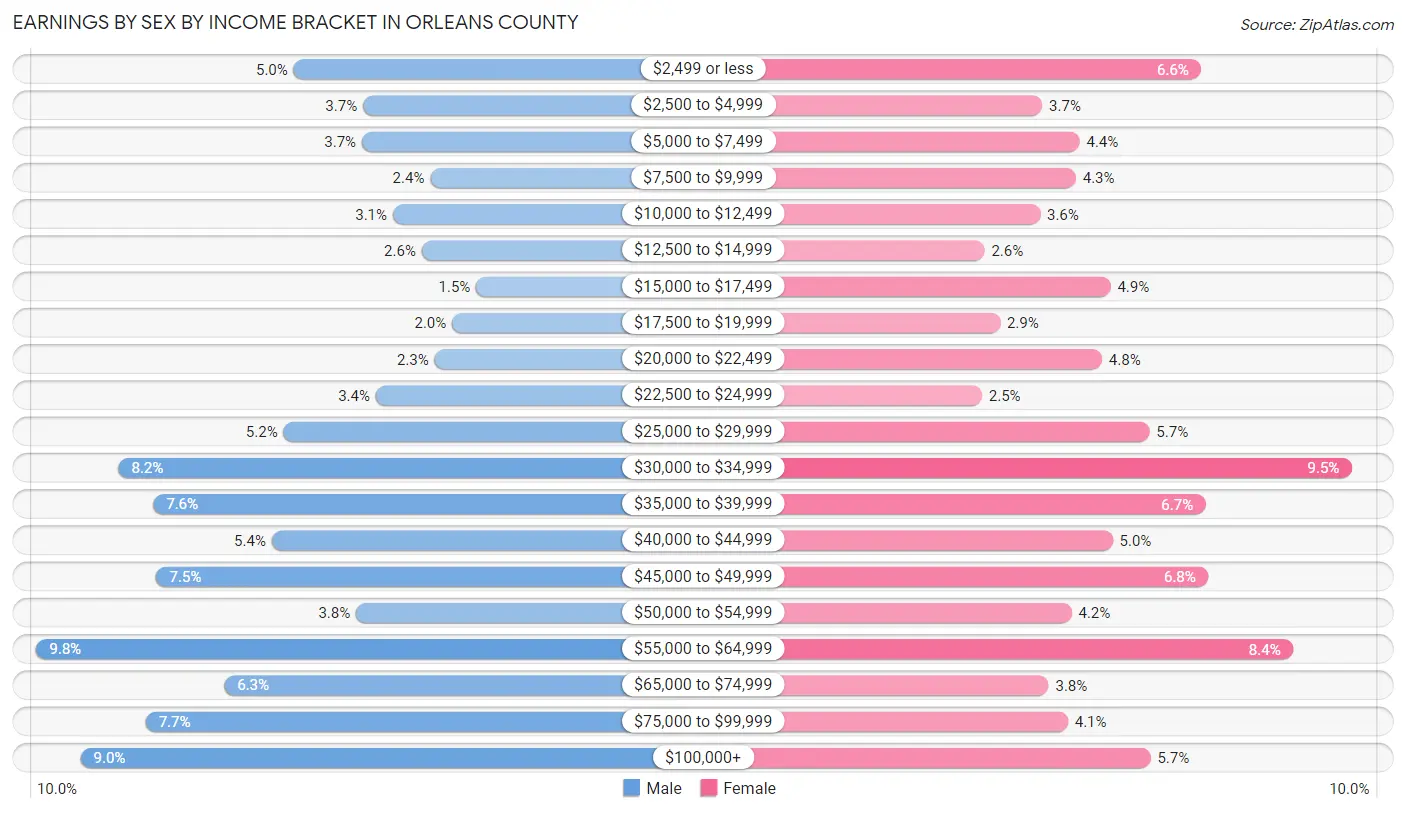
| Income | Male | Female |
| $2,499 or less | 389 (5.0%) | 480 (6.6%) |
| $2,500 to $4,999 | 287 (3.7%) | 265 (3.7%) |
| $5,000 to $7,499 | 289 (3.7%) | 316 (4.4%) |
| $7,500 to $9,999 | 188 (2.4%) | 311 (4.3%) |
| $10,000 to $12,499 | 243 (3.1%) | 262 (3.6%) |
| $12,500 to $14,999 | 201 (2.6%) | 187 (2.6%) |
| $15,000 to $17,499 | 121 (1.5%) | 358 (4.9%) |
| $17,500 to $19,999 | 156 (2.0%) | 208 (2.9%) |
| $20,000 to $22,499 | 182 (2.3%) | 346 (4.8%) |
| $22,500 to $24,999 | 268 (3.4%) | 183 (2.5%) |
| $25,000 to $29,999 | 404 (5.1%) | 411 (5.7%) |
| $30,000 to $34,999 | 646 (8.2%) | 685 (9.5%) |
| $35,000 to $39,999 | 595 (7.6%) | 486 (6.7%) |
| $40,000 to $44,999 | 421 (5.4%) | 361 (5.0%) |
| $45,000 to $49,999 | 591 (7.5%) | 490 (6.8%) |
| $50,000 to $54,999 | 297 (3.8%) | 305 (4.2%) |
| $55,000 to $64,999 | 767 (9.8%) | 605 (8.4%) |
| $65,000 to $74,999 | 491 (6.3%) | 274 (3.8%) |
| $75,000 to $99,999 | 606 (7.7%) | 300 (4.1%) |
| $100,000+ | 702 (8.9%) | 412 (5.7%) |
| Total | 7,844 (100.0%) | 7,245 (100.0%) |
Earnings by Sex by Educational Attainment in Orleans County
Average earnings in Orleans County are $44,867 for men and $35,159 for women, a difference of 21.6%. Men with an educational attainment of bachelor's degree enjoy the highest average annual earnings of $51,542, while those with less than high school education earn the least with $32,321. Women with an educational attainment of graduate degree earn the most with the average annual earnings of $62,676, while those with less than high school education have the smallest earnings of $20,243.
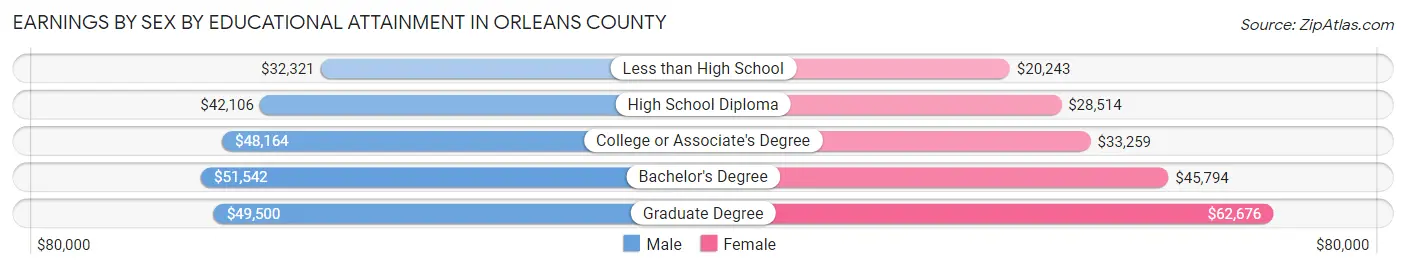
| Educational Attainment | Male Income | Female Income |
| Less than High School | $32,321 | $20,243 |
| High School Diploma | $42,106 | $28,514 |
| College or Associate's Degree | $48,164 | $33,259 |
| Bachelor's Degree | $51,542 | $45,794 |
| Graduate Degree | $49,500 | $62,676 |
| Total | $44,867 | $35,159 |
Family Income in Orleans County
Family Income Brackets in Orleans County
According to the Orleans County family income data, there are 1,596 families falling into the $100,000 to $149,999 income range, which is the most common income bracket and makes up 22.0% of all families. Conversely, the $10,000 to $14,999 income bracket is the least frequent group with only 87 families (1.2%) belonging to this category.
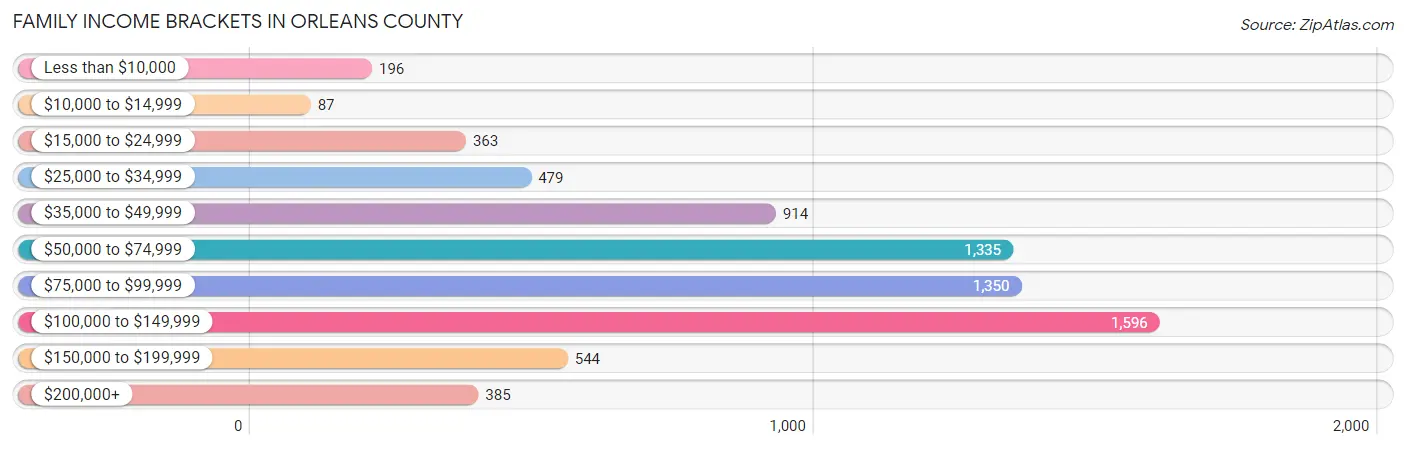
| Income Bracket | # Families | % Families |
| Less than $10,000 | 196 | 2.7% |
| $10,000 to $14,999 | 87 | 1.2% |
| $15,000 to $24,999 | 363 | 5.0% |
| $25,000 to $34,999 | 479 | 6.6% |
| $35,000 to $49,999 | 914 | 12.6% |
| $50,000 to $74,999 | 1,335 | 18.4% |
| $75,000 to $99,999 | 1,350 | 18.6% |
| $100,000 to $149,999 | 1,596 | 22.0% |
| $150,000 to $199,999 | 544 | 7.5% |
| $200,000+ | 385 | 5.3% |
Family Income by Famaliy Size in Orleans County
7+ person families (93 | 1.3%) account for the highest median family income in Orleans County with $133,466 per family, while 2-person families (4,128 | 56.9%) have the highest median income of $36,186 per family member.
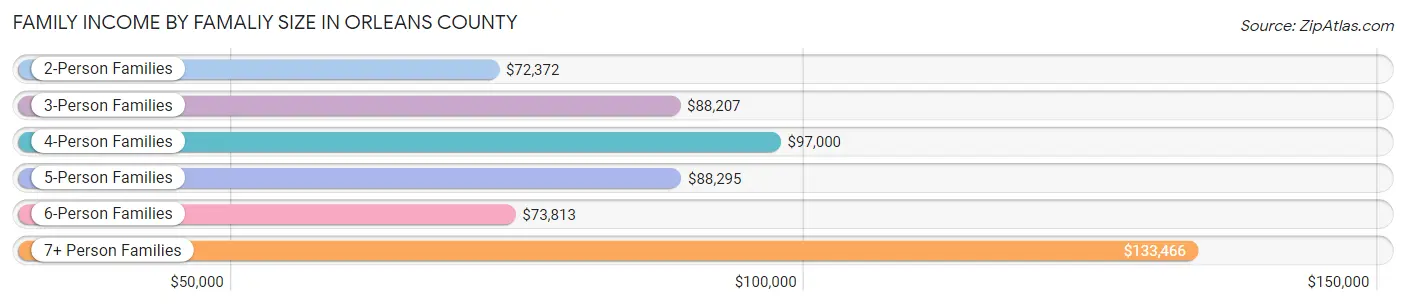
| Income Bracket | # Families | Median Income |
| 2-Person Families | 4,128 (56.9%) | $72,372 |
| 3-Person Families | 1,469 (20.3%) | $88,207 |
| 4-Person Families | 1,034 (14.2%) | $97,000 |
| 5-Person Families | 425 (5.9%) | $88,295 |
| 6-Person Families | 107 (1.5%) | $73,813 |
| 7+ Person Families | 93 (1.3%) | $133,466 |
| Total | 7,256 (100.0%) | $79,806 |
Family Income by Number of Earners in Orleans County
The median family income in Orleans County is $79,806, with families comprising 3+ earners (901) having the highest median family income of $122,917, while families with no earners (1,339) have the lowest median family income of $47,981, accounting for 12.4% and 18.4% of families, respectively.
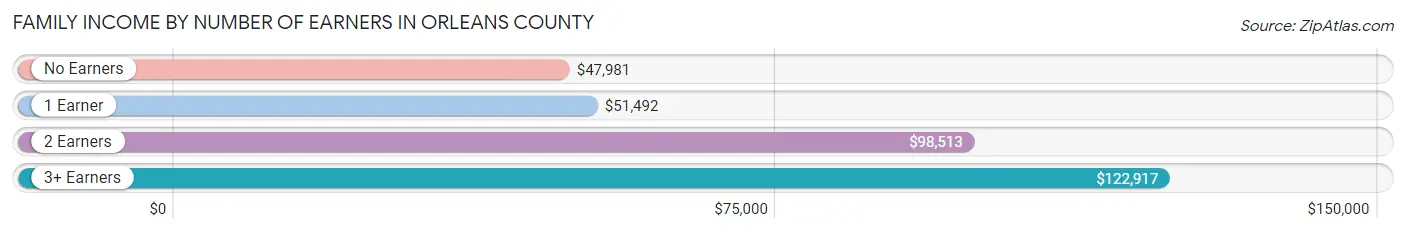
| Number of Earners | # Families | Median Income |
| No Earners | 1,339 (18.4%) | $47,981 |
| 1 Earner | 1,954 (26.9%) | $51,492 |
| 2 Earners | 3,062 (42.2%) | $98,513 |
| 3+ Earners | 901 (12.4%) | $122,917 |
| Total | 7,256 (100.0%) | $79,806 |
Household Income in Orleans County
Household Income Brackets in Orleans County
With 1,994 households falling in the category, the $50,000 to $74,999 income range is the most frequent in Orleans County, accounting for 17.3% of all households. In contrast, only 427 households (3.7%) fall into the less than $10,000 income bracket, making it the least populous group.
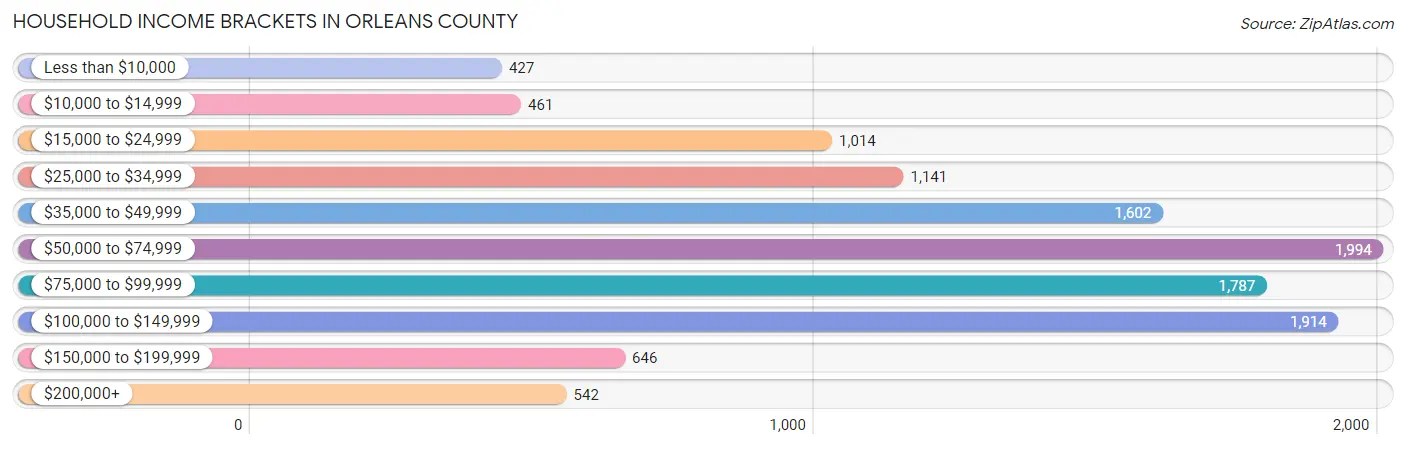
| Income Bracket | # Households | % Households |
| Less than $10,000 | 427 | 3.7% |
| $10,000 to $14,999 | 461 | 4.0% |
| $15,000 to $24,999 | 1,014 | 8.8% |
| $25,000 to $34,999 | 1,141 | 9.9% |
| $35,000 to $49,999 | 1,602 | 13.9% |
| $50,000 to $74,999 | 1,994 | 17.3% |
| $75,000 to $99,999 | 1,787 | 15.5% |
| $100,000 to $149,999 | 1,914 | 16.6% |
| $150,000 to $199,999 | 646 | 5.6% |
| $200,000+ | 542 | 4.7% |
Household Income by Householder Age in Orleans County
The median household income in Orleans County is $63,981, with the highest median household income of $77,168 found in the 45 to 64 years age bracket for the primary householder. A total of 4,273 households (37.1%) fall into this category. Meanwhile, the 15 to 24 years age bracket for the primary householder has the lowest median household income of $40,288, with 404 households (3.5%) in this group.
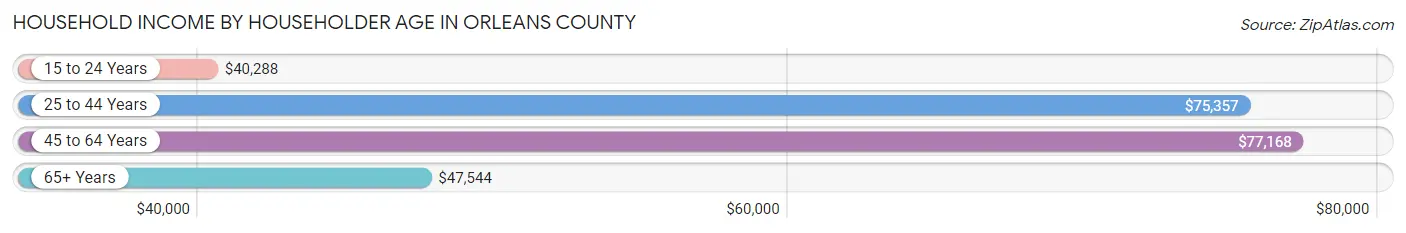
| Income Bracket | # Households | Median Income |
| 15 to 24 Years | 404 (3.5%) | $40,288 |
| 25 to 44 Years | 2,870 (24.9%) | $75,357 |
| 45 to 64 Years | 4,273 (37.1%) | $77,168 |
| 65+ Years | 3,981 (34.5%) | $47,544 |
| Total | 11,528 (100.0%) | $63,981 |
Poverty in Orleans County
Income Below Poverty by Sex and Age in Orleans County
With 7.7% poverty level for males and 12.0% for females among the residents of Orleans County, 16 and 17 year old males and 75 year old and over females are the most vulnerable to poverty, with 42 males (13.6%) and 224 females (19.1%) in their respective age groups living below the poverty level.
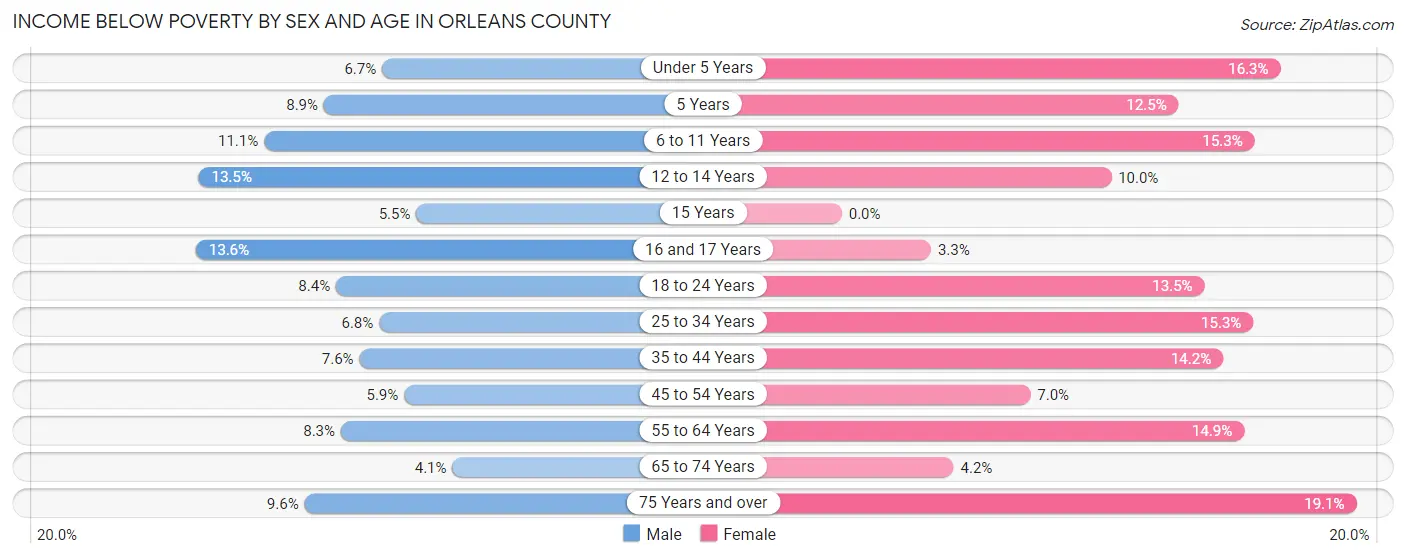
| Age Bracket | Male | Female |
| Under 5 Years | 45 (6.7%) | 97 (16.3%) |
| 5 Years | 8 (8.9%) | 24 (12.5%) |
| 6 to 11 Years | 110 (11.1%) | 135 (15.3%) |
| 12 to 14 Years | 60 (13.5%) | 39 (10.0%) |
| 15 Years | 10 (5.5%) | 0 (0.0%) |
| 16 and 17 Years | 42 (13.6%) | 11 (3.3%) |
| 18 to 24 Years | 82 (8.4%) | 128 (13.5%) |
| 25 to 34 Years | 104 (6.8%) | 214 (15.3%) |
| 35 to 44 Years | 114 (7.6%) | 214 (14.1%) |
| 45 to 54 Years | 104 (5.9%) | 117 (7.0%) |
| 55 to 64 Years | 163 (8.3%) | 301 (14.9%) |
| 65 to 74 Years | 76 (4.1%) | 81 (4.2%) |
| 75 Years and over | 107 (9.6%) | 224 (19.1%) |
| Total | 1,025 (7.7%) | 1,585 (12.0%) |
Income Above Poverty by Sex and Age in Orleans County
According to the poverty statistics in Orleans County, males aged 65 to 74 years and females aged 15 years are the age groups that are most secure financially, with 95.9% of males and 100.0% of females in these age groups living above the poverty line.
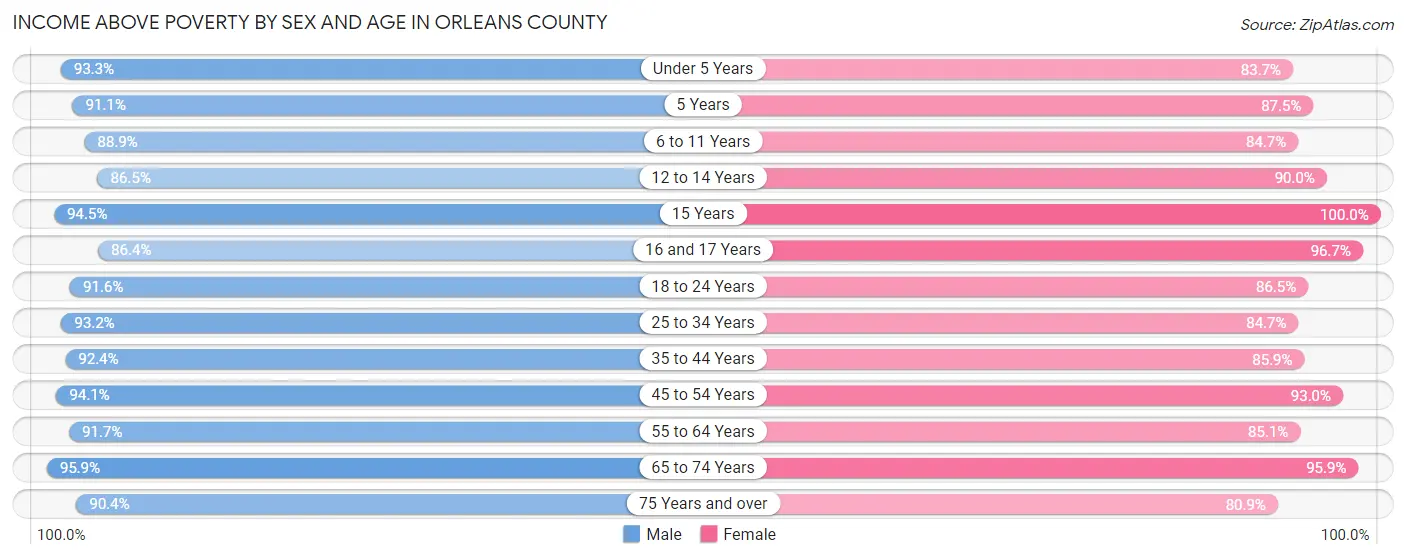
| Age Bracket | Male | Female |
| Under 5 Years | 624 (93.3%) | 499 (83.7%) |
| 5 Years | 82 (91.1%) | 168 (87.5%) |
| 6 to 11 Years | 880 (88.9%) | 746 (84.7%) |
| 12 to 14 Years | 383 (86.5%) | 351 (90.0%) |
| 15 Years | 173 (94.5%) | 145 (100.0%) |
| 16 and 17 Years | 266 (86.4%) | 321 (96.7%) |
| 18 to 24 Years | 889 (91.6%) | 823 (86.5%) |
| 25 to 34 Years | 1,416 (93.2%) | 1,187 (84.7%) |
| 35 to 44 Years | 1,392 (92.4%) | 1,298 (85.9%) |
| 45 to 54 Years | 1,657 (94.1%) | 1,555 (93.0%) |
| 55 to 64 Years | 1,810 (91.7%) | 1,715 (85.1%) |
| 65 to 74 Years | 1,767 (95.9%) | 1,872 (95.9%) |
| 75 Years and over | 1,007 (90.4%) | 949 (80.9%) |
| Total | 12,346 (92.3%) | 11,629 (88.0%) |
Income Below Poverty Among Married-Couple Families in Orleans County
The poverty statistics for married-couple families in Orleans County show that 3.1% or 176 of the total 5,760 families live below the poverty line. Families with 3 or 4 children have the highest poverty rate of 9.3%, comprising of 30 families. On the other hand, families with 5 or more children have the lowest poverty rate of 0.0%, which includes 0 families.
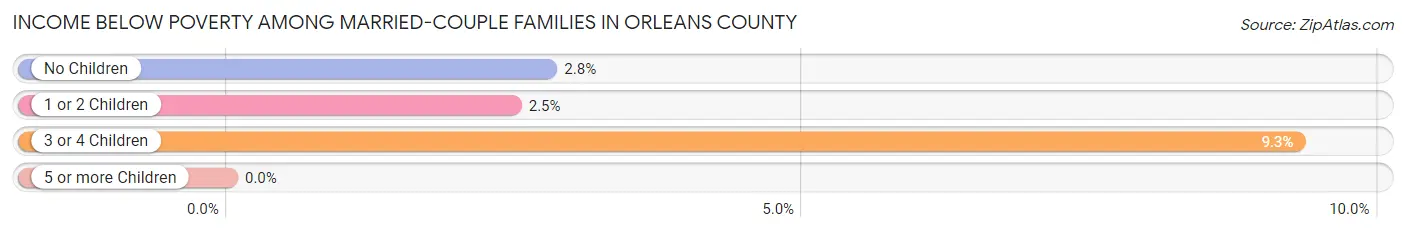
| Children | Above Poverty | Below Poverty |
| No Children | 3,817 (97.2%) | 109 (2.8%) |
| 1 or 2 Children | 1,458 (97.5%) | 37 (2.5%) |
| 3 or 4 Children | 293 (90.7%) | 30 (9.3%) |
| 5 or more Children | 16 (100.0%) | 0 (0.0%) |
| Total | 5,584 (96.9%) | 176 (3.1%) |
Income Below Poverty Among Single-Parent Households in Orleans County
According to the poverty data in Orleans County, 10.5% or 61 single-father households and 28.1% or 258 single-mother households are living below the poverty line. Among single-father households, those with 1 or 2 children have the highest poverty rate, with 56 households (15.3%) experiencing poverty. Likewise, among single-mother households, those with 1 or 2 children have the highest poverty rate, with 154 households (34.5%) falling below the poverty line.
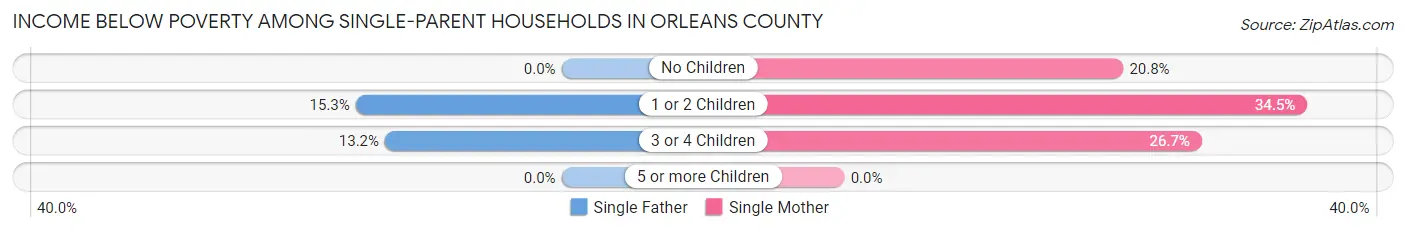
| Children | Single Father | Single Mother |
| No Children | 0 (0.0%) | 76 (20.8%) |
| 1 or 2 Children | 56 (15.3%) | 154 (34.5%) |
| 3 or 4 Children | 5 (13.2%) | 28 (26.7%) |
| 5 or more Children | 0 (0.0%) | 0 (0.0%) |
| Total | 61 (10.5%) | 258 (28.1%) |
Income Below Poverty Among Married-Couple vs Single-Parent Households in Orleans County
The poverty data for Orleans County shows that 176 of the married-couple family households (3.1%) and 319 of the single-parent households (21.3%) are living below the poverty level. Within the married-couple family households, those with 3 or 4 children have the highest poverty rate, with 30 households (9.3%) falling below the poverty line. Among the single-parent households, those with 1 or 2 children have the highest poverty rate, with 210 household (25.9%) living below poverty.
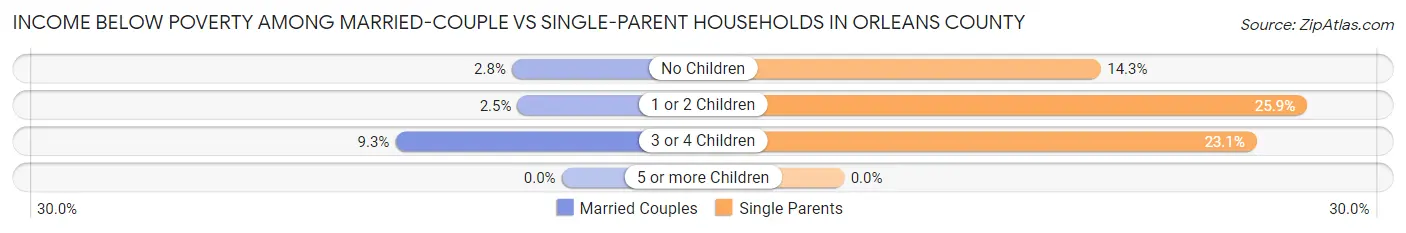
| Children | Married-Couple Families | Single-Parent Households |
| No Children | 109 (2.8%) | 76 (14.3%) |
| 1 or 2 Children | 37 (2.5%) | 210 (25.9%) |
| 3 or 4 Children | 30 (9.3%) | 33 (23.1%) |
| 5 or more Children | 0 (0.0%) | 0 (0.0%) |
| Total | 176 (3.1%) | 319 (21.3%) |
Employment Characteristics in Orleans County
Employment by Class of Employer in Orleans County
Among the 13,184 employed individuals in Orleans County, private company employees (7,021 | 53.2%), not-for-profit organizations (1,746 | 13.2%), and self-employed (not incorporated) (1,413 | 10.7%) make up the most common classes of employment.
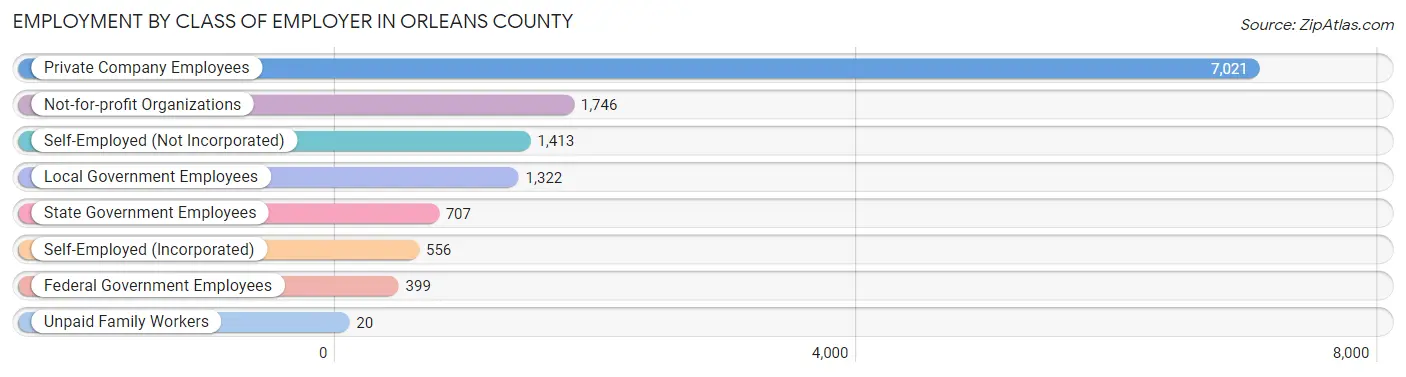
| Employer Class | # Employees | % Employees |
| Private Company Employees | 7,021 | 53.2% |
| Self-Employed (Incorporated) | 556 | 4.2% |
| Self-Employed (Not Incorporated) | 1,413 | 10.7% |
| Not-for-profit Organizations | 1,746 | 13.2% |
| Local Government Employees | 1,322 | 10.0% |
| State Government Employees | 707 | 5.4% |
| Federal Government Employees | 399 | 3.0% |
| Unpaid Family Workers | 20 | 0.2% |
| Total | 13,184 | 100.0% |
Employment Status by Age in Orleans County
According to the labor force statistics for Orleans County, out of the total population over 16 years of age (22,801), 62.4% or 14,228 individuals are in the labor force, with 6.1% or 868 of them unemployed. The age group with the highest labor force participation rate is 25 to 29 years, with 87.6% or 1,311 individuals in the labor force. Within the labor force, the 16 to 19 years age range has the highest percentage of unemployed individuals, with 12.7% or 89 of them being unemployed.
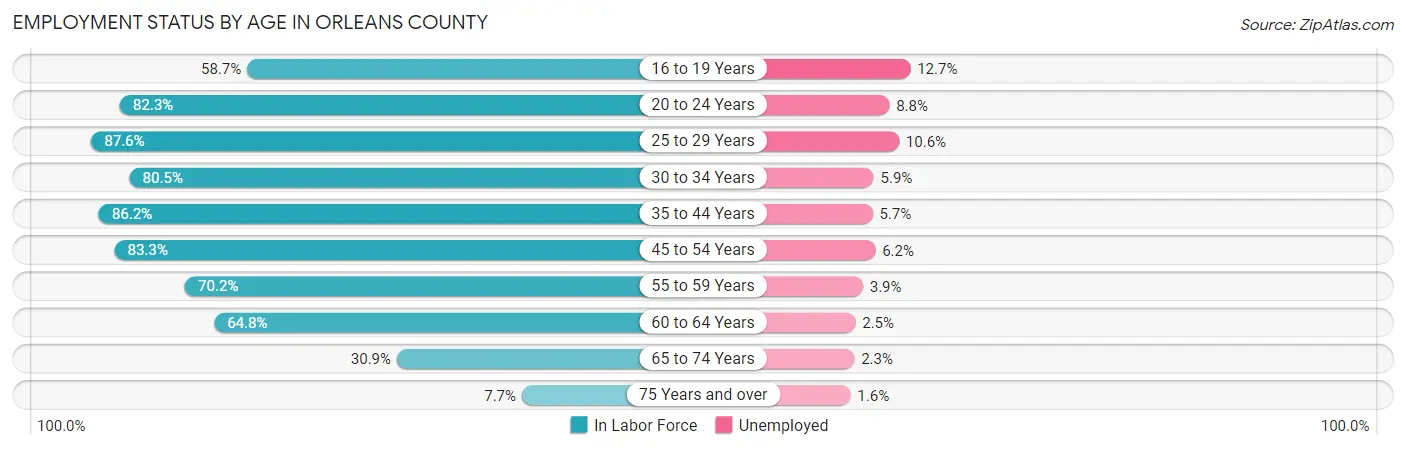
| Age Bracket | In Labor Force | Unemployed |
| 16 to 19 Years | 700 (58.7%) | 89 (12.7%) |
| 20 to 24 Years | 1,258 (82.3%) | 111 (8.8%) |
| 25 to 29 Years | 1,311 (87.6%) | 139 (10.6%) |
| 30 to 34 Years | 1,245 (80.5%) | 73 (5.9%) |
| 35 to 44 Years | 2,677 (86.2%) | 153 (5.7%) |
| 45 to 54 Years | 2,905 (83.3%) | 180 (6.2%) |
| 55 to 59 Years | 1,443 (70.2%) | 56 (3.9%) |
| 60 to 64 Years | 1,308 (64.8%) | 33 (2.5%) |
| 65 to 74 Years | 1,192 (30.9%) | 27 (2.3%) |
| 75 Years and over | 193 (7.7%) | 3 (1.6%) |
| Total | 14,228 (62.4%) | 868 (6.1%) |
Employment Status by Educational Attainment in Orleans County
According to labor force statistics for Orleans County, 79.4% of individuals (10,886) out of the total population between 25 and 64 years of age (13,710) are in the labor force, with 5.8% or 631 of them being unemployed. The group with the highest labor force participation rate are those with the educational attainment of bachelor's degree or higher, with 88.3% or 3,377 individuals in the labor force. Within the labor force, individuals with less than high school education have the highest percentage of unemployment, with 21.9% or 92 of them being unemployed.
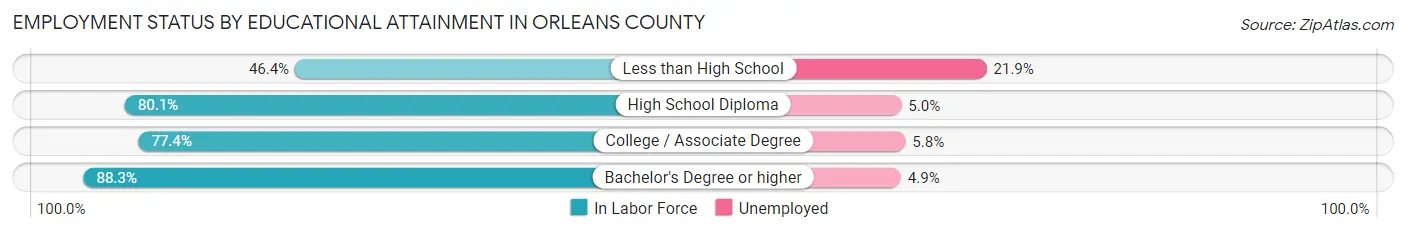
| Educational Attainment | In Labor Force | Unemployed |
| Less than High School | 420 (46.4%) | 198 (21.9%) |
| High School Diploma | 4,176 (80.1%) | 261 (5.0%) |
| College / Associate Degree | 2,916 (77.4%) | 219 (5.8%) |
| Bachelor's Degree or higher | 3,377 (88.3%) | 187 (4.9%) |
| Total | 10,886 (79.4%) | 795 (5.8%) |
Employment Occupations by Sex in Orleans County
Management, Business, Science and Arts Occupations
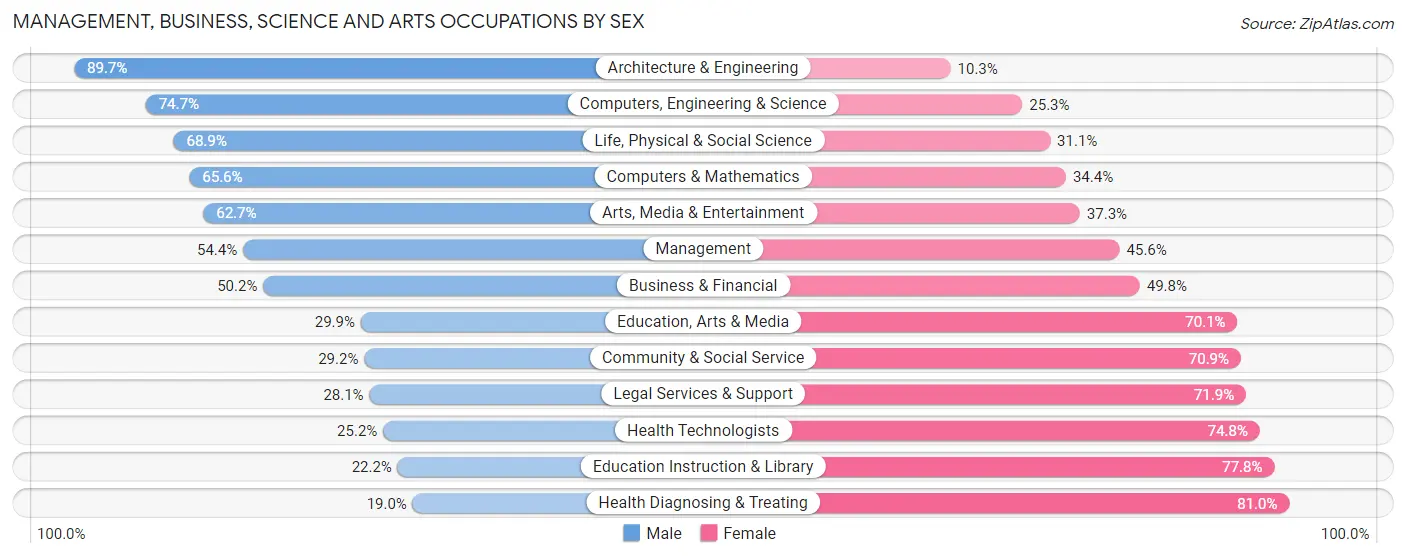
The most common Management, Business, Science and Arts occupations in Orleans County are Community & Social Service (1,942 | 14.5%), Management (1,501 | 11.3%), Education Instruction & Library (1,123 | 8.4%), Health Diagnosing & Treating (788 | 5.9%), and Health Technologists (488 | 3.7%).
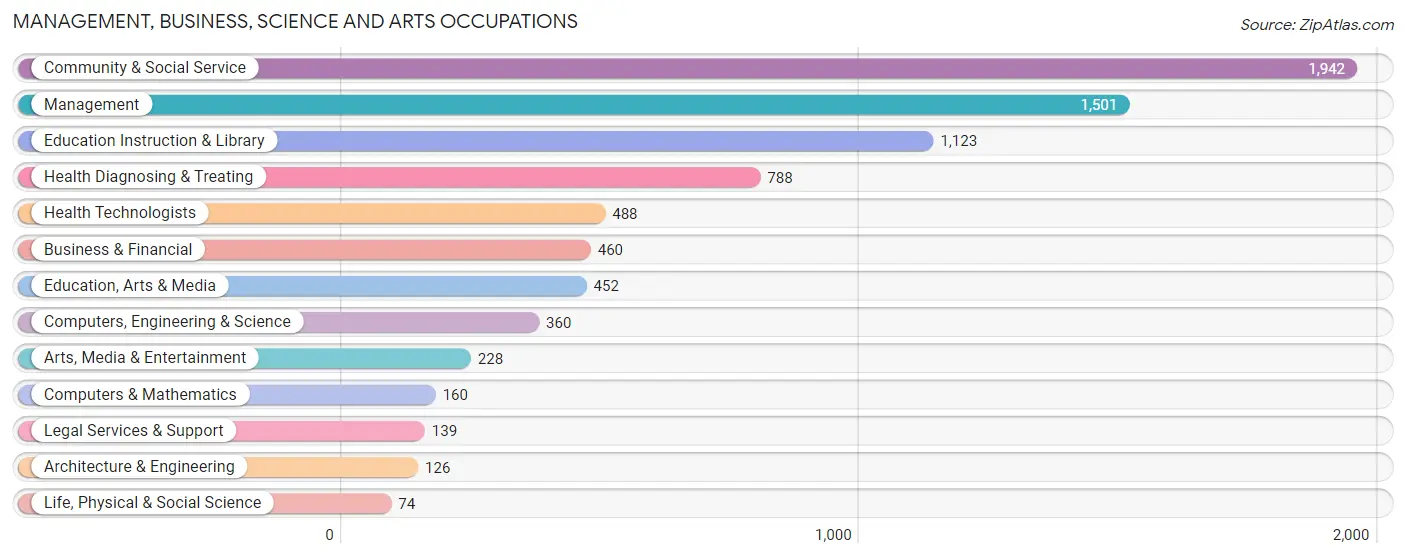
Management, Business, Science and Arts Occupations by Sex
Within the Management, Business, Science and Arts occupations in Orleans County, the most male-oriented occupations are Architecture & Engineering (89.7%), Computers, Engineering & Science (74.7%), and Life, Physical & Social Science (68.9%), while the most female-oriented occupations are Health Diagnosing & Treating (81.0%), Education Instruction & Library (77.8%), and Health Technologists (74.8%).
| Occupation | Male | Female |
| Management | 817 (54.4%) | 684 (45.6%) |
| Business & Financial | 231 (50.2%) | 229 (49.8%) |
| Computers, Engineering & Science | 269 (74.7%) | 91 (25.3%) |
| Computers & Mathematics | 105 (65.6%) | 55 (34.4%) |
| Architecture & Engineering | 113 (89.7%) | 13 (10.3%) |
| Life, Physical & Social Science | 51 (68.9%) | 23 (31.1%) |
| Community & Social Service | 566 (29.1%) | 1,376 (70.9%) |
| Education, Arts & Media | 135 (29.9%) | 317 (70.1%) |
| Legal Services & Support | 39 (28.1%) | 100 (71.9%) |
| Education Instruction & Library | 249 (22.2%) | 874 (77.8%) |
| Arts, Media & Entertainment | 143 (62.7%) | 85 (37.3%) |
| Health Diagnosing & Treating | 150 (19.0%) | 638 (81.0%) |
| Health Technologists | 123 (25.2%) | 365 (74.8%) |
| Total (Category) | 2,033 (40.3%) | 3,018 (59.8%) |
| Total (Overall) | 6,797 (50.9%) | 6,550 (49.1%) |
Services Occupations
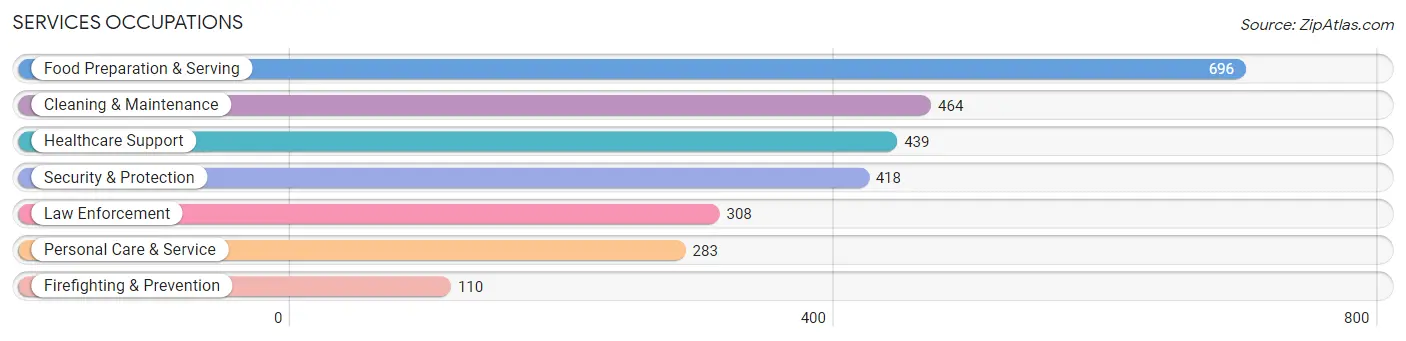
The most common Services occupations in Orleans County are Food Preparation & Serving (696 | 5.2%), Cleaning & Maintenance (464 | 3.5%), Healthcare Support (439 | 3.3%), Security & Protection (418 | 3.1%), and Law Enforcement (308 | 2.3%).
Services Occupations by Sex
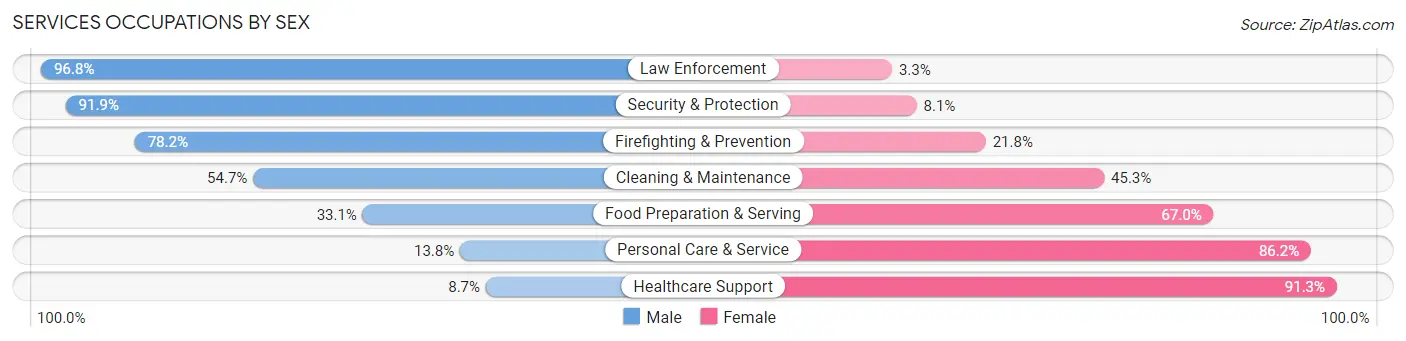
Within the Services occupations in Orleans County, the most male-oriented occupations are Law Enforcement (96.8%), Security & Protection (91.9%), and Firefighting & Prevention (78.2%), while the most female-oriented occupations are Healthcare Support (91.3%), Personal Care & Service (86.2%), and Food Preparation & Serving (66.9%).
| Occupation | Male | Female |
| Healthcare Support | 38 (8.7%) | 401 (91.3%) |
| Security & Protection | 384 (91.9%) | 34 (8.1%) |
| Firefighting & Prevention | 86 (78.2%) | 24 (21.8%) |
| Law Enforcement | 298 (96.8%) | 10 (3.3%) |
| Food Preparation & Serving | 230 (33.1%) | 466 (66.9%) |
| Cleaning & Maintenance | 254 (54.7%) | 210 (45.3%) |
| Personal Care & Service | 39 (13.8%) | 244 (86.2%) |
| Total (Category) | 945 (41.1%) | 1,355 (58.9%) |
| Total (Overall) | 6,797 (50.9%) | 6,550 (49.1%) |
Sales and Office Occupations
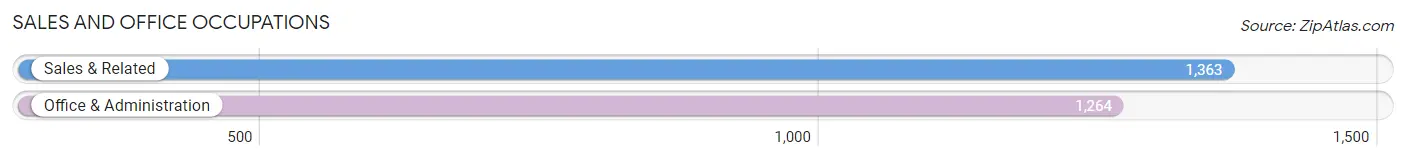
The most common Sales and Office occupations in Orleans County are Sales & Related (1,363 | 10.2%), and Office & Administration (1,264 | 9.5%).
Sales and Office Occupations by Sex
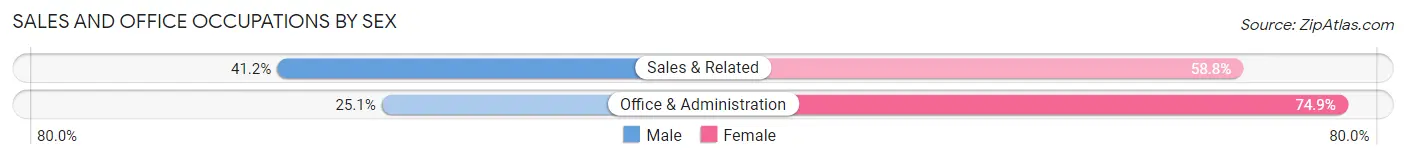
| Occupation | Male | Female |
| Sales & Related | 561 (41.2%) | 802 (58.8%) |
| Office & Administration | 317 (25.1%) | 947 (74.9%) |
| Total (Category) | 878 (33.4%) | 1,749 (66.6%) |
| Total (Overall) | 6,797 (50.9%) | 6,550 (49.1%) |
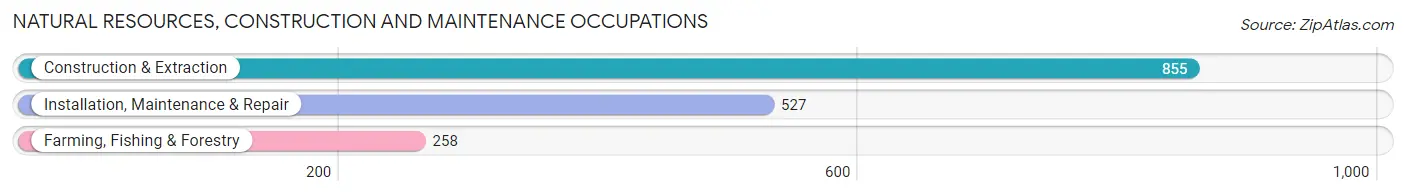
Natural Resources, Construction and Maintenance Occupations
The most common Natural Resources, Construction and Maintenance occupations in Orleans County are Construction & Extraction (855 | 6.4%), Installation, Maintenance & Repair (527 | 4.0%), and Farming, Fishing & Forestry (258 | 1.9%).
Natural Resources, Construction and Maintenance Occupations by Sex
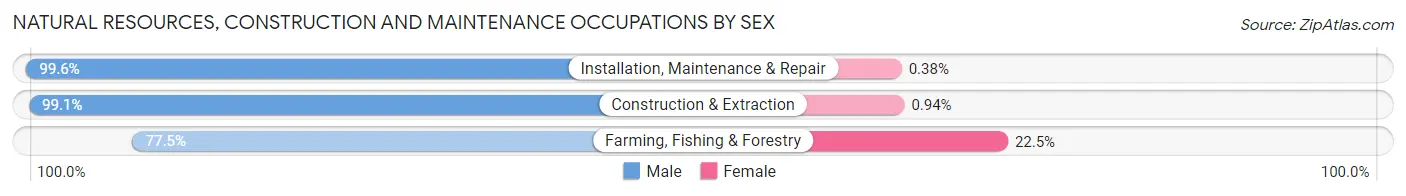
| Occupation | Male | Female |
| Farming, Fishing & Forestry | 200 (77.5%) | 58 (22.5%) |
| Construction & Extraction | 847 (99.1%) | 8 (0.9%) |
| Installation, Maintenance & Repair | 525 (99.6%) | 2 (0.4%) |
| Total (Category) | 1,572 (95.9%) | 68 (4.2%) |
| Total (Overall) | 6,797 (50.9%) | 6,550 (49.1%) |
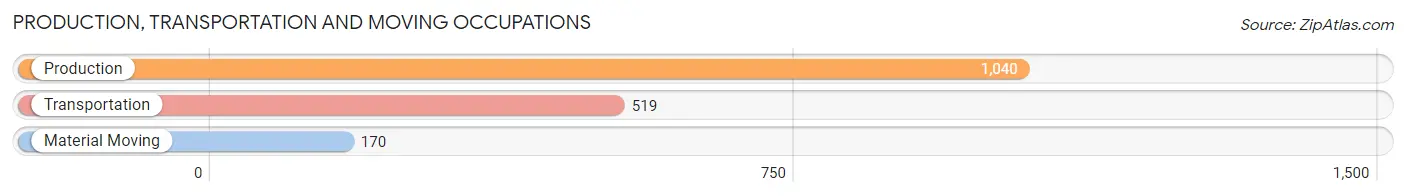
Production, Transportation and Moving Occupations
The most common Production, Transportation and Moving occupations in Orleans County are Production (1,040 | 7.8%), Transportation (519 | 3.9%), and Material Moving (170 | 1.3%).
Production, Transportation and Moving Occupations by Sex
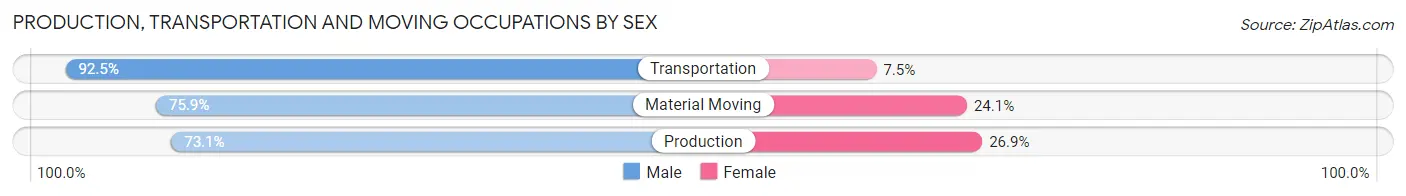
| Occupation | Male | Female |
| Production | 760 (73.1%) | 280 (26.9%) |
| Transportation | 480 (92.5%) | 39 (7.5%) |
| Material Moving | 129 (75.9%) | 41 (24.1%) |
| Total (Category) | 1,369 (79.2%) | 360 (20.8%) |
| Total (Overall) | 6,797 (50.9%) | 6,550 (49.1%) |
Employment Industries by Sex in Orleans County
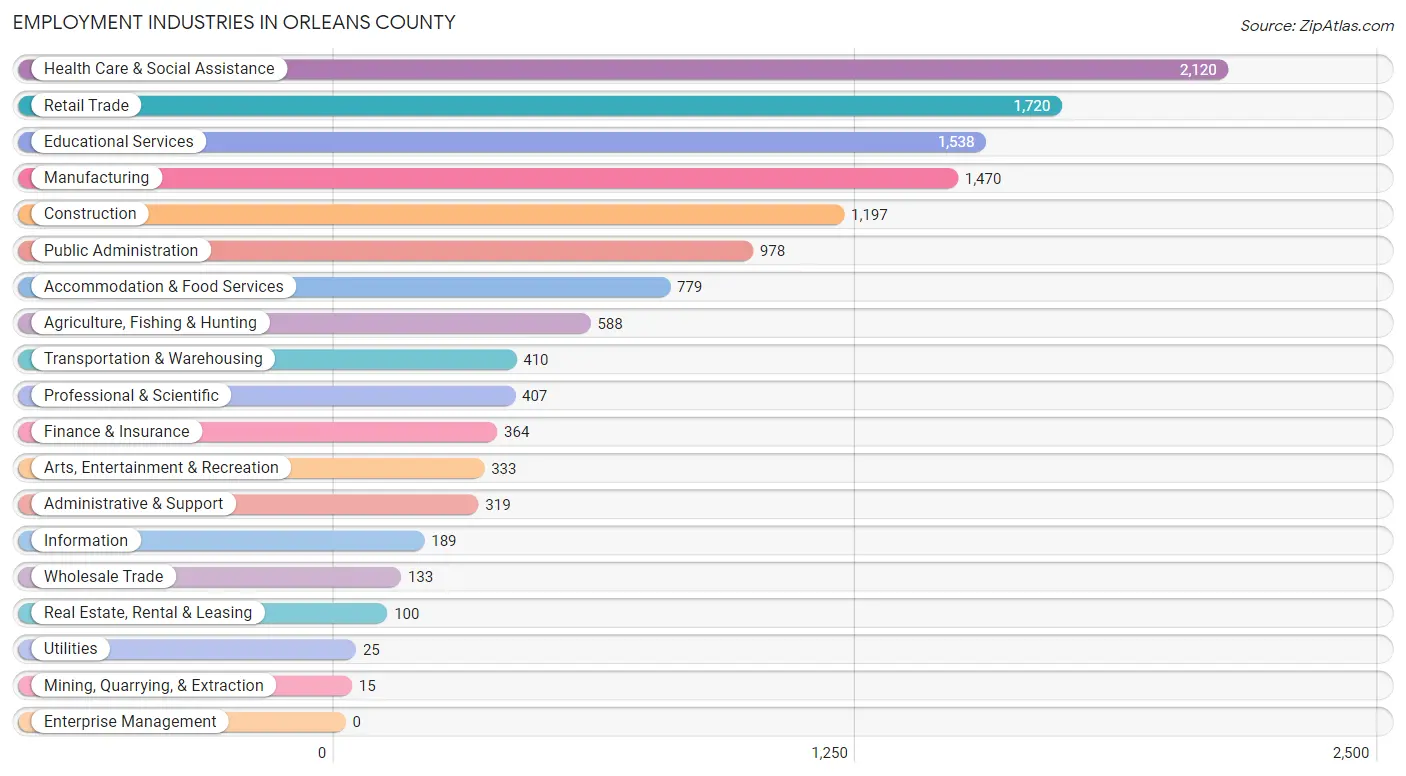
Employment Industries in Orleans County
The major employment industries in Orleans County include Health Care & Social Assistance (2,120 | 15.9%), Retail Trade (1,720 | 12.9%), Educational Services (1,538 | 11.5%), Manufacturing (1,470 | 11.0%), and Construction (1,197 | 9.0%).
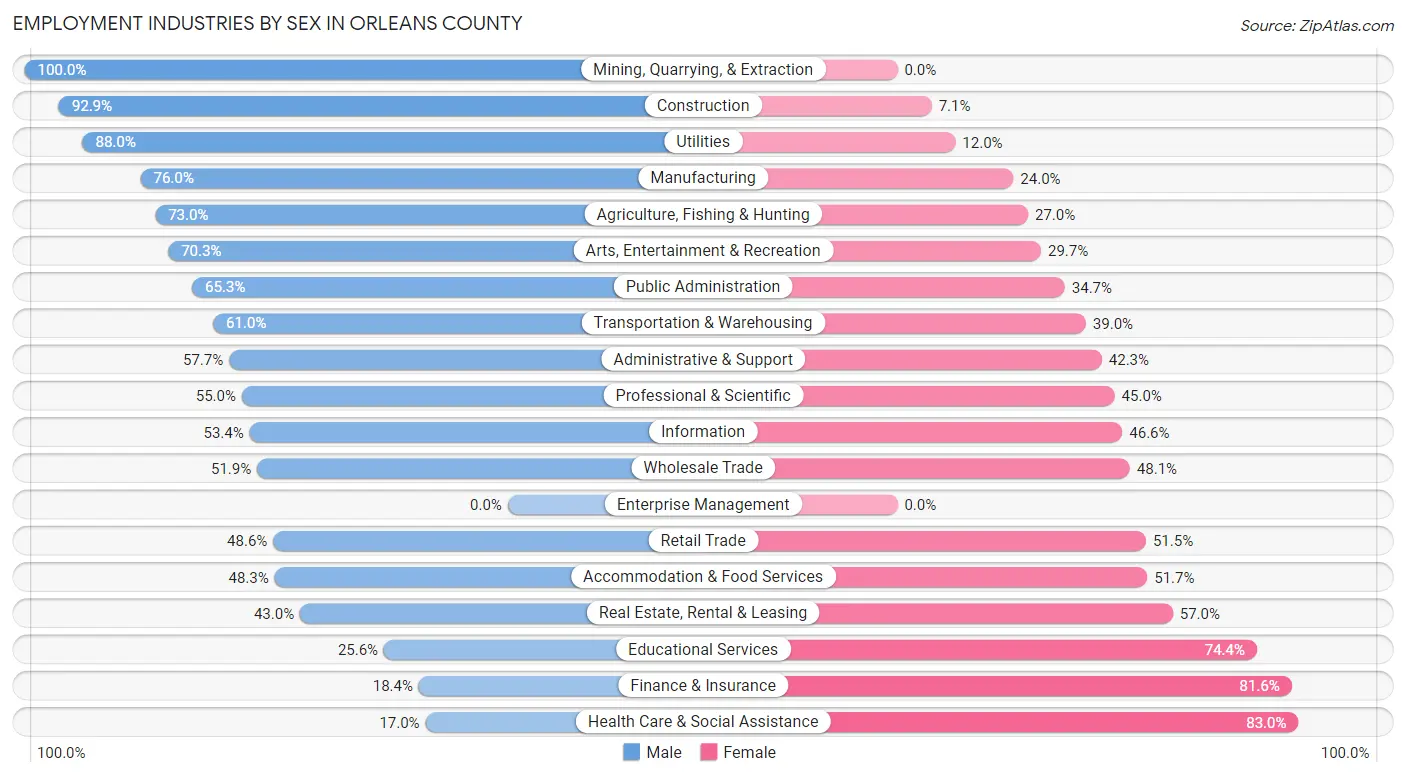
Employment Industries by Sex in Orleans County
The Orleans County industries that see more men than women are Mining, Quarrying, & Extraction (100.0%), Construction (92.9%), and Utilities (88.0%), whereas the industries that tend to have a higher number of women are Health Care & Social Assistance (83.0%), Finance & Insurance (81.6%), and Educational Services (74.4%).
| Industry | Male | Female |
| Agriculture, Fishing & Hunting | 429 (73.0%) | 159 (27.0%) |
| Mining, Quarrying, & Extraction | 15 (100.0%) | 0 (0.0%) |
| Construction | 1,112 (92.9%) | 85 (7.1%) |
| Manufacturing | 1,117 (76.0%) | 353 (24.0%) |
| Wholesale Trade | 69 (51.9%) | 64 (48.1%) |
| Retail Trade | 835 (48.5%) | 885 (51.4%) |
| Transportation & Warehousing | 250 (61.0%) | 160 (39.0%) |
| Utilities | 22 (88.0%) | 3 (12.0%) |
| Information | 101 (53.4%) | 88 (46.6%) |
| Finance & Insurance | 67 (18.4%) | 297 (81.6%) |
| Real Estate, Rental & Leasing | 43 (43.0%) | 57 (57.0%) |
| Professional & Scientific | 224 (55.0%) | 183 (45.0%) |
| Enterprise Management | 0 (0.0%) | 0 (0.0%) |
| Administrative & Support | 184 (57.7%) | 135 (42.3%) |
| Educational Services | 394 (25.6%) | 1,144 (74.4%) |
| Health Care & Social Assistance | 361 (17.0%) | 1,759 (83.0%) |
| Arts, Entertainment & Recreation | 234 (70.3%) | 99 (29.7%) |
| Accommodation & Food Services | 376 (48.3%) | 403 (51.7%) |
| Public Administration | 639 (65.3%) | 339 (34.7%) |
| Total | 6,797 (50.9%) | 6,550 (49.1%) |
Education in Orleans County
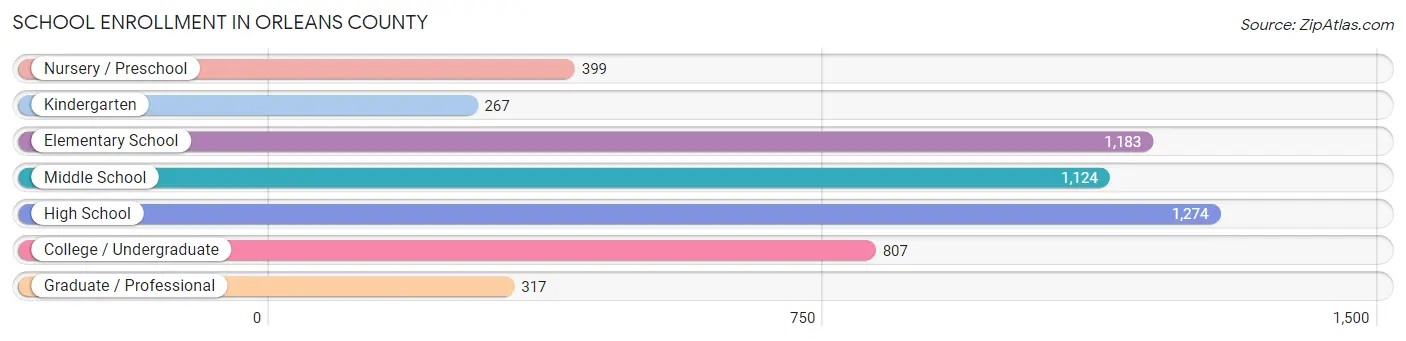
School Enrollment in Orleans County
The most common levels of schooling among the 5,371 students in Orleans County are high school (1,274 | 23.7%), elementary school (1,183 | 22.0%), and middle school (1,124 | 20.9%).
| School Level | # Students | % Students |
| Nursery / Preschool | 399 | 7.4% |
| Kindergarten | 267 | 5.0% |
| Elementary School | 1,183 | 22.0% |
| Middle School | 1,124 | 20.9% |
| High School | 1,274 | 23.7% |
| College / Undergraduate | 807 | 15.0% |
| Graduate / Professional | 317 | 5.9% |
| Total | 5,371 | 100.0% |
School Enrollment by Age by Funding Source in Orleans County
Out of a total of 5,371 students who are enrolled in schools in Orleans County, 752 (14.0%) attend a private institution, while the remaining 4,619 (86.0%) are enrolled in public schools. The age group of 20 to 24 year olds has the highest likelihood of being enrolled in private schools, with 150 (41.1% in the age bracket) enrolled. Conversely, the age group of 3 to 4 year olds has the lowest likelihood of being enrolled in a private school, with 266 (91.4% in the age bracket) attending a public institution.
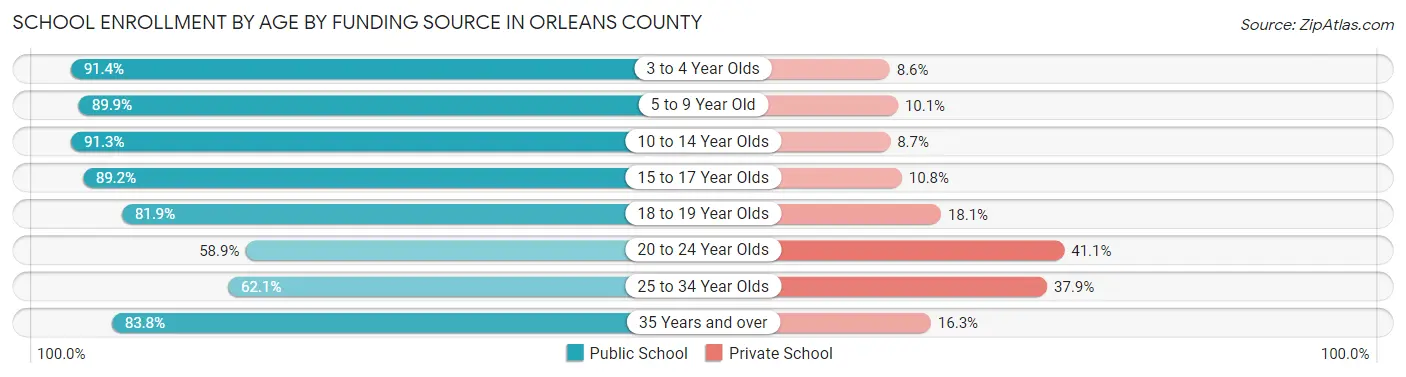
| Age Bracket | Public School | Private School |
| 3 to 4 Year Olds | 266 (91.4%) | 25 (8.6%) |
| 5 to 9 Year Old | 1,272 (89.9%) | 143 (10.1%) |
| 10 to 14 Year Olds | 1,295 (91.3%) | 123 (8.7%) |
| 15 to 17 Year Olds | 880 (89.2%) | 107 (10.8%) |
| 18 to 19 Year Olds | 226 (81.9%) | 50 (18.1%) |
| 20 to 24 Year Olds | 215 (58.9%) | 150 (41.1%) |
| 25 to 34 Year Olds | 159 (62.1%) | 97 (37.9%) |
| 35 Years and over | 304 (83.8%) | 59 (16.3%) |
| Total | 4,619 (86.0%) | 752 (14.0%) |
Educational Attainment by Field of Study in Orleans County
Education (1,052 | 17.1%), social sciences (536 | 8.7%), business (535 | 8.7%), literature & languages (532 | 8.6%), and science & technology (529 | 8.6%) are the most common fields of study among 6,158 individuals in Orleans County who have obtained a bachelor's degree or higher.
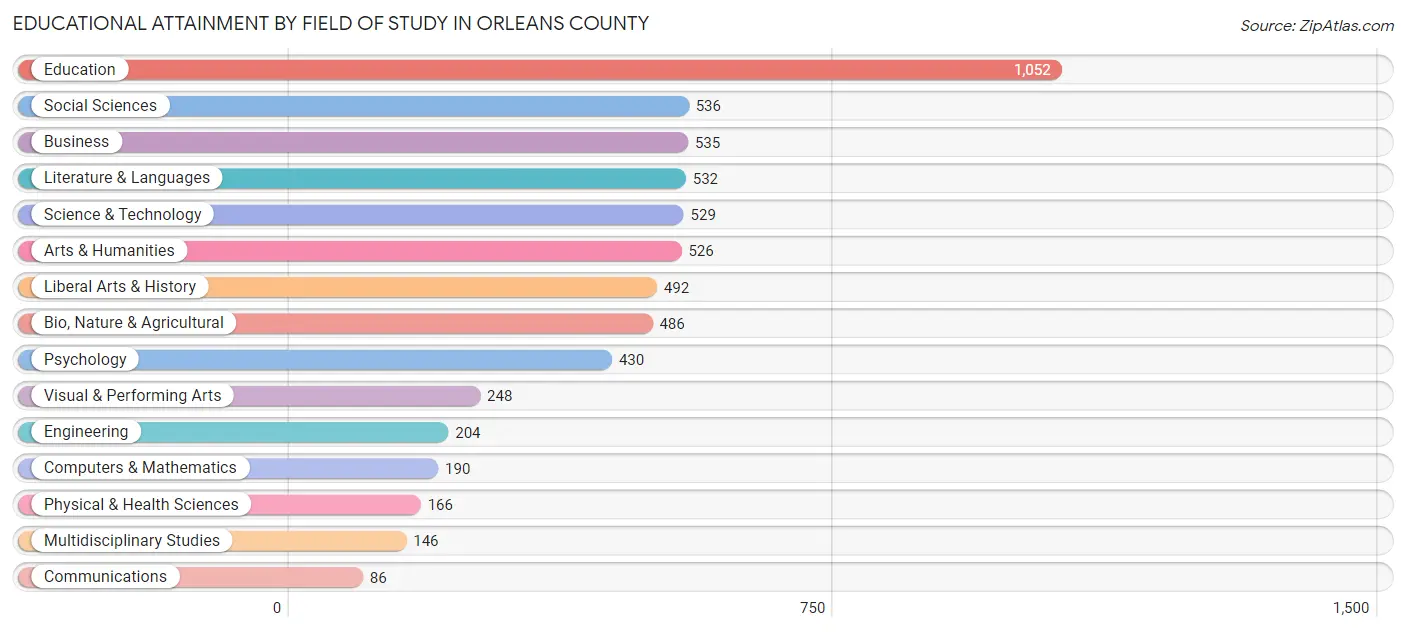
| Field of Study | # Graduates | % Graduates |
| Computers & Mathematics | 190 | 3.1% |
| Bio, Nature & Agricultural | 486 | 7.9% |
| Physical & Health Sciences | 166 | 2.7% |
| Psychology | 430 | 7.0% |
| Social Sciences | 536 | 8.7% |
| Engineering | 204 | 3.3% |
| Multidisciplinary Studies | 146 | 2.4% |
| Science & Technology | 529 | 8.6% |
| Business | 535 | 8.7% |
| Education | 1,052 | 17.1% |
| Literature & Languages | 532 | 8.6% |
| Liberal Arts & History | 492 | 8.0% |
| Visual & Performing Arts | 248 | 4.0% |
| Communications | 86 | 1.4% |
| Arts & Humanities | 526 | 8.5% |
| Total | 6,158 | 100.0% |
Transportation & Commute in Orleans County
Vehicle Availability by Sex in Orleans County
The most prevalent vehicle ownership categories in Orleans County are males with 2 vehicles (3,204, accounting for 47.5%) and females with 2 vehicles (2,899, making up 50.5%).
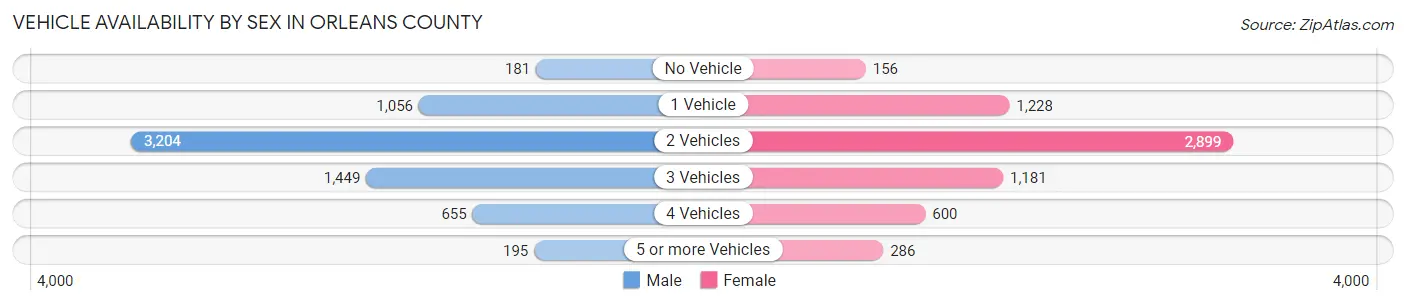
| Vehicles Available | Male | Female |
| No Vehicle | 181 (2.7%) | 156 (2.5%) |
| 1 Vehicle | 1,056 (15.7%) | 1,228 (19.3%) |
| 2 Vehicles | 3,204 (47.5%) | 2,899 (45.7%) |
| 3 Vehicles | 1,449 (21.5%) | 1,181 (18.6%) |
| 4 Vehicles | 655 (9.7%) | 600 (9.5%) |
| 5 or more Vehicles | 195 (2.9%) | 286 (4.5%) |
| Total | 6,740 (100.0%) | 6,350 (100.0%) |
Commute Time in Orleans County
The most frequently occuring commute durations in Orleans County are 20 to 24 minutes (2,040 commuters, 17.0%), 15 to 19 minutes (1,799 commuters, 15.0%), and 5 to 9 minutes (1,716 commuters, 14.3%).
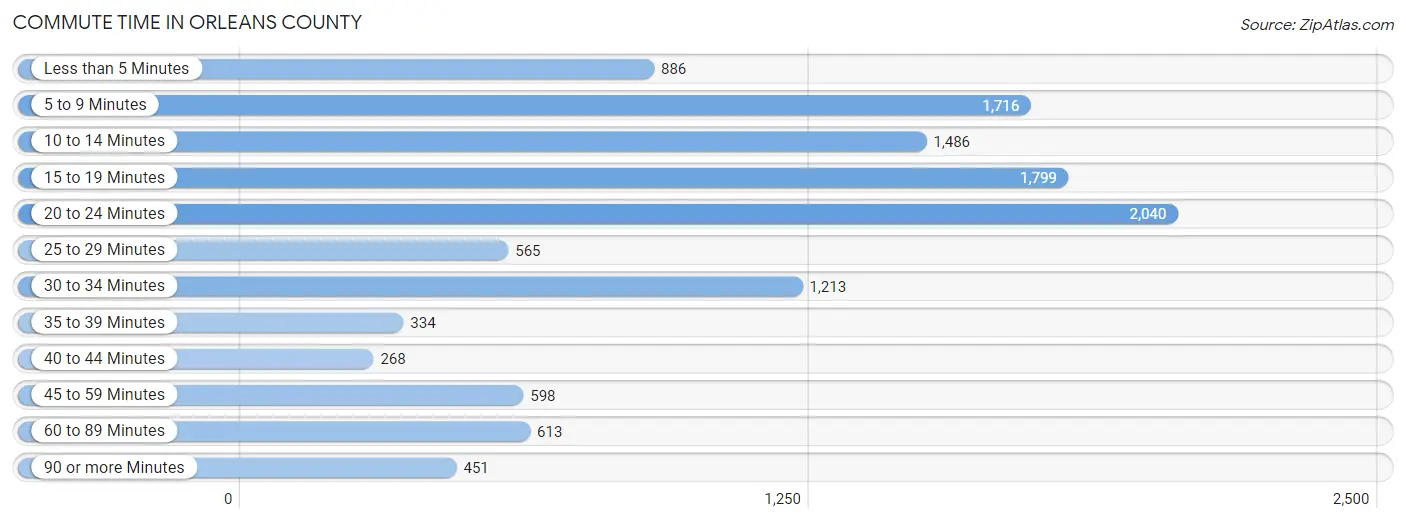
| Commute Time | # Commuters | % Commuters |
| Less than 5 Minutes | 886 | 7.4% |
| 5 to 9 Minutes | 1,716 | 14.3% |
| 10 to 14 Minutes | 1,486 | 12.4% |
| 15 to 19 Minutes | 1,799 | 15.0% |
| 20 to 24 Minutes | 2,040 | 17.0% |
| 25 to 29 Minutes | 565 | 4.7% |
| 30 to 34 Minutes | 1,213 | 10.1% |
| 35 to 39 Minutes | 334 | 2.8% |
| 40 to 44 Minutes | 268 | 2.2% |
| 45 to 59 Minutes | 598 | 5.0% |
| 60 to 89 Minutes | 613 | 5.1% |
| 90 or more Minutes | 451 | 3.8% |
Commute Time by Sex in Orleans County
The most common commute times in Orleans County are 20 to 24 minutes (1,101 commuters, 17.6%) for males and 20 to 24 minutes (939 commuters, 16.5%) for females.
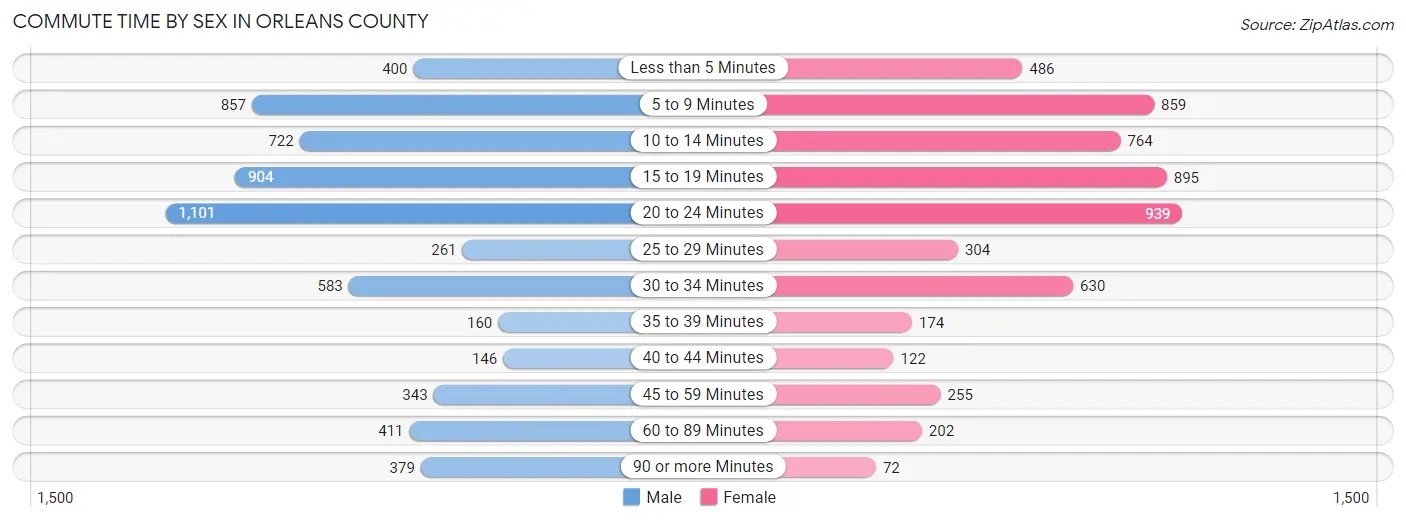
| Commute Time | Male | Female |
| Less than 5 Minutes | 400 (6.4%) | 486 (8.5%) |
| 5 to 9 Minutes | 857 (13.7%) | 859 (15.1%) |
| 10 to 14 Minutes | 722 (11.5%) | 764 (13.4%) |
| 15 to 19 Minutes | 904 (14.4%) | 895 (15.7%) |
| 20 to 24 Minutes | 1,101 (17.6%) | 939 (16.5%) |
| 25 to 29 Minutes | 261 (4.2%) | 304 (5.3%) |
| 30 to 34 Minutes | 583 (9.3%) | 630 (11.1%) |
| 35 to 39 Minutes | 160 (2.5%) | 174 (3.0%) |
| 40 to 44 Minutes | 146 (2.3%) | 122 (2.1%) |
| 45 to 59 Minutes | 343 (5.5%) | 255 (4.5%) |
| 60 to 89 Minutes | 411 (6.6%) | 202 (3.5%) |
| 90 or more Minutes | 379 (6.0%) | 72 (1.3%) |
Time of Departure to Work by Sex in Orleans County
The most frequent times of departure to work in Orleans County are 6:30 AM to 6:59 AM (943, 15.0%) for males and 7:30 AM to 7:59 AM (1,242, 21.8%) for females.
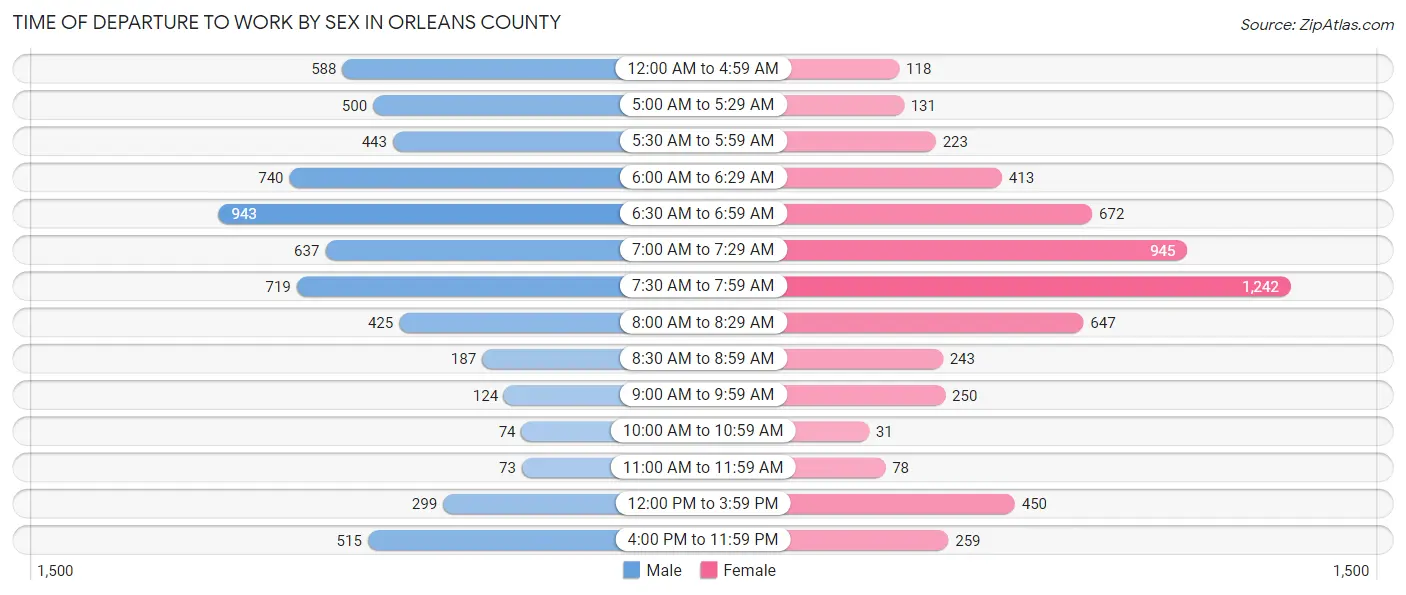
| Time of Departure | Male | Female |
| 12:00 AM to 4:59 AM | 588 (9.4%) | 118 (2.1%) |
| 5:00 AM to 5:29 AM | 500 (8.0%) | 131 (2.3%) |
| 5:30 AM to 5:59 AM | 443 (7.1%) | 223 (3.9%) |
| 6:00 AM to 6:29 AM | 740 (11.8%) | 413 (7.2%) |
| 6:30 AM to 6:59 AM | 943 (15.0%) | 672 (11.8%) |
| 7:00 AM to 7:29 AM | 637 (10.2%) | 945 (16.6%) |
| 7:30 AM to 7:59 AM | 719 (11.5%) | 1,242 (21.8%) |
| 8:00 AM to 8:29 AM | 425 (6.8%) | 647 (11.4%) |
| 8:30 AM to 8:59 AM | 187 (3.0%) | 243 (4.3%) |
| 9:00 AM to 9:59 AM | 124 (2.0%) | 250 (4.4%) |
| 10:00 AM to 10:59 AM | 74 (1.2%) | 31 (0.5%) |
| 11:00 AM to 11:59 AM | 73 (1.2%) | 78 (1.4%) |
| 12:00 PM to 3:59 PM | 299 (4.8%) | 450 (7.9%) |
| 4:00 PM to 11:59 PM | 515 (8.2%) | 259 (4.5%) |
| Total | 6,267 (100.0%) | 5,702 (100.0%) |
Housing Occupancy in Orleans County
Occupancy by Ownership in Orleans County
Of the total 11,528 dwellings in Orleans County, owner-occupied units account for 9,228 (80.0%), while renter-occupied units make up 2,300 (20.0%).
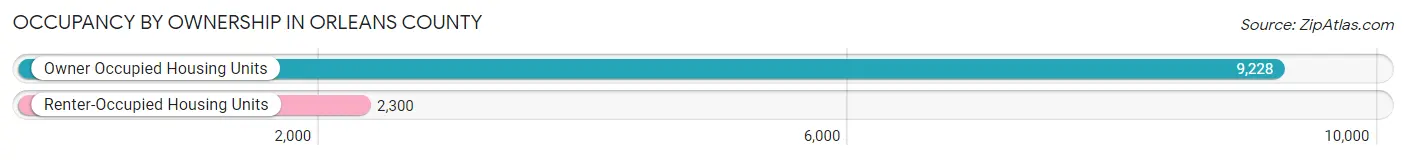
| Occupancy | # Housing Units | % Housing Units |
| Owner Occupied Housing Units | 9,228 | 80.0% |
| Renter-Occupied Housing Units | 2,300 | 20.0% |
| Total Occupied Housing Units | 11,528 | 100.0% |
Occupancy by Household Size in Orleans County
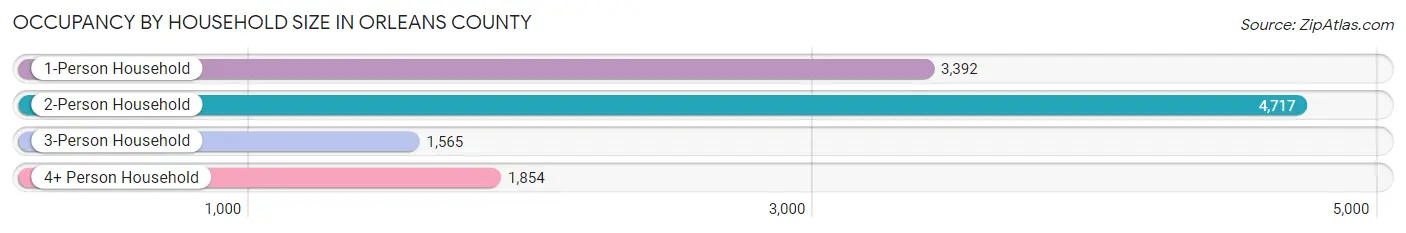
| Household Size | # Housing Units | % Housing Units |
| 1-Person Household | 3,392 | 29.4% |
| 2-Person Household | 4,717 | 40.9% |
| 3-Person Household | 1,565 | 13.6% |
| 4+ Person Household | 1,854 | 16.1% |
| Total Housing Units | 11,528 | 100.0% |
Occupancy by Ownership by Household Size in Orleans County
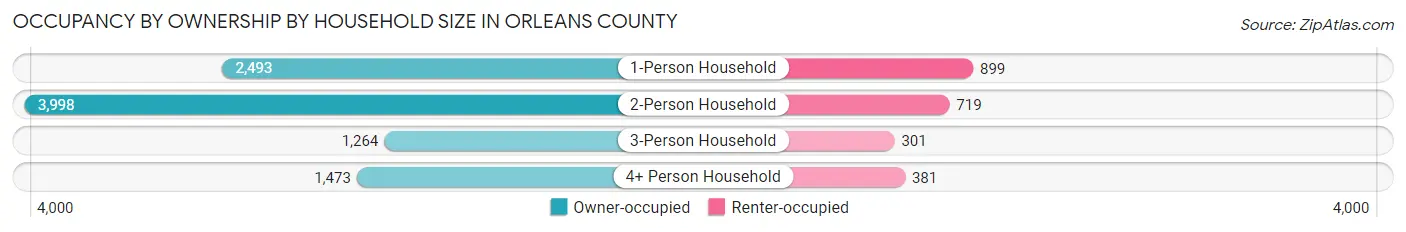
| Household Size | Owner-occupied | Renter-occupied |
| 1-Person Household | 2,493 (73.5%) | 899 (26.5%) |
| 2-Person Household | 3,998 (84.8%) | 719 (15.2%) |
| 3-Person Household | 1,264 (80.8%) | 301 (19.2%) |
| 4+ Person Household | 1,473 (79.4%) | 381 (20.5%) |
| Total Housing Units | 9,228 (80.0%) | 2,300 (20.0%) |
Occupancy by Educational Attainment in Orleans County
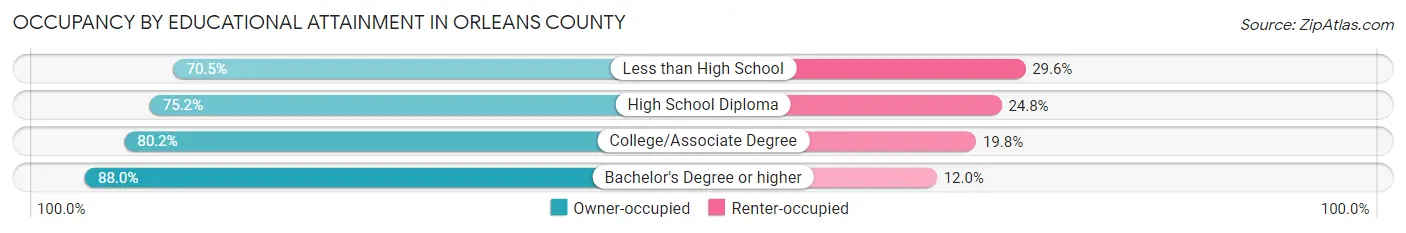
| Household Size | Owner-occupied | Renter-occupied |
| Less than High School | 627 (70.5%) | 263 (29.5%) |
| High School Diploma | 2,989 (75.2%) | 988 (24.8%) |
| College/Associate Degree | 2,569 (80.2%) | 634 (19.8%) |
| Bachelor's Degree or higher | 3,043 (88.0%) | 415 (12.0%) |
Occupancy by Age of Householder in Orleans County
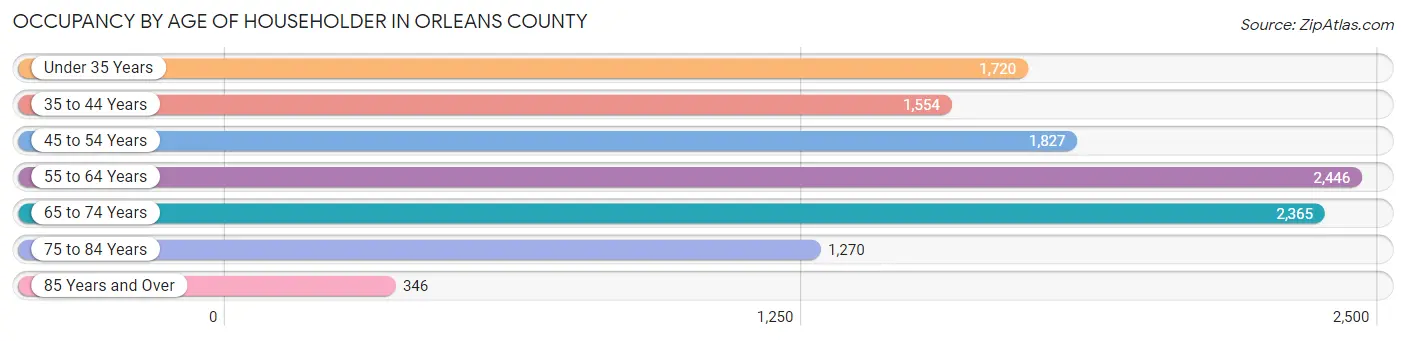
| Age Bracket | # Households | % Households |
| Under 35 Years | 1,720 | 14.9% |
| 35 to 44 Years | 1,554 | 13.5% |
| 45 to 54 Years | 1,827 | 15.9% |
| 55 to 64 Years | 2,446 | 21.2% |
| 65 to 74 Years | 2,365 | 20.5% |
| 75 to 84 Years | 1,270 | 11.0% |
| 85 Years and Over | 346 | 3.0% |
| Total | 11,528 | 100.0% |
Housing Finances in Orleans County
Median Income by Occupancy in Orleans County
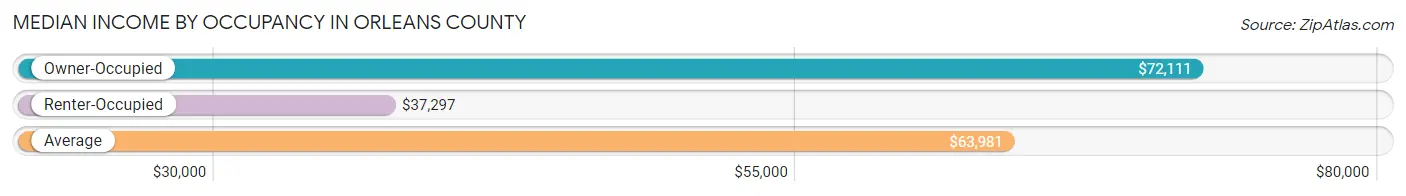
| Occupancy Type | # Households | Median Income |
| Owner-Occupied | 9,228 (80.0%) | $72,111 |
| Renter-Occupied | 2,300 (20.0%) | $37,297 |
| Average | 11,528 (100.0%) | $63,981 |
Occupancy by Householder Income Bracket in Orleans County
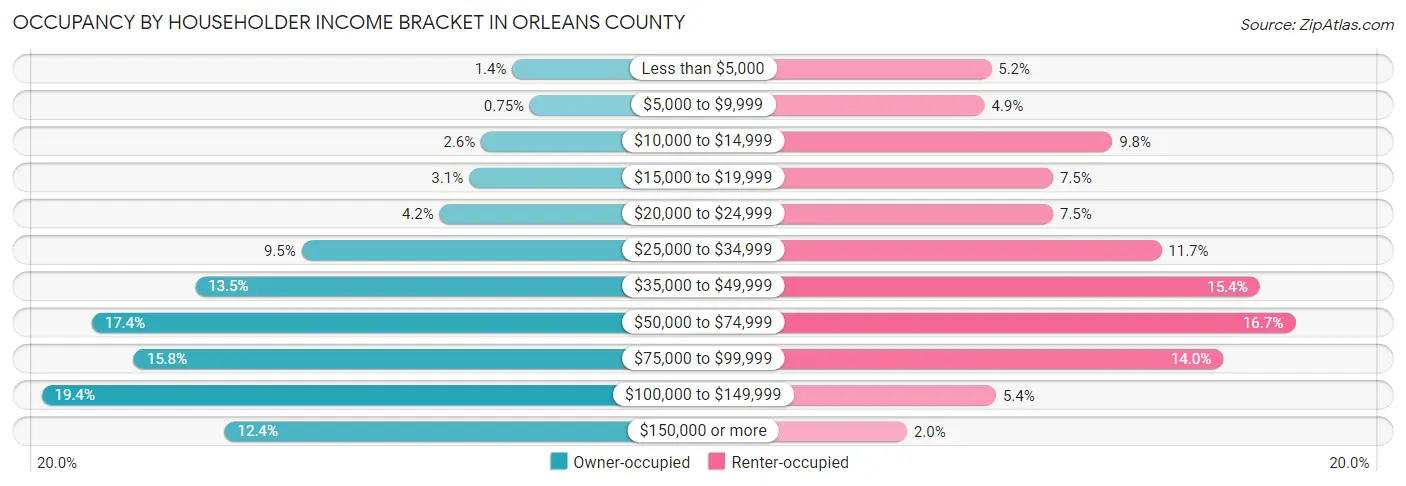
| Income Bracket | Owner-occupied | Renter-occupied |
| Less than $5,000 | 131 (1.4%) | 119 (5.2%) |
| $5,000 to $9,999 | 69 (0.7%) | 113 (4.9%) |
| $10,000 to $14,999 | 241 (2.6%) | 225 (9.8%) |
| $15,000 to $19,999 | 283 (3.1%) | 173 (7.5%) |
| $20,000 to $24,999 | 387 (4.2%) | 173 (7.5%) |
| $25,000 to $34,999 | 872 (9.5%) | 268 (11.7%) |
| $35,000 to $49,999 | 1,246 (13.5%) | 354 (15.4%) |
| $50,000 to $74,999 | 1,609 (17.4%) | 385 (16.7%) |
| $75,000 to $99,999 | 1,462 (15.8%) | 322 (14.0%) |
| $100,000 to $149,999 | 1,786 (19.4%) | 123 (5.3%) |
| $150,000 or more | 1,142 (12.4%) | 45 (2.0%) |
| Total | 9,228 (100.0%) | 2,300 (100.0%) |
Monthly Housing Cost Tiers in Orleans County
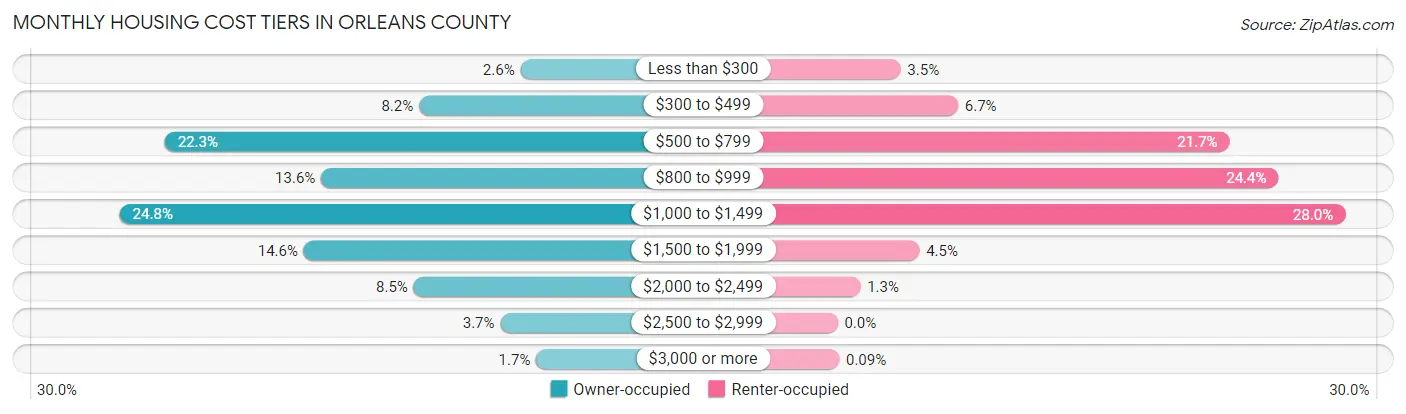
| Monthly Cost | Owner-occupied | Renter-occupied |
| Less than $300 | 241 (2.6%) | 80 (3.5%) |
| $300 to $499 | 758 (8.2%) | 153 (6.7%) |
| $500 to $799 | 2,054 (22.3%) | 498 (21.6%) |
| $800 to $999 | 1,257 (13.6%) | 560 (24.3%) |
| $1,000 to $1,499 | 2,284 (24.7%) | 645 (28.0%) |
| $1,500 to $1,999 | 1,345 (14.6%) | 104 (4.5%) |
| $2,000 to $2,499 | 785 (8.5%) | 29 (1.3%) |
| $2,500 to $2,999 | 343 (3.7%) | 0 (0.0%) |
| $3,000 or more | 161 (1.7%) | 2 (0.1%) |
| Total | 9,228 (100.0%) | 2,300 (100.0%) |
Physical Housing Characteristics in Orleans County
Housing Structures in Orleans County
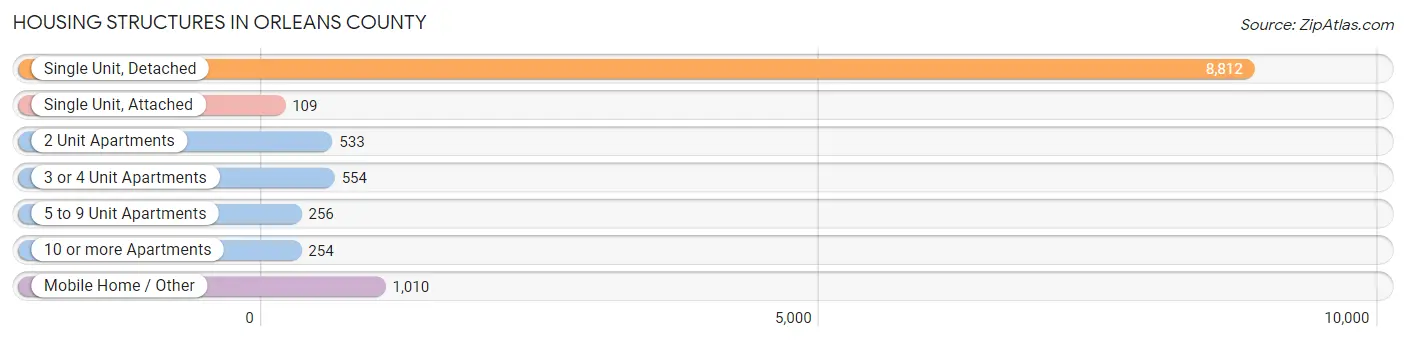
| Structure Type | # Housing Units | % Housing Units |
| Single Unit, Detached | 8,812 | 76.4% |
| Single Unit, Attached | 109 | 0.9% |
| 2 Unit Apartments | 533 | 4.6% |
| 3 or 4 Unit Apartments | 554 | 4.8% |
| 5 to 9 Unit Apartments | 256 | 2.2% |
| 10 or more Apartments | 254 | 2.2% |
| Mobile Home / Other | 1,010 | 8.8% |
| Total | 11,528 | 100.0% |
Housing Structures by Occupancy in Orleans County
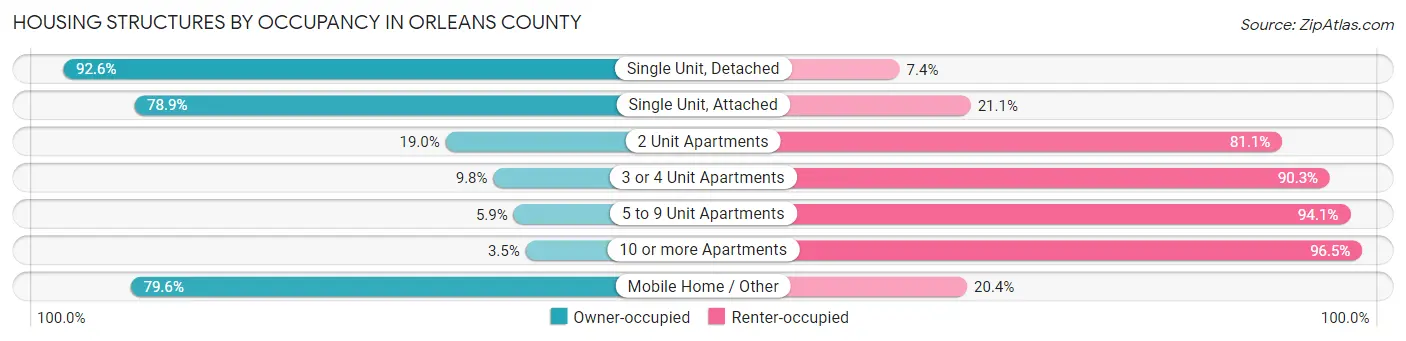
| Structure Type | Owner-occupied | Renter-occupied |
| Single Unit, Detached | 8,159 (92.6%) | 653 (7.4%) |
| Single Unit, Attached | 86 (78.9%) | 23 (21.1%) |
| 2 Unit Apartments | 101 (19.0%) | 432 (81.0%) |
| 3 or 4 Unit Apartments | 54 (9.8%) | 500 (90.2%) |
| 5 to 9 Unit Apartments | 15 (5.9%) | 241 (94.1%) |
| 10 or more Apartments | 9 (3.5%) | 245 (96.5%) |
| Mobile Home / Other | 804 (79.6%) | 206 (20.4%) |
| Total | 9,228 (80.0%) | 2,300 (20.0%) |
Housing Structures by Number of Rooms in Orleans County
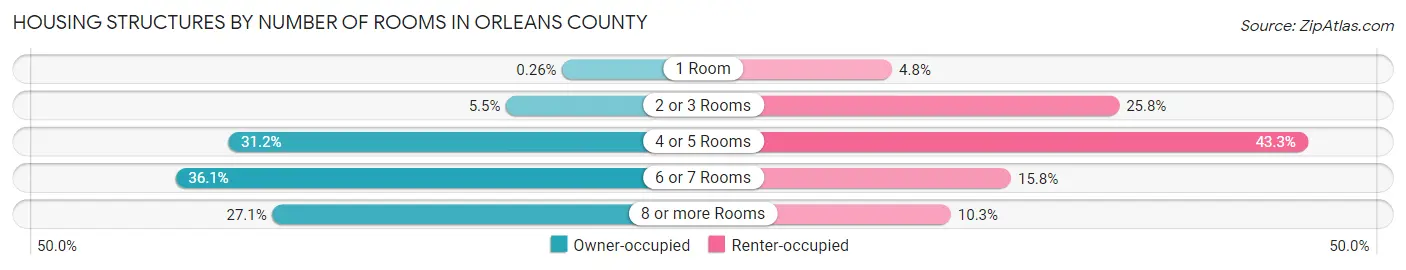
| Number of Rooms | Owner-occupied | Renter-occupied |
| 1 Room | 24 (0.3%) | 111 (4.8%) |
| 2 or 3 Rooms | 503 (5.4%) | 594 (25.8%) |
| 4 or 5 Rooms | 2,876 (31.2%) | 995 (43.3%) |
| 6 or 7 Rooms | 3,327 (36.0%) | 364 (15.8%) |
| 8 or more Rooms | 2,498 (27.1%) | 236 (10.3%) |
| Total | 9,228 (100.0%) | 2,300 (100.0%) |
Housing Structure by Heating Type in Orleans County
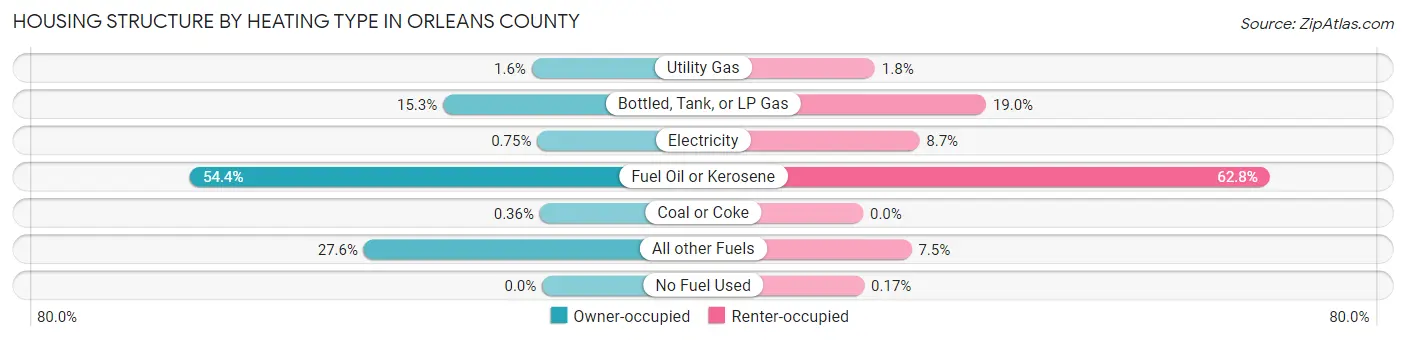
| Heating Type | Owner-occupied | Renter-occupied |
| Utility Gas | 149 (1.6%) | 42 (1.8%) |
| Bottled, Tank, or LP Gas | 1,413 (15.3%) | 437 (19.0%) |
| Electricity | 69 (0.7%) | 200 (8.7%) |
| Fuel Oil or Kerosene | 5,021 (54.4%) | 1,445 (62.8%) |
| Coal or Coke | 33 (0.4%) | 0 (0.0%) |
| All other Fuels | 2,543 (27.6%) | 172 (7.5%) |
| No Fuel Used | 0 (0.0%) | 4 (0.2%) |
| Total | 9,228 (100.0%) | 2,300 (100.0%) |
Household Vehicle Usage in Orleans County
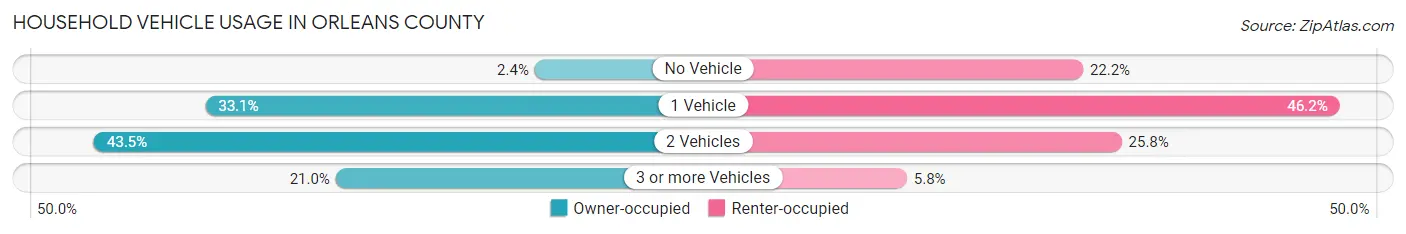
| Vehicles per Household | Owner-occupied | Renter-occupied |
| No Vehicle | 220 (2.4%) | 511 (22.2%) |
| 1 Vehicle | 3,057 (33.1%) | 1,062 (46.2%) |
| 2 Vehicles | 4,017 (43.5%) | 594 (25.8%) |
| 3 or more Vehicles | 1,934 (21.0%) | 133 (5.8%) |
| Total | 9,228 (100.0%) | 2,300 (100.0%) |
Real Estate & Mortgages in Orleans County
Real Estate and Mortgage Overview in Orleans County
| Characteristic | Without Mortgage | With Mortgage |
| Housing Units | 4,063 | 5,165 |
| Median Property Value | $192,700 | $199,200 |
| Median Household Income | $61,285 | $727 |
| Monthly Housing Costs | $674 | $143 |
| Real Estate Taxes | $3,356 | $55 |
Property Value by Mortgage Status in Orleans County
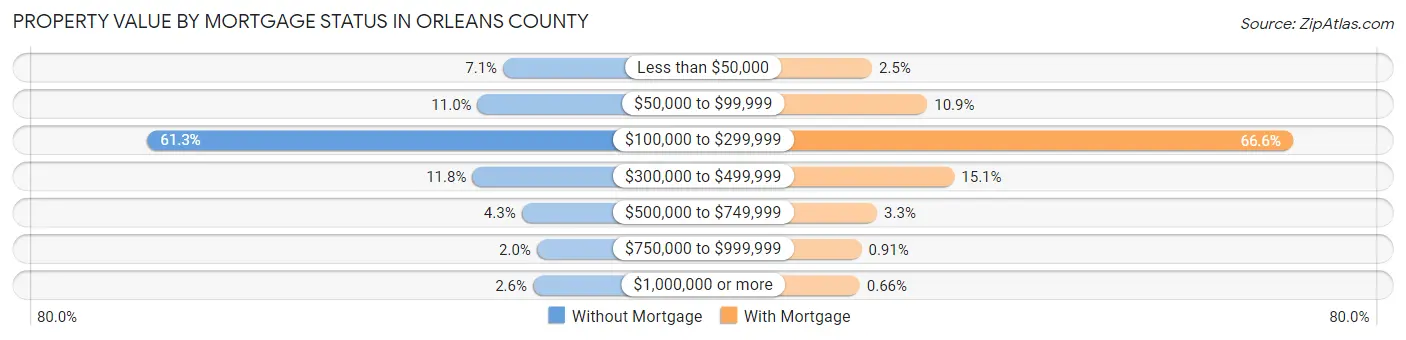
| Property Value | Without Mortgage | With Mortgage |
| Less than $50,000 | 289 (7.1%) | 130 (2.5%) |
| $50,000 to $99,999 | 447 (11.0%) | 565 (10.9%) |
| $100,000 to $299,999 | 2,490 (61.3%) | 3,441 (66.6%) |
| $300,000 to $499,999 | 479 (11.8%) | 778 (15.1%) |
| $500,000 to $749,999 | 174 (4.3%) | 170 (3.3%) |
| $750,000 to $999,999 | 80 (2.0%) | 47 (0.9%) |
| $1,000,000 or more | 104 (2.6%) | 34 (0.7%) |
| Total | 4,063 (100.0%) | 5,165 (100.0%) |
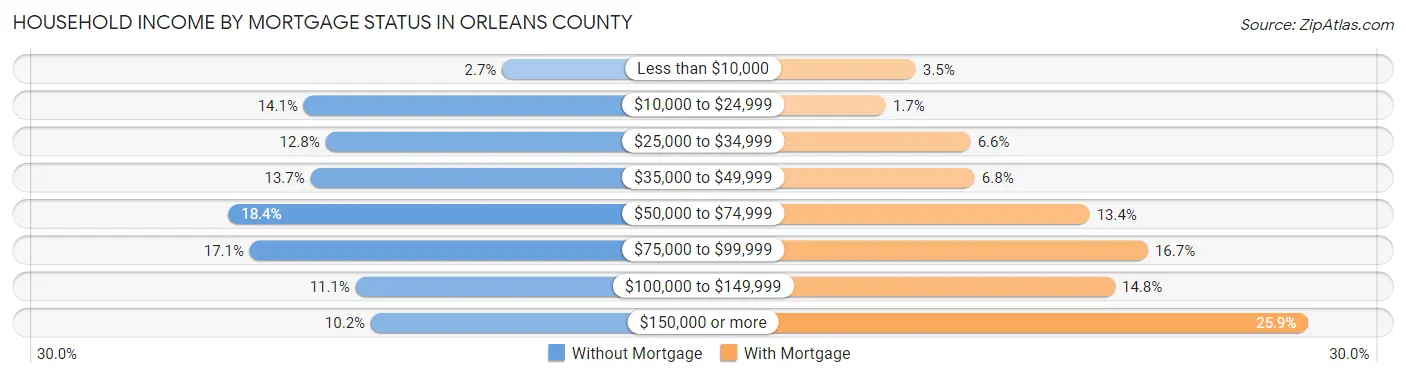
Household Income by Mortgage Status in Orleans County
| Household Income | Without Mortgage | With Mortgage |
| Less than $10,000 | 110 (2.7%) | 178 (3.5%) |
| $10,000 to $24,999 | 571 (14.1%) | 90 (1.7%) |
| $25,000 to $34,999 | 520 (12.8%) | 340 (6.6%) |
| $35,000 to $49,999 | 555 (13.7%) | 352 (6.8%) |
| $50,000 to $74,999 | 746 (18.4%) | 691 (13.4%) |
| $75,000 to $99,999 | 696 (17.1%) | 863 (16.7%) |
| $100,000 to $149,999 | 450 (11.1%) | 766 (14.8%) |
| $150,000 or more | 415 (10.2%) | 1,336 (25.9%) |
| Total | 4,063 (100.0%) | 5,165 (100.0%) |
Property Value to Household Income Ratio in Orleans County
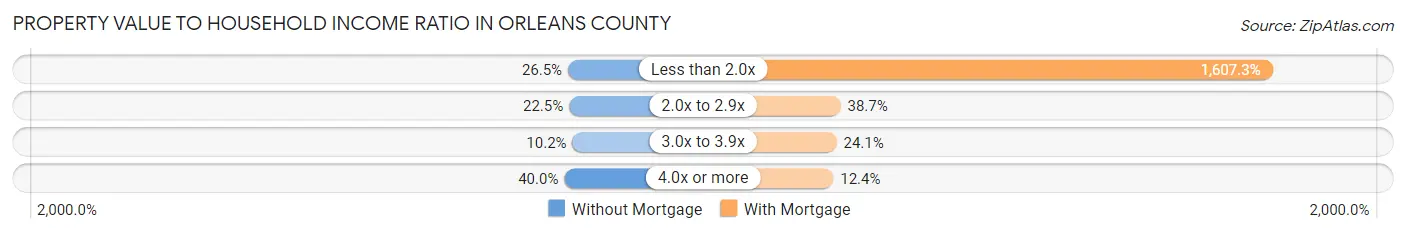
| Value-to-Income Ratio | Without Mortgage | With Mortgage |
| Less than 2.0x | 1,075 (26.5%) | 83,019 (1,607.3%) |
| 2.0x to 2.9x | 916 (22.5%) | 2,000 (38.7%) |
| 3.0x to 3.9x | 416 (10.2%) | 1,246 (24.1%) |
| 4.0x or more | 1,624 (40.0%) | 639 (12.4%) |
| Total | 4,063 (100.0%) | 5,165 (100.0%) |
Real Estate Taxes by Mortgage Status in Orleans County
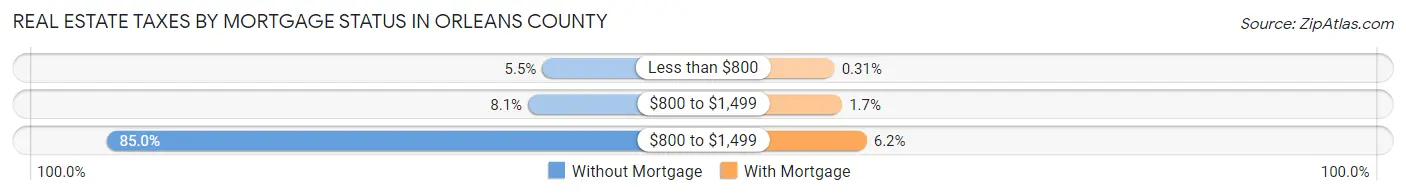
| Property Taxes | Without Mortgage | With Mortgage |
| Less than $800 | 222 (5.5%) | 16 (0.3%) |
| $800 to $1,499 | 328 (8.1%) | 87 (1.7%) |
| $800 to $1,499 | 3,454 (85.0%) | 318 (6.2%) |
| Total | 4,063 (100.0%) | 5,165 (100.0%) |
Health & Disability in Orleans County
Health Insurance Coverage by Age in Orleans County
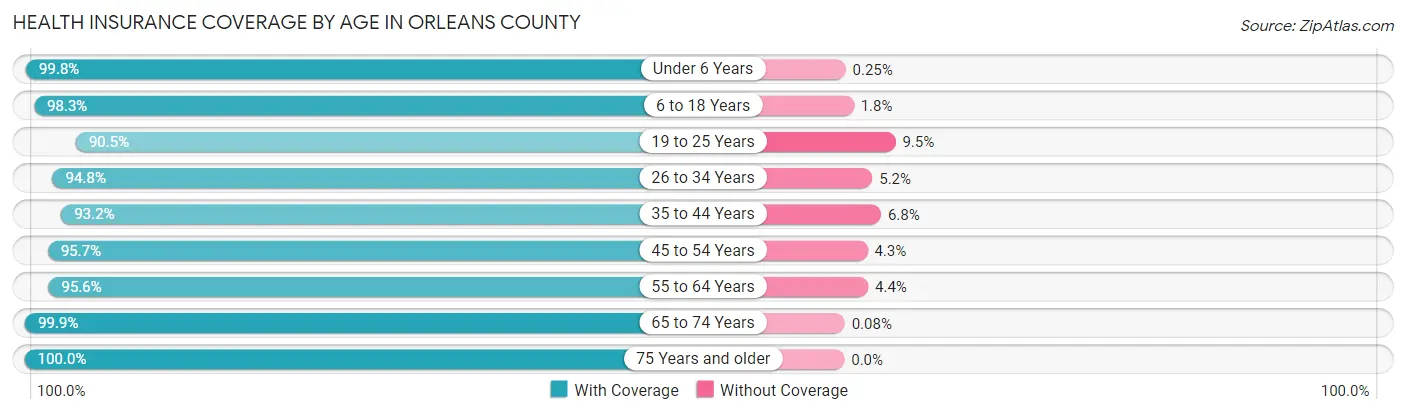
| Age Bracket | With Coverage | Without Coverage |
| Under 6 Years | 1,572 (99.8%) | 4 (0.3%) |
| 6 to 18 Years | 3,921 (98.3%) | 70 (1.8%) |
| 19 to 25 Years | 1,774 (90.5%) | 187 (9.5%) |
| 26 to 34 Years | 2,577 (94.8%) | 142 (5.2%) |
| 35 to 44 Years | 2,804 (93.2%) | 206 (6.8%) |
| 45 to 54 Years | 3,281 (95.7%) | 148 (4.3%) |
| 55 to 64 Years | 3,812 (95.6%) | 177 (4.4%) |
| 65 to 74 Years | 3,793 (99.9%) | 3 (0.1%) |
| 75 Years and older | 2,287 (100.0%) | 0 (0.0%) |
| Total | 25,821 (96.5%) | 937 (3.5%) |
Health Insurance Coverage by Citizenship Status in Orleans County
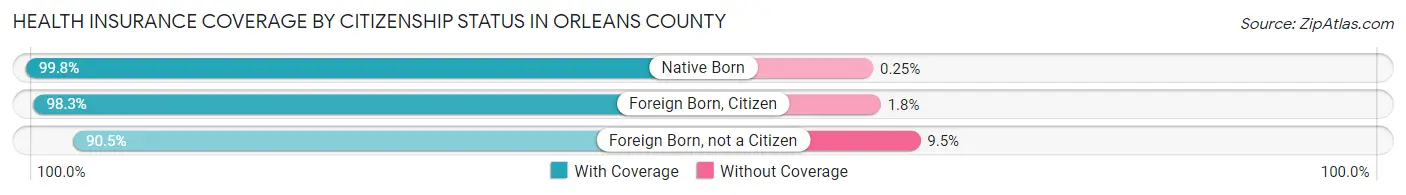
| Citizenship Status | With Coverage | Without Coverage |
| Native Born | 1,572 (99.8%) | 4 (0.3%) |
| Foreign Born, Citizen | 3,921 (98.3%) | 70 (1.8%) |
| Foreign Born, not a Citizen | 1,774 (90.5%) | 187 (9.5%) |
Health Insurance Coverage by Household Income in Orleans County
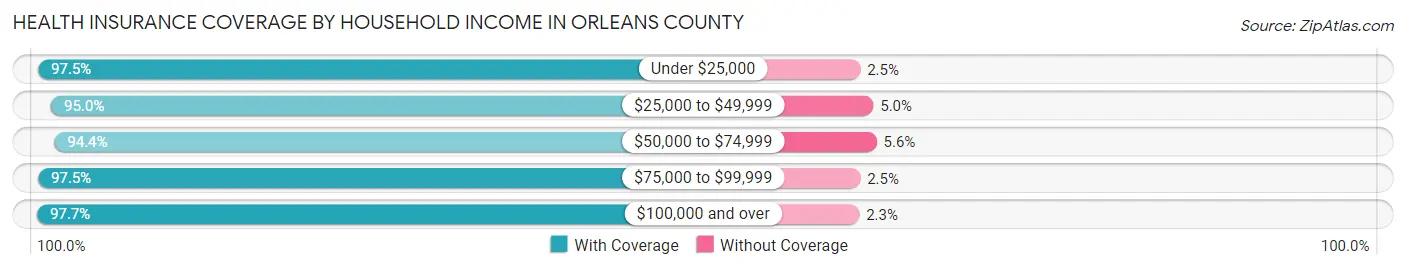
| Household Income | With Coverage | Without Coverage |
| Under $25,000 | 2,758 (97.5%) | 71 (2.5%) |
| $25,000 to $49,999 | 4,923 (95.0%) | 257 (5.0%) |
| $50,000 to $74,999 | 4,452 (94.4%) | 263 (5.6%) |
| $75,000 to $99,999 | 4,356 (97.5%) | 112 (2.5%) |
| $100,000 and over | 9,135 (97.7%) | 217 (2.3%) |
Public vs Private Health Insurance Coverage by Age in Orleans County
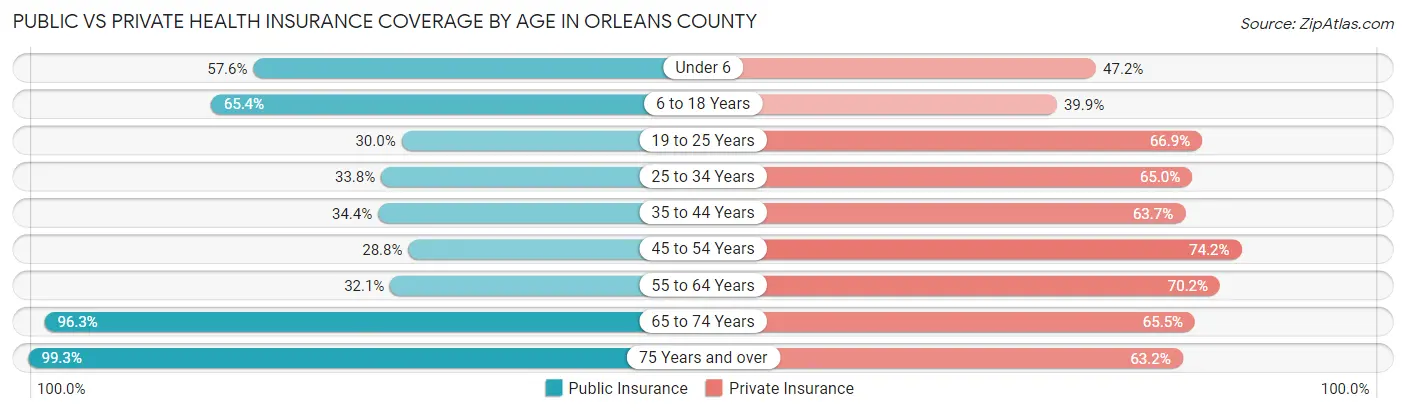
| Age Bracket | Public Insurance | Private Insurance |
| Under 6 | 907 (57.6%) | 744 (47.2%) |
| 6 to 18 Years | 2,611 (65.4%) | 1,594 (39.9%) |
| 19 to 25 Years | 589 (30.0%) | 1,311 (66.8%) |
| 25 to 34 Years | 920 (33.8%) | 1,768 (65.0%) |
| 35 to 44 Years | 1,035 (34.4%) | 1,917 (63.7%) |
| 45 to 54 Years | 987 (28.8%) | 2,543 (74.2%) |
| 55 to 64 Years | 1,282 (32.1%) | 2,799 (70.2%) |
| 65 to 74 Years | 3,656 (96.3%) | 2,488 (65.5%) |
| 75 Years and over | 2,270 (99.3%) | 1,446 (63.2%) |
| Total | 14,257 (53.3%) | 16,610 (62.1%) |
Disability Status by Sex by Age in Orleans County
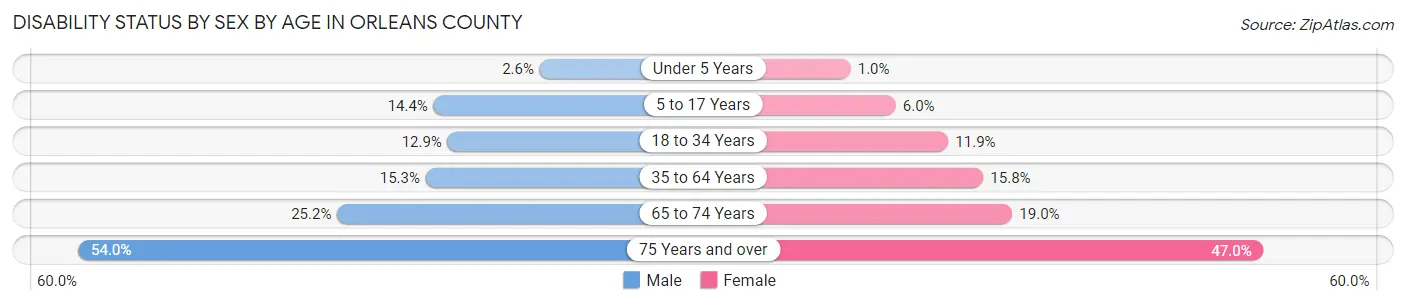
| Age Bracket | Male | Female |
| Under 5 Years | 18 (2.6%) | 6 (1.0%) |
| 5 to 17 Years | 298 (14.4%) | 119 (6.0%) |
| 18 to 34 Years | 325 (12.9%) | 284 (11.9%) |
| 35 to 64 Years | 801 (15.3%) | 820 (15.8%) |
| 65 to 74 Years | 464 (25.2%) | 371 (19.0%) |
| 75 Years and over | 602 (54.0%) | 551 (47.0%) |
Disability Class by Sex by Age in Orleans County
Disability Class: Hearing Difficulty
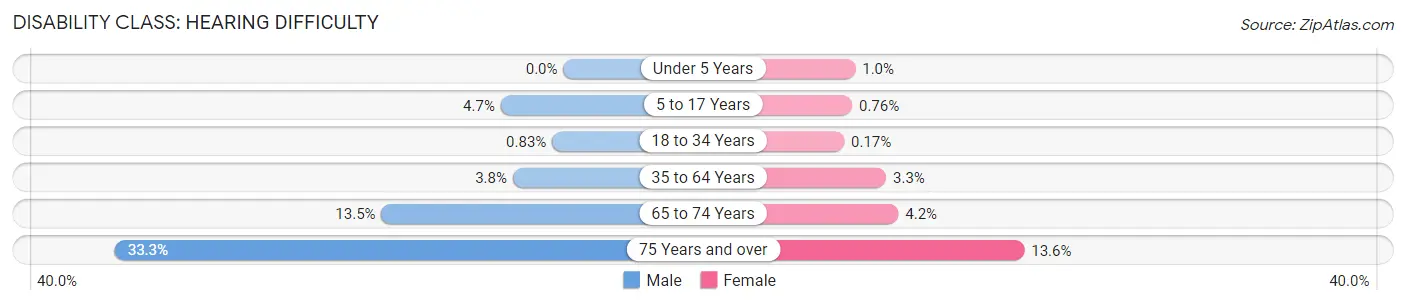
| Age Bracket | Male | Female |
| Under 5 Years | 0 (0.0%) | 6 (1.0%) |
| 5 to 17 Years | 96 (4.6%) | 15 (0.8%) |
| 18 to 34 Years | 21 (0.8%) | 4 (0.2%) |
| 35 to 64 Years | 196 (3.7%) | 171 (3.3%) |
| 65 to 74 Years | 249 (13.5%) | 82 (4.2%) |
| 75 Years and over | 371 (33.3%) | 159 (13.6%) |
Disability Class: Vision Difficulty
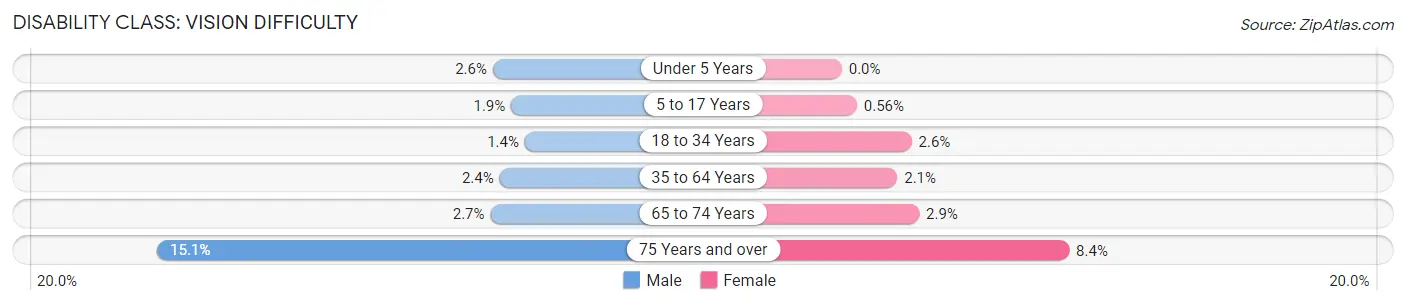
| Age Bracket | Male | Female |
| Under 5 Years | 18 (2.6%) | 0 (0.0%) |
| 5 to 17 Years | 40 (1.9%) | 11 (0.6%) |
| 18 to 34 Years | 36 (1.4%) | 62 (2.6%) |
| 35 to 64 Years | 124 (2.4%) | 107 (2.1%) |
| 65 to 74 Years | 50 (2.7%) | 56 (2.9%) |
| 75 Years and over | 168 (15.1%) | 99 (8.4%) |
Disability Class: Cognitive Difficulty
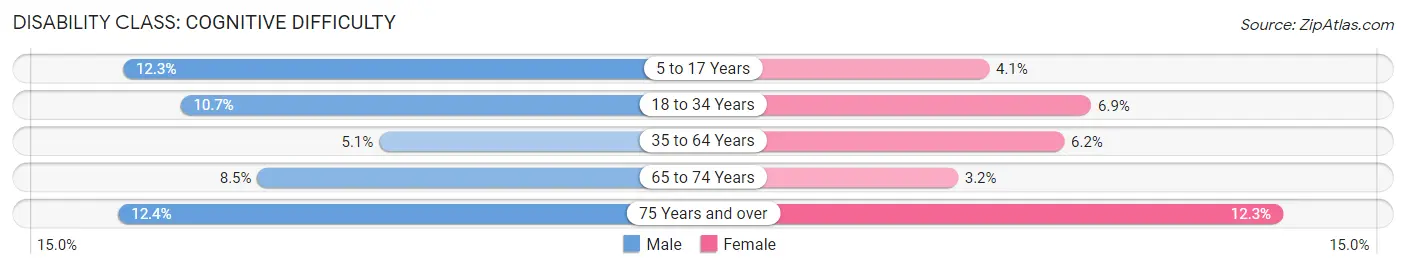
| Age Bracket | Male | Female |
| 5 to 17 Years | 253 (12.3%) | 81 (4.1%) |
| 18 to 34 Years | 269 (10.7%) | 166 (6.9%) |
| 35 to 64 Years | 268 (5.1%) | 322 (6.2%) |
| 65 to 74 Years | 157 (8.5%) | 63 (3.2%) |
| 75 Years and over | 138 (12.4%) | 144 (12.3%) |
Disability Class: Ambulatory Difficulty
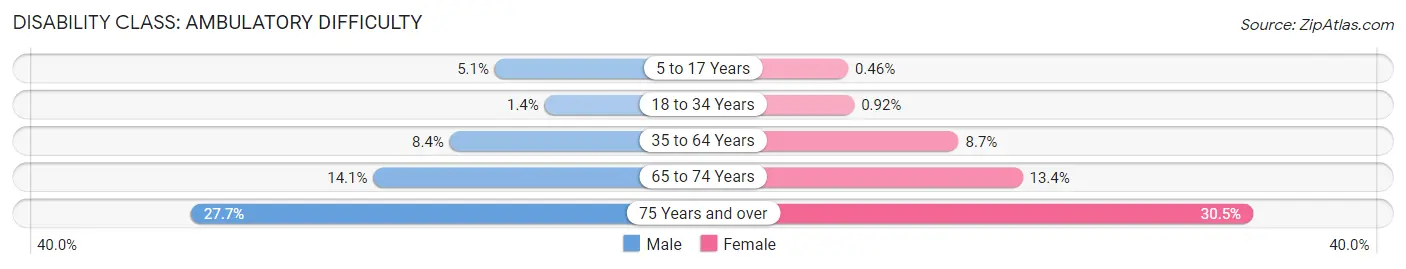
| Age Bracket | Male | Female |
| 5 to 17 Years | 105 (5.1%) | 9 (0.5%) |
| 18 to 34 Years | 35 (1.4%) | 22 (0.9%) |
| 35 to 64 Years | 441 (8.4%) | 451 (8.7%) |
| 65 to 74 Years | 260 (14.1%) | 262 (13.4%) |
| 75 Years and over | 308 (27.7%) | 358 (30.5%) |
Disability Class: Self-Care Difficulty
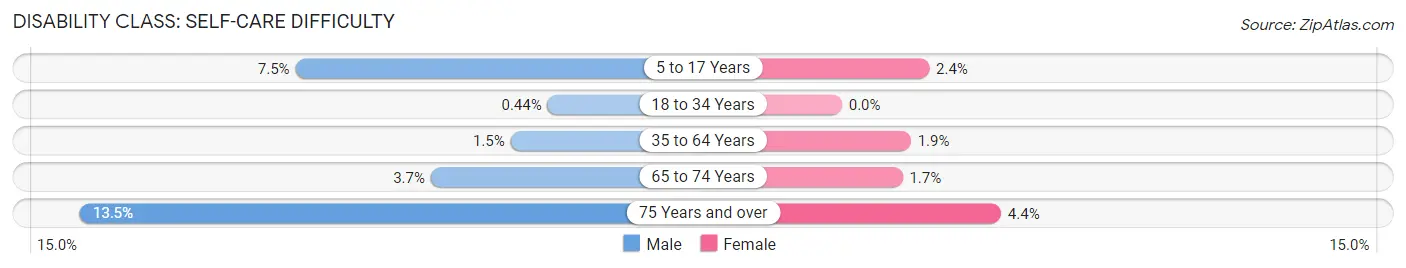
| Age Bracket | Male | Female |
| 5 to 17 Years | 154 (7.5%) | 48 (2.4%) |
| 18 to 34 Years | 11 (0.4%) | 0 (0.0%) |
| 35 to 64 Years | 77 (1.5%) | 100 (1.9%) |
| 65 to 74 Years | 68 (3.7%) | 33 (1.7%) |
| 75 Years and over | 150 (13.5%) | 52 (4.4%) |
Technology Access in Orleans County
Computing Device Access in Orleans County
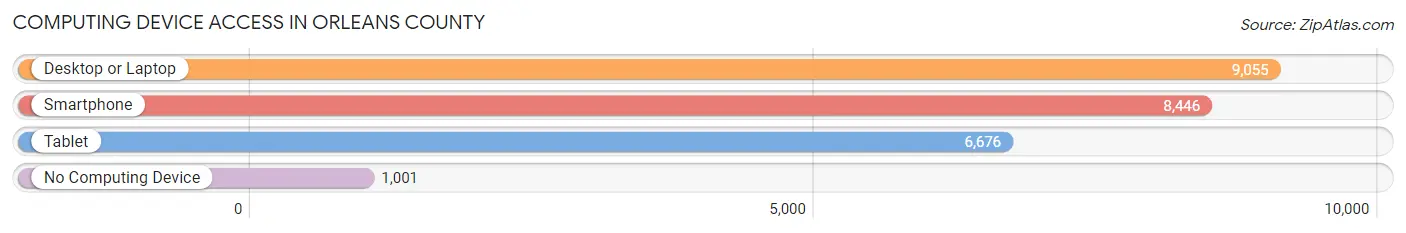
| Device Type | # Households | % Households |
| Desktop or Laptop | 9,055 | 78.5% |
| Smartphone | 8,446 | 73.3% |
| Tablet | 6,676 | 57.9% |
| No Computing Device | 1,001 | 8.7% |
| Total | 11,528 | 100.0% |
Internet Access in Orleans County
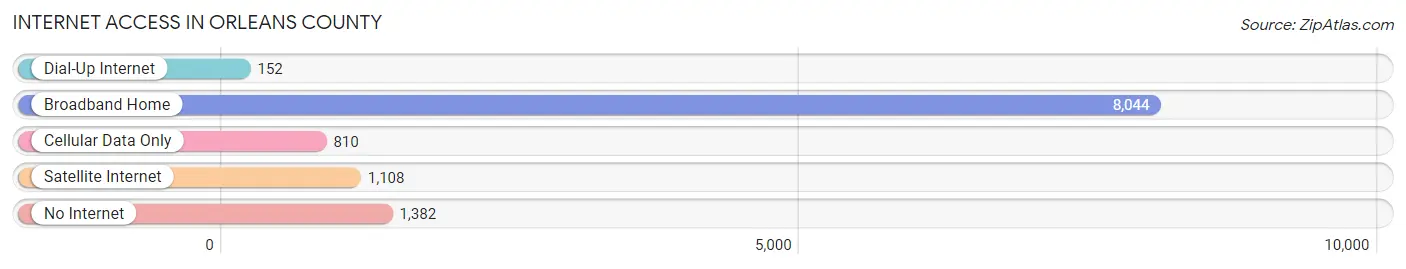
| Internet Type | # Households | % Households |
| Dial-Up Internet | 152 | 1.3% |
| Broadband Home | 8,044 | 69.8% |
| Cellular Data Only | 810 | 7.0% |
| Satellite Internet | 1,108 | 9.6% |
| No Internet | 1,382 | 12.0% |
| Total | 11,528 | 100.0% |
Orleans County Summary
Orleans County, Vermont is located in the northeastern corner of the state and is bordered by Canada to the north, Caledonia County to the east, Lamoille County to the south, and Franklin County to the west. The county seat is the town of Newport, and the county is home to a total of 24 towns and two gores. Orleans County is the second least populous county in Vermont, with a population of 27,231 as of the 2010 census.
Geography
Orleans County is located in the northeastern corner of Vermont and is bordered by Canada to the north, Caledonia County to the east, Lamoille County to the south, and Franklin County to the west. The county is located in the Green Mountains region of Vermont and is home to several mountain peaks, including Mount Pisgah, Mount Hor, and Mount Orne. The highest point in the county is the summit of Mount Orne, which stands at 3,890 feet. The county is also home to several rivers and streams, including the Barton, Clyde, and Missisquoi Rivers.
The county is divided into 24 towns and two gores. The towns are Albany, Barton, Brownington, Charleston, Coventry, Craftsbury, Derby, Glover, Greensboro, Holland, Irasburg, Jay, Lowell, Newport, Troy, Westfield, and Westmore. The two gores are Goss Hollow and Norton.
Economy
The economy of Orleans County is largely based on agriculture, forestry, and tourism. The county is home to several dairy farms, as well as a number of apple orchards and maple syrup producers. The county is also home to several sawmills and lumber companies, which produce a variety of wood products.
Tourism is also an important part of the economy of Orleans County. The county is home to several ski resorts, including Burke Mountain, Jay Peak, and Mount Orne. The county is also home to several state parks, including Brighton State Park, Groton State Forest, and Willoughby State Forest.
Demographics
As of the 2010 census, the population of Orleans County was 27,231. The population is largely white (96.2%), with small percentages of African Americans (1.2%), Native Americans (0.5%), Asians (0.4%), and other races (1.7%). The median household income in the county is $45,845, and the median age is 44.7 years.
Conclusion
Orleans County, Vermont is located in the northeastern corner of the state and is bordered by Canada to the north, Caledonia County to the east, Lamoille County to the south, and Franklin County to the west. The county is home to 24 towns and two gores, and the county seat is the town of Newport. The economy of Orleans County is largely based on agriculture, forestry, and tourism, and the population of the county is 27,231 as of the 2010 census. The population is largely white, with small percentages of African Americans, Native Americans, Asians, and other races. The median household income in the county is $45,845, and the median age is 44.7 years.
Common Questions
What is the Total Population of Orleans County?
Total Population of Orleans County is 27,459.
What is the Total Male Population of Orleans County?
Total Male Population of Orleans County is 13,899.
What is the Total Female Population of Orleans County?
Total Female Population of Orleans County is 13,560.
What is the Ratio of Males per 100 Females in Orleans County?
There are 102.50 Males per 100 Females in Orleans County.
What is the Ratio of Females per 100 Males in Orleans County?
There are 97.56 Females per 100 Males in Orleans County.
What is the Median Population Age in Orleans County?
Median Population Age in Orleans County is 45.6 Years.
What is the Average Family Size in Orleans County
Average Family Size in Orleans County is 2.9 People.
What is the Average Household Size in Orleans County
Average Household Size in Orleans County is 2.3 People.
What is Per Capita Income in Orleans County?
Per Capita income in Orleans County is $34,365.
What is the Median Family Income in Orleans County?
Median Family Income in Orleans County is $79,806.
What is the Median Household income in Orleans County?
Median Household Income in Orleans County is $63,981.
What is Income or Wage Gap in Orleans County?
Income or Wage Gap in Orleans County is 17.8%.
Women in Orleans County earn 82.2 cents for every dollar earned by a man.
What is Family Income Deficit in Orleans County?
Family Income Deficit in Orleans County is $8,947.
Families that are below poverty line in Orleans County earn $8,947 less on average than the poverty threshold level.
What is Inequality or Gini Index in Orleans County?
Inequality or Gini Index in Orleans County is 0.42.
How Large is the Labor Force in Orleans County?
There are 14,228 People in the Labor Forcein in Orleans County.
What is the Percentage of People in the Labor Force in Orleans County?
62.4% of People are in the Labor Force in Orleans County.
What is the Unemployment Rate in Orleans County?
Unemployment Rate in Orleans County is 6.1%.