Orange County, VT
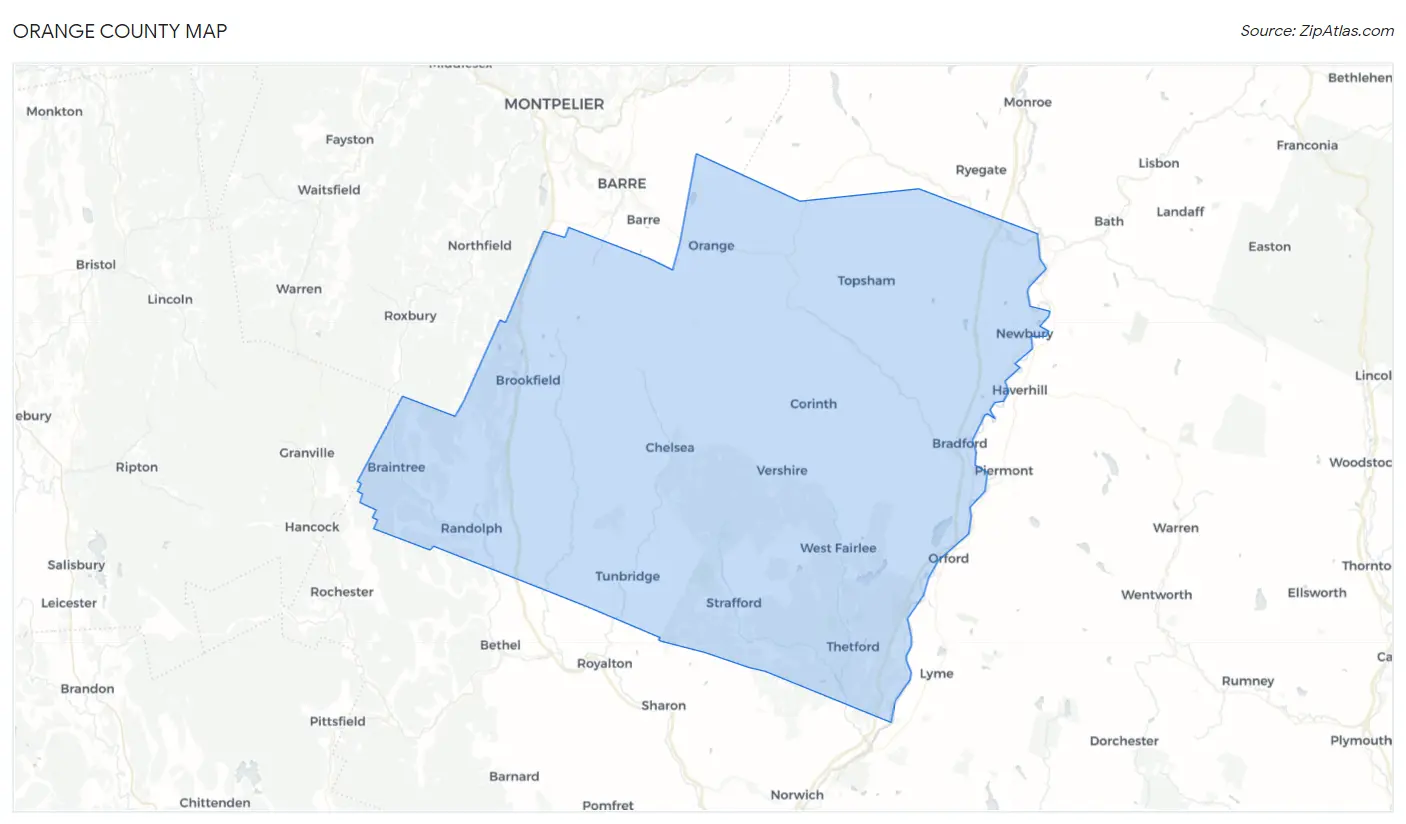
Orange County Map
Orange County Overview
29,439
TOTAL POPULATION
14,820
MALE POPULATION
14,619
FEMALE POPULATION
101.37
MALES / 100 FEMALES
98.64
FEMALES / 100 MALES
46.6
MEDIAN AGE
2.7
AVG FAMILY SIZE
2.3
AVG HOUSEHOLD SIZE
$38,709
PER CAPITA INCOME
$87,560
AVG FAMILY INCOME
$74,534
AVG HOUSEHOLD INCOME
14.5%
WAGE / INCOME GAP [ % ]
85.5¢/ $1
WAGE / INCOME GAP [ $ ]
$7,216
FAMILY INCOME DEFICIT
0.39
INEQUALITY / GINI INDEX
16,597
LABOR FORCE [ PEOPLE ]
66.8%
PERCENT IN LABOR FORCE
3.1%
UNEMPLOYMENT RATE
Orange County Area Codes
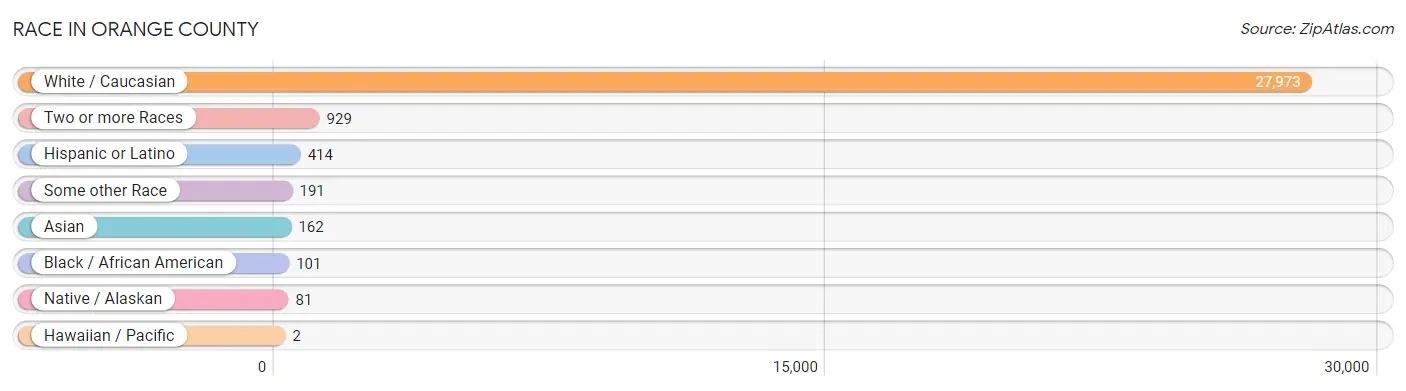
Race in Orange County
The most populous races in Orange County are White / Caucasian (27,973 | 95.0%), Two or more Races (929 | 3.2%), and Hispanic or Latino (414 | 1.4%).
| Race | # Population | % Population |
| Asian | 162 | 0.5% |
| Black / African American | 101 | 0.3% |
| Hawaiian / Pacific | 2 | 0.0% |
| Hispanic or Latino | 414 | 1.4% |
| Native / Alaskan | 81 | 0.3% |
| White / Caucasian | 27,973 | 95.0% |
| Two or more Races | 929 | 3.2% |
| Some other Race | 191 | 0.6% |
| Total | 29,439 | 100.0% |
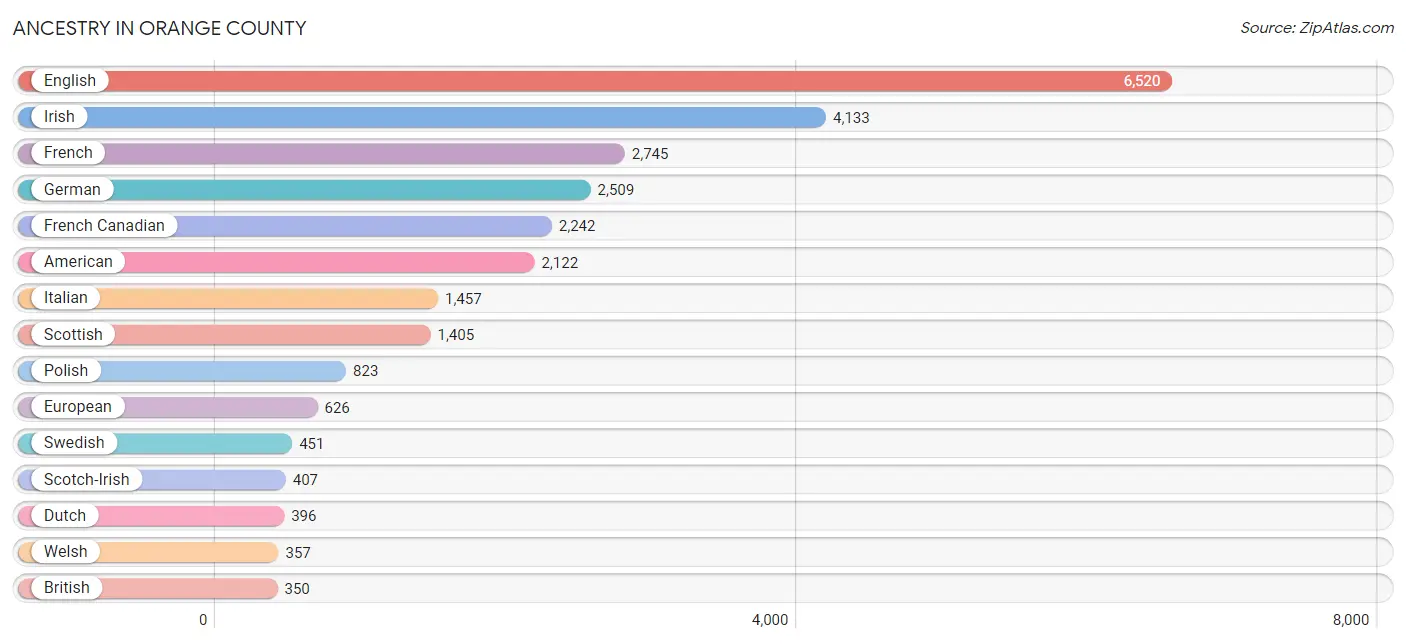
Ancestry in Orange County
The most populous ancestries reported in Orange County are English (6,520 | 22.2%), Irish (4,133 | 14.0%), French (2,745 | 9.3%), German (2,509 | 8.5%), and French Canadian (2,242 | 7.6%), together accounting for 61.7% of all Orange County residents.
| Ancestry | # Population | % Population |
| African | 51 | 0.2% |
| Albanian | 4 | 0.0% |
| American | 2,122 | 7.2% |
| Arab | 34 | 0.1% |
| Armenian | 8 | 0.0% |
| Australian | 9 | 0.0% |
| Austrian | 52 | 0.2% |
| Belgian | 20 | 0.1% |
| Bhutanese | 28 | 0.1% |
| Blackfeet | 51 | 0.2% |
| Bolivian | 5 | 0.0% |
| British | 350 | 1.2% |
| Bulgarian | 4 | 0.0% |
| Burmese | 16 | 0.1% |
| Canadian | 145 | 0.5% |
| Celtic | 21 | 0.1% |
| Central American | 87 | 0.3% |
| Central American Indian | 19 | 0.1% |
| Cherokee | 35 | 0.1% |
| Chilean | 5 | 0.0% |
| Choctaw | 4 | 0.0% |
| Croatian | 20 | 0.1% |
| Czech | 131 | 0.4% |
| Czechoslovakian | 12 | 0.0% |
| Danish | 145 | 0.5% |
| Dominican | 6 | 0.0% |
| Dutch | 396 | 1.3% |
| Eastern European | 148 | 0.5% |
| English | 6,520 | 22.2% |
| European | 626 | 2.1% |
| Filipino | 1 | 0.0% |
| Finnish | 114 | 0.4% |
| French | 2,745 | 9.3% |
| French Canadian | 2,242 | 7.6% |
| German | 2,509 | 8.5% |
| Greek | 168 | 0.6% |
| Guatemalan | 34 | 0.1% |
| Hopi | 1 | 0.0% |
| Hungarian | 62 | 0.2% |
| Icelander | 23 | 0.1% |
| Indian (Asian) | 60 | 0.2% |
| Inupiat | 3 | 0.0% |
| Irish | 4,133 | 14.0% |
| Iroquois | 37 | 0.1% |
| Italian | 1,457 | 5.0% |
| Kenyan | 9 | 0.0% |
| Korean | 43 | 0.2% |
| Latvian | 67 | 0.2% |
| Lebanese | 34 | 0.1% |
| Lithuanian | 64 | 0.2% |
| Mexican | 125 | 0.4% |
| Native Hawaiian | 2 | 0.0% |
| Navajo | 1 | 0.0% |
| New Zealander | 5 | 0.0% |
| Nicaraguan | 41 | 0.1% |
| Nigerian | 39 | 0.1% |
| Northern European | 70 | 0.2% |
| Norwegian | 167 | 0.6% |
| Panamanian | 9 | 0.0% |
| Pennsylvania German | 1 | 0.0% |
| Polish | 823 | 2.8% |
| Portuguese | 176 | 0.6% |
| Puerto Rican | 54 | 0.2% |
| Romanian | 30 | 0.1% |
| Russian | 225 | 0.8% |
| Salvadoran | 3 | 0.0% |
| Samoan | 1 | 0.0% |
| Scandinavian | 47 | 0.2% |
| Scotch-Irish | 407 | 1.4% |
| Scottish | 1,405 | 4.8% |
| Seminole | 4 | 0.0% |
| Serbian | 6 | 0.0% |
| Sioux | 9 | 0.0% |
| Slovak | 18 | 0.1% |
| Slovene | 55 | 0.2% |
| South American | 27 | 0.1% |
| Spaniard | 5 | 0.0% |
| Spanish | 5 | 0.0% |
| Sri Lankan | 63 | 0.2% |
| Subsaharan African | 99 | 0.3% |
| Swedish | 451 | 1.5% |
| Swiss | 83 | 0.3% |
| Thai | 9 | 0.0% |
| Turkish | 5 | 0.0% |
| Ukrainian | 96 | 0.3% |
| Venezuelan | 17 | 0.1% |
| Welsh | 357 | 1.2% |
| Yaqui | 7 | 0.0% | View All 88 Rows |
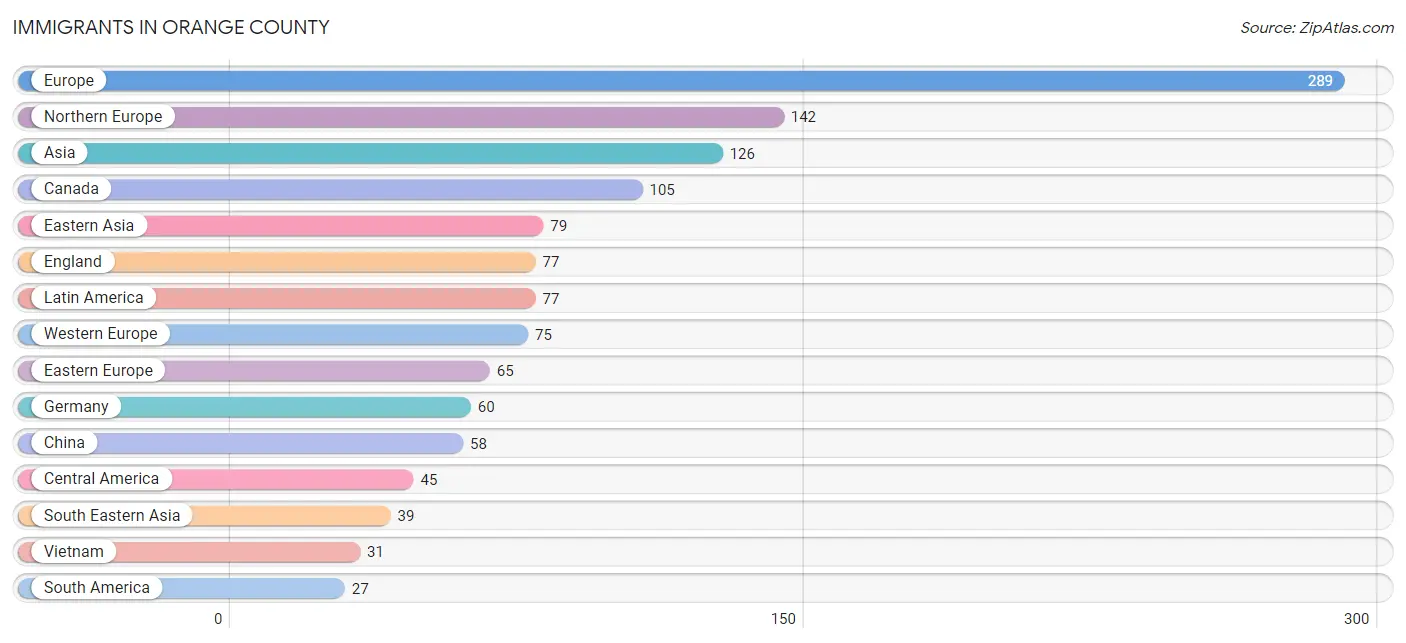
Immigrants in Orange County
The most numerous immigrant groups reported in Orange County came from Europe (289 | 1.0%), Northern Europe (142 | 0.5%), Asia (126 | 0.4%), Canada (105 | 0.4%), and Eastern Asia (79 | 0.3%), together accounting for 2.5% of all Orange County residents.
| Immigration Origin | # Population | % Population |
| Africa | 16 | 0.1% |
| Asia | 126 | 0.4% |
| Belarus | 18 | 0.1% |
| Canada | 105 | 0.4% |
| Caribbean | 5 | 0.0% |
| Central America | 45 | 0.2% |
| Chile | 5 | 0.0% |
| China | 58 | 0.2% |
| Czechoslovakia | 1 | 0.0% |
| Eastern Asia | 79 | 0.3% |
| Eastern Europe | 65 | 0.2% |
| England | 77 | 0.3% |
| Europe | 289 | 1.0% |
| France | 12 | 0.0% |
| Germany | 60 | 0.2% |
| Guatemala | 24 | 0.1% |
| India | 5 | 0.0% |
| Italy | 7 | 0.0% |
| Japan | 9 | 0.0% |
| Korea | 12 | 0.0% |
| Latin America | 77 | 0.3% |
| Mexico | 18 | 0.1% |
| Morocco | 13 | 0.0% |
| Nepal | 3 | 0.0% |
| Netherlands | 3 | 0.0% |
| Northern Africa | 13 | 0.0% |
| Northern Europe | 142 | 0.5% |
| Oceania | 17 | 0.1% |
| Panama | 3 | 0.0% |
| Philippines | 8 | 0.0% |
| Poland | 3 | 0.0% |
| Romania | 4 | 0.0% |
| Russia | 19 | 0.1% |
| South Africa | 3 | 0.0% |
| South America | 27 | 0.1% |
| South Central Asia | 8 | 0.0% |
| South Eastern Asia | 39 | 0.1% |
| Southern Europe | 7 | 0.0% |
| Taiwan | 1 | 0.0% |
| Trinidad and Tobago | 5 | 0.0% |
| Ukraine | 20 | 0.1% |
| Venezuela | 14 | 0.1% |
| Vietnam | 31 | 0.1% |
| Western Europe | 75 | 0.3% | View All 44 Rows |
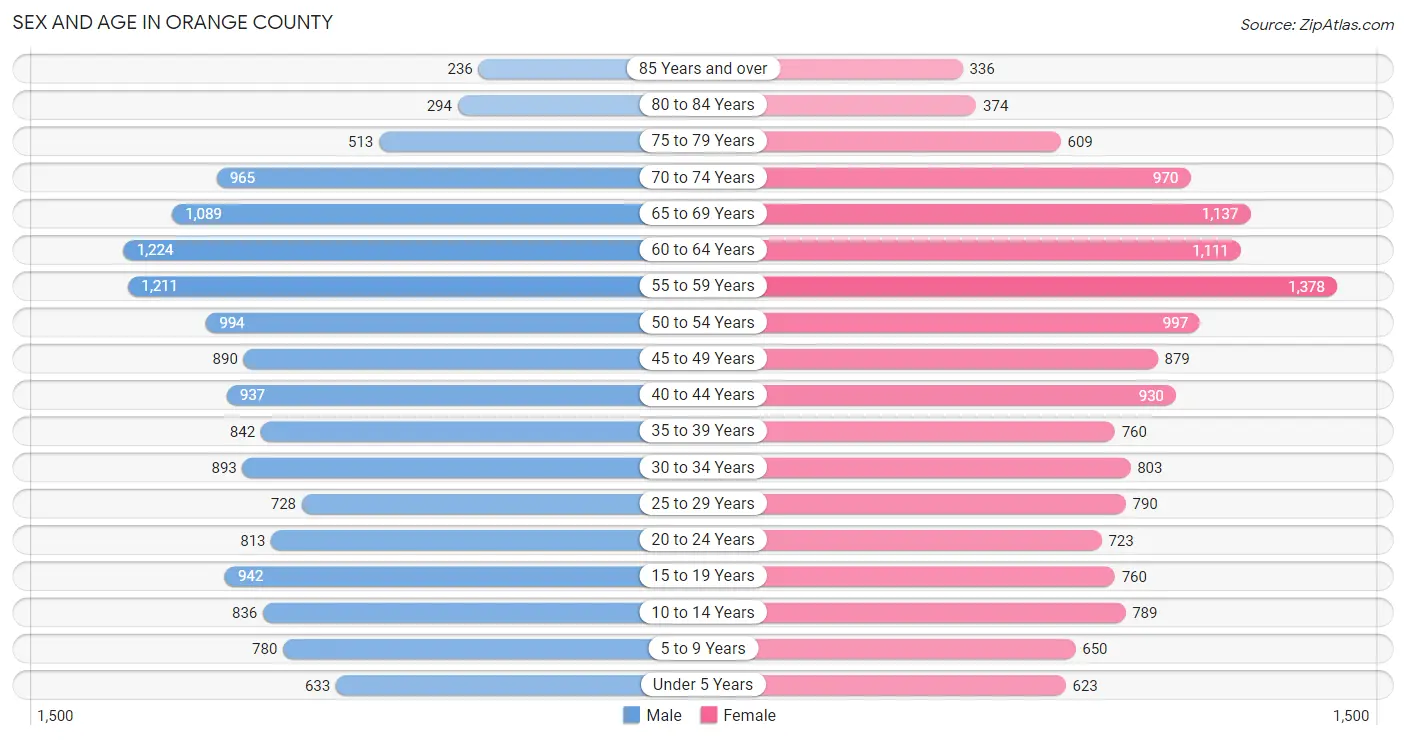
Sex and Age in Orange County
Sex and Age in Orange County
The most populous age groups in Orange County are 60 to 64 Years (1,224 | 8.3%) for men and 55 to 59 Years (1,378 | 9.4%) for women.
| Age Bracket | Male | Female |
| Under 5 Years | 633 (4.3%) | 623 (4.3%) |
| 5 to 9 Years | 780 (5.3%) | 650 (4.4%) |
| 10 to 14 Years | 836 (5.6%) | 789 (5.4%) |
| 15 to 19 Years | 942 (6.4%) | 760 (5.2%) |
| 20 to 24 Years | 813 (5.5%) | 723 (5.0%) |
| 25 to 29 Years | 728 (4.9%) | 790 (5.4%) |
| 30 to 34 Years | 893 (6.0%) | 803 (5.5%) |
| 35 to 39 Years | 842 (5.7%) | 760 (5.2%) |
| 40 to 44 Years | 937 (6.3%) | 930 (6.4%) |
| 45 to 49 Years | 890 (6.0%) | 879 (6.0%) |
| 50 to 54 Years | 994 (6.7%) | 997 (6.8%) |
| 55 to 59 Years | 1,211 (8.2%) | 1,378 (9.4%) |
| 60 to 64 Years | 1,224 (8.3%) | 1,111 (7.6%) |
| 65 to 69 Years | 1,089 (7.3%) | 1,137 (7.8%) |
| 70 to 74 Years | 965 (6.5%) | 970 (6.6%) |
| 75 to 79 Years | 513 (3.5%) | 609 (4.2%) |
| 80 to 84 Years | 294 (2.0%) | 374 (2.6%) |
| 85 Years and over | 236 (1.6%) | 336 (2.3%) |
| Total | 14,820 (100.0%) | 14,619 (100.0%) |
Families and Households in Orange County
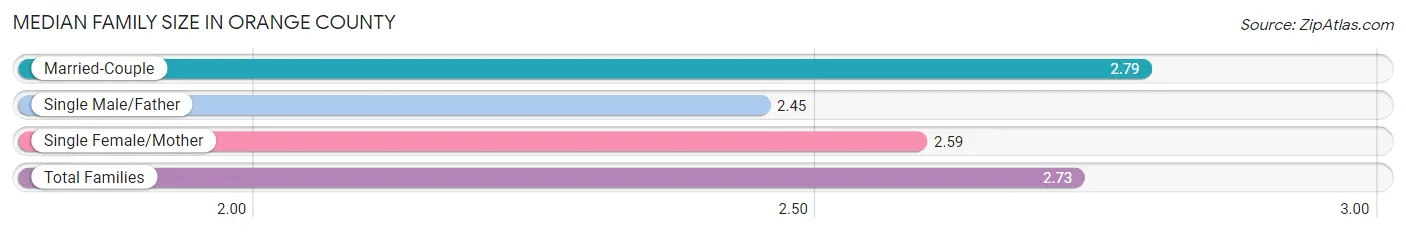
Median Family Size in Orange County
The median family size in Orange County is 2.73 persons per family, with married-couple families (6,241 | 76.9%) accounting for the largest median family size of 2.79 persons per family. On the other hand, single male/father families (744 | 9.2%) represent the smallest median family size with 2.45 persons per family.
| Family Type | # Families | Family Size |
| Married-Couple | 6,241 (76.9%) | 2.79 |
| Single Male/Father | 744 (9.2%) | 2.45 |
| Single Female/Mother | 1,125 (13.9%) | 2.59 |
| Total Families | 8,110 (100.0%) | 2.73 |
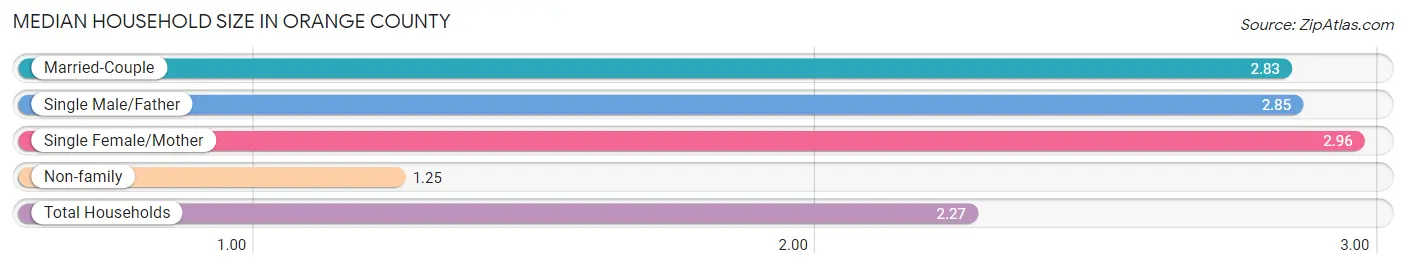
Median Household Size in Orange County
The median household size in Orange County is 2.27 persons per household, with single female/mother households (1,125 | 8.9%) accounting for the largest median household size of 2.96 persons per household. non-family households (4,580 | 36.1%) represent the smallest median household size with 1.25 persons per household.
| Household Type | # Households | Household Size |
| Married-Couple | 6,241 (49.2%) | 2.83 |
| Single Male/Father | 744 (5.9%) | 2.85 |
| Single Female/Mother | 1,125 (8.9%) | 2.96 |
| Non-family | 4,580 (36.1%) | 1.25 |
| Total Households | 12,690 (100.0%) | 2.27 |
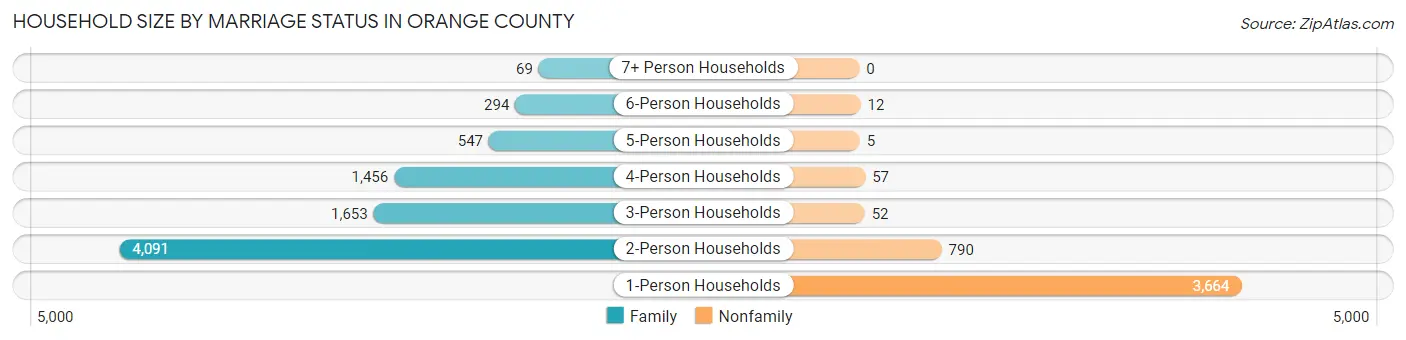
Household Size by Marriage Status in Orange County
Out of a total of 12,690 households in Orange County, 8,110 (63.9%) are family households, while 4,580 (36.1%) are nonfamily households. The most numerous type of family households are 2-person households, comprising 4,091, and the most common type of nonfamily households are 1-person households, comprising 3,664.
| Household Size | Family Households | Nonfamily Households |
| 1-Person Households | - | 3,664 (28.9%) |
| 2-Person Households | 4,091 (32.2%) | 790 (6.2%) |
| 3-Person Households | 1,653 (13.0%) | 52 (0.4%) |
| 4-Person Households | 1,456 (11.5%) | 57 (0.4%) |
| 5-Person Households | 547 (4.3%) | 5 (0.0%) |
| 6-Person Households | 294 (2.3%) | 12 (0.1%) |
| 7+ Person Households | 69 (0.5%) | 0 (0.0%) |
| Total | 8,110 (63.9%) | 4,580 (36.1%) |
Female Fertility in Orange County
Fertility by Age in Orange County
Average fertility rate in Orange County is 45.0 births per 1,000 women. Women in the age bracket of 20 to 34 years have the highest fertility rate with 82.0 births per 1,000 women. Women in the age bracket of 20 to 34 years acount for 72.9% of all women with births.
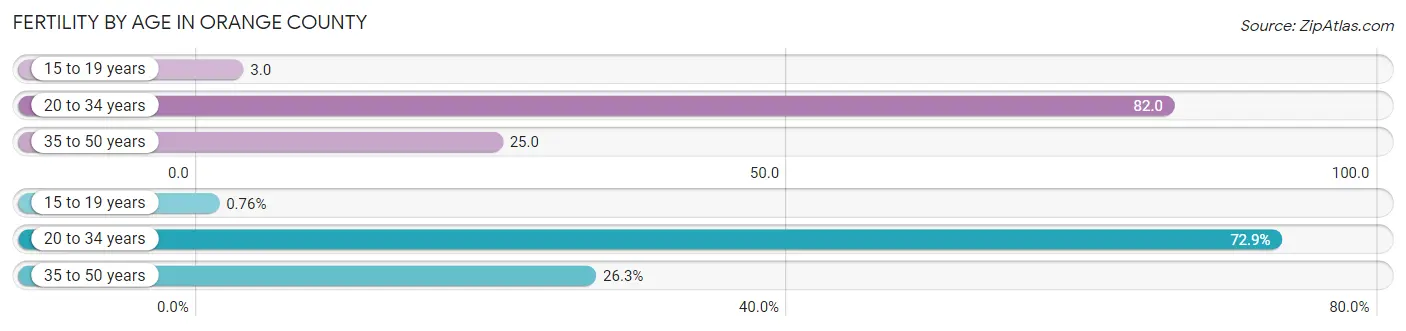
| Age Bracket | Women with Births | Births / 1,000 Women |
| 15 to 19 years | 2 (0.8%) | 3.0 |
| 20 to 34 years | 191 (72.9%) | 82.0 |
| 35 to 50 years | 69 (26.3%) | 25.0 |
| Total | 262 (100.0%) | 45.0 |
Fertility by Age by Marriage Status in Orange County
71.0% of women with births (262) in Orange County are married. The highest percentage of unmarried women with births falls into 15 to 19 years age bracket with 100.0% of them unmarried at the time of birth, while the lowest percentage of unmarried women with births belong to 35 to 50 years age bracket with 4.3% of them unmarried.
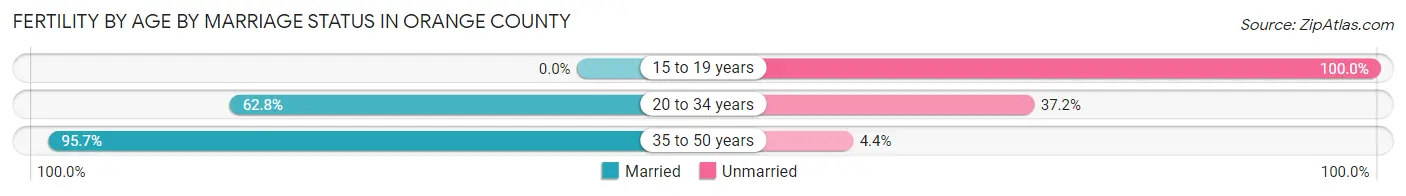
| Age Bracket | Married | Unmarried |
| 15 to 19 years | 0 (0.0%) | 2 (100.0%) |
| 20 to 34 years | 120 (62.8%) | 71 (37.2%) |
| 35 to 50 years | 66 (95.7%) | 3 (4.3%) |
| Total | 186 (71.0%) | 76 (29.0%) |
Fertility by Education in Orange County
Average fertility rate in Orange County is 45.0 births per 1,000 women. Women with the education attainment of graduate degree have the highest fertility rate of 74.0 births per 1,000 women, while women with the education attainment of less than high school have the lowest fertility at 4.0 births per 1,000 women. Women with the education attainment of college or associate's degree represent 38.2% of all women with births.
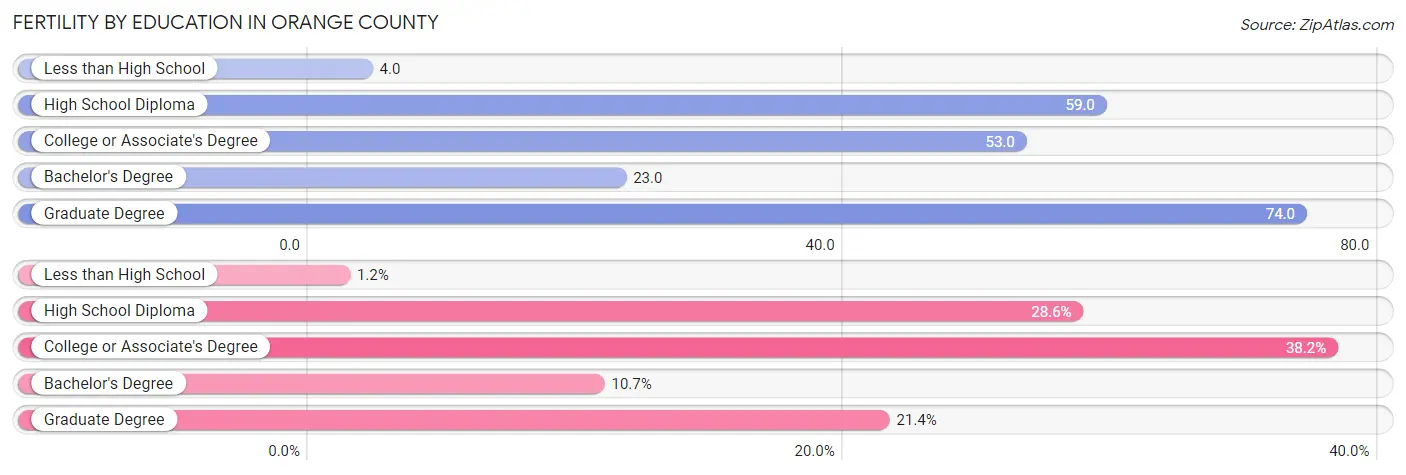
| Educational Attainment | Women with Births | Births / 1,000 Women |
| Less than High School | 3 (1.1%) | 4.0 |
| High School Diploma | 75 (28.6%) | 59.0 |
| College or Associate's Degree | 100 (38.2%) | 53.0 |
| Bachelor's Degree | 28 (10.7%) | 23.0 |
| Graduate Degree | 56 (21.4%) | 74.0 |
| Total | 262 (100.0%) | 45.0 |
Fertility by Education by Marriage Status in Orange County
29.0% of women with births in Orange County are unmarried. Women with the educational attainment of bachelor's degree are most likely to be married with 100.0% of them married at childbirth, while women with the educational attainment of high school diploma are least likely to be married with 76.0% of them unmarried at childbirth.
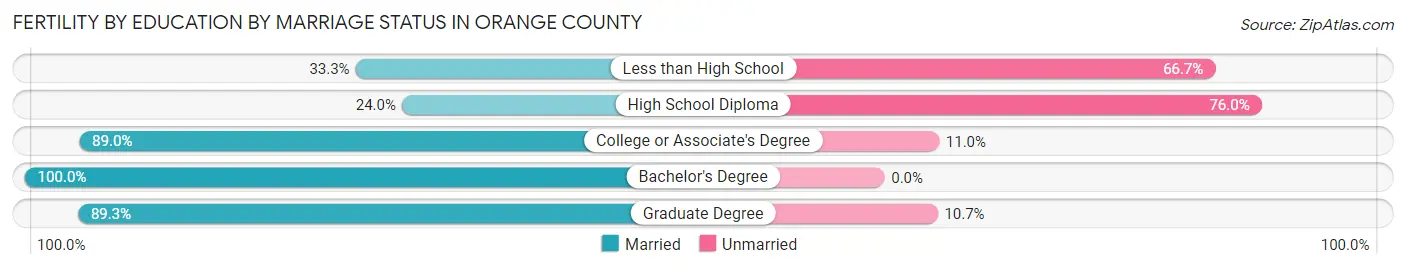
| Educational Attainment | Married | Unmarried |
| Less than High School | 1 (33.3%) | 2 (66.7%) |
| High School Diploma | 18 (24.0%) | 57 (76.0%) |
| College or Associate's Degree | 89 (89.0%) | 11 (11.0%) |
| Bachelor's Degree | 28 (100.0%) | 0 (0.0%) |
| Graduate Degree | 50 (89.3%) | 6 (10.7%) |
| Total | 186 (71.0%) | 76 (29.0%) |
Income in Orange County
Income Overview in Orange County
Per Capita Income in Orange County is $38,709, while median incomes of families and households are $87,560 and $74,534 respectively.
| Characteristic | Number | Measure |
| Per Capita Income | 29,439 | $38,709 |
| Median Family Income | 8,110 | $87,560 |
| Mean Family Income | 8,110 | $101,963 |
| Median Household Income | 12,690 | $74,534 |
| Mean Household Income | 12,690 | $89,027 |
| Income Deficit | 8,110 | $7,216 |
| Wage / Income Gap (%) | 29,439 | 14.48% |
| Wage / Income Gap ($) | 29,439 | 85.52¢ per $1 |
| Gini / Inequality Index | 29,439 | 0.39 |
Earnings by Sex in Orange County
Average Earnings in Orange County are $40,186, $44,302 for men and $37,885 for women, a difference of 14.5%.
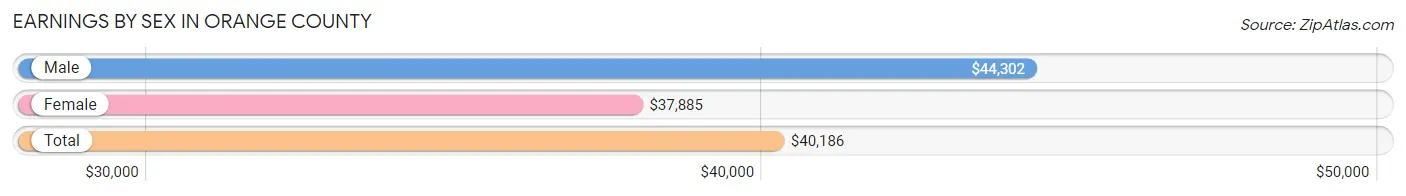
| Sex | Number | Average Earnings |
| Male | 9,124 (51.6%) | $44,302 |
| Female | 8,552 (48.4%) | $37,885 |
| Total | 17,676 (100.0%) | $40,186 |
Earnings by Sex by Income Bracket in Orange County
The most common earnings brackets in Orange County are $55,000 to $64,999 for men (998 | 10.9%) and $55,000 to $64,999 for women (769 | 9.0%).
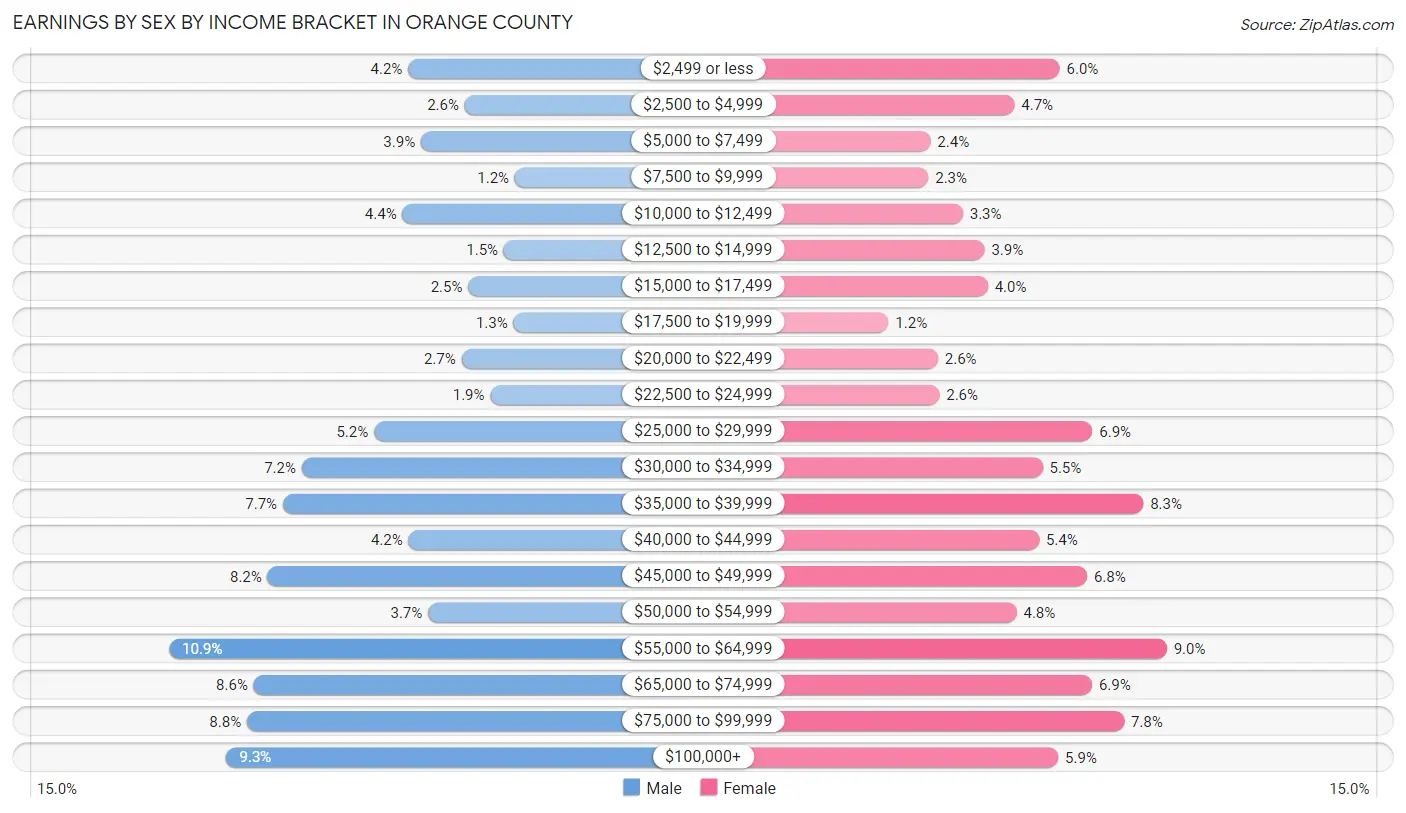
| Income | Male | Female |
| $2,499 or less | 385 (4.2%) | 511 (6.0%) |
| $2,500 to $4,999 | 240 (2.6%) | 403 (4.7%) |
| $5,000 to $7,499 | 352 (3.9%) | 201 (2.4%) |
| $7,500 to $9,999 | 111 (1.2%) | 196 (2.3%) |
| $10,000 to $12,499 | 400 (4.4%) | 279 (3.3%) |
| $12,500 to $14,999 | 140 (1.5%) | 331 (3.9%) |
| $15,000 to $17,499 | 231 (2.5%) | 339 (4.0%) |
| $17,500 to $19,999 | 115 (1.3%) | 100 (1.2%) |
| $20,000 to $22,499 | 248 (2.7%) | 219 (2.6%) |
| $22,500 to $24,999 | 174 (1.9%) | 222 (2.6%) |
| $25,000 to $29,999 | 473 (5.2%) | 590 (6.9%) |
| $30,000 to $34,999 | 658 (7.2%) | 470 (5.5%) |
| $35,000 to $39,999 | 706 (7.7%) | 712 (8.3%) |
| $40,000 to $44,999 | 384 (4.2%) | 462 (5.4%) |
| $45,000 to $49,999 | 745 (8.2%) | 577 (6.8%) |
| $50,000 to $54,999 | 334 (3.7%) | 408 (4.8%) |
| $55,000 to $64,999 | 998 (10.9%) | 769 (9.0%) |
| $65,000 to $74,999 | 781 (8.6%) | 589 (6.9%) |
| $75,000 to $99,999 | 798 (8.7%) | 666 (7.8%) |
| $100,000+ | 851 (9.3%) | 508 (5.9%) |
| Total | 9,124 (100.0%) | 8,552 (100.0%) |
Earnings by Sex by Educational Attainment in Orange County
Average earnings in Orange County are $47,389 for men and $41,973 for women, a difference of 11.4%. Men with an educational attainment of graduate degree enjoy the highest average annual earnings of $68,130, while those with less than high school education earn the least with $33,006. Women with an educational attainment of graduate degree earn the most with the average annual earnings of $62,163, while those with high school diploma education have the smallest earnings of $35,587.
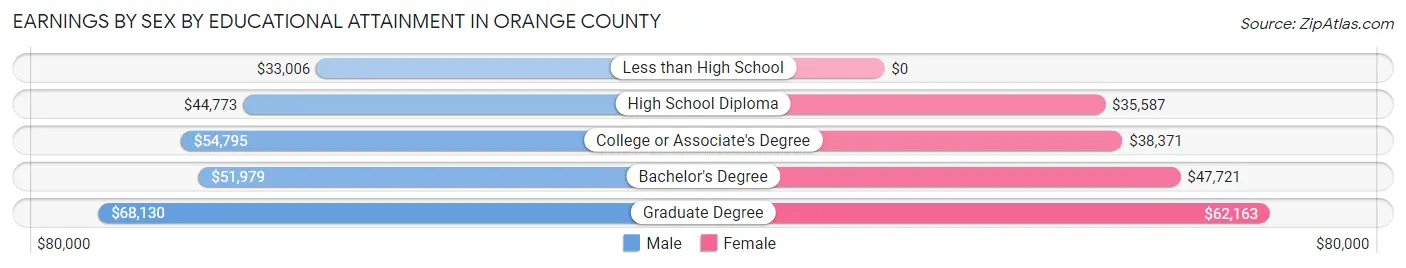
| Educational Attainment | Male Income | Female Income |
| Less than High School | $33,006 | $0 |
| High School Diploma | $44,773 | $35,587 |
| College or Associate's Degree | $54,795 | $38,371 |
| Bachelor's Degree | $51,979 | $47,721 |
| Graduate Degree | $68,130 | $62,163 |
| Total | $47,389 | $41,973 |
Family Income in Orange County
Family Income Brackets in Orange County
According to the Orange County family income data, there are 1,930 families falling into the $100,000 to $149,999 income range, which is the most common income bracket and makes up 23.8% of all families. Conversely, the less than $10,000 income bracket is the least frequent group with only 89 families (1.1%) belonging to this category.
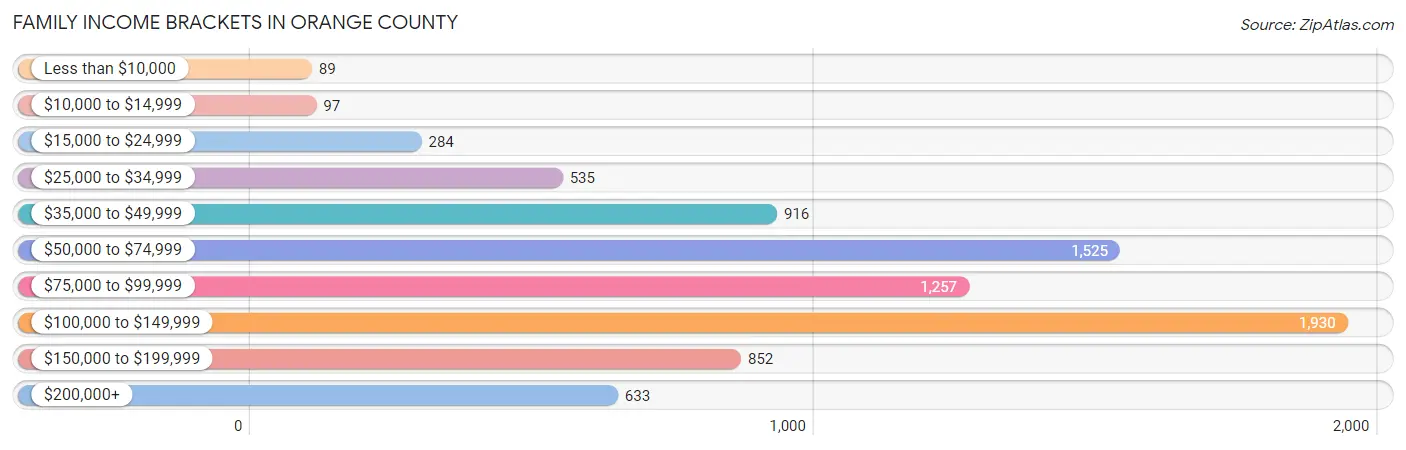
| Income Bracket | # Families | % Families |
| Less than $10,000 | 89 | 1.1% |
| $10,000 to $14,999 | 97 | 1.2% |
| $15,000 to $24,999 | 284 | 3.5% |
| $25,000 to $34,999 | 535 | 6.6% |
| $35,000 to $49,999 | 916 | 11.3% |
| $50,000 to $74,999 | 1,525 | 18.8% |
| $75,000 to $99,999 | 1,257 | 15.5% |
| $100,000 to $149,999 | 1,930 | 23.8% |
| $150,000 to $199,999 | 852 | 10.5% |
| $200,000+ | 633 | 7.8% |
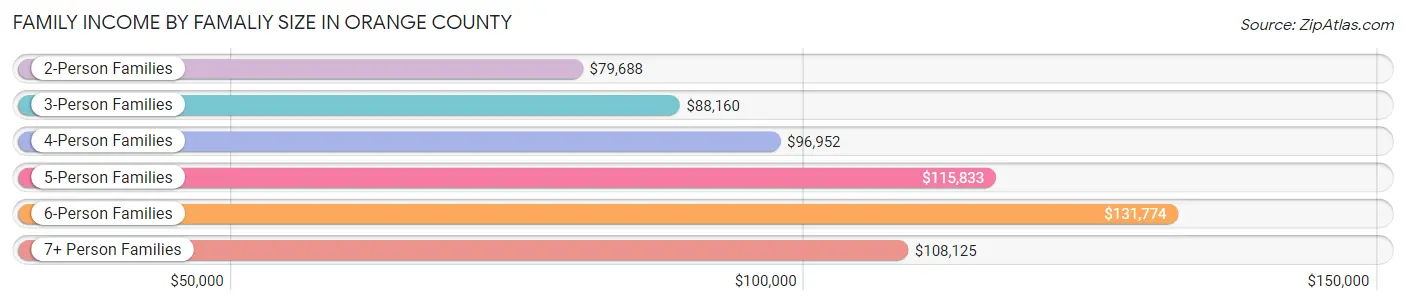
Family Income by Famaliy Size in Orange County
6-person families (256 | 3.2%) account for the highest median family income in Orange County with $131,774 per family, while 2-person families (4,426 | 54.6%) have the highest median income of $39,844 per family member.
| Income Bracket | # Families | Median Income |
| 2-Person Families | 4,426 (54.6%) | $79,688 |
| 3-Person Families | 1,704 (21.0%) | $88,160 |
| 4-Person Families | 1,181 (14.6%) | $96,952 |
| 5-Person Families | 516 (6.4%) | $115,833 |
| 6-Person Families | 256 (3.2%) | $131,774 |
| 7+ Person Families | 27 (0.3%) | $108,125 |
| Total | 8,110 (100.0%) | $87,560 |
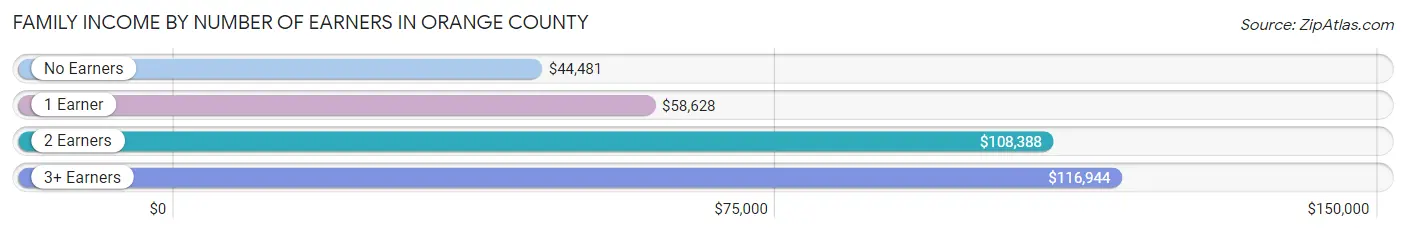
Family Income by Number of Earners in Orange County
The median family income in Orange County is $87,560, with families comprising 3+ earners (1,162) having the highest median family income of $116,944, while families with no earners (1,078) have the lowest median family income of $44,481, accounting for 14.3% and 13.3% of families, respectively.
| Number of Earners | # Families | Median Income |
| No Earners | 1,078 (13.3%) | $44,481 |
| 1 Earner | 2,374 (29.3%) | $58,628 |
| 2 Earners | 3,496 (43.1%) | $108,388 |
| 3+ Earners | 1,162 (14.3%) | $116,944 |
| Total | 8,110 (100.0%) | $87,560 |
Household Income in Orange County
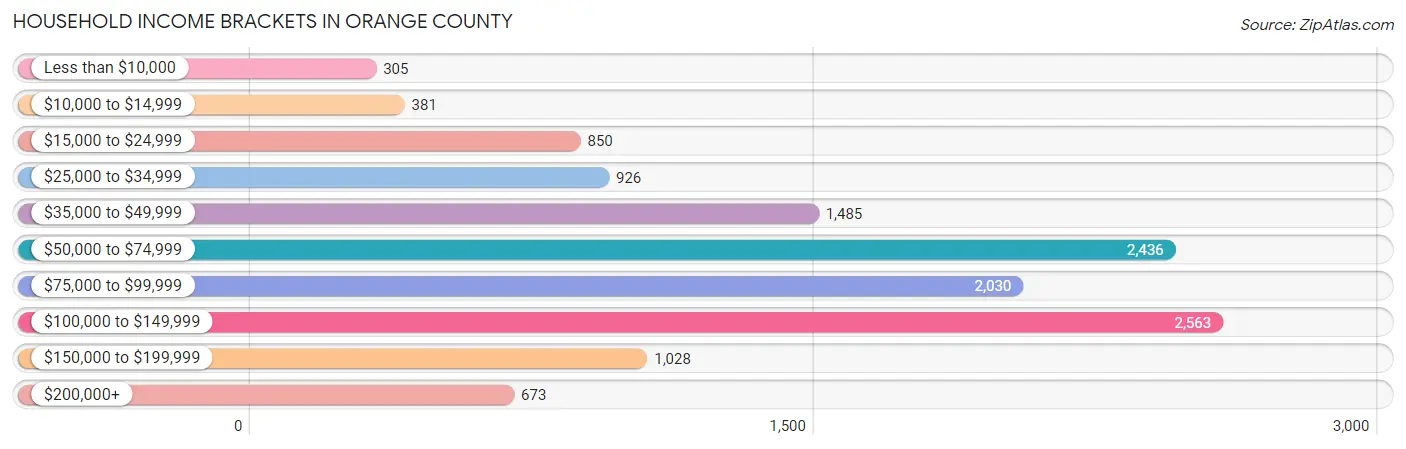
Household Income Brackets in Orange County
With 2,563 households falling in the category, the $100,000 to $149,999 income range is the most frequent in Orange County, accounting for 20.2% of all households. In contrast, only 305 households (2.4%) fall into the less than $10,000 income bracket, making it the least populous group.
| Income Bracket | # Households | % Households |
| Less than $10,000 | 305 | 2.4% |
| $10,000 to $14,999 | 381 | 3.0% |
| $15,000 to $24,999 | 850 | 6.7% |
| $25,000 to $34,999 | 926 | 7.3% |
| $35,000 to $49,999 | 1,485 | 11.7% |
| $50,000 to $74,999 | 2,436 | 19.2% |
| $75,000 to $99,999 | 2,030 | 16.0% |
| $100,000 to $149,999 | 2,563 | 20.2% |
| $150,000 to $199,999 | 1,028 | 8.1% |
| $200,000+ | 673 | 5.3% |
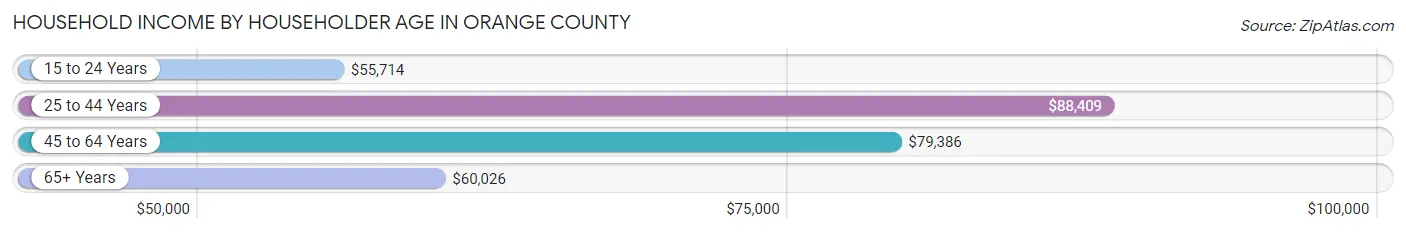
Household Income by Householder Age in Orange County
The median household income in Orange County is $74,534, with the highest median household income of $88,409 found in the 25 to 44 years age bracket for the primary householder. A total of 3,076 households (24.2%) fall into this category. Meanwhile, the 15 to 24 years age bracket for the primary householder has the lowest median household income of $55,714, with 234 households (1.8%) in this group.
| Income Bracket | # Households | Median Income |
| 15 to 24 Years | 234 (1.8%) | $55,714 |
| 25 to 44 Years | 3,076 (24.2%) | $88,409 |
| 45 to 64 Years | 5,181 (40.8%) | $79,386 |
| 65+ Years | 4,199 (33.1%) | $60,026 |
| Total | 12,690 (100.0%) | $74,534 |
Poverty in Orange County
Income Below Poverty by Sex and Age in Orange County
With 8.4% poverty level for males and 10.1% for females among the residents of Orange County, 15 year old males and 15 year old females are the most vulnerable to poverty, with 38 males (21.0%) and 47 females (47.5%) in their respective age groups living below the poverty level.
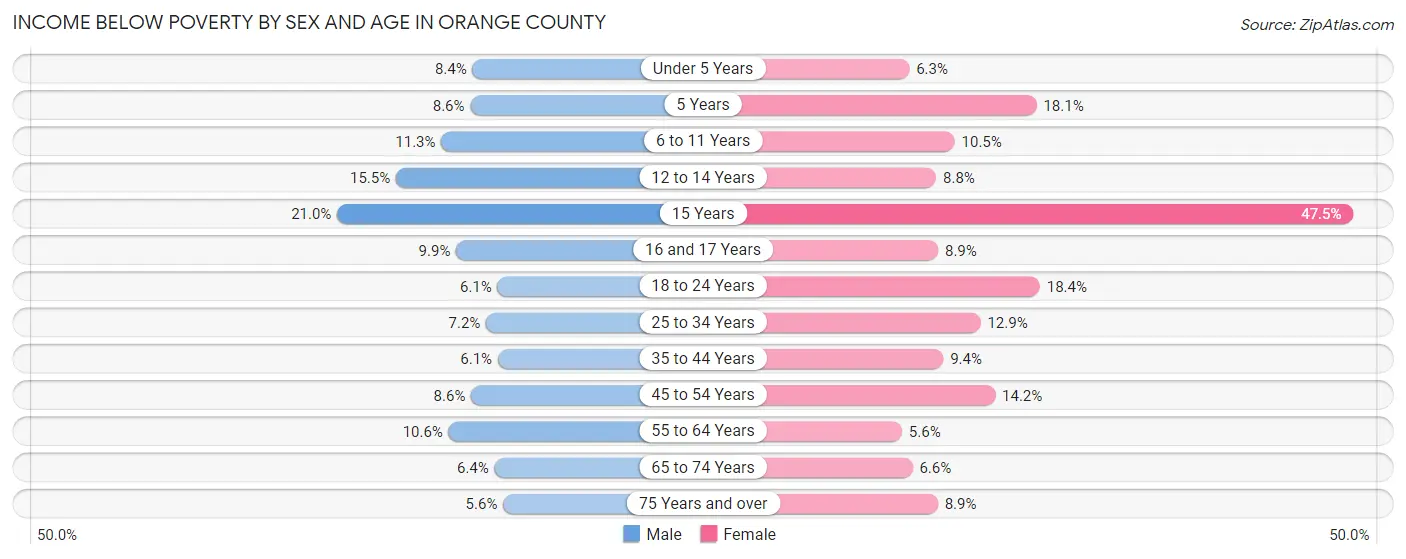
| Age Bracket | Male | Female |
| Under 5 Years | 50 (8.4%) | 38 (6.3%) |
| 5 Years | 12 (8.6%) | 15 (18.1%) |
| 6 to 11 Years | 108 (11.3%) | 83 (10.5%) |
| 12 to 14 Years | 75 (15.5%) | 42 (8.7%) |
| 15 Years | 38 (21.0%) | 47 (47.5%) |
| 16 and 17 Years | 32 (9.9%) | 31 (8.9%) |
| 18 to 24 Years | 62 (6.1%) | 175 (18.4%) |
| 25 to 34 Years | 116 (7.2%) | 205 (12.9%) |
| 35 to 44 Years | 108 (6.1%) | 159 (9.4%) |
| 45 to 54 Years | 161 (8.6%) | 267 (14.2%) |
| 55 to 64 Years | 259 (10.6%) | 139 (5.6%) |
| 65 to 74 Years | 131 (6.4%) | 138 (6.6%) |
| 75 Years and over | 57 (5.6%) | 114 (8.9%) |
| Total | 1,209 (8.4%) | 1,453 (10.1%) |
Income Above Poverty by Sex and Age in Orange County
According to the poverty statistics in Orange County, males aged 75 years and over and females aged 55 to 64 years are the age groups that are most secure financially, with 94.4% of males and 94.4% of females in these age groups living above the poverty line.
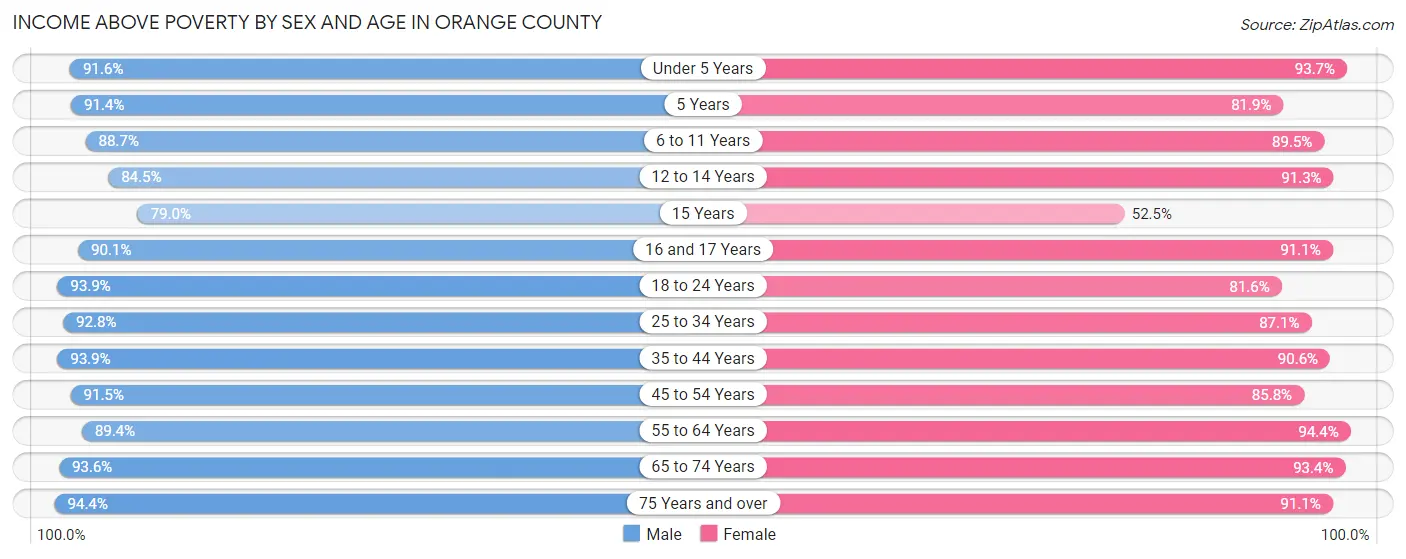
| Age Bracket | Male | Female |
| Under 5 Years | 543 (91.6%) | 569 (93.7%) |
| 5 Years | 127 (91.4%) | 68 (81.9%) |
| 6 to 11 Years | 846 (88.7%) | 710 (89.5%) |
| 12 to 14 Years | 408 (84.5%) | 438 (91.2%) |
| 15 Years | 143 (79.0%) | 52 (52.5%) |
| 16 and 17 Years | 290 (90.1%) | 316 (91.1%) |
| 18 to 24 Years | 955 (93.9%) | 777 (81.6%) |
| 25 to 34 Years | 1,503 (92.8%) | 1,388 (87.1%) |
| 35 to 44 Years | 1,671 (93.9%) | 1,531 (90.6%) |
| 45 to 54 Years | 1,721 (91.4%) | 1,609 (85.8%) |
| 55 to 64 Years | 2,176 (89.4%) | 2,350 (94.4%) |
| 65 to 74 Years | 1,923 (93.6%) | 1,966 (93.4%) |
| 75 Years and over | 964 (94.4%) | 1,167 (91.1%) |
| Total | 13,270 (91.6%) | 12,941 (89.9%) |
Income Below Poverty Among Married-Couple Families in Orange County
The poverty statistics for married-couple families in Orange County show that 3.8% or 239 of the total 6,241 families live below the poverty line. Families with 5 or more children have the highest poverty rate of 63.6%, comprising of 7 families. On the other hand, families with no children have the lowest poverty rate of 2.8%, which includes 116 families.
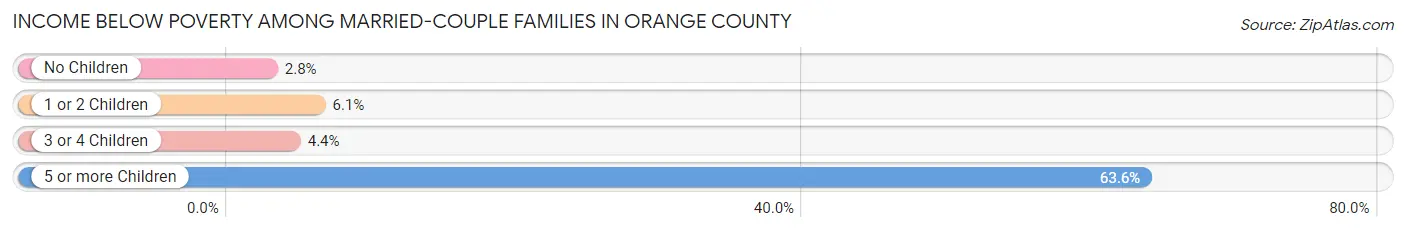
| Children | Above Poverty | Below Poverty |
| No Children | 4,070 (97.2%) | 116 (2.8%) |
| 1 or 2 Children | 1,447 (93.9%) | 94 (6.1%) |
| 3 or 4 Children | 481 (95.6%) | 22 (4.4%) |
| 5 or more Children | 4 (36.4%) | 7 (63.6%) |
| Total | 6,002 (96.2%) | 239 (3.8%) |
Income Below Poverty Among Single-Parent Households in Orange County
According to the poverty data in Orange County, 1.8% or 13 single-father households and 19.1% or 215 single-mother households are living below the poverty line. Among single-father households, those with 3 or 4 children have the highest poverty rate, with 7 households (10.3%) experiencing poverty. Likewise, among single-mother households, those with 3 or 4 children have the highest poverty rate, with 33 households (53.2%) falling below the poverty line.
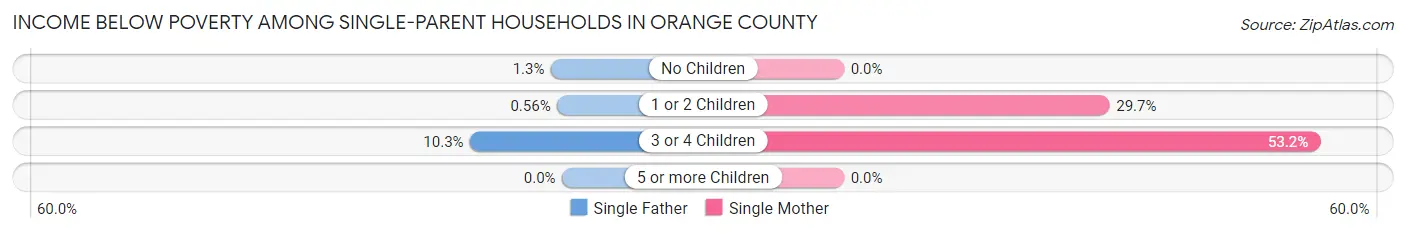
| Children | Single Father | Single Mother |
| No Children | 4 (1.3%) | 0 (0.0%) |
| 1 or 2 Children | 2 (0.6%) | 182 (29.7%) |
| 3 or 4 Children | 7 (10.3%) | 33 (53.2%) |
| 5 or more Children | 0 (0.0%) | 0 (0.0%) |
| Total | 13 (1.8%) | 215 (19.1%) |
Income Below Poverty Among Married-Couple vs Single-Parent Households in Orange County
The poverty data for Orange County shows that 239 of the married-couple family households (3.8%) and 228 of the single-parent households (12.2%) are living below the poverty level. Within the married-couple family households, those with 5 or more children have the highest poverty rate, with 7 households (63.6%) falling below the poverty line. Among the single-parent households, those with 3 or 4 children have the highest poverty rate, with 40 household (30.8%) living below poverty.
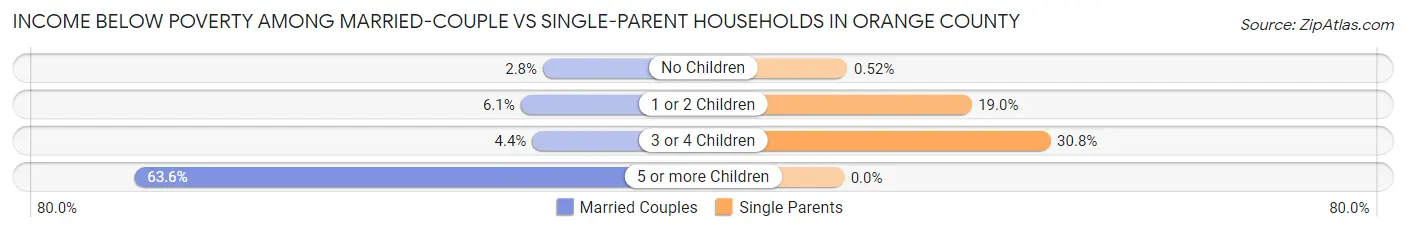
| Children | Married-Couple Families | Single-Parent Households |
| No Children | 116 (2.8%) | 4 (0.5%) |
| 1 or 2 Children | 94 (6.1%) | 184 (19.0%) |
| 3 or 4 Children | 22 (4.4%) | 40 (30.8%) |
| 5 or more Children | 7 (63.6%) | 0 (0.0%) |
| Total | 239 (3.8%) | 228 (12.2%) |
Employment Characteristics in Orange County
Employment by Class of Employer in Orange County
Among the 15,650 employed individuals in Orange County, private company employees (7,776 | 49.7%), not-for-profit organizations (2,918 | 18.6%), and self-employed (not incorporated) (1,566 | 10.0%) make up the most common classes of employment.
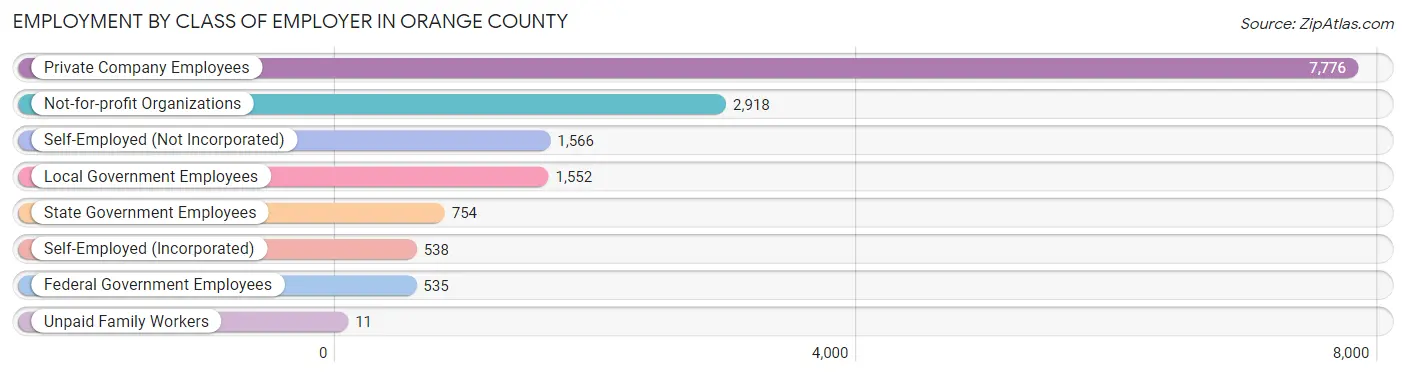
| Employer Class | # Employees | % Employees |
| Private Company Employees | 7,776 | 49.7% |
| Self-Employed (Incorporated) | 538 | 3.4% |
| Self-Employed (Not Incorporated) | 1,566 | 10.0% |
| Not-for-profit Organizations | 2,918 | 18.6% |
| Local Government Employees | 1,552 | 9.9% |
| State Government Employees | 754 | 4.8% |
| Federal Government Employees | 535 | 3.4% |
| Unpaid Family Workers | 11 | 0.1% |
| Total | 15,650 | 100.0% |
Employment Status by Age in Orange County
According to the labor force statistics for Orange County, out of the total population over 16 years of age (24,846), 66.8% or 16,597 individuals are in the labor force, with 3.1% or 515 of them unemployed. The age group with the highest labor force participation rate is 35 to 44 years, with 89.0% or 3,087 individuals in the labor force. Within the labor force, the 16 to 19 years age range has the highest percentage of unemployed individuals, with 13.4% or 111 of them being unemployed.
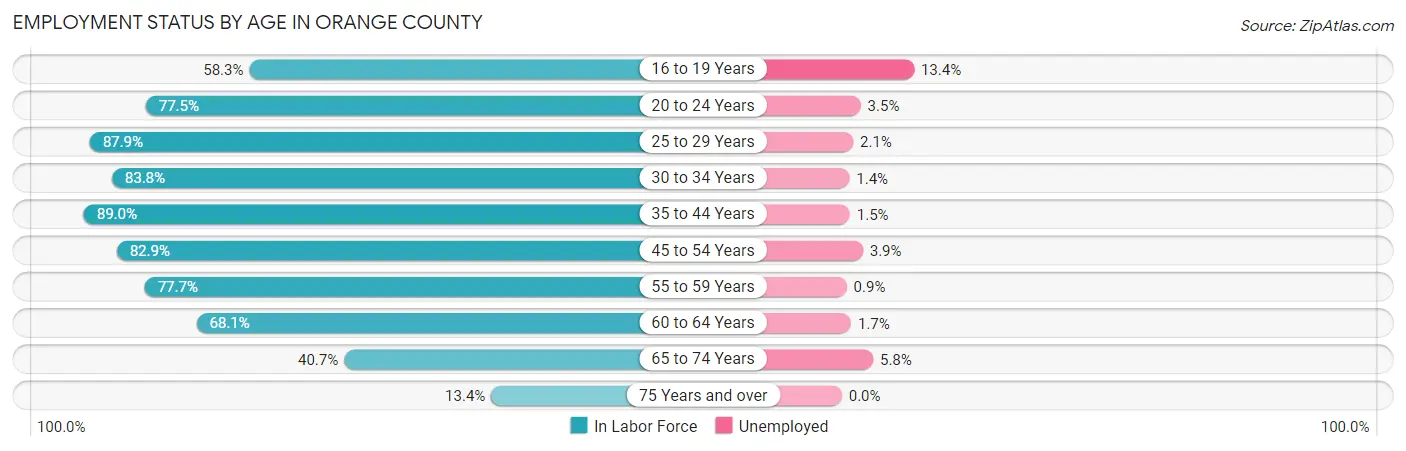
| Age Bracket | In Labor Force | Unemployed |
| 16 to 19 Years | 828 (58.3%) | 111 (13.4%) |
| 20 to 24 Years | 1,190 (77.5%) | 42 (3.5%) |
| 25 to 29 Years | 1,334 (87.9%) | 28 (2.1%) |
| 30 to 34 Years | 1,421 (83.8%) | 20 (1.4%) |
| 35 to 44 Years | 3,087 (89.0%) | 46 (1.5%) |
| 45 to 54 Years | 3,117 (82.9%) | 122 (3.9%) |
| 55 to 59 Years | 2,012 (77.7%) | 18 (0.9%) |
| 60 to 64 Years | 1,590 (68.1%) | 27 (1.7%) |
| 65 to 74 Years | 1,694 (40.7%) | 98 (5.8%) |
| 75 Years and over | 317 (13.4%) | 0 (0.0%) |
| Total | 16,597 (66.8%) | 515 (3.1%) |
Employment Status by Educational Attainment in Orange County
According to labor force statistics for Orange County, 81.8% of individuals (12,570) out of the total population between 25 and 64 years of age (15,367) are in the labor force, with 2.1% or 264 of them being unemployed. The group with the highest labor force participation rate are those with the educational attainment of college / associate degree, with 87.4% or 3,511 individuals in the labor force. Within the labor force, individuals with less than high school education have the highest percentage of unemployment, with 4.5% or 24 of them being unemployed.
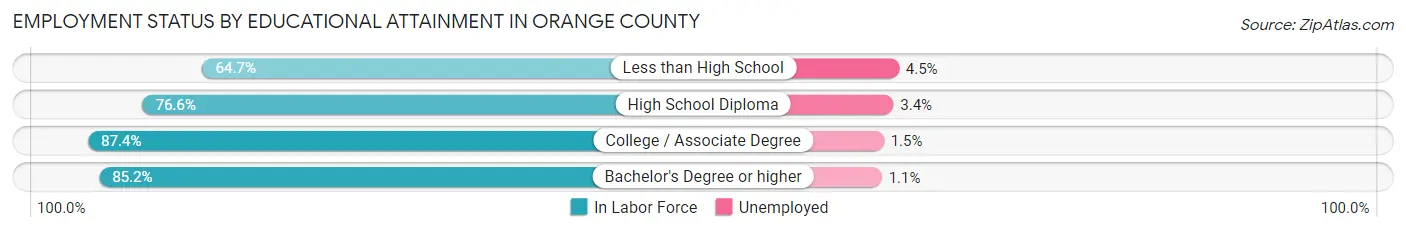
| Educational Attainment | In Labor Force | Unemployed |
| Less than High School | 544 (64.7%) | 38 (4.5%) |
| High School Diploma | 3,997 (76.6%) | 177 (3.4%) |
| College / Associate Degree | 3,511 (87.4%) | 60 (1.5%) |
| Bachelor's Degree or higher | 4,508 (85.2%) | 58 (1.1%) |
| Total | 12,570 (81.8%) | 323 (2.1%) |
Employment Occupations by Sex in Orange County
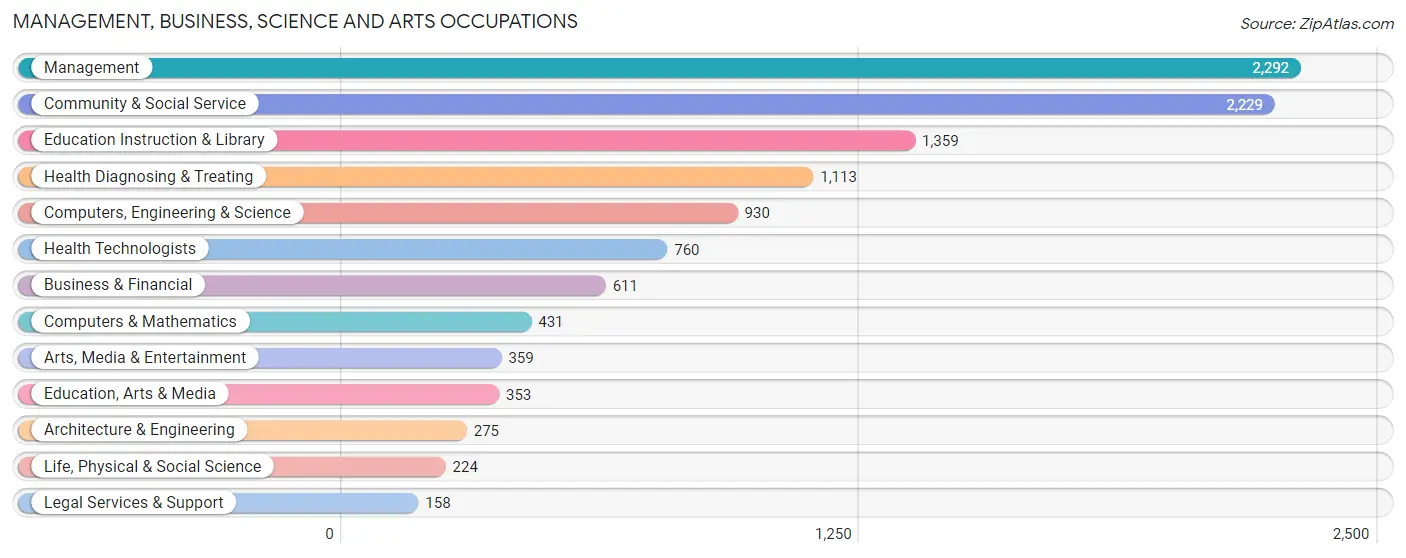
Management, Business, Science and Arts Occupations
The most common Management, Business, Science and Arts occupations in Orange County are Management (2,292 | 14.3%), Community & Social Service (2,229 | 13.9%), Education Instruction & Library (1,359 | 8.5%), Health Diagnosing & Treating (1,113 | 6.9%), and Computers, Engineering & Science (930 | 5.8%).
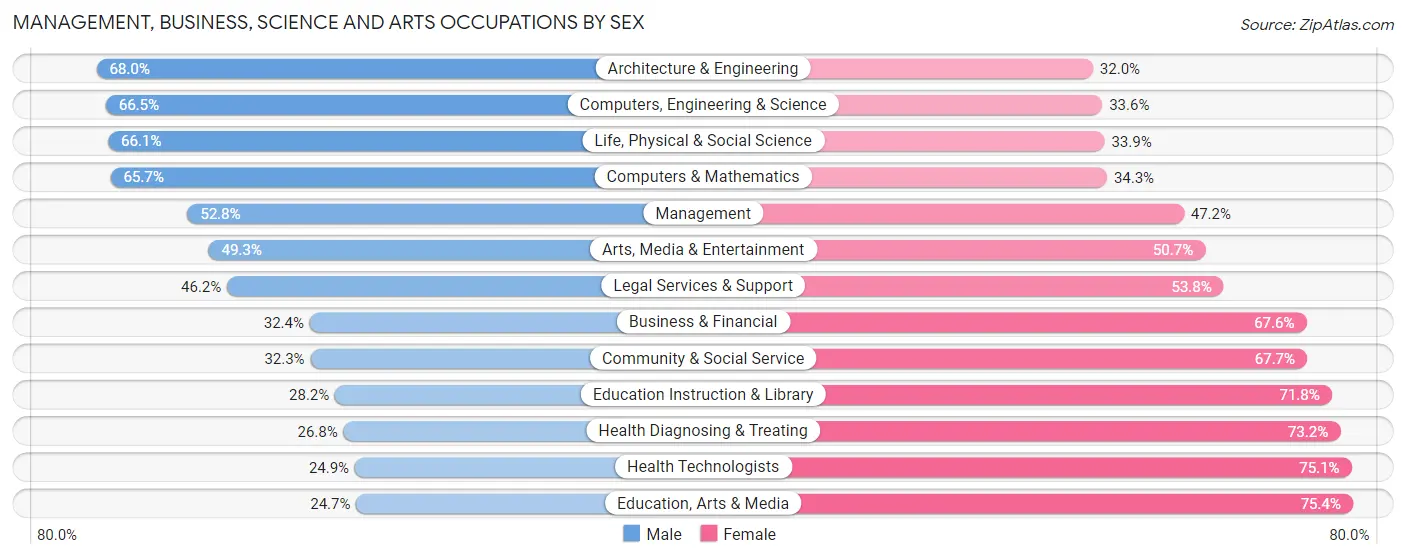
Management, Business, Science and Arts Occupations by Sex
Within the Management, Business, Science and Arts occupations in Orange County, the most male-oriented occupations are Architecture & Engineering (68.0%), Computers, Engineering & Science (66.4%), and Life, Physical & Social Science (66.1%), while the most female-oriented occupations are Education, Arts & Media (75.3%), Health Technologists (75.1%), and Health Diagnosing & Treating (73.2%).
| Occupation | Male | Female |
| Management | 1,211 (52.8%) | 1,081 (47.2%) |
| Business & Financial | 198 (32.4%) | 413 (67.6%) |
| Computers, Engineering & Science | 618 (66.4%) | 312 (33.6%) |
| Computers & Mathematics | 283 (65.7%) | 148 (34.3%) |
| Architecture & Engineering | 187 (68.0%) | 88 (32.0%) |
| Life, Physical & Social Science | 148 (66.1%) | 76 (33.9%) |
| Community & Social Service | 720 (32.3%) | 1,509 (67.7%) |
| Education, Arts & Media | 87 (24.6%) | 266 (75.3%) |
| Legal Services & Support | 73 (46.2%) | 85 (53.8%) |
| Education Instruction & Library | 383 (28.2%) | 976 (71.8%) |
| Arts, Media & Entertainment | 177 (49.3%) | 182 (50.7%) |
| Health Diagnosing & Treating | 298 (26.8%) | 815 (73.2%) |
| Health Technologists | 189 (24.9%) | 571 (75.1%) |
| Total (Category) | 3,045 (42.4%) | 4,130 (57.6%) |
| Total (Overall) | 8,237 (51.3%) | 7,826 (48.7%) |
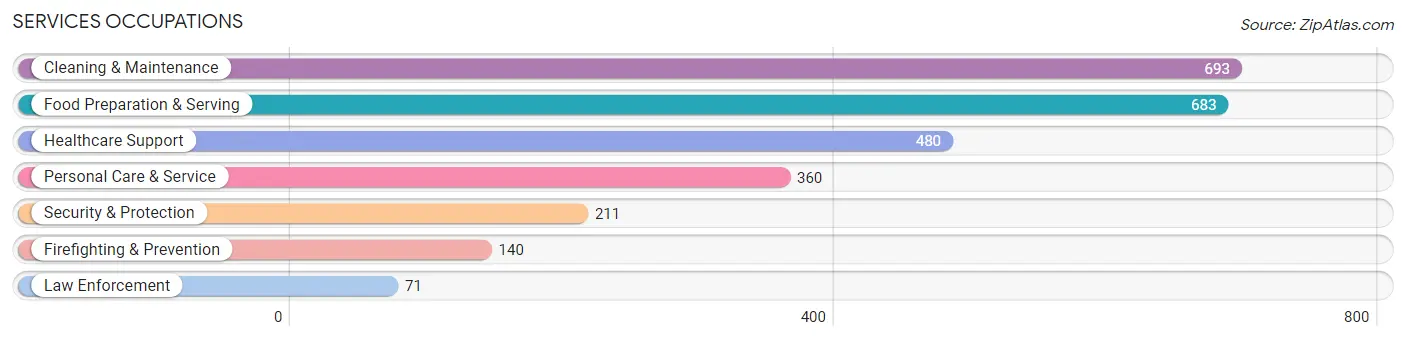
Services Occupations
The most common Services occupations in Orange County are Cleaning & Maintenance (693 | 4.3%), Food Preparation & Serving (683 | 4.3%), Healthcare Support (480 | 3.0%), Personal Care & Service (360 | 2.2%), and Security & Protection (211 | 1.3%).
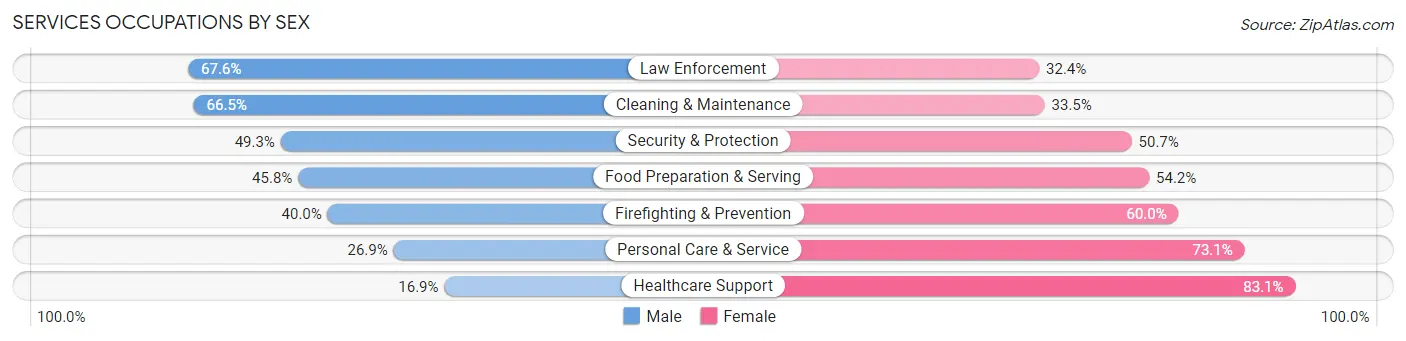
Services Occupations by Sex
Within the Services occupations in Orange County, the most male-oriented occupations are Law Enforcement (67.6%), Cleaning & Maintenance (66.5%), and Security & Protection (49.3%), while the most female-oriented occupations are Healthcare Support (83.1%), Personal Care & Service (73.1%), and Firefighting & Prevention (60.0%).
| Occupation | Male | Female |
| Healthcare Support | 81 (16.9%) | 399 (83.1%) |
| Security & Protection | 104 (49.3%) | 107 (50.7%) |
| Firefighting & Prevention | 56 (40.0%) | 84 (60.0%) |
| Law Enforcement | 48 (67.6%) | 23 (32.4%) |
| Food Preparation & Serving | 313 (45.8%) | 370 (54.2%) |
| Cleaning & Maintenance | 461 (66.5%) | 232 (33.5%) |
| Personal Care & Service | 97 (26.9%) | 263 (73.1%) |
| Total (Category) | 1,056 (43.5%) | 1,371 (56.5%) |
| Total (Overall) | 8,237 (51.3%) | 7,826 (48.7%) |
Sales and Office Occupations
The most common Sales and Office occupations in Orange County are Office & Administration (1,610 | 10.0%), and Sales & Related (925 | 5.8%).

Sales and Office Occupations by Sex
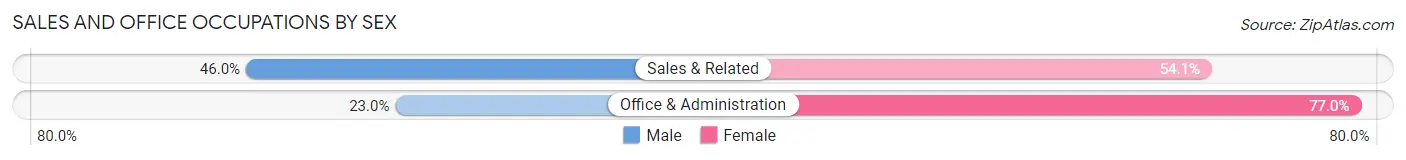
| Occupation | Male | Female |
| Sales & Related | 425 (46.0%) | 500 (54.0%) |
| Office & Administration | 370 (23.0%) | 1,240 (77.0%) |
| Total (Category) | 795 (31.4%) | 1,740 (68.6%) |
| Total (Overall) | 8,237 (51.3%) | 7,826 (48.7%) |
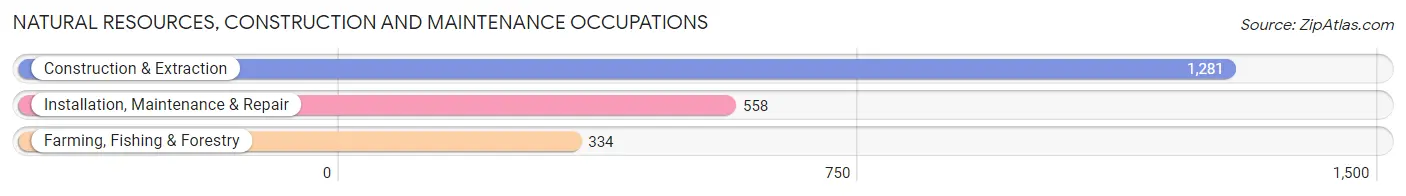
Natural Resources, Construction and Maintenance Occupations
The most common Natural Resources, Construction and Maintenance occupations in Orange County are Construction & Extraction (1,281 | 8.0%), Installation, Maintenance & Repair (558 | 3.5%), and Farming, Fishing & Forestry (334 | 2.1%).
Natural Resources, Construction and Maintenance Occupations by Sex
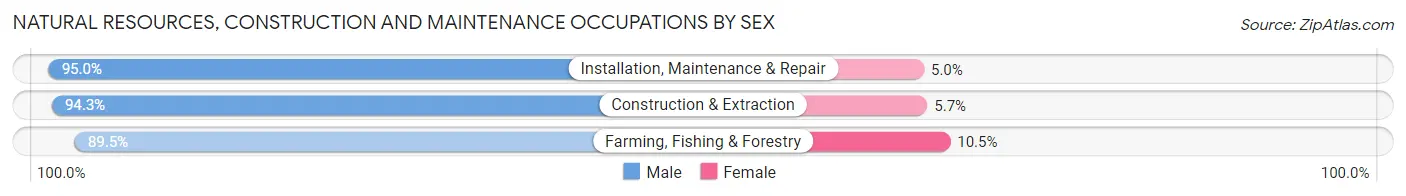
| Occupation | Male | Female |
| Farming, Fishing & Forestry | 299 (89.5%) | 35 (10.5%) |
| Construction & Extraction | 1,208 (94.3%) | 73 (5.7%) |
| Installation, Maintenance & Repair | 530 (95.0%) | 28 (5.0%) |
| Total (Category) | 2,037 (93.7%) | 136 (6.3%) |
| Total (Overall) | 8,237 (51.3%) | 7,826 (48.7%) |
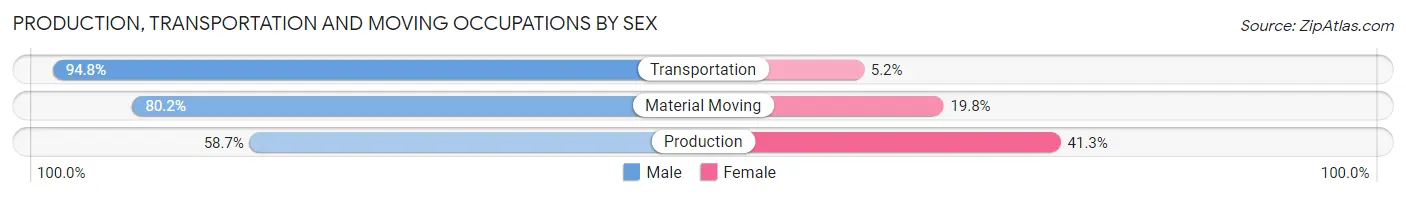
Production, Transportation and Moving Occupations
The most common Production, Transportation and Moving occupations in Orange County are Production (828 | 5.1%), Transportation (521 | 3.2%), and Material Moving (404 | 2.5%).
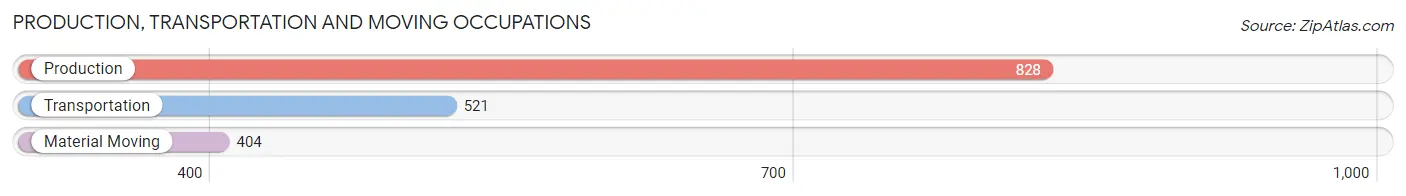
Production, Transportation and Moving Occupations by Sex
| Occupation | Male | Female |
| Production | 486 (58.7%) | 342 (41.3%) |
| Transportation | 494 (94.8%) | 27 (5.2%) |
| Material Moving | 324 (80.2%) | 80 (19.8%) |
| Total (Category) | 1,304 (74.4%) | 449 (25.6%) |
| Total (Overall) | 8,237 (51.3%) | 7,826 (48.7%) |
Employment Industries by Sex in Orange County
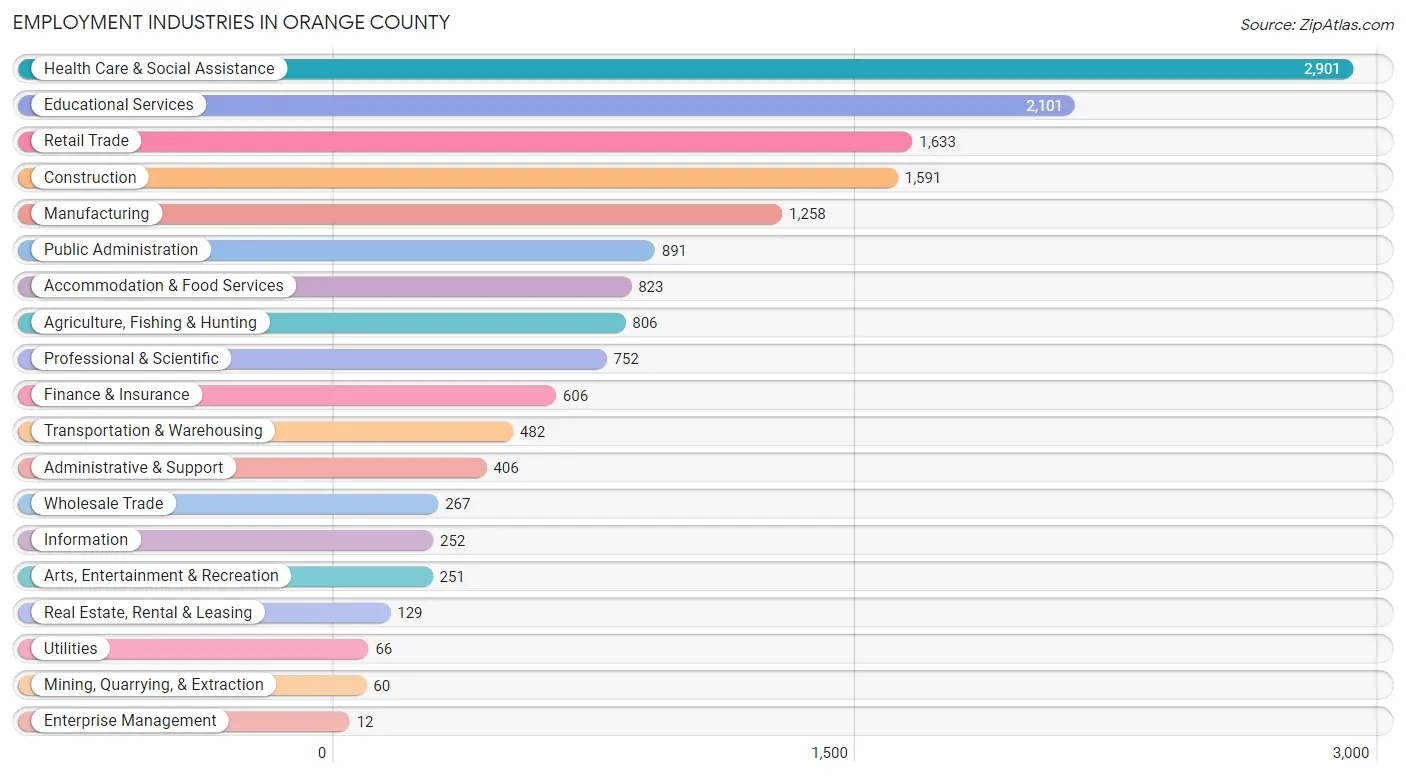
Employment Industries in Orange County
The major employment industries in Orange County include Health Care & Social Assistance (2,901 | 18.1%), Educational Services (2,101 | 13.1%), Retail Trade (1,633 | 10.2%), Construction (1,591 | 9.9%), and Manufacturing (1,258 | 7.8%).
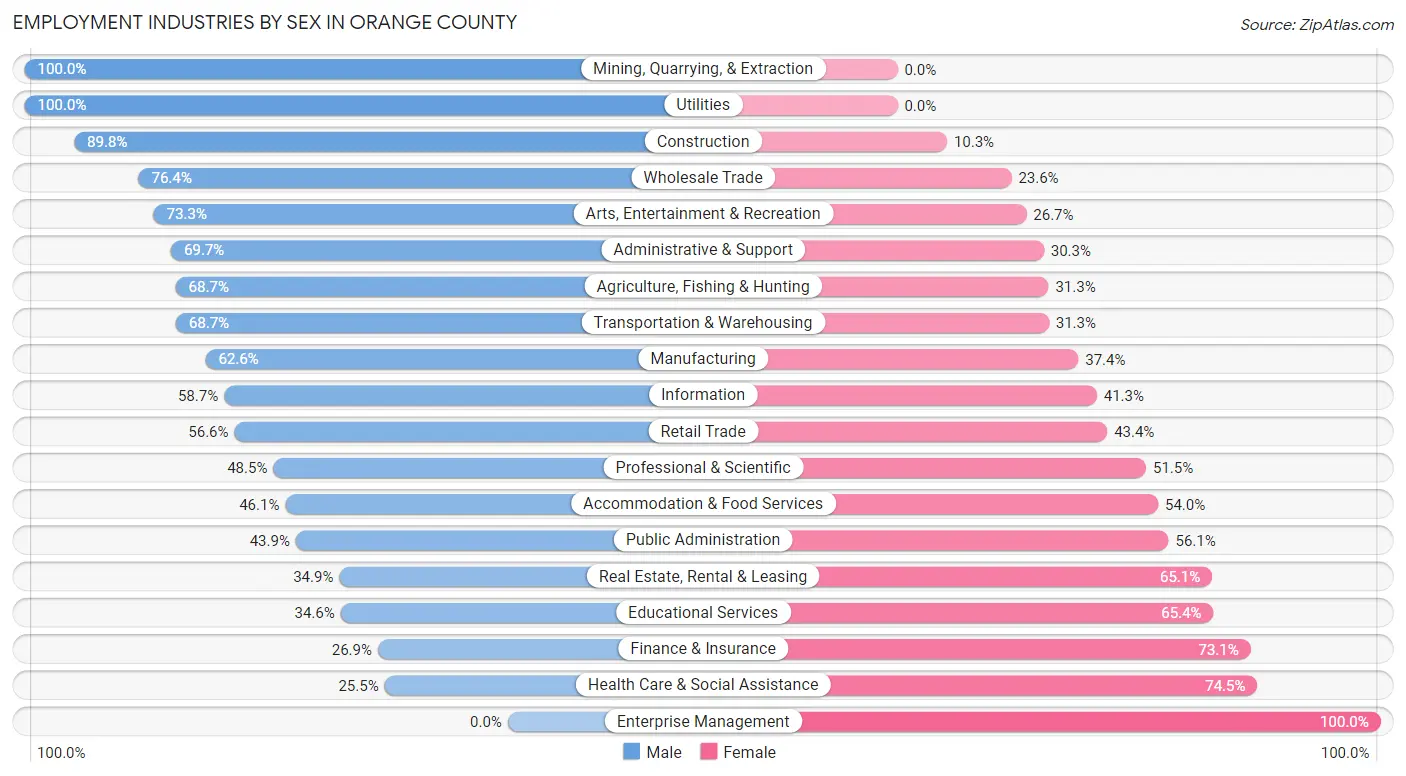
Employment Industries by Sex in Orange County
The Orange County industries that see more men than women are Mining, Quarrying, & Extraction (100.0%), Utilities (100.0%), and Construction (89.7%), whereas the industries that tend to have a higher number of women are Enterprise Management (100.0%), Health Care & Social Assistance (74.5%), and Finance & Insurance (73.1%).
| Industry | Male | Female |
| Agriculture, Fishing & Hunting | 554 (68.7%) | 252 (31.3%) |
| Mining, Quarrying, & Extraction | 60 (100.0%) | 0 (0.0%) |
| Construction | 1,428 (89.7%) | 163 (10.2%) |
| Manufacturing | 787 (62.6%) | 471 (37.4%) |
| Wholesale Trade | 204 (76.4%) | 63 (23.6%) |
| Retail Trade | 924 (56.6%) | 709 (43.4%) |
| Transportation & Warehousing | 331 (68.7%) | 151 (31.3%) |
| Utilities | 66 (100.0%) | 0 (0.0%) |
| Information | 148 (58.7%) | 104 (41.3%) |
| Finance & Insurance | 163 (26.9%) | 443 (73.1%) |
| Real Estate, Rental & Leasing | 45 (34.9%) | 84 (65.1%) |
| Professional & Scientific | 365 (48.5%) | 387 (51.5%) |
| Enterprise Management | 0 (0.0%) | 12 (100.0%) |
| Administrative & Support | 283 (69.7%) | 123 (30.3%) |
| Educational Services | 727 (34.6%) | 1,374 (65.4%) |
| Health Care & Social Assistance | 740 (25.5%) | 2,161 (74.5%) |
| Arts, Entertainment & Recreation | 184 (73.3%) | 67 (26.7%) |
| Accommodation & Food Services | 379 (46.1%) | 444 (53.9%) |
| Public Administration | 391 (43.9%) | 500 (56.1%) |
| Total | 8,237 (51.3%) | 7,826 (48.7%) |
Education in Orange County
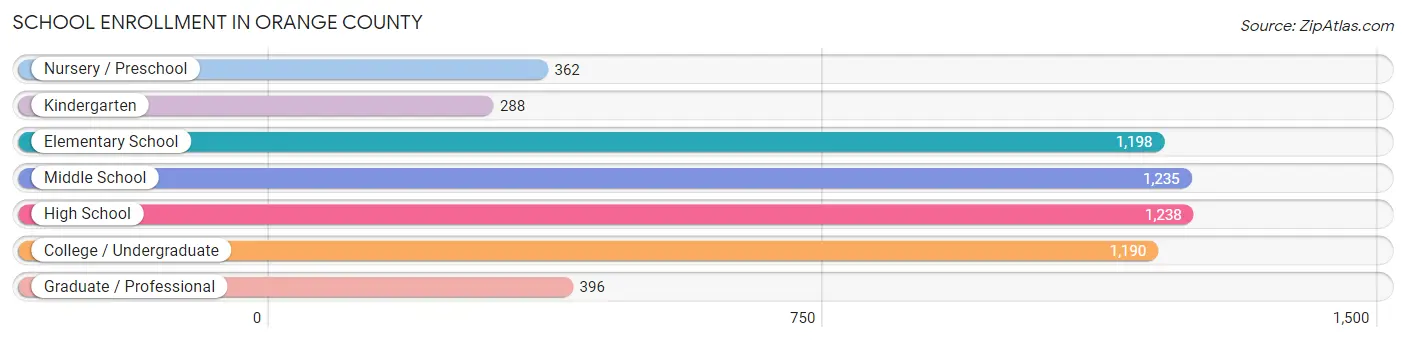
School Enrollment in Orange County
The most common levels of schooling among the 5,907 students in Orange County are high school (1,238 | 21.0%), middle school (1,235 | 20.9%), and elementary school (1,198 | 20.3%).
| School Level | # Students | % Students |
| Nursery / Preschool | 362 | 6.1% |
| Kindergarten | 288 | 4.9% |
| Elementary School | 1,198 | 20.3% |
| Middle School | 1,235 | 20.9% |
| High School | 1,238 | 21.0% |
| College / Undergraduate | 1,190 | 20.2% |
| Graduate / Professional | 396 | 6.7% |
| Total | 5,907 | 100.0% |
School Enrollment by Age by Funding Source in Orange County
Out of a total of 5,907 students who are enrolled in schools in Orange County, 1,087 (18.4%) attend a private institution, while the remaining 4,820 (81.6%) are enrolled in public schools. The age group of 25 to 34 year olds has the highest likelihood of being enrolled in private schools, with 156 (49.1% in the age bracket) enrolled. Conversely, the age group of 15 to 17 year olds has the lowest likelihood of being enrolled in a private school, with 875 (93.8% in the age bracket) attending a public institution.
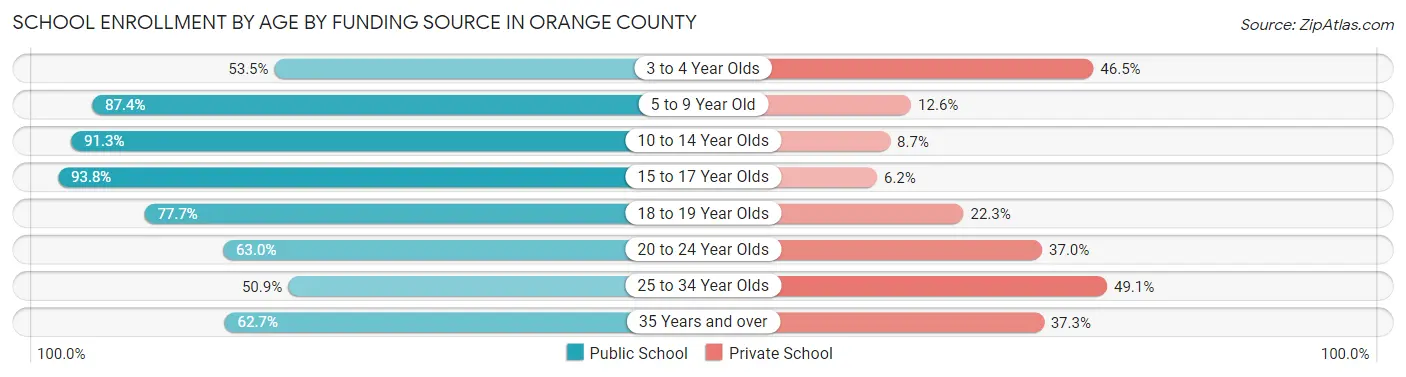
| Age Bracket | Public School | Private School |
| 3 to 4 Year Olds | 123 (53.5%) | 107 (46.5%) |
| 5 to 9 Year Old | 1,217 (87.4%) | 175 (12.6%) |
| 10 to 14 Year Olds | 1,477 (91.3%) | 140 (8.7%) |
| 15 to 17 Year Olds | 875 (93.8%) | 58 (6.2%) |
| 18 to 19 Year Olds | 407 (77.7%) | 117 (22.3%) |
| 20 to 24 Year Olds | 365 (63.0%) | 214 (37.0%) |
| 25 to 34 Year Olds | 162 (50.9%) | 156 (49.1%) |
| 35 Years and over | 197 (62.7%) | 117 (37.3%) |
| Total | 4,820 (81.6%) | 1,087 (18.4%) |
Educational Attainment by Field of Study in Orange County
Education (1,115 | 13.1%), social sciences (1,040 | 12.3%), bio, nature & agricultural (980 | 11.6%), liberal arts & history (744 | 8.8%), and science & technology (664 | 7.8%) are the most common fields of study among 8,483 individuals in Orange County who have obtained a bachelor's degree or higher.
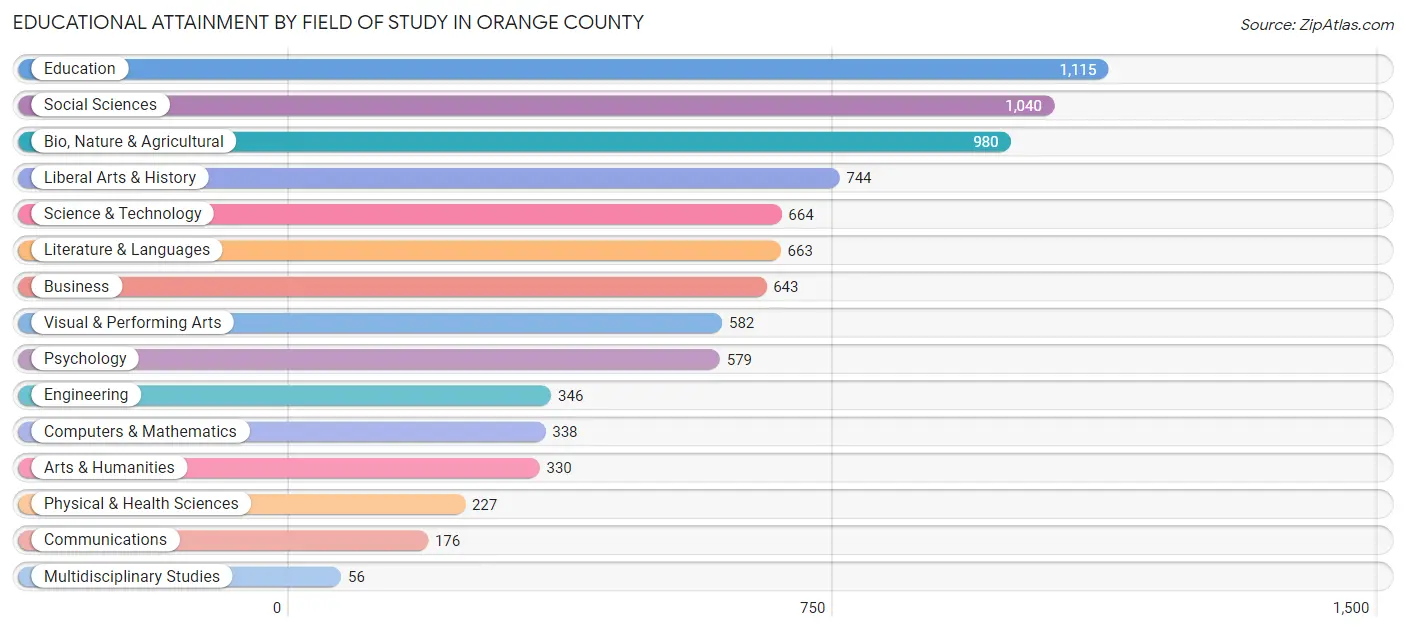
| Field of Study | # Graduates | % Graduates |
| Computers & Mathematics | 338 | 4.0% |
| Bio, Nature & Agricultural | 980 | 11.6% |
| Physical & Health Sciences | 227 | 2.7% |
| Psychology | 579 | 6.8% |
| Social Sciences | 1,040 | 12.3% |
| Engineering | 346 | 4.1% |
| Multidisciplinary Studies | 56 | 0.7% |
| Science & Technology | 664 | 7.8% |
| Business | 643 | 7.6% |
| Education | 1,115 | 13.1% |
| Literature & Languages | 663 | 7.8% |
| Liberal Arts & History | 744 | 8.8% |
| Visual & Performing Arts | 582 | 6.9% |
| Communications | 176 | 2.1% |
| Arts & Humanities | 330 | 3.9% |
| Total | 8,483 | 100.0% |
Transportation & Commute in Orange County
Vehicle Availability by Sex in Orange County
The most prevalent vehicle ownership categories in Orange County are males with 2 vehicles (3,592, accounting for 45.5%) and females with 2 vehicles (3,198, making up 47.5%).
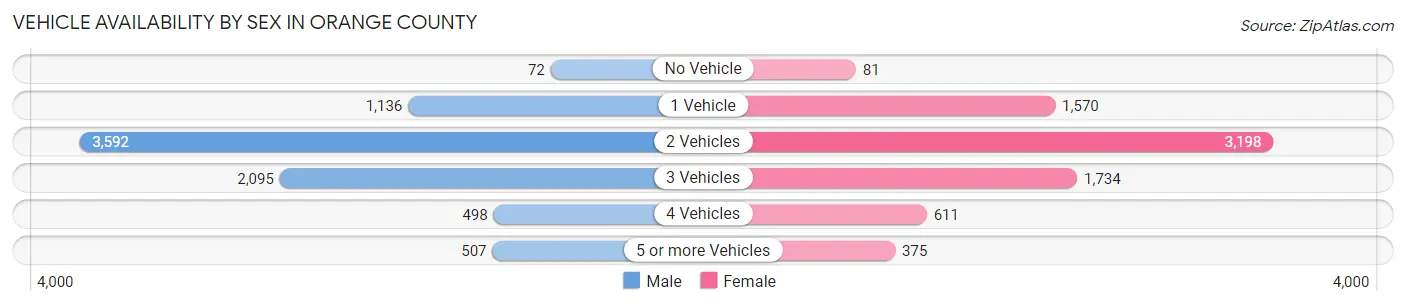
| Vehicles Available | Male | Female |
| No Vehicle | 72 (0.9%) | 81 (1.1%) |
| 1 Vehicle | 1,136 (14.4%) | 1,570 (20.7%) |
| 2 Vehicles | 3,592 (45.5%) | 3,198 (42.2%) |
| 3 Vehicles | 2,095 (26.5%) | 1,734 (22.9%) |
| 4 Vehicles | 498 (6.3%) | 611 (8.1%) |
| 5 or more Vehicles | 507 (6.4%) | 375 (5.0%) |
| Total | 7,900 (100.0%) | 7,569 (100.0%) |
Commute Time in Orange County
The most frequently occuring commute durations in Orange County are 30 to 34 minutes (2,172 commuters, 15.9%), 20 to 24 minutes (2,028 commuters, 14.9%), and 15 to 19 minutes (1,849 commuters, 13.6%).
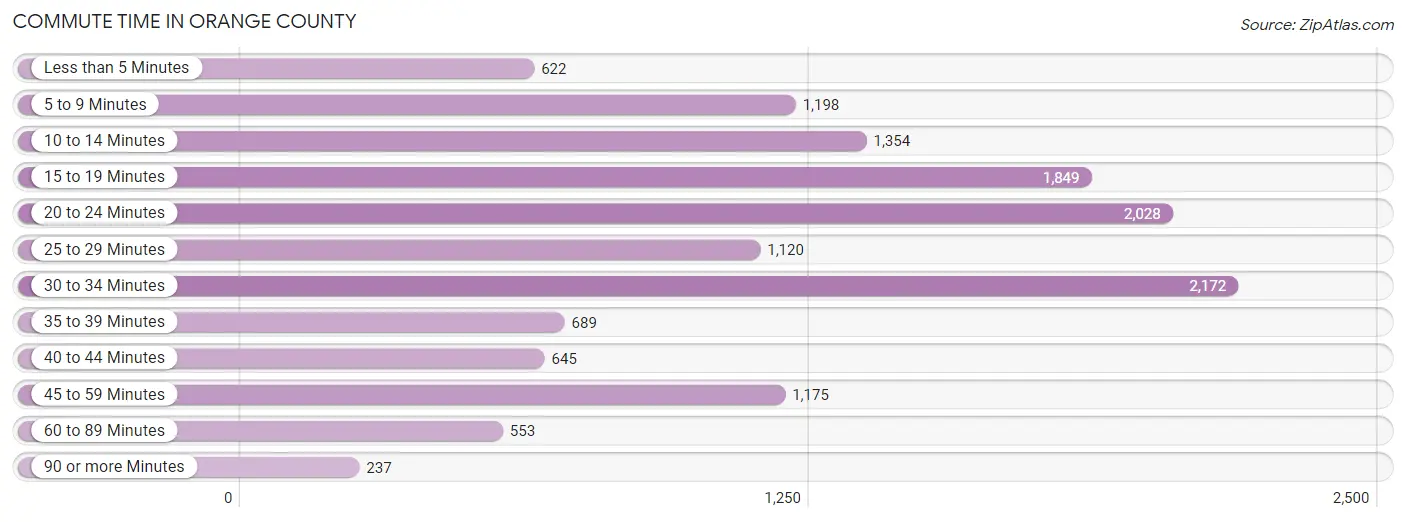
| Commute Time | # Commuters | % Commuters |
| Less than 5 Minutes | 622 | 4.6% |
| 5 to 9 Minutes | 1,198 | 8.8% |
| 10 to 14 Minutes | 1,354 | 9.9% |
| 15 to 19 Minutes | 1,849 | 13.6% |
| 20 to 24 Minutes | 2,028 | 14.9% |
| 25 to 29 Minutes | 1,120 | 8.2% |
| 30 to 34 Minutes | 2,172 | 15.9% |
| 35 to 39 Minutes | 689 | 5.1% |
| 40 to 44 Minutes | 645 | 4.7% |
| 45 to 59 Minutes | 1,175 | 8.6% |
| 60 to 89 Minutes | 553 | 4.1% |
| 90 or more Minutes | 237 | 1.7% |
Commute Time by Sex in Orange County
The most common commute times in Orange County are 30 to 34 minutes (1,033 commuters, 14.9%) for males and 30 to 34 minutes (1,139 commuters, 17.0%) for females.
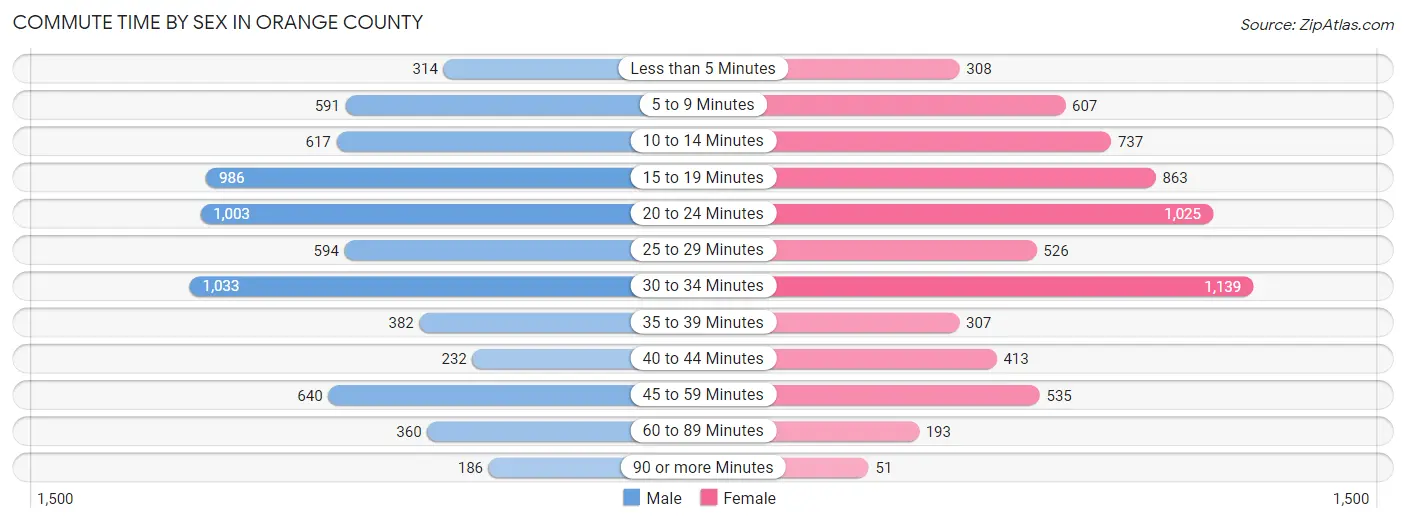
| Commute Time | Male | Female |
| Less than 5 Minutes | 314 (4.5%) | 308 (4.6%) |
| 5 to 9 Minutes | 591 (8.5%) | 607 (9.0%) |
| 10 to 14 Minutes | 617 (8.9%) | 737 (11.0%) |
| 15 to 19 Minutes | 986 (14.2%) | 863 (12.9%) |
| 20 to 24 Minutes | 1,003 (14.5%) | 1,025 (15.3%) |
| 25 to 29 Minutes | 594 (8.6%) | 526 (7.9%) |
| 30 to 34 Minutes | 1,033 (14.9%) | 1,139 (17.0%) |
| 35 to 39 Minutes | 382 (5.5%) | 307 (4.6%) |
| 40 to 44 Minutes | 232 (3.3%) | 413 (6.2%) |
| 45 to 59 Minutes | 640 (9.2%) | 535 (8.0%) |
| 60 to 89 Minutes | 360 (5.2%) | 193 (2.9%) |
| 90 or more Minutes | 186 (2.7%) | 51 (0.8%) |
Time of Departure to Work by Sex in Orange County
The most frequent times of departure to work in Orange County are 7:00 AM to 7:29 AM (1,304, 18.8%) for males and 7:00 AM to 7:29 AM (1,371, 20.4%) for females.
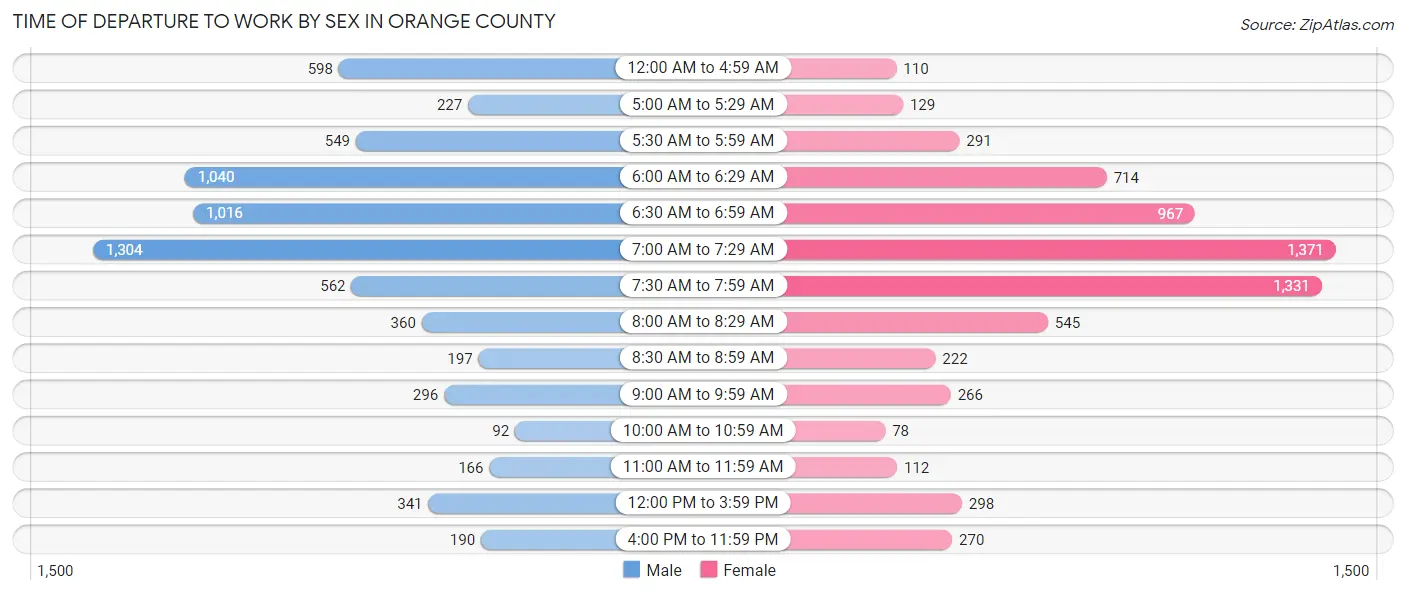
| Time of Departure | Male | Female |
| 12:00 AM to 4:59 AM | 598 (8.6%) | 110 (1.6%) |
| 5:00 AM to 5:29 AM | 227 (3.3%) | 129 (1.9%) |
| 5:30 AM to 5:59 AM | 549 (7.9%) | 291 (4.3%) |
| 6:00 AM to 6:29 AM | 1,040 (15.0%) | 714 (10.6%) |
| 6:30 AM to 6:59 AM | 1,016 (14.6%) | 967 (14.4%) |
| 7:00 AM to 7:29 AM | 1,304 (18.8%) | 1,371 (20.4%) |
| 7:30 AM to 7:59 AM | 562 (8.1%) | 1,331 (19.9%) |
| 8:00 AM to 8:29 AM | 360 (5.2%) | 545 (8.1%) |
| 8:30 AM to 8:59 AM | 197 (2.8%) | 222 (3.3%) |
| 9:00 AM to 9:59 AM | 296 (4.3%) | 266 (4.0%) |
| 10:00 AM to 10:59 AM | 92 (1.3%) | 78 (1.2%) |
| 11:00 AM to 11:59 AM | 166 (2.4%) | 112 (1.7%) |
| 12:00 PM to 3:59 PM | 341 (4.9%) | 298 (4.4%) |
| 4:00 PM to 11:59 PM | 190 (2.7%) | 270 (4.0%) |
| Total | 6,938 (100.0%) | 6,704 (100.0%) |
Housing Occupancy in Orange County
Occupancy by Ownership in Orange County
Of the total 12,690 dwellings in Orange County, owner-occupied units account for 10,461 (82.4%), while renter-occupied units make up 2,229 (17.6%).
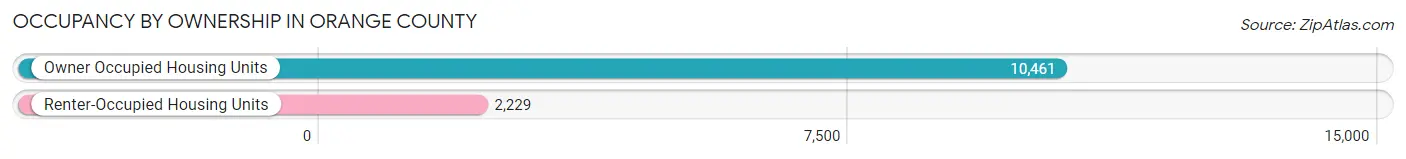
| Occupancy | # Housing Units | % Housing Units |
| Owner Occupied Housing Units | 10,461 | 82.4% |
| Renter-Occupied Housing Units | 2,229 | 17.6% |
| Total Occupied Housing Units | 12,690 | 100.0% |
Occupancy by Household Size in Orange County
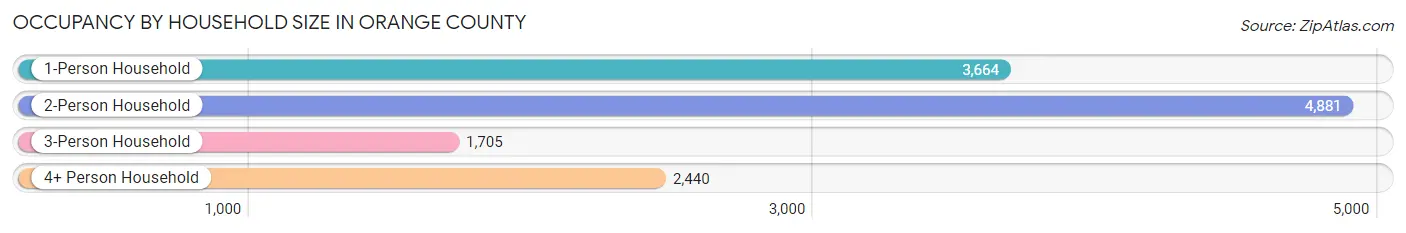
| Household Size | # Housing Units | % Housing Units |
| 1-Person Household | 3,664 | 28.9% |
| 2-Person Household | 4,881 | 38.5% |
| 3-Person Household | 1,705 | 13.4% |
| 4+ Person Household | 2,440 | 19.2% |
| Total Housing Units | 12,690 | 100.0% |
Occupancy by Ownership by Household Size in Orange County
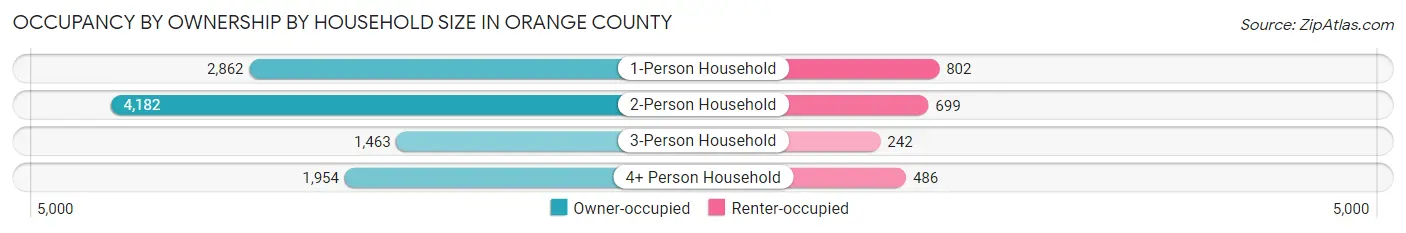
| Household Size | Owner-occupied | Renter-occupied |
| 1-Person Household | 2,862 (78.1%) | 802 (21.9%) |
| 2-Person Household | 4,182 (85.7%) | 699 (14.3%) |
| 3-Person Household | 1,463 (85.8%) | 242 (14.2%) |
| 4+ Person Household | 1,954 (80.1%) | 486 (19.9%) |
| Total Housing Units | 10,461 (82.4%) | 2,229 (17.6%) |
Occupancy by Educational Attainment in Orange County
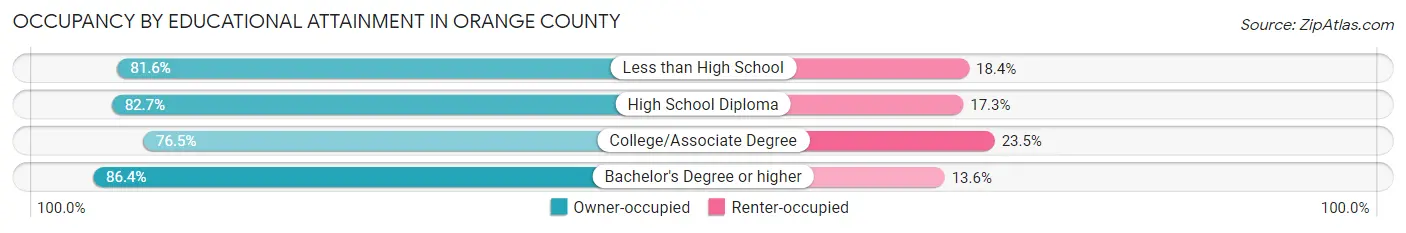
| Household Size | Owner-occupied | Renter-occupied |
| Less than High School | 514 (81.6%) | 116 (18.4%) |
| High School Diploma | 3,054 (82.7%) | 638 (17.3%) |
| College/Associate Degree | 2,607 (76.5%) | 801 (23.5%) |
| Bachelor's Degree or higher | 4,286 (86.4%) | 674 (13.6%) |
Occupancy by Age of Householder in Orange County
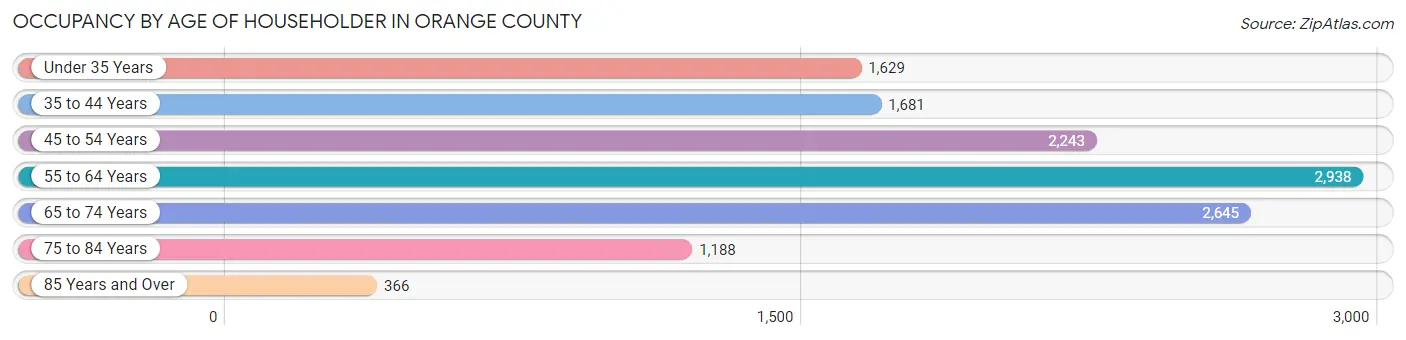
| Age Bracket | # Households | % Households |
| Under 35 Years | 1,629 | 12.8% |
| 35 to 44 Years | 1,681 | 13.3% |
| 45 to 54 Years | 2,243 | 17.7% |
| 55 to 64 Years | 2,938 | 23.2% |
| 65 to 74 Years | 2,645 | 20.8% |
| 75 to 84 Years | 1,188 | 9.4% |
| 85 Years and Over | 366 | 2.9% |
| Total | 12,690 | 100.0% |
Housing Finances in Orange County
Median Income by Occupancy in Orange County
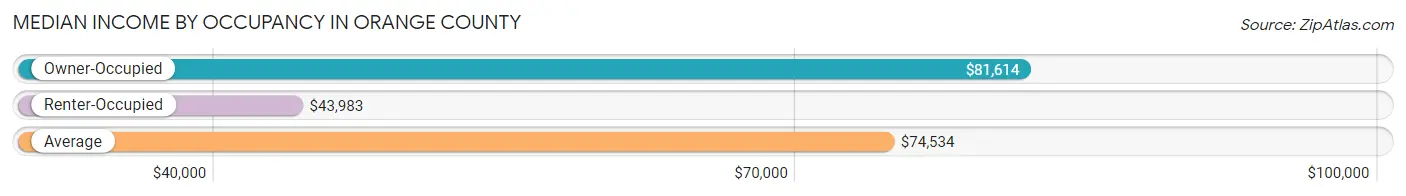
| Occupancy Type | # Households | Median Income |
| Owner-Occupied | 10,461 (82.4%) | $81,614 |
| Renter-Occupied | 2,229 (17.6%) | $43,983 |
| Average | 12,690 (100.0%) | $74,534 |
Occupancy by Householder Income Bracket in Orange County
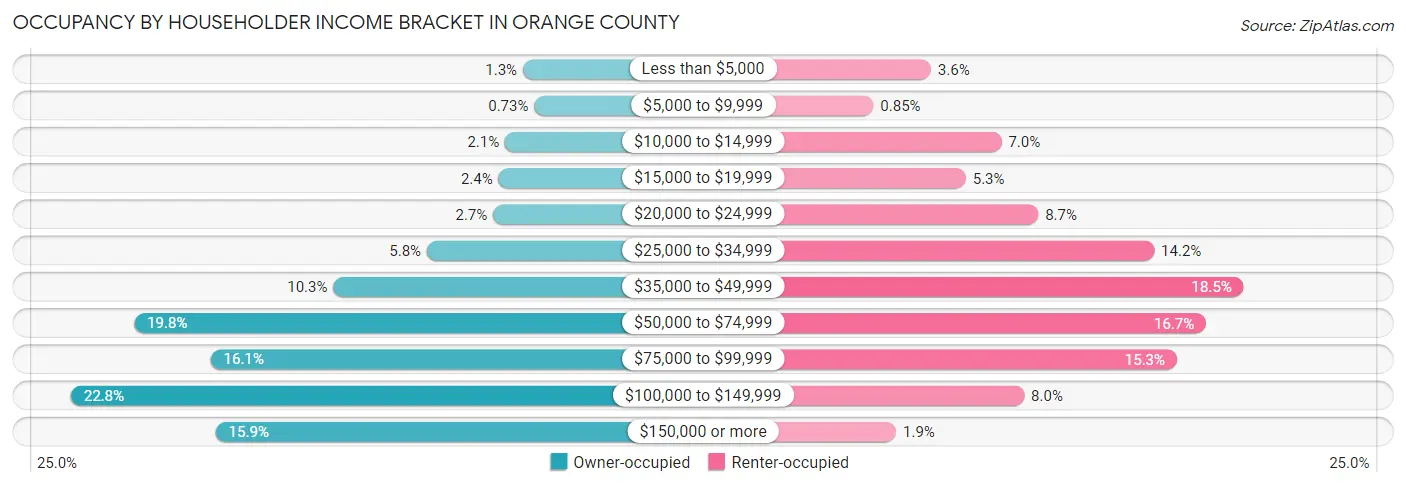
| Income Bracket | Owner-occupied | Renter-occupied |
| Less than $5,000 | 133 (1.3%) | 80 (3.6%) |
| $5,000 to $9,999 | 76 (0.7%) | 19 (0.9%) |
| $10,000 to $14,999 | 222 (2.1%) | 155 (7.0%) |
| $15,000 to $19,999 | 254 (2.4%) | 117 (5.2%) |
| $20,000 to $24,999 | 281 (2.7%) | 194 (8.7%) |
| $25,000 to $34,999 | 611 (5.8%) | 317 (14.2%) |
| $35,000 to $49,999 | 1,078 (10.3%) | 412 (18.5%) |
| $50,000 to $74,999 | 2,070 (19.8%) | 372 (16.7%) |
| $75,000 to $99,999 | 1,688 (16.1%) | 341 (15.3%) |
| $100,000 to $149,999 | 2,385 (22.8%) | 179 (8.0%) |
| $150,000 or more | 1,663 (15.9%) | 43 (1.9%) |
| Total | 10,461 (100.0%) | 2,229 (100.0%) |
Monthly Housing Cost Tiers in Orange County
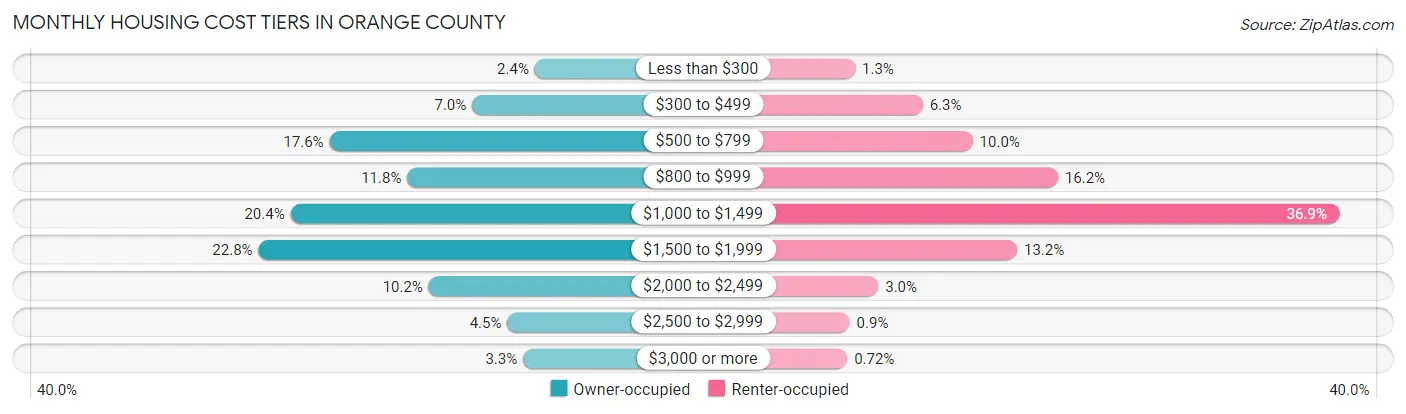
| Monthly Cost | Owner-occupied | Renter-occupied |
| Less than $300 | 254 (2.4%) | 29 (1.3%) |
| $300 to $499 | 736 (7.0%) | 140 (6.3%) |
| $500 to $799 | 1,836 (17.5%) | 222 (10.0%) |
| $800 to $999 | 1,236 (11.8%) | 362 (16.2%) |
| $1,000 to $1,499 | 2,136 (20.4%) | 823 (36.9%) |
| $1,500 to $1,999 | 2,383 (22.8%) | 295 (13.2%) |
| $2,000 to $2,499 | 1,071 (10.2%) | 67 (3.0%) |
| $2,500 to $2,999 | 465 (4.4%) | 20 (0.9%) |
| $3,000 or more | 344 (3.3%) | 16 (0.7%) |
| Total | 10,461 (100.0%) | 2,229 (100.0%) |
Physical Housing Characteristics in Orange County
Housing Structures in Orange County
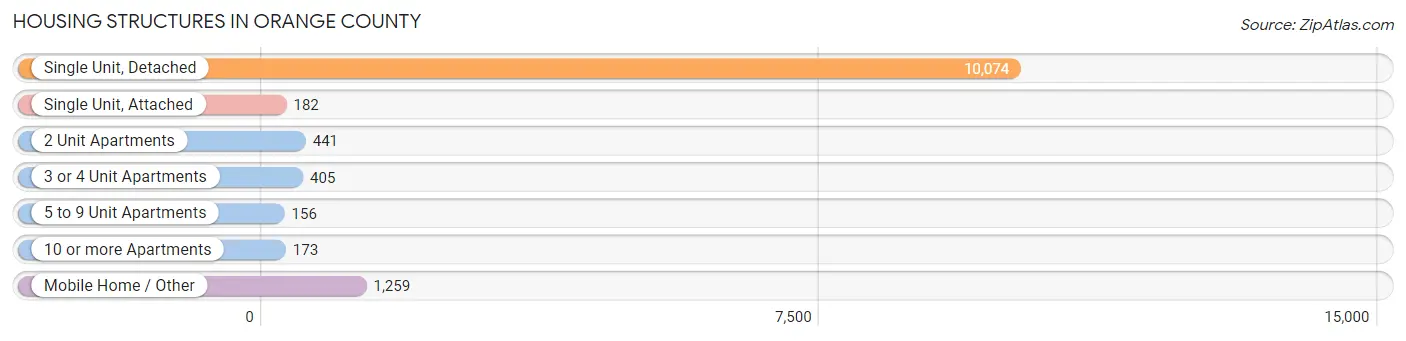
| Structure Type | # Housing Units | % Housing Units |
| Single Unit, Detached | 10,074 | 79.4% |
| Single Unit, Attached | 182 | 1.4% |
| 2 Unit Apartments | 441 | 3.5% |
| 3 or 4 Unit Apartments | 405 | 3.2% |
| 5 to 9 Unit Apartments | 156 | 1.2% |
| 10 or more Apartments | 173 | 1.4% |
| Mobile Home / Other | 1,259 | 9.9% |
| Total | 12,690 | 100.0% |
Housing Structures by Occupancy in Orange County
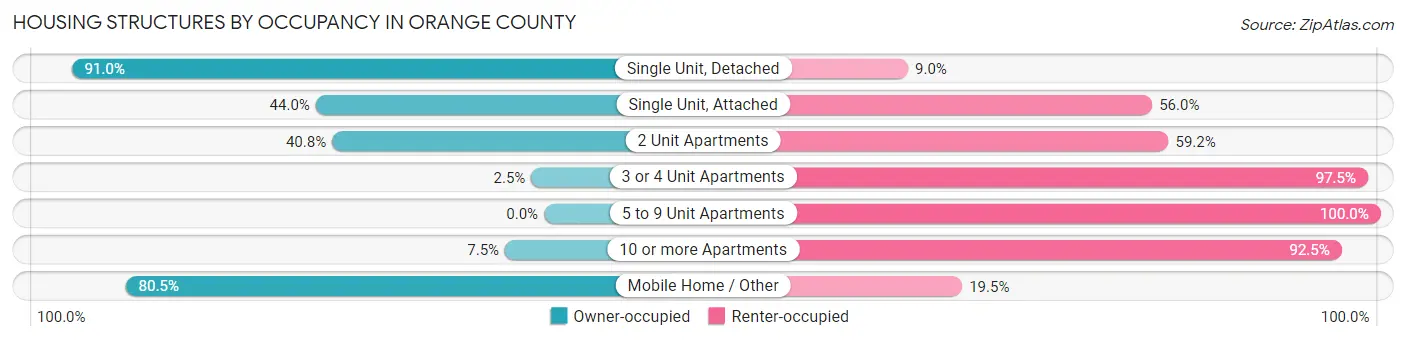
| Structure Type | Owner-occupied | Renter-occupied |
| Single Unit, Detached | 9,164 (91.0%) | 910 (9.0%) |
| Single Unit, Attached | 80 (44.0%) | 102 (56.0%) |
| 2 Unit Apartments | 180 (40.8%) | 261 (59.2%) |
| 3 or 4 Unit Apartments | 10 (2.5%) | 395 (97.5%) |
| 5 to 9 Unit Apartments | 0 (0.0%) | 156 (100.0%) |
| 10 or more Apartments | 13 (7.5%) | 160 (92.5%) |
| Mobile Home / Other | 1,014 (80.5%) | 245 (19.5%) |
| Total | 10,461 (82.4%) | 2,229 (17.6%) |
Housing Structures by Number of Rooms in Orange County
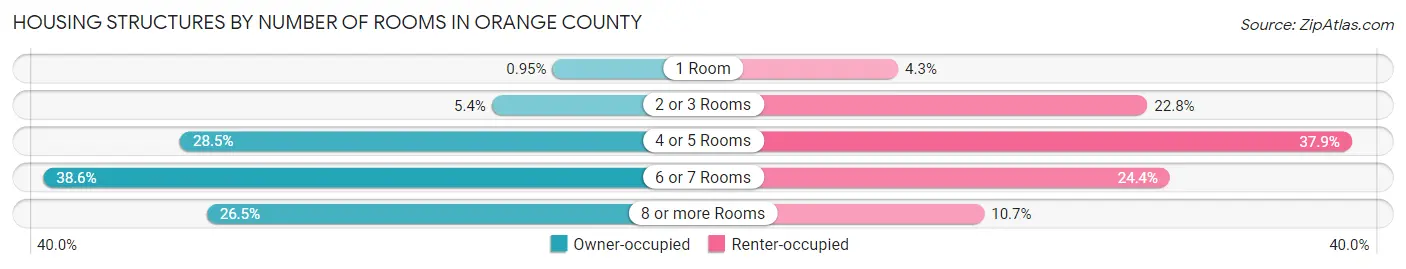
| Number of Rooms | Owner-occupied | Renter-occupied |
| 1 Room | 99 (0.9%) | 96 (4.3%) |
| 2 or 3 Rooms | 569 (5.4%) | 507 (22.8%) |
| 4 or 5 Rooms | 2,980 (28.5%) | 844 (37.9%) |
| 6 or 7 Rooms | 4,039 (38.6%) | 544 (24.4%) |
| 8 or more Rooms | 2,774 (26.5%) | 238 (10.7%) |
| Total | 10,461 (100.0%) | 2,229 (100.0%) |
Housing Structure by Heating Type in Orange County
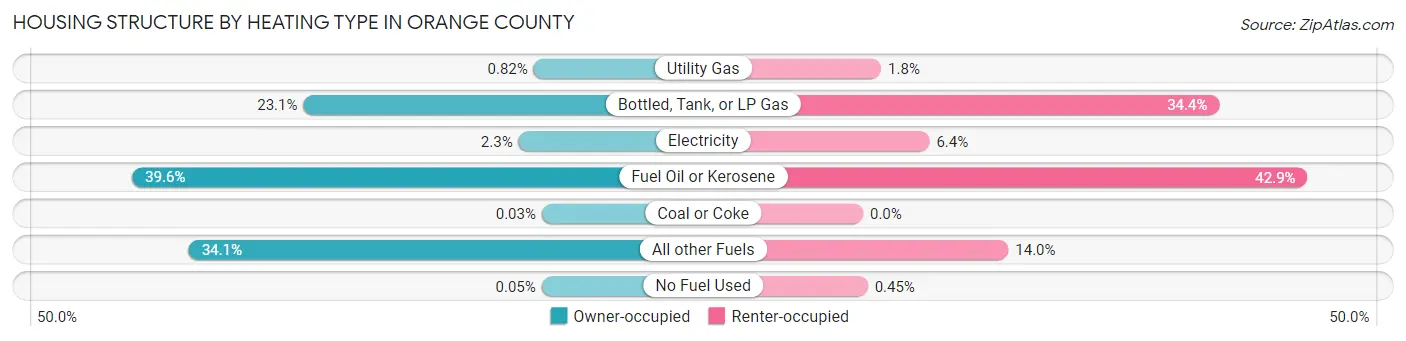
| Heating Type | Owner-occupied | Renter-occupied |
| Utility Gas | 86 (0.8%) | 39 (1.8%) |
| Bottled, Tank, or LP Gas | 2,413 (23.1%) | 767 (34.4%) |
| Electricity | 239 (2.3%) | 143 (6.4%) |
| Fuel Oil or Kerosene | 4,144 (39.6%) | 957 (42.9%) |
| Coal or Coke | 3 (0.0%) | 0 (0.0%) |
| All other Fuels | 3,571 (34.1%) | 313 (14.0%) |
| No Fuel Used | 5 (0.1%) | 10 (0.4%) |
| Total | 10,461 (100.0%) | 2,229 (100.0%) |
Household Vehicle Usage in Orange County
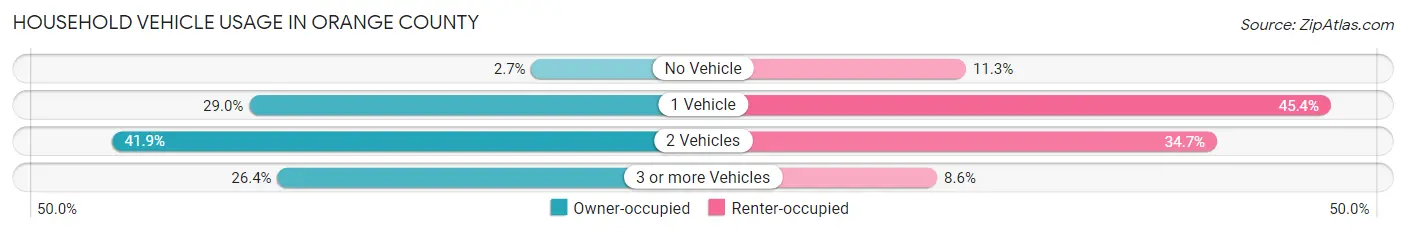
| Vehicles per Household | Owner-occupied | Renter-occupied |
| No Vehicle | 281 (2.7%) | 252 (11.3%) |
| 1 Vehicle | 3,038 (29.0%) | 1,011 (45.4%) |
| 2 Vehicles | 4,380 (41.9%) | 774 (34.7%) |
| 3 or more Vehicles | 2,762 (26.4%) | 192 (8.6%) |
| Total | 10,461 (100.0%) | 2,229 (100.0%) |
Real Estate & Mortgages in Orange County
Real Estate and Mortgage Overview in Orange County
| Characteristic | Without Mortgage | With Mortgage |
| Housing Units | 4,262 | 6,199 |
| Median Property Value | $230,800 | $231,100 |
| Median Household Income | $65,345 | $1,199 |
| Monthly Housing Costs | $728 | $336 |
| Real Estate Taxes | $4,096 | $80 |
Property Value by Mortgage Status in Orange County
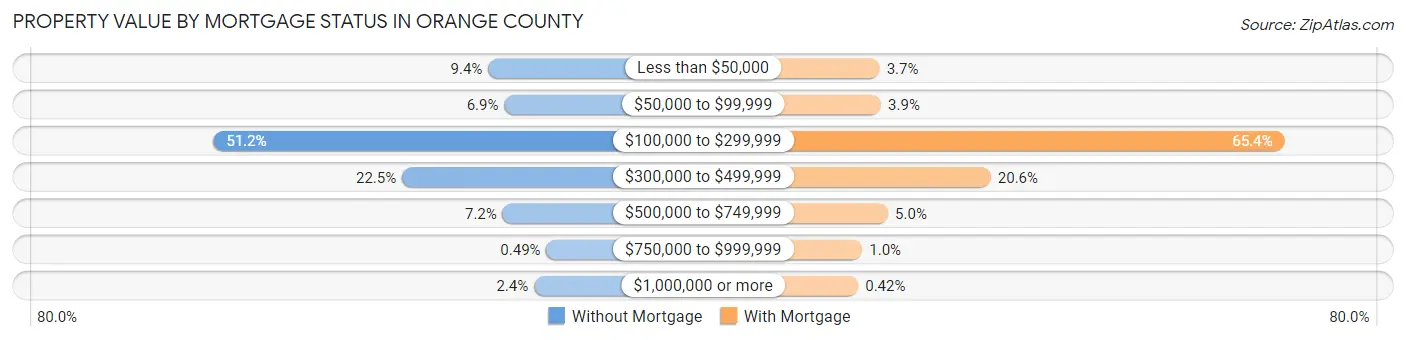
| Property Value | Without Mortgage | With Mortgage |
| Less than $50,000 | 399 (9.4%) | 229 (3.7%) |
| $50,000 to $99,999 | 294 (6.9%) | 242 (3.9%) |
| $100,000 to $299,999 | 2,184 (51.2%) | 4,052 (65.4%) |
| $300,000 to $499,999 | 958 (22.5%) | 1,278 (20.6%) |
| $500,000 to $749,999 | 305 (7.2%) | 308 (5.0%) |
| $750,000 to $999,999 | 21 (0.5%) | 64 (1.0%) |
| $1,000,000 or more | 101 (2.4%) | 26 (0.4%) |
| Total | 4,262 (100.0%) | 6,199 (100.0%) |
Household Income by Mortgage Status in Orange County
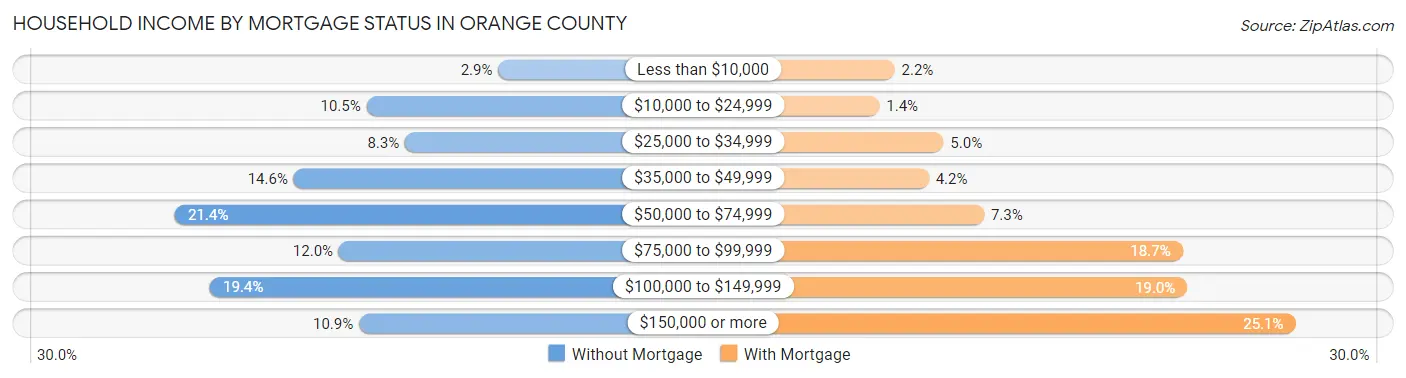
| Household Income | Without Mortgage | With Mortgage |
| Less than $10,000 | 125 (2.9%) | 138 (2.2%) |
| $10,000 to $24,999 | 446 (10.5%) | 84 (1.4%) |
| $25,000 to $34,999 | 352 (8.3%) | 311 (5.0%) |
| $35,000 to $49,999 | 623 (14.6%) | 259 (4.2%) |
| $50,000 to $74,999 | 912 (21.4%) | 455 (7.3%) |
| $75,000 to $99,999 | 513 (12.0%) | 1,158 (18.7%) |
| $100,000 to $149,999 | 827 (19.4%) | 1,175 (19.0%) |
| $150,000 or more | 464 (10.9%) | 1,558 (25.1%) |
| Total | 4,262 (100.0%) | 6,199 (100.0%) |
Property Value to Household Income Ratio in Orange County
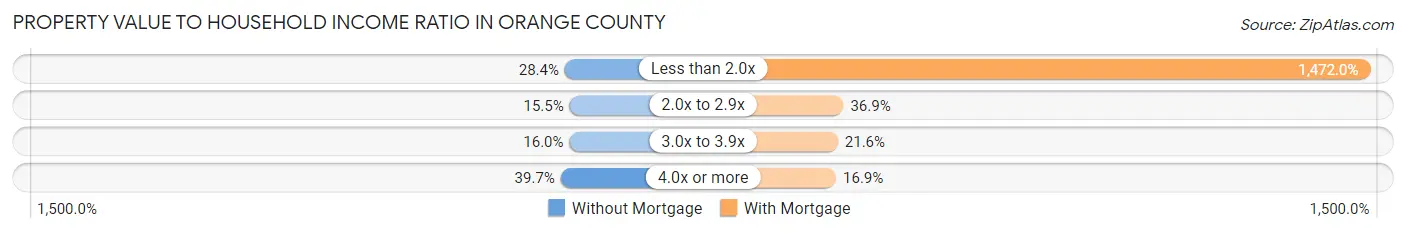
| Value-to-Income Ratio | Without Mortgage | With Mortgage |
| Less than 2.0x | 1,212 (28.4%) | 91,250 (1,472.0%) |
| 2.0x to 2.9x | 661 (15.5%) | 2,287 (36.9%) |
| 3.0x to 3.9x | 681 (16.0%) | 1,340 (21.6%) |
| 4.0x or more | 1,691 (39.7%) | 1,047 (16.9%) |
| Total | 4,262 (100.0%) | 6,199 (100.0%) |
Real Estate Taxes by Mortgage Status in Orange County

| Property Taxes | Without Mortgage | With Mortgage |
| Less than $800 | 287 (6.7%) | 7 (0.1%) |
| $800 to $1,499 | 214 (5.0%) | 145 (2.3%) |
| $800 to $1,499 | 3,678 (86.3%) | 103 (1.7%) |
| Total | 4,262 (100.0%) | 6,199 (100.0%) |
Health & Disability in Orange County
Health Insurance Coverage by Age in Orange County
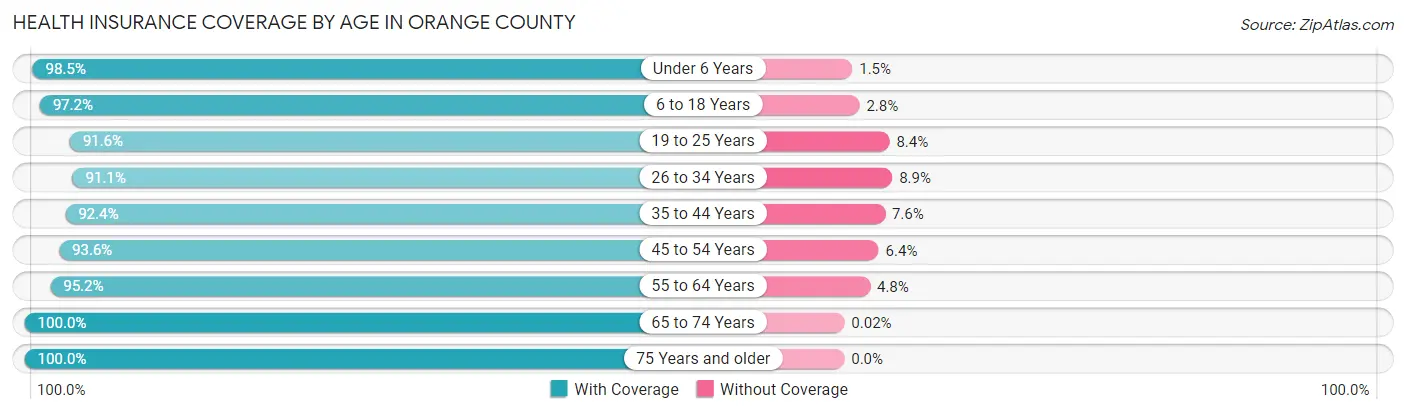
| Age Bracket | With Coverage | Without Coverage |
| Under 6 Years | 1,459 (98.5%) | 22 (1.5%) |
| 6 to 18 Years | 4,155 (97.2%) | 121 (2.8%) |
| 19 to 25 Years | 1,892 (91.6%) | 174 (8.4%) |
| 26 to 34 Years | 2,659 (91.1%) | 261 (8.9%) |
| 35 to 44 Years | 3,206 (92.4%) | 263 (7.6%) |
| 45 to 54 Years | 3,519 (93.6%) | 241 (6.4%) |
| 55 to 64 Years | 4,681 (95.2%) | 236 (4.8%) |
| 65 to 74 Years | 4,157 (100.0%) | 1 (0.0%) |
| 75 Years and older | 2,302 (100.0%) | 0 (0.0%) |
| Total | 28,030 (95.5%) | 1,319 (4.5%) |
Health Insurance Coverage by Citizenship Status in Orange County
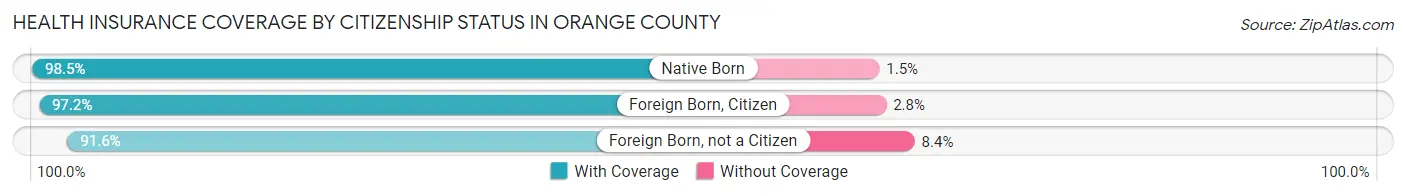
| Citizenship Status | With Coverage | Without Coverage |
| Native Born | 1,459 (98.5%) | 22 (1.5%) |
| Foreign Born, Citizen | 4,155 (97.2%) | 121 (2.8%) |
| Foreign Born, not a Citizen | 1,892 (91.6%) | 174 (8.4%) |
Health Insurance Coverage by Household Income in Orange County
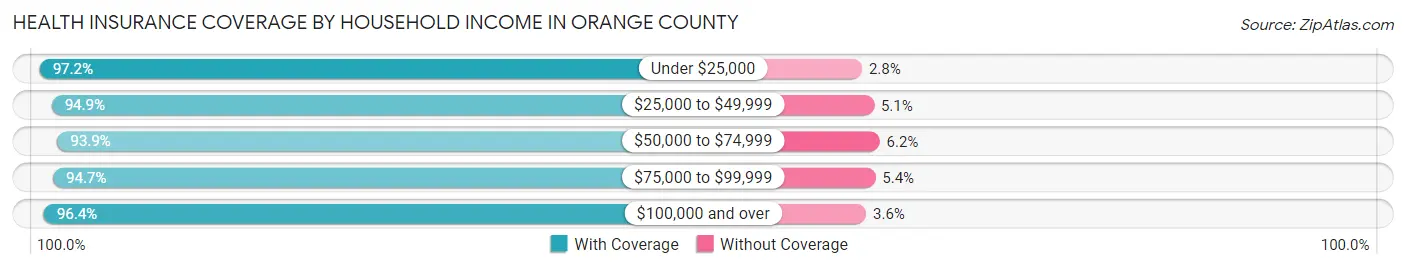
| Household Income | With Coverage | Without Coverage |
| Under $25,000 | 1,913 (97.2%) | 56 (2.8%) |
| $25,000 to $49,999 | 4,642 (94.9%) | 249 (5.1%) |
| $50,000 to $74,999 | 4,653 (93.9%) | 305 (6.1%) |
| $75,000 to $99,999 | 4,793 (94.7%) | 271 (5.3%) |
| $100,000 and over | 11,507 (96.4%) | 432 (3.6%) |
Public vs Private Health Insurance Coverage by Age in Orange County
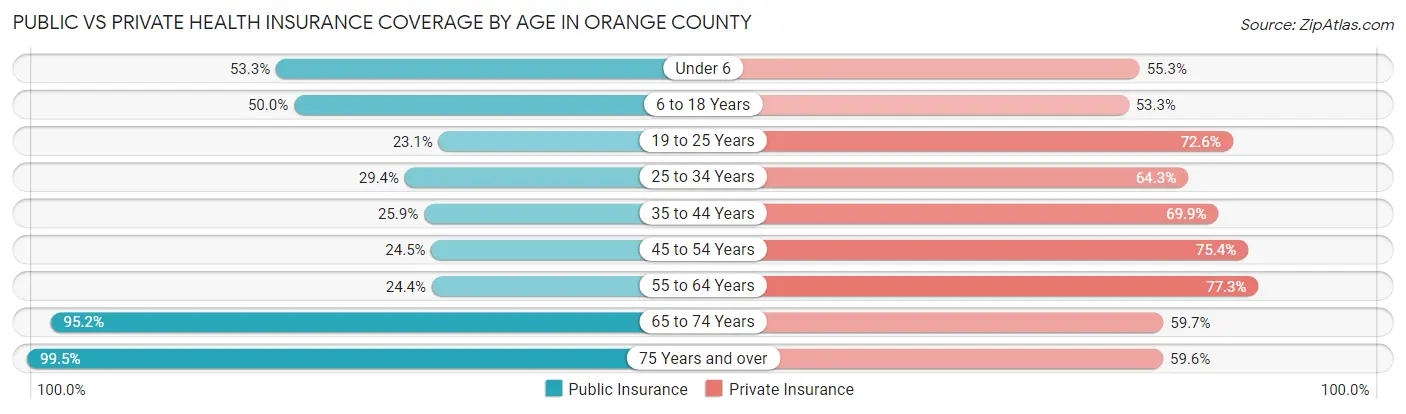
| Age Bracket | Public Insurance | Private Insurance |
| Under 6 | 790 (53.3%) | 819 (55.3%) |
| 6 to 18 Years | 2,138 (50.0%) | 2,277 (53.2%) |
| 19 to 25 Years | 478 (23.1%) | 1,499 (72.6%) |
| 25 to 34 Years | 859 (29.4%) | 1,876 (64.2%) |
| 35 to 44 Years | 897 (25.9%) | 2,424 (69.9%) |
| 45 to 54 Years | 921 (24.5%) | 2,835 (75.4%) |
| 55 to 64 Years | 1,200 (24.4%) | 3,801 (77.3%) |
| 65 to 74 Years | 3,957 (95.2%) | 2,482 (59.7%) |
| 75 Years and over | 2,291 (99.5%) | 1,373 (59.6%) |
| Total | 13,531 (46.1%) | 19,386 (66.0%) |
Disability Status by Sex by Age in Orange County
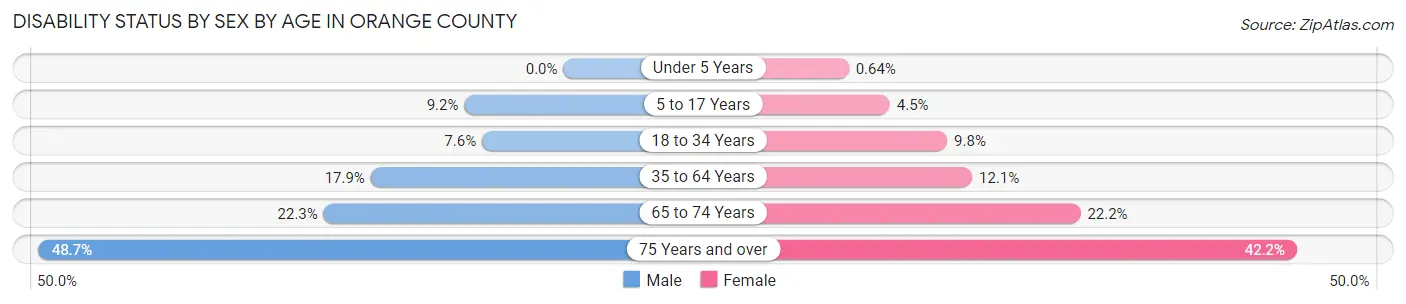
| Age Bracket | Male | Female |
| Under 5 Years | 0 (0.0%) | 4 (0.6%) |
| 5 to 17 Years | 194 (9.2%) | 84 (4.5%) |
| 18 to 34 Years | 216 (7.5%) | 257 (9.8%) |
| 35 to 64 Years | 1,089 (17.9%) | 732 (12.1%) |
| 65 to 74 Years | 457 (22.3%) | 466 (22.2%) |
| 75 Years and over | 497 (48.7%) | 541 (42.2%) |
Disability Class by Sex by Age in Orange County
Disability Class: Hearing Difficulty
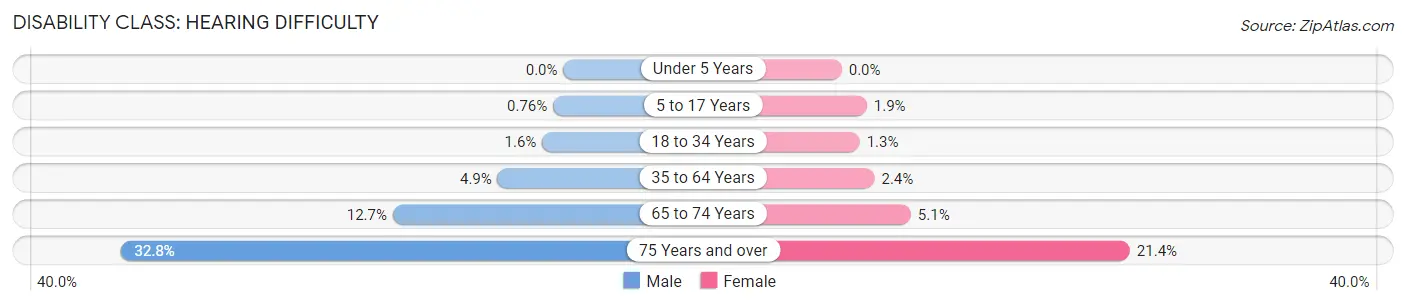
| Age Bracket | Male | Female |
| Under 5 Years | 0 (0.0%) | 0 (0.0%) |
| 5 to 17 Years | 16 (0.8%) | 35 (1.9%) |
| 18 to 34 Years | 45 (1.6%) | 35 (1.3%) |
| 35 to 64 Years | 297 (4.9%) | 147 (2.4%) |
| 65 to 74 Years | 260 (12.7%) | 108 (5.1%) |
| 75 Years and over | 335 (32.8%) | 274 (21.4%) |
Disability Class: Vision Difficulty
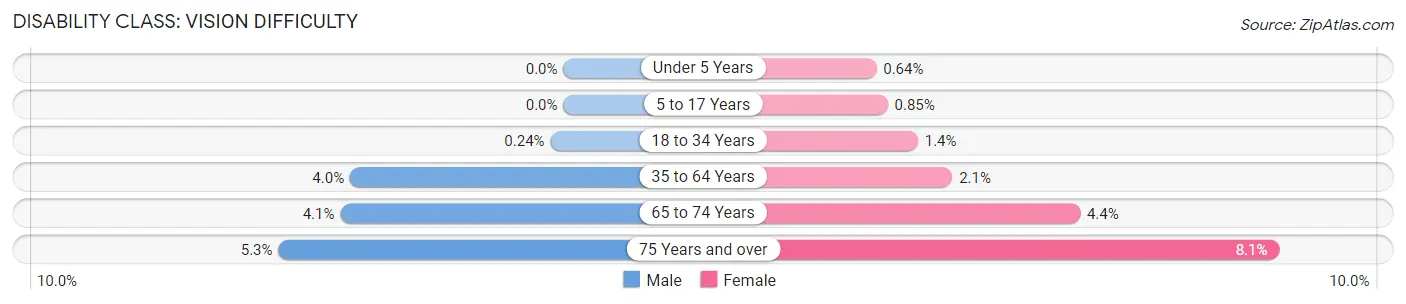
| Age Bracket | Male | Female |
| Under 5 Years | 0 (0.0%) | 4 (0.6%) |
| 5 to 17 Years | 0 (0.0%) | 16 (0.9%) |
| 18 to 34 Years | 7 (0.2%) | 37 (1.4%) |
| 35 to 64 Years | 241 (4.0%) | 124 (2.1%) |
| 65 to 74 Years | 85 (4.1%) | 93 (4.4%) |
| 75 Years and over | 54 (5.3%) | 104 (8.1%) |
Disability Class: Cognitive Difficulty
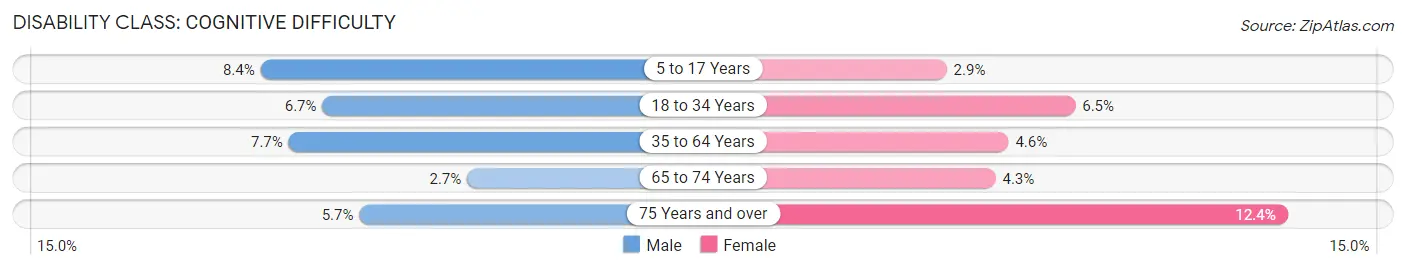
| Age Bracket | Male | Female |
| 5 to 17 Years | 178 (8.4%) | 55 (2.9%) |
| 18 to 34 Years | 192 (6.7%) | 171 (6.5%) |
| 35 to 64 Years | 466 (7.6%) | 281 (4.6%) |
| 65 to 74 Years | 55 (2.7%) | 90 (4.3%) |
| 75 Years and over | 58 (5.7%) | 159 (12.4%) |
Disability Class: Ambulatory Difficulty
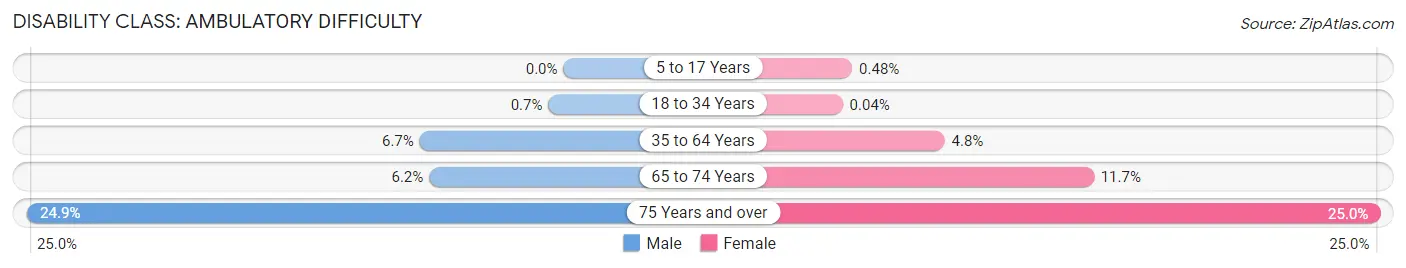
| Age Bracket | Male | Female |
| 5 to 17 Years | 0 (0.0%) | 9 (0.5%) |
| 18 to 34 Years | 20 (0.7%) | 1 (0.0%) |
| 35 to 64 Years | 406 (6.7%) | 289 (4.8%) |
| 65 to 74 Years | 128 (6.2%) | 246 (11.7%) |
| 75 Years and over | 254 (24.9%) | 320 (25.0%) |
Disability Class: Self-Care Difficulty
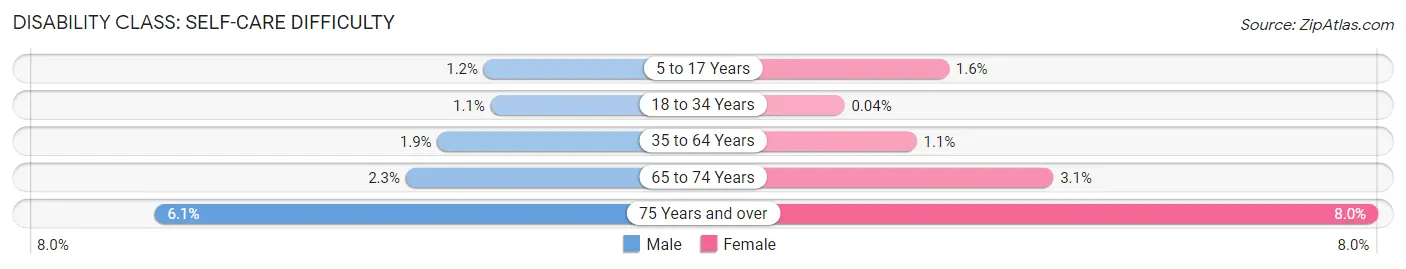
| Age Bracket | Male | Female |
| 5 to 17 Years | 25 (1.2%) | 30 (1.6%) |
| 18 to 34 Years | 31 (1.1%) | 1 (0.0%) |
| 35 to 64 Years | 114 (1.9%) | 67 (1.1%) |
| 65 to 74 Years | 48 (2.3%) | 66 (3.1%) |
| 75 Years and over | 62 (6.1%) | 102 (8.0%) |
Technology Access in Orange County
Computing Device Access in Orange County
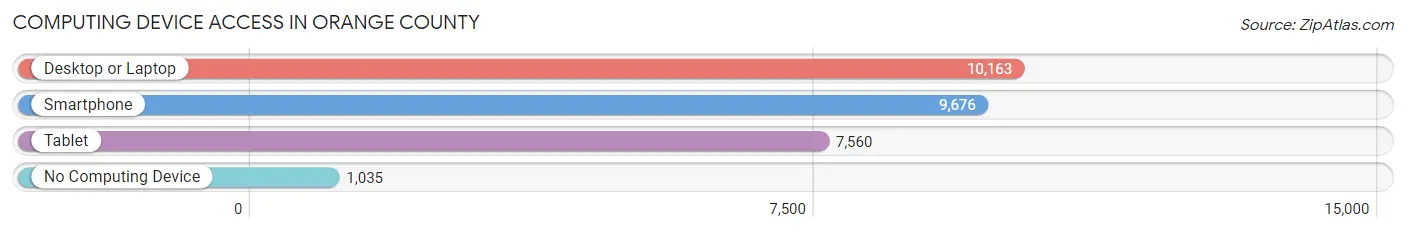
| Device Type | # Households | % Households |
| Desktop or Laptop | 10,163 | 80.1% |
| Smartphone | 9,676 | 76.2% |
| Tablet | 7,560 | 59.6% |
| No Computing Device | 1,035 | 8.2% |
| Total | 12,690 | 100.0% |
Internet Access in Orange County
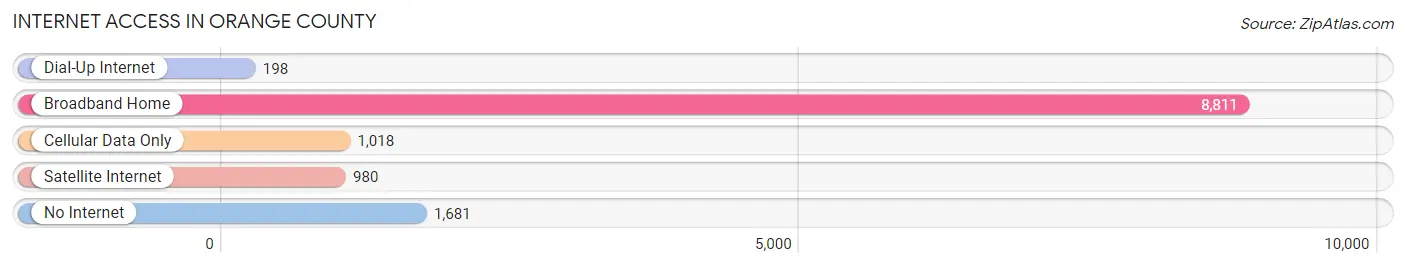
| Internet Type | # Households | % Households |
| Dial-Up Internet | 198 | 1.6% |
| Broadband Home | 8,811 | 69.4% |
| Cellular Data Only | 1,018 | 8.0% |
| Satellite Internet | 980 | 7.7% |
| No Internet | 1,681 | 13.3% |
| Total | 12,690 | 100.0% |
Orange County Summary
Orange County, Vermont is a county located in the state of Vermont in the United States. It is the second least populous county in the state, with a population of 28,936 as of the 2010 census. The county seat is Chelsea.
Geography
Orange County is located in the central part of Vermont, and is bordered by Washington County to the north, Caledonia County to the east, Windsor County to the south, and Addison County to the west. The county has a total area of 517 square miles, of which 514 square miles is land and 3.2 square miles (0.6%) is water. The highest point in the county is Mount Hunger, at 3,906 feet.
The county is home to several rivers, including the White River, the Winooski River, and the Connecticut River. The county also contains several lakes, including Lake Fairlee, Lake Morey, and Lake Rescue.
Economy
The economy of Orange County is largely based on agriculture and tourism. The county is home to several dairy farms, as well as apple orchards and maple syrup producers. The county is also home to several ski resorts, including Killington Ski Resort, Okemo Mountain Resort, and Mount Snow.
Demographics
As of the 2010 census, there were 28,936 people, 11,845 households, and 7,945 families residing in the county. The population density was 56.3 people per square mile. The racial makeup of the county was 96.3% White, 0.7% African American, 0.3% Native American, 0.5% Asian, 0.1% Pacific Islander, 0.5% from other races, and 1.6% from two or more races. Hispanic or Latino of any race were 1.7% of the population.
The median income for a household in the county was $45,945, and the median income for a family was $54,945. The per capita income for the county was $24,945. About 8.3% of families and 11.2% of the population were below the poverty line, including 14.2% of those under age 18 and 8.2% of those age 65 or over.
Conclusion
Orange County, Vermont is a rural county located in the central part of the state. The county is home to several dairy farms, apple orchards, maple syrup producers, and ski resorts. The population of the county is largely white, with a median household income of $45,945. The county is also home to several rivers and lakes, making it a popular destination for tourists.
Common Questions
What is the Total Population of Orange County?
Total Population of Orange County is 29,439.
What is the Total Male Population of Orange County?
Total Male Population of Orange County is 14,820.
What is the Total Female Population of Orange County?
Total Female Population of Orange County is 14,619.
What is the Ratio of Males per 100 Females in Orange County?
There are 101.37 Males per 100 Females in Orange County.
What is the Ratio of Females per 100 Males in Orange County?
There are 98.64 Females per 100 Males in Orange County.
What is the Median Population Age in Orange County?
Median Population Age in Orange County is 46.6 Years.
What is the Average Family Size in Orange County
Average Family Size in Orange County is 2.7 People.
What is the Average Household Size in Orange County
Average Household Size in Orange County is 2.3 People.
What is Per Capita Income in Orange County?
Per Capita income in Orange County is $38,709.
What is the Median Family Income in Orange County?
Median Family Income in Orange County is $87,560.
What is the Median Household income in Orange County?
Median Household Income in Orange County is $74,534.
What is Income or Wage Gap in Orange County?
Income or Wage Gap in Orange County is 14.5%.
Women in Orange County earn 85.5 cents for every dollar earned by a man.
What is Family Income Deficit in Orange County?
Family Income Deficit in Orange County is $7,216.
Families that are below poverty line in Orange County earn $7,216 less on average than the poverty threshold level.
What is Inequality or Gini Index in Orange County?
Inequality or Gini Index in Orange County is 0.39.
How Large is the Labor Force in Orange County?
There are 16,597 People in the Labor Forcein in Orange County.
What is the Percentage of People in the Labor Force in Orange County?
66.8% of People are in the Labor Force in Orange County.
What is the Unemployment Rate in Orange County?
Unemployment Rate in Orange County is 3.1%.