Lamoille County, VT
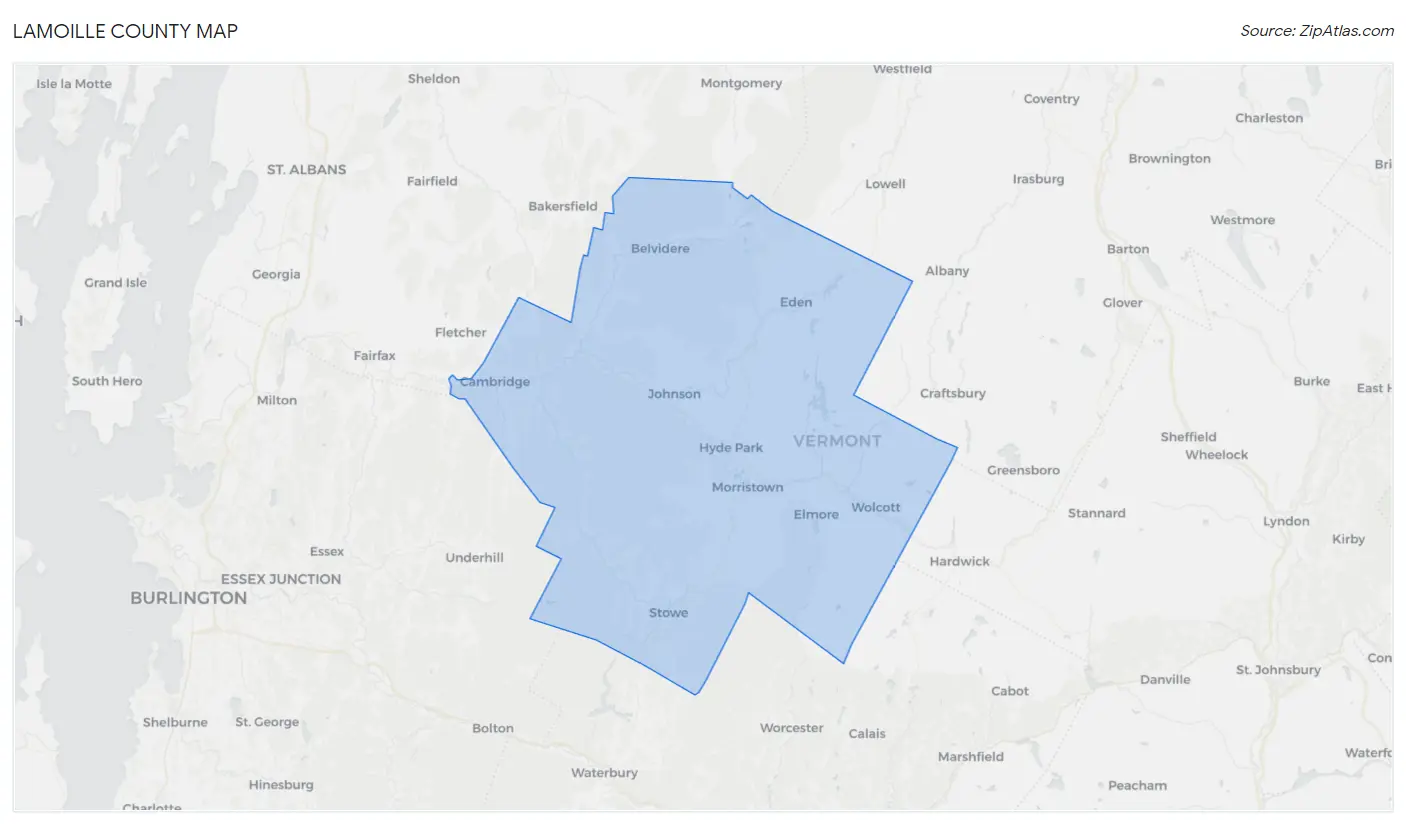
Lamoille County Map
Lamoille County Overview
25,977
TOTAL POPULATION
13,023
MALE POPULATION
12,954
FEMALE POPULATION
100.53
MALES / 100 FEMALES
99.47
FEMALES / 100 MALES
41.0
MEDIAN AGE
2.8
AVG FAMILY SIZE
2.3
AVG HOUSEHOLD SIZE
$42,778
PER CAPITA INCOME
$87,358
AVG FAMILY INCOME
$69,886
AVG HOUSEHOLD INCOME
18.0%
WAGE / INCOME GAP [ % ]
82.0¢/ $1
WAGE / INCOME GAP [ $ ]
$10,640
FAMILY INCOME DEFICIT
0.46
INEQUALITY / GINI INDEX
14,516
LABOR FORCE [ PEOPLE ]
67.7%
PERCENT IN LABOR FORCE
3.9%
UNEMPLOYMENT RATE
Lamoille County Area Codes
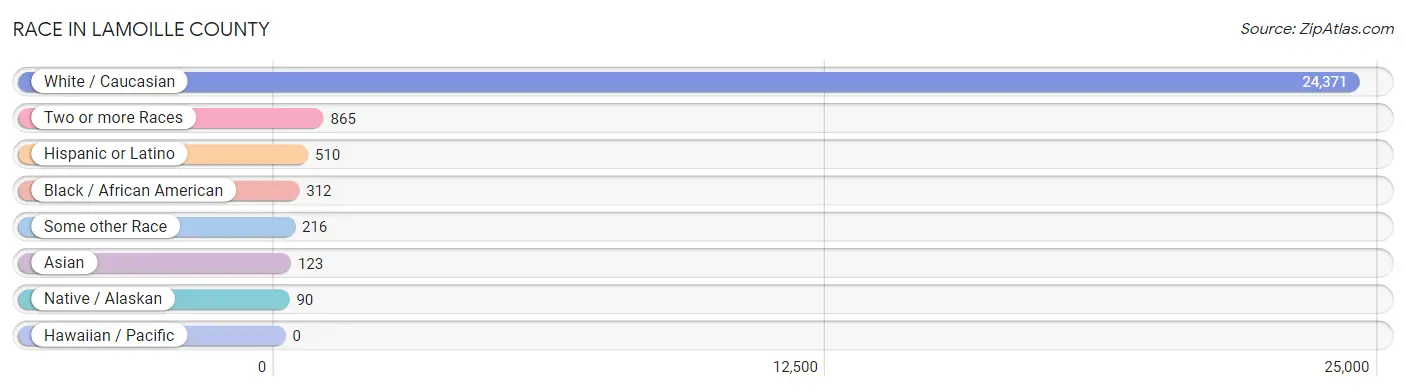
Race in Lamoille County
The most populous races in Lamoille County are White / Caucasian (24,371 | 93.8%), Two or more Races (865 | 3.3%), and Hispanic or Latino (510 | 2.0%).
| Race | # Population | % Population |
| Asian | 123 | 0.5% |
| Black / African American | 312 | 1.2% |
| Hawaiian / Pacific | 0 | 0.0% |
| Hispanic or Latino | 510 | 2.0% |
| Native / Alaskan | 90 | 0.4% |
| White / Caucasian | 24,371 | 93.8% |
| Two or more Races | 865 | 3.3% |
| Some other Race | 216 | 0.8% |
| Total | 25,977 | 100.0% |
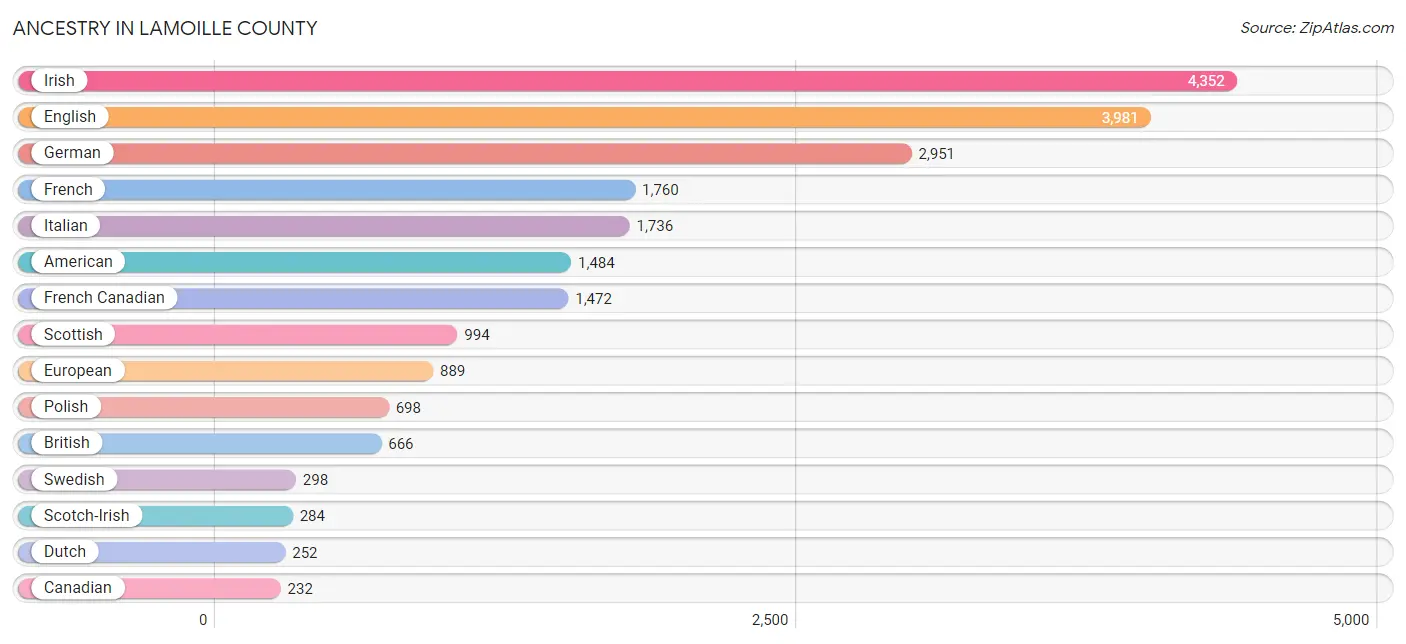
Ancestry in Lamoille County
The most populous ancestries reported in Lamoille County are Irish (4,352 | 16.8%), English (3,981 | 15.3%), German (2,951 | 11.4%), French (1,760 | 6.8%), and Italian (1,736 | 6.7%), together accounting for 56.9% of all Lamoille County residents.
| Ancestry | # Population | % Population |
| African | 89 | 0.3% |
| American | 1,484 | 5.7% |
| Arab | 93 | 0.4% |
| Armenian | 11 | 0.0% |
| Austrian | 64 | 0.3% |
| Belgian | 7 | 0.0% |
| Bhutanese | 33 | 0.1% |
| Blackfeet | 52 | 0.2% |
| Bolivian | 7 | 0.0% |
| British | 666 | 2.6% |
| British West Indian | 9 | 0.0% |
| Bulgarian | 2 | 0.0% |
| Burmese | 54 | 0.2% |
| Canadian | 232 | 0.9% |
| Celtic | 6 | 0.0% |
| Central American | 106 | 0.4% |
| Central American Indian | 6 | 0.0% |
| Cherokee | 162 | 0.6% |
| Chippewa | 4 | 0.0% |
| Colombian | 49 | 0.2% |
| Cree | 7 | 0.0% |
| Creek | 1 | 0.0% |
| Cuban | 32 | 0.1% |
| Czech | 66 | 0.3% |
| Czechoslovakian | 2 | 0.0% |
| Danish | 57 | 0.2% |
| Dominican | 20 | 0.1% |
| Dutch | 252 | 1.0% |
| Eastern European | 42 | 0.2% |
| English | 3,981 | 15.3% |
| European | 889 | 3.4% |
| Finnish | 77 | 0.3% |
| French | 1,760 | 6.8% |
| French American Indian | 74 | 0.3% |
| French Canadian | 1,472 | 5.7% |
| German | 2,951 | 11.4% |
| Greek | 25 | 0.1% |
| Haitian | 5 | 0.0% |
| Hungarian | 98 | 0.4% |
| Icelander | 2 | 0.0% |
| Indian (Asian) | 45 | 0.2% |
| Iranian | 5 | 0.0% |
| Irish | 4,352 | 16.8% |
| Iroquois | 24 | 0.1% |
| Italian | 1,736 | 6.7% |
| Jamaican | 45 | 0.2% |
| Kenyan | 35 | 0.1% |
| Korean | 15 | 0.1% |
| Latvian | 32 | 0.1% |
| Lebanese | 79 | 0.3% |
| Lithuanian | 98 | 0.4% |
| Maltese | 27 | 0.1% |
| Mexican | 122 | 0.5% |
| Native Hawaiian | 17 | 0.1% |
| Northern European | 50 | 0.2% |
| Norwegian | 131 | 0.5% |
| Panamanian | 5 | 0.0% |
| Pennsylvania German | 6 | 0.0% |
| Peruvian | 4 | 0.0% |
| Polish | 698 | 2.7% |
| Portuguese | 47 | 0.2% |
| Puerto Rican | 92 | 0.4% |
| Romanian | 33 | 0.1% |
| Russian | 142 | 0.5% |
| Salvadoran | 101 | 0.4% |
| Scandinavian | 104 | 0.4% |
| Scotch-Irish | 284 | 1.1% |
| Scottish | 994 | 3.8% |
| Serbian | 49 | 0.2% |
| Slavic | 8 | 0.0% |
| Slovak | 19 | 0.1% |
| Somali | 5 | 0.0% |
| South American | 73 | 0.3% |
| Spaniard | 48 | 0.2% |
| Spanish | 10 | 0.0% |
| Sri Lankan | 2 | 0.0% |
| Subsaharan African | 106 | 0.4% |
| Swedish | 298 | 1.1% |
| Swiss | 93 | 0.4% |
| Syrian | 7 | 0.0% |
| Thai | 37 | 0.1% |
| Turkish | 14 | 0.1% |
| Ukrainian | 86 | 0.3% |
| Venezuelan | 13 | 0.1% |
| Welsh | 118 | 0.4% |
| Yugoslavian | 8 | 0.0% | View All 86 Rows |
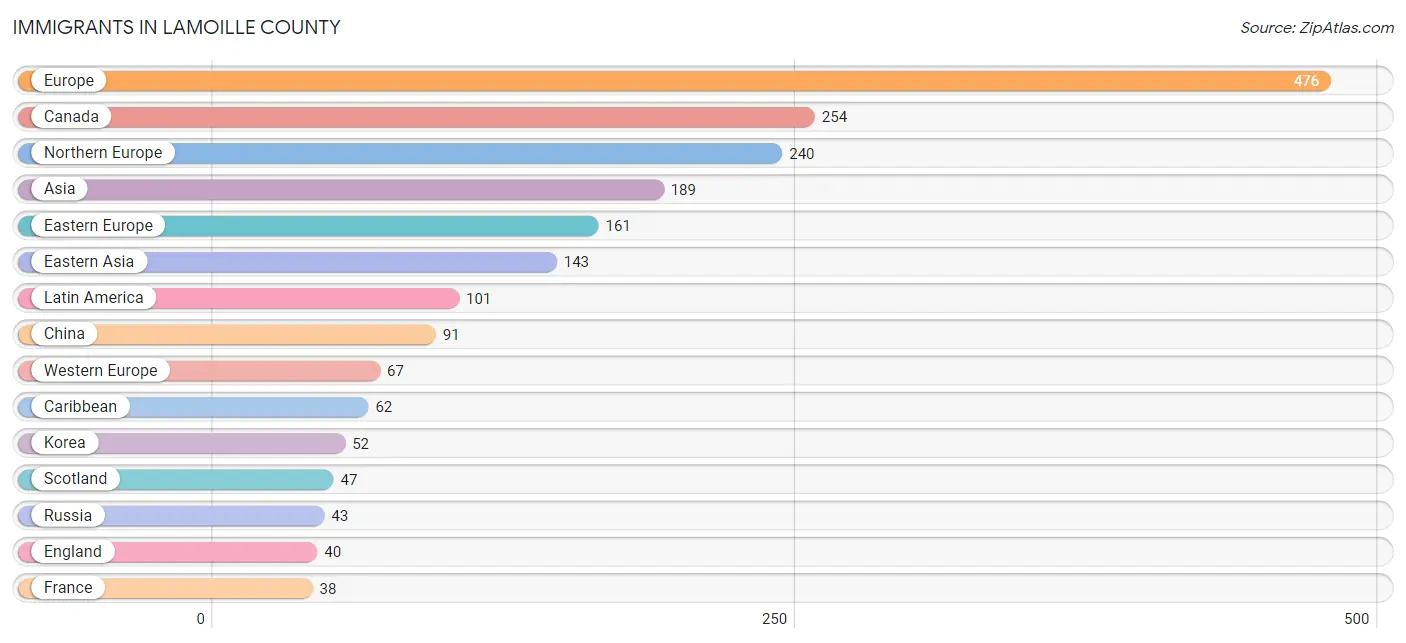
Immigrants in Lamoille County
The most numerous immigrant groups reported in Lamoille County came from Europe (476 | 1.8%), Canada (254 | 1.0%), Northern Europe (240 | 0.9%), Asia (189 | 0.7%), and Eastern Europe (161 | 0.6%), together accounting for 5.1% of all Lamoille County residents.
| Immigration Origin | # Population | % Population |
| Africa | 8 | 0.0% |
| Asia | 189 | 0.7% |
| Australia | 12 | 0.1% |
| Austria | 4 | 0.0% |
| Barbados | 5 | 0.0% |
| Belgium | 9 | 0.0% |
| Bulgaria | 3 | 0.0% |
| Canada | 254 | 1.0% |
| Caribbean | 62 | 0.2% |
| Central America | 12 | 0.1% |
| China | 91 | 0.4% |
| Colombia | 14 | 0.1% |
| Czechoslovakia | 36 | 0.1% |
| Dominican Republic | 10 | 0.0% |
| Eastern Africa | 5 | 0.0% |
| Eastern Asia | 143 | 0.5% |
| Eastern Europe | 161 | 0.6% |
| England | 40 | 0.2% |
| Europe | 476 | 1.8% |
| France | 38 | 0.2% |
| Germany | 16 | 0.1% |
| Greece | 8 | 0.0% |
| Haiti | 5 | 0.0% |
| Hong Kong | 25 | 0.1% |
| India | 17 | 0.1% |
| Iran | 4 | 0.0% |
| Israel | 13 | 0.1% |
| Jamaica | 31 | 0.1% |
| Kenya | 5 | 0.0% |
| Korea | 52 | 0.2% |
| Latin America | 101 | 0.4% |
| Liberia | 3 | 0.0% |
| Mexico | 12 | 0.1% |
| Northern Europe | 240 | 0.9% |
| Oceania | 12 | 0.1% |
| Philippines | 11 | 0.0% |
| Poland | 9 | 0.0% |
| Romania | 5 | 0.0% |
| Russia | 43 | 0.2% |
| Scotland | 47 | 0.2% |
| Serbia | 26 | 0.1% |
| South America | 27 | 0.1% |
| South Central Asia | 21 | 0.1% |
| South Eastern Asia | 12 | 0.1% |
| Southern Europe | 8 | 0.0% |
| Trinidad and Tobago | 11 | 0.0% |
| Ukraine | 27 | 0.1% |
| Venezuela | 13 | 0.1% |
| Vietnam | 1 | 0.0% |
| Western Africa | 3 | 0.0% |
| Western Asia | 13 | 0.1% |
| Western Europe | 67 | 0.3% | View All 52 Rows |
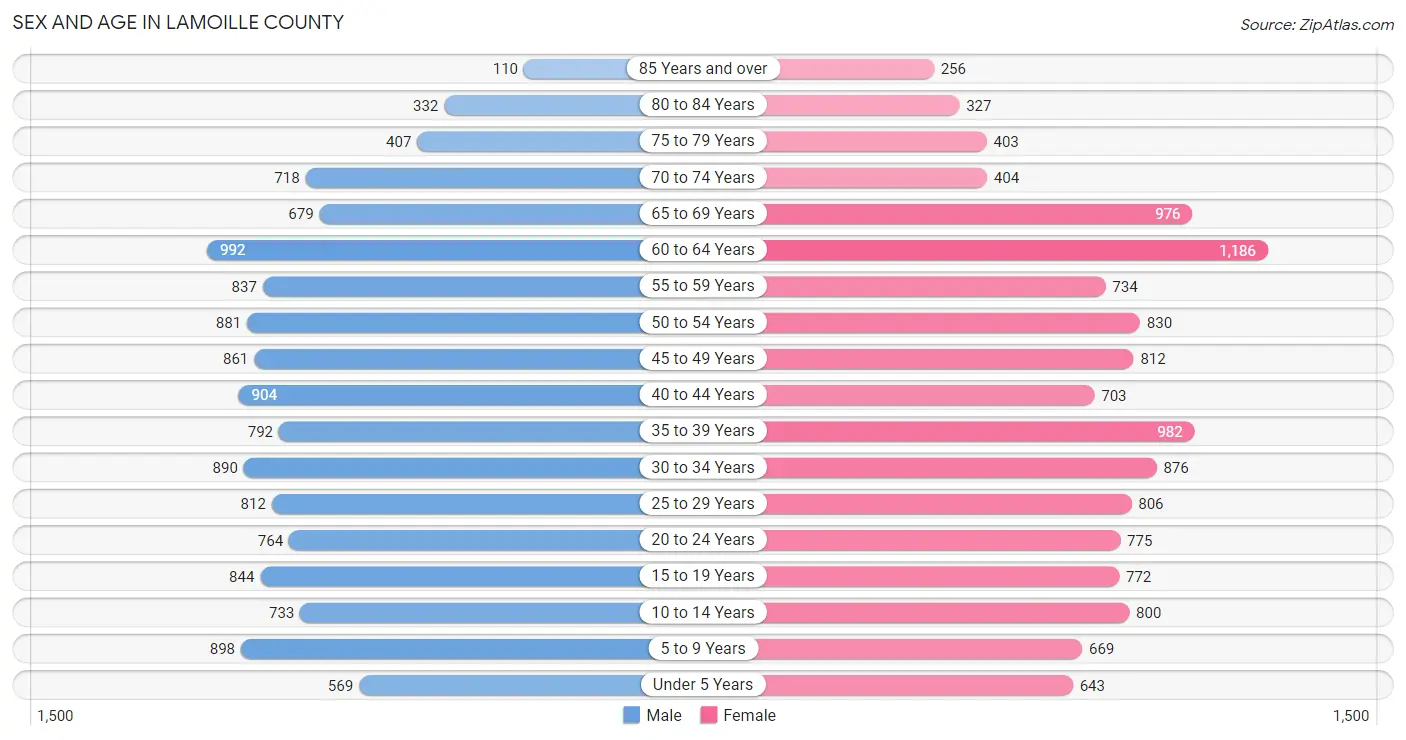
Sex and Age in Lamoille County
Sex and Age in Lamoille County
The most populous age groups in Lamoille County are 60 to 64 Years (992 | 7.6%) for men and 60 to 64 Years (1,186 | 9.2%) for women.
| Age Bracket | Male | Female |
| Under 5 Years | 569 (4.4%) | 643 (5.0%) |
| 5 to 9 Years | 898 (6.9%) | 669 (5.2%) |
| 10 to 14 Years | 733 (5.6%) | 800 (6.2%) |
| 15 to 19 Years | 844 (6.5%) | 772 (6.0%) |
| 20 to 24 Years | 764 (5.9%) | 775 (6.0%) |
| 25 to 29 Years | 812 (6.2%) | 806 (6.2%) |
| 30 to 34 Years | 890 (6.8%) | 876 (6.8%) |
| 35 to 39 Years | 792 (6.1%) | 982 (7.6%) |
| 40 to 44 Years | 904 (6.9%) | 703 (5.4%) |
| 45 to 49 Years | 861 (6.6%) | 812 (6.3%) |
| 50 to 54 Years | 881 (6.8%) | 830 (6.4%) |
| 55 to 59 Years | 837 (6.4%) | 734 (5.7%) |
| 60 to 64 Years | 992 (7.6%) | 1,186 (9.2%) |
| 65 to 69 Years | 679 (5.2%) | 976 (7.5%) |
| 70 to 74 Years | 718 (5.5%) | 404 (3.1%) |
| 75 to 79 Years | 407 (3.1%) | 403 (3.1%) |
| 80 to 84 Years | 332 (2.5%) | 327 (2.5%) |
| 85 Years and over | 110 (0.8%) | 256 (2.0%) |
| Total | 13,023 (100.0%) | 12,954 (100.0%) |
Families and Households in Lamoille County
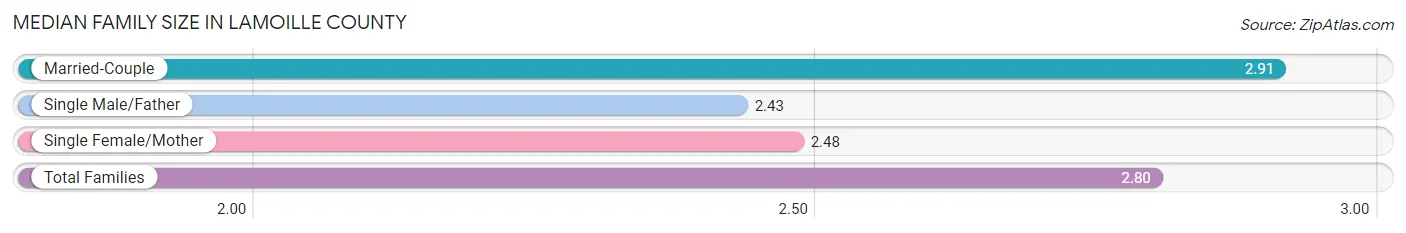
Median Family Size in Lamoille County
The median family size in Lamoille County is 2.80 persons per family, with married-couple families (5,128 | 77.3%) accounting for the largest median family size of 2.91 persons per family. On the other hand, single male/father families (545 | 8.2%) represent the smallest median family size with 2.43 persons per family.
| Family Type | # Families | Family Size |
| Married-Couple | 5,128 (77.3%) | 2.91 |
| Single Male/Father | 545 (8.2%) | 2.43 |
| Single Female/Mother | 964 (14.5%) | 2.48 |
| Total Families | 6,637 (100.0%) | 2.80 |
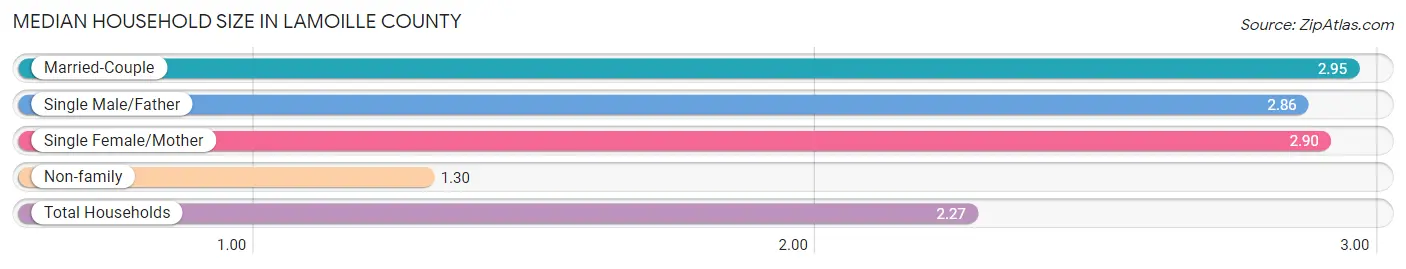
Median Household Size in Lamoille County
The median household size in Lamoille County is 2.27 persons per household, with married-couple households (5,128 | 45.9%) accounting for the largest median household size of 2.95 persons per household. non-family households (4,539 | 40.6%) represent the smallest median household size with 1.30 persons per household.
| Household Type | # Households | Household Size |
| Married-Couple | 5,128 (45.9%) | 2.95 |
| Single Male/Father | 545 (4.9%) | 2.86 |
| Single Female/Mother | 964 (8.6%) | 2.90 |
| Non-family | 4,539 (40.6%) | 1.30 |
| Total Households | 11,176 (100.0%) | 2.27 |
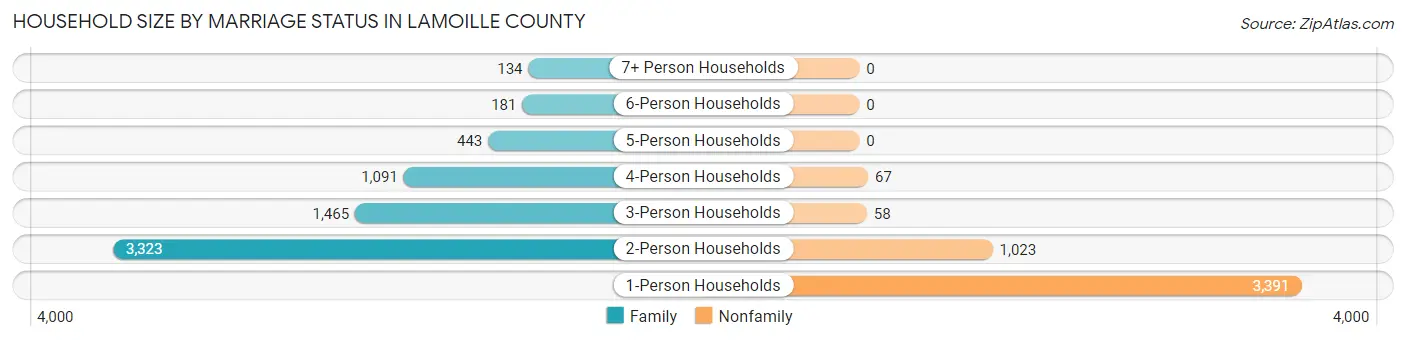
Household Size by Marriage Status in Lamoille County
Out of a total of 11,176 households in Lamoille County, 6,637 (59.4%) are family households, while 4,539 (40.6%) are nonfamily households. The most numerous type of family households are 2-person households, comprising 3,323, and the most common type of nonfamily households are 1-person households, comprising 3,391.
| Household Size | Family Households | Nonfamily Households |
| 1-Person Households | - | 3,391 (30.3%) |
| 2-Person Households | 3,323 (29.7%) | 1,023 (9.1%) |
| 3-Person Households | 1,465 (13.1%) | 58 (0.5%) |
| 4-Person Households | 1,091 (9.8%) | 67 (0.6%) |
| 5-Person Households | 443 (4.0%) | 0 (0.0%) |
| 6-Person Households | 181 (1.6%) | 0 (0.0%) |
| 7+ Person Households | 134 (1.2%) | 0 (0.0%) |
| Total | 6,637 (59.4%) | 4,539 (40.6%) |
Female Fertility in Lamoille County
Fertility by Age in Lamoille County
Average fertility rate in Lamoille County is 38.0 births per 1,000 women. Women in the age bracket of 20 to 34 years have the highest fertility rate with 63.0 births per 1,000 women. Women in the age bracket of 20 to 34 years acount for 69.7% of all women with births.
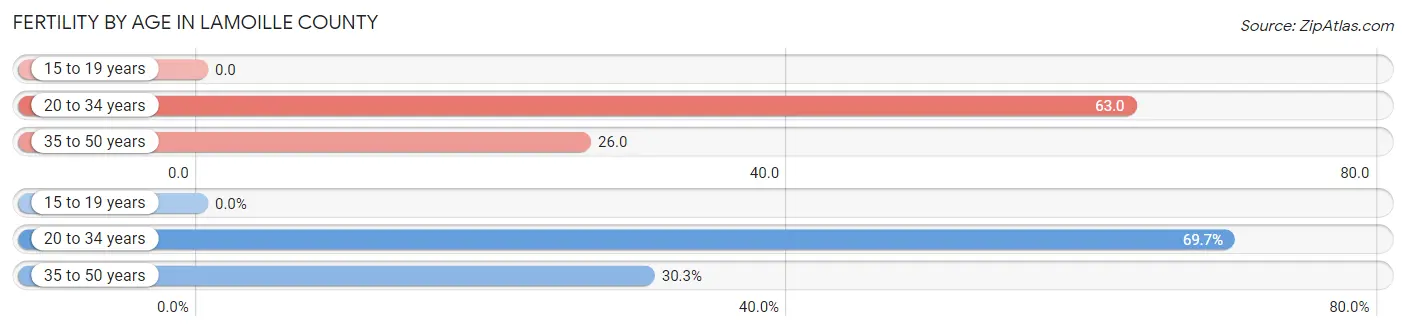
| Age Bracket | Women with Births | Births / 1,000 Women |
| 15 to 19 years | 0 (0.0%) | 0.0 |
| 20 to 34 years | 154 (69.7%) | 63.0 |
| 35 to 50 years | 67 (30.3%) | 26.0 |
| Total | 221 (100.0%) | 38.0 |
Fertility by Age by Marriage Status in Lamoille County
79.6% of women with births (221) in Lamoille County are married. The highest percentage of unmarried women with births falls into 20 to 34 years age bracket with 27.3% of them unmarried at the time of birth, while the lowest percentage of unmarried women with births belong to 35 to 50 years age bracket with 4.5% of them unmarried.
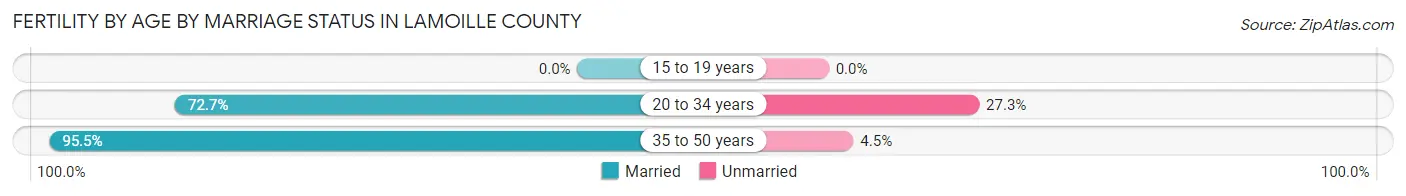
| Age Bracket | Married | Unmarried |
| 15 to 19 years | 0 (0.0%) | 0 (0.0%) |
| 20 to 34 years | 112 (72.7%) | 42 (27.3%) |
| 35 to 50 years | 64 (95.5%) | 3 (4.5%) |
| Total | 176 (79.6%) | 45 (20.4%) |
Fertility by Education in Lamoille County
Average fertility rate in Lamoille County is 38.0 births per 1,000 women. Women with the education attainment of bachelor's degree have the highest fertility rate of 65.0 births per 1,000 women, while women with the education attainment of graduate degree have the lowest fertility at 10.0 births per 1,000 women. Women with the education attainment of bachelor's degree represent 48.0% of all women with births.
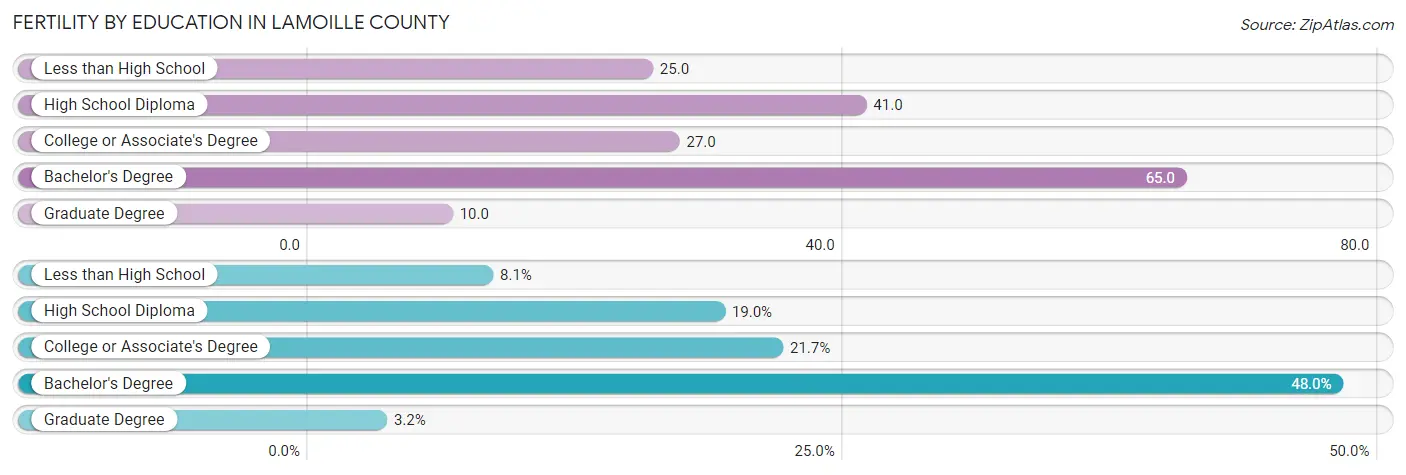
| Educational Attainment | Women with Births | Births / 1,000 Women |
| Less than High School | 18 (8.1%) | 25.0 |
| High School Diploma | 42 (19.0%) | 41.0 |
| College or Associate's Degree | 48 (21.7%) | 27.0 |
| Bachelor's Degree | 106 (48.0%) | 65.0 |
| Graduate Degree | 7 (3.2%) | 10.0 |
| Total | 221 (100.0%) | 38.0 |
Fertility by Education by Marriage Status in Lamoille County
20.4% of women with births in Lamoille County are unmarried. Women with the educational attainment of less than high school are most likely to be married with 100.0% of them married at childbirth, while women with the educational attainment of high school diploma are least likely to be married with 100.0% of them unmarried at childbirth.
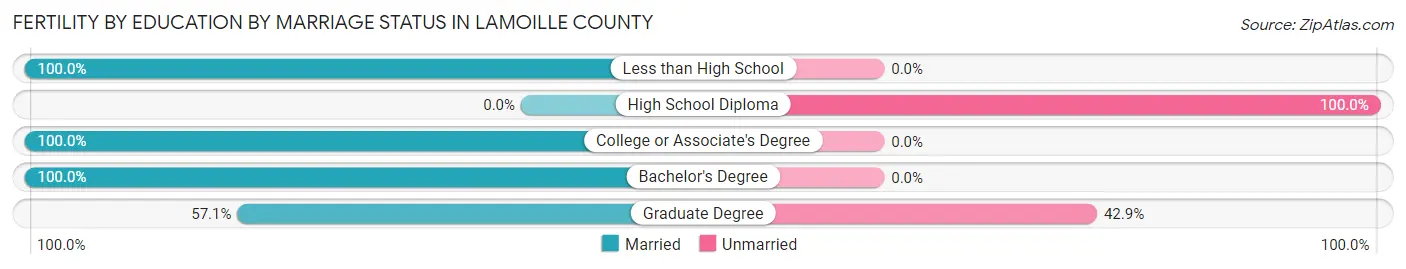
| Educational Attainment | Married | Unmarried |
| Less than High School | 18 (100.0%) | 0 (0.0%) |
| High School Diploma | 0 (0.0%) | 42 (100.0%) |
| College or Associate's Degree | 48 (100.0%) | 0 (0.0%) |
| Bachelor's Degree | 106 (100.0%) | 0 (0.0%) |
| Graduate Degree | 4 (57.1%) | 3 (42.9%) |
| Total | 176 (79.6%) | 45 (20.4%) |
Income in Lamoille County
Income Overview in Lamoille County
Per Capita Income in Lamoille County is $42,778, while median incomes of families and households are $87,358 and $69,886 respectively.
| Characteristic | Number | Measure |
| Per Capita Income | 25,977 | $42,778 |
| Median Family Income | 6,637 | $87,358 |
| Mean Family Income | 6,637 | $116,898 |
| Median Household Income | 11,176 | $69,886 |
| Mean Household Income | 11,176 | $98,575 |
| Income Deficit | 6,637 | $10,640 |
| Wage / Income Gap (%) | 25,977 | 18.01% |
| Wage / Income Gap ($) | 25,977 | 81.99¢ per $1 |
| Gini / Inequality Index | 25,977 | 0.46 |
Earnings by Sex in Lamoille County
Average Earnings in Lamoille County are $37,649, $41,610 for men and $34,118 for women, a difference of 18.0%.
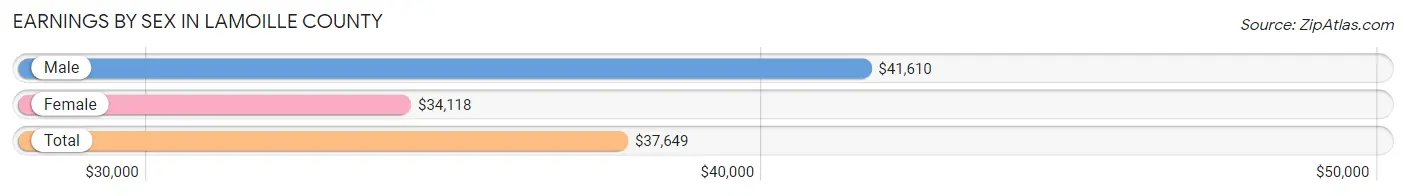
| Sex | Number | Average Earnings |
| Male | 7,907 (49.7%) | $41,610 |
| Female | 8,000 (50.3%) | $34,118 |
| Total | 15,907 (100.0%) | $37,649 |
Earnings by Sex by Income Bracket in Lamoille County
The most common earnings brackets in Lamoille County are $100,000+ for men (885 | 11.2%) and $35,000 to $39,999 for women (719 | 9.0%).
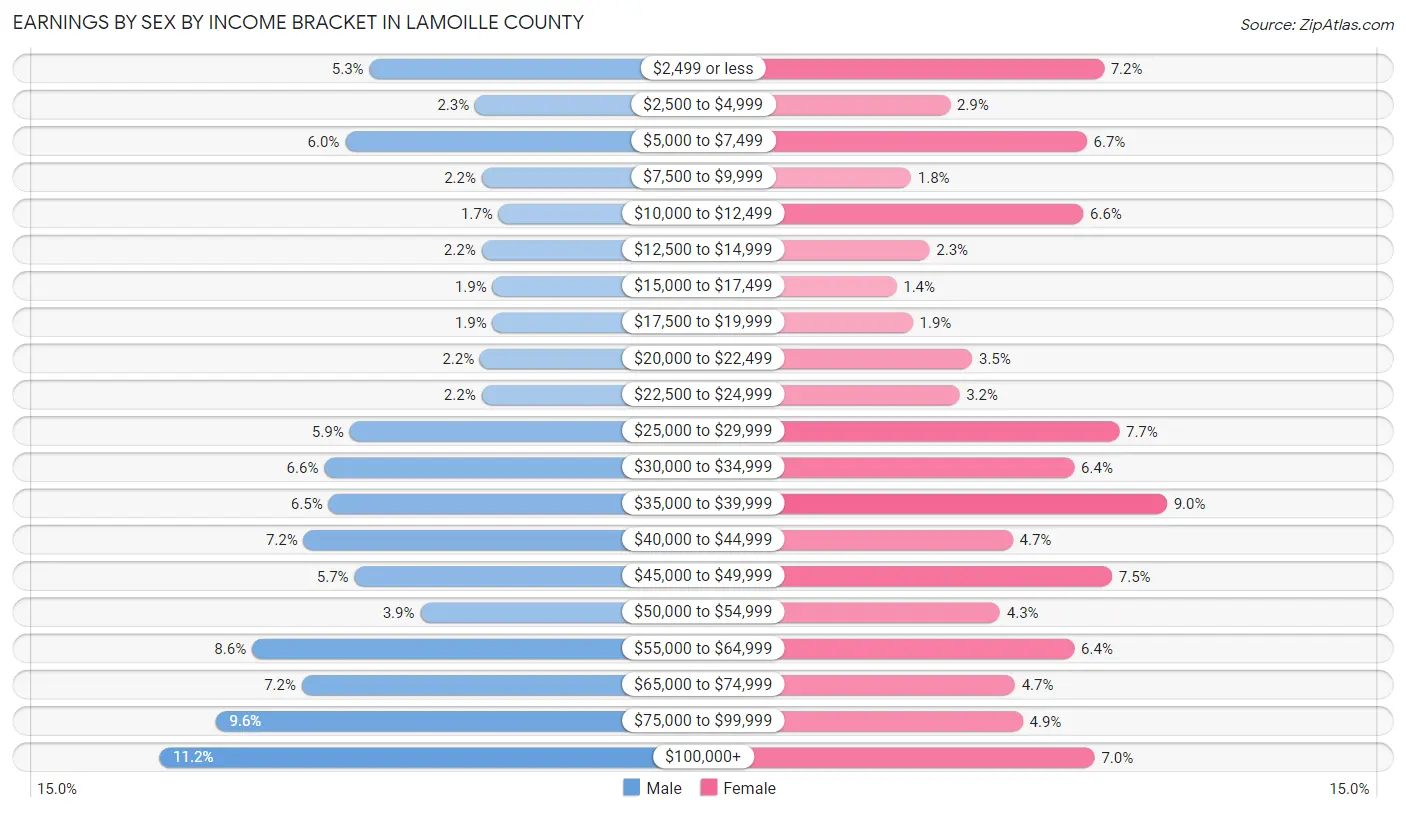
| Income | Male | Female |
| $2,499 or less | 420 (5.3%) | 578 (7.2%) |
| $2,500 to $4,999 | 185 (2.3%) | 232 (2.9%) |
| $5,000 to $7,499 | 474 (6.0%) | 539 (6.7%) |
| $7,500 to $9,999 | 170 (2.1%) | 144 (1.8%) |
| $10,000 to $12,499 | 133 (1.7%) | 531 (6.6%) |
| $12,500 to $14,999 | 171 (2.2%) | 186 (2.3%) |
| $15,000 to $17,499 | 146 (1.8%) | 111 (1.4%) |
| $17,500 to $19,999 | 146 (1.8%) | 148 (1.8%) |
| $20,000 to $22,499 | 174 (2.2%) | 282 (3.5%) |
| $22,500 to $24,999 | 171 (2.2%) | 253 (3.2%) |
| $25,000 to $29,999 | 464 (5.9%) | 612 (7.6%) |
| $30,000 to $34,999 | 520 (6.6%) | 511 (6.4%) |
| $35,000 to $39,999 | 511 (6.5%) | 719 (9.0%) |
| $40,000 to $44,999 | 566 (7.2%) | 373 (4.7%) |
| $45,000 to $49,999 | 453 (5.7%) | 596 (7.4%) |
| $50,000 to $54,999 | 307 (3.9%) | 344 (4.3%) |
| $55,000 to $64,999 | 681 (8.6%) | 511 (6.4%) |
| $65,000 to $74,999 | 570 (7.2%) | 378 (4.7%) |
| $75,000 to $99,999 | 760 (9.6%) | 395 (4.9%) |
| $100,000+ | 885 (11.2%) | 557 (7.0%) |
| Total | 7,907 (100.0%) | 8,000 (100.0%) |
Earnings by Sex by Educational Attainment in Lamoille County
Average earnings in Lamoille County are $47,692 for men and $36,811 for women, a difference of 22.8%. Men with an educational attainment of graduate degree enjoy the highest average annual earnings of $71,774, while those with college or associate's degree education earn the least with $40,119. Women with an educational attainment of graduate degree earn the most with the average annual earnings of $53,558, while those with less than high school education have the smallest earnings of $28,438.
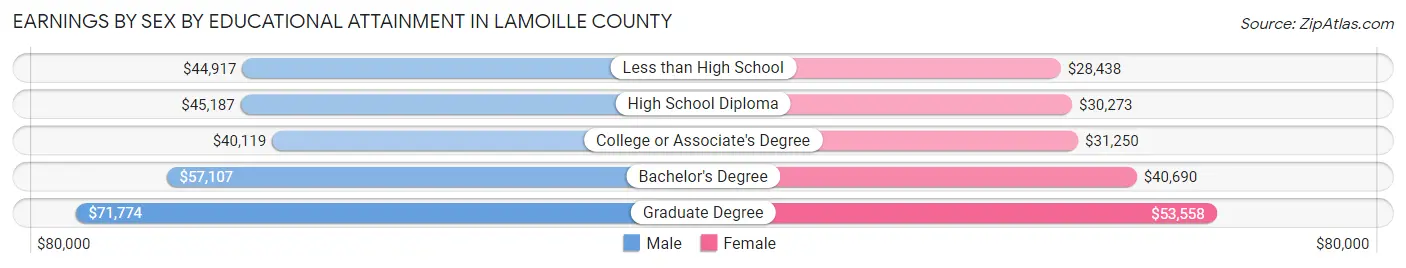
| Educational Attainment | Male Income | Female Income |
| Less than High School | $44,917 | $28,438 |
| High School Diploma | $45,187 | $30,273 |
| College or Associate's Degree | $40,119 | $31,250 |
| Bachelor's Degree | $57,107 | $40,690 |
| Graduate Degree | $71,774 | $53,558 |
| Total | $47,692 | $36,811 |
Family Income in Lamoille County
Family Income Brackets in Lamoille County
According to the Lamoille County family income data, there are 1,467 families falling into the $100,000 to $149,999 income range, which is the most common income bracket and makes up 22.1% of all families. Conversely, the $10,000 to $14,999 income bracket is the least frequent group with only 60 families (0.9%) belonging to this category.
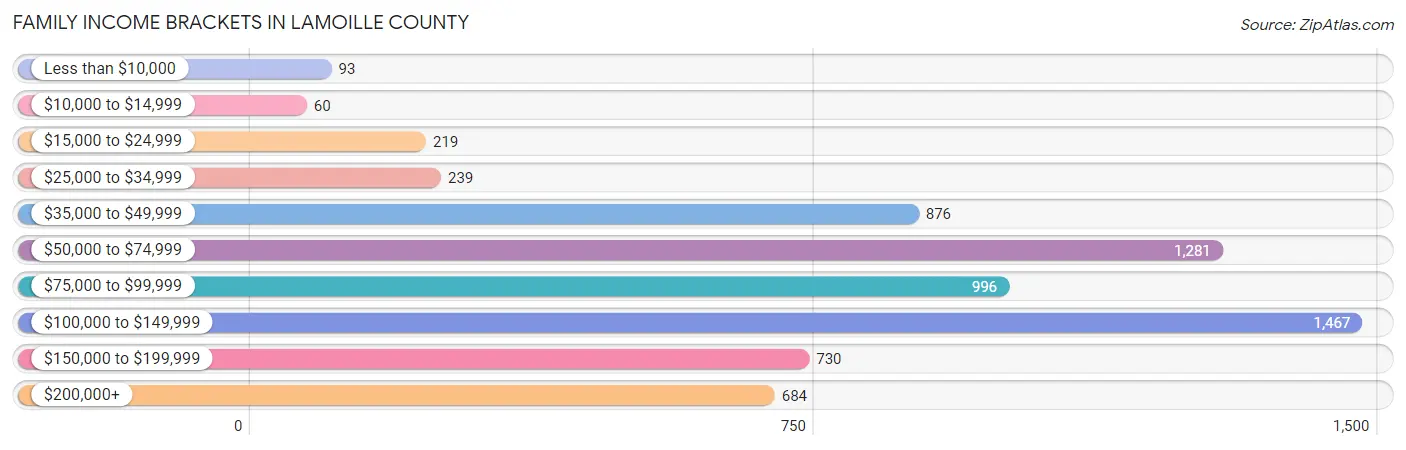
| Income Bracket | # Families | % Families |
| Less than $10,000 | 93 | 1.4% |
| $10,000 to $14,999 | 60 | 0.9% |
| $15,000 to $24,999 | 219 | 3.3% |
| $25,000 to $34,999 | 239 | 3.6% |
| $35,000 to $49,999 | 876 | 13.2% |
| $50,000 to $74,999 | 1,281 | 19.3% |
| $75,000 to $99,999 | 996 | 15.0% |
| $100,000 to $149,999 | 1,467 | 22.1% |
| $150,000 to $199,999 | 730 | 11.0% |
| $200,000+ | 684 | 10.3% |
Family Income by Famaliy Size in Lamoille County
7+ person families (38 | 0.6%) account for the highest median family income in Lamoille County with $133,750 per family, while 2-person families (3,701 | 55.8%) have the highest median income of $39,574 per family member.
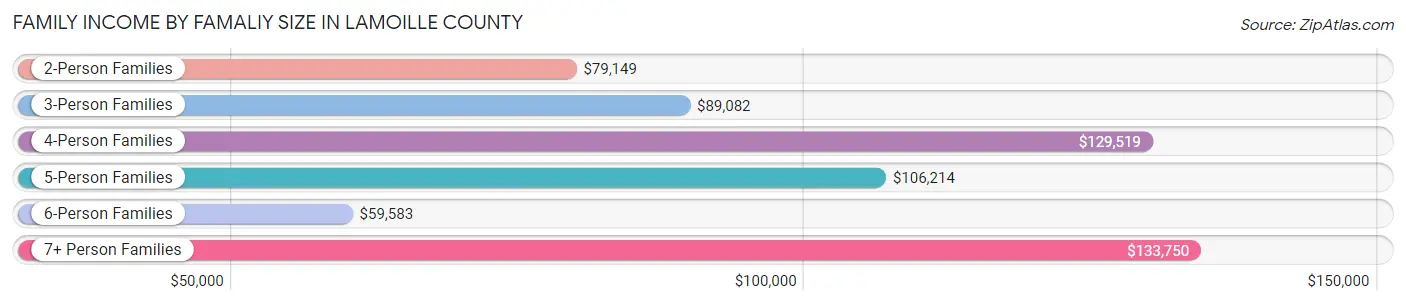
| Income Bracket | # Families | Median Income |
| 2-Person Families | 3,701 (55.8%) | $79,149 |
| 3-Person Families | 1,348 (20.3%) | $89,082 |
| 4-Person Families | 977 (14.7%) | $129,519 |
| 5-Person Families | 396 (6.0%) | $106,214 |
| 6-Person Families | 177 (2.7%) | $59,583 |
| 7+ Person Families | 38 (0.6%) | $133,750 |
| Total | 6,637 (100.0%) | $87,358 |
Family Income by Number of Earners in Lamoille County
The median family income in Lamoille County is $87,358, with families comprising 3+ earners (735) having the highest median family income of $126,302, while families with 1 earner (2,113) have the lowest median family income of $57,746, accounting for 11.1% and 31.8% of families, respectively.
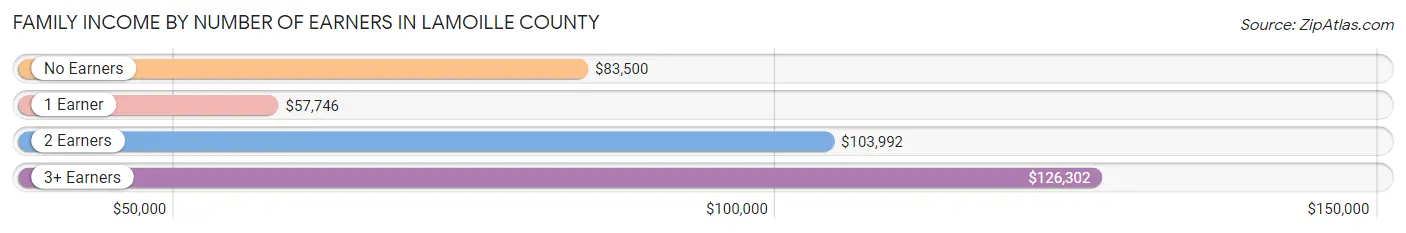
| Number of Earners | # Families | Median Income |
| No Earners | 668 (10.1%) | $83,500 |
| 1 Earner | 2,113 (31.8%) | $57,746 |
| 2 Earners | 3,121 (47.0%) | $103,992 |
| 3+ Earners | 735 (11.1%) | $126,302 |
| Total | 6,637 (100.0%) | $87,358 |
Household Income in Lamoille County
Household Income Brackets in Lamoille County
With 2,190 households falling in the category, the $50,000 to $74,999 income range is the most frequent in Lamoille County, accounting for 19.6% of all households. In contrast, only 246 households (2.2%) fall into the $10,000 to $14,999 income bracket, making it the least populous group.
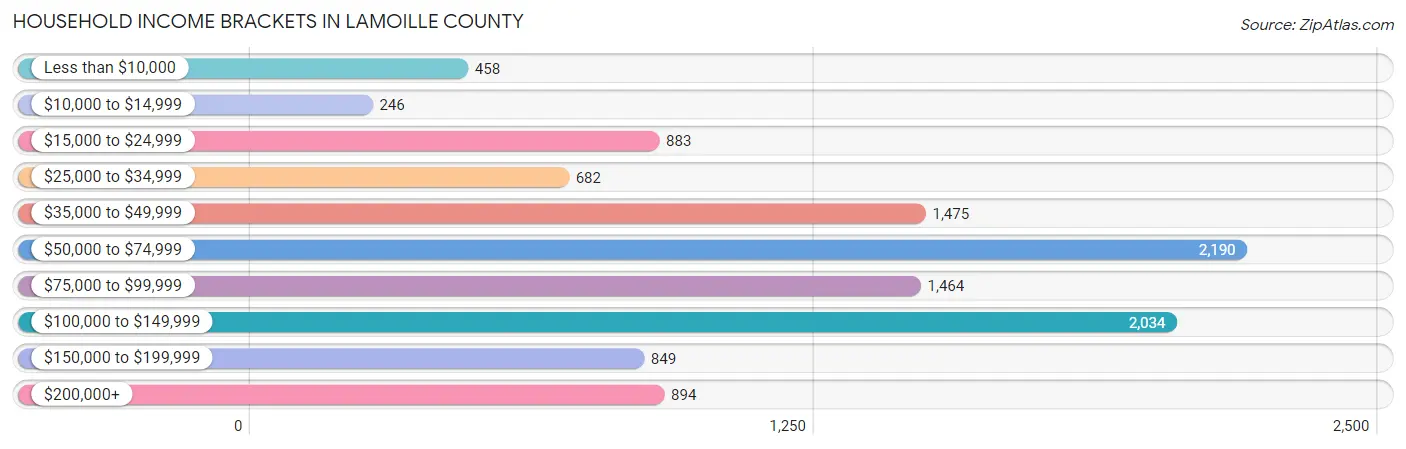
| Income Bracket | # Households | % Households |
| Less than $10,000 | 458 | 4.1% |
| $10,000 to $14,999 | 246 | 2.2% |
| $15,000 to $24,999 | 883 | 7.9% |
| $25,000 to $34,999 | 682 | 6.1% |
| $35,000 to $49,999 | 1,475 | 13.2% |
| $50,000 to $74,999 | 2,190 | 19.6% |
| $75,000 to $99,999 | 1,464 | 13.1% |
| $100,000 to $149,999 | 2,034 | 18.2% |
| $150,000 to $199,999 | 849 | 7.6% |
| $200,000+ | 894 | 8.0% |
Household Income by Householder Age in Lamoille County
The median household income in Lamoille County is $69,886, with the highest median household income of $82,663 found in the 25 to 44 years age bracket for the primary householder. A total of 3,397 households (30.4%) fall into this category. Meanwhile, the 15 to 24 years age bracket for the primary householder has the lowest median household income of $48,516, with 359 households (3.2%) in this group.
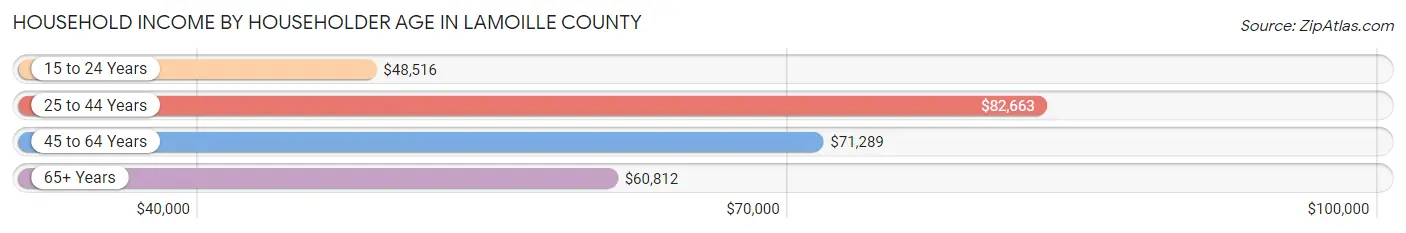
| Income Bracket | # Households | Median Income |
| 15 to 24 Years | 359 (3.2%) | $48,516 |
| 25 to 44 Years | 3,397 (30.4%) | $82,663 |
| 45 to 64 Years | 4,380 (39.2%) | $71,289 |
| 65+ Years | 3,040 (27.2%) | $60,812 |
| Total | 11,176 (100.0%) | $69,886 |
Poverty in Lamoille County
Income Below Poverty by Sex and Age in Lamoille County
With 8.9% poverty level for males and 8.3% for females among the residents of Lamoille County, 15 year old males and 18 to 24 year old females are the most vulnerable to poverty, with 34 males (28.1%) and 132 females (14.7%) in their respective age groups living below the poverty level.
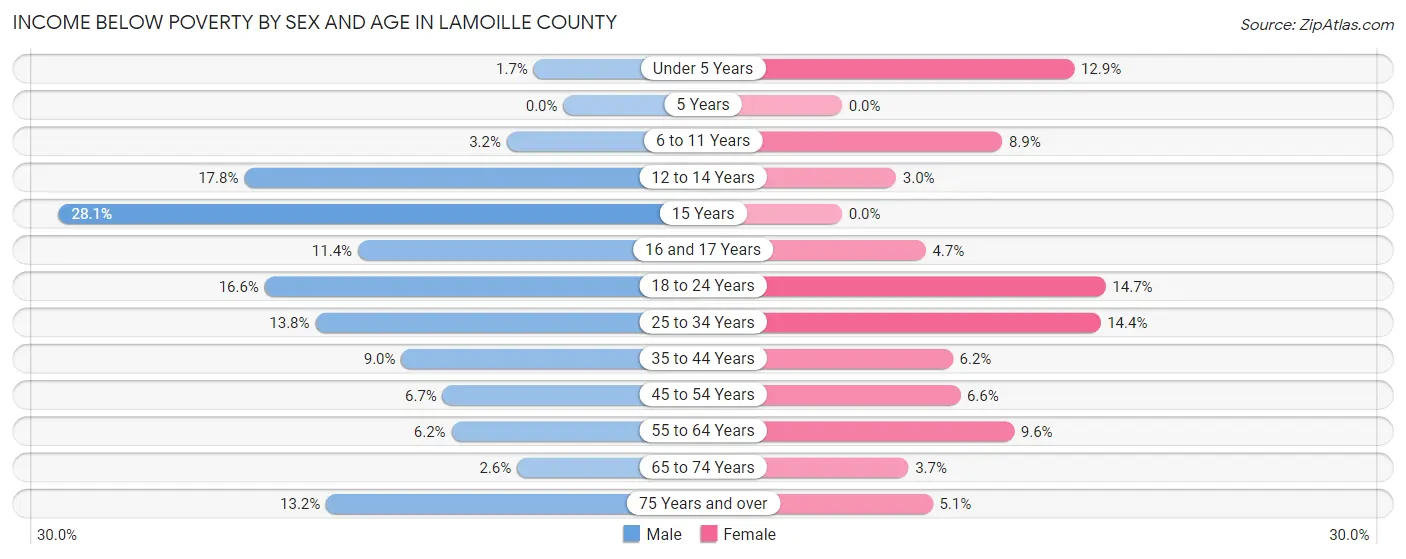
| Age Bracket | Male | Female |
| Under 5 Years | 9 (1.7%) | 76 (12.9%) |
| 5 Years | 0 (0.0%) | 0 (0.0%) |
| 6 to 11 Years | 28 (3.2%) | 73 (8.9%) |
| 12 to 14 Years | 94 (17.8%) | 15 (3.0%) |
| 15 Years | 34 (28.1%) | 0 (0.0%) |
| 16 and 17 Years | 42 (11.4%) | 16 (4.7%) |
| 18 to 24 Years | 157 (16.6%) | 132 (14.7%) |
| 25 to 34 Years | 235 (13.8%) | 242 (14.4%) |
| 35 to 44 Years | 153 (9.0%) | 104 (6.2%) |
| 45 to 54 Years | 117 (6.7%) | 108 (6.6%) |
| 55 to 64 Years | 114 (6.2%) | 184 (9.6%) |
| 65 to 74 Years | 36 (2.6%) | 51 (3.7%) |
| 75 Years and over | 110 (13.2%) | 47 (5.1%) |
| Total | 1,129 (8.9%) | 1,048 (8.3%) |
Income Above Poverty by Sex and Age in Lamoille County
According to the poverty statistics in Lamoille County, males aged 5 years and females aged 5 years are the age groups that are most secure financially, with 100.0% of males and 100.0% of females in these age groups living above the poverty line.
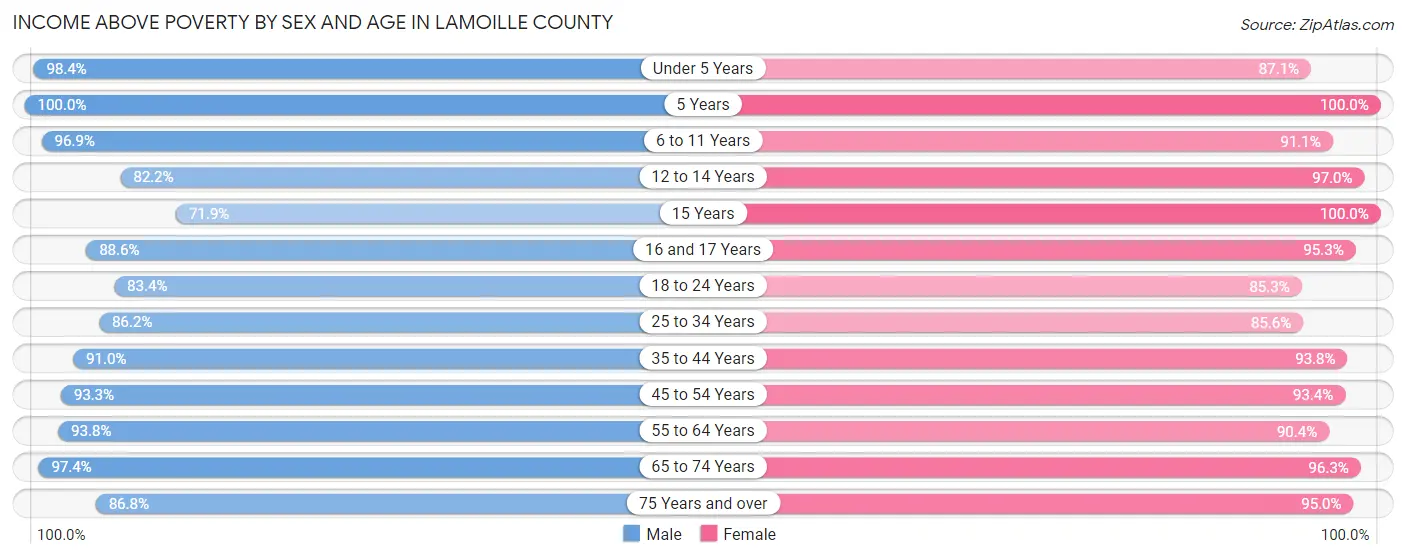
| Age Bracket | Male | Female |
| Under 5 Years | 538 (98.4%) | 512 (87.1%) |
| 5 Years | 151 (100.0%) | 133 (100.0%) |
| 6 to 11 Years | 861 (96.9%) | 745 (91.1%) |
| 12 to 14 Years | 435 (82.2%) | 484 (97.0%) |
| 15 Years | 87 (71.9%) | 102 (100.0%) |
| 16 and 17 Years | 325 (88.6%) | 327 (95.3%) |
| 18 to 24 Years | 787 (83.4%) | 767 (85.3%) |
| 25 to 34 Years | 1,467 (86.2%) | 1,440 (85.6%) |
| 35 to 44 Years | 1,543 (91.0%) | 1,581 (93.8%) |
| 45 to 54 Years | 1,625 (93.3%) | 1,534 (93.4%) |
| 55 to 64 Years | 1,715 (93.8%) | 1,736 (90.4%) |
| 65 to 74 Years | 1,357 (97.4%) | 1,326 (96.3%) |
| 75 Years and over | 723 (86.8%) | 884 (95.0%) |
| Total | 11,614 (91.1%) | 11,571 (91.7%) |
Income Below Poverty Among Married-Couple Families in Lamoille County
The poverty statistics for married-couple families in Lamoille County show that 2.3% or 118 of the total 5,128 families live below the poverty line. Families with 3 or 4 children have the highest poverty rate of 5.4%, comprising of 21 families. On the other hand, families with 5 or more children have the lowest poverty rate of 0.0%, which includes 0 families.
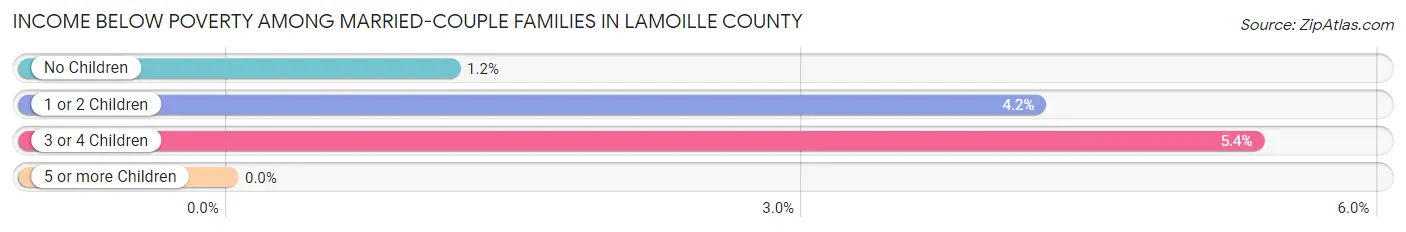
| Children | Above Poverty | Below Poverty |
| No Children | 3,312 (98.8%) | 39 (1.2%) |
| 1 or 2 Children | 1,317 (95.8%) | 58 (4.2%) |
| 3 or 4 Children | 371 (94.6%) | 21 (5.4%) |
| 5 or more Children | 10 (100.0%) | 0 (0.0%) |
| Total | 5,010 (97.7%) | 118 (2.3%) |
Income Below Poverty Among Single-Parent Households in Lamoille County
According to the poverty data in Lamoille County, 6.2% or 34 single-father households and 11.6% or 112 single-mother households are living below the poverty line. Among single-father households, those with no children have the highest poverty rate, with 21 households (11.3%) experiencing poverty. Likewise, among single-mother households, those with 3 or 4 children have the highest poverty rate, with 30 households (35.3%) falling below the poverty line.
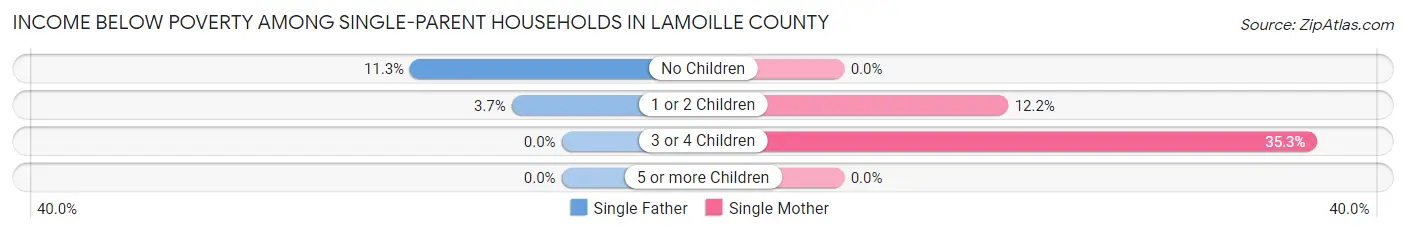
| Children | Single Father | Single Mother |
| No Children | 21 (11.3%) | 0 (0.0%) |
| 1 or 2 Children | 13 (3.7%) | 82 (12.2%) |
| 3 or 4 Children | 0 (0.0%) | 30 (35.3%) |
| 5 or more Children | 0 (0.0%) | 0 (0.0%) |
| Total | 34 (6.2%) | 112 (11.6%) |
Income Below Poverty Among Married-Couple vs Single-Parent Households in Lamoille County
The poverty data for Lamoille County shows that 118 of the married-couple family households (2.3%) and 146 of the single-parent households (9.7%) are living below the poverty level. Within the married-couple family households, those with 3 or 4 children have the highest poverty rate, with 21 households (5.4%) falling below the poverty line. Among the single-parent households, those with 3 or 4 children have the highest poverty rate, with 30 household (31.6%) living below poverty.
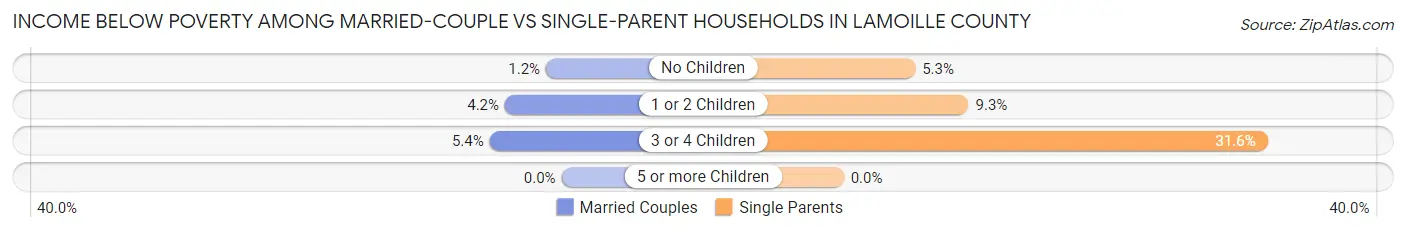
| Children | Married-Couple Families | Single-Parent Households |
| No Children | 39 (1.2%) | 21 (5.3%) |
| 1 or 2 Children | 58 (4.2%) | 95 (9.3%) |
| 3 or 4 Children | 21 (5.4%) | 30 (31.6%) |
| 5 or more Children | 0 (0.0%) | 0 (0.0%) |
| Total | 118 (2.3%) | 146 (9.7%) |
Employment Characteristics in Lamoille County
Employment by Class of Employer in Lamoille County
Among the 13,709 employed individuals in Lamoille County, private company employees (8,099 | 59.1%), not-for-profit organizations (1,977 | 14.4%), and self-employed (not incorporated) (1,360 | 9.9%) make up the most common classes of employment.
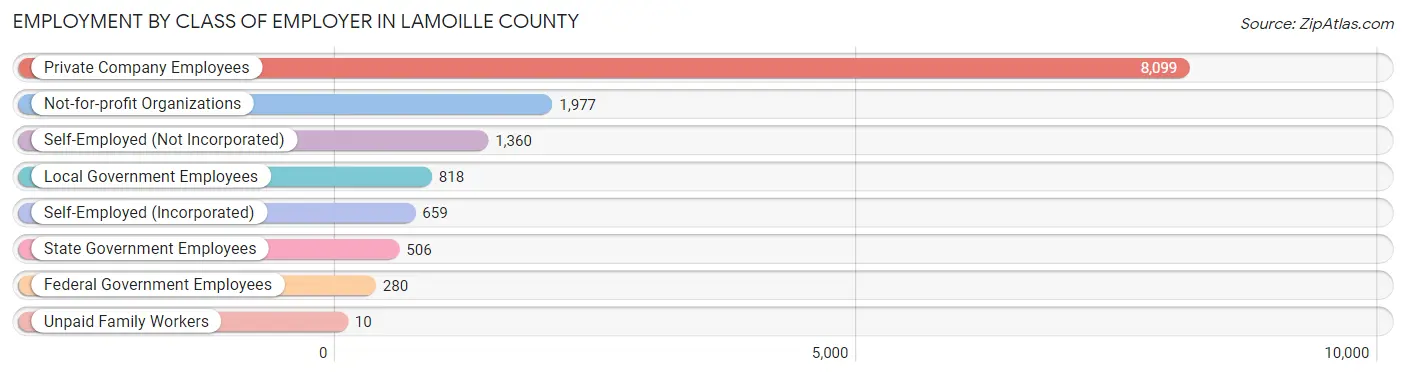
| Employer Class | # Employees | % Employees |
| Private Company Employees | 8,099 | 59.1% |
| Self-Employed (Incorporated) | 659 | 4.8% |
| Self-Employed (Not Incorporated) | 1,360 | 9.9% |
| Not-for-profit Organizations | 1,977 | 14.4% |
| Local Government Employees | 818 | 6.0% |
| State Government Employees | 506 | 3.7% |
| Federal Government Employees | 280 | 2.0% |
| Unpaid Family Workers | 10 | 0.1% |
| Total | 13,709 | 100.0% |
Employment Status by Age in Lamoille County
According to the labor force statistics for Lamoille County, out of the total population over 16 years of age (21,442), 67.7% or 14,516 individuals are in the labor force, with 3.9% or 566 of them unemployed. The age group with the highest labor force participation rate is 25 to 29 years, with 89.6% or 1,450 individuals in the labor force. Within the labor force, the 16 to 19 years age range has the highest percentage of unemployed individuals, with 13.7% or 96 of them being unemployed.
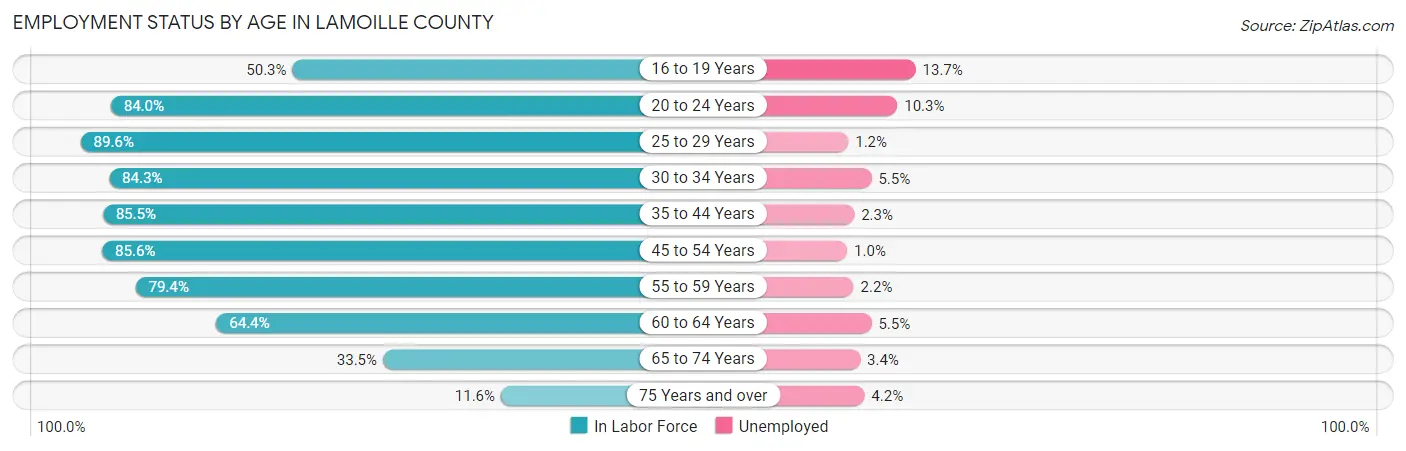
| Age Bracket | In Labor Force | Unemployed |
| 16 to 19 Years | 701 (50.3%) | 96 (13.7%) |
| 20 to 24 Years | 1,293 (84.0%) | 133 (10.3%) |
| 25 to 29 Years | 1,450 (89.6%) | 17 (1.2%) |
| 30 to 34 Years | 1,489 (84.3%) | 82 (5.5%) |
| 35 to 44 Years | 2,891 (85.5%) | 66 (2.3%) |
| 45 to 54 Years | 2,897 (85.6%) | 29 (1.0%) |
| 55 to 59 Years | 1,247 (79.4%) | 27 (2.2%) |
| 60 to 64 Years | 1,403 (64.4%) | 77 (5.5%) |
| 65 to 74 Years | 930 (33.5%) | 32 (3.4%) |
| 75 Years and over | 213 (11.6%) | 9 (4.2%) |
| Total | 14,516 (67.7%) | 566 (3.9%) |
Employment Status by Educational Attainment in Lamoille County
According to labor force statistics for Lamoille County, 81.9% of individuals (11,382) out of the total population between 25 and 64 years of age (13,898) are in the labor force, with 2.6% or 296 of them being unemployed. The group with the highest labor force participation rate are those with the educational attainment of bachelor's degree or higher, with 84.0% or 4,886 individuals in the labor force. Within the labor force, individuals with high school diploma education have the highest percentage of unemployment, with 5.3% or 139 of them being unemployed.
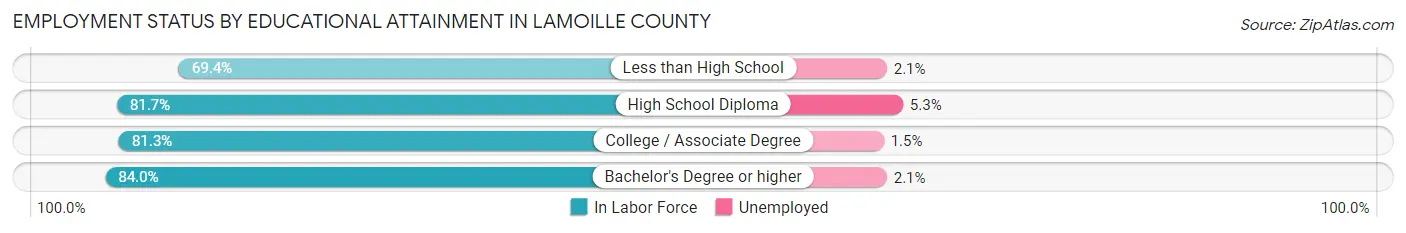
| Educational Attainment | In Labor Force | Unemployed |
| Less than High School | 534 (69.4%) | 16 (2.1%) |
| High School Diploma | 2,632 (81.7%) | 171 (5.3%) |
| College / Associate Degree | 3,326 (81.3%) | 61 (1.5%) |
| Bachelor's Degree or higher | 4,886 (84.0%) | 122 (2.1%) |
| Total | 11,382 (81.9%) | 361 (2.6%) |
Employment Occupations by Sex in Lamoille County
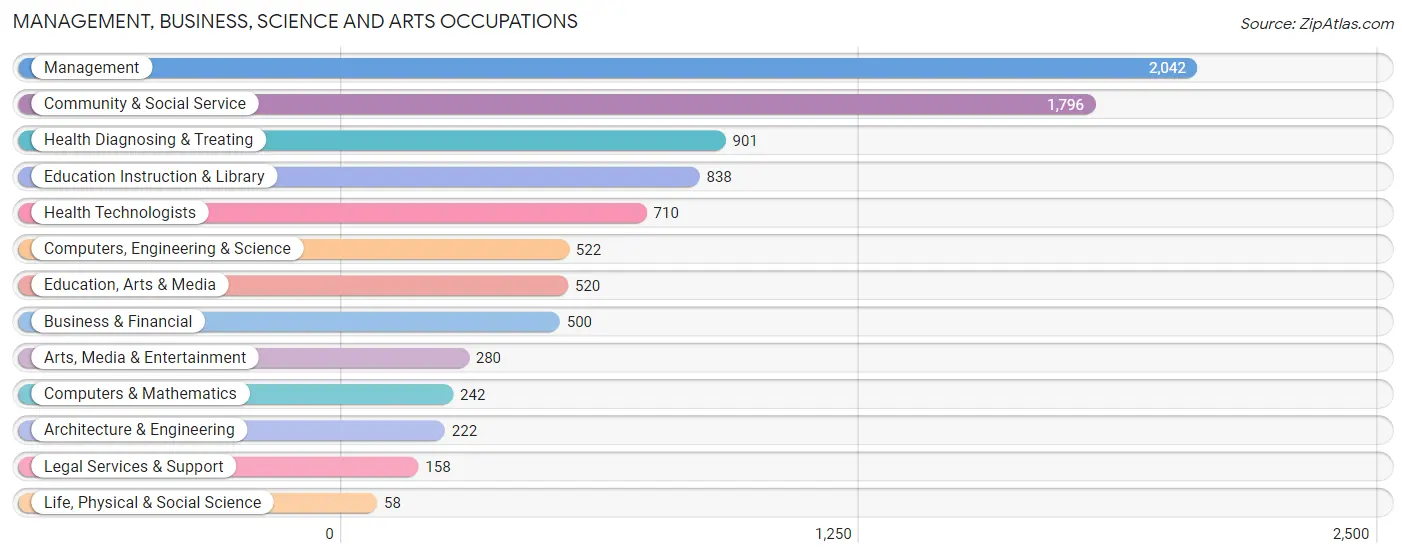
Management, Business, Science and Arts Occupations
The most common Management, Business, Science and Arts occupations in Lamoille County are Management (2,042 | 14.7%), Community & Social Service (1,796 | 12.9%), Health Diagnosing & Treating (901 | 6.5%), Education Instruction & Library (838 | 6.0%), and Health Technologists (710 | 5.1%).
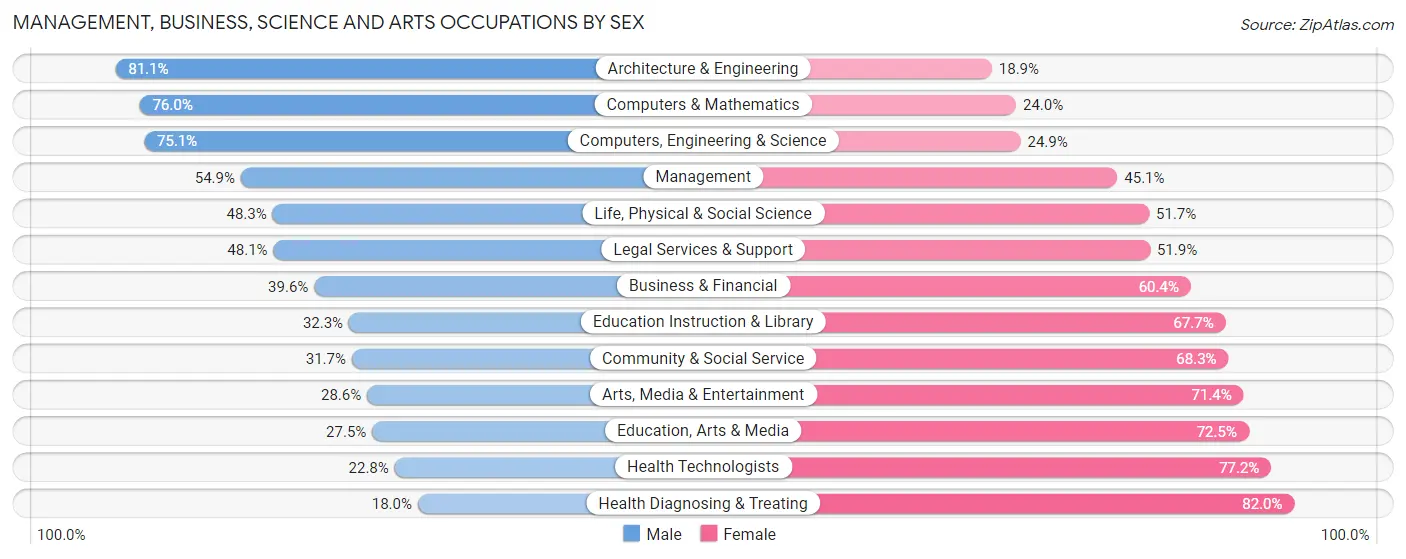
Management, Business, Science and Arts Occupations by Sex
Within the Management, Business, Science and Arts occupations in Lamoille County, the most male-oriented occupations are Architecture & Engineering (81.1%), Computers & Mathematics (76.0%), and Computers, Engineering & Science (75.1%), while the most female-oriented occupations are Health Diagnosing & Treating (82.0%), Health Technologists (77.2%), and Education, Arts & Media (72.5%).
| Occupation | Male | Female |
| Management | 1,121 (54.9%) | 921 (45.1%) |
| Business & Financial | 198 (39.6%) | 302 (60.4%) |
| Computers, Engineering & Science | 392 (75.1%) | 130 (24.9%) |
| Computers & Mathematics | 184 (76.0%) | 58 (24.0%) |
| Architecture & Engineering | 180 (81.1%) | 42 (18.9%) |
| Life, Physical & Social Science | 28 (48.3%) | 30 (51.7%) |
| Community & Social Service | 570 (31.7%) | 1,226 (68.3%) |
| Education, Arts & Media | 143 (27.5%) | 377 (72.5%) |
| Legal Services & Support | 76 (48.1%) | 82 (51.9%) |
| Education Instruction & Library | 271 (32.3%) | 567 (67.7%) |
| Arts, Media & Entertainment | 80 (28.6%) | 200 (71.4%) |
| Health Diagnosing & Treating | 162 (18.0%) | 739 (82.0%) |
| Health Technologists | 162 (22.8%) | 548 (77.2%) |
| Total (Category) | 2,443 (42.4%) | 3,318 (57.6%) |
| Total (Overall) | 6,924 (49.7%) | 6,998 (50.3%) |
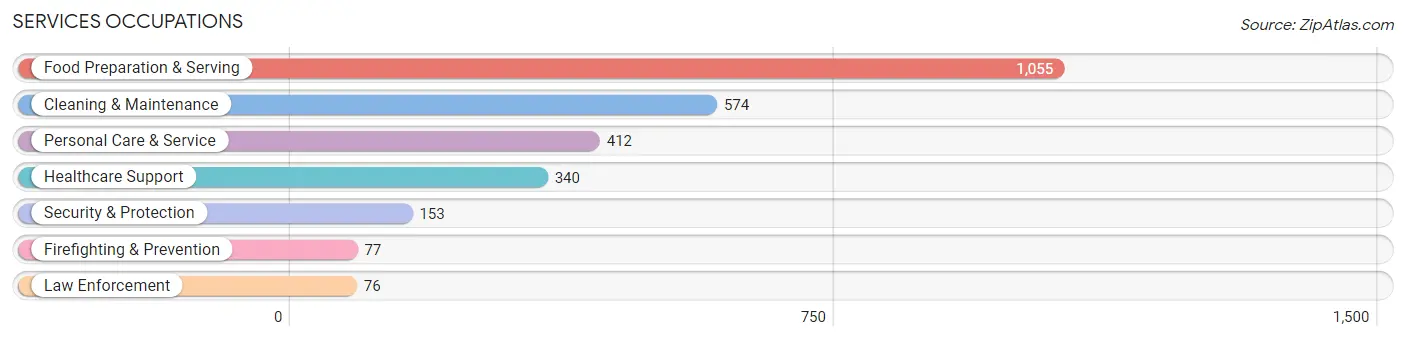
Services Occupations
The most common Services occupations in Lamoille County are Food Preparation & Serving (1,055 | 7.6%), Cleaning & Maintenance (574 | 4.1%), Personal Care & Service (412 | 3.0%), Healthcare Support (340 | 2.4%), and Security & Protection (153 | 1.1%).
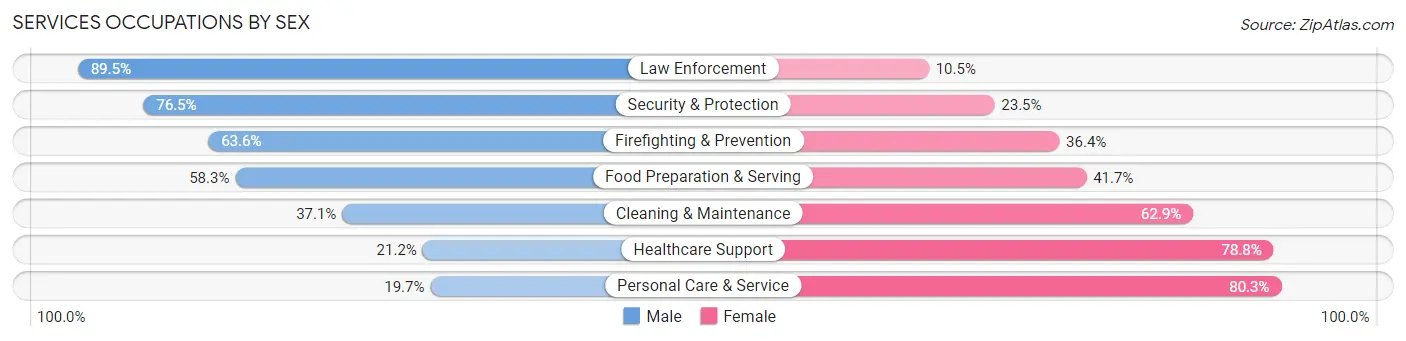
Services Occupations by Sex
Within the Services occupations in Lamoille County, the most male-oriented occupations are Law Enforcement (89.5%), Security & Protection (76.5%), and Firefighting & Prevention (63.6%), while the most female-oriented occupations are Personal Care & Service (80.3%), Healthcare Support (78.8%), and Cleaning & Maintenance (62.9%).
| Occupation | Male | Female |
| Healthcare Support | 72 (21.2%) | 268 (78.8%) |
| Security & Protection | 117 (76.5%) | 36 (23.5%) |
| Firefighting & Prevention | 49 (63.6%) | 28 (36.4%) |
| Law Enforcement | 68 (89.5%) | 8 (10.5%) |
| Food Preparation & Serving | 615 (58.3%) | 440 (41.7%) |
| Cleaning & Maintenance | 213 (37.1%) | 361 (62.9%) |
| Personal Care & Service | 81 (19.7%) | 331 (80.3%) |
| Total (Category) | 1,098 (43.3%) | 1,436 (56.7%) |
| Total (Overall) | 6,924 (49.7%) | 6,998 (50.3%) |
Sales and Office Occupations
The most common Sales and Office occupations in Lamoille County are Office & Administration (1,528 | 11.0%), and Sales & Related (1,118 | 8.0%).

Sales and Office Occupations by Sex

| Occupation | Male | Female |
| Sales & Related | 553 (49.5%) | 565 (50.5%) |
| Office & Administration | 269 (17.6%) | 1,259 (82.4%) |
| Total (Category) | 822 (31.1%) | 1,824 (68.9%) |
| Total (Overall) | 6,924 (49.7%) | 6,998 (50.3%) |
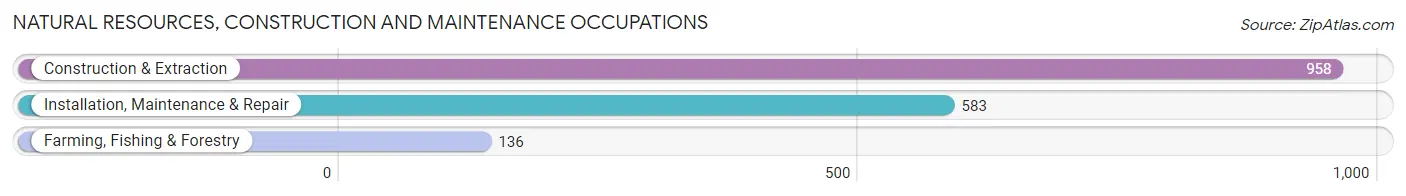
Natural Resources, Construction and Maintenance Occupations
The most common Natural Resources, Construction and Maintenance occupations in Lamoille County are Construction & Extraction (958 | 6.9%), Installation, Maintenance & Repair (583 | 4.2%), and Farming, Fishing & Forestry (136 | 1.0%).
Natural Resources, Construction and Maintenance Occupations by Sex
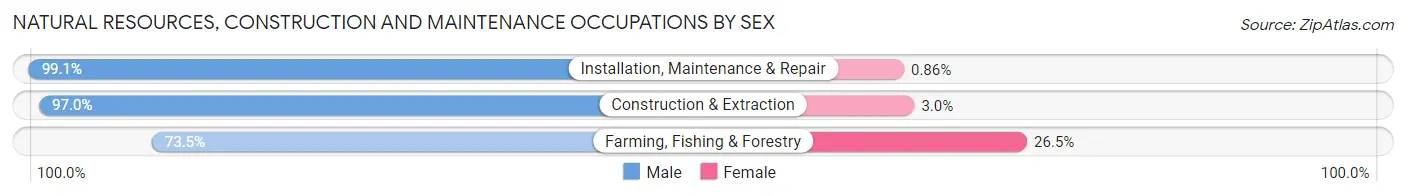
| Occupation | Male | Female |
| Farming, Fishing & Forestry | 100 (73.5%) | 36 (26.5%) |
| Construction & Extraction | 929 (97.0%) | 29 (3.0%) |
| Installation, Maintenance & Repair | 578 (99.1%) | 5 (0.9%) |
| Total (Category) | 1,607 (95.8%) | 70 (4.2%) |
| Total (Overall) | 6,924 (49.7%) | 6,998 (50.3%) |
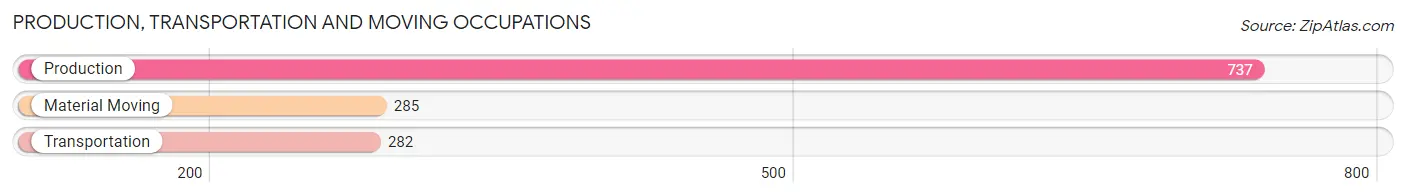
Production, Transportation and Moving Occupations
The most common Production, Transportation and Moving occupations in Lamoille County are Production (737 | 5.3%), Material Moving (285 | 2.1%), and Transportation (282 | 2.0%).
Production, Transportation and Moving Occupations by Sex
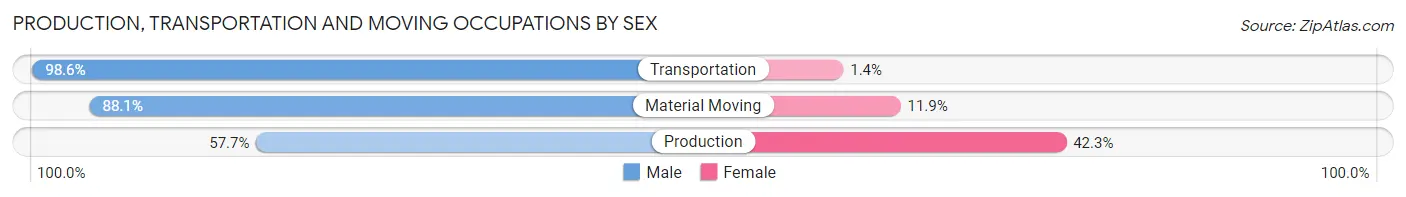
| Occupation | Male | Female |
| Production | 425 (57.7%) | 312 (42.3%) |
| Transportation | 278 (98.6%) | 4 (1.4%) |
| Material Moving | 251 (88.1%) | 34 (11.9%) |
| Total (Category) | 954 (73.2%) | 350 (26.8%) |
| Total (Overall) | 6,924 (49.7%) | 6,998 (50.3%) |
Employment Industries by Sex in Lamoille County
Employment Industries in Lamoille County
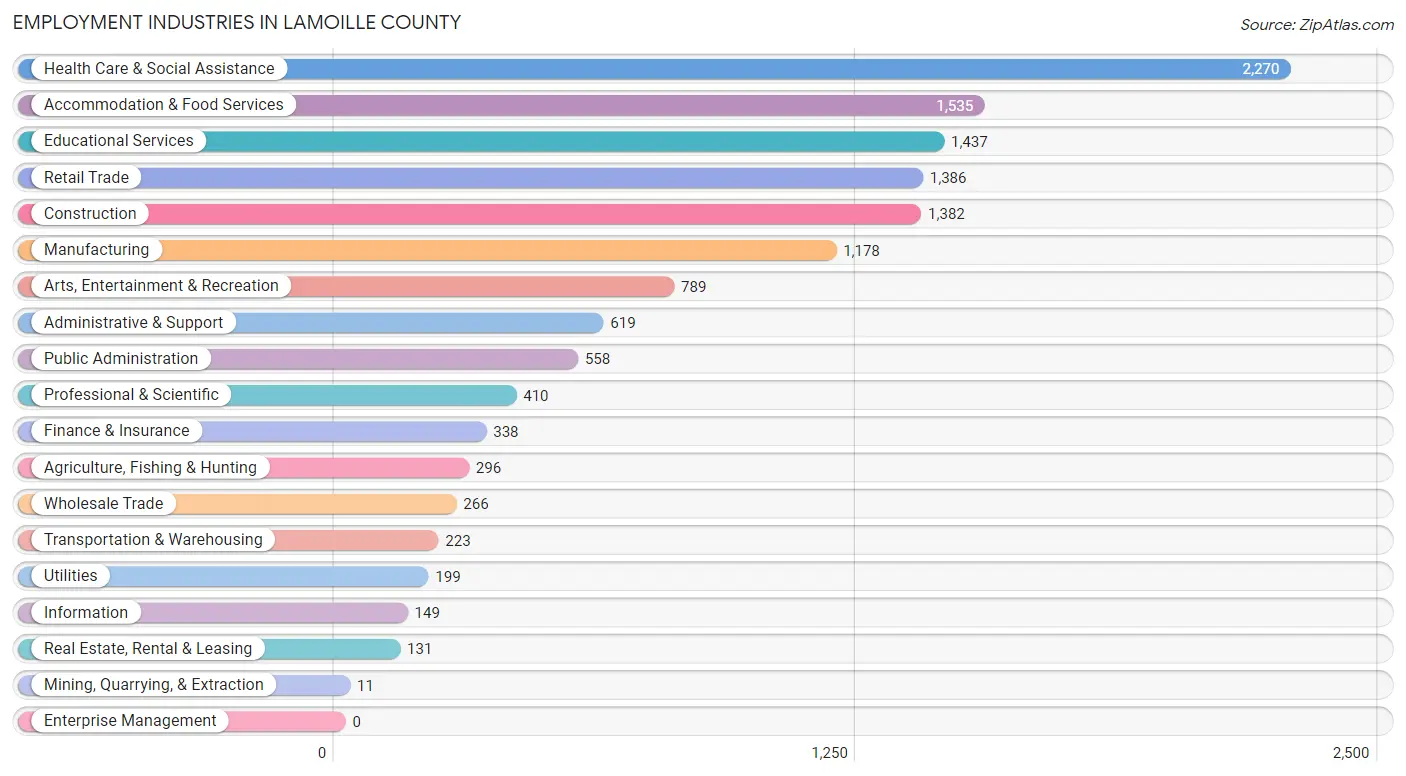
The major employment industries in Lamoille County include Health Care & Social Assistance (2,270 | 16.3%), Accommodation & Food Services (1,535 | 11.0%), Educational Services (1,437 | 10.3%), Retail Trade (1,386 | 10.0%), and Construction (1,382 | 9.9%).
Employment Industries by Sex in Lamoille County
The Lamoille County industries that see more men than women are Mining, Quarrying, & Extraction (100.0%), Construction (92.6%), and Utilities (75.4%), whereas the industries that tend to have a higher number of women are Health Care & Social Assistance (81.4%), Educational Services (69.0%), and Finance & Insurance (61.2%).
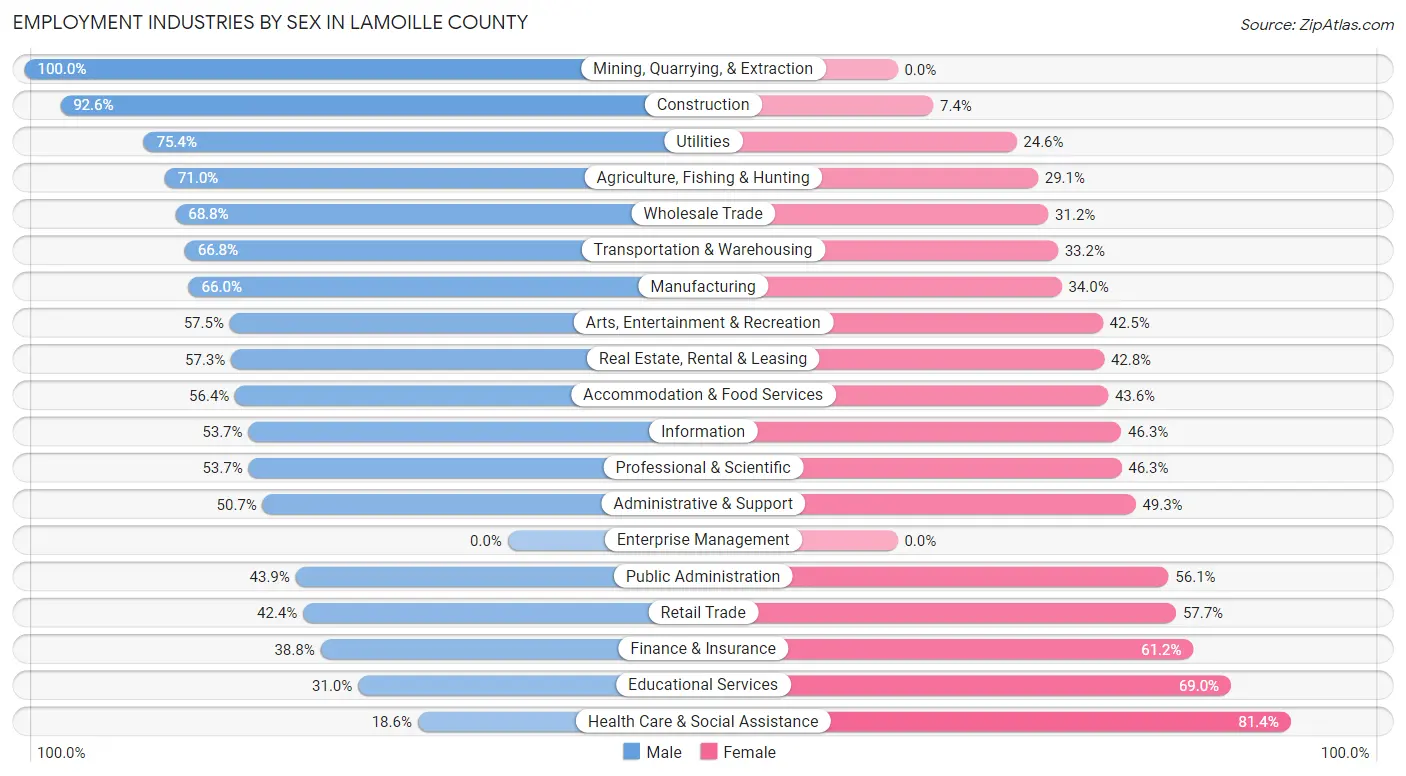
| Industry | Male | Female |
| Agriculture, Fishing & Hunting | 210 (71.0%) | 86 (29.0%) |
| Mining, Quarrying, & Extraction | 11 (100.0%) | 0 (0.0%) |
| Construction | 1,280 (92.6%) | 102 (7.4%) |
| Manufacturing | 778 (66.0%) | 400 (34.0%) |
| Wholesale Trade | 183 (68.8%) | 83 (31.2%) |
| Retail Trade | 587 (42.3%) | 799 (57.7%) |
| Transportation & Warehousing | 149 (66.8%) | 74 (33.2%) |
| Utilities | 150 (75.4%) | 49 (24.6%) |
| Information | 80 (53.7%) | 69 (46.3%) |
| Finance & Insurance | 131 (38.8%) | 207 (61.2%) |
| Real Estate, Rental & Leasing | 75 (57.3%) | 56 (42.7%) |
| Professional & Scientific | 220 (53.7%) | 190 (46.3%) |
| Enterprise Management | 0 (0.0%) | 0 (0.0%) |
| Administrative & Support | 314 (50.7%) | 305 (49.3%) |
| Educational Services | 445 (31.0%) | 992 (69.0%) |
| Health Care & Social Assistance | 423 (18.6%) | 1,847 (81.4%) |
| Arts, Entertainment & Recreation | 454 (57.5%) | 335 (42.5%) |
| Accommodation & Food Services | 866 (56.4%) | 669 (43.6%) |
| Public Administration | 245 (43.9%) | 313 (56.1%) |
| Total | 6,924 (49.7%) | 6,998 (50.3%) |
Education in Lamoille County
School Enrollment in Lamoille County
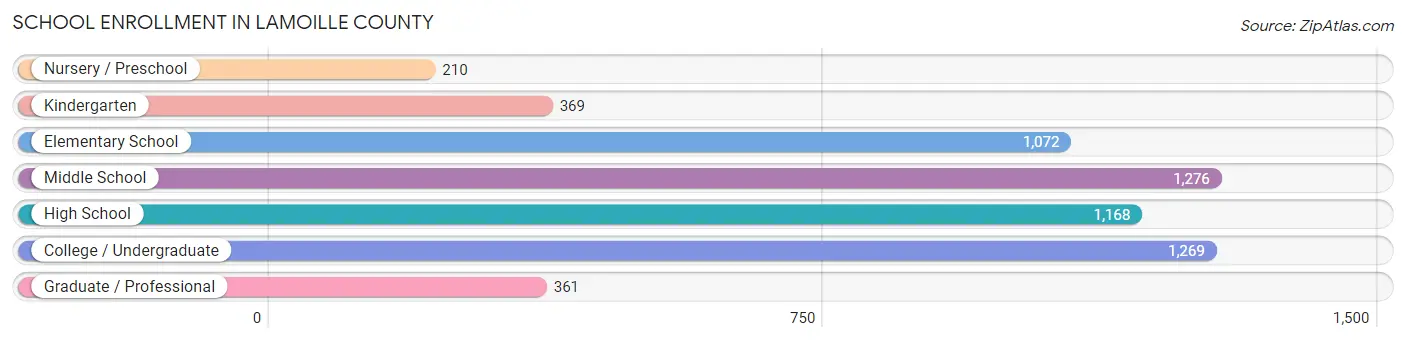
The most common levels of schooling among the 5,725 students in Lamoille County are middle school (1,276 | 22.3%), college / undergraduate (1,269 | 22.2%), and high school (1,168 | 20.4%).
| School Level | # Students | % Students |
| Nursery / Preschool | 210 | 3.7% |
| Kindergarten | 369 | 6.5% |
| Elementary School | 1,072 | 18.7% |
| Middle School | 1,276 | 22.3% |
| High School | 1,168 | 20.4% |
| College / Undergraduate | 1,269 | 22.2% |
| Graduate / Professional | 361 | 6.3% |
| Total | 5,725 | 100.0% |
School Enrollment by Age by Funding Source in Lamoille County
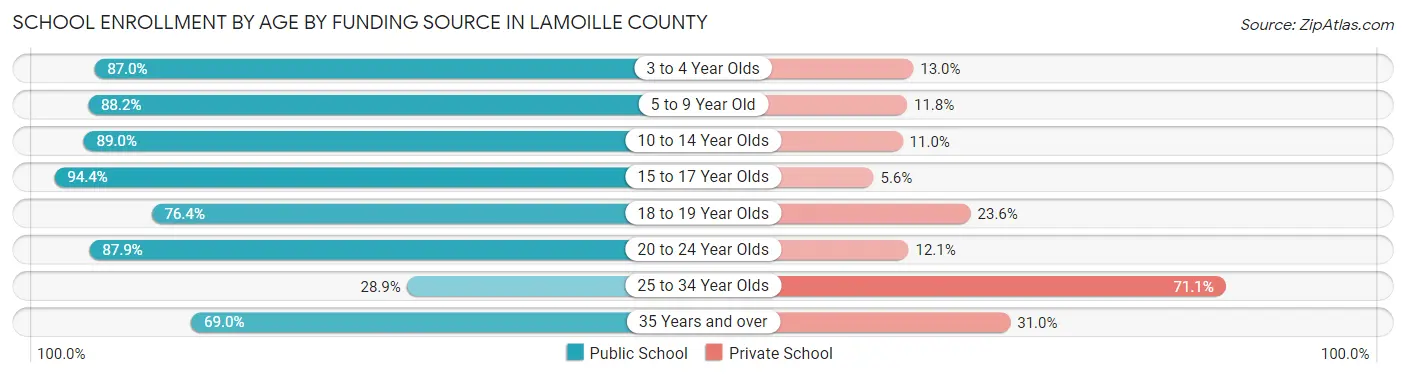
Out of a total of 5,725 students who are enrolled in schools in Lamoille County, 893 (15.6%) attend a private institution, while the remaining 4,832 (84.4%) are enrolled in public schools. The age group of 25 to 34 year olds has the highest likelihood of being enrolled in private schools, with 175 (71.1% in the age bracket) enrolled. Conversely, the age group of 15 to 17 year olds has the lowest likelihood of being enrolled in a private school, with 815 (94.4% in the age bracket) attending a public institution.
| Age Bracket | Public School | Private School |
| 3 to 4 Year Olds | 161 (87.0%) | 24 (13.0%) |
| 5 to 9 Year Old | 1,239 (88.2%) | 166 (11.8%) |
| 10 to 14 Year Olds | 1,312 (89.0%) | 162 (11.0%) |
| 15 to 17 Year Olds | 815 (94.4%) | 48 (5.6%) |
| 18 to 19 Year Olds | 420 (76.4%) | 130 (23.6%) |
| 20 to 24 Year Olds | 575 (87.9%) | 79 (12.1%) |
| 25 to 34 Year Olds | 71 (28.9%) | 175 (71.1%) |
| 35 Years and over | 240 (69.0%) | 108 (31.0%) |
| Total | 4,832 (84.4%) | 893 (15.6%) |
Educational Attainment by Field of Study in Lamoille County
Education (1,269 | 14.6%), business (1,258 | 14.4%), social sciences (863 | 9.9%), science & technology (847 | 9.7%), and bio, nature & agricultural (770 | 8.8%) are the most common fields of study among 8,707 individuals in Lamoille County who have obtained a bachelor's degree or higher.
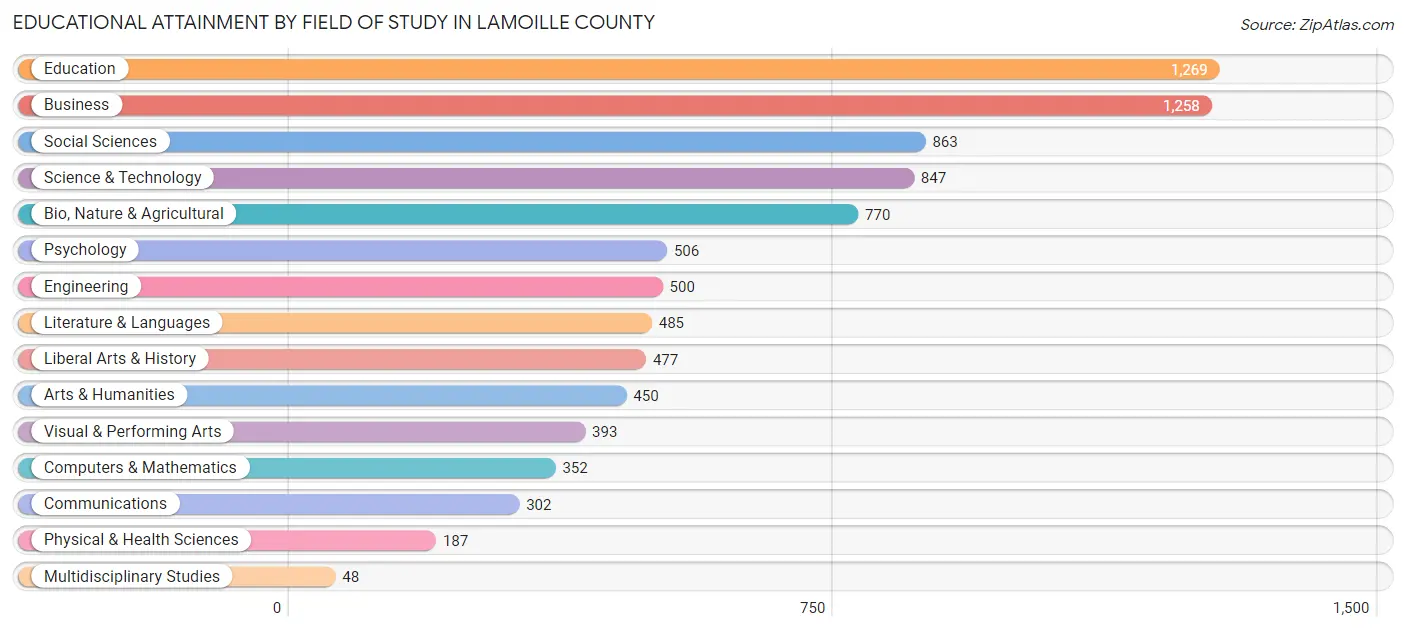
| Field of Study | # Graduates | % Graduates |
| Computers & Mathematics | 352 | 4.0% |
| Bio, Nature & Agricultural | 770 | 8.8% |
| Physical & Health Sciences | 187 | 2.1% |
| Psychology | 506 | 5.8% |
| Social Sciences | 863 | 9.9% |
| Engineering | 500 | 5.7% |
| Multidisciplinary Studies | 48 | 0.5% |
| Science & Technology | 847 | 9.7% |
| Business | 1,258 | 14.4% |
| Education | 1,269 | 14.6% |
| Literature & Languages | 485 | 5.6% |
| Liberal Arts & History | 477 | 5.5% |
| Visual & Performing Arts | 393 | 4.5% |
| Communications | 302 | 3.5% |
| Arts & Humanities | 450 | 5.2% |
| Total | 8,707 | 100.0% |
Transportation & Commute in Lamoille County
Vehicle Availability by Sex in Lamoille County
The most prevalent vehicle ownership categories in Lamoille County are males with 2 vehicles (3,569, accounting for 52.8%) and females with 2 vehicles (3,364, making up 53.2%).
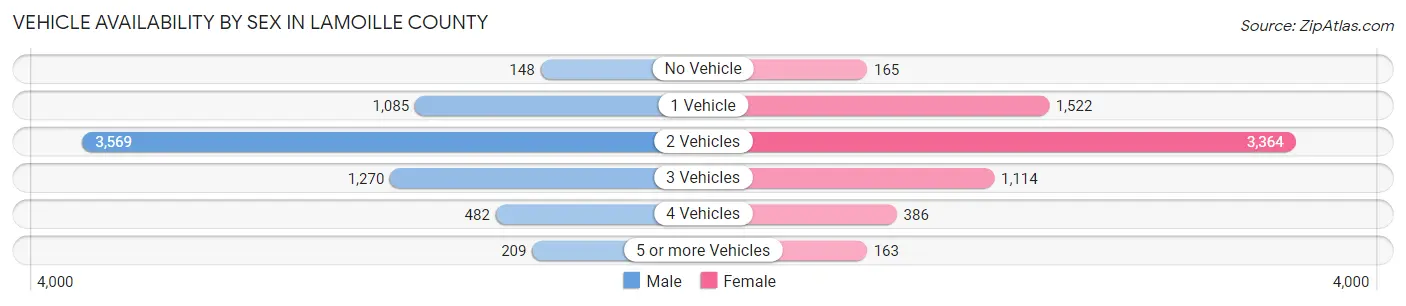
| Vehicles Available | Male | Female |
| No Vehicle | 148 (2.2%) | 165 (2.5%) |
| 1 Vehicle | 1,085 (16.0%) | 1,522 (22.7%) |
| 2 Vehicles | 3,569 (52.8%) | 3,364 (50.1%) |
| 3 Vehicles | 1,270 (18.8%) | 1,114 (16.6%) |
| 4 Vehicles | 482 (7.1%) | 386 (5.8%) |
| 5 or more Vehicles | 209 (3.1%) | 163 (2.4%) |
| Total | 6,763 (100.0%) | 6,714 (100.0%) |
Commute Time in Lamoille County
The most frequently occuring commute durations in Lamoille County are 10 to 14 minutes (1,988 commuters, 16.1%), 20 to 24 minutes (1,749 commuters, 14.2%), and 5 to 9 minutes (1,584 commuters, 12.8%).
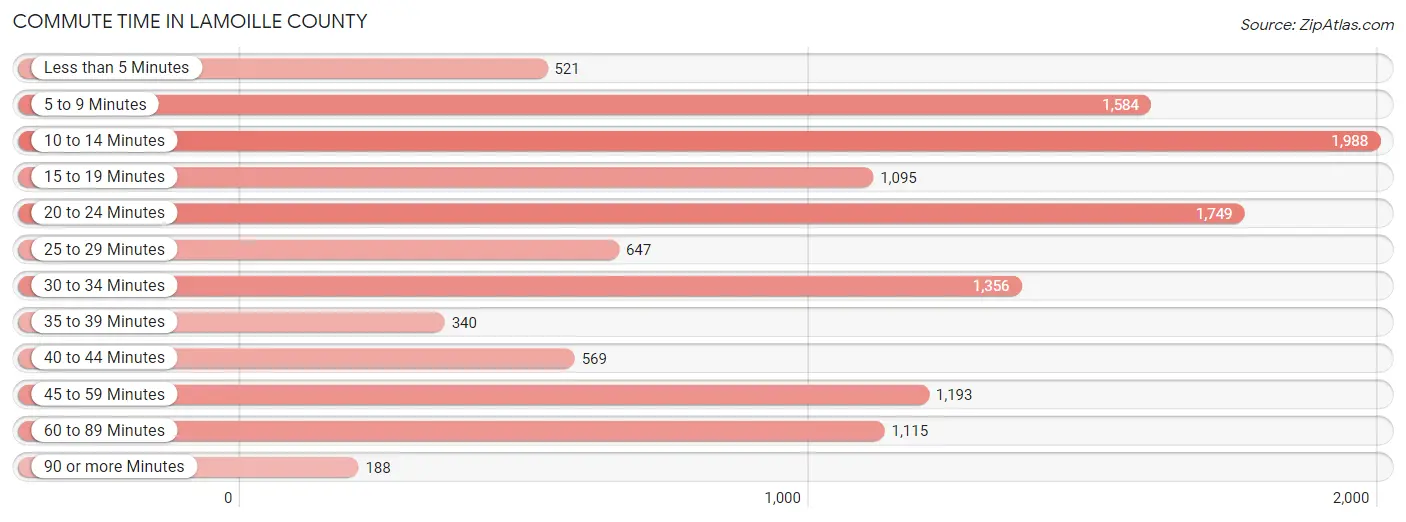
| Commute Time | # Commuters | % Commuters |
| Less than 5 Minutes | 521 | 4.2% |
| 5 to 9 Minutes | 1,584 | 12.8% |
| 10 to 14 Minutes | 1,988 | 16.1% |
| 15 to 19 Minutes | 1,095 | 8.9% |
| 20 to 24 Minutes | 1,749 | 14.2% |
| 25 to 29 Minutes | 647 | 5.2% |
| 30 to 34 Minutes | 1,356 | 11.0% |
| 35 to 39 Minutes | 340 | 2.8% |
| 40 to 44 Minutes | 569 | 4.6% |
| 45 to 59 Minutes | 1,193 | 9.7% |
| 60 to 89 Minutes | 1,115 | 9.0% |
| 90 or more Minutes | 188 | 1.5% |
Commute Time by Sex in Lamoille County
The most common commute times in Lamoille County are 10 to 14 minutes (952 commuters, 14.8%) for males and 10 to 14 minutes (1,036 commuters, 17.5%) for females.
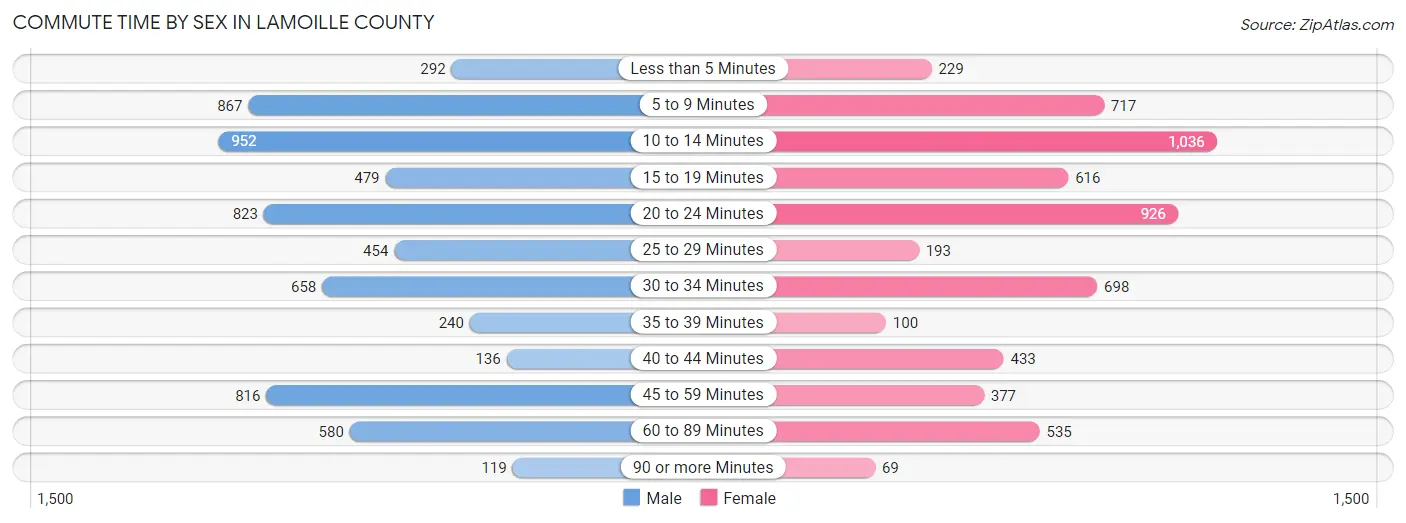
| Commute Time | Male | Female |
| Less than 5 Minutes | 292 (4.5%) | 229 (3.9%) |
| 5 to 9 Minutes | 867 (13.5%) | 717 (12.1%) |
| 10 to 14 Minutes | 952 (14.8%) | 1,036 (17.5%) |
| 15 to 19 Minutes | 479 (7.5%) | 616 (10.4%) |
| 20 to 24 Minutes | 823 (12.8%) | 926 (15.6%) |
| 25 to 29 Minutes | 454 (7.1%) | 193 (3.3%) |
| 30 to 34 Minutes | 658 (10.3%) | 698 (11.8%) |
| 35 to 39 Minutes | 240 (3.7%) | 100 (1.7%) |
| 40 to 44 Minutes | 136 (2.1%) | 433 (7.3%) |
| 45 to 59 Minutes | 816 (12.7%) | 377 (6.4%) |
| 60 to 89 Minutes | 580 (9.0%) | 535 (9.0%) |
| 90 or more Minutes | 119 (1.8%) | 69 (1.2%) |
Time of Departure to Work by Sex in Lamoille County
The most frequent times of departure to work in Lamoille County are 7:00 AM to 7:29 AM (1,119, 17.4%) for males and 7:00 AM to 7:29 AM (1,419, 23.9%) for females.
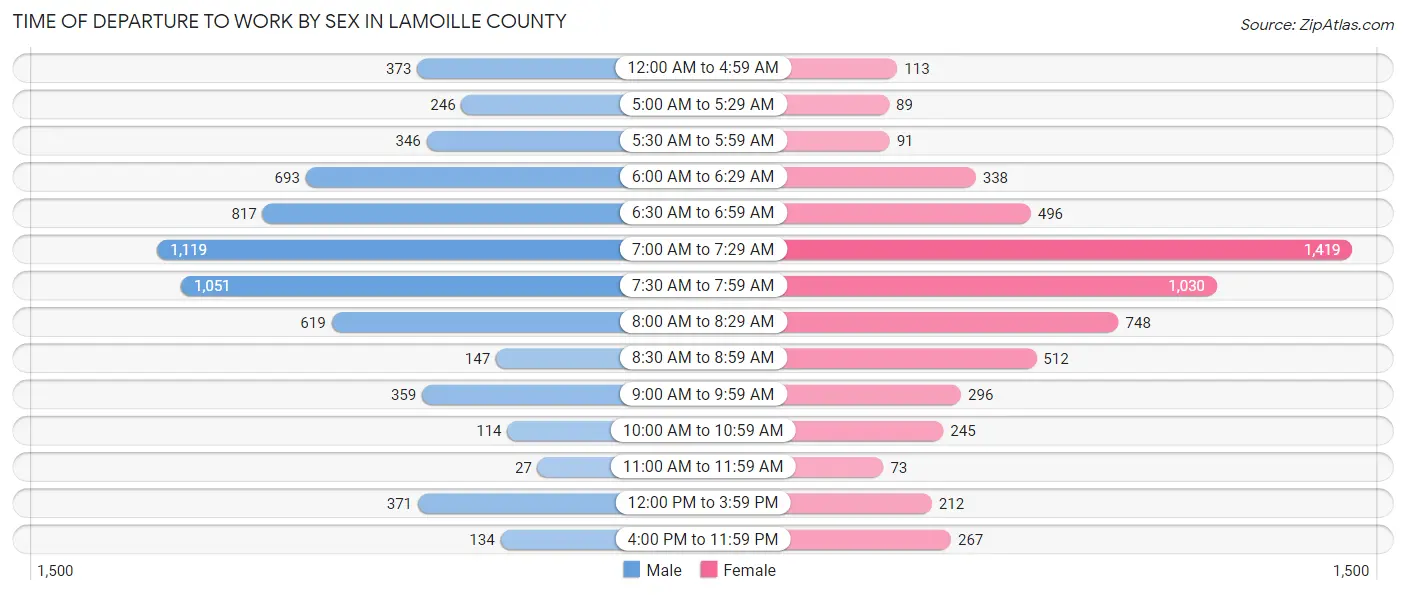
| Time of Departure | Male | Female |
| 12:00 AM to 4:59 AM | 373 (5.8%) | 113 (1.9%) |
| 5:00 AM to 5:29 AM | 246 (3.8%) | 89 (1.5%) |
| 5:30 AM to 5:59 AM | 346 (5.4%) | 91 (1.5%) |
| 6:00 AM to 6:29 AM | 693 (10.8%) | 338 (5.7%) |
| 6:30 AM to 6:59 AM | 817 (12.7%) | 496 (8.4%) |
| 7:00 AM to 7:29 AM | 1,119 (17.4%) | 1,419 (23.9%) |
| 7:30 AM to 7:59 AM | 1,051 (16.4%) | 1,030 (17.4%) |
| 8:00 AM to 8:29 AM | 619 (9.7%) | 748 (12.6%) |
| 8:30 AM to 8:59 AM | 147 (2.3%) | 512 (8.6%) |
| 9:00 AM to 9:59 AM | 359 (5.6%) | 296 (5.0%) |
| 10:00 AM to 10:59 AM | 114 (1.8%) | 245 (4.1%) |
| 11:00 AM to 11:59 AM | 27 (0.4%) | 73 (1.2%) |
| 12:00 PM to 3:59 PM | 371 (5.8%) | 212 (3.6%) |
| 4:00 PM to 11:59 PM | 134 (2.1%) | 267 (4.5%) |
| Total | 6,416 (100.0%) | 5,929 (100.0%) |
Housing Occupancy in Lamoille County
Occupancy by Ownership in Lamoille County
Of the total 11,176 dwellings in Lamoille County, owner-occupied units account for 8,213 (73.5%), while renter-occupied units make up 2,963 (26.5%).
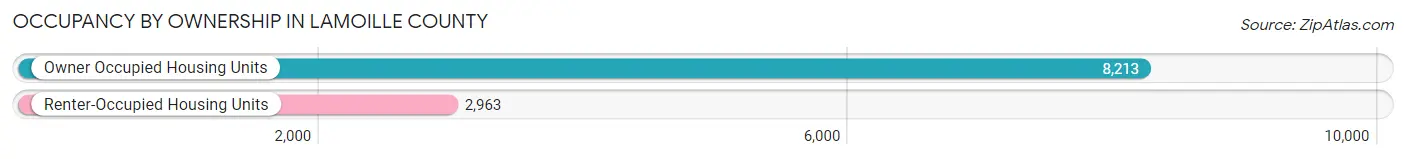
| Occupancy | # Housing Units | % Housing Units |
| Owner Occupied Housing Units | 8,213 | 73.5% |
| Renter-Occupied Housing Units | 2,963 | 26.5% |
| Total Occupied Housing Units | 11,176 | 100.0% |
Occupancy by Household Size in Lamoille County
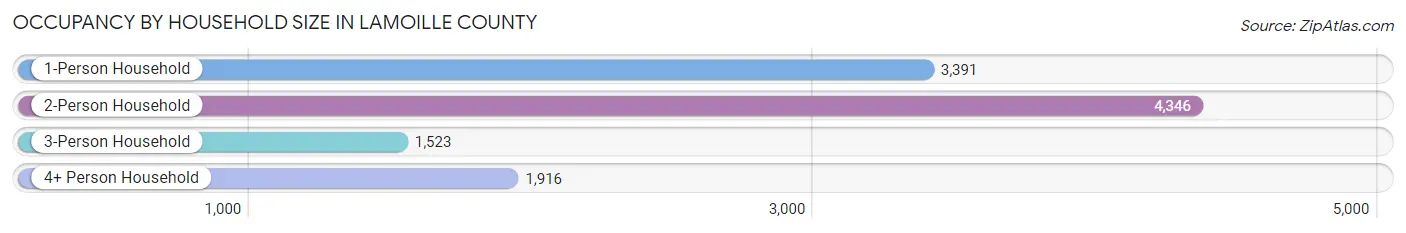
| Household Size | # Housing Units | % Housing Units |
| 1-Person Household | 3,391 | 30.3% |
| 2-Person Household | 4,346 | 38.9% |
| 3-Person Household | 1,523 | 13.6% |
| 4+ Person Household | 1,916 | 17.1% |
| Total Housing Units | 11,176 | 100.0% |
Occupancy by Ownership by Household Size in Lamoille County
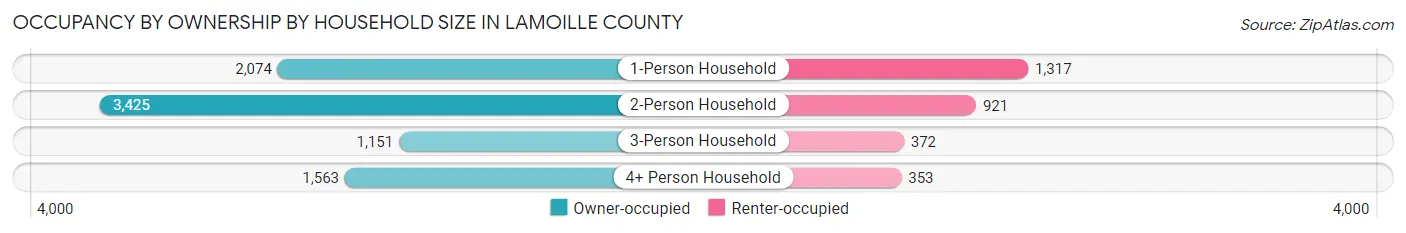
| Household Size | Owner-occupied | Renter-occupied |
| 1-Person Household | 2,074 (61.2%) | 1,317 (38.8%) |
| 2-Person Household | 3,425 (78.8%) | 921 (21.2%) |
| 3-Person Household | 1,151 (75.6%) | 372 (24.4%) |
| 4+ Person Household | 1,563 (81.6%) | 353 (18.4%) |
| Total Housing Units | 8,213 (73.5%) | 2,963 (26.5%) |
Occupancy by Educational Attainment in Lamoille County
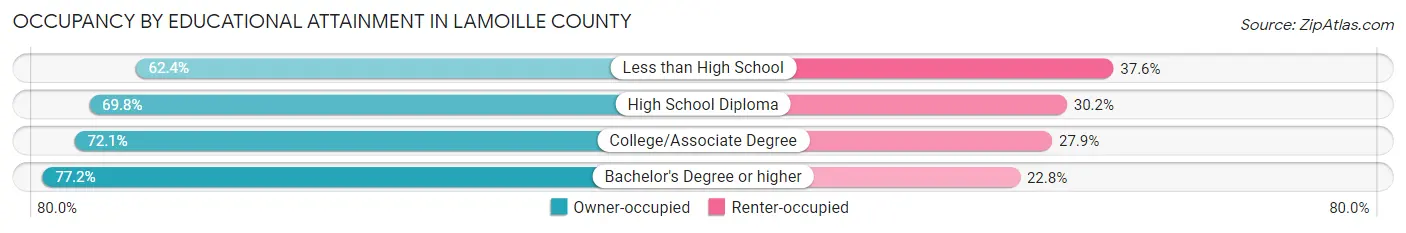
| Household Size | Owner-occupied | Renter-occupied |
| Less than High School | 335 (62.4%) | 202 (37.6%) |
| High School Diploma | 1,618 (69.8%) | 701 (30.2%) |
| College/Associate Degree | 2,300 (72.1%) | 890 (27.9%) |
| Bachelor's Degree or higher | 3,960 (77.2%) | 1,170 (22.8%) |
Occupancy by Age of Householder in Lamoille County
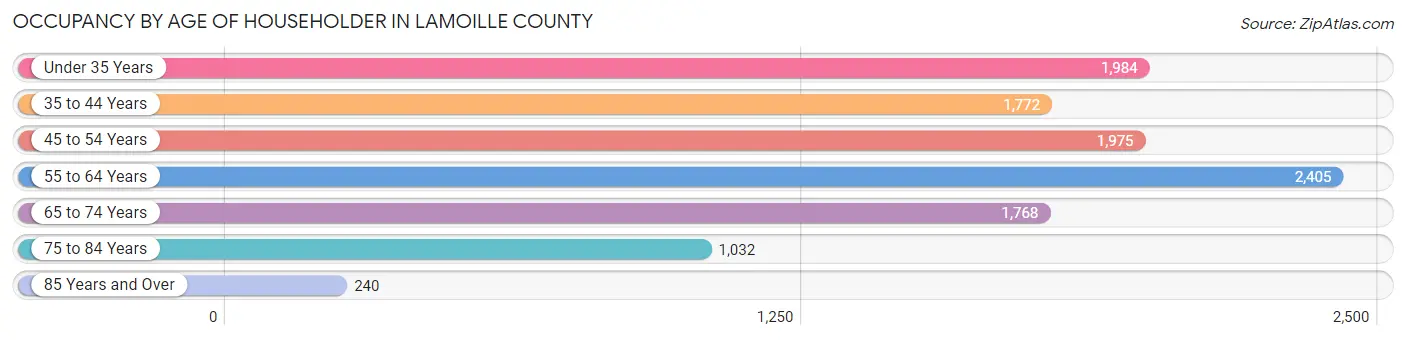
| Age Bracket | # Households | % Households |
| Under 35 Years | 1,984 | 17.7% |
| 35 to 44 Years | 1,772 | 15.9% |
| 45 to 54 Years | 1,975 | 17.7% |
| 55 to 64 Years | 2,405 | 21.5% |
| 65 to 74 Years | 1,768 | 15.8% |
| 75 to 84 Years | 1,032 | 9.2% |
| 85 Years and Over | 240 | 2.1% |
| Total | 11,176 | 100.0% |
Housing Finances in Lamoille County
Median Income by Occupancy in Lamoille County
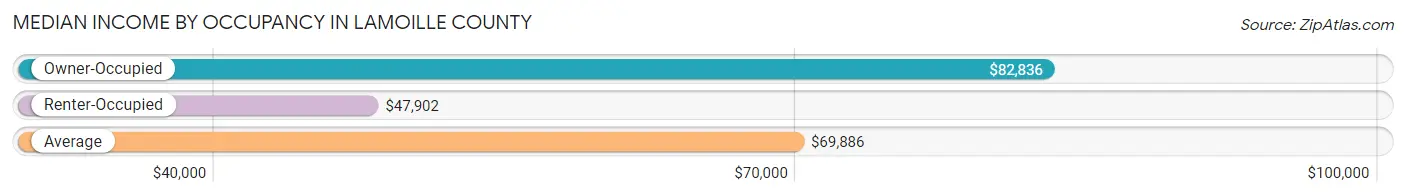
| Occupancy Type | # Households | Median Income |
| Owner-Occupied | 8,213 (73.5%) | $82,836 |
| Renter-Occupied | 2,963 (26.5%) | $47,902 |
| Average | 11,176 (100.0%) | $69,886 |
Occupancy by Householder Income Bracket in Lamoille County
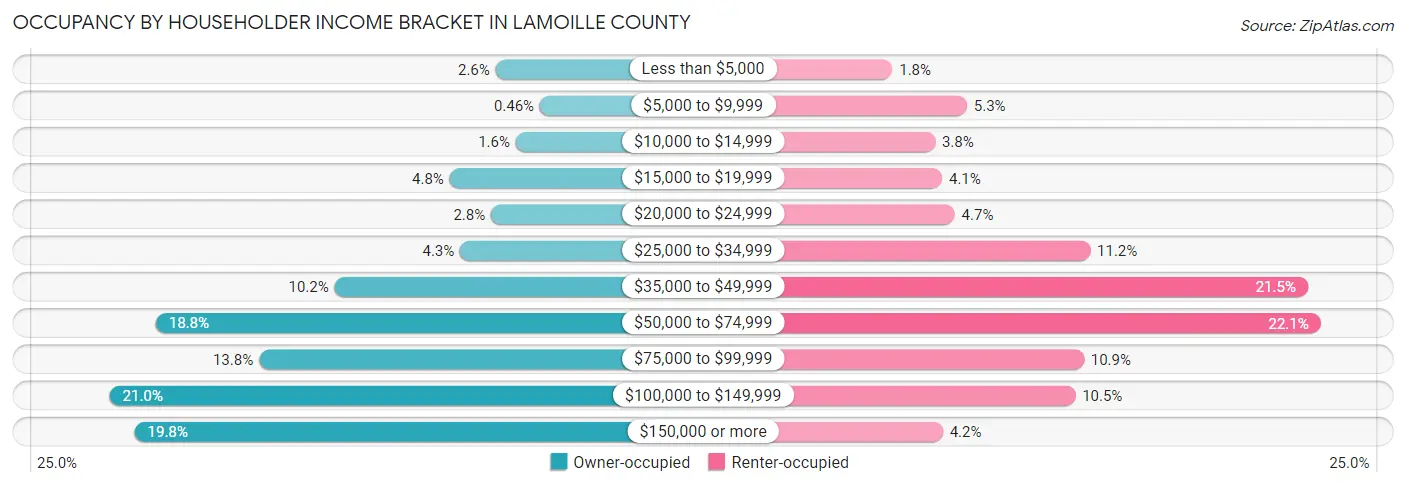
| Income Bracket | Owner-occupied | Renter-occupied |
| Less than $5,000 | 211 (2.6%) | 52 (1.8%) |
| $5,000 to $9,999 | 38 (0.5%) | 157 (5.3%) |
| $10,000 to $14,999 | 132 (1.6%) | 112 (3.8%) |
| $15,000 to $19,999 | 391 (4.8%) | 122 (4.1%) |
| $20,000 to $24,999 | 229 (2.8%) | 140 (4.7%) |
| $25,000 to $34,999 | 350 (4.3%) | 331 (11.2%) |
| $35,000 to $49,999 | 841 (10.2%) | 638 (21.5%) |
| $50,000 to $74,999 | 1,540 (18.8%) | 656 (22.1%) |
| $75,000 to $99,999 | 1,137 (13.8%) | 322 (10.9%) |
| $100,000 to $149,999 | 1,721 (20.9%) | 310 (10.5%) |
| $150,000 or more | 1,623 (19.8%) | 123 (4.2%) |
| Total | 8,213 (100.0%) | 2,963 (100.0%) |
Monthly Housing Cost Tiers in Lamoille County
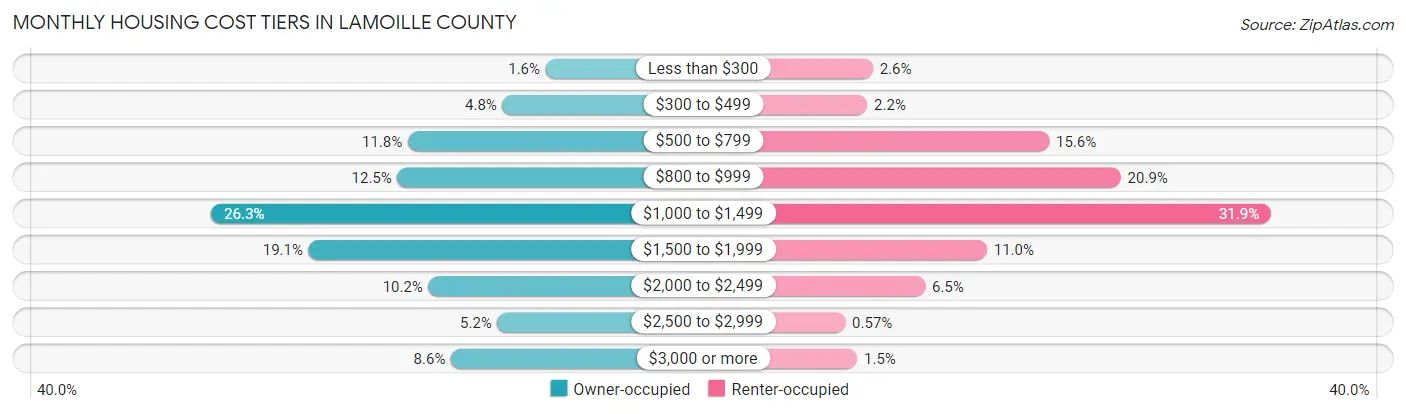
| Monthly Cost | Owner-occupied | Renter-occupied |
| Less than $300 | 132 (1.6%) | 77 (2.6%) |
| $300 to $499 | 393 (4.8%) | 65 (2.2%) |
| $500 to $799 | 966 (11.8%) | 462 (15.6%) |
| $800 to $999 | 1,029 (12.5%) | 618 (20.9%) |
| $1,000 to $1,499 | 2,157 (26.3%) | 946 (31.9%) |
| $1,500 to $1,999 | 1,566 (19.1%) | 326 (11.0%) |
| $2,000 to $2,499 | 841 (10.2%) | 191 (6.5%) |
| $2,500 to $2,999 | 424 (5.2%) | 17 (0.6%) |
| $3,000 or more | 705 (8.6%) | 43 (1.5%) |
| Total | 8,213 (100.0%) | 2,963 (100.0%) |
Physical Housing Characteristics in Lamoille County
Housing Structures in Lamoille County
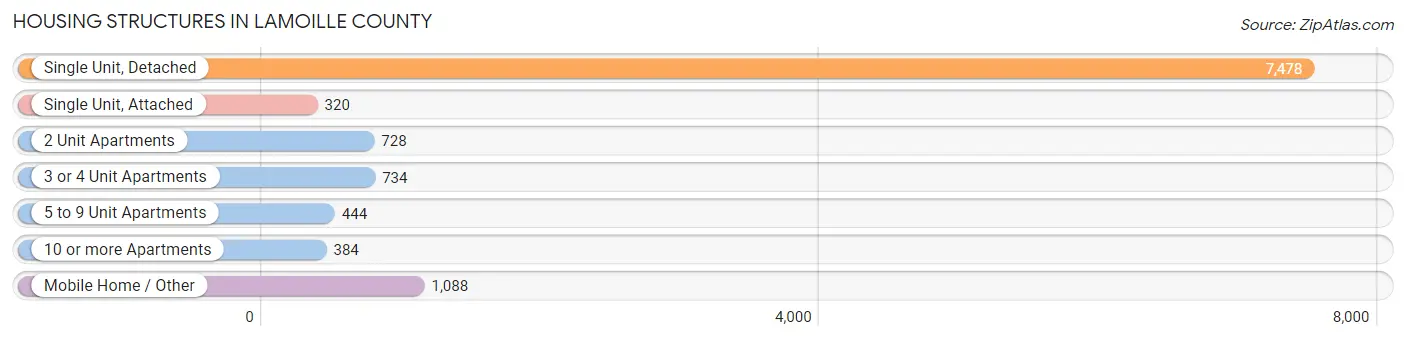
| Structure Type | # Housing Units | % Housing Units |
| Single Unit, Detached | 7,478 | 66.9% |
| Single Unit, Attached | 320 | 2.9% |
| 2 Unit Apartments | 728 | 6.5% |
| 3 or 4 Unit Apartments | 734 | 6.6% |
| 5 to 9 Unit Apartments | 444 | 4.0% |
| 10 or more Apartments | 384 | 3.4% |
| Mobile Home / Other | 1,088 | 9.7% |
| Total | 11,176 | 100.0% |
Housing Structures by Occupancy in Lamoille County
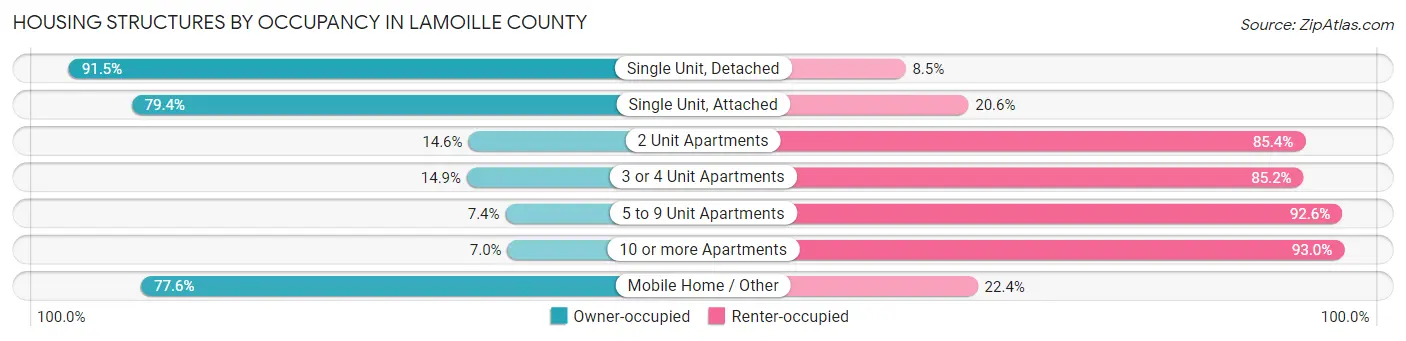
| Structure Type | Owner-occupied | Renter-occupied |
| Single Unit, Detached | 6,840 (91.5%) | 638 (8.5%) |
| Single Unit, Attached | 254 (79.4%) | 66 (20.6%) |
| 2 Unit Apartments | 106 (14.6%) | 622 (85.4%) |
| 3 or 4 Unit Apartments | 109 (14.8%) | 625 (85.2%) |
| 5 to 9 Unit Apartments | 33 (7.4%) | 411 (92.6%) |
| 10 or more Apartments | 27 (7.0%) | 357 (93.0%) |
| Mobile Home / Other | 844 (77.6%) | 244 (22.4%) |
| Total | 8,213 (73.5%) | 2,963 (26.5%) |
Housing Structures by Number of Rooms in Lamoille County
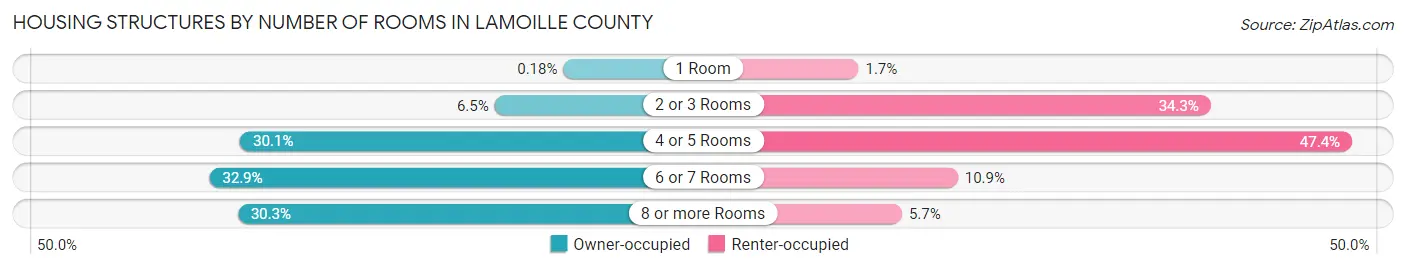
| Number of Rooms | Owner-occupied | Renter-occupied |
| 1 Room | 15 (0.2%) | 51 (1.7%) |
| 2 or 3 Rooms | 537 (6.5%) | 1,016 (34.3%) |
| 4 or 5 Rooms | 2,470 (30.1%) | 1,403 (47.3%) |
| 6 or 7 Rooms | 2,703 (32.9%) | 323 (10.9%) |
| 8 or more Rooms | 2,488 (30.3%) | 170 (5.7%) |
| Total | 8,213 (100.0%) | 2,963 (100.0%) |
Housing Structure by Heating Type in Lamoille County
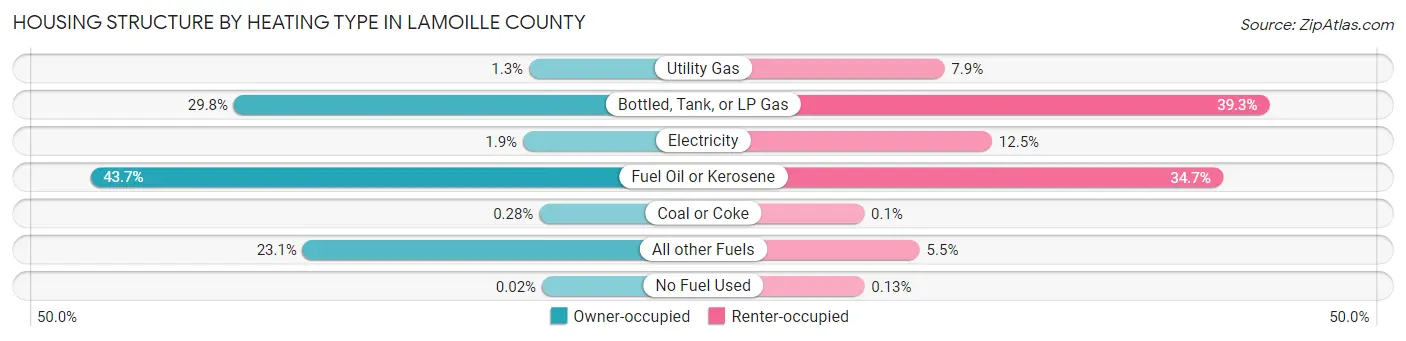
| Heating Type | Owner-occupied | Renter-occupied |
| Utility Gas | 104 (1.3%) | 233 (7.9%) |
| Bottled, Tank, or LP Gas | 2,446 (29.8%) | 1,163 (39.3%) |
| Electricity | 152 (1.8%) | 369 (12.4%) |
| Fuel Oil or Kerosene | 3,586 (43.7%) | 1,029 (34.7%) |
| Coal or Coke | 23 (0.3%) | 3 (0.1%) |
| All other Fuels | 1,900 (23.1%) | 162 (5.5%) |
| No Fuel Used | 2 (0.0%) | 4 (0.1%) |
| Total | 8,213 (100.0%) | 2,963 (100.0%) |
Household Vehicle Usage in Lamoille County
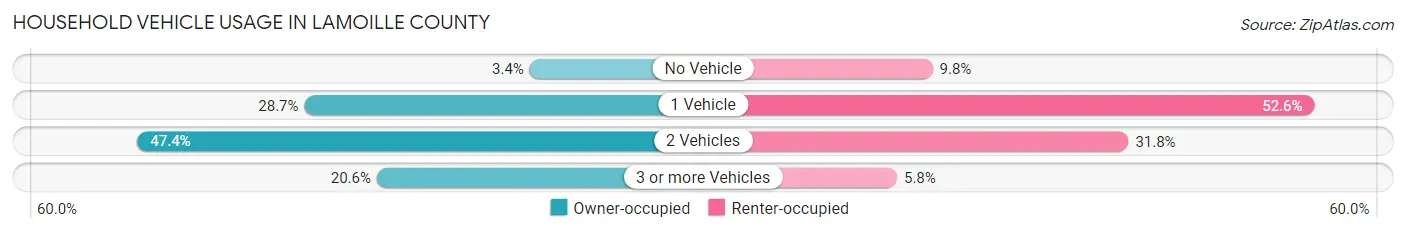
| Vehicles per Household | Owner-occupied | Renter-occupied |
| No Vehicle | 281 (3.4%) | 291 (9.8%) |
| 1 Vehicle | 2,354 (28.7%) | 1,558 (52.6%) |
| 2 Vehicles | 3,890 (47.4%) | 941 (31.8%) |
| 3 or more Vehicles | 1,688 (20.5%) | 173 (5.8%) |
| Total | 8,213 (100.0%) | 2,963 (100.0%) |
Real Estate & Mortgages in Lamoille County
Real Estate and Mortgage Overview in Lamoille County
| Characteristic | Without Mortgage | With Mortgage |
| Housing Units | 3,188 | 5,025 |
| Median Property Value | $279,900 | $265,200 |
| Median Household Income | $63,770 | $1,034 |
| Monthly Housing Costs | $863 | $659 |
| Real Estate Taxes | $4,755 | $30 |
Property Value by Mortgage Status in Lamoille County
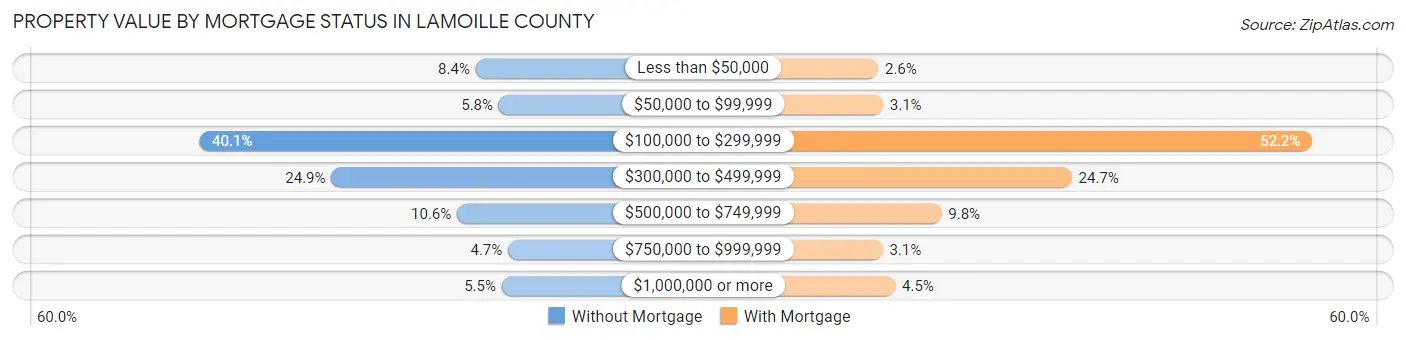
| Property Value | Without Mortgage | With Mortgage |
| Less than $50,000 | 269 (8.4%) | 129 (2.6%) |
| $50,000 to $99,999 | 185 (5.8%) | 157 (3.1%) |
| $100,000 to $299,999 | 1,277 (40.1%) | 2,623 (52.2%) |
| $300,000 to $499,999 | 795 (24.9%) | 1,241 (24.7%) |
| $500,000 to $749,999 | 337 (10.6%) | 493 (9.8%) |
| $750,000 to $999,999 | 151 (4.7%) | 155 (3.1%) |
| $1,000,000 or more | 174 (5.5%) | 227 (4.5%) |
| Total | 3,188 (100.0%) | 5,025 (100.0%) |
Household Income by Mortgage Status in Lamoille County
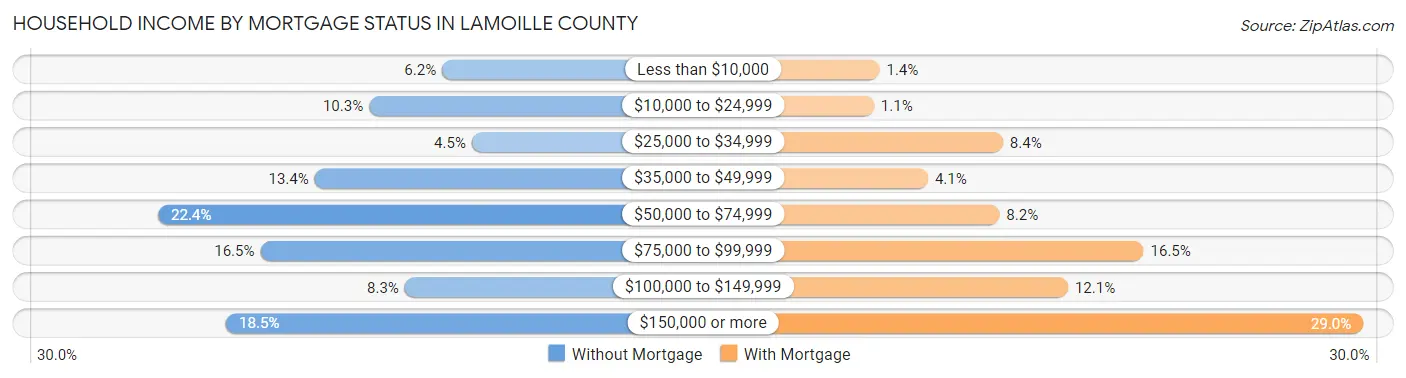
| Household Income | Without Mortgage | With Mortgage |
| Less than $10,000 | 196 (6.1%) | 69 (1.4%) |
| $10,000 to $24,999 | 329 (10.3%) | 53 (1.1%) |
| $25,000 to $34,999 | 142 (4.4%) | 423 (8.4%) |
| $35,000 to $49,999 | 428 (13.4%) | 208 (4.1%) |
| $50,000 to $74,999 | 713 (22.4%) | 413 (8.2%) |
| $75,000 to $99,999 | 527 (16.5%) | 827 (16.5%) |
| $100,000 to $149,999 | 264 (8.3%) | 610 (12.1%) |
| $150,000 or more | 589 (18.5%) | 1,457 (29.0%) |
| Total | 3,188 (100.0%) | 5,025 (100.0%) |
Property Value to Household Income Ratio in Lamoille County
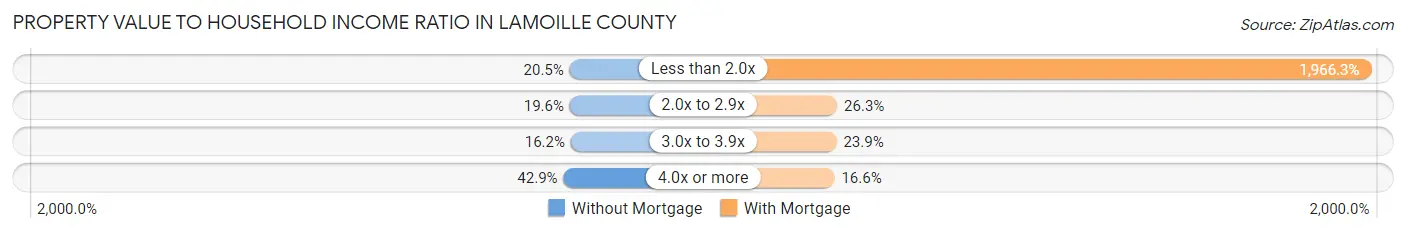
| Value-to-Income Ratio | Without Mortgage | With Mortgage |
| Less than 2.0x | 652 (20.4%) | 98,806 (1,966.3%) |
| 2.0x to 2.9x | 626 (19.6%) | 1,323 (26.3%) |
| 3.0x to 3.9x | 517 (16.2%) | 1,201 (23.9%) |
| 4.0x or more | 1,369 (42.9%) | 836 (16.6%) |
| Total | 3,188 (100.0%) | 5,025 (100.0%) |
Real Estate Taxes by Mortgage Status in Lamoille County

| Property Taxes | Without Mortgage | With Mortgage |
| Less than $800 | 294 (9.2%) | 2 (0.0%) |
| $800 to $1,499 | 95 (3.0%) | 74 (1.5%) |
| $800 to $1,499 | 2,760 (86.6%) | 167 (3.3%) |
| Total | 3,188 (100.0%) | 5,025 (100.0%) |
Health & Disability in Lamoille County
Health Insurance Coverage by Age in Lamoille County
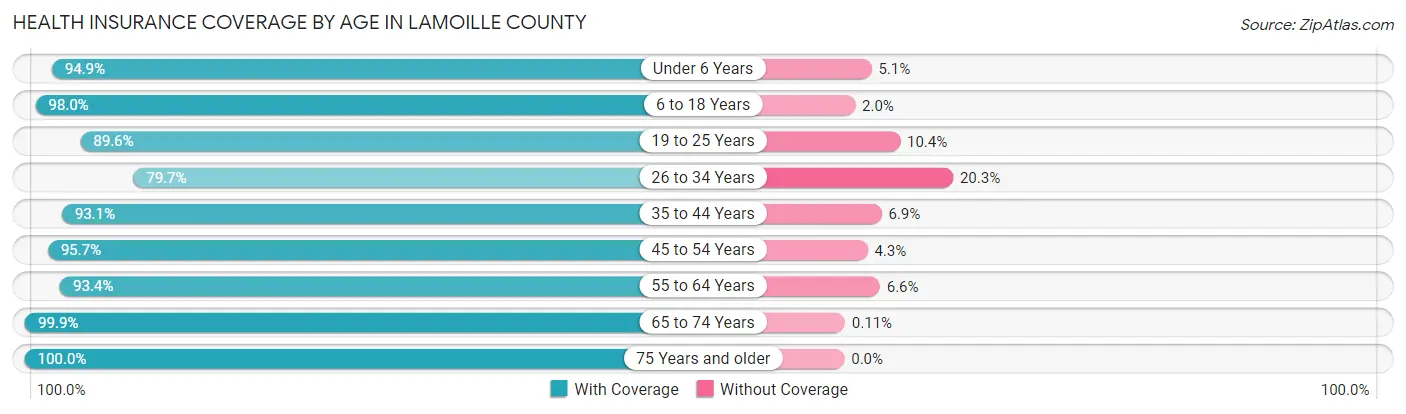
| Age Bracket | With Coverage | Without Coverage |
| Under 6 Years | 1,423 (94.9%) | 76 (5.1%) |
| 6 to 18 Years | 3,977 (98.0%) | 82 (2.0%) |
| 19 to 25 Years | 2,111 (89.6%) | 245 (10.4%) |
| 26 to 34 Years | 2,333 (79.7%) | 593 (20.3%) |
| 35 to 44 Years | 3,137 (93.1%) | 234 (6.9%) |
| 45 to 54 Years | 3,235 (95.7%) | 146 (4.3%) |
| 55 to 64 Years | 3,501 (93.4%) | 248 (6.6%) |
| 65 to 74 Years | 2,767 (99.9%) | 3 (0.1%) |
| 75 Years and older | 1,764 (100.0%) | 0 (0.0%) |
| Total | 24,248 (93.7%) | 1,627 (6.3%) |
Health Insurance Coverage by Citizenship Status in Lamoille County
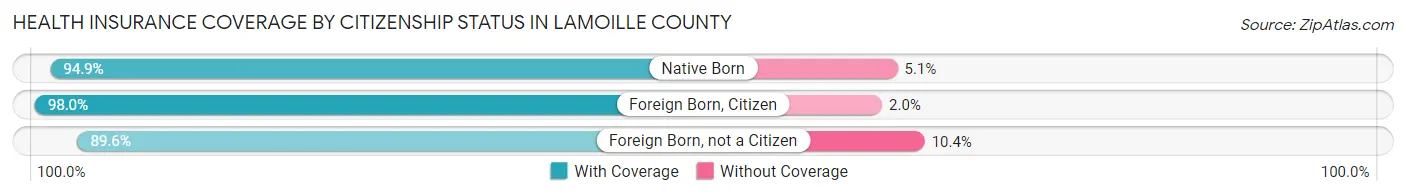
| Citizenship Status | With Coverage | Without Coverage |
| Native Born | 1,423 (94.9%) | 76 (5.1%) |
| Foreign Born, Citizen | 3,977 (98.0%) | 82 (2.0%) |
| Foreign Born, not a Citizen | 2,111 (89.6%) | 245 (10.4%) |
Health Insurance Coverage by Household Income in Lamoille County
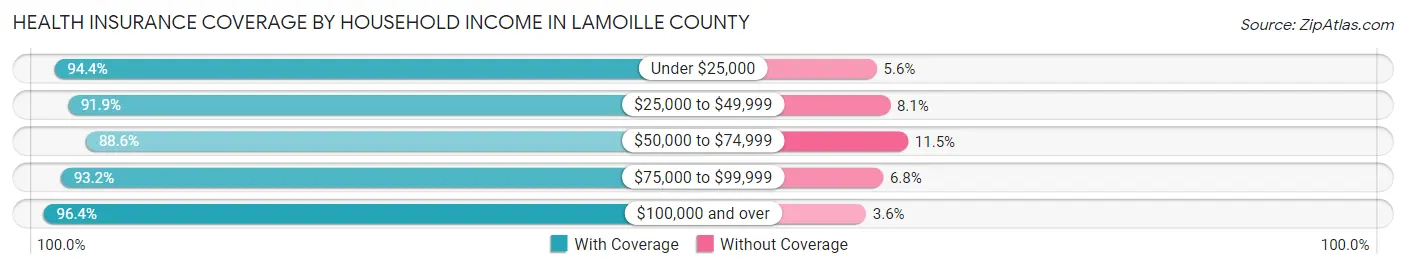
| Household Income | With Coverage | Without Coverage |
| Under $25,000 | 1,962 (94.4%) | 116 (5.6%) |
| $25,000 to $49,999 | 3,594 (91.9%) | 316 (8.1%) |
| $50,000 to $74,999 | 4,083 (88.5%) | 528 (11.5%) |
| $75,000 to $99,999 | 3,572 (93.2%) | 260 (6.8%) |
| $100,000 and over | 10,506 (96.4%) | 389 (3.6%) |
Public vs Private Health Insurance Coverage by Age in Lamoille County
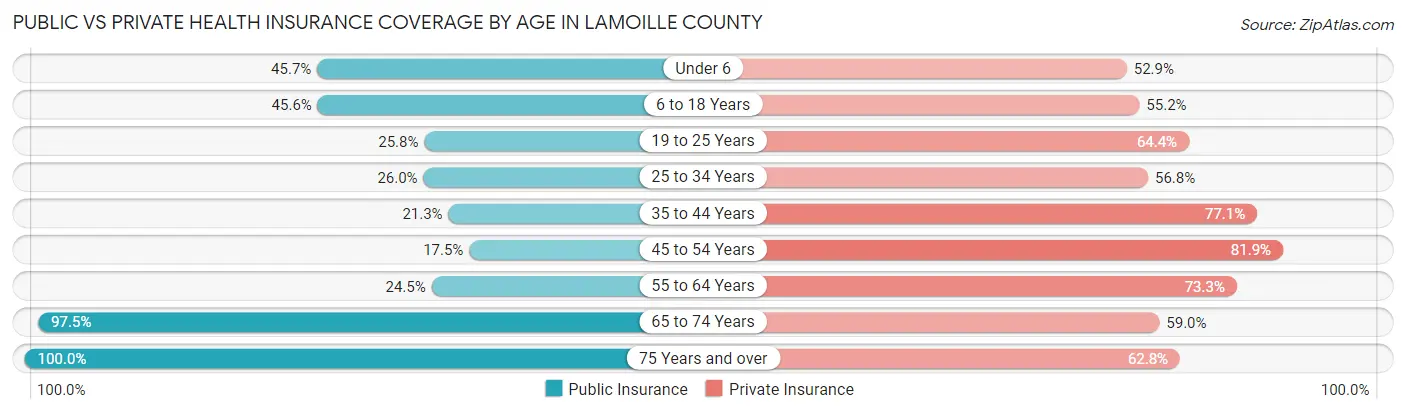
| Age Bracket | Public Insurance | Private Insurance |
| Under 6 | 685 (45.7%) | 793 (52.9%) |
| 6 to 18 Years | 1,851 (45.6%) | 2,242 (55.2%) |
| 19 to 25 Years | 608 (25.8%) | 1,518 (64.4%) |
| 25 to 34 Years | 760 (26.0%) | 1,663 (56.8%) |
| 35 to 44 Years | 719 (21.3%) | 2,598 (77.1%) |
| 45 to 54 Years | 591 (17.5%) | 2,768 (81.9%) |
| 55 to 64 Years | 917 (24.5%) | 2,748 (73.3%) |
| 65 to 74 Years | 2,701 (97.5%) | 1,633 (59.0%) |
| 75 Years and over | 1,764 (100.0%) | 1,107 (62.8%) |
| Total | 10,596 (40.9%) | 17,070 (66.0%) |
Disability Status by Sex by Age in Lamoille County
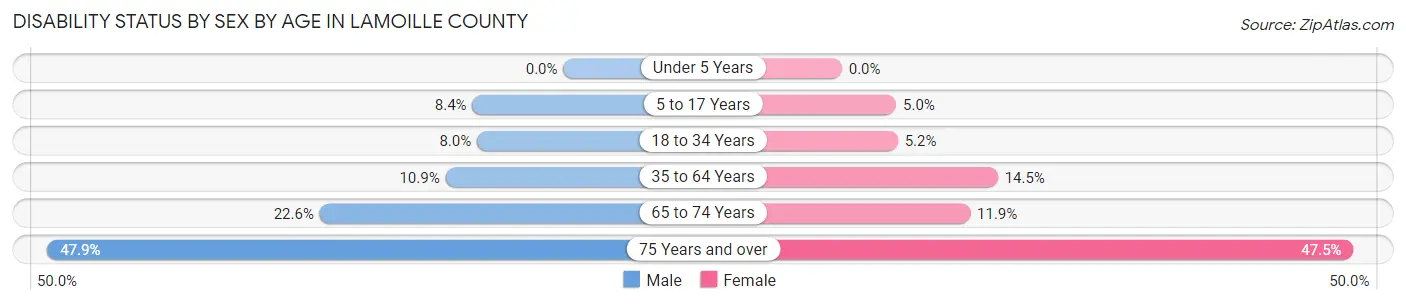
| Age Bracket | Male | Female |
| Under 5 Years | 0 (0.0%) | 0 (0.0%) |
| 5 to 17 Years | 179 (8.4%) | 97 (5.0%) |
| 18 to 34 Years | 225 (8.0%) | 144 (5.2%) |
| 35 to 64 Years | 575 (10.9%) | 759 (14.5%) |
| 65 to 74 Years | 315 (22.6%) | 164 (11.9%) |
| 75 Years and over | 399 (47.9%) | 442 (47.5%) |
Disability Class by Sex by Age in Lamoille County
Disability Class: Hearing Difficulty
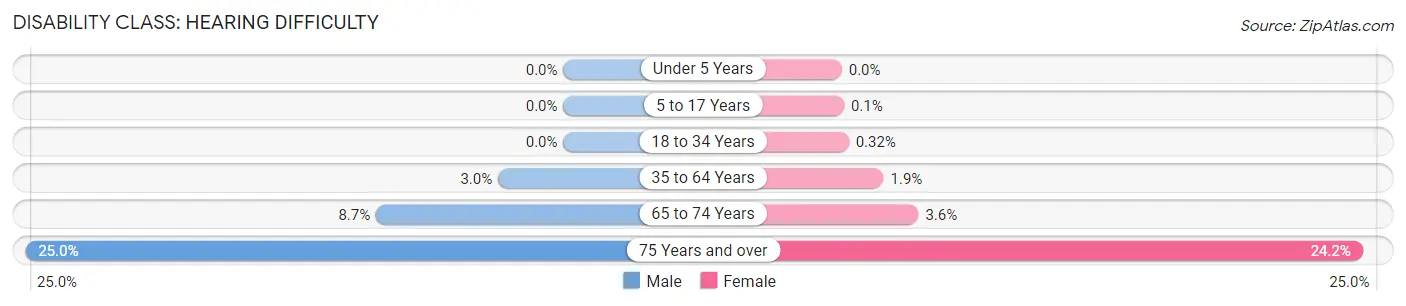
| Age Bracket | Male | Female |
| Under 5 Years | 0 (0.0%) | 0 (0.0%) |
| 5 to 17 Years | 0 (0.0%) | 2 (0.1%) |
| 18 to 34 Years | 0 (0.0%) | 9 (0.3%) |
| 35 to 64 Years | 159 (3.0%) | 102 (1.9%) |
| 65 to 74 Years | 121 (8.7%) | 49 (3.6%) |
| 75 Years and over | 208 (25.0%) | 225 (24.2%) |
Disability Class: Vision Difficulty
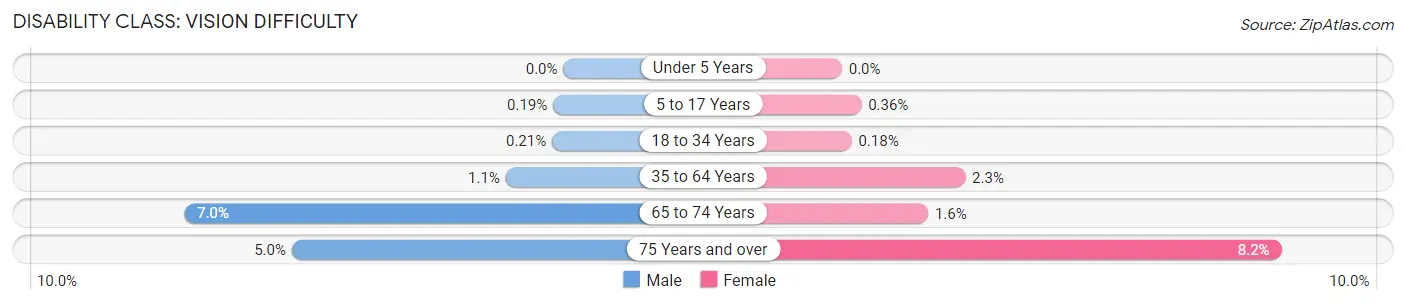
| Age Bracket | Male | Female |
| Under 5 Years | 0 (0.0%) | 0 (0.0%) |
| 5 to 17 Years | 4 (0.2%) | 7 (0.4%) |
| 18 to 34 Years | 6 (0.2%) | 5 (0.2%) |
| 35 to 64 Years | 56 (1.1%) | 120 (2.3%) |
| 65 to 74 Years | 98 (7.0%) | 22 (1.6%) |
| 75 Years and over | 42 (5.0%) | 76 (8.2%) |
Disability Class: Cognitive Difficulty
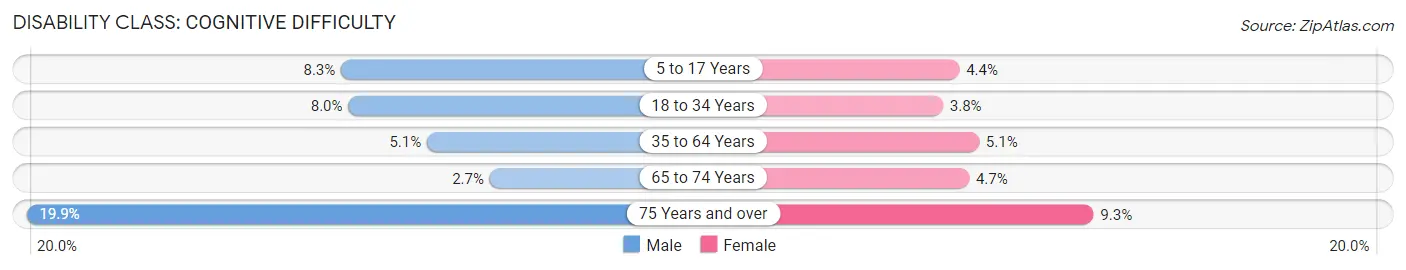
| Age Bracket | Male | Female |
| 5 to 17 Years | 175 (8.3%) | 84 (4.4%) |
| 18 to 34 Years | 224 (8.0%) | 104 (3.7%) |
| 35 to 64 Years | 266 (5.1%) | 267 (5.1%) |
| 65 to 74 Years | 38 (2.7%) | 65 (4.7%) |
| 75 Years and over | 166 (19.9%) | 87 (9.3%) |
Disability Class: Ambulatory Difficulty
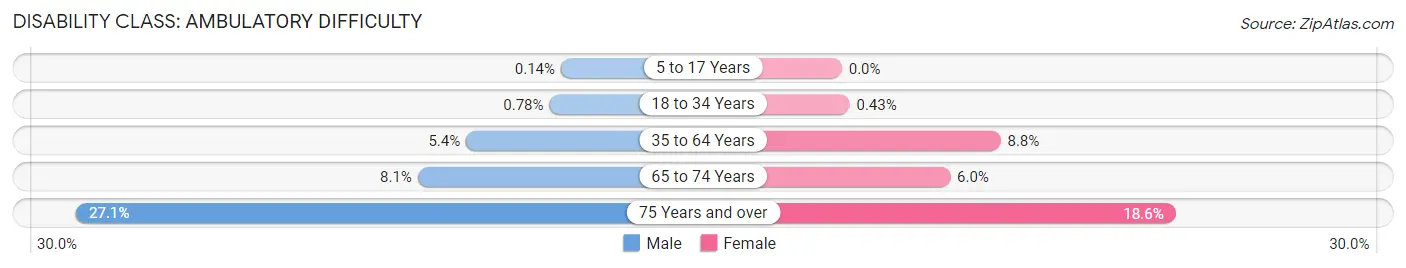
| Age Bracket | Male | Female |
| 5 to 17 Years | 3 (0.1%) | 0 (0.0%) |
| 18 to 34 Years | 22 (0.8%) | 12 (0.4%) |
| 35 to 64 Years | 285 (5.4%) | 464 (8.8%) |
| 65 to 74 Years | 113 (8.1%) | 83 (6.0%) |
| 75 Years and over | 226 (27.1%) | 173 (18.6%) |
Disability Class: Self-Care Difficulty
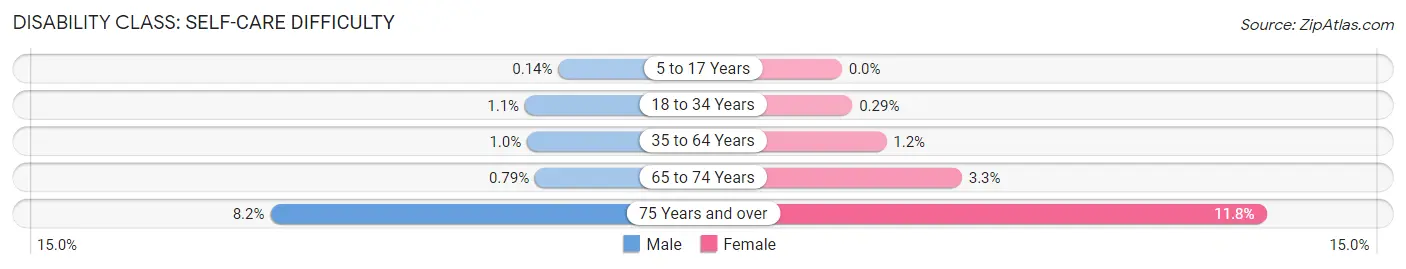
| Age Bracket | Male | Female |
| 5 to 17 Years | 3 (0.1%) | 0 (0.0%) |
| 18 to 34 Years | 30 (1.1%) | 8 (0.3%) |
| 35 to 64 Years | 53 (1.0%) | 65 (1.2%) |
| 65 to 74 Years | 11 (0.8%) | 46 (3.3%) |
| 75 Years and over | 68 (8.2%) | 110 (11.8%) |
Technology Access in Lamoille County
Computing Device Access in Lamoille County
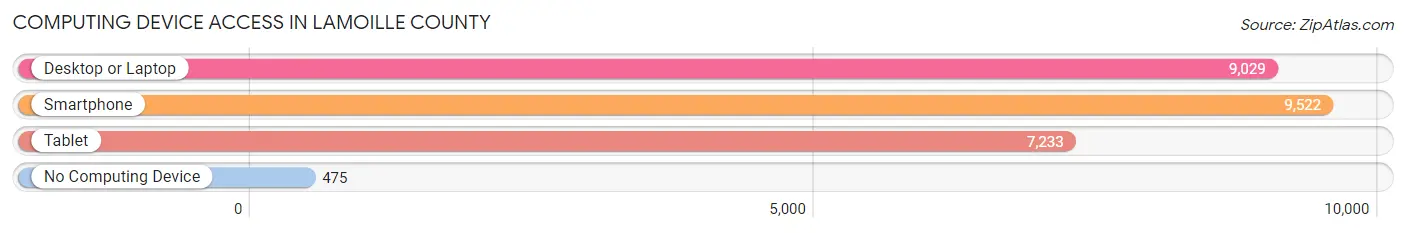
| Device Type | # Households | % Households |
| Desktop or Laptop | 9,029 | 80.8% |
| Smartphone | 9,522 | 85.2% |
| Tablet | 7,233 | 64.7% |
| No Computing Device | 475 | 4.3% |
| Total | 11,176 | 100.0% |
Internet Access in Lamoille County
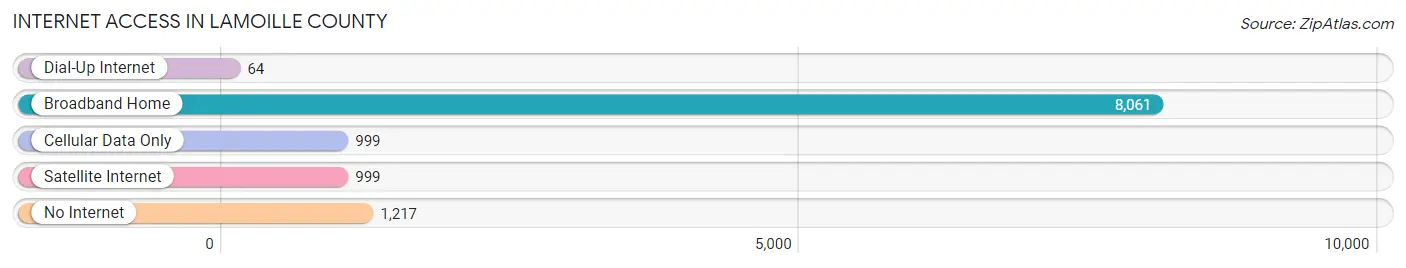
| Internet Type | # Households | % Households |
| Dial-Up Internet | 64 | 0.6% |
| Broadband Home | 8,061 | 72.1% |
| Cellular Data Only | 999 | 8.9% |
| Satellite Internet | 999 | 8.9% |
| No Internet | 1,217 | 10.9% |
| Total | 11,176 | 100.0% |
Lamoille County Summary
Lamoille County is located in the northern part of the state of Vermont, in the United States. It is bordered by Franklin County to the north, Chittenden County to the east, Washington County to the south, and Orleans County to the west. The county seat is the town of Hyde Park. Lamoille County is part of the Burlington-South Burlington, VT Metropolitan Statistical Area.
History
Lamoille County was created in 1835 from parts of Chittenden and Franklin counties. It was named after the Lamoille River, which flows through the county. The first settlers in the area were mostly of English and French descent. The first permanent settlement was established in 1790 in the town of Cambridge.
The county was largely agricultural until the late 19th century, when the railroad arrived and industry began to develop. The county was also home to several marble quarries, which provided the stone for many of the state's public buildings.
Geography
Lamoille County covers an area of 545 square miles, making it the second-smallest county in Vermont. The terrain is mostly hilly and forested, with the highest point being Mount Mansfield, at 4,393 feet. The Lamoille River flows through the county, and there are several lakes, including Lake Elmore, Lake Eden, and Lake Lamoille.
The county is home to several state parks, including Elmore State Park, Smugglers' Notch State Park, and Mount Mansfield State Forest.
Economy
The economy of Lamoille County is largely based on agriculture, tourism, and manufacturing. The county is home to several large dairy farms, as well as several smaller farms that produce vegetables, fruits, and maple syrup.
Tourism is also an important part of the economy, with many visitors coming to the area to enjoy the natural beauty of the mountains and lakes. The county is home to several ski resorts, including Smugglers' Notch and Stowe Mountain Resort.
Manufacturing is also an important part of the economy, with several companies producing furniture, electronics, and other products.
Demographics
As of the 2010 census, the population of Lamoille County was 24,475. The population is mostly white (96.2%), with small percentages of African Americans (1.2%), Native Americans (0.5%), Asians (0.5%), and other races (1.6%). The median household income is $50,945, and the median age is 43.
The largest cities in the county are Morrisville (population 2,845), Stowe (population 4,314), and Hyde Park (population 1,845). The county is served by several school districts, including Lamoille Union High School, Stowe Elementary School, and Morrisville Elementary School.
Common Questions
What is the Total Population of Lamoille County?
Total Population of Lamoille County is 25,977.
What is the Total Male Population of Lamoille County?
Total Male Population of Lamoille County is 13,023.
What is the Total Female Population of Lamoille County?
Total Female Population of Lamoille County is 12,954.
What is the Ratio of Males per 100 Females in Lamoille County?
There are 100.53 Males per 100 Females in Lamoille County.
What is the Ratio of Females per 100 Males in Lamoille County?
There are 99.47 Females per 100 Males in Lamoille County.
What is the Median Population Age in Lamoille County?
Median Population Age in Lamoille County is 41.0 Years.
What is the Average Family Size in Lamoille County
Average Family Size in Lamoille County is 2.8 People.
What is the Average Household Size in Lamoille County
Average Household Size in Lamoille County is 2.3 People.
What is Per Capita Income in Lamoille County?
Per Capita income in Lamoille County is $42,778.
What is the Median Family Income in Lamoille County?
Median Family Income in Lamoille County is $87,358.
What is the Median Household income in Lamoille County?
Median Household Income in Lamoille County is $69,886.
What is Income or Wage Gap in Lamoille County?
Income or Wage Gap in Lamoille County is 18.0%.
Women in Lamoille County earn 82.0 cents for every dollar earned by a man.
What is Family Income Deficit in Lamoille County?
Family Income Deficit in Lamoille County is $10,640.
Families that are below poverty line in Lamoille County earn $10,640 less on average than the poverty threshold level.
What is Inequality or Gini Index in Lamoille County?
Inequality or Gini Index in Lamoille County is 0.46.
How Large is the Labor Force in Lamoille County?
There are 14,516 People in the Labor Forcein in Lamoille County.
What is the Percentage of People in the Labor Force in Lamoille County?
67.7% of People are in the Labor Force in Lamoille County.
What is the Unemployment Rate in Lamoille County?
Unemployment Rate in Lamoille County is 3.9%.