Essex County, VT
Essex County Map
Essex County Overview
5,976
TOTAL POPULATION
3,024
MALE POPULATION
2,952
FEMALE POPULATION
102.44
MALES / 100 FEMALES
97.62
FEMALES / 100 MALES
51.6
MEDIAN AGE
2.7
AVG FAMILY SIZE
2.2
AVG HOUSEHOLD SIZE
$31,891
PER CAPITA INCOME
$65,481
AVG FAMILY INCOME
$55,247
AVG HOUSEHOLD INCOME
25.2%
WAGE / INCOME GAP [ % ]
74.8¢/ $1
WAGE / INCOME GAP [ $ ]
$10,154
FAMILY INCOME DEFICIT
0.44
INEQUALITY / GINI INDEX
2,782
LABOR FORCE [ PEOPLE ]
54.9%
PERCENT IN LABOR FORCE
5.4%
UNEMPLOYMENT RATE
Essex County Area Codes
Race in Essex County
The most populous races in Essex County are White / Caucasian (5,682 | 95.1%), Two or more Races (209 | 3.5%), and Hispanic or Latino (92 | 1.5%).
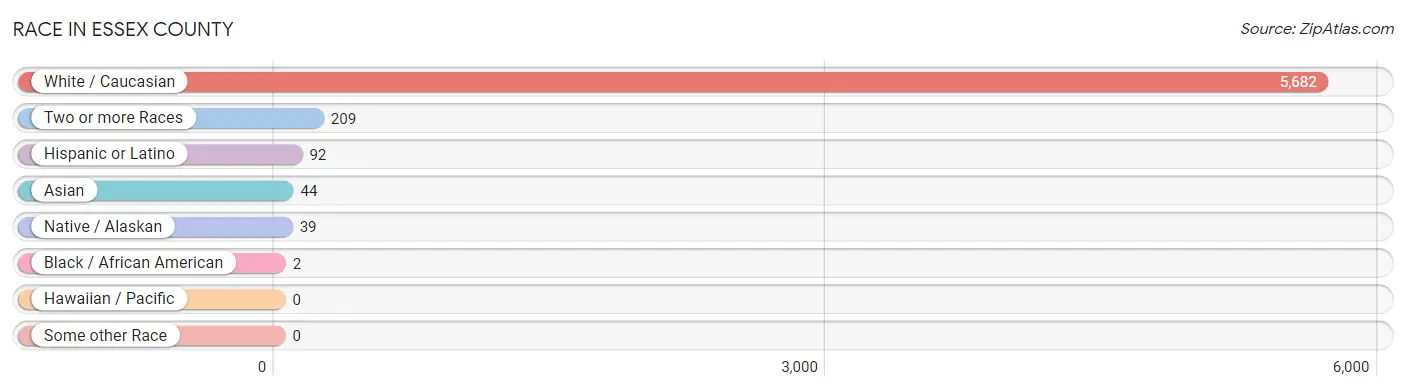
| Race | # Population | % Population |
| Asian | 44 | 0.7% |
| Black / African American | 2 | 0.0% |
| Hawaiian / Pacific | 0 | 0.0% |
| Hispanic or Latino | 92 | 1.5% |
| Native / Alaskan | 39 | 0.6% |
| White / Caucasian | 5,682 | 95.1% |
| Two or more Races | 209 | 3.5% |
| Some other Race | 0 | 0.0% |
| Total | 5,976 | 100.0% |
Ancestry in Essex County
The most populous ancestries reported in Essex County are English (1,090 | 18.2%), Irish (982 | 16.4%), French (880 | 14.7%), French Canadian (738 | 12.3%), and American (363 | 6.1%), together accounting for 67.8% of all Essex County residents.
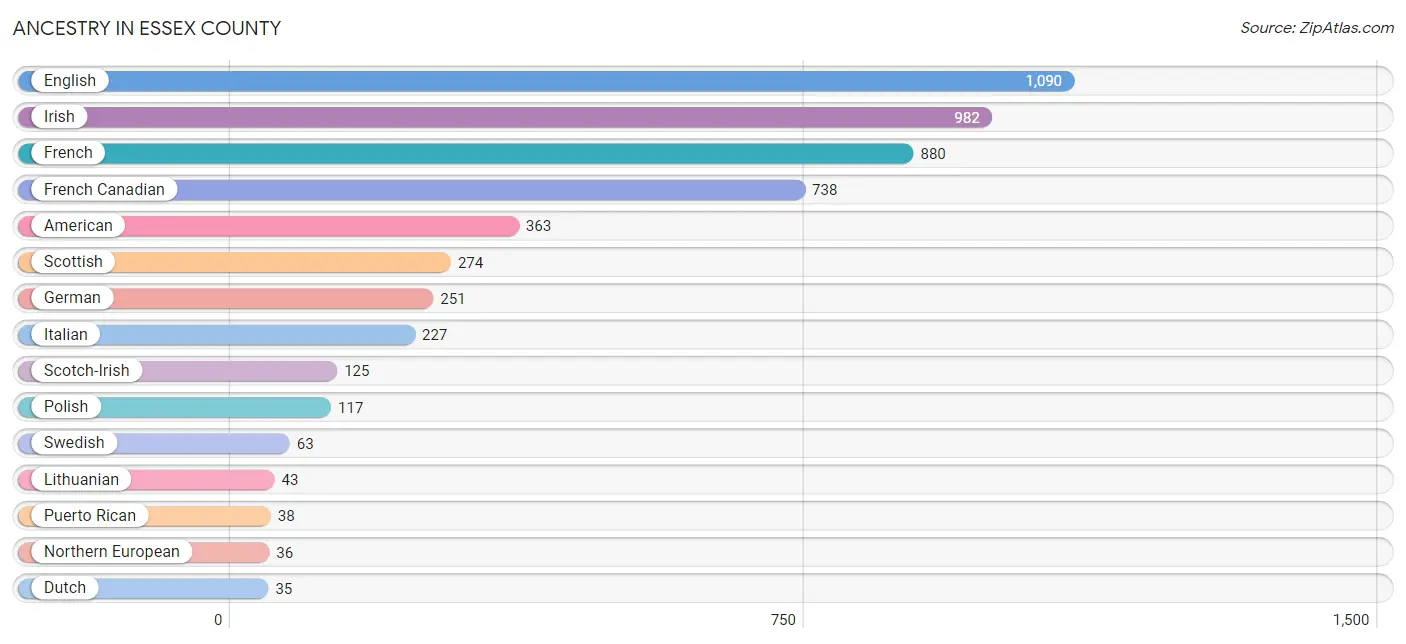
| Ancestry | # Population | % Population |
| Alaska Native | 9 | 0.2% |
| Albanian | 4 | 0.1% |
| American | 363 | 6.1% |
| Argentinean | 13 | 0.2% |
| Armenian | 3 | 0.1% |
| Austrian | 9 | 0.2% |
| Bhutanese | 1 | 0.0% |
| Blackfeet | 16 | 0.3% |
| British | 18 | 0.3% |
| Burmese | 10 | 0.2% |
| Canadian | 21 | 0.4% |
| Central American | 7 | 0.1% |
| Cuban | 18 | 0.3% |
| Czech | 20 | 0.3% |
| Danish | 14 | 0.2% |
| Delaware | 2 | 0.0% |
| Dutch | 35 | 0.6% |
| Eastern European | 6 | 0.1% |
| English | 1,090 | 18.2% |
| European | 10 | 0.2% |
| Filipino | 1 | 0.0% |
| Finnish | 15 | 0.3% |
| French | 880 | 14.7% |
| French American Indian | 20 | 0.3% |
| French Canadian | 738 | 12.3% |
| German | 251 | 4.2% |
| Greek | 1 | 0.0% |
| Guatemalan | 3 | 0.1% |
| Hungarian | 31 | 0.5% |
| Indian (Asian) | 24 | 0.4% |
| Irish | 982 | 16.4% |
| Italian | 227 | 3.8% |
| Korean | 4 | 0.1% |
| Lithuanian | 43 | 0.7% |
| Malaysian | 3 | 0.1% |
| Mexican | 13 | 0.2% |
| Nicaraguan | 4 | 0.1% |
| Northern European | 36 | 0.6% |
| Norwegian | 12 | 0.2% |
| Pakistani | 7 | 0.1% |
| Polish | 117 | 2.0% |
| Portuguese | 34 | 0.6% |
| Puerto Rican | 38 | 0.6% |
| Russian | 22 | 0.4% |
| Scandinavian | 13 | 0.2% |
| Scotch-Irish | 125 | 2.1% |
| Scottish | 274 | 4.6% |
| Shoshone | 2 | 0.0% |
| Slavic | 21 | 0.4% |
| Slovak | 1 | 0.0% |
| Slovene | 1 | 0.0% |
| South American | 13 | 0.2% |
| Sri Lankan | 2 | 0.0% |
| Swedish | 63 | 1.1% |
| Swiss | 14 | 0.2% |
| Thai | 3 | 0.1% |
| Ukrainian | 7 | 0.1% |
| Welsh | 20 | 0.3% | View All 58 Rows |
Immigrants in Essex County
The most numerous immigrant groups reported in Essex County came from Canada (137 | 2.3%), Asia (21 | 0.4%), Eastern Asia (11 | 0.2%), China (10 | 0.2%), and Europe (9 | 0.2%), together accounting for 3.1% of all Essex County residents.
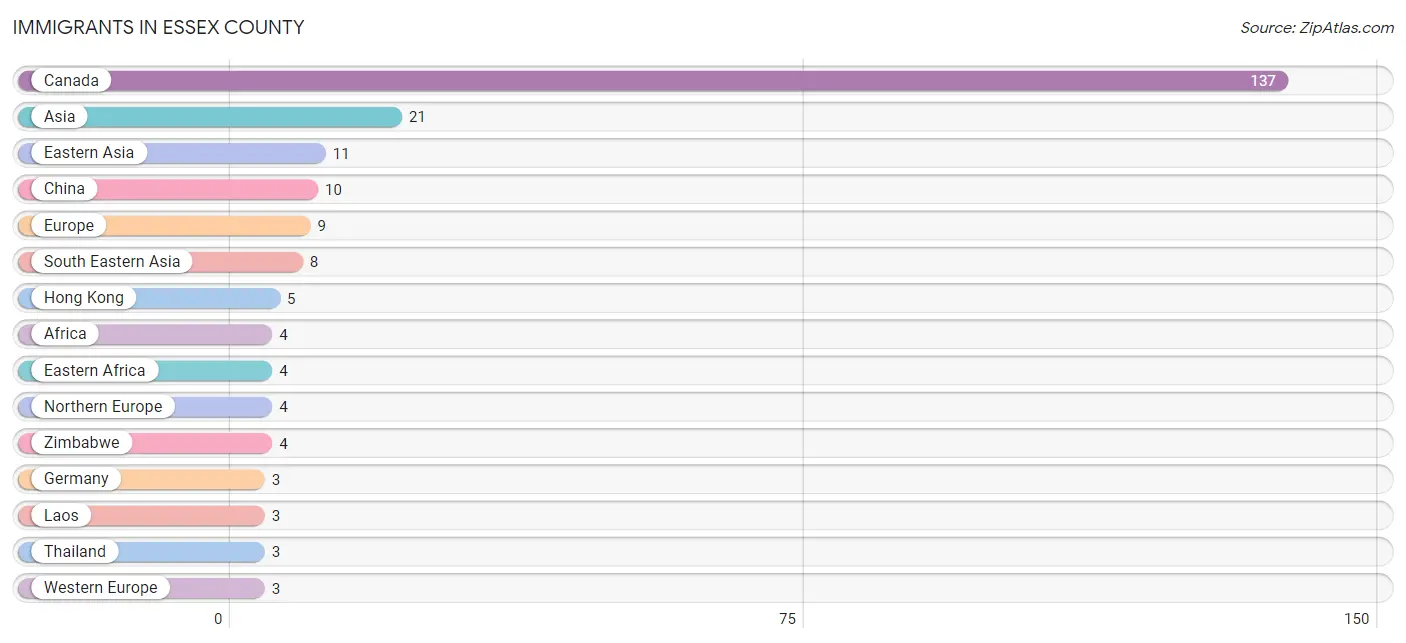
| Immigration Origin | # Population | % Population |
| Africa | 4 | 0.1% |
| Asia | 21 | 0.4% |
| Australia | 2 | 0.0% |
| Canada | 137 | 2.3% |
| China | 10 | 0.2% |
| Eastern Africa | 4 | 0.1% |
| Eastern Asia | 11 | 0.2% |
| Eastern Europe | 2 | 0.0% |
| Europe | 9 | 0.2% |
| Germany | 3 | 0.1% |
| Hong Kong | 5 | 0.1% |
| India | 2 | 0.0% |
| Japan | 1 | 0.0% |
| Laos | 3 | 0.1% |
| Northern Europe | 4 | 0.1% |
| Oceania | 2 | 0.0% |
| Poland | 2 | 0.0% |
| South Central Asia | 2 | 0.0% |
| South Eastern Asia | 8 | 0.1% |
| Taiwan | 1 | 0.0% |
| Thailand | 3 | 0.1% |
| Vietnam | 2 | 0.0% |
| Western Europe | 3 | 0.1% |
| Zimbabwe | 4 | 0.1% | View All 24 Rows |
Sex and Age in Essex County
Sex and Age in Essex County
The most populous age groups in Essex County are 60 to 64 Years (310 | 10.2%) for men and 60 to 64 Years (277 | 9.4%) for women.
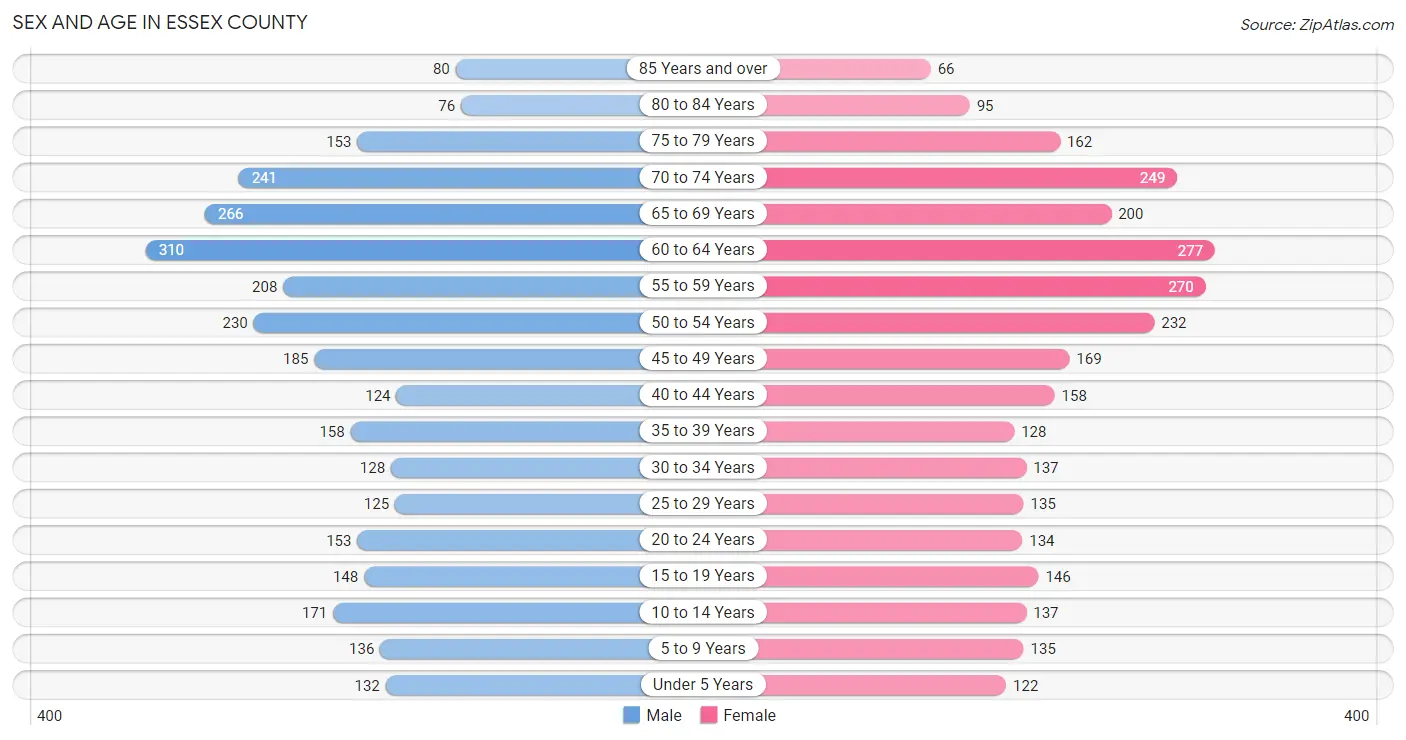
| Age Bracket | Male | Female |
| Under 5 Years | 132 (4.4%) | 122 (4.1%) |
| 5 to 9 Years | 136 (4.5%) | 135 (4.6%) |
| 10 to 14 Years | 171 (5.7%) | 137 (4.6%) |
| 15 to 19 Years | 148 (4.9%) | 146 (5.0%) |
| 20 to 24 Years | 153 (5.1%) | 134 (4.5%) |
| 25 to 29 Years | 125 (4.1%) | 135 (4.6%) |
| 30 to 34 Years | 128 (4.2%) | 137 (4.6%) |
| 35 to 39 Years | 158 (5.2%) | 128 (4.3%) |
| 40 to 44 Years | 124 (4.1%) | 158 (5.3%) |
| 45 to 49 Years | 185 (6.1%) | 169 (5.7%) |
| 50 to 54 Years | 230 (7.6%) | 232 (7.9%) |
| 55 to 59 Years | 208 (6.9%) | 270 (9.1%) |
| 60 to 64 Years | 310 (10.2%) | 277 (9.4%) |
| 65 to 69 Years | 266 (8.8%) | 200 (6.8%) |
| 70 to 74 Years | 241 (8.0%) | 249 (8.4%) |
| 75 to 79 Years | 153 (5.1%) | 162 (5.5%) |
| 80 to 84 Years | 76 (2.5%) | 95 (3.2%) |
| 85 Years and over | 80 (2.6%) | 66 (2.2%) |
| Total | 3,024 (100.0%) | 2,952 (100.0%) |
Families and Households in Essex County
Median Family Size in Essex County
The median family size in Essex County is 2.73 persons per family, with single female/mother families (256 | 15.5%) accounting for the largest median family size of 3.17 persons per family. On the other hand, single male/father families (115 | 7.0%) represent the smallest median family size with 2.47 persons per family.
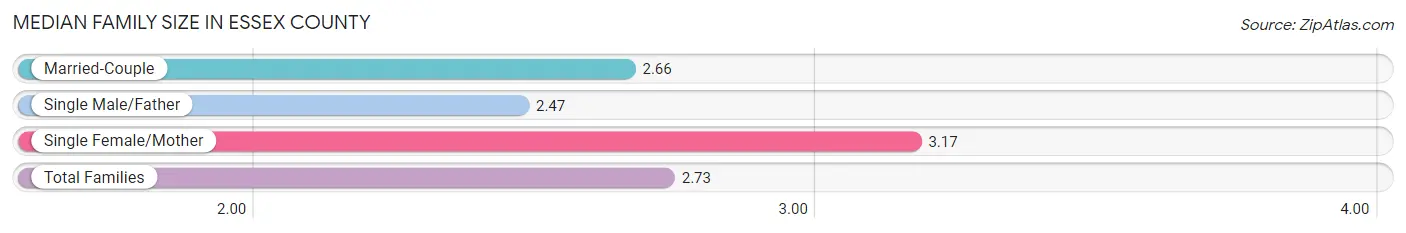
| Family Type | # Families | Family Size |
| Married-Couple | 1,282 (77.6%) | 2.66 |
| Single Male/Father | 115 (7.0%) | 2.47 |
| Single Female/Mother | 256 (15.5%) | 3.17 |
| Total Families | 1,653 (100.0%) | 2.73 |
Median Household Size in Essex County
The median household size in Essex County is 2.23 persons per household, with single female/mother households (256 | 9.6%) accounting for the largest median household size of 3.72 persons per household. non-family households (1,014 | 38.0%) represent the smallest median household size with 1.20 persons per household.
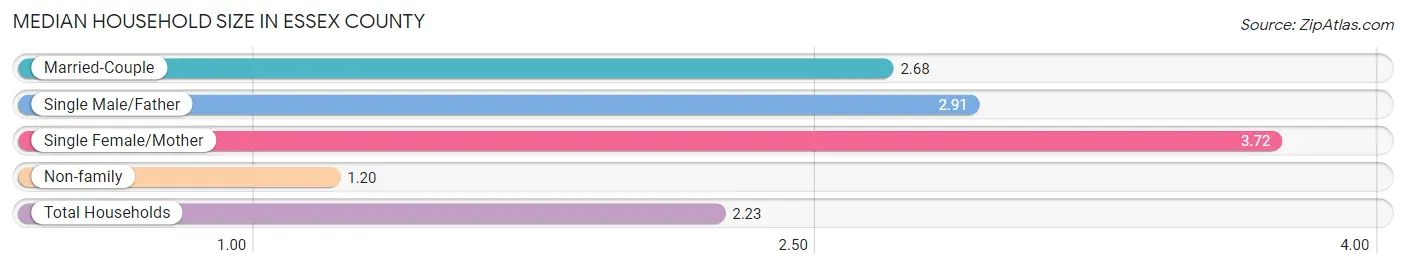
| Household Type | # Households | Household Size |
| Married-Couple | 1,282 (48.1%) | 2.68 |
| Single Male/Father | 115 (4.3%) | 2.91 |
| Single Female/Mother | 256 (9.6%) | 3.72 |
| Non-family | 1,014 (38.0%) | 1.20 |
| Total Households | 2,667 (100.0%) | 2.23 |
Household Size by Marriage Status in Essex County
Out of a total of 2,667 households in Essex County, 1,653 (62.0%) are family households, while 1,014 (38.0%) are nonfamily households. The most numerous type of family households are 2-person households, comprising 972, and the most common type of nonfamily households are 1-person households, comprising 837.
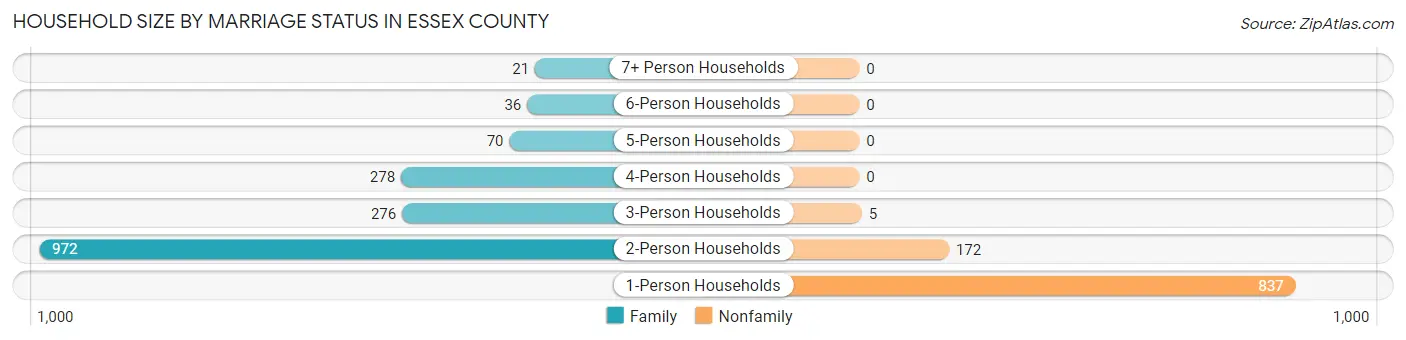
| Household Size | Family Households | Nonfamily Households |
| 1-Person Households | - | 837 (31.4%) |
| 2-Person Households | 972 (36.4%) | 172 (6.5%) |
| 3-Person Households | 276 (10.3%) | 5 (0.2%) |
| 4-Person Households | 278 (10.4%) | 0 (0.0%) |
| 5-Person Households | 70 (2.6%) | 0 (0.0%) |
| 6-Person Households | 36 (1.3%) | 0 (0.0%) |
| 7+ Person Households | 21 (0.8%) | 0 (0.0%) |
| Total | 1,653 (62.0%) | 1,014 (38.0%) |
Female Fertility in Essex County
Fertility by Age in Essex County
Average fertility rate in Essex County is 31.0 births per 1,000 women. Women in the age bracket of 20 to 34 years have the highest fertility rate with 81.0 births per 1,000 women. Women in the age bracket of 20 to 34 years acount for 100.0% of all women with births.
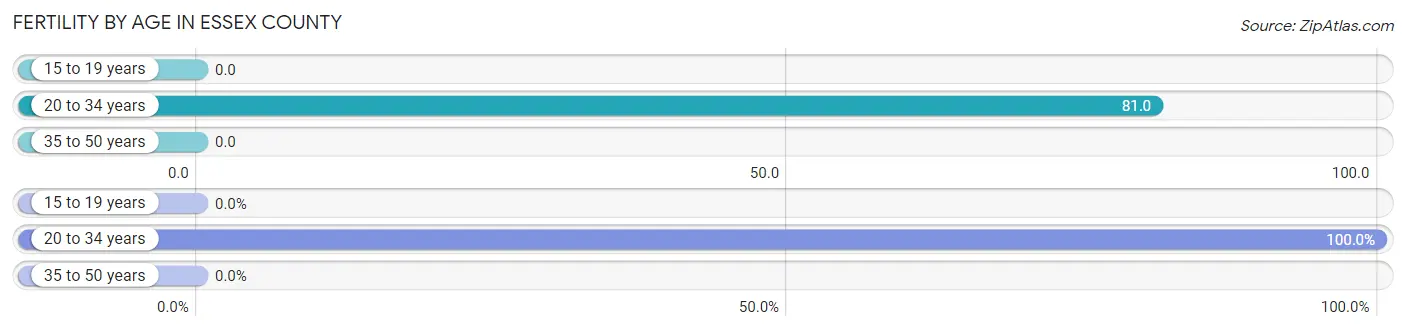
| Age Bracket | Women with Births | Births / 1,000 Women |
| 15 to 19 years | 0 (0.0%) | 0.0 |
| 20 to 34 years | 33 (100.0%) | 81.0 |
| 35 to 50 years | 0 (0.0%) | 0.0 |
| Total | 33 (100.0%) | 31.0 |
Fertility by Age by Marriage Status in Essex County
90.9% of women with births (33) in Essex County are married. The highest percentage of unmarried women with births falls into 20 to 34 years age bracket with 9.1% of them unmarried at the time of birth, while the lowest percentage of unmarried women with births belong to 20 to 34 years age bracket with 9.1% of them unmarried.
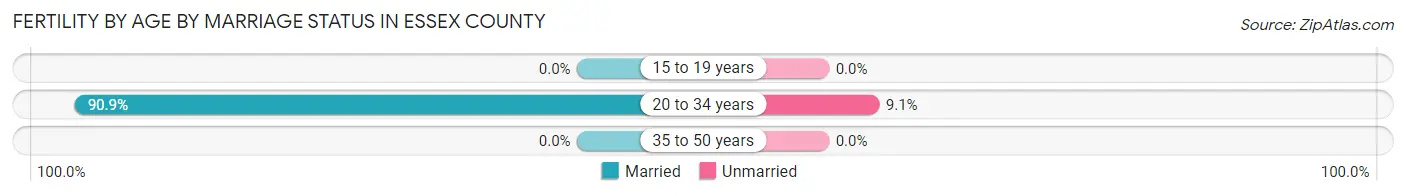
| Age Bracket | Married | Unmarried |
| 15 to 19 years | 0 (0.0%) | 0 (0.0%) |
| 20 to 34 years | 30 (90.9%) | 3 (9.1%) |
| 35 to 50 years | 0 (0.0%) | 0 (0.0%) |
| Total | 30 (90.9%) | 3 (9.1%) |
Fertility by Education in Essex County
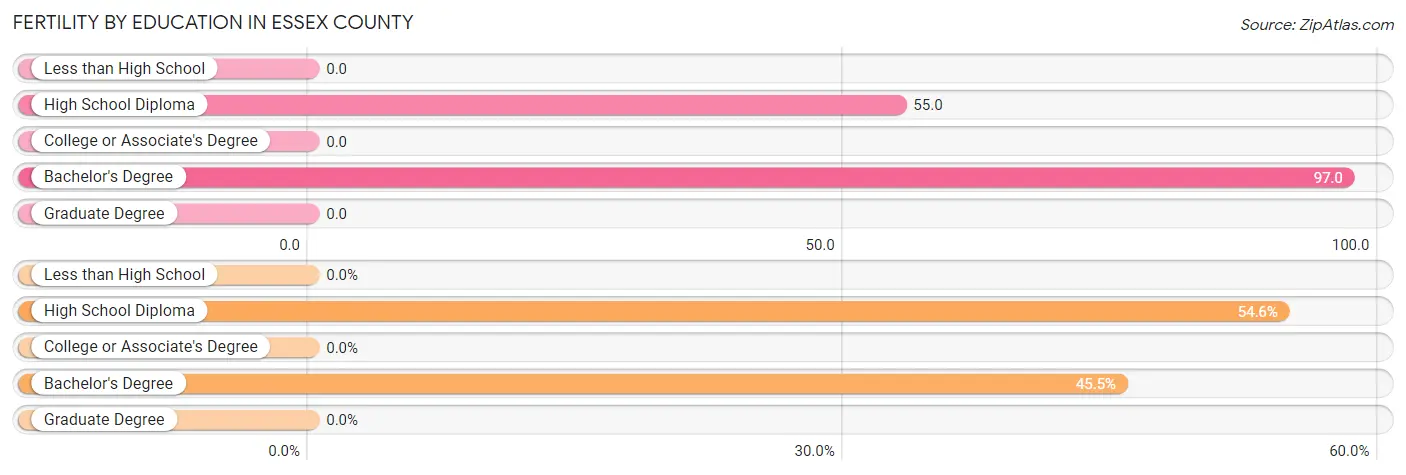
| Educational Attainment | Women with Births | Births / 1,000 Women |
| Less than High School | 0 (0.0%) | 0.0 |
| High School Diploma | 18 (54.5%) | 55.0 |
| College or Associate's Degree | 0 (0.0%) | 0.0 |
| Bachelor's Degree | 15 (45.5%) | 97.0 |
| Graduate Degree | 0 (0.0%) | 0.0 |
| Total | 33 (100.0%) | 31.0 |
Fertility by Education by Marriage Status in Essex County
9.1% of women with births in Essex County are unmarried. Women with the educational attainment of bachelor's degree are most likely to be married with 100.0% of them married at childbirth, while women with the educational attainment of high school diploma are least likely to be married with 16.7% of them unmarried at childbirth.
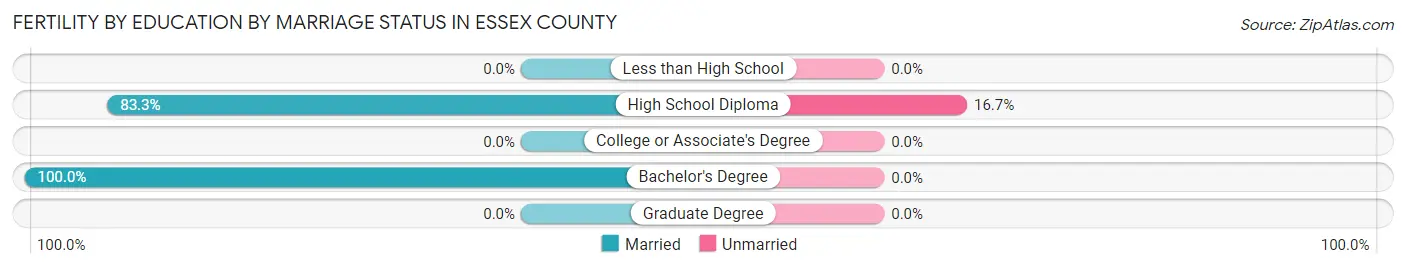
| Educational Attainment | Married | Unmarried |
| Less than High School | 0 (0.0%) | 0 (0.0%) |
| High School Diploma | 15 (83.3%) | 3 (16.7%) |
| College or Associate's Degree | 0 (0.0%) | 0 (0.0%) |
| Bachelor's Degree | 15 (100.0%) | 0 (0.0%) |
| Graduate Degree | 0 (0.0%) | 0 (0.0%) |
| Total | 30 (90.9%) | 3 (9.1%) |
Income in Essex County
Income Overview in Essex County
Per Capita Income in Essex County is $31,891, while median incomes of families and households are $65,481 and $55,247 respectively.
| Characteristic | Number | Measure |
| Per Capita Income | 5,976 | $31,891 |
| Median Family Income | 1,653 | $65,481 |
| Mean Family Income | 1,653 | $80,661 |
| Median Household Income | 2,667 | $55,247 |
| Mean Household Income | 2,667 | $71,462 |
| Income Deficit | 1,653 | $10,154 |
| Wage / Income Gap (%) | 5,976 | 25.23% |
| Wage / Income Gap ($) | 5,976 | 74.77¢ per $1 |
| Gini / Inequality Index | 5,976 | 0.44 |
Earnings by Sex in Essex County
Average Earnings in Essex County are $33,308, $37,323 for men and $27,907 for women, a difference of 25.2%.
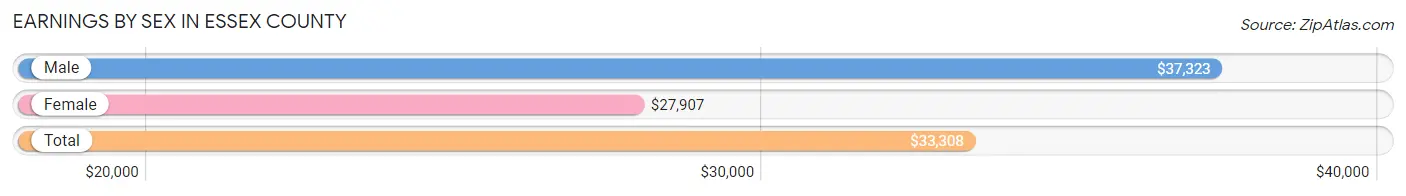
| Sex | Number | Average Earnings |
| Male | 1,472 (49.7%) | $37,323 |
| Female | 1,489 (50.3%) | $27,907 |
| Total | 2,961 (100.0%) | $33,308 |
Earnings by Sex by Income Bracket in Essex County
The most common earnings brackets in Essex County are $65,000 to $74,999 for men (139 | 9.4%) and $25,000 to $29,999 for women (170 | 11.4%).
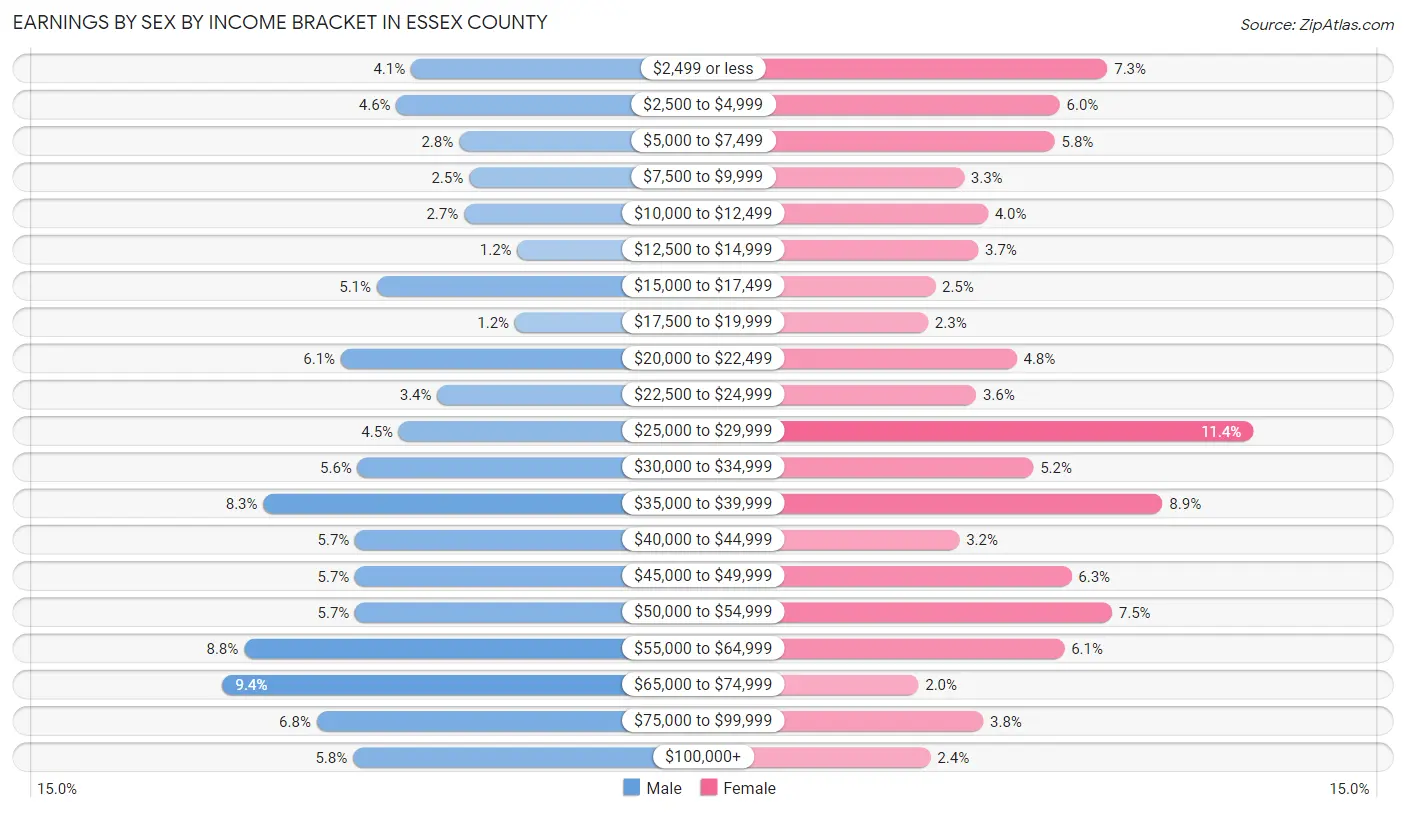
| Income | Male | Female |
| $2,499 or less | 61 (4.1%) | 109 (7.3%) |
| $2,500 to $4,999 | 67 (4.5%) | 89 (6.0%) |
| $5,000 to $7,499 | 41 (2.8%) | 87 (5.8%) |
| $7,500 to $9,999 | 37 (2.5%) | 49 (3.3%) |
| $10,000 to $12,499 | 39 (2.6%) | 59 (4.0%) |
| $12,500 to $14,999 | 17 (1.1%) | 55 (3.7%) |
| $15,000 to $17,499 | 75 (5.1%) | 37 (2.5%) |
| $17,500 to $19,999 | 18 (1.2%) | 34 (2.3%) |
| $20,000 to $22,499 | 90 (6.1%) | 71 (4.8%) |
| $22,500 to $24,999 | 50 (3.4%) | 54 (3.6%) |
| $25,000 to $29,999 | 66 (4.5%) | 170 (11.4%) |
| $30,000 to $34,999 | 83 (5.6%) | 78 (5.2%) |
| $35,000 to $39,999 | 122 (8.3%) | 132 (8.9%) |
| $40,000 to $44,999 | 84 (5.7%) | 47 (3.2%) |
| $45,000 to $49,999 | 84 (5.7%) | 94 (6.3%) |
| $50,000 to $54,999 | 84 (5.7%) | 111 (7.4%) |
| $55,000 to $64,999 | 130 (8.8%) | 91 (6.1%) |
| $65,000 to $74,999 | 139 (9.4%) | 30 (2.0%) |
| $75,000 to $99,999 | 100 (6.8%) | 57 (3.8%) |
| $100,000+ | 85 (5.8%) | 35 (2.4%) |
| Total | 1,472 (100.0%) | 1,489 (100.0%) |
Earnings by Sex by Educational Attainment in Essex County
Average earnings in Essex County are $40,650 for men and $30,000 for women, a difference of 26.2%. Men with an educational attainment of graduate degree enjoy the highest average annual earnings of $63,125, while those with less than high school education earn the least with $33,750. Women with an educational attainment of bachelor's degree earn the most with the average annual earnings of $42,500, while those with less than high school education have the smallest earnings of $28,333.
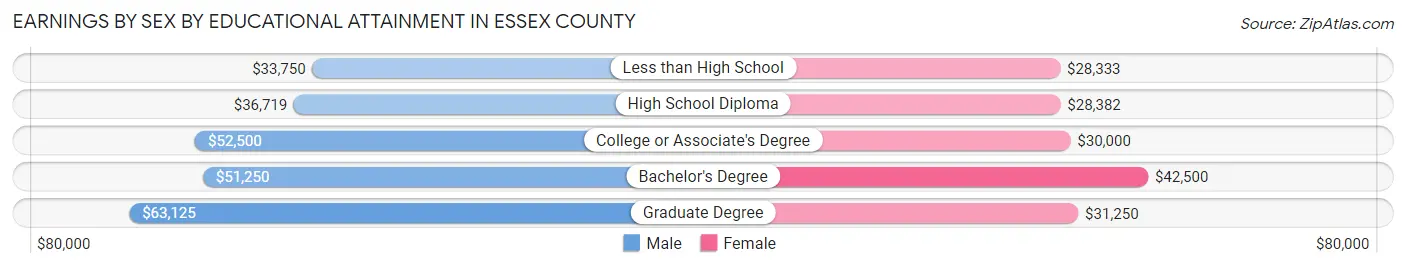
| Educational Attainment | Male Income | Female Income |
| Less than High School | $33,750 | $28,333 |
| High School Diploma | $36,719 | $28,382 |
| College or Associate's Degree | $52,500 | $30,000 |
| Bachelor's Degree | $51,250 | $42,500 |
| Graduate Degree | $63,125 | $31,250 |
| Total | $40,650 | $30,000 |
Family Income in Essex County
Family Income Brackets in Essex County
According to the Essex County family income data, there are 403 families falling into the $50,000 to $74,999 income range, which is the most common income bracket and makes up 24.4% of all families. Conversely, the less than $10,000 income bracket is the least frequent group with only 45 families (2.7%) belonging to this category.
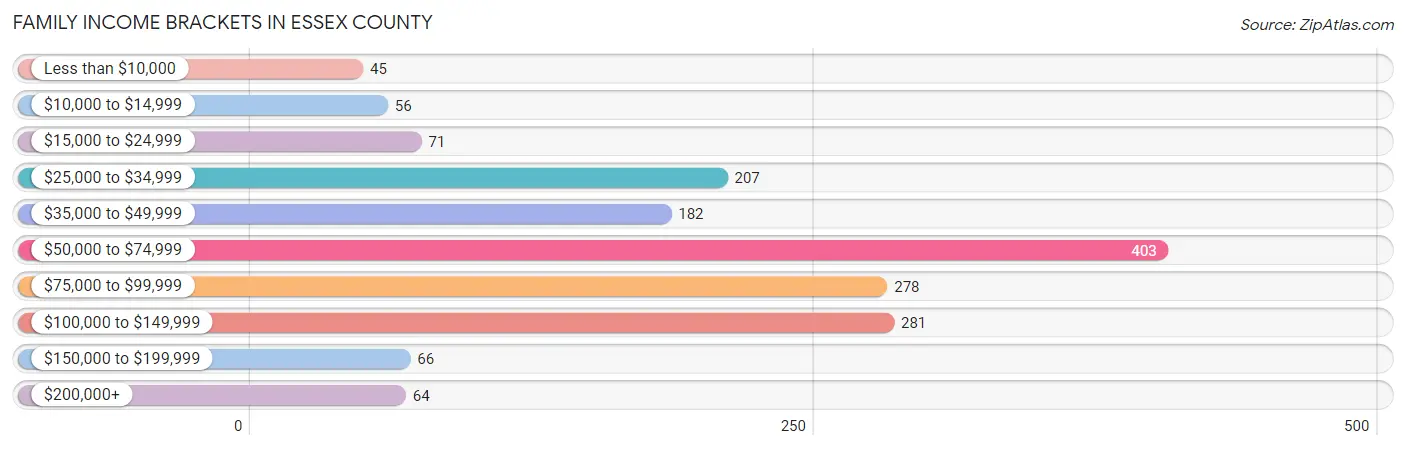
| Income Bracket | # Families | % Families |
| Less than $10,000 | 45 | 2.7% |
| $10,000 to $14,999 | 56 | 3.4% |
| $15,000 to $24,999 | 71 | 4.3% |
| $25,000 to $34,999 | 207 | 12.5% |
| $35,000 to $49,999 | 182 | 11.0% |
| $50,000 to $74,999 | 403 | 24.4% |
| $75,000 to $99,999 | 278 | 16.8% |
| $100,000 to $149,999 | 281 | 17.0% |
| $150,000 to $199,999 | 66 | 4.0% |
| $200,000+ | 64 | 3.9% |
Family Income by Famaliy Size in Essex County
5-person families (40 | 2.4%) account for the highest median family income in Essex County with $91,786 per family, while 2-person families (1,003 | 60.7%) have the highest median income of $29,614 per family member.
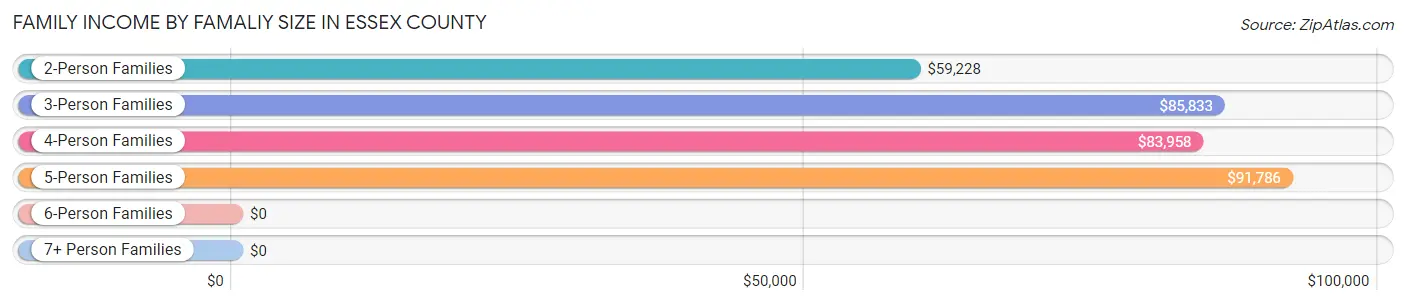
| Income Bracket | # Families | Median Income |
| 2-Person Families | 1,003 (60.7%) | $59,228 |
| 3-Person Families | 300 (18.1%) | $85,833 |
| 4-Person Families | 267 (16.2%) | $83,958 |
| 5-Person Families | 40 (2.4%) | $91,786 |
| 6-Person Families | 32 (1.9%) | $0 |
| 7+ Person Families | 11 (0.7%) | $0 |
| Total | 1,653 (100.0%) | $65,481 |
Family Income by Number of Earners in Essex County
The median family income in Essex County is $65,481, with families comprising 3+ earners (146) having the highest median family income of $137,500, while families with no earners (350) have the lowest median family income of $44,783, accounting for 8.8% and 21.2% of families, respectively.
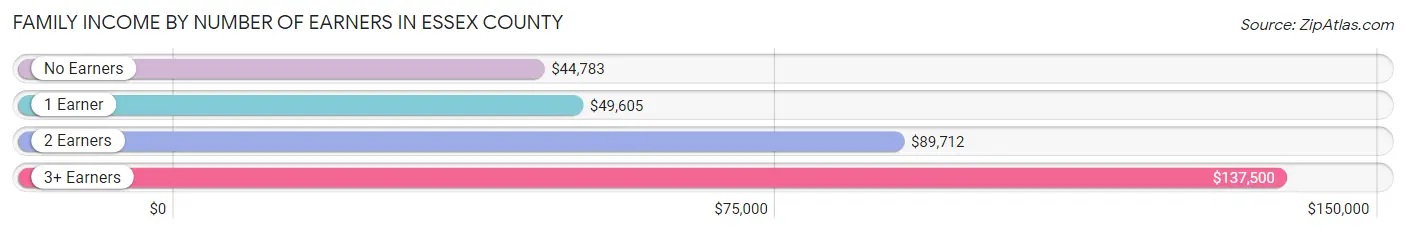
| Number of Earners | # Families | Median Income |
| No Earners | 350 (21.2%) | $44,783 |
| 1 Earner | 576 (34.8%) | $49,605 |
| 2 Earners | 581 (35.1%) | $89,712 |
| 3+ Earners | 146 (8.8%) | $137,500 |
| Total | 1,653 (100.0%) | $65,481 |
Household Income in Essex County
Household Income Brackets in Essex County
With 568 households falling in the category, the $50,000 to $74,999 income range is the most frequent in Essex County, accounting for 21.3% of all households. In contrast, only 83 households (3.1%) fall into the $200,000+ income bracket, making it the least populous group.
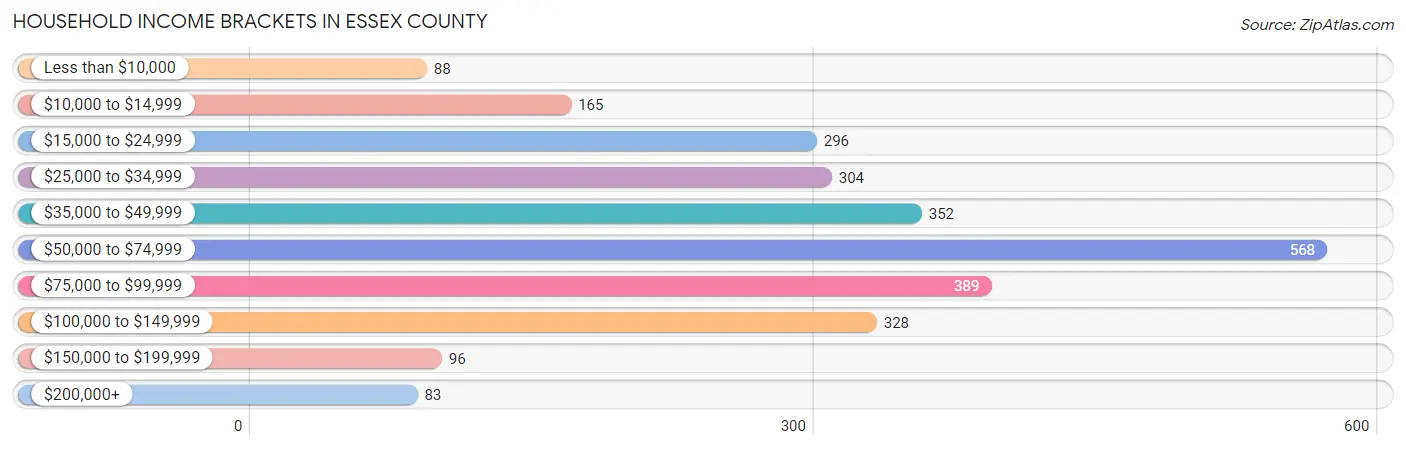
| Income Bracket | # Households | % Households |
| Less than $10,000 | 88 | 3.3% |
| $10,000 to $14,999 | 165 | 6.2% |
| $15,000 to $24,999 | 296 | 11.1% |
| $25,000 to $34,999 | 304 | 11.4% |
| $35,000 to $49,999 | 352 | 13.2% |
| $50,000 to $74,999 | 568 | 21.3% |
| $75,000 to $99,999 | 389 | 14.6% |
| $100,000 to $149,999 | 328 | 12.3% |
| $150,000 to $199,999 | 96 | 3.6% |
| $200,000+ | 83 | 3.1% |
Household Income by Householder Age in Essex County
The median household income in Essex County is $55,247, with the highest median household income of $63,781 found in the 45 to 64 years age bracket for the primary householder. A total of 1,079 households (40.5%) fall into this category. Meanwhile, the 15 to 24 years age bracket for the primary householder has the lowest median household income of $0, with 82 households (3.1%) in this group.
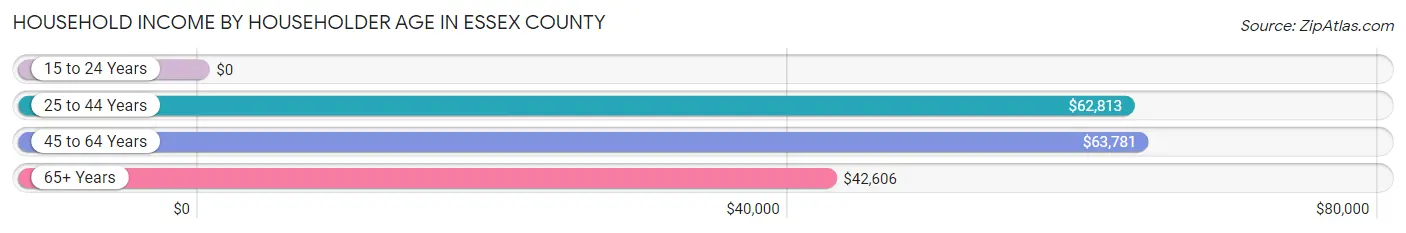
| Income Bracket | # Households | Median Income |
| 15 to 24 Years | 82 (3.1%) | $0 |
| 25 to 44 Years | 439 (16.5%) | $62,813 |
| 45 to 64 Years | 1,079 (40.5%) | $63,781 |
| 65+ Years | 1,067 (40.0%) | $42,606 |
| Total | 2,667 (100.0%) | $55,247 |
Poverty in Essex County
Income Below Poverty by Sex and Age in Essex County
With 10.1% poverty level for males and 16.4% for females among the residents of Essex County, 15 year old males and 15 year old females are the most vulnerable to poverty, with 9 males (27.3%) and 22 females (51.2%) in their respective age groups living below the poverty level.
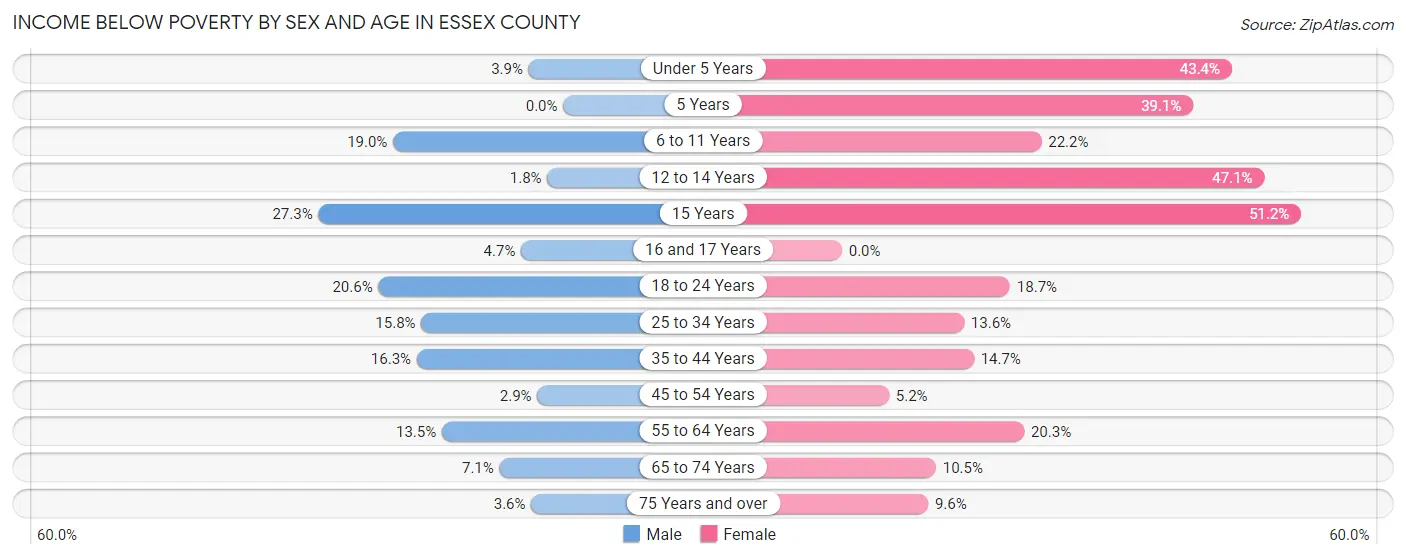
| Age Bracket | Male | Female |
| Under 5 Years | 5 (3.8%) | 53 (43.4%) |
| 5 Years | 0 (0.0%) | 9 (39.1%) |
| 6 to 11 Years | 29 (19.0%) | 36 (22.2%) |
| 12 to 14 Years | 2 (1.8%) | 40 (47.1%) |
| 15 Years | 9 (27.3%) | 22 (51.2%) |
| 16 and 17 Years | 3 (4.7%) | 0 (0.0%) |
| 18 to 24 Years | 42 (20.6%) | 35 (18.7%) |
| 25 to 34 Years | 40 (15.8%) | 37 (13.6%) |
| 35 to 44 Years | 46 (16.3%) | 42 (14.7%) |
| 45 to 54 Years | 12 (2.9%) | 21 (5.2%) |
| 55 to 64 Years | 70 (13.5%) | 111 (20.3%) |
| 65 to 74 Years | 36 (7.1%) | 47 (10.5%) |
| 75 Years and over | 11 (3.6%) | 31 (9.6%) |
| Total | 305 (10.1%) | 484 (16.4%) |
Income Above Poverty by Sex and Age in Essex County
According to the poverty statistics in Essex County, males aged 5 years and females aged 16 and 17 years are the age groups that are most secure financially, with 100.0% of males and 100.0% of females in these age groups living above the poverty line.
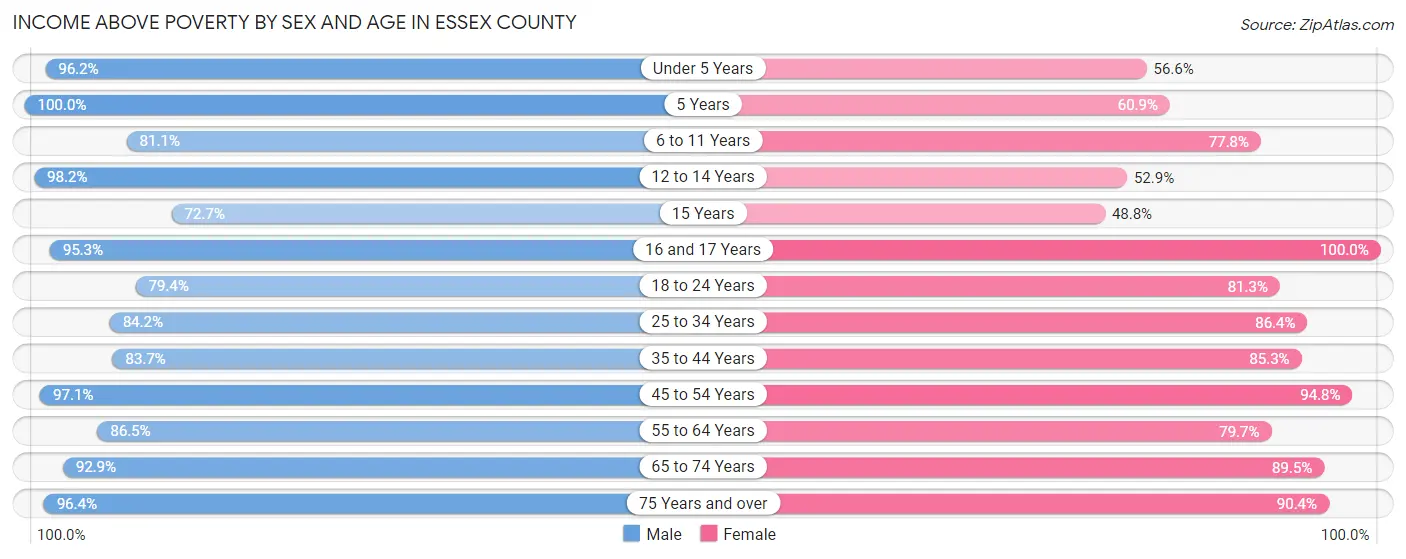
| Age Bracket | Male | Female |
| Under 5 Years | 125 (96.2%) | 69 (56.6%) |
| 5 Years | 32 (100.0%) | 14 (60.9%) |
| 6 to 11 Years | 124 (81.0%) | 126 (77.8%) |
| 12 to 14 Years | 111 (98.2%) | 45 (52.9%) |
| 15 Years | 24 (72.7%) | 21 (48.8%) |
| 16 and 17 Years | 61 (95.3%) | 50 (100.0%) |
| 18 to 24 Years | 162 (79.4%) | 152 (81.3%) |
| 25 to 34 Years | 213 (84.2%) | 235 (86.4%) |
| 35 to 44 Years | 236 (83.7%) | 244 (85.3%) |
| 45 to 54 Years | 403 (97.1%) | 380 (94.8%) |
| 55 to 64 Years | 448 (86.5%) | 436 (79.7%) |
| 65 to 74 Years | 471 (92.9%) | 402 (89.5%) |
| 75 Years and over | 298 (96.4%) | 292 (90.4%) |
| Total | 2,708 (89.9%) | 2,466 (83.6%) |
Income Below Poverty Among Married-Couple Families in Essex County
The poverty statistics for married-couple families in Essex County show that 7.4% or 95 of the total 1,282 families live below the poverty line. Families with 3 or 4 children have the highest poverty rate of 17.1%, comprising of 7 families. On the other hand, families with no children have the lowest poverty rate of 5.5%, which includes 54 families.
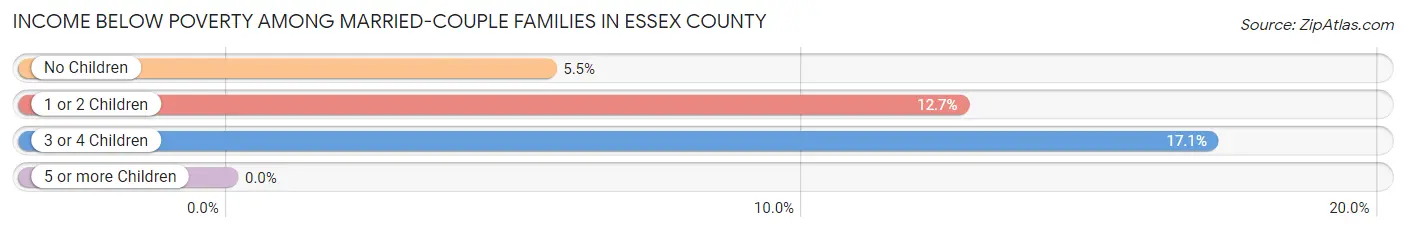
| Children | Above Poverty | Below Poverty |
| No Children | 920 (94.5%) | 54 (5.5%) |
| 1 or 2 Children | 233 (87.3%) | 34 (12.7%) |
| 3 or 4 Children | 34 (82.9%) | 7 (17.1%) |
| 5 or more Children | 0 (0.0%) | 0 (0.0%) |
| Total | 1,187 (92.6%) | 95 (7.4%) |
Income Below Poverty Among Single-Parent Households in Essex County
According to the poverty data in Essex County, 17.4% or 20 single-father households and 13.3% or 34 single-mother households are living below the poverty line. Among single-father households, those with 1 or 2 children have the highest poverty rate, with 20 households (27.0%) experiencing poverty. Likewise, among single-mother households, those with 5 or more children have the highest poverty rate, with 8 households (100.0%) falling below the poverty line.
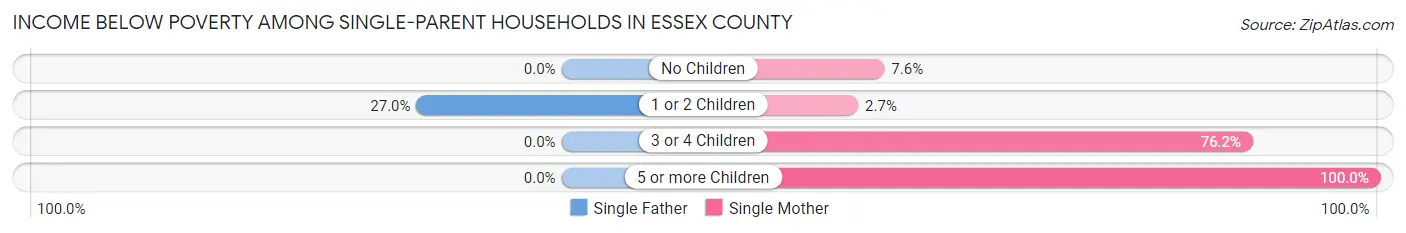
| Children | Single Father | Single Mother |
| No Children | 0 (0.0%) | 6 (7.6%) |
| 1 or 2 Children | 20 (27.0%) | 4 (2.7%) |
| 3 or 4 Children | 0 (0.0%) | 16 (76.2%) |
| 5 or more Children | 0 (0.0%) | 8 (100.0%) |
| Total | 20 (17.4%) | 34 (13.3%) |
Income Below Poverty Among Married-Couple vs Single-Parent Households in Essex County
The poverty data for Essex County shows that 95 of the married-couple family households (7.4%) and 54 of the single-parent households (14.6%) are living below the poverty level. Within the married-couple family households, those with 3 or 4 children have the highest poverty rate, with 7 households (17.1%) falling below the poverty line. Among the single-parent households, those with 5 or more children have the highest poverty rate, with 8 household (100.0%) living below poverty.
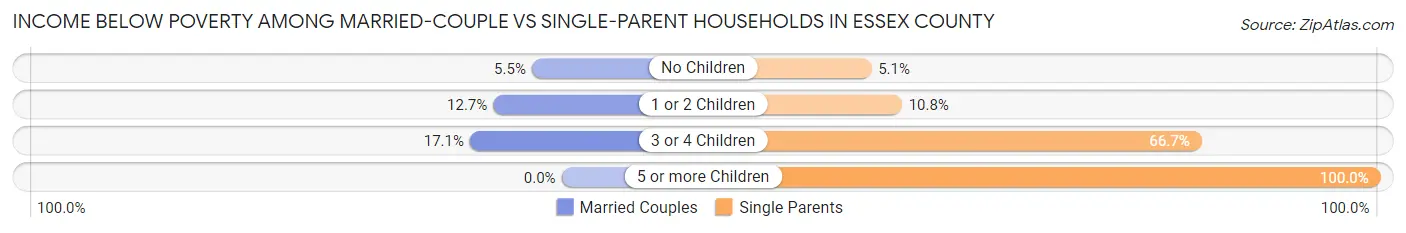
| Children | Married-Couple Families | Single-Parent Households |
| No Children | 54 (5.5%) | 6 (5.1%) |
| 1 or 2 Children | 34 (12.7%) | 24 (10.8%) |
| 3 or 4 Children | 7 (17.1%) | 16 (66.7%) |
| 5 or more Children | 0 (0.0%) | 8 (100.0%) |
| Total | 95 (7.4%) | 54 (14.6%) |
Employment Characteristics in Essex County
Employment by Class of Employer in Essex County
Among the 2,566 employed individuals in Essex County, private company employees (1,403 | 54.7%), local government employees (308 | 12.0%), and not-for-profit organizations (294 | 11.5%) make up the most common classes of employment.
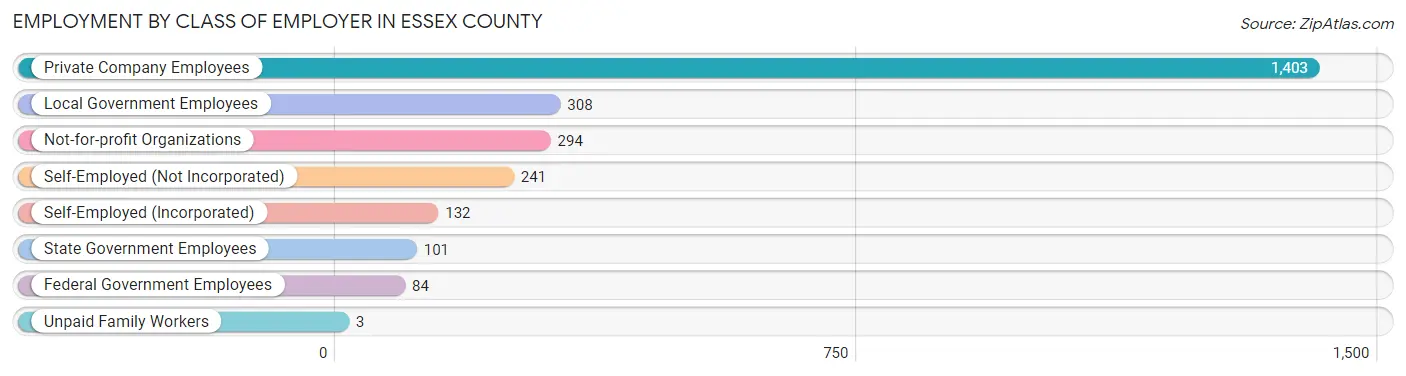
| Employer Class | # Employees | % Employees |
| Private Company Employees | 1,403 | 54.7% |
| Self-Employed (Incorporated) | 132 | 5.1% |
| Self-Employed (Not Incorporated) | 241 | 9.4% |
| Not-for-profit Organizations | 294 | 11.5% |
| Local Government Employees | 308 | 12.0% |
| State Government Employees | 101 | 3.9% |
| Federal Government Employees | 84 | 3.3% |
| Unpaid Family Workers | 3 | 0.1% |
| Total | 2,566 | 100.0% |
Employment Status by Age in Essex County
According to the labor force statistics for Essex County, out of the total population over 16 years of age (5,067), 54.9% or 2,782 individuals are in the labor force, with 5.4% or 150 of them unemployed. The age group with the highest labor force participation rate is 20 to 24 years, with 81.2% or 233 individuals in the labor force. Within the labor force, the 25 to 29 years age range has the highest percentage of unemployed individuals, with 19.7% or 41 of them being unemployed.
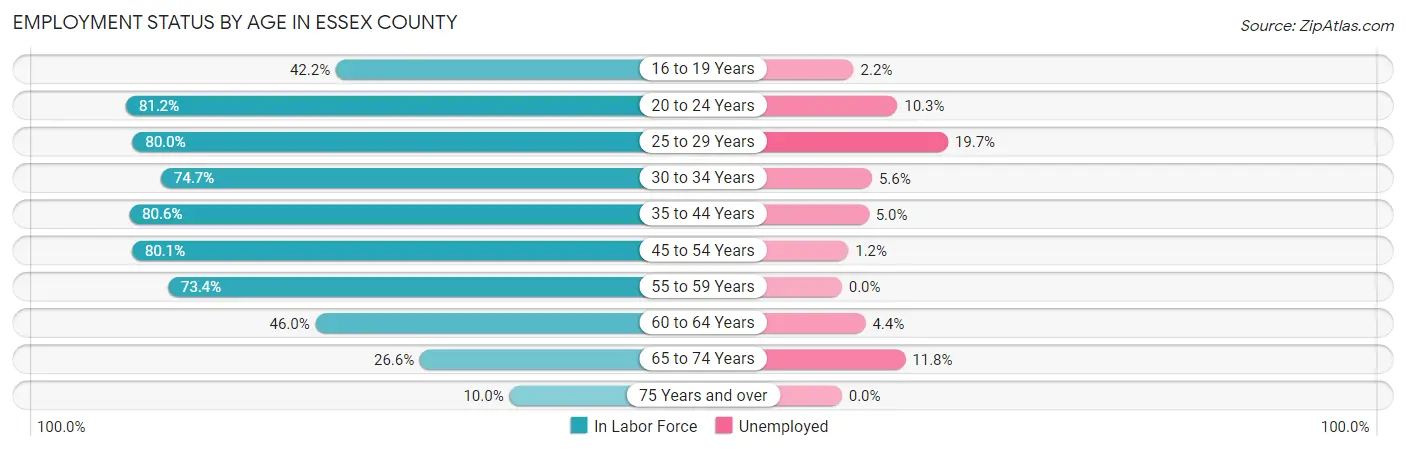
| Age Bracket | In Labor Force | Unemployed |
| 16 to 19 Years | 92 (42.2%) | 2 (2.2%) |
| 20 to 24 Years | 233 (81.2%) | 24 (10.3%) |
| 25 to 29 Years | 208 (80.0%) | 41 (19.7%) |
| 30 to 34 Years | 198 (74.7%) | 11 (5.6%) |
| 35 to 44 Years | 458 (80.6%) | 23 (5.0%) |
| 45 to 54 Years | 654 (80.1%) | 8 (1.2%) |
| 55 to 59 Years | 351 (73.4%) | 0 (0.0%) |
| 60 to 64 Years | 270 (46.0%) | 12 (4.4%) |
| 65 to 74 Years | 254 (26.6%) | 30 (11.8%) |
| 75 Years and over | 63 (10.0%) | 0 (0.0%) |
| Total | 2,782 (54.9%) | 150 (5.4%) |
Employment Status by Educational Attainment in Essex County
According to labor force statistics for Essex County, 71.9% of individuals (2,138) out of the total population between 25 and 64 years of age (2,974) are in the labor force, with 4.4% or 94 of them being unemployed. The group with the highest labor force participation rate are those with the educational attainment of bachelor's degree or higher, with 87.3% or 557 individuals in the labor force. Within the labor force, individuals with less than high school education have the highest percentage of unemployment, with 32.9% or 49 of them being unemployed.
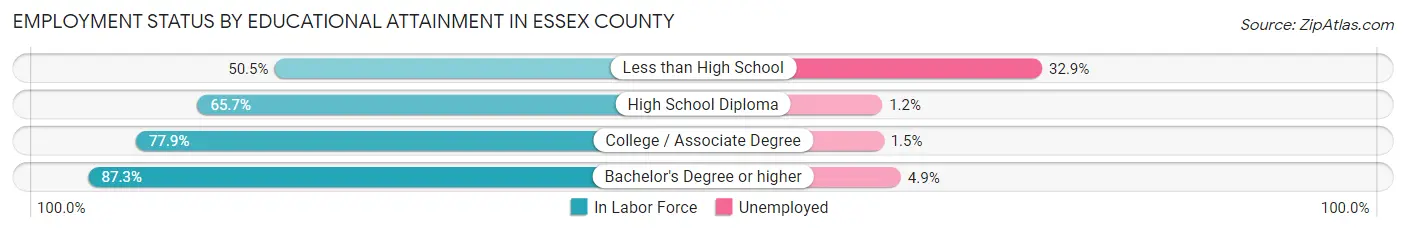
| Educational Attainment | In Labor Force | Unemployed |
| Less than High School | 149 (50.5%) | 97 (32.9%) |
| High School Diploma | 848 (65.7%) | 15 (1.2%) |
| College / Associate Degree | 585 (77.9%) | 11 (1.5%) |
| Bachelor's Degree or higher | 557 (87.3%) | 31 (4.9%) |
| Total | 2,138 (71.9%) | 131 (4.4%) |
Employment Occupations by Sex in Essex County
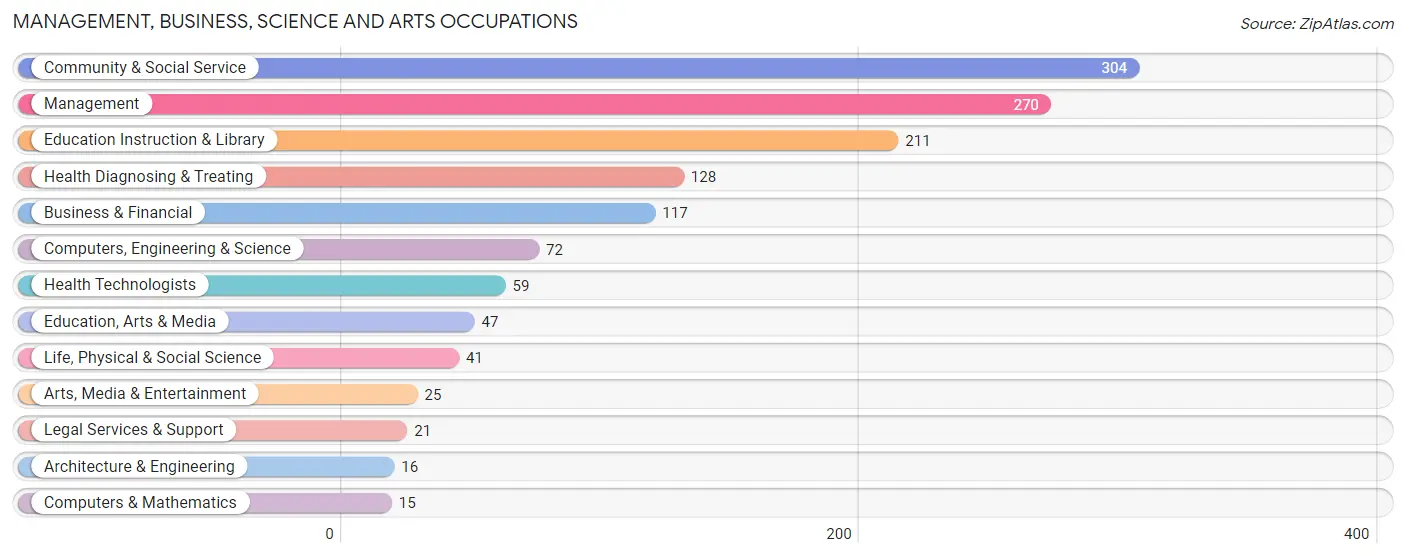
Management, Business, Science and Arts Occupations
The most common Management, Business, Science and Arts occupations in Essex County are Community & Social Service (304 | 11.6%), Management (270 | 10.3%), Education Instruction & Library (211 | 8.0%), Health Diagnosing & Treating (128 | 4.9%), and Business & Financial (117 | 4.4%).
Management, Business, Science and Arts Occupations by Sex
Within the Management, Business, Science and Arts occupations in Essex County, the most male-oriented occupations are Life, Physical & Social Science (70.7%), Computers, Engineering & Science (69.4%), and Architecture & Engineering (68.8%), while the most female-oriented occupations are Education, Arts & Media (87.2%), Health Technologists (81.4%), and Health Diagnosing & Treating (81.2%).
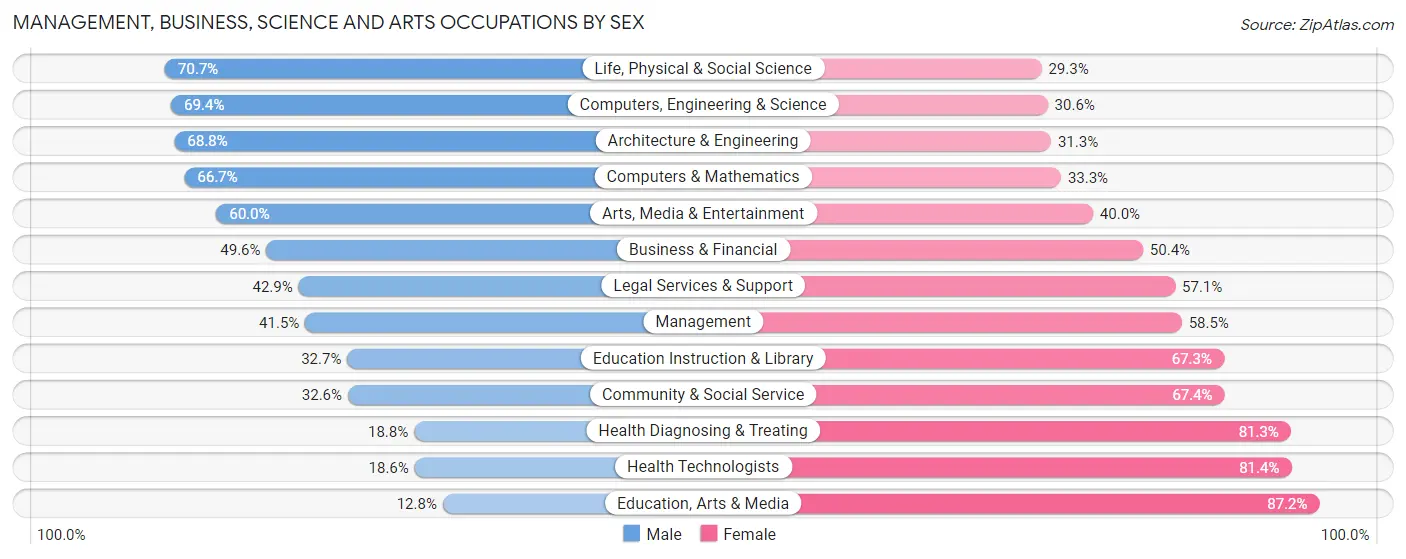
| Occupation | Male | Female |
| Management | 112 (41.5%) | 158 (58.5%) |
| Business & Financial | 58 (49.6%) | 59 (50.4%) |
| Computers, Engineering & Science | 50 (69.4%) | 22 (30.6%) |
| Computers & Mathematics | 10 (66.7%) | 5 (33.3%) |
| Architecture & Engineering | 11 (68.8%) | 5 (31.2%) |
| Life, Physical & Social Science | 29 (70.7%) | 12 (29.3%) |
| Community & Social Service | 99 (32.6%) | 205 (67.4%) |
| Education, Arts & Media | 6 (12.8%) | 41 (87.2%) |
| Legal Services & Support | 9 (42.9%) | 12 (57.1%) |
| Education Instruction & Library | 69 (32.7%) | 142 (67.3%) |
| Arts, Media & Entertainment | 15 (60.0%) | 10 (40.0%) |
| Health Diagnosing & Treating | 24 (18.8%) | 104 (81.2%) |
| Health Technologists | 11 (18.6%) | 48 (81.4%) |
| Total (Category) | 343 (38.5%) | 548 (61.5%) |
| Total (Overall) | 1,294 (49.2%) | 1,334 (50.8%) |
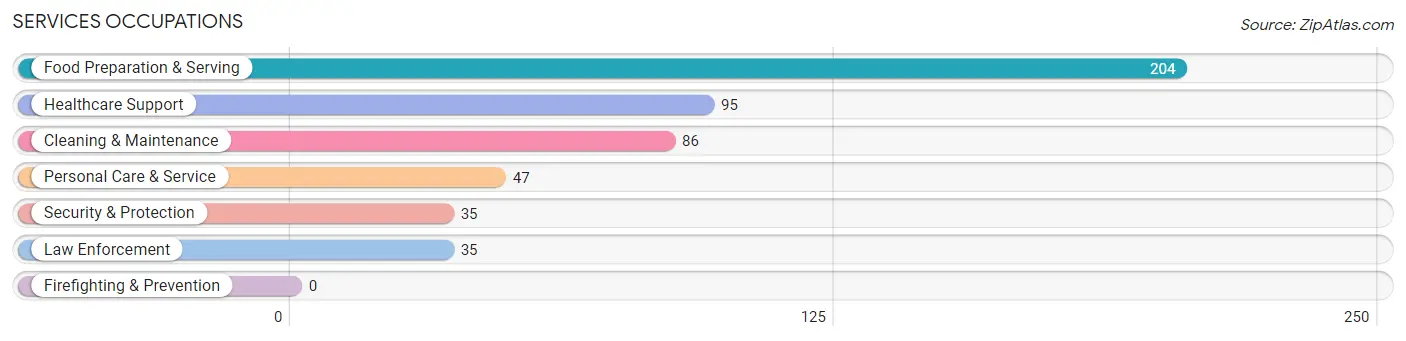
Services Occupations
The most common Services occupations in Essex County are Food Preparation & Serving (204 | 7.8%), Healthcare Support (95 | 3.6%), Cleaning & Maintenance (86 | 3.3%), Personal Care & Service (47 | 1.8%), and Security & Protection (35 | 1.3%).
Services Occupations by Sex
Within the Services occupations in Essex County, the most male-oriented occupations are Security & Protection (80.0%), Law Enforcement (80.0%), and Food Preparation & Serving (37.8%), while the most female-oriented occupations are Healthcare Support (100.0%), Personal Care & Service (85.1%), and Cleaning & Maintenance (62.8%).
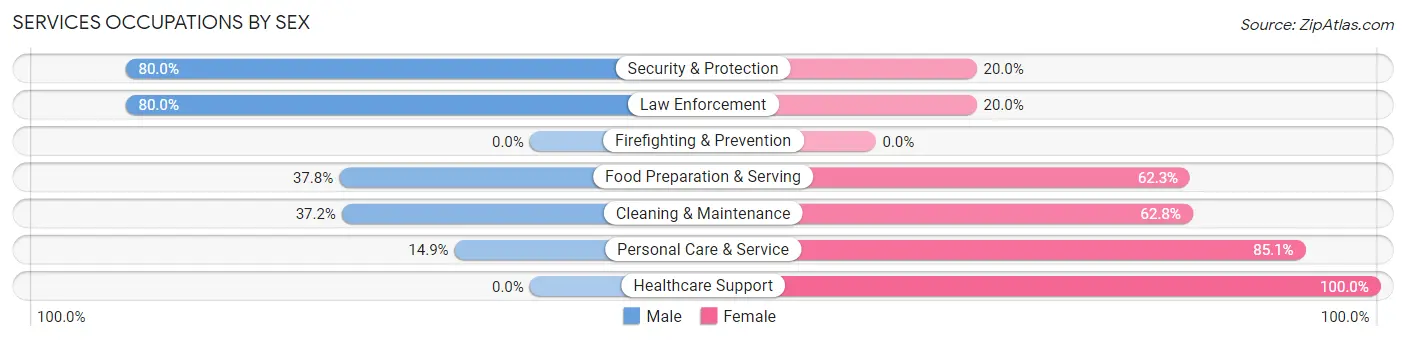
| Occupation | Male | Female |
| Healthcare Support | 0 (0.0%) | 95 (100.0%) |
| Security & Protection | 28 (80.0%) | 7 (20.0%) |
| Firefighting & Prevention | 0 (0.0%) | 0 (0.0%) |
| Law Enforcement | 28 (80.0%) | 7 (20.0%) |
| Food Preparation & Serving | 77 (37.8%) | 127 (62.3%) |
| Cleaning & Maintenance | 32 (37.2%) | 54 (62.8%) |
| Personal Care & Service | 7 (14.9%) | 40 (85.1%) |
| Total (Category) | 144 (30.8%) | 323 (69.2%) |
| Total (Overall) | 1,294 (49.2%) | 1,334 (50.8%) |
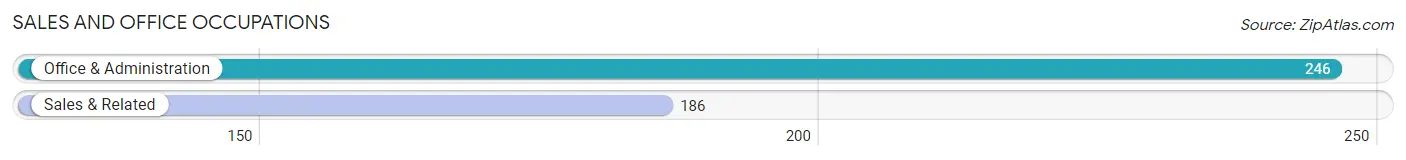
Sales and Office Occupations
The most common Sales and Office occupations in Essex County are Office & Administration (246 | 9.4%), and Sales & Related (186 | 7.1%).
Sales and Office Occupations by Sex
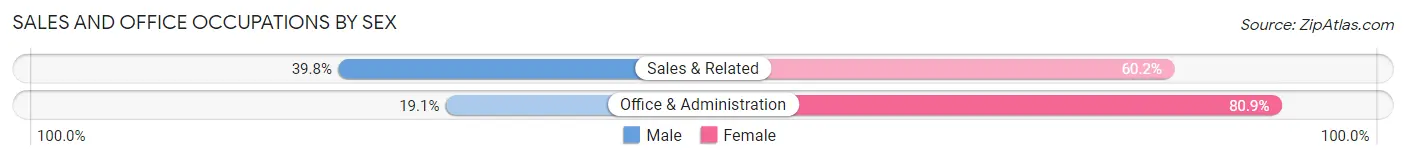
| Occupation | Male | Female |
| Sales & Related | 74 (39.8%) | 112 (60.2%) |
| Office & Administration | 47 (19.1%) | 199 (80.9%) |
| Total (Category) | 121 (28.0%) | 311 (72.0%) |
| Total (Overall) | 1,294 (49.2%) | 1,334 (50.8%) |
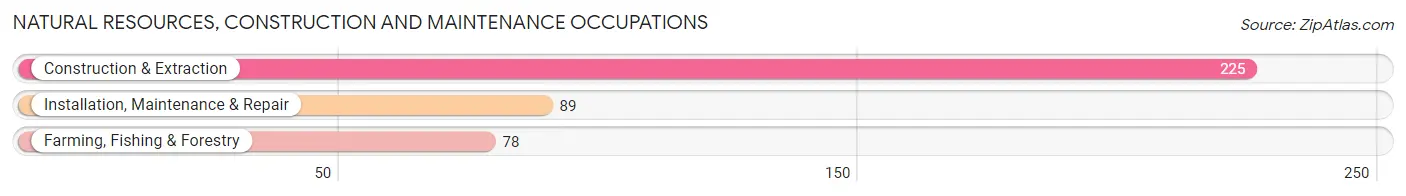
Natural Resources, Construction and Maintenance Occupations
The most common Natural Resources, Construction and Maintenance occupations in Essex County are Construction & Extraction (225 | 8.6%), Installation, Maintenance & Repair (89 | 3.4%), and Farming, Fishing & Forestry (78 | 3.0%).
Natural Resources, Construction and Maintenance Occupations by Sex
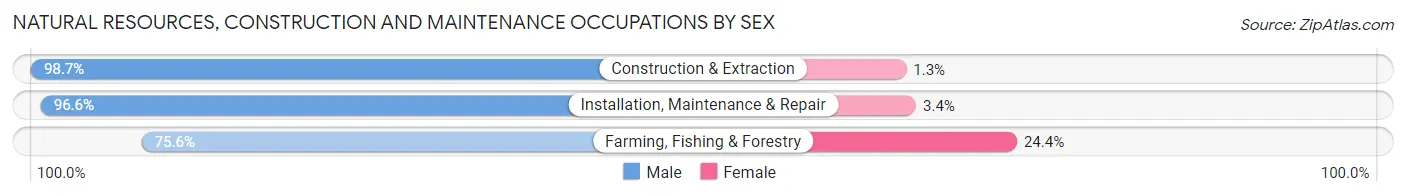
| Occupation | Male | Female |
| Farming, Fishing & Forestry | 59 (75.6%) | 19 (24.4%) |
| Construction & Extraction | 222 (98.7%) | 3 (1.3%) |
| Installation, Maintenance & Repair | 86 (96.6%) | 3 (3.4%) |
| Total (Category) | 367 (93.6%) | 25 (6.4%) |
| Total (Overall) | 1,294 (49.2%) | 1,334 (50.8%) |
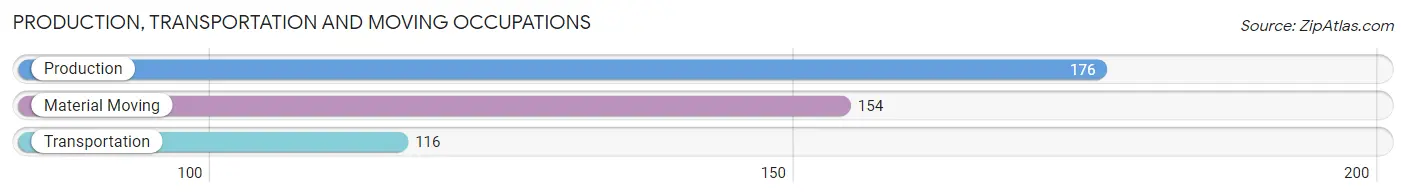
Production, Transportation and Moving Occupations
The most common Production, Transportation and Moving occupations in Essex County are Production (176 | 6.7%), Material Moving (154 | 5.9%), and Transportation (116 | 4.4%).
Production, Transportation and Moving Occupations by Sex
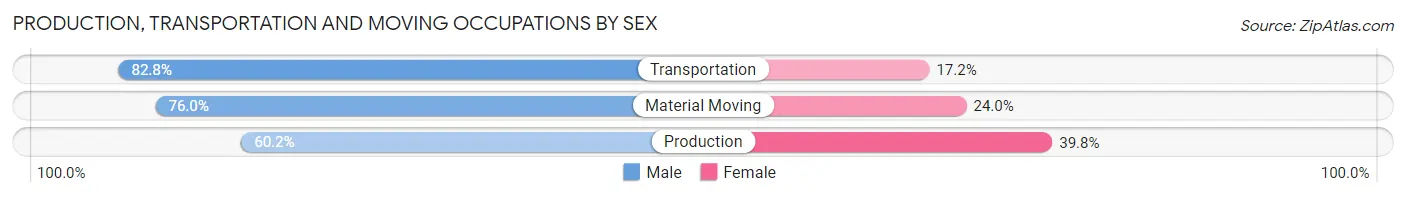
| Occupation | Male | Female |
| Production | 106 (60.2%) | 70 (39.8%) |
| Transportation | 96 (82.8%) | 20 (17.2%) |
| Material Moving | 117 (76.0%) | 37 (24.0%) |
| Total (Category) | 319 (71.5%) | 127 (28.5%) |
| Total (Overall) | 1,294 (49.2%) | 1,334 (50.8%) |
Employment Industries by Sex in Essex County
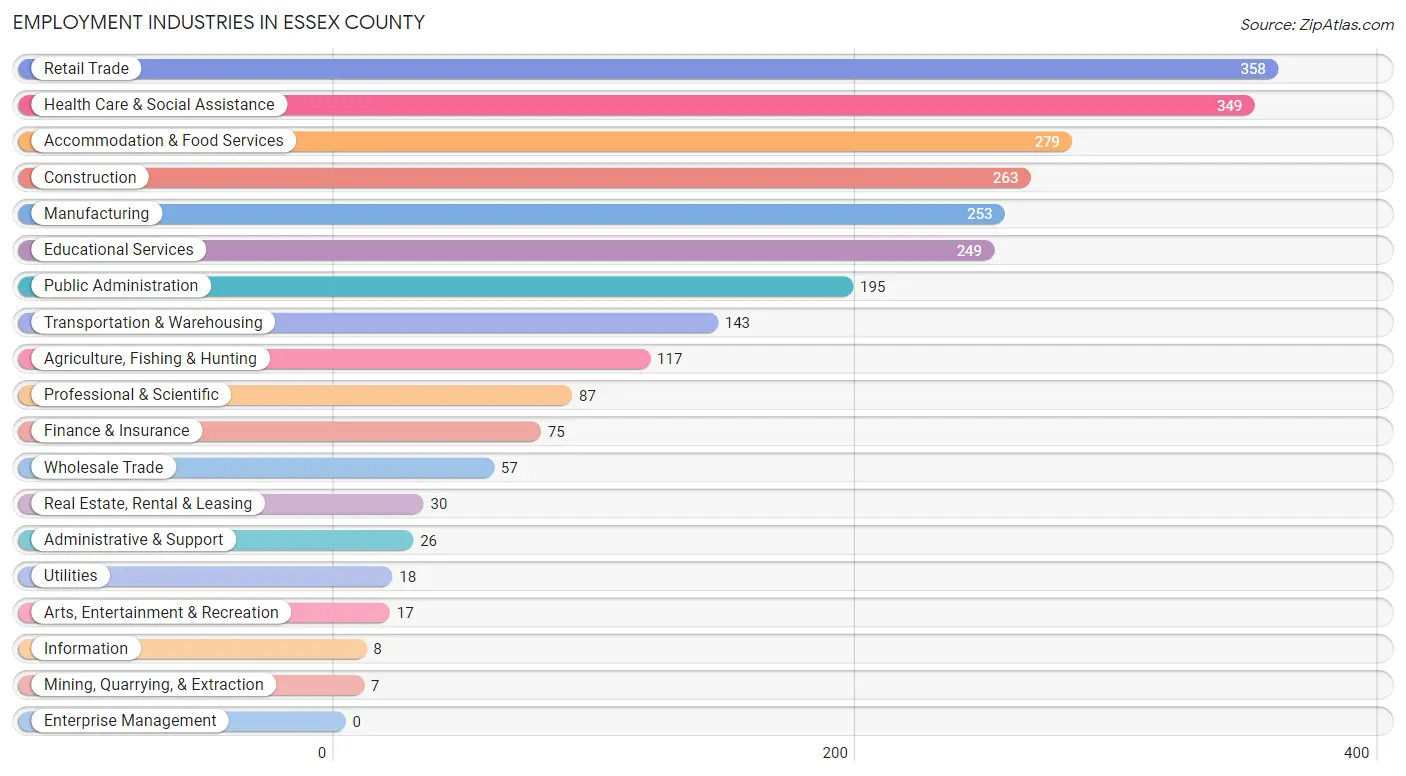
Employment Industries in Essex County
The major employment industries in Essex County include Retail Trade (358 | 13.6%), Health Care & Social Assistance (349 | 13.3%), Accommodation & Food Services (279 | 10.6%), Construction (263 | 10.0%), and Manufacturing (253 | 9.6%).
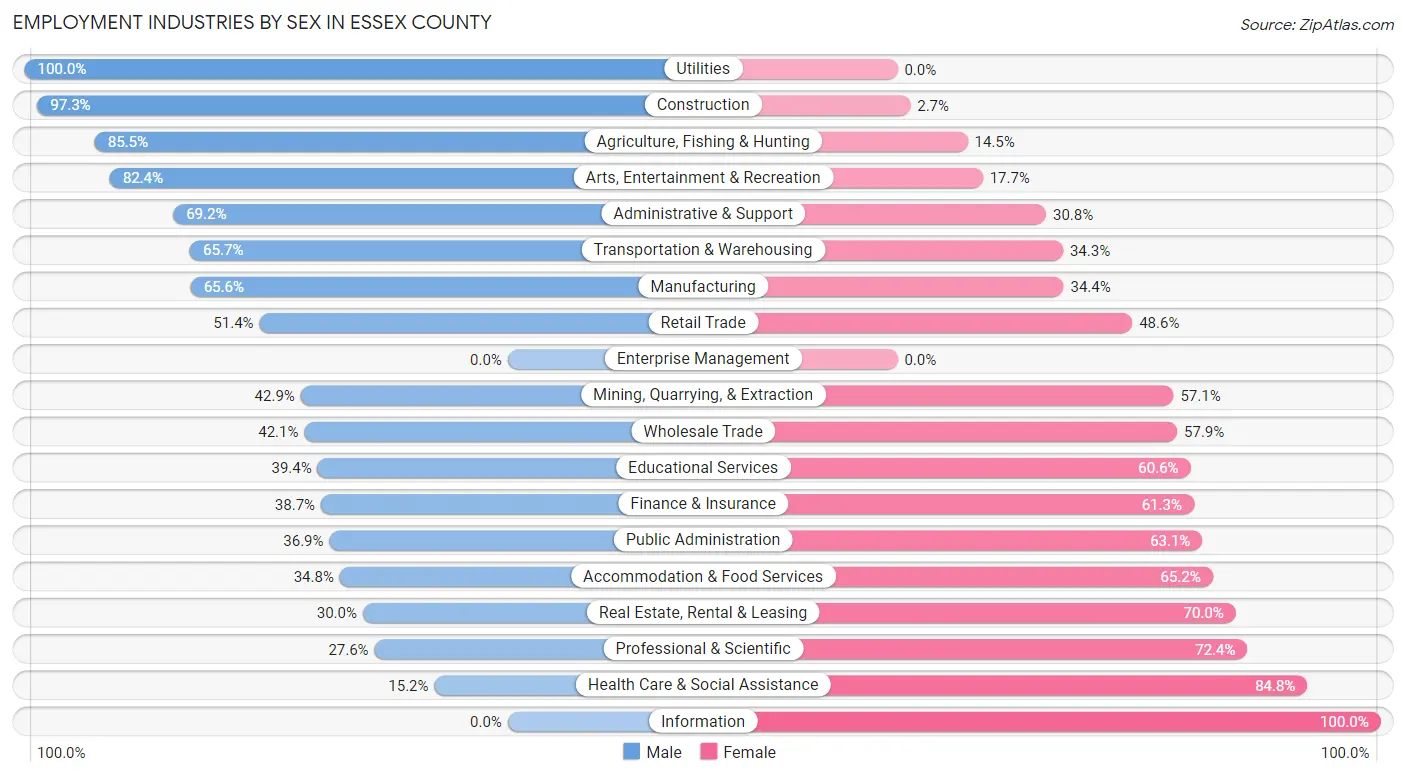
Employment Industries by Sex in Essex County
The Essex County industries that see more men than women are Utilities (100.0%), Construction (97.3%), and Agriculture, Fishing & Hunting (85.5%), whereas the industries that tend to have a higher number of women are Information (100.0%), Health Care & Social Assistance (84.8%), and Professional & Scientific (72.4%).
| Industry | Male | Female |
| Agriculture, Fishing & Hunting | 100 (85.5%) | 17 (14.5%) |
| Mining, Quarrying, & Extraction | 3 (42.9%) | 4 (57.1%) |
| Construction | 256 (97.3%) | 7 (2.7%) |
| Manufacturing | 166 (65.6%) | 87 (34.4%) |
| Wholesale Trade | 24 (42.1%) | 33 (57.9%) |
| Retail Trade | 184 (51.4%) | 174 (48.6%) |
| Transportation & Warehousing | 94 (65.7%) | 49 (34.3%) |
| Utilities | 18 (100.0%) | 0 (0.0%) |
| Information | 0 (0.0%) | 8 (100.0%) |
| Finance & Insurance | 29 (38.7%) | 46 (61.3%) |
| Real Estate, Rental & Leasing | 9 (30.0%) | 21 (70.0%) |
| Professional & Scientific | 24 (27.6%) | 63 (72.4%) |
| Enterprise Management | 0 (0.0%) | 0 (0.0%) |
| Administrative & Support | 18 (69.2%) | 8 (30.8%) |
| Educational Services | 98 (39.4%) | 151 (60.6%) |
| Health Care & Social Assistance | 53 (15.2%) | 296 (84.8%) |
| Arts, Entertainment & Recreation | 14 (82.4%) | 3 (17.6%) |
| Accommodation & Food Services | 97 (34.8%) | 182 (65.2%) |
| Public Administration | 72 (36.9%) | 123 (63.1%) |
| Total | 1,294 (49.2%) | 1,334 (50.8%) |
Education in Essex County
School Enrollment in Essex County
The most common levels of schooling among the 1,065 students in Essex County are high school (307 | 28.8%), elementary school (235 | 22.1%), and middle school (214 | 20.1%).
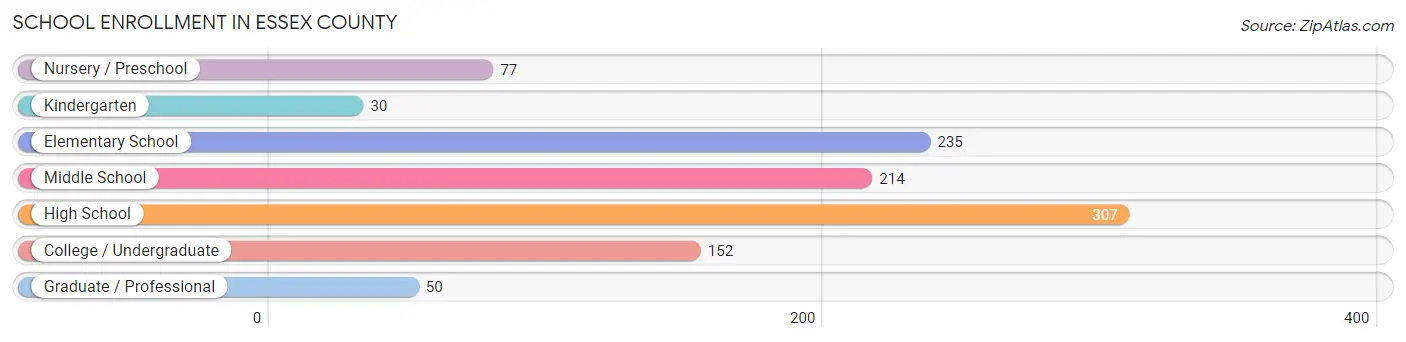
| School Level | # Students | % Students |
| Nursery / Preschool | 77 | 7.2% |
| Kindergarten | 30 | 2.8% |
| Elementary School | 235 | 22.1% |
| Middle School | 214 | 20.1% |
| High School | 307 | 28.8% |
| College / Undergraduate | 152 | 14.3% |
| Graduate / Professional | 50 | 4.7% |
| Total | 1,065 | 100.0% |
School Enrollment by Age by Funding Source in Essex County
Out of a total of 1,065 students who are enrolled in schools in Essex County, 237 (22.3%) attend a private institution, while the remaining 828 (77.7%) are enrolled in public schools. The age group of 15 to 17 year olds has the highest likelihood of being enrolled in private schools, with 86 (47.5% in the age bracket) enrolled. Conversely, the age group of 25 to 34 year olds has the lowest likelihood of being enrolled in a private school, with 54 (100.0% in the age bracket) attending a public institution.
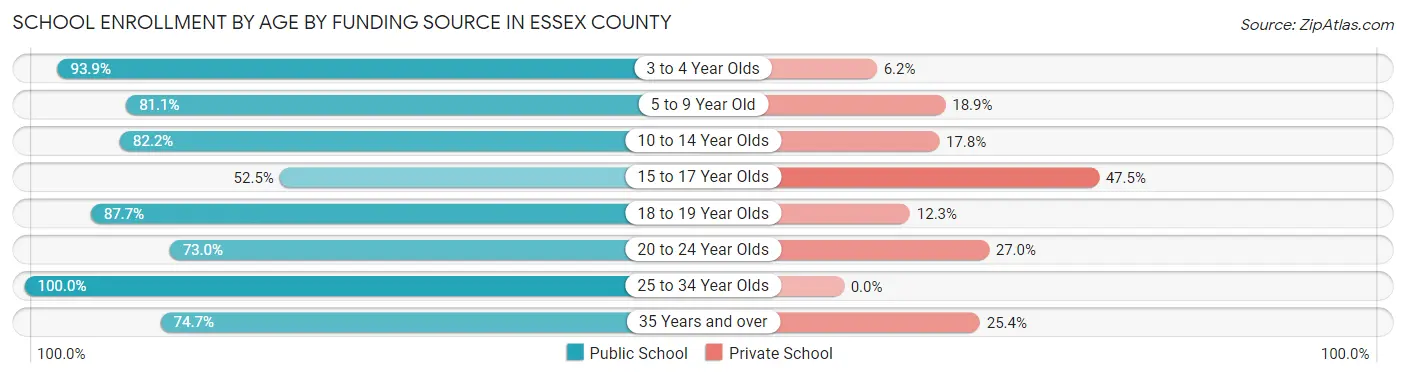
| Age Bracket | Public School | Private School |
| 3 to 4 Year Olds | 61 (93.9%) | 4 (6.1%) |
| 5 to 9 Year Old | 197 (81.1%) | 46 (18.9%) |
| 10 to 14 Year Olds | 250 (82.2%) | 54 (17.8%) |
| 15 to 17 Year Olds | 95 (52.5%) | 86 (47.5%) |
| 18 to 19 Year Olds | 64 (87.7%) | 9 (12.3%) |
| 20 to 24 Year Olds | 54 (73.0%) | 20 (27.0%) |
| 25 to 34 Year Olds | 54 (100.0%) | 0 (0.0%) |
| 35 Years and over | 53 (74.7%) | 18 (25.4%) |
| Total | 828 (77.7%) | 237 (22.3%) |
Educational Attainment by Field of Study in Essex County
Education (142 | 13.9%), social sciences (123 | 12.1%), science & technology (115 | 11.3%), arts & humanities (113 | 11.1%), and business (88 | 8.6%) are the most common fields of study among 1,019 individuals in Essex County who have obtained a bachelor's degree or higher.
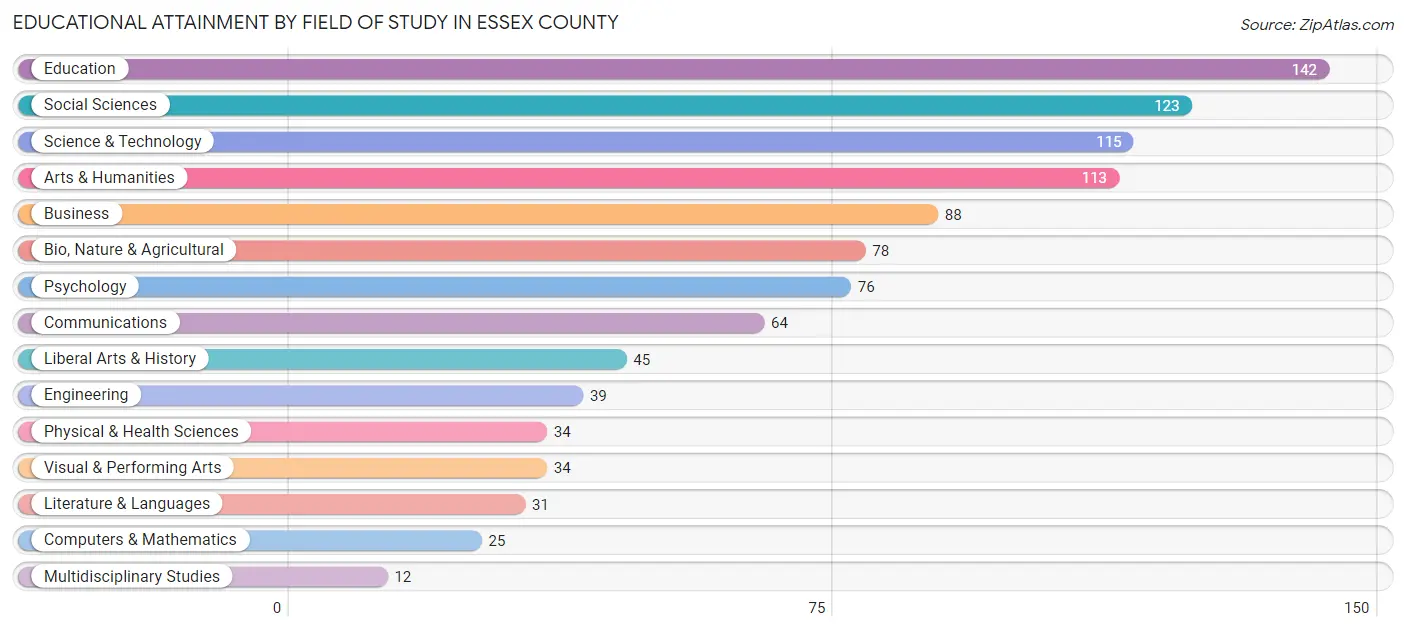
| Field of Study | # Graduates | % Graduates |
| Computers & Mathematics | 25 | 2.5% |
| Bio, Nature & Agricultural | 78 | 7.6% |
| Physical & Health Sciences | 34 | 3.3% |
| Psychology | 76 | 7.5% |
| Social Sciences | 123 | 12.1% |
| Engineering | 39 | 3.8% |
| Multidisciplinary Studies | 12 | 1.2% |
| Science & Technology | 115 | 11.3% |
| Business | 88 | 8.6% |
| Education | 142 | 13.9% |
| Literature & Languages | 31 | 3.0% |
| Liberal Arts & History | 45 | 4.4% |
| Visual & Performing Arts | 34 | 3.3% |
| Communications | 64 | 6.3% |
| Arts & Humanities | 113 | 11.1% |
| Total | 1,019 | 100.0% |
Transportation & Commute in Essex County
Vehicle Availability by Sex in Essex County
The most prevalent vehicle ownership categories in Essex County are males with 2 vehicles (532, accounting for 42.6%) and females with 2 vehicles (557, making up 40.7%).
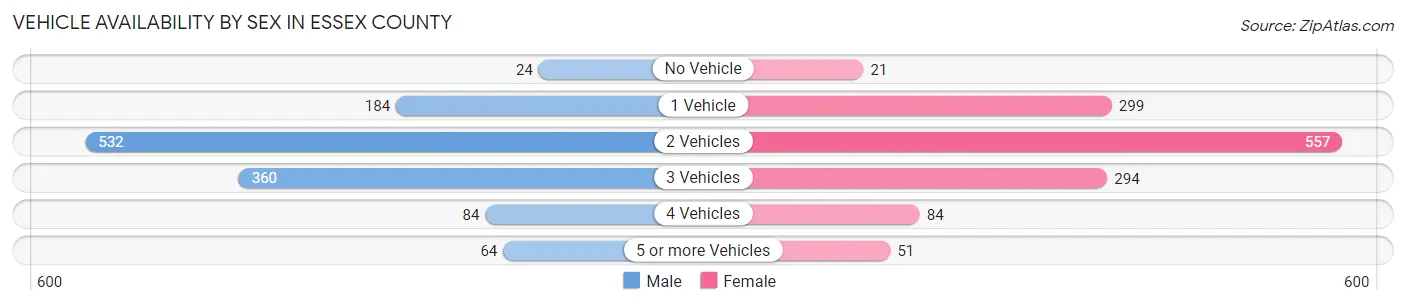
| Vehicles Available | Male | Female |
| No Vehicle | 24 (1.9%) | 21 (1.6%) |
| 1 Vehicle | 184 (14.7%) | 299 (22.9%) |
| 2 Vehicles | 532 (42.6%) | 557 (42.6%) |
| 3 Vehicles | 360 (28.8%) | 294 (22.5%) |
| 4 Vehicles | 84 (6.7%) | 84 (6.4%) |
| 5 or more Vehicles | 64 (5.1%) | 51 (3.9%) |
| Total | 1,248 (100.0%) | 1,306 (100.0%) |
Commute Time in Essex County
The most frequently occuring commute durations in Essex County are 30 to 34 minutes (461 commuters, 19.3%), 20 to 24 minutes (332 commuters, 13.9%), and 15 to 19 minutes (265 commuters, 11.1%).
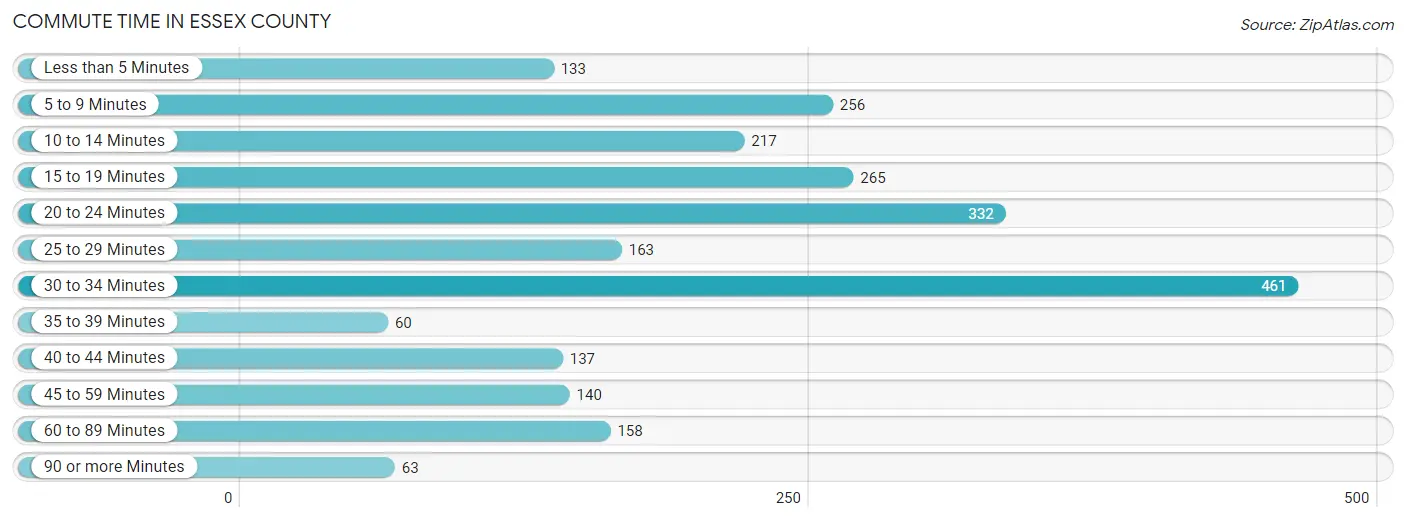
| Commute Time | # Commuters | % Commuters |
| Less than 5 Minutes | 133 | 5.6% |
| 5 to 9 Minutes | 256 | 10.7% |
| 10 to 14 Minutes | 217 | 9.1% |
| 15 to 19 Minutes | 265 | 11.1% |
| 20 to 24 Minutes | 332 | 13.9% |
| 25 to 29 Minutes | 163 | 6.8% |
| 30 to 34 Minutes | 461 | 19.3% |
| 35 to 39 Minutes | 60 | 2.5% |
| 40 to 44 Minutes | 137 | 5.7% |
| 45 to 59 Minutes | 140 | 5.9% |
| 60 to 89 Minutes | 158 | 6.6% |
| 90 or more Minutes | 63 | 2.6% |
Commute Time by Sex in Essex County
The most common commute times in Essex County are 30 to 34 minutes (180 commuters, 15.3%) for males and 30 to 34 minutes (281 commuters, 23.2%) for females.
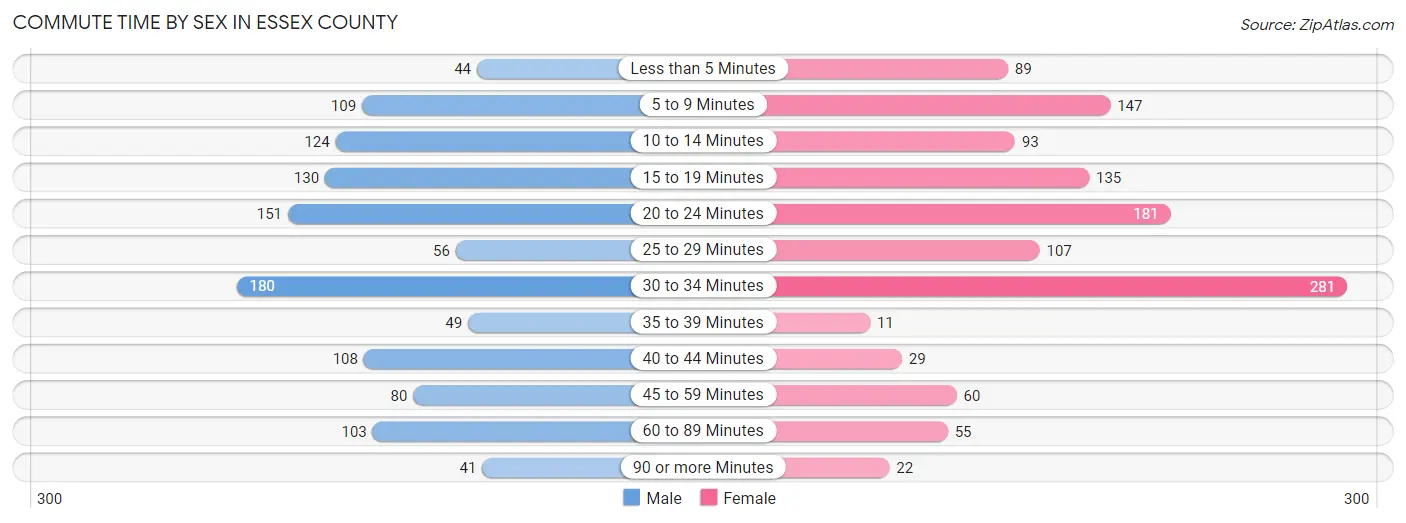
| Commute Time | Male | Female |
| Less than 5 Minutes | 44 (3.7%) | 89 (7.4%) |
| 5 to 9 Minutes | 109 (9.3%) | 147 (12.1%) |
| 10 to 14 Minutes | 124 (10.5%) | 93 (7.7%) |
| 15 to 19 Minutes | 130 (11.1%) | 135 (11.2%) |
| 20 to 24 Minutes | 151 (12.9%) | 181 (15.0%) |
| 25 to 29 Minutes | 56 (4.8%) | 107 (8.8%) |
| 30 to 34 Minutes | 180 (15.3%) | 281 (23.2%) |
| 35 to 39 Minutes | 49 (4.2%) | 11 (0.9%) |
| 40 to 44 Minutes | 108 (9.2%) | 29 (2.4%) |
| 45 to 59 Minutes | 80 (6.8%) | 60 (5.0%) |
| 60 to 89 Minutes | 103 (8.8%) | 55 (4.5%) |
| 90 or more Minutes | 41 (3.5%) | 22 (1.8%) |
Time of Departure to Work by Sex in Essex County
The most frequent times of departure to work in Essex County are 6:30 AM to 6:59 AM (175, 14.9%) for males and 7:30 AM to 7:59 AM (263, 21.7%) for females.
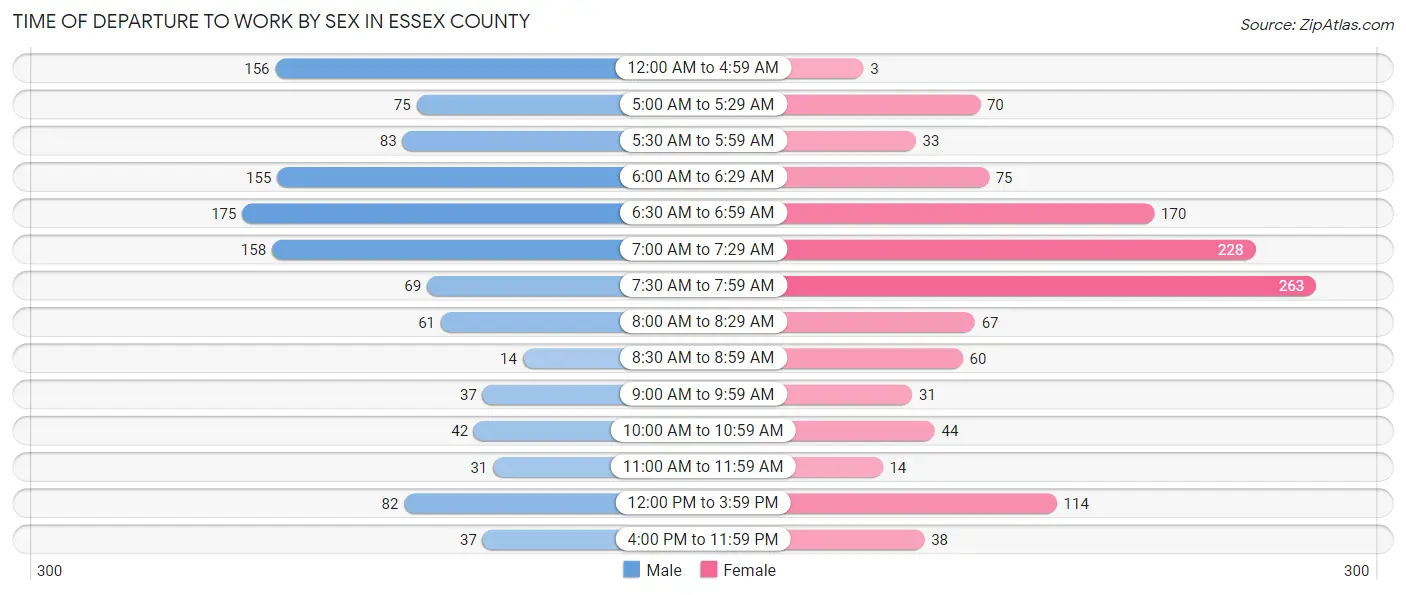
| Time of Departure | Male | Female |
| 12:00 AM to 4:59 AM | 156 (13.3%) | 3 (0.3%) |
| 5:00 AM to 5:29 AM | 75 (6.4%) | 70 (5.8%) |
| 5:30 AM to 5:59 AM | 83 (7.1%) | 33 (2.7%) |
| 6:00 AM to 6:29 AM | 155 (13.2%) | 75 (6.2%) |
| 6:30 AM to 6:59 AM | 175 (14.9%) | 170 (14.1%) |
| 7:00 AM to 7:29 AM | 158 (13.5%) | 228 (18.8%) |
| 7:30 AM to 7:59 AM | 69 (5.9%) | 263 (21.7%) |
| 8:00 AM to 8:29 AM | 61 (5.2%) | 67 (5.5%) |
| 8:30 AM to 8:59 AM | 14 (1.2%) | 60 (5.0%) |
| 9:00 AM to 9:59 AM | 37 (3.2%) | 31 (2.6%) |
| 10:00 AM to 10:59 AM | 42 (3.6%) | 44 (3.6%) |
| 11:00 AM to 11:59 AM | 31 (2.6%) | 14 (1.2%) |
| 12:00 PM to 3:59 PM | 82 (7.0%) | 114 (9.4%) |
| 4:00 PM to 11:59 PM | 37 (3.2%) | 38 (3.1%) |
| Total | 1,175 (100.0%) | 1,210 (100.0%) |
Housing Occupancy in Essex County
Occupancy by Ownership in Essex County
Of the total 2,667 dwellings in Essex County, owner-occupied units account for 2,231 (83.7%), while renter-occupied units make up 436 (16.4%).
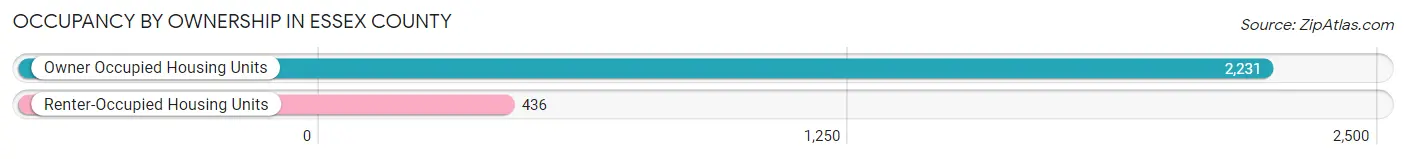
| Occupancy | # Housing Units | % Housing Units |
| Owner Occupied Housing Units | 2,231 | 83.7% |
| Renter-Occupied Housing Units | 436 | 16.4% |
| Total Occupied Housing Units | 2,667 | 100.0% |
Occupancy by Household Size in Essex County
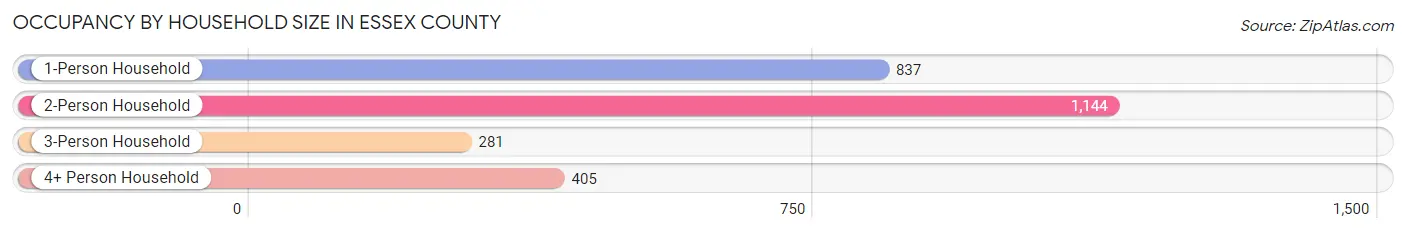
| Household Size | # Housing Units | % Housing Units |
| 1-Person Household | 837 | 31.4% |
| 2-Person Household | 1,144 | 42.9% |
| 3-Person Household | 281 | 10.5% |
| 4+ Person Household | 405 | 15.2% |
| Total Housing Units | 2,667 | 100.0% |
Occupancy by Ownership by Household Size in Essex County
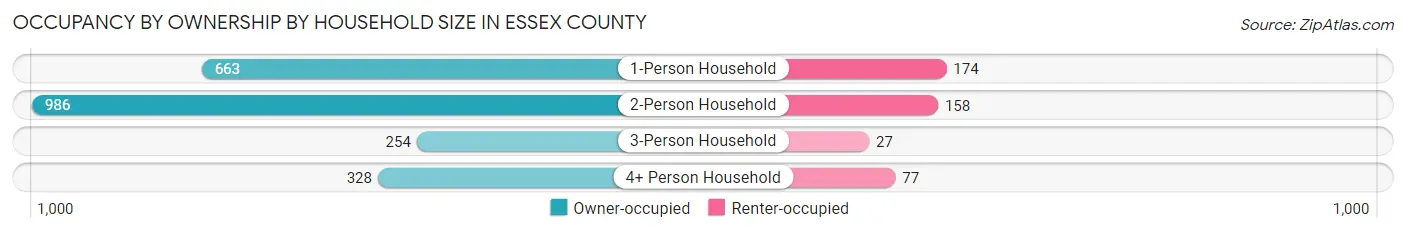
| Household Size | Owner-occupied | Renter-occupied |
| 1-Person Household | 663 (79.2%) | 174 (20.8%) |
| 2-Person Household | 986 (86.2%) | 158 (13.8%) |
| 3-Person Household | 254 (90.4%) | 27 (9.6%) |
| 4+ Person Household | 328 (81.0%) | 77 (19.0%) |
| Total Housing Units | 2,231 (83.7%) | 436 (16.4%) |
Occupancy by Educational Attainment in Essex County
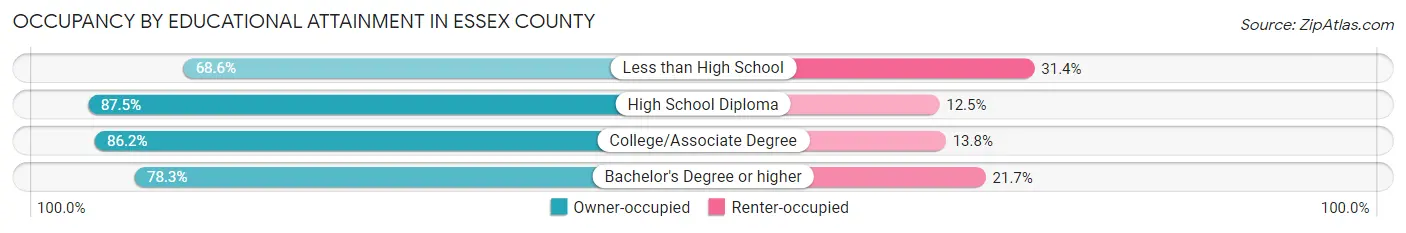
| Household Size | Owner-occupied | Renter-occupied |
| Less than High School | 151 (68.6%) | 69 (31.4%) |
| High School Diploma | 978 (87.5%) | 140 (12.5%) |
| College/Associate Degree | 669 (86.2%) | 107 (13.8%) |
| Bachelor's Degree or higher | 433 (78.3%) | 120 (21.7%) |
Occupancy by Age of Householder in Essex County
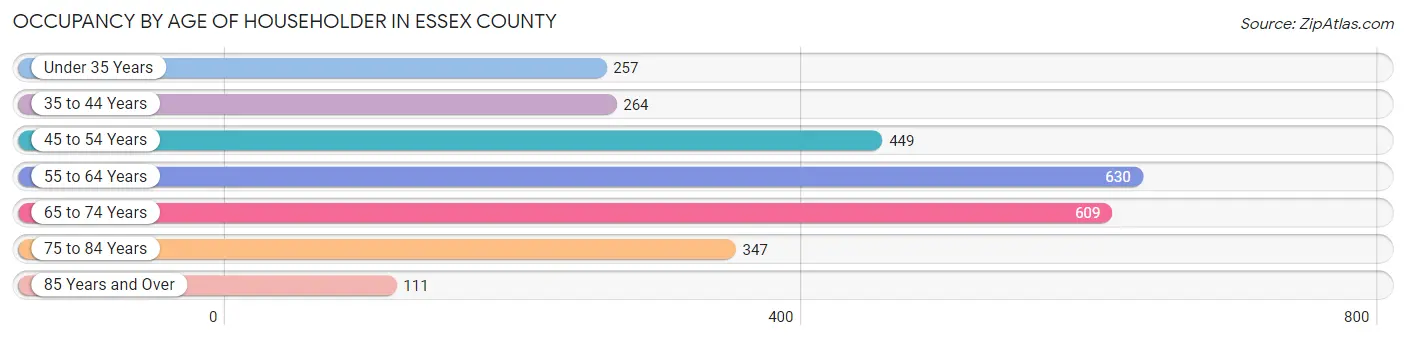
| Age Bracket | # Households | % Households |
| Under 35 Years | 257 | 9.6% |
| 35 to 44 Years | 264 | 9.9% |
| 45 to 54 Years | 449 | 16.8% |
| 55 to 64 Years | 630 | 23.6% |
| 65 to 74 Years | 609 | 22.8% |
| 75 to 84 Years | 347 | 13.0% |
| 85 Years and Over | 111 | 4.2% |
| Total | 2,667 | 100.0% |
Housing Finances in Essex County
Median Income by Occupancy in Essex County
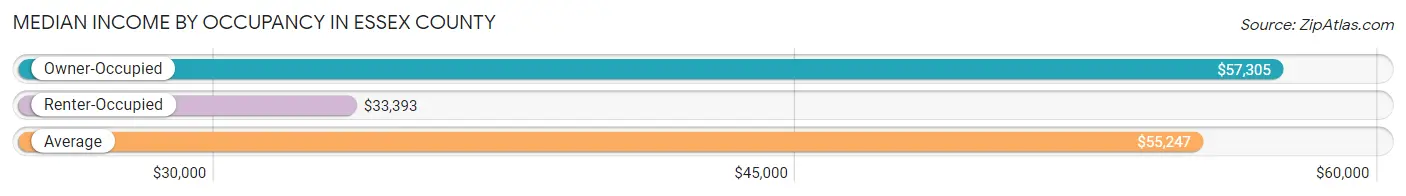
| Occupancy Type | # Households | Median Income |
| Owner-Occupied | 2,231 (83.7%) | $57,305 |
| Renter-Occupied | 436 (16.4%) | $33,393 |
| Average | 2,667 (100.0%) | $55,247 |
Occupancy by Householder Income Bracket in Essex County
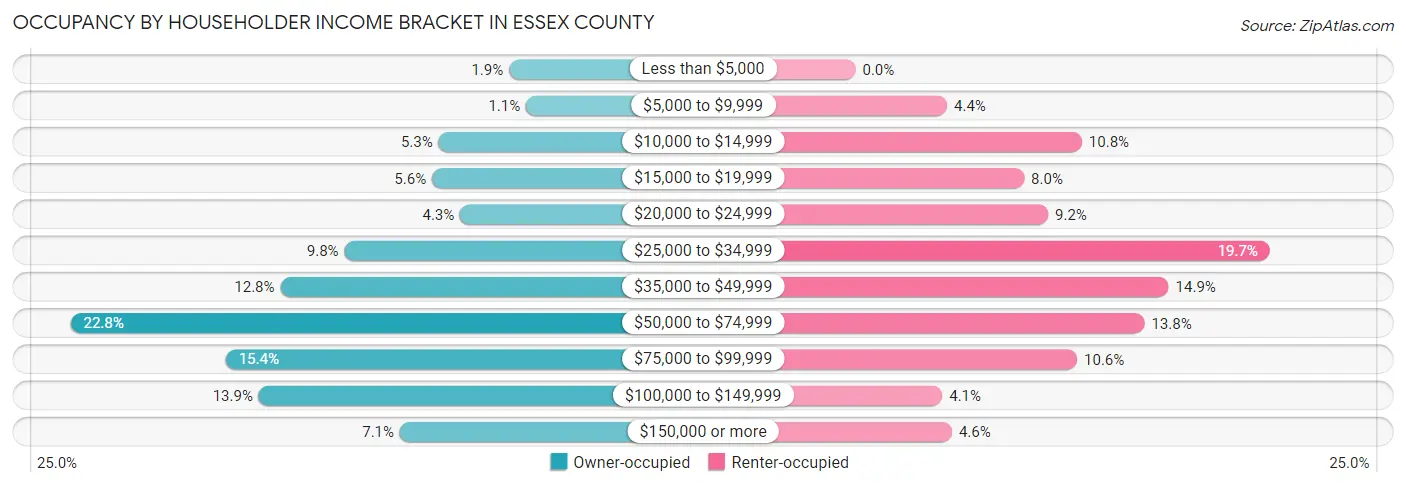
| Income Bracket | Owner-occupied | Renter-occupied |
| Less than $5,000 | 43 (1.9%) | 0 (0.0%) |
| $5,000 to $9,999 | 25 (1.1%) | 19 (4.4%) |
| $10,000 to $14,999 | 118 (5.3%) | 47 (10.8%) |
| $15,000 to $19,999 | 125 (5.6%) | 35 (8.0%) |
| $20,000 to $24,999 | 95 (4.3%) | 40 (9.2%) |
| $25,000 to $34,999 | 218 (9.8%) | 86 (19.7%) |
| $35,000 to $49,999 | 286 (12.8%) | 65 (14.9%) |
| $50,000 to $74,999 | 509 (22.8%) | 60 (13.8%) |
| $75,000 to $99,999 | 344 (15.4%) | 46 (10.5%) |
| $100,000 to $149,999 | 309 (13.9%) | 18 (4.1%) |
| $150,000 or more | 159 (7.1%) | 20 (4.6%) |
| Total | 2,231 (100.0%) | 436 (100.0%) |
Monthly Housing Cost Tiers in Essex County
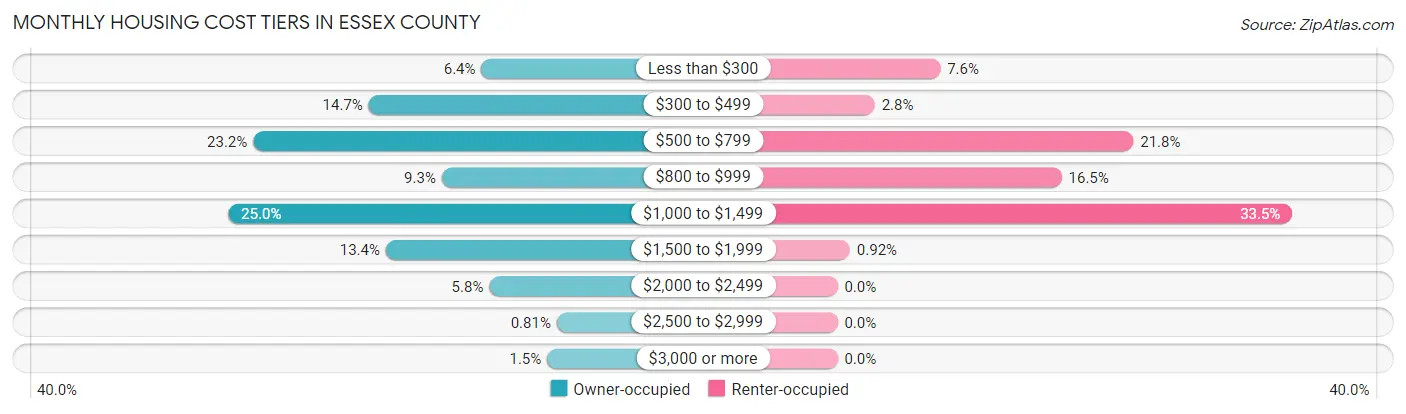
| Monthly Cost | Owner-occupied | Renter-occupied |
| Less than $300 | 142 (6.4%) | 33 (7.6%) |
| $300 to $499 | 327 (14.7%) | 12 (2.8%) |
| $500 to $799 | 517 (23.2%) | 95 (21.8%) |
| $800 to $999 | 207 (9.3%) | 72 (16.5%) |
| $1,000 to $1,499 | 558 (25.0%) | 146 (33.5%) |
| $1,500 to $1,999 | 299 (13.4%) | 4 (0.9%) |
| $2,000 to $2,499 | 129 (5.8%) | 0 (0.0%) |
| $2,500 to $2,999 | 18 (0.8%) | 0 (0.0%) |
| $3,000 or more | 34 (1.5%) | 0 (0.0%) |
| Total | 2,231 (100.0%) | 436 (100.0%) |
Physical Housing Characteristics in Essex County
Housing Structures in Essex County
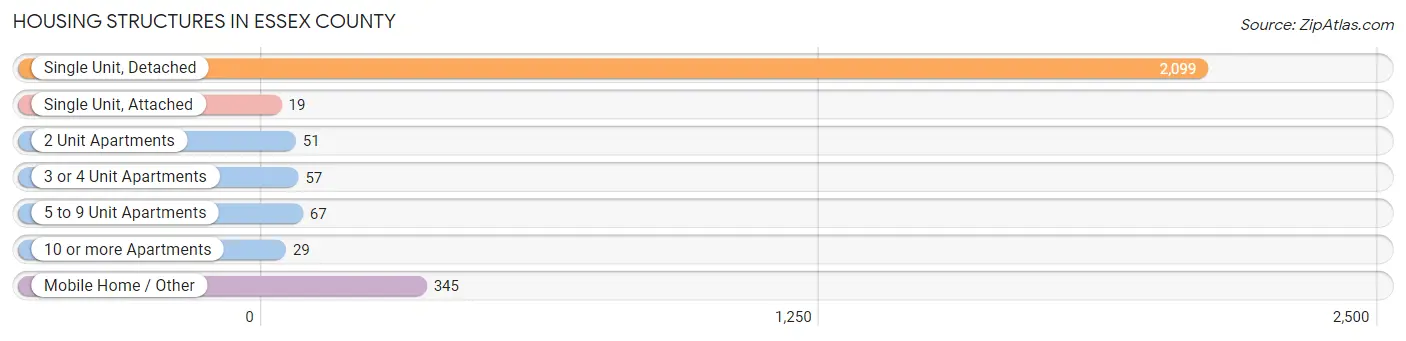
| Structure Type | # Housing Units | % Housing Units |
| Single Unit, Detached | 2,099 | 78.7% |
| Single Unit, Attached | 19 | 0.7% |
| 2 Unit Apartments | 51 | 1.9% |
| 3 or 4 Unit Apartments | 57 | 2.1% |
| 5 to 9 Unit Apartments | 67 | 2.5% |
| 10 or more Apartments | 29 | 1.1% |
| Mobile Home / Other | 345 | 12.9% |
| Total | 2,667 | 100.0% |
Housing Structures by Occupancy in Essex County
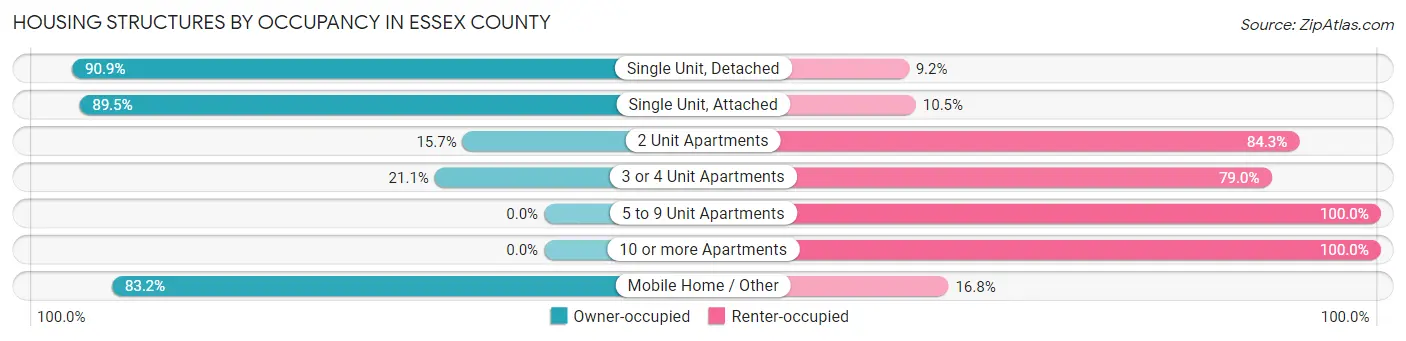
| Structure Type | Owner-occupied | Renter-occupied |
| Single Unit, Detached | 1,907 (90.8%) | 192 (9.1%) |
| Single Unit, Attached | 17 (89.5%) | 2 (10.5%) |
| 2 Unit Apartments | 8 (15.7%) | 43 (84.3%) |
| 3 or 4 Unit Apartments | 12 (21.0%) | 45 (78.9%) |
| 5 to 9 Unit Apartments | 0 (0.0%) | 67 (100.0%) |
| 10 or more Apartments | 0 (0.0%) | 29 (100.0%) |
| Mobile Home / Other | 287 (83.2%) | 58 (16.8%) |
| Total | 2,231 (83.7%) | 436 (16.4%) |
Housing Structures by Number of Rooms in Essex County
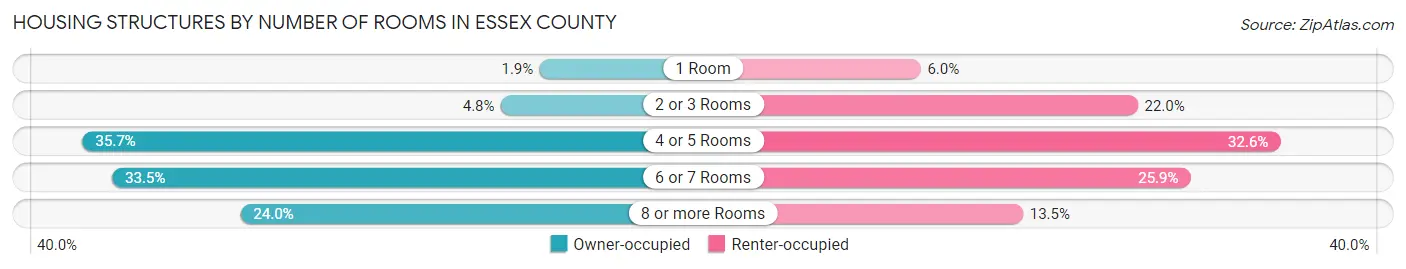
| Number of Rooms | Owner-occupied | Renter-occupied |
| 1 Room | 43 (1.9%) | 26 (6.0%) |
| 2 or 3 Rooms | 107 (4.8%) | 96 (22.0%) |
| 4 or 5 Rooms | 797 (35.7%) | 142 (32.6%) |
| 6 or 7 Rooms | 748 (33.5%) | 113 (25.9%) |
| 8 or more Rooms | 536 (24.0%) | 59 (13.5%) |
| Total | 2,231 (100.0%) | 436 (100.0%) |
Housing Structure by Heating Type in Essex County
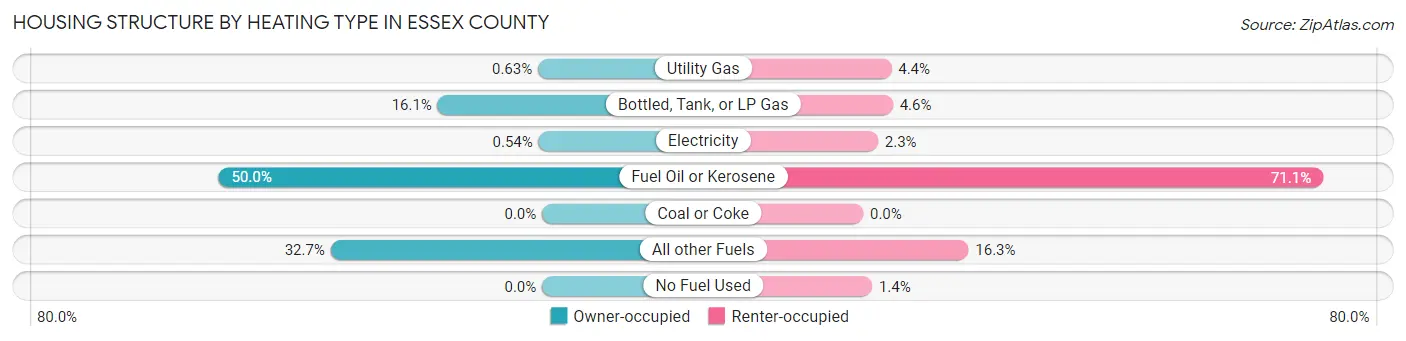
| Heating Type | Owner-occupied | Renter-occupied |
| Utility Gas | 14 (0.6%) | 19 (4.4%) |
| Bottled, Tank, or LP Gas | 360 (16.1%) | 20 (4.6%) |
| Electricity | 12 (0.5%) | 10 (2.3%) |
| Fuel Oil or Kerosene | 1,116 (50.0%) | 310 (71.1%) |
| Coal or Coke | 0 (0.0%) | 0 (0.0%) |
| All other Fuels | 729 (32.7%) | 71 (16.3%) |
| No Fuel Used | 0 (0.0%) | 6 (1.4%) |
| Total | 2,231 (100.0%) | 436 (100.0%) |
Household Vehicle Usage in Essex County
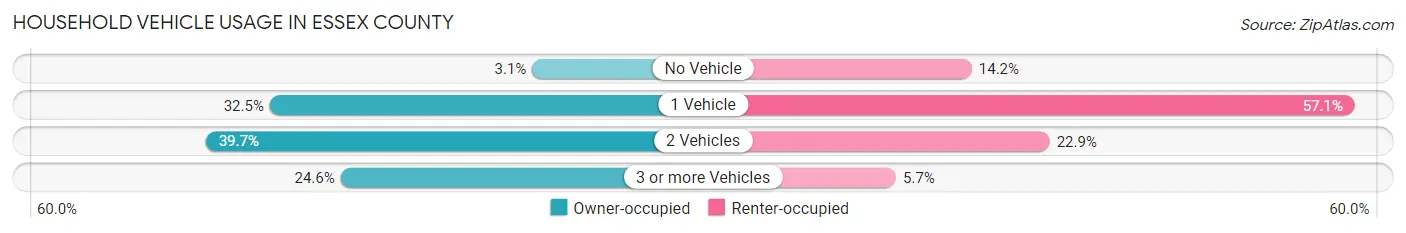
| Vehicles per Household | Owner-occupied | Renter-occupied |
| No Vehicle | 70 (3.1%) | 62 (14.2%) |
| 1 Vehicle | 726 (32.5%) | 249 (57.1%) |
| 2 Vehicles | 886 (39.7%) | 100 (22.9%) |
| 3 or more Vehicles | 549 (24.6%) | 25 (5.7%) |
| Total | 2,231 (100.0%) | 436 (100.0%) |
Real Estate & Mortgages in Essex County
Real Estate and Mortgage Overview in Essex County
| Characteristic | Without Mortgage | With Mortgage |
| Housing Units | 1,161 | 1,070 |
| Median Property Value | $131,000 | $165,500 |
| Median Household Income | $47,614 | $76 |
| Monthly Housing Costs | $555 | $29 |
| Real Estate Taxes | $2,543 | $14 |
Property Value by Mortgage Status in Essex County
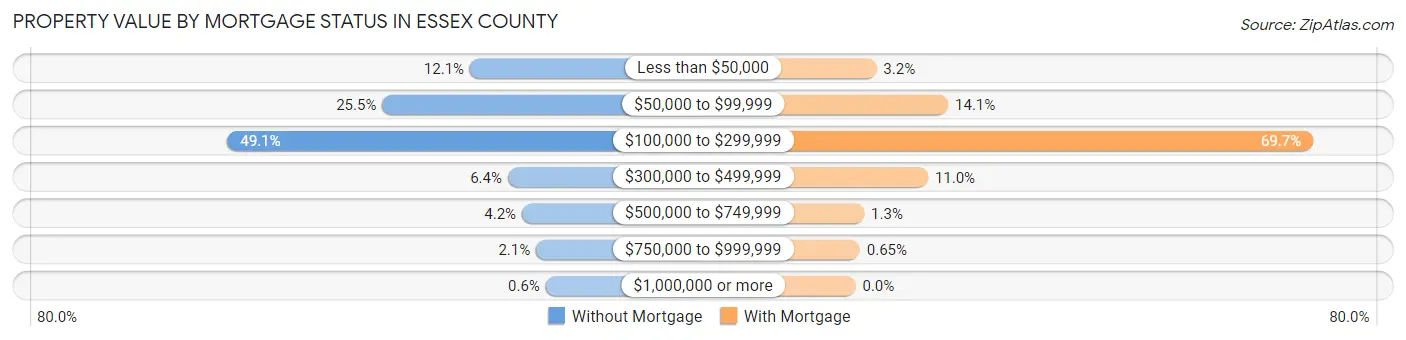
| Property Value | Without Mortgage | With Mortgage |
| Less than $50,000 | 141 (12.1%) | 34 (3.2%) |
| $50,000 to $99,999 | 296 (25.5%) | 151 (14.1%) |
| $100,000 to $299,999 | 570 (49.1%) | 746 (69.7%) |
| $300,000 to $499,999 | 74 (6.4%) | 118 (11.0%) |
| $500,000 to $749,999 | 49 (4.2%) | 14 (1.3%) |
| $750,000 to $999,999 | 24 (2.1%) | 7 (0.6%) |
| $1,000,000 or more | 7 (0.6%) | 0 (0.0%) |
| Total | 1,161 (100.0%) | 1,070 (100.0%) |
Household Income by Mortgage Status in Essex County
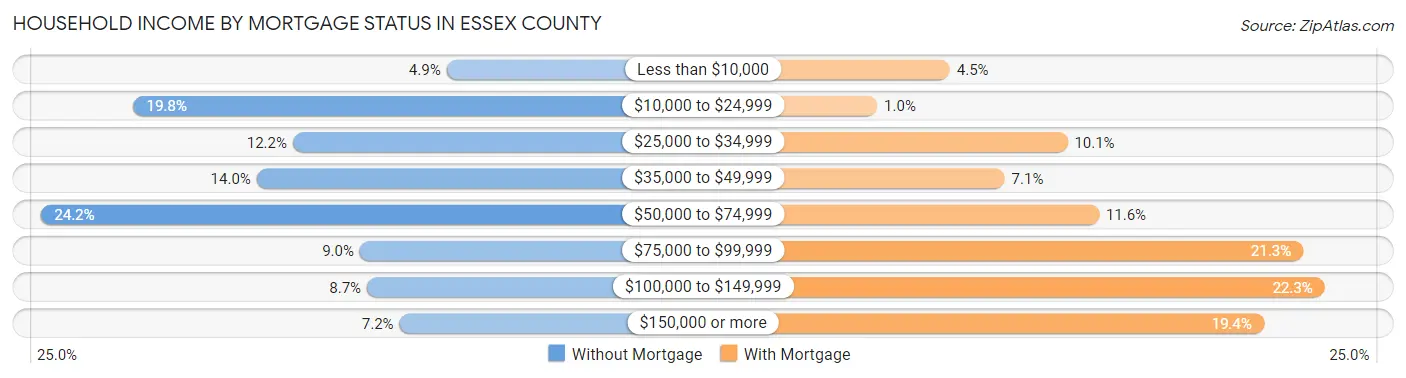
| Household Income | Without Mortgage | With Mortgage |
| Less than $10,000 | 57 (4.9%) | 48 (4.5%) |
| $10,000 to $24,999 | 230 (19.8%) | 11 (1.0%) |
| $25,000 to $34,999 | 142 (12.2%) | 108 (10.1%) |
| $35,000 to $49,999 | 162 (14.0%) | 76 (7.1%) |
| $50,000 to $74,999 | 281 (24.2%) | 124 (11.6%) |
| $75,000 to $99,999 | 105 (9.0%) | 228 (21.3%) |
| $100,000 to $149,999 | 101 (8.7%) | 239 (22.3%) |
| $150,000 or more | 83 (7.1%) | 208 (19.4%) |
| Total | 1,161 (100.0%) | 1,070 (100.0%) |
Property Value to Household Income Ratio in Essex County
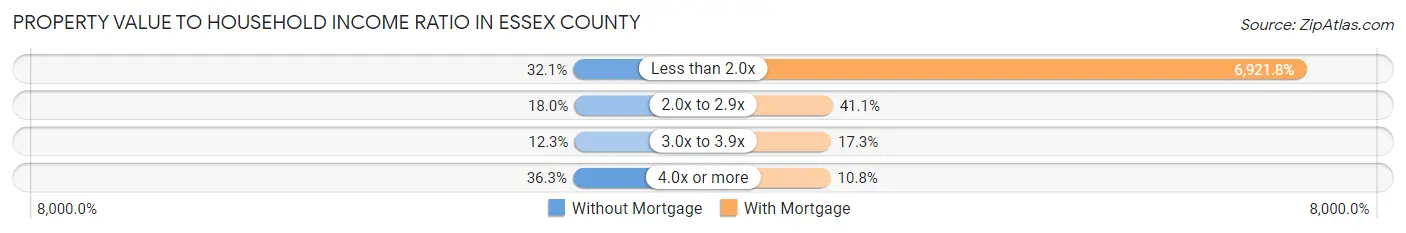
| Value-to-Income Ratio | Without Mortgage | With Mortgage |
| Less than 2.0x | 373 (32.1%) | 74,063 (6,921.8%) |
| 2.0x to 2.9x | 209 (18.0%) | 440 (41.1%) |
| 3.0x to 3.9x | 143 (12.3%) | 185 (17.3%) |
| 4.0x or more | 421 (36.3%) | 115 (10.7%) |
| Total | 1,161 (100.0%) | 1,070 (100.0%) |
Real Estate Taxes by Mortgage Status in Essex County
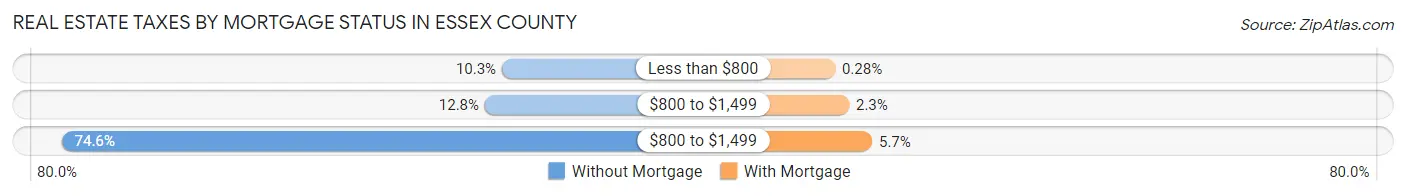
| Property Taxes | Without Mortgage | With Mortgage |
| Less than $800 | 119 (10.2%) | 3 (0.3%) |
| $800 to $1,499 | 148 (12.8%) | 25 (2.3%) |
| $800 to $1,499 | 866 (74.6%) | 61 (5.7%) |
| Total | 1,161 (100.0%) | 1,070 (100.0%) |
Health & Disability in Essex County
Health Insurance Coverage by Age in Essex County
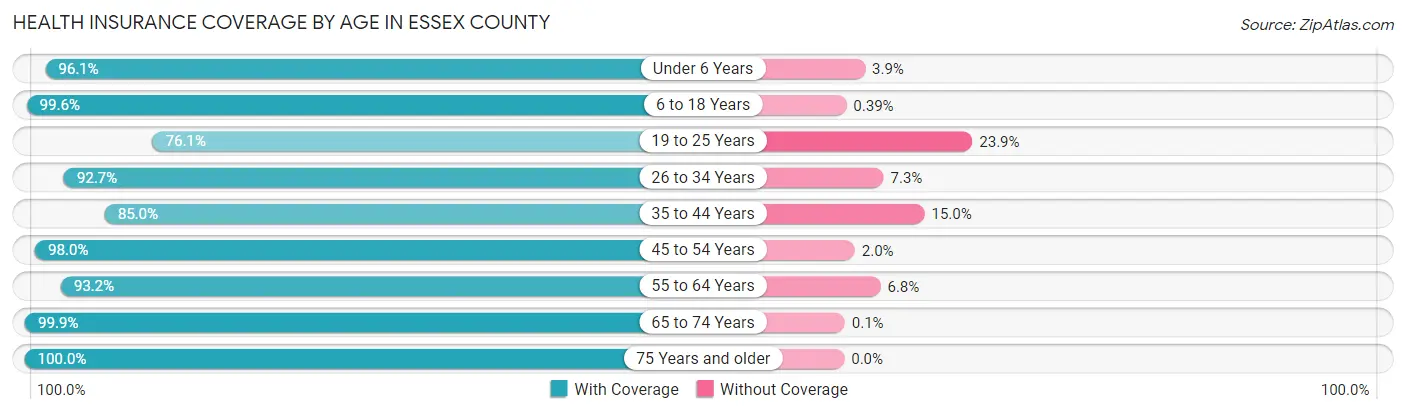
| Age Bracket | With Coverage | Without Coverage |
| Under 6 Years | 297 (96.1%) | 12 (3.9%) |
| 6 to 18 Years | 773 (99.6%) | 3 (0.4%) |
| 19 to 25 Years | 306 (76.1%) | 96 (23.9%) |
| 26 to 34 Years | 417 (92.7%) | 33 (7.3%) |
| 35 to 44 Years | 483 (85.0%) | 85 (15.0%) |
| 45 to 54 Years | 800 (98.0%) | 16 (2.0%) |
| 55 to 64 Years | 993 (93.2%) | 72 (6.8%) |
| 65 to 74 Years | 955 (99.9%) | 1 (0.1%) |
| 75 Years and older | 632 (100.0%) | 0 (0.0%) |
| Total | 5,656 (94.7%) | 318 (5.3%) |
Health Insurance Coverage by Citizenship Status in Essex County
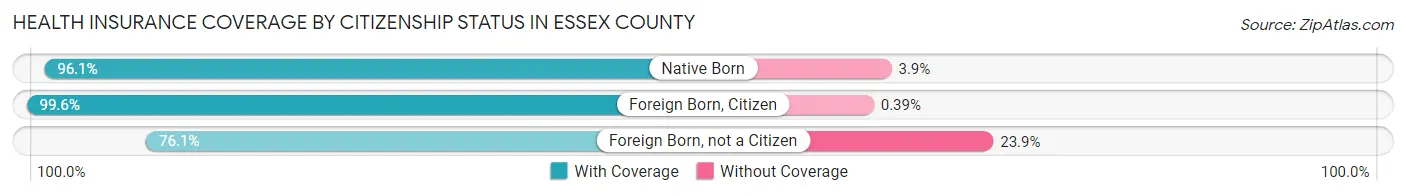
| Citizenship Status | With Coverage | Without Coverage |
| Native Born | 297 (96.1%) | 12 (3.9%) |
| Foreign Born, Citizen | 773 (99.6%) | 3 (0.4%) |
| Foreign Born, not a Citizen | 306 (76.1%) | 96 (23.9%) |
Health Insurance Coverage by Household Income in Essex County
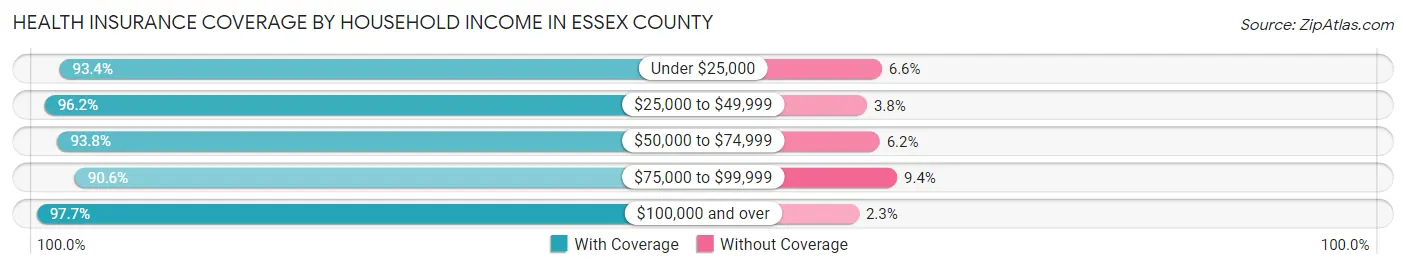
| Household Income | With Coverage | Without Coverage |
| Under $25,000 | 741 (93.4%) | 52 (6.6%) |
| $25,000 to $49,999 | 1,297 (96.2%) | 51 (3.8%) |
| $50,000 to $74,999 | 1,246 (93.8%) | 82 (6.2%) |
| $75,000 to $99,999 | 971 (90.6%) | 101 (9.4%) |
| $100,000 and over | 1,373 (97.7%) | 32 (2.3%) |
Public vs Private Health Insurance Coverage by Age in Essex County
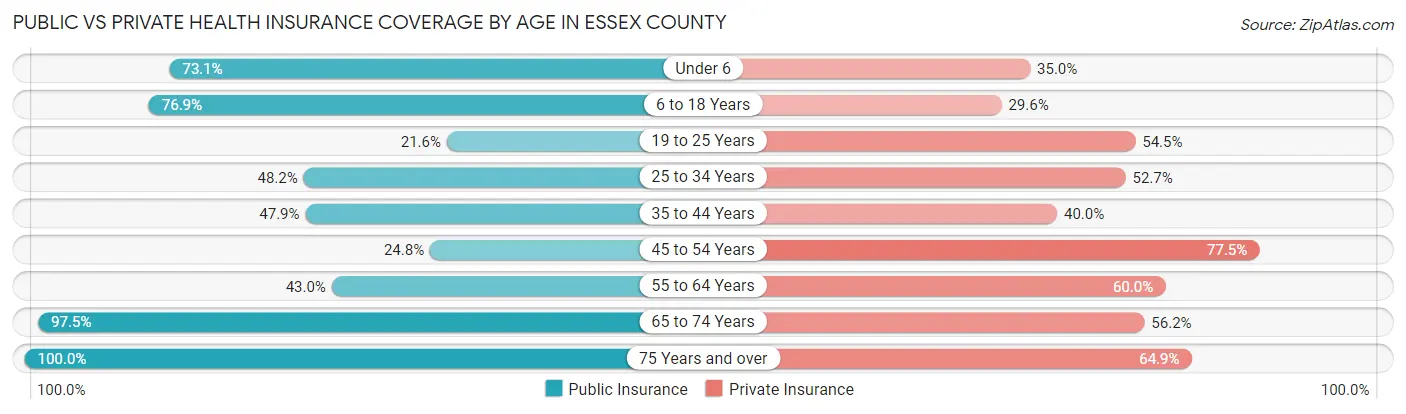
| Age Bracket | Public Insurance | Private Insurance |
| Under 6 | 226 (73.1%) | 108 (34.9%) |
| 6 to 18 Years | 597 (76.9%) | 230 (29.6%) |
| 19 to 25 Years | 87 (21.6%) | 219 (54.5%) |
| 25 to 34 Years | 217 (48.2%) | 237 (52.7%) |
| 35 to 44 Years | 272 (47.9%) | 227 (40.0%) |
| 45 to 54 Years | 202 (24.7%) | 632 (77.4%) |
| 55 to 64 Years | 458 (43.0%) | 639 (60.0%) |
| 65 to 74 Years | 932 (97.5%) | 537 (56.2%) |
| 75 Years and over | 632 (100.0%) | 410 (64.9%) |
| Total | 3,623 (60.7%) | 3,239 (54.2%) |
Disability Status by Sex by Age in Essex County
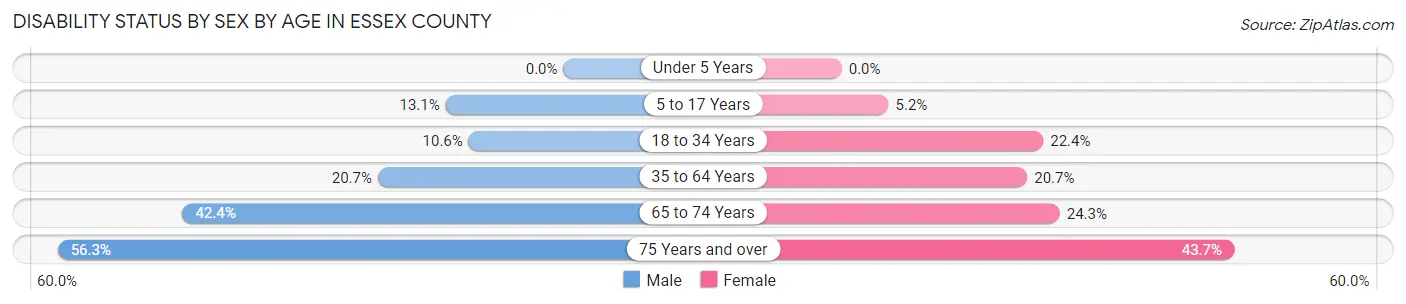
| Age Bracket | Male | Female |
| Under 5 Years | 0 (0.0%) | 0 (0.0%) |
| 5 to 17 Years | 53 (13.1%) | 19 (5.2%) |
| 18 to 34 Years | 48 (10.5%) | 103 (22.4%) |
| 35 to 64 Years | 251 (20.7%) | 255 (20.7%) |
| 65 to 74 Years | 215 (42.4%) | 109 (24.3%) |
| 75 Years and over | 174 (56.3%) | 141 (43.6%) |
Disability Class by Sex by Age in Essex County
Disability Class: Hearing Difficulty
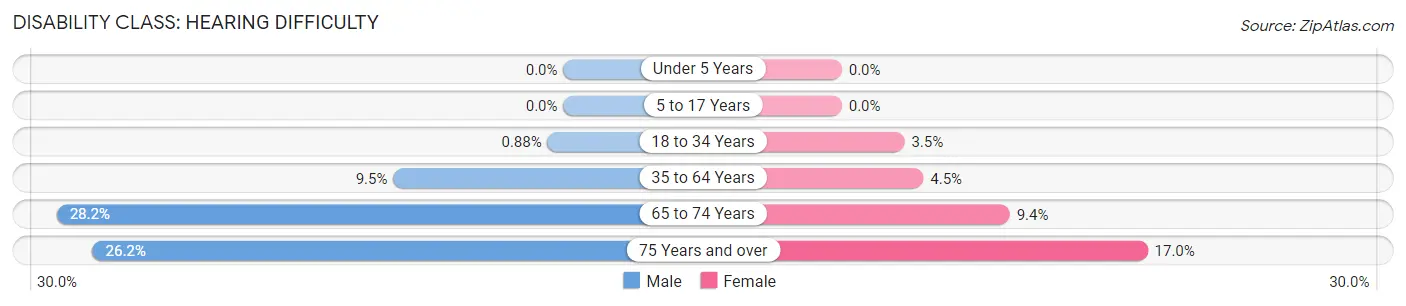
| Age Bracket | Male | Female |
| Under 5 Years | 0 (0.0%) | 0 (0.0%) |
| 5 to 17 Years | 0 (0.0%) | 0 (0.0%) |
| 18 to 34 Years | 4 (0.9%) | 16 (3.5%) |
| 35 to 64 Years | 115 (9.5%) | 56 (4.5%) |
| 65 to 74 Years | 143 (28.2%) | 42 (9.3%) |
| 75 Years and over | 81 (26.2%) | 55 (17.0%) |
Disability Class: Vision Difficulty
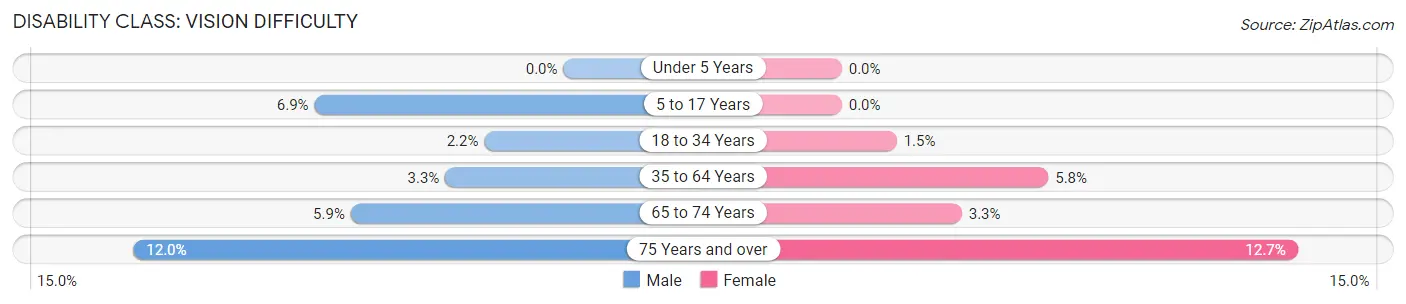
| Age Bracket | Male | Female |
| Under 5 Years | 0 (0.0%) | 0 (0.0%) |
| 5 to 17 Years | 28 (6.9%) | 0 (0.0%) |
| 18 to 34 Years | 10 (2.2%) | 7 (1.5%) |
| 35 to 64 Years | 40 (3.3%) | 71 (5.8%) |
| 65 to 74 Years | 30 (5.9%) | 15 (3.3%) |
| 75 Years and over | 37 (12.0%) | 41 (12.7%) |
Disability Class: Cognitive Difficulty
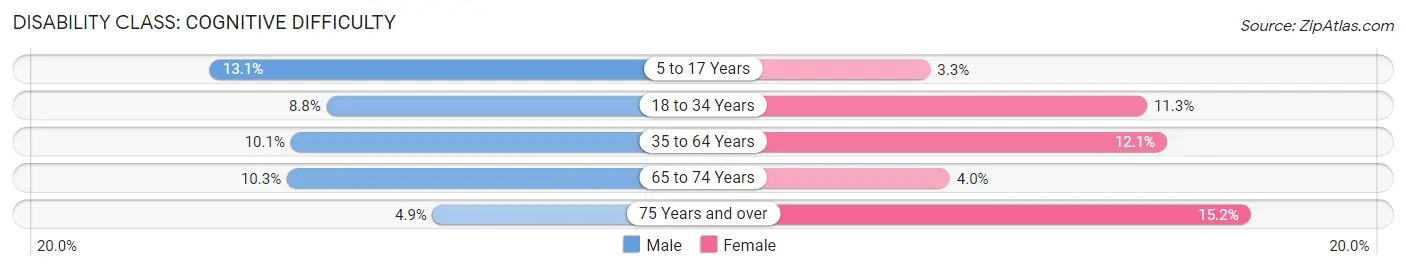
| Age Bracket | Male | Female |
| 5 to 17 Years | 53 (13.1%) | 12 (3.3%) |
| 18 to 34 Years | 40 (8.8%) | 52 (11.3%) |
| 35 to 64 Years | 123 (10.1%) | 149 (12.1%) |
| 65 to 74 Years | 52 (10.3%) | 18 (4.0%) |
| 75 Years and over | 15 (4.9%) | 49 (15.2%) |
Disability Class: Ambulatory Difficulty
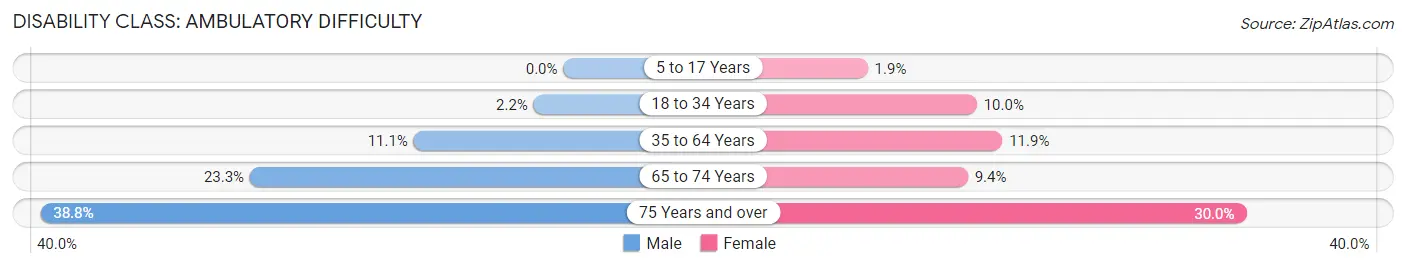
| Age Bracket | Male | Female |
| 5 to 17 Years | 0 (0.0%) | 7 (1.9%) |
| 18 to 34 Years | 10 (2.2%) | 46 (10.0%) |
| 35 to 64 Years | 135 (11.1%) | 147 (11.9%) |
| 65 to 74 Years | 118 (23.3%) | 42 (9.3%) |
| 75 Years and over | 120 (38.8%) | 97 (30.0%) |
Disability Class: Self-Care Difficulty
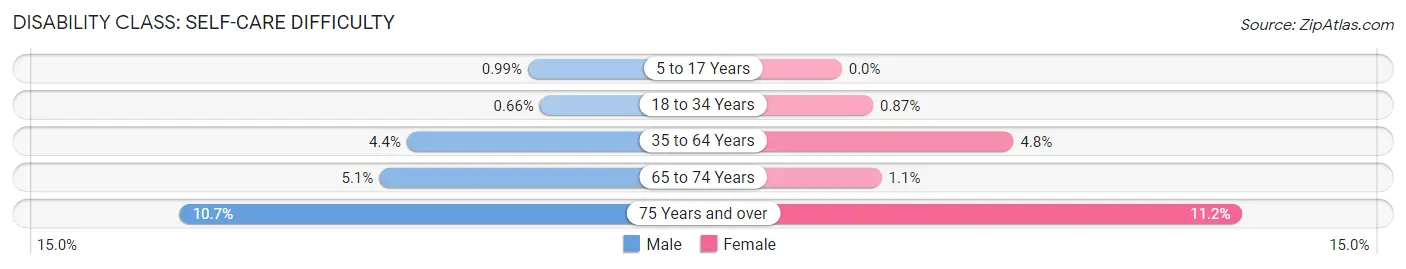
| Age Bracket | Male | Female |
| 5 to 17 Years | 4 (1.0%) | 0 (0.0%) |
| 18 to 34 Years | 3 (0.7%) | 4 (0.9%) |
| 35 to 64 Years | 53 (4.4%) | 59 (4.8%) |
| 65 to 74 Years | 26 (5.1%) | 5 (1.1%) |
| 75 Years and over | 33 (10.7%) | 36 (11.2%) |
Technology Access in Essex County
Computing Device Access in Essex County
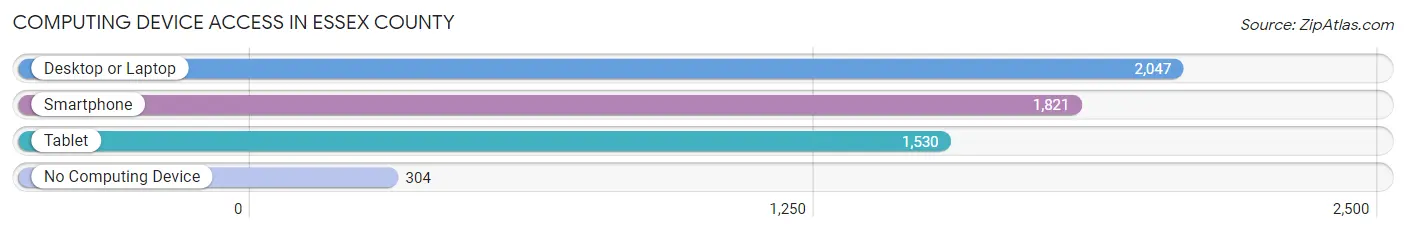
| Device Type | # Households | % Households |
| Desktop or Laptop | 2,047 | 76.7% |
| Smartphone | 1,821 | 68.3% |
| Tablet | 1,530 | 57.4% |
| No Computing Device | 304 | 11.4% |
| Total | 2,667 | 100.0% |
Internet Access in Essex County
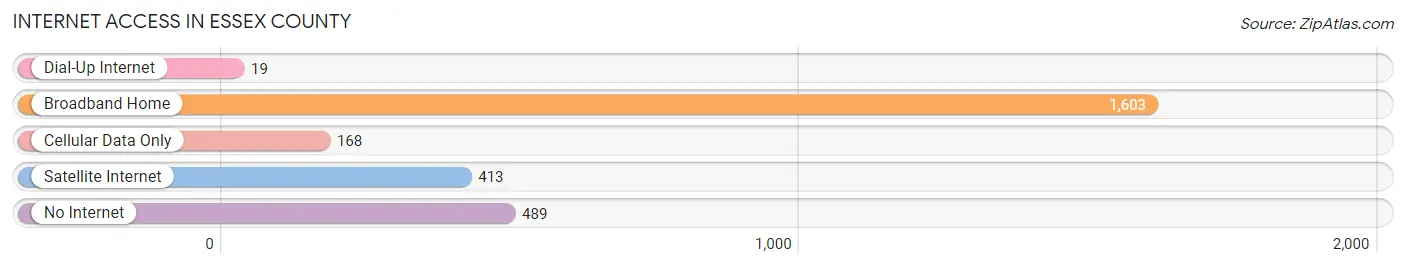
| Internet Type | # Households | % Households |
| Dial-Up Internet | 19 | 0.7% |
| Broadband Home | 1,603 | 60.1% |
| Cellular Data Only | 168 | 6.3% |
| Satellite Internet | 413 | 15.5% |
| No Internet | 489 | 18.3% |
| Total | 2,667 | 100.0% |
Essex County Summary
Essex County, Vermont is located in the northeastern corner of the state and is bordered by Canada to the north, New Hampshire to the east, and Caledonia County to the south and west. It is the second least populous county in the state, with a population of 6,306 as of the 2010 census. The county seat is the town of Guildhall.
Geography
Essex County is located in the northeastern corner of Vermont and is bordered by Canada to the north, New Hampshire to the east, and Caledonia County to the south and west. It is the second least populous county in the state, with a population of 6,306 as of the 2010 census. The county seat is the town of Guildhall. The county has a total area of 517 square miles, of which 514 square miles is land and 3.2 square miles is water. The highest point in the county is Mount Pisgah, at 3,945 feet.
The county is home to several rivers, including the Connecticut River, which forms the county’s northern border with Canada, and the Nulhegan River, which flows through the county from north to south. The county also contains several lakes, including Lake Memphremagog, which is located on the border with Canada, and Lake Willoughby, which is located in the town of Westmore.
Economy
Essex County’s economy is largely based on agriculture and tourism. The county is home to several dairy farms, as well as a number of apple orchards and maple syrup producers. The county is also home to several ski resorts, including Burke Mountain, Jay Peak, and Burke Mountain Resort.
The county is also home to several manufacturing companies, including the Essex County Wood Products Company, which produces wood products such as furniture and flooring, and the Essex County Textiles Company, which produces textiles such as blankets and towels.
Demographics
As of the 2010 census, the population of Essex County was 6,306, with a population density of 12.2 people per square mile. The racial makeup of the county was 97.2% White, 0.3% African American, 0.3% Native American, 0.3% Asian, 0.1% Pacific Islander, 0.3% from other races, and 1.5% from two or more races. Hispanic or Latino of any race were 1.2% of the population.
The median income for a household in the county was $41,944, and the median income for a family was $50,917. The per capita income for the county was $20,945. About 11.2% of families and 15.2% of the population were below the poverty line, including 19.2% of those under age 18 and 8.2% of those age 65 or over.
Essex County is served by two school districts, the Essex Westford School District and the Caledonia North Supervisory Union. The county is also home to several colleges and universities, including Lyndon State College, Johnson State College, and the Community College of Vermont.
Essex County is a rural county with a strong agricultural and tourism-based economy. The county is home to several ski resorts, manufacturing companies, and educational institutions, and has a population that is largely white and of moderate income.
Common Questions
What is the Total Population of Essex County?
Total Population of Essex County is 5,976.
What is the Total Male Population of Essex County?
Total Male Population of Essex County is 3,024.
What is the Total Female Population of Essex County?
Total Female Population of Essex County is 2,952.
What is the Ratio of Males per 100 Females in Essex County?
There are 102.44 Males per 100 Females in Essex County.
What is the Ratio of Females per 100 Males in Essex County?
There are 97.62 Females per 100 Males in Essex County.
What is the Median Population Age in Essex County?
Median Population Age in Essex County is 51.6 Years.
What is the Average Family Size in Essex County
Average Family Size in Essex County is 2.7 People.
What is the Average Household Size in Essex County
Average Household Size in Essex County is 2.2 People.
What is Per Capita Income in Essex County?
Per Capita income in Essex County is $31,891.
What is the Median Family Income in Essex County?
Median Family Income in Essex County is $65,481.
What is the Median Household income in Essex County?
Median Household Income in Essex County is $55,247.
What is Income or Wage Gap in Essex County?
Income or Wage Gap in Essex County is 25.2%.
Women in Essex County earn 74.8 cents for every dollar earned by a man.
What is Family Income Deficit in Essex County?
Family Income Deficit in Essex County is $10,154.
Families that are below poverty line in Essex County earn $10,154 less on average than the poverty threshold level.
What is Inequality or Gini Index in Essex County?
Inequality or Gini Index in Essex County is 0.44.
How Large is the Labor Force in Essex County?
There are 2,782 People in the Labor Forcein in Essex County.
What is the Percentage of People in the Labor Force in Essex County?
54.9% of People are in the Labor Force in Essex County.
What is the Unemployment Rate in Essex County?
Unemployment Rate in Essex County is 5.4%.