Chittenden County, VT
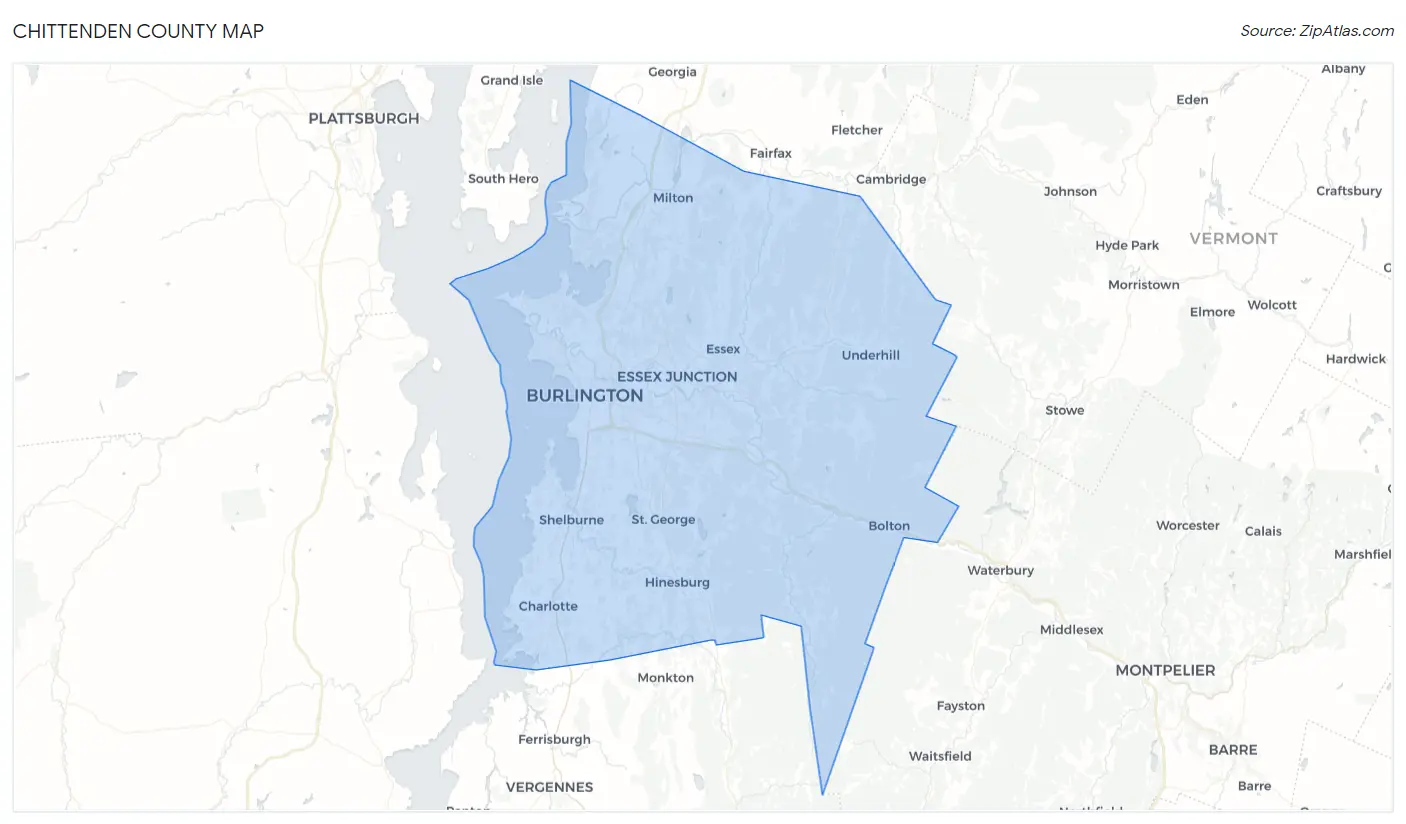
Chittenden County Map
Chittenden County Overview
168,309
TOTAL POPULATION
83,053
MALE POPULATION
85,256
FEMALE POPULATION
97.42
MALES / 100 FEMALES
102.65
FEMALES / 100 MALES
36.7
MEDIAN AGE
2.9
AVG FAMILY SIZE
2.3
AVG HOUSEHOLD SIZE
$47,458
PER CAPITA INCOME
$118,949
AVG FAMILY INCOME
$89,494
AVG HOUSEHOLD INCOME
24.1%
WAGE / INCOME GAP [ % ]
75.9¢/ $1
WAGE / INCOME GAP [ $ ]
$10,210
FAMILY INCOME DEFICIT
0.44
INEQUALITY / GINI INDEX
99,578
LABOR FORCE [ PEOPLE ]
69.7%
PERCENT IN LABOR FORCE
3.9%
UNEMPLOYMENT RATE
Chittenden County Area Codes
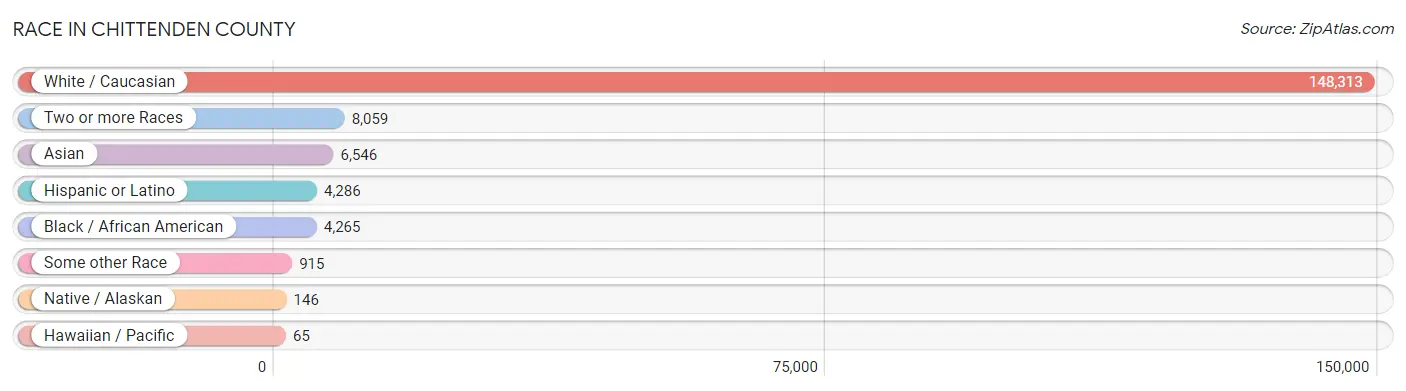
Race in Chittenden County
The most populous races in Chittenden County are White / Caucasian (148,313 | 88.1%), Two or more Races (8,059 | 4.8%), and Asian (6,546 | 3.9%).
| Race | # Population | % Population |
| Asian | 6,546 | 3.9% |
| Black / African American | 4,265 | 2.5% |
| Hawaiian / Pacific | 65 | 0.0% |
| Hispanic or Latino | 4,286 | 2.5% |
| Native / Alaskan | 146 | 0.1% |
| White / Caucasian | 148,313 | 88.1% |
| Two or more Races | 8,059 | 4.8% |
| Some other Race | 915 | 0.5% |
| Total | 168,309 | 100.0% |
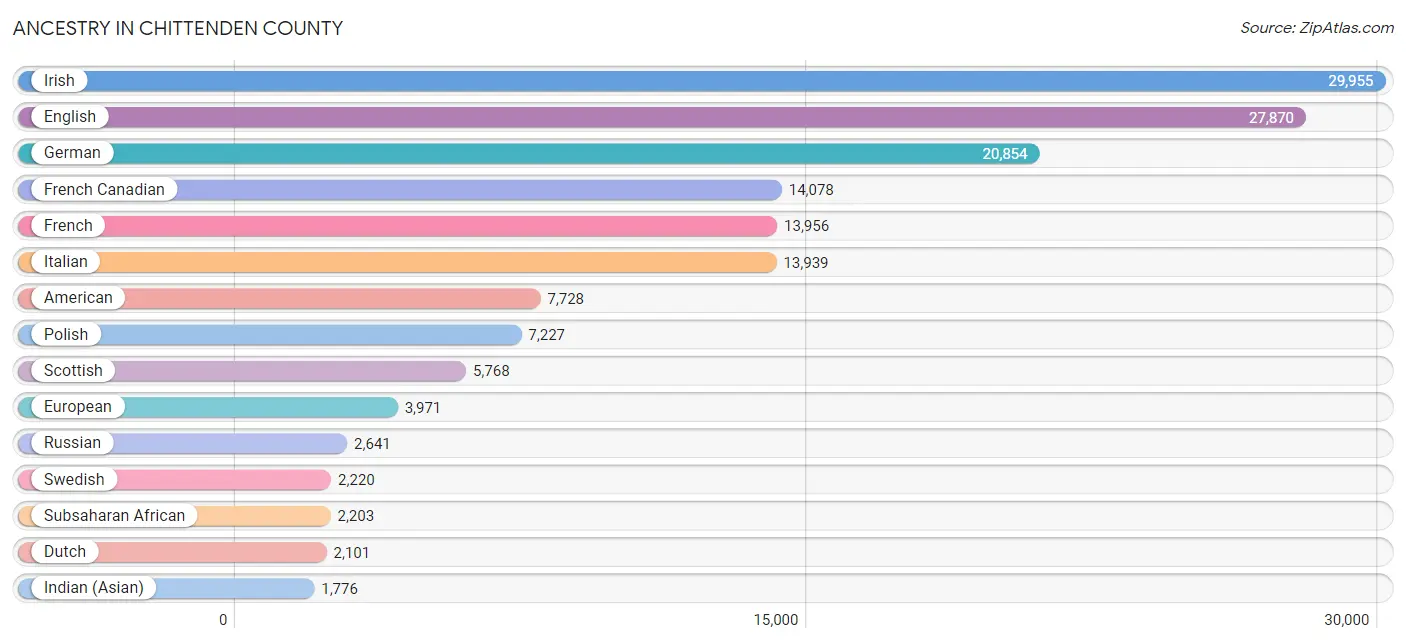
Ancestry in Chittenden County
The most populous ancestries reported in Chittenden County are Irish (29,955 | 17.8%), English (27,870 | 16.6%), German (20,854 | 12.4%), French Canadian (14,078 | 8.4%), and French (13,956 | 8.3%), together accounting for 63.4% of all Chittenden County residents.
| Ancestry | # Population | % Population |
| African | 487 | 0.3% |
| Albanian | 42 | 0.0% |
| Alsatian | 8 | 0.0% |
| American | 7,728 | 4.6% |
| Apache | 24 | 0.0% |
| Arab | 956 | 0.6% |
| Argentinean | 176 | 0.1% |
| Armenian | 242 | 0.1% |
| Australian | 8 | 0.0% |
| Austrian | 638 | 0.4% |
| Barbadian | 40 | 0.0% |
| Basque | 28 | 0.0% |
| Belgian | 157 | 0.1% |
| Bhutanese | 403 | 0.2% |
| Blackfeet | 117 | 0.1% |
| Brazilian | 88 | 0.1% |
| British | 1,502 | 0.9% |
| British West Indian | 23 | 0.0% |
| Bulgarian | 8 | 0.0% |
| Burmese | 806 | 0.5% |
| Cajun | 26 | 0.0% |
| Canadian | 1,720 | 1.0% |
| Celtic | 75 | 0.0% |
| Central American | 334 | 0.2% |
| Central American Indian | 227 | 0.1% |
| Cherokee | 85 | 0.1% |
| Cheyenne | 16 | 0.0% |
| Chilean | 13 | 0.0% |
| Chippewa | 22 | 0.0% |
| Choctaw | 24 | 0.0% |
| Colombian | 321 | 0.2% |
| Costa Rican | 71 | 0.0% |
| Cree | 11 | 0.0% |
| Croatian | 213 | 0.1% |
| Cuban | 401 | 0.2% |
| Cypriot | 2 | 0.0% |
| Czech | 617 | 0.4% |
| Czechoslovakian | 61 | 0.0% |
| Danish | 471 | 0.3% |
| Delaware | 7 | 0.0% |
| Dominican | 352 | 0.2% |
| Dutch | 2,101 | 1.3% |
| Eastern European | 1,546 | 0.9% |
| Ecuadorian | 86 | 0.1% |
| English | 27,870 | 16.6% |
| Estonian | 24 | 0.0% |
| Ethiopian | 15 | 0.0% |
| European | 3,971 | 2.4% |
| Filipino | 54 | 0.0% |
| Finnish | 275 | 0.2% |
| French | 13,956 | 8.3% |
| French American Indian | 51 | 0.0% |
| French Canadian | 14,078 | 8.4% |
| German | 20,854 | 12.4% |
| German Russian | 38 | 0.0% |
| Ghanaian | 94 | 0.1% |
| Greek | 1,265 | 0.7% |
| Guamanian / Chamorro | 11 | 0.0% |
| Guatemalan | 132 | 0.1% |
| Guyanese | 10 | 0.0% |
| Haitian | 95 | 0.1% |
| Honduran | 18 | 0.0% |
| Hungarian | 780 | 0.5% |
| Indian (Asian) | 1,776 | 1.1% |
| Indonesian | 539 | 0.3% |
| Inupiat | 6 | 0.0% |
| Iranian | 288 | 0.2% |
| Iraqi | 73 | 0.0% |
| Irish | 29,955 | 17.8% |
| Iroquois | 66 | 0.0% |
| Israeli | 59 | 0.0% |
| Italian | 13,939 | 8.3% |
| Jamaican | 442 | 0.3% |
| Japanese | 68 | 0.0% |
| Kenyan | 19 | 0.0% |
| Korean | 1,126 | 0.7% |
| Laotian | 151 | 0.1% |
| Latvian | 62 | 0.0% |
| Lebanese | 419 | 0.3% |
| Lithuanian | 735 | 0.4% |
| Luxembourger | 12 | 0.0% |
| Macedonian | 82 | 0.1% |
| Maltese | 14 | 0.0% |
| Mexican | 755 | 0.4% |
| Mexican American Indian | 11 | 0.0% |
| Mongolian | 8 | 0.0% |
| Moroccan | 5 | 0.0% |
| Native Hawaiian | 45 | 0.0% |
| New Zealander | 43 | 0.0% |
| Nicaraguan | 57 | 0.0% |
| Nigerian | 379 | 0.2% |
| Northern European | 967 | 0.6% |
| Norwegian | 1,558 | 0.9% |
| Okinawan | 21 | 0.0% |
| Pakistani | 158 | 0.1% |
| Palestinian | 52 | 0.0% |
| Panamanian | 15 | 0.0% |
| Paraguayan | 12 | 0.0% |
| Pennsylvania German | 11 | 0.0% |
| Peruvian | 138 | 0.1% |
| Polish | 7,227 | 4.3% |
| Portuguese | 871 | 0.5% |
| Puerto Rican | 624 | 0.4% |
| Romanian | 396 | 0.2% |
| Russian | 2,641 | 1.6% |
| Salvadoran | 41 | 0.0% |
| Samoan | 14 | 0.0% |
| Scandinavian | 677 | 0.4% |
| Scotch-Irish | 1,496 | 0.9% |
| Scottish | 5,768 | 3.4% |
| Senegalese | 48 | 0.0% |
| Serbian | 23 | 0.0% |
| Shoshone | 19 | 0.0% |
| Sioux | 51 | 0.0% |
| Slavic | 66 | 0.0% |
| Slovak | 664 | 0.4% |
| Slovene | 106 | 0.1% |
| Somali | 472 | 0.3% |
| South African | 24 | 0.0% |
| South American | 1,083 | 0.6% |
| South American Indian | 31 | 0.0% |
| Spaniard | 281 | 0.2% |
| Spanish | 280 | 0.2% |
| Sri Lankan | 766 | 0.5% |
| Subsaharan African | 2,203 | 1.3% |
| Sudanese | 18 | 0.0% |
| Swedish | 2,220 | 1.3% |
| Swiss | 459 | 0.3% |
| Syrian | 209 | 0.1% |
| Thai | 1,488 | 0.9% |
| Trinidadian and Tobagonian | 14 | 0.0% |
| Turkish | 178 | 0.1% |
| Ugandan | 17 | 0.0% |
| Ukrainian | 732 | 0.4% |
| Uruguayan | 149 | 0.1% |
| Venezuelan | 188 | 0.1% |
| Vietnamese | 7 | 0.0% |
| Welsh | 1,385 | 0.8% |
| Yaqui | 35 | 0.0% |
| Yugoslavian | 789 | 0.5% | View All 140 Rows |
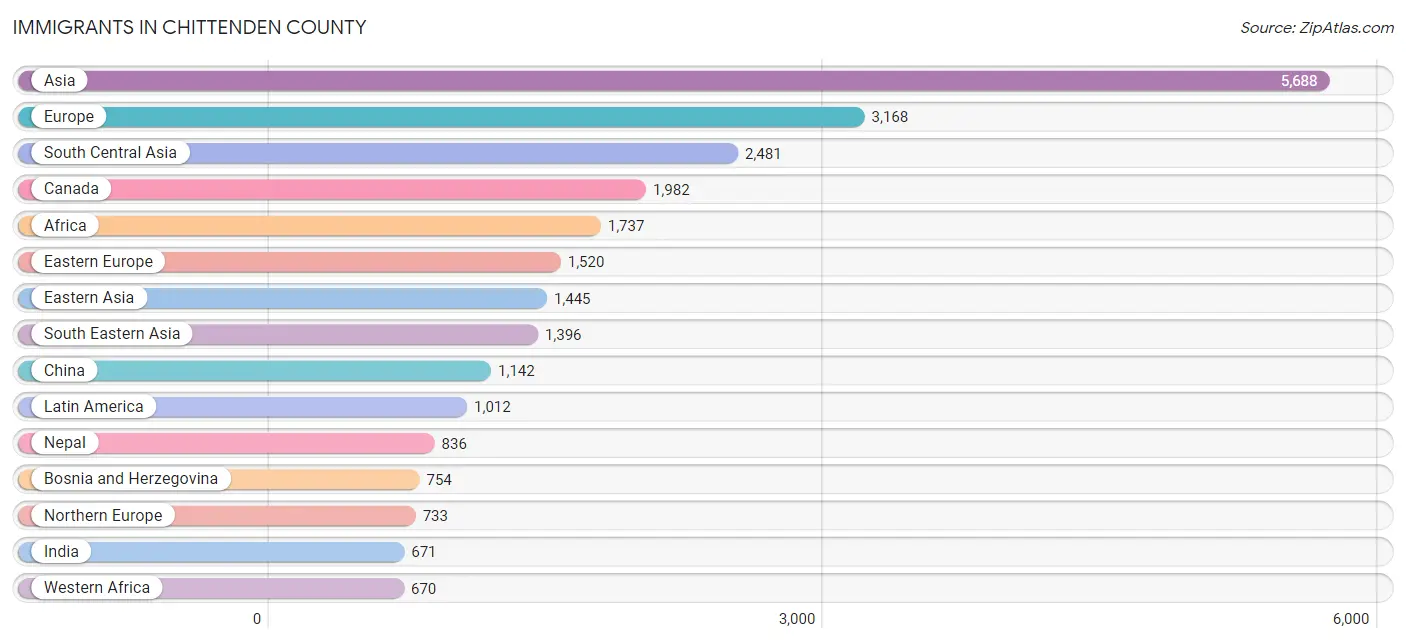
Immigrants in Chittenden County
The most numerous immigrant groups reported in Chittenden County came from Asia (5,688 | 3.4%), Europe (3,168 | 1.9%), South Central Asia (2,481 | 1.5%), Canada (1,982 | 1.2%), and Africa (1,737 | 1.0%), together accounting for 8.9% of all Chittenden County residents.
| Immigration Origin | # Population | % Population |
| Africa | 1,737 | 1.0% |
| Albania | 29 | 0.0% |
| Argentina | 43 | 0.0% |
| Asia | 5,688 | 3.4% |
| Australia | 143 | 0.1% |
| Austria | 27 | 0.0% |
| Bahamas | 11 | 0.0% |
| Bangladesh | 62 | 0.0% |
| Belarus | 5 | 0.0% |
| Belgium | 25 | 0.0% |
| Bosnia and Herzegovina | 754 | 0.4% |
| Brazil | 52 | 0.0% |
| Bulgaria | 23 | 0.0% |
| Cambodia | 54 | 0.0% |
| Canada | 1,982 | 1.2% |
| Caribbean | 331 | 0.2% |
| Central America | 172 | 0.1% |
| Chile | 3 | 0.0% |
| China | 1,142 | 0.7% |
| Colombia | 75 | 0.0% |
| Congo | 12 | 0.0% |
| Croatia | 13 | 0.0% |
| Cuba | 17 | 0.0% |
| Czechoslovakia | 27 | 0.0% |
| Denmark | 5 | 0.0% |
| Dominican Republic | 73 | 0.0% |
| Eastern Africa | 424 | 0.3% |
| Eastern Asia | 1,445 | 0.9% |
| Eastern Europe | 1,520 | 0.9% |
| Ecuador | 39 | 0.0% |
| El Salvador | 18 | 0.0% |
| England | 283 | 0.2% |
| Ethiopia | 15 | 0.0% |
| Europe | 3,168 | 1.9% |
| France | 114 | 0.1% |
| Germany | 355 | 0.2% |
| Ghana | 250 | 0.2% |
| Greece | 106 | 0.1% |
| Guatemala | 70 | 0.0% |
| Haiti | 42 | 0.0% |
| Hong Kong | 30 | 0.0% |
| Hungary | 16 | 0.0% |
| India | 671 | 0.4% |
| Indonesia | 15 | 0.0% |
| Iran | 108 | 0.1% |
| Iraq | 127 | 0.1% |
| Ireland | 88 | 0.1% |
| Israel | 19 | 0.0% |
| Italy | 115 | 0.1% |
| Jamaica | 181 | 0.1% |
| Japan | 79 | 0.1% |
| Kazakhstan | 21 | 0.0% |
| Kenya | 78 | 0.1% |
| Korea | 224 | 0.1% |
| Laos | 12 | 0.0% |
| Latin America | 1,012 | 0.6% |
| Lebanon | 13 | 0.0% |
| Lithuania | 39 | 0.0% |
| Mexico | 57 | 0.0% |
| Middle Africa | 333 | 0.2% |
| Moldova | 118 | 0.1% |
| Morocco | 34 | 0.0% |
| Nepal | 836 | 0.5% |
| Netherlands | 113 | 0.1% |
| Nicaragua | 9 | 0.0% |
| Nigeria | 253 | 0.2% |
| North Macedonia | 36 | 0.0% |
| Northern Africa | 193 | 0.1% |
| Northern Europe | 733 | 0.4% |
| Norway | 7 | 0.0% |
| Oceania | 150 | 0.1% |
| Panama | 18 | 0.0% |
| Peru | 94 | 0.1% |
| Philippines | 314 | 0.2% |
| Poland | 92 | 0.1% |
| Portugal | 7 | 0.0% |
| Romania | 31 | 0.0% |
| Russia | 172 | 0.1% |
| Scotland | 9 | 0.0% |
| Senegal | 48 | 0.0% |
| Singapore | 21 | 0.0% |
| Somalia | 235 | 0.1% |
| South Africa | 97 | 0.1% |
| South America | 509 | 0.3% |
| South Central Asia | 2,481 | 1.5% |
| South Eastern Asia | 1,396 | 0.8% |
| Southern Europe | 264 | 0.2% |
| Spain | 36 | 0.0% |
| Sri Lanka | 26 | 0.0% |
| Sudan | 159 | 0.1% |
| Sweden | 73 | 0.0% |
| Switzerland | 8 | 0.0% |
| Taiwan | 138 | 0.1% |
| Thailand | 239 | 0.1% |
| Turkey | 178 | 0.1% |
| Uganda | 23 | 0.0% |
| Ukraine | 61 | 0.0% |
| Uruguay | 131 | 0.1% |
| Uzbekistan | 32 | 0.0% |
| Venezuela | 72 | 0.0% |
| Vietnam | 398 | 0.2% |
| Western Africa | 670 | 0.4% |
| Western Asia | 366 | 0.2% |
| Western Europe | 651 | 0.4% |
| Zaire | 321 | 0.2% | View All 105 Rows |
Sex and Age in Chittenden County
Sex and Age in Chittenden County
The most populous age groups in Chittenden County are 20 to 24 Years (9,182 | 11.1%) for men and 20 to 24 Years (9,400 | 11.0%) for women.
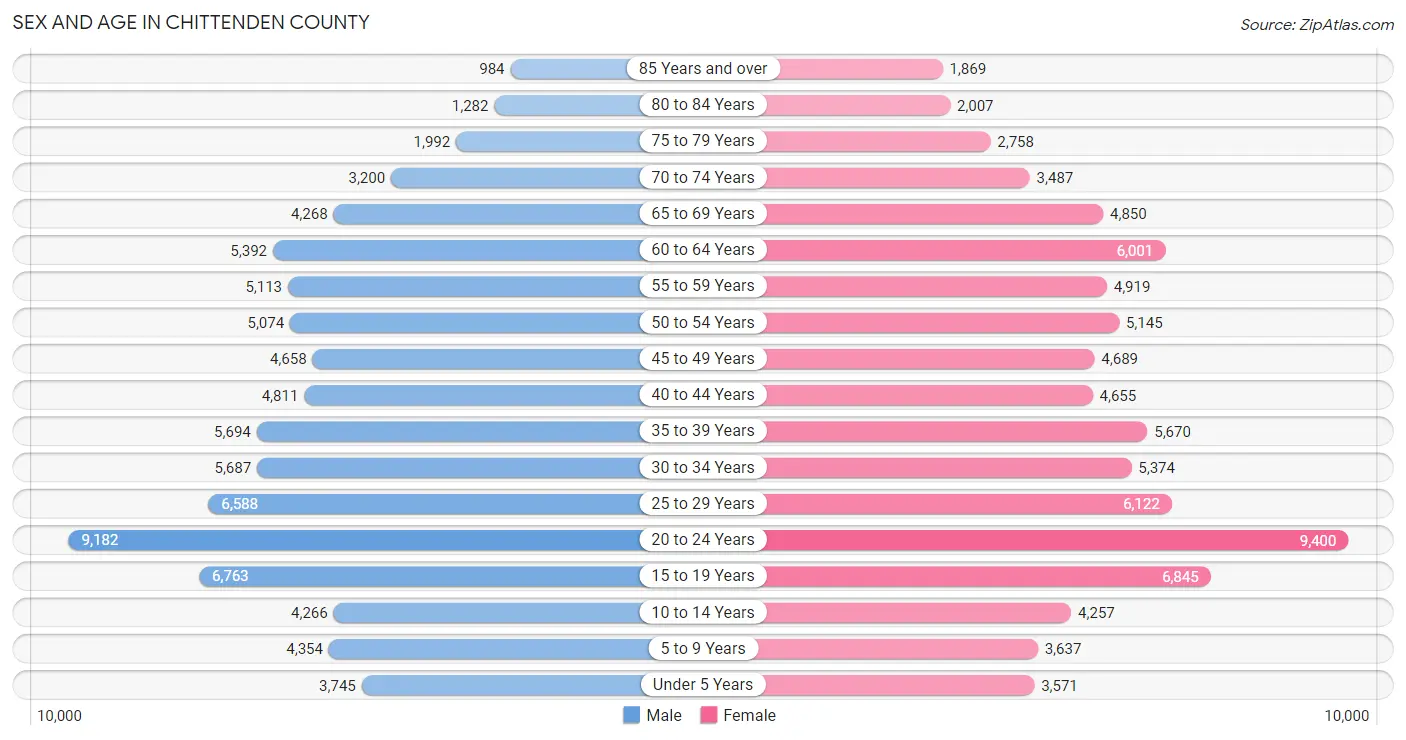
| Age Bracket | Male | Female |
| Under 5 Years | 3,745 (4.5%) | 3,571 (4.2%) |
| 5 to 9 Years | 4,354 (5.2%) | 3,637 (4.3%) |
| 10 to 14 Years | 4,266 (5.1%) | 4,257 (5.0%) |
| 15 to 19 Years | 6,763 (8.1%) | 6,845 (8.0%) |
| 20 to 24 Years | 9,182 (11.1%) | 9,400 (11.0%) |
| 25 to 29 Years | 6,588 (7.9%) | 6,122 (7.2%) |
| 30 to 34 Years | 5,687 (6.9%) | 5,374 (6.3%) |
| 35 to 39 Years | 5,694 (6.9%) | 5,670 (6.7%) |
| 40 to 44 Years | 4,811 (5.8%) | 4,655 (5.5%) |
| 45 to 49 Years | 4,658 (5.6%) | 4,689 (5.5%) |
| 50 to 54 Years | 5,074 (6.1%) | 5,145 (6.0%) |
| 55 to 59 Years | 5,113 (6.2%) | 4,919 (5.8%) |
| 60 to 64 Years | 5,392 (6.5%) | 6,001 (7.0%) |
| 65 to 69 Years | 4,268 (5.1%) | 4,850 (5.7%) |
| 70 to 74 Years | 3,200 (3.8%) | 3,487 (4.1%) |
| 75 to 79 Years | 1,992 (2.4%) | 2,758 (3.2%) |
| 80 to 84 Years | 1,282 (1.5%) | 2,007 (2.4%) |
| 85 Years and over | 984 (1.2%) | 1,869 (2.2%) |
| Total | 83,053 (100.0%) | 85,256 (100.0%) |
Families and Households in Chittenden County
Median Family Size in Chittenden County
The median family size in Chittenden County is 2.86 persons per family, with married-couple families (31,032 | 79.9%) accounting for the largest median family size of 2.9 persons per family. On the other hand, single female/mother families (5,385 | 13.9%) represent the smallest median family size with 2.62 persons per family.
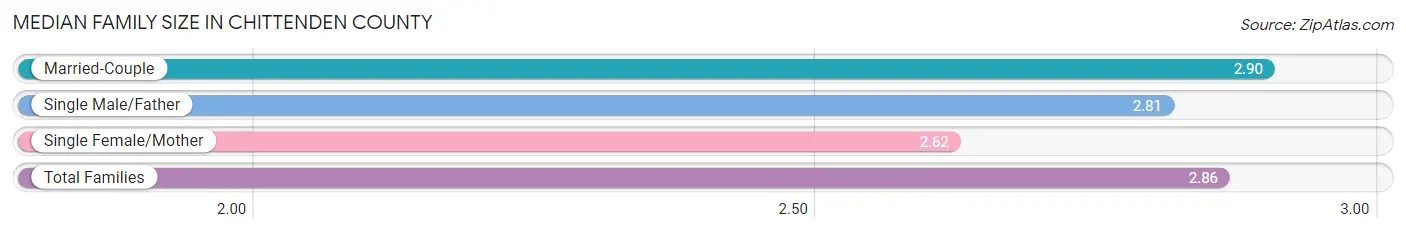
| Family Type | # Families | Family Size |
| Married-Couple | 31,032 (79.9%) | 2.90 |
| Single Male/Father | 2,396 (6.2%) | 2.81 |
| Single Female/Mother | 5,385 (13.9%) | 2.62 |
| Total Families | 38,813 (100.0%) | 2.86 |
Median Household Size in Chittenden County
The median household size in Chittenden County is 2.29 persons per household, with single male/father households (2,396 | 3.5%) accounting for the largest median household size of 3.24 persons per household. non-family households (30,505 | 44.0%) represent the smallest median household size with 1.47 persons per household.
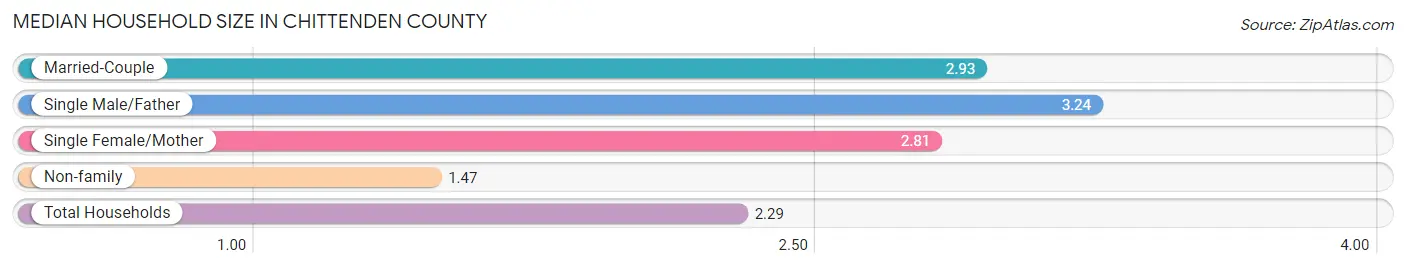
| Household Type | # Households | Household Size |
| Married-Couple | 31,032 (44.8%) | 2.93 |
| Single Male/Father | 2,396 (3.5%) | 3.24 |
| Single Female/Mother | 5,385 (7.8%) | 2.81 |
| Non-family | 30,505 (44.0%) | 1.47 |
| Total Households | 69,318 (100.0%) | 2.29 |
Household Size by Marriage Status in Chittenden County
Out of a total of 69,318 households in Chittenden County, 38,813 (56.0%) are family households, while 30,505 (44.0%) are nonfamily households. The most numerous type of family households are 2-person households, comprising 19,092, and the most common type of nonfamily households are 1-person households, comprising 20,460.
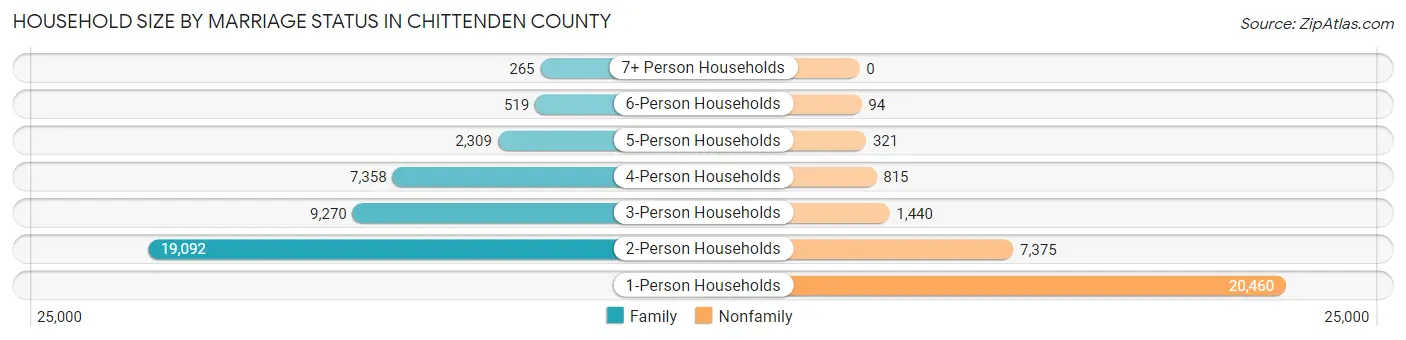
| Household Size | Family Households | Nonfamily Households |
| 1-Person Households | - | 20,460 (29.5%) |
| 2-Person Households | 19,092 (27.5%) | 7,375 (10.6%) |
| 3-Person Households | 9,270 (13.4%) | 1,440 (2.1%) |
| 4-Person Households | 7,358 (10.6%) | 815 (1.2%) |
| 5-Person Households | 2,309 (3.3%) | 321 (0.5%) |
| 6-Person Households | 519 (0.7%) | 94 (0.1%) |
| 7+ Person Households | 265 (0.4%) | 0 (0.0%) |
| Total | 38,813 (56.0%) | 30,505 (44.0%) |
Female Fertility in Chittenden County
Fertility by Age in Chittenden County
Average fertility rate in Chittenden County is 42.0 births per 1,000 women. Women in the age bracket of 20 to 34 years have the highest fertility rate with 63.0 births per 1,000 women. Women in the age bracket of 20 to 34 years acount for 71.2% of all women with births.
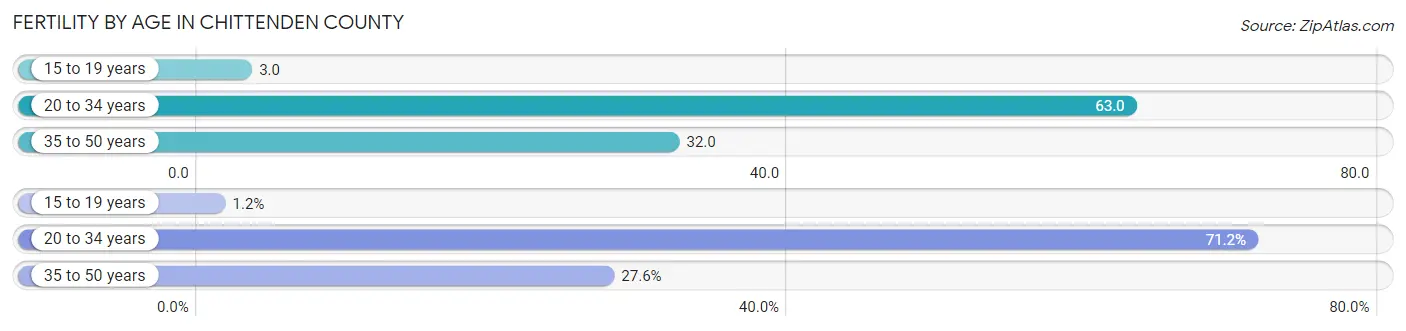
| Age Bracket | Women with Births | Births / 1,000 Women |
| 15 to 19 years | 22 (1.2%) | 3.0 |
| 20 to 34 years | 1,320 (71.2%) | 63.0 |
| 35 to 50 years | 511 (27.6%) | 32.0 |
| Total | 1,853 (100.0%) | 42.0 |
Fertility by Age by Marriage Status in Chittenden County
75.4% of women with births (1,853) in Chittenden County are married. The highest percentage of unmarried women with births falls into 15 to 19 years age bracket with 100.0% of them unmarried at the time of birth, while the lowest percentage of unmarried women with births belong to 35 to 50 years age bracket with 19.2% of them unmarried.
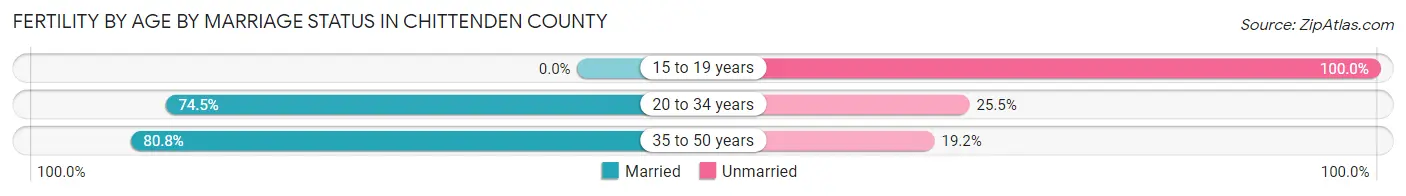
| Age Bracket | Married | Unmarried |
| 15 to 19 years | 0 (0.0%) | 22 (100.0%) |
| 20 to 34 years | 983 (74.5%) | 337 (25.5%) |
| 35 to 50 years | 413 (80.8%) | 98 (19.2%) |
| Total | 1,397 (75.4%) | 456 (24.6%) |
Fertility by Education in Chittenden County
Average fertility rate in Chittenden County is 42.0 births per 1,000 women. Women with the education attainment of graduate degree have the highest fertility rate of 50.0 births per 1,000 women, while women with the education attainment of less than high school have the lowest fertility at 29.0 births per 1,000 women. Women with the education attainment of bachelor's degree represent 32.4% of all women with births.
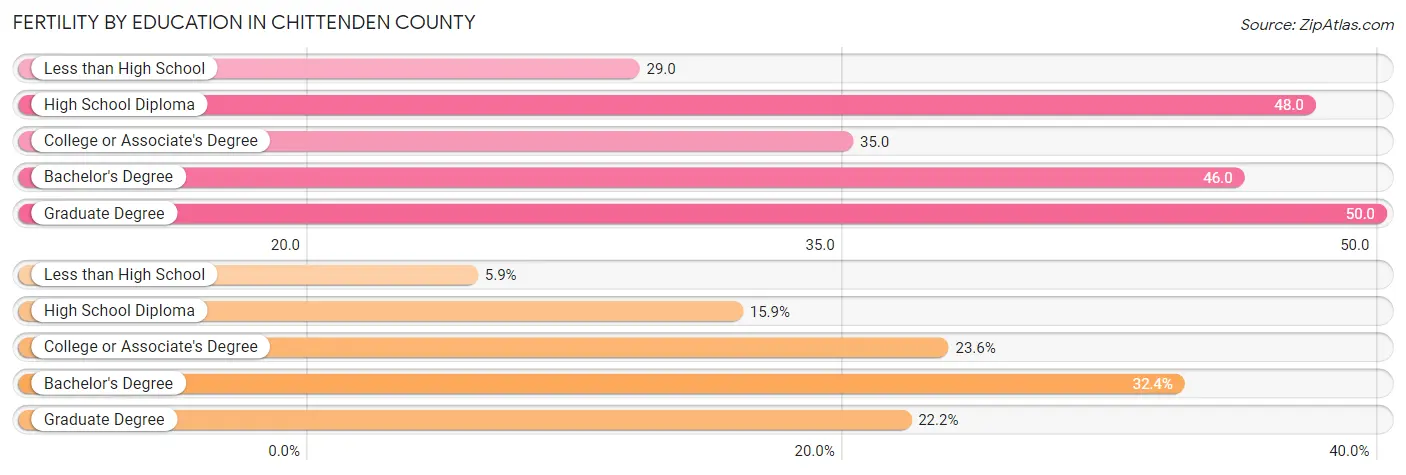
| Educational Attainment | Women with Births | Births / 1,000 Women |
| Less than High School | 110 (5.9%) | 29.0 |
| High School Diploma | 294 (15.9%) | 48.0 |
| College or Associate's Degree | 437 (23.6%) | 35.0 |
| Bachelor's Degree | 601 (32.4%) | 46.0 |
| Graduate Degree | 411 (22.2%) | 50.0 |
| Total | 1,853 (100.0%) | 42.0 |
Fertility by Education by Marriage Status in Chittenden County
24.6% of women with births in Chittenden County are unmarried. Women with the educational attainment of graduate degree are most likely to be married with 92.9% of them married at childbirth, while women with the educational attainment of less than high school are least likely to be married with 82.7% of them unmarried at childbirth.
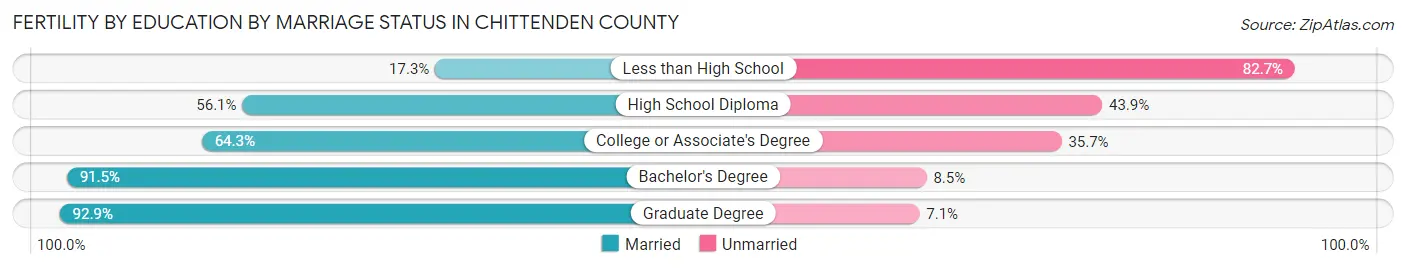
| Educational Attainment | Married | Unmarried |
| Less than High School | 19 (17.3%) | 91 (82.7%) |
| High School Diploma | 165 (56.1%) | 129 (43.9%) |
| College or Associate's Degree | 281 (64.3%) | 156 (35.7%) |
| Bachelor's Degree | 550 (91.5%) | 51 (8.5%) |
| Graduate Degree | 382 (92.9%) | 29 (7.1%) |
| Total | 1,397 (75.4%) | 456 (24.6%) |
Income in Chittenden County
Income Overview in Chittenden County
Per Capita Income in Chittenden County is $47,458, while median incomes of families and households are $118,949 and $89,494 respectively.
| Characteristic | Number | Measure |
| Per Capita Income | 168,309 | $47,458 |
| Median Family Income | 38,813 | $118,949 |
| Mean Family Income | 38,813 | $144,892 |
| Median Household Income | 69,318 | $89,494 |
| Mean Household Income | 69,318 | $114,146 |
| Income Deficit | 38,813 | $10,210 |
| Wage / Income Gap (%) | 168,309 | 24.06% |
| Wage / Income Gap ($) | 168,309 | 75.94¢ per $1 |
| Gini / Inequality Index | 168,309 | 0.44 |
Earnings by Sex in Chittenden County
Average Earnings in Chittenden County are $43,755, $50,637 for men and $38,454 for women, a difference of 24.1%.
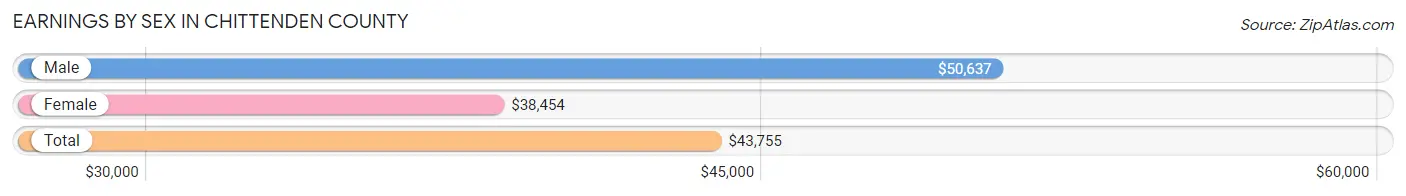
| Sex | Number | Average Earnings |
| Male | 55,643 (50.9%) | $50,637 |
| Female | 53,559 (49.0%) | $38,454 |
| Total | 109,202 (100.0%) | $43,755 |
Earnings by Sex by Income Bracket in Chittenden County
The most common earnings brackets in Chittenden County are $100,000+ for men (10,961 | 19.7%) and $100,000+ for women (5,523 | 10.3%).
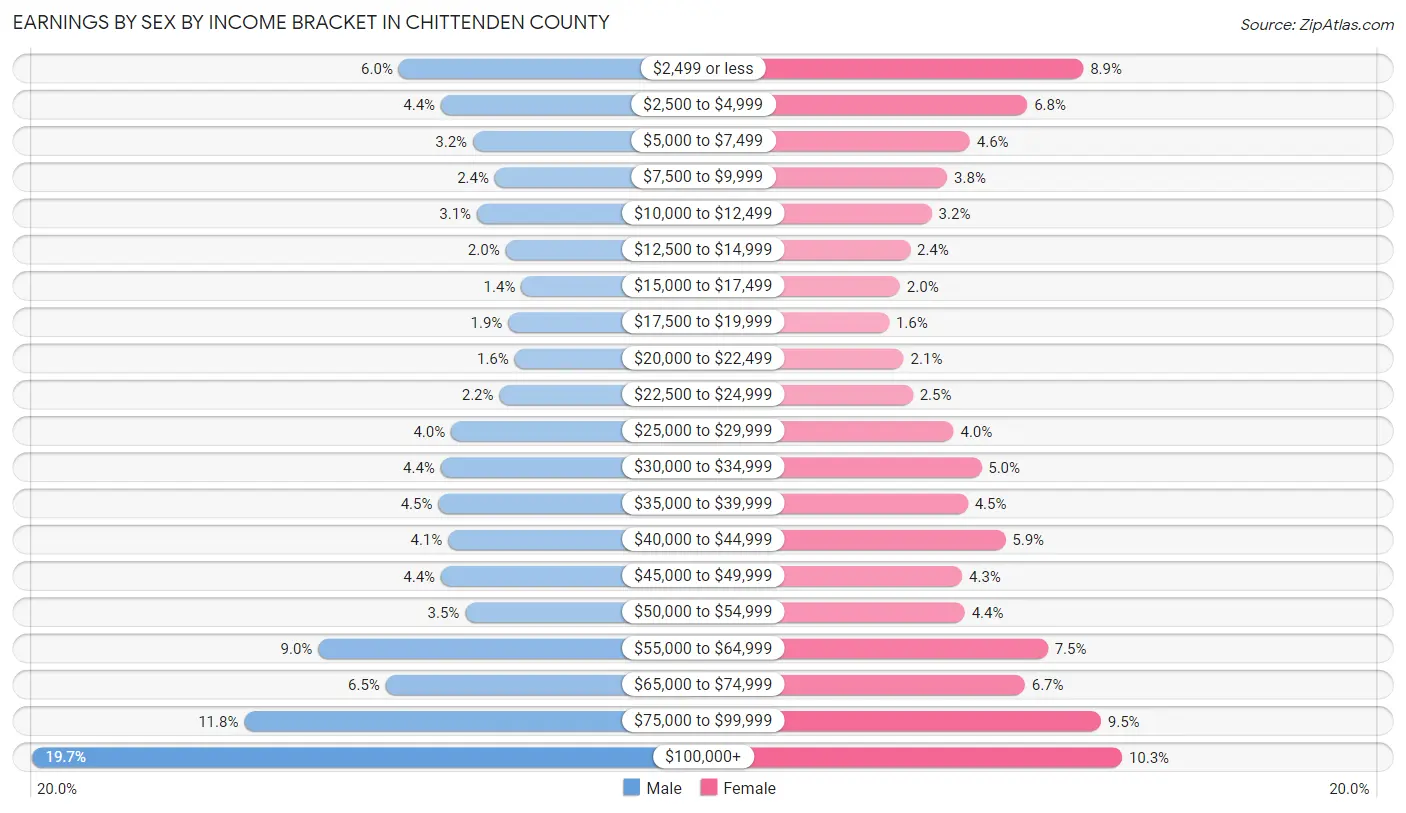
| Income | Male | Female |
| $2,499 or less | 3,330 (6.0%) | 4,748 (8.9%) |
| $2,500 to $4,999 | 2,451 (4.4%) | 3,622 (6.8%) |
| $5,000 to $7,499 | 1,783 (3.2%) | 2,470 (4.6%) |
| $7,500 to $9,999 | 1,325 (2.4%) | 2,016 (3.8%) |
| $10,000 to $12,499 | 1,697 (3.0%) | 1,701 (3.2%) |
| $12,500 to $14,999 | 1,102 (2.0%) | 1,269 (2.4%) |
| $15,000 to $17,499 | 772 (1.4%) | 1,068 (2.0%) |
| $17,500 to $19,999 | 1,044 (1.9%) | 846 (1.6%) |
| $20,000 to $22,499 | 910 (1.6%) | 1,142 (2.1%) |
| $22,500 to $24,999 | 1,231 (2.2%) | 1,325 (2.5%) |
| $25,000 to $29,999 | 2,236 (4.0%) | 2,140 (4.0%) |
| $30,000 to $34,999 | 2,456 (4.4%) | 2,697 (5.0%) |
| $35,000 to $39,999 | 2,503 (4.5%) | 2,424 (4.5%) |
| $40,000 to $44,999 | 2,296 (4.1%) | 3,180 (5.9%) |
| $45,000 to $49,999 | 2,446 (4.4%) | 2,315 (4.3%) |
| $50,000 to $54,999 | 1,944 (3.5%) | 2,369 (4.4%) |
| $55,000 to $64,999 | 5,009 (9.0%) | 4,033 (7.5%) |
| $65,000 to $74,999 | 3,599 (6.5%) | 3,571 (6.7%) |
| $75,000 to $99,999 | 6,548 (11.8%) | 5,100 (9.5%) |
| $100,000+ | 10,961 (19.7%) | 5,523 (10.3%) |
| Total | 55,643 (100.0%) | 53,559 (100.0%) |
Earnings by Sex by Educational Attainment in Chittenden County
Average earnings in Chittenden County are $63,053 for men and $51,034 for women, a difference of 19.1%. Men with an educational attainment of graduate degree enjoy the highest average annual earnings of $95,196, while those with less than high school education earn the least with $32,563. Women with an educational attainment of graduate degree earn the most with the average annual earnings of $70,825, while those with less than high school education have the smallest earnings of $19,890.
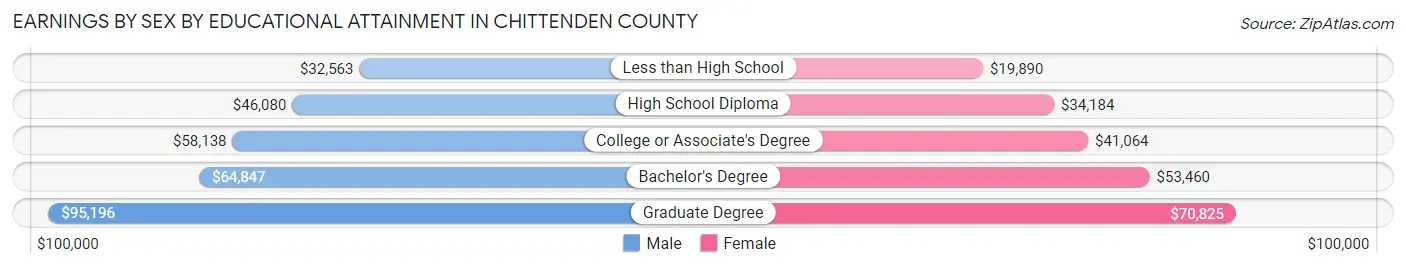
| Educational Attainment | Male Income | Female Income |
| Less than High School | $32,563 | $19,890 |
| High School Diploma | $46,080 | $34,184 |
| College or Associate's Degree | $58,138 | $41,064 |
| Bachelor's Degree | $64,847 | $53,460 |
| Graduate Degree | $95,196 | $70,825 |
| Total | $63,053 | $51,034 |
Family Income in Chittenden County
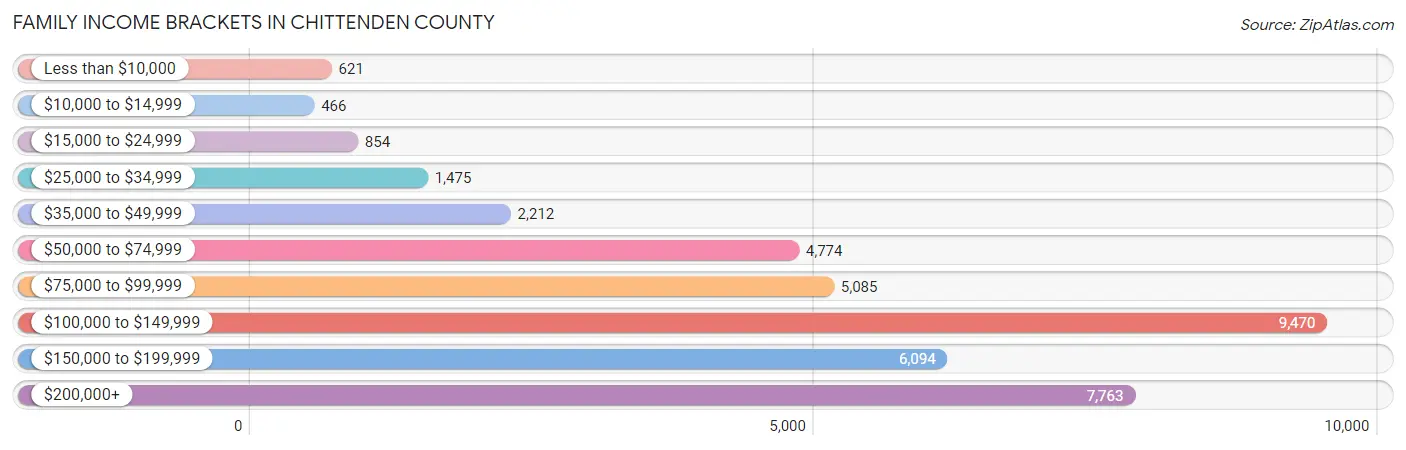
Family Income Brackets in Chittenden County
According to the Chittenden County family income data, there are 9,470 families falling into the $100,000 to $149,999 income range, which is the most common income bracket and makes up 24.4% of all families. Conversely, the $10,000 to $14,999 income bracket is the least frequent group with only 466 families (1.2%) belonging to this category.
| Income Bracket | # Families | % Families |
| Less than $10,000 | 621 | 1.6% |
| $10,000 to $14,999 | 466 | 1.2% |
| $15,000 to $24,999 | 854 | 2.2% |
| $25,000 to $34,999 | 1,475 | 3.8% |
| $35,000 to $49,999 | 2,212 | 5.7% |
| $50,000 to $74,999 | 4,774 | 12.3% |
| $75,000 to $99,999 | 5,085 | 13.1% |
| $100,000 to $149,999 | 9,470 | 24.4% |
| $150,000 to $199,999 | 6,094 | 15.7% |
| $200,000+ | 7,763 | 20.0% |
Family Income by Famaliy Size in Chittenden County
5-person families (1,954 | 5.0%) account for the highest median family income in Chittenden County with $160,466 per family, while 2-person families (20,320 | 52.3%) have the highest median income of $51,372 per family member.
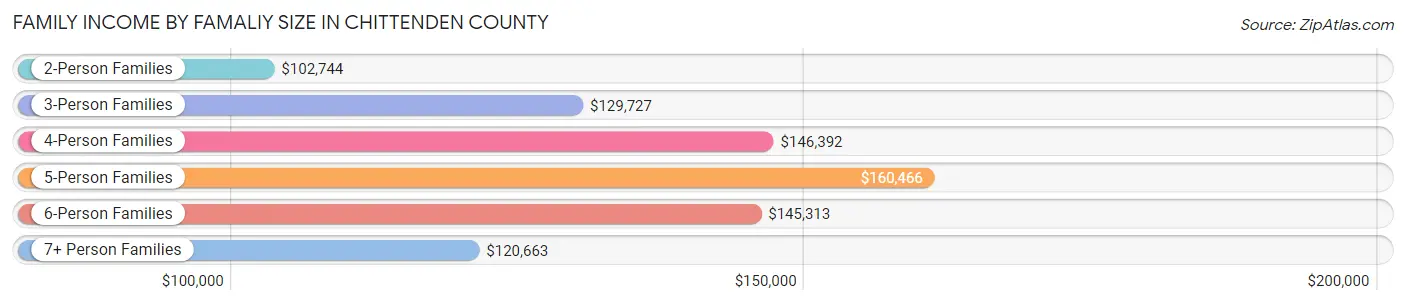
| Income Bracket | # Families | Median Income |
| 2-Person Families | 20,320 (52.3%) | $102,744 |
| 3-Person Families | 8,643 (22.3%) | $129,727 |
| 4-Person Families | 7,234 (18.6%) | $146,392 |
| 5-Person Families | 1,954 (5.0%) | $160,466 |
| 6-Person Families | 436 (1.1%) | $145,313 |
| 7+ Person Families | 226 (0.6%) | $120,663 |
| Total | 38,813 (100.0%) | $118,949 |
Family Income by Number of Earners in Chittenden County
The median family income in Chittenden County is $118,949, with families comprising 3+ earners (4,665) having the highest median family income of $179,242, while families with no earners (4,716) have the lowest median family income of $68,456, accounting for 12.0% and 12.1% of families, respectively.
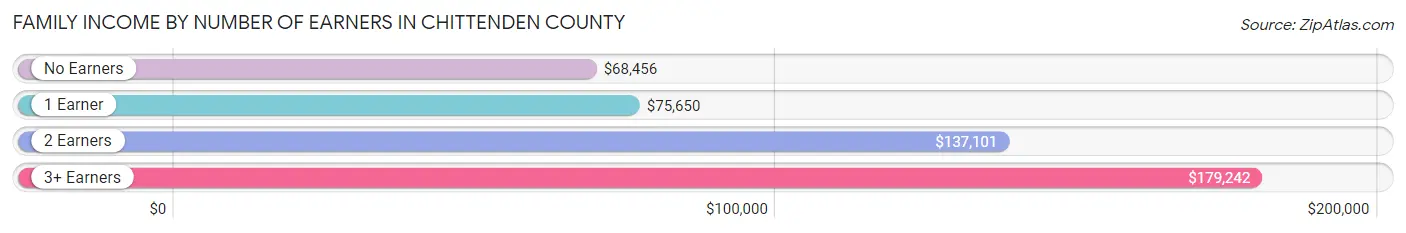
| Number of Earners | # Families | Median Income |
| No Earners | 4,716 (12.1%) | $68,456 |
| 1 Earner | 9,276 (23.9%) | $75,650 |
| 2 Earners | 20,156 (51.9%) | $137,101 |
| 3+ Earners | 4,665 (12.0%) | $179,242 |
| Total | 38,813 (100.0%) | $118,949 |
Household Income in Chittenden County
Household Income Brackets in Chittenden County
With 13,794 households falling in the category, the $100,000 to $149,999 income range is the most frequent in Chittenden County, accounting for 19.9% of all households. In contrast, only 2,287 households (3.3%) fall into the $10,000 to $14,999 income bracket, making it the least populous group.
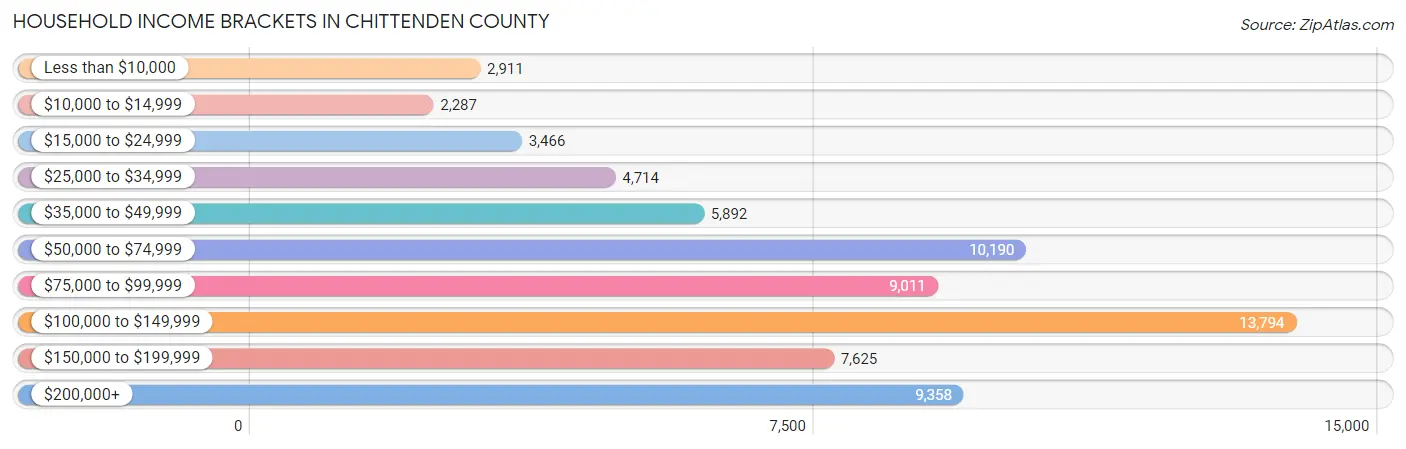
| Income Bracket | # Households | % Households |
| Less than $10,000 | 2,911 | 4.2% |
| $10,000 to $14,999 | 2,287 | 3.3% |
| $15,000 to $24,999 | 3,466 | 5.0% |
| $25,000 to $34,999 | 4,714 | 6.8% |
| $35,000 to $49,999 | 5,892 | 8.5% |
| $50,000 to $74,999 | 10,190 | 14.7% |
| $75,000 to $99,999 | 9,011 | 13.0% |
| $100,000 to $149,999 | 13,794 | 19.9% |
| $150,000 to $199,999 | 7,625 | 11.0% |
| $200,000+ | 9,358 | 13.5% |
Household Income by Householder Age in Chittenden County
The median household income in Chittenden County is $89,494, with the highest median household income of $111,114 found in the 45 to 64 years age bracket for the primary householder. A total of 23,676 households (34.2%) fall into this category. Meanwhile, the 15 to 24 years age bracket for the primary householder has the lowest median household income of $37,547, with 5,390 households (7.8%) in this group.
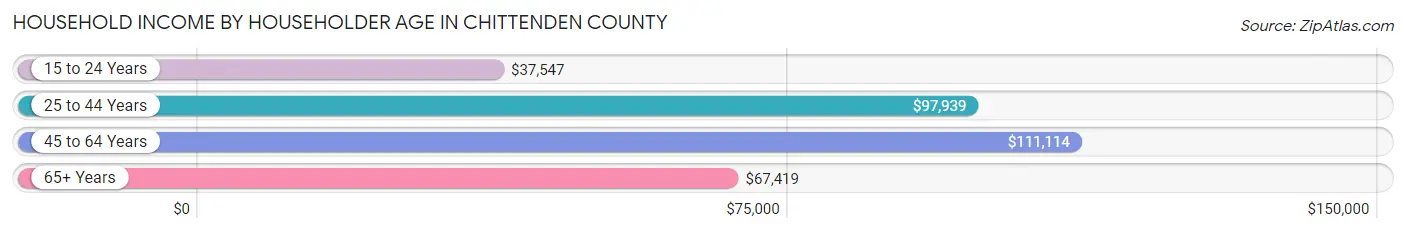
| Income Bracket | # Households | Median Income |
| 15 to 24 Years | 5,390 (7.8%) | $37,547 |
| 25 to 44 Years | 22,934 (33.1%) | $97,939 |
| 45 to 64 Years | 23,676 (34.2%) | $111,114 |
| 65+ Years | 17,318 (25.0%) | $67,419 |
| Total | 69,318 (100.0%) | $89,494 |
Poverty in Chittenden County
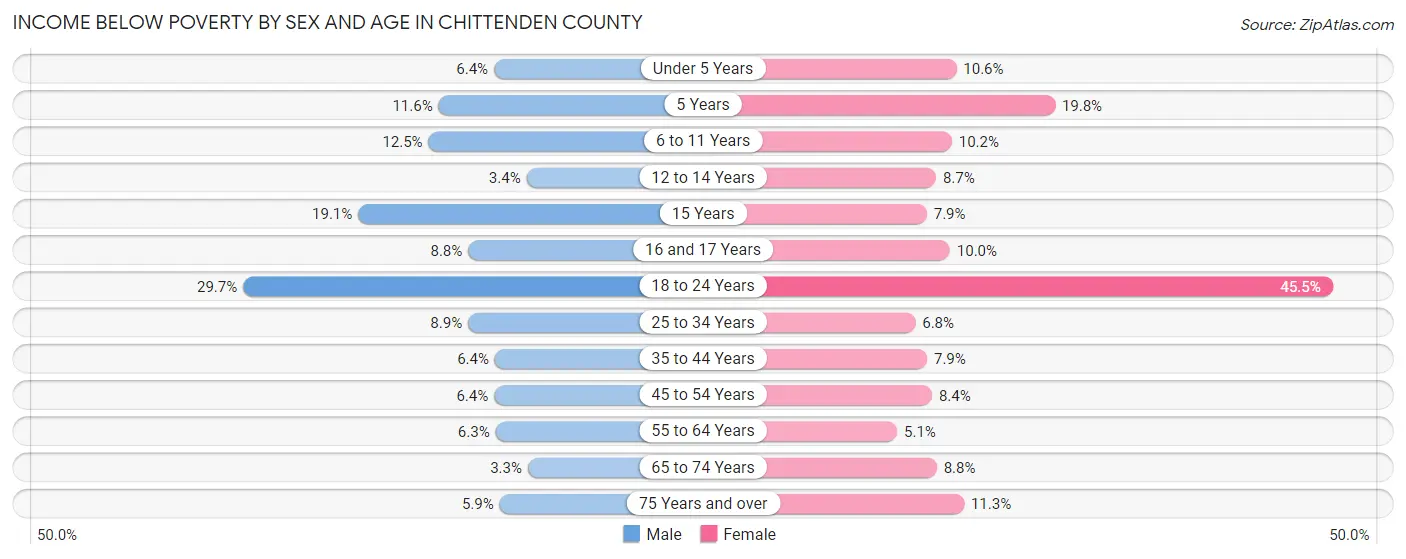
Income Below Poverty by Sex and Age in Chittenden County
With 9.9% poverty level for males and 12.5% for females among the residents of Chittenden County, 18 to 24 year old males and 18 to 24 year old females are the most vulnerable to poverty, with 2,856 males (29.7%) and 4,099 females (45.5%) in their respective age groups living below the poverty level.
| Age Bracket | Male | Female |
| Under 5 Years | 236 (6.4%) | 377 (10.6%) |
| 5 Years | 86 (11.6%) | 162 (19.8%) |
| 6 to 11 Years | 688 (12.5%) | 413 (10.2%) |
| 12 to 14 Years | 80 (3.4%) | 259 (8.7%) |
| 15 Years | 148 (19.1%) | 66 (7.9%) |
| 16 and 17 Years | 187 (8.8%) | 174 (10.0%) |
| 18 to 24 Years | 2,856 (29.7%) | 4,099 (45.5%) |
| 25 to 34 Years | 1,083 (8.8%) | 781 (6.8%) |
| 35 to 44 Years | 668 (6.4%) | 814 (7.9%) |
| 45 to 54 Years | 626 (6.4%) | 819 (8.4%) |
| 55 to 64 Years | 660 (6.3%) | 558 (5.1%) |
| 65 to 74 Years | 245 (3.3%) | 728 (8.8%) |
| 75 Years and over | 244 (5.9%) | 697 (11.3%) |
| Total | 7,807 (9.9%) | 9,947 (12.5%) |
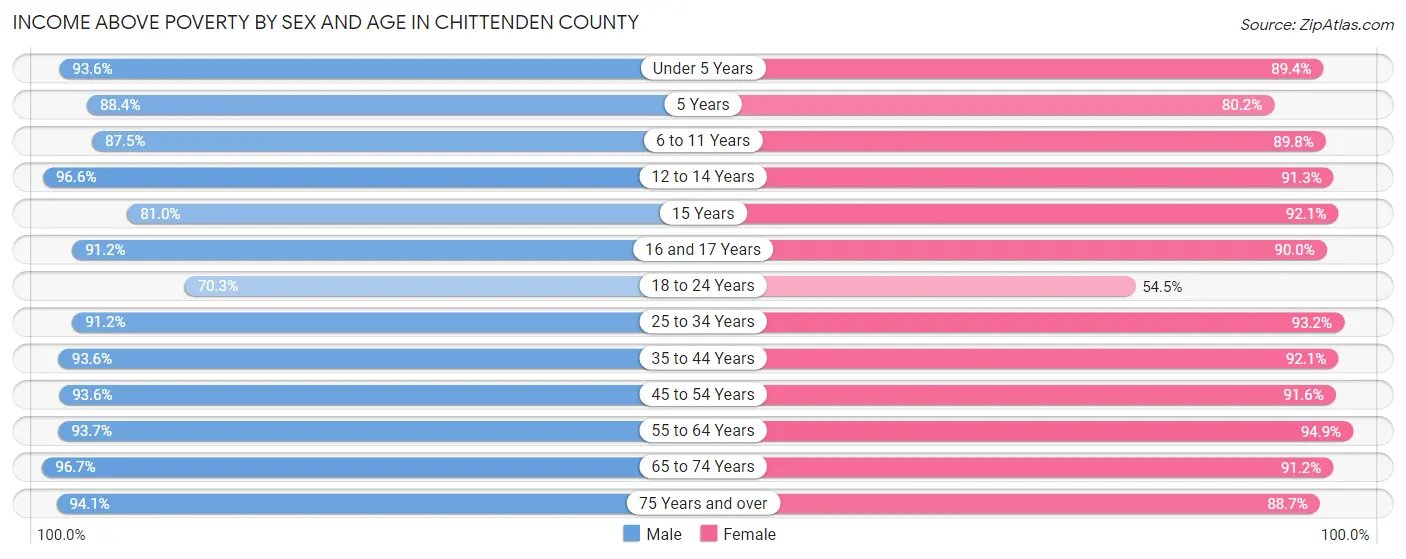
Income Above Poverty by Sex and Age in Chittenden County
According to the poverty statistics in Chittenden County, males aged 65 to 74 years and females aged 55 to 64 years are the age groups that are most secure financially, with 96.7% of males and 94.9% of females in these age groups living above the poverty line.
| Age Bracket | Male | Female |
| Under 5 Years | 3,431 (93.6%) | 3,170 (89.4%) |
| 5 Years | 656 (88.4%) | 657 (80.2%) |
| 6 to 11 Years | 4,807 (87.5%) | 3,631 (89.8%) |
| 12 to 14 Years | 2,259 (96.6%) | 2,706 (91.3%) |
| 15 Years | 629 (80.9%) | 770 (92.1%) |
| 16 and 17 Years | 1,929 (91.2%) | 1,560 (90.0%) |
| 18 to 24 Years | 6,752 (70.3%) | 4,901 (54.5%) |
| 25 to 34 Years | 11,156 (91.1%) | 10,675 (93.2%) |
| 35 to 44 Years | 9,836 (93.6%) | 9,482 (92.1%) |
| 45 to 54 Years | 9,104 (93.6%) | 8,971 (91.6%) |
| 55 to 64 Years | 9,822 (93.7%) | 10,325 (94.9%) |
| 65 to 74 Years | 7,185 (96.7%) | 7,535 (91.2%) |
| 75 Years and over | 3,875 (94.1%) | 5,452 (88.7%) |
| Total | 71,441 (90.1%) | 69,835 (87.5%) |
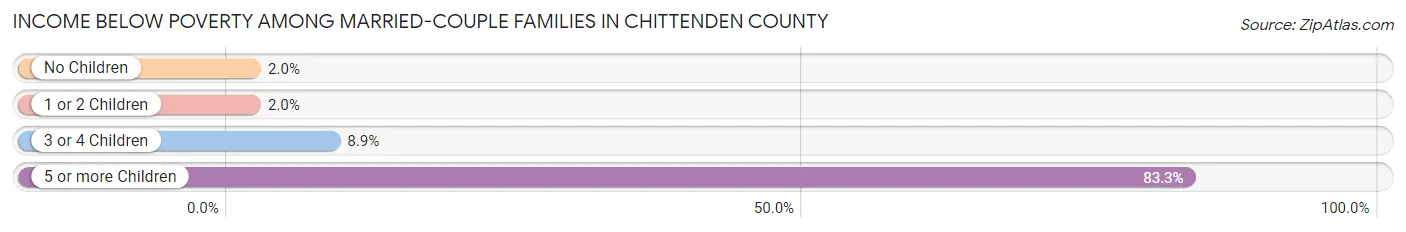
Income Below Poverty Among Married-Couple Families in Chittenden County
The poverty statistics for married-couple families in Chittenden County show that 2.4% or 734 of the total 31,032 families live below the poverty line. Families with 5 or more children have the highest poverty rate of 83.3%, comprising of 20 families. On the other hand, families with 1 or 2 children have the lowest poverty rate of 2.0%, which includes 218 families.
| Children | Above Poverty | Below Poverty |
| No Children | 18,378 (98.0%) | 377 (2.0%) |
| 1 or 2 Children | 10,699 (98.0%) | 218 (2.0%) |
| 3 or 4 Children | 1,217 (91.1%) | 119 (8.9%) |
| 5 or more Children | 4 (16.7%) | 20 (83.3%) |
| Total | 30,298 (97.6%) | 734 (2.4%) |
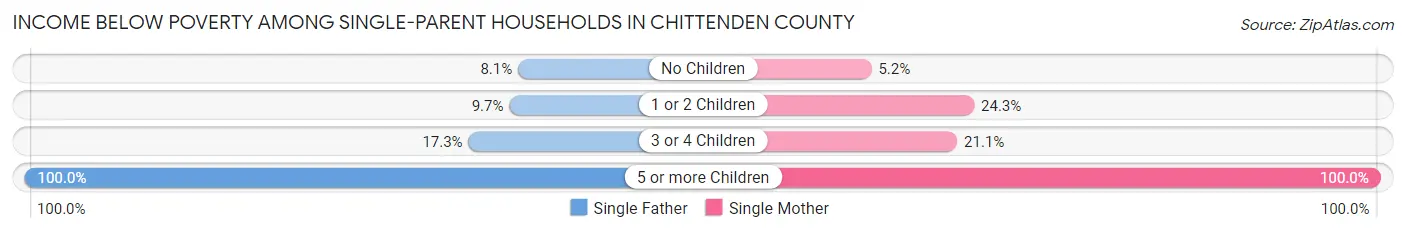
Income Below Poverty Among Single-Parent Households in Chittenden County
According to the poverty data in Chittenden County, 9.6% or 230 single-father households and 16.9% or 908 single-mother households are living below the poverty line. Among single-father households, those with 5 or more children have the highest poverty rate, with 5 households (100.0%) experiencing poverty. Likewise, among single-mother households, those with 5 or more children have the highest poverty rate, with 21 households (100.0%) falling below the poverty line.
| Children | Single Father | Single Mother |
| No Children | 65 (8.1%) | 110 (5.2%) |
| 1 or 2 Children | 147 (9.7%) | 710 (24.3%) |
| 3 or 4 Children | 13 (17.3%) | 67 (21.1%) |
| 5 or more Children | 5 (100.0%) | 21 (100.0%) |
| Total | 230 (9.6%) | 908 (16.9%) |
Income Below Poverty Among Married-Couple vs Single-Parent Households in Chittenden County
The poverty data for Chittenden County shows that 734 of the married-couple family households (2.4%) and 1,138 of the single-parent households (14.6%) are living below the poverty level. Within the married-couple family households, those with 5 or more children have the highest poverty rate, with 20 households (83.3%) falling below the poverty line. Among the single-parent households, those with 5 or more children have the highest poverty rate, with 26 household (100.0%) living below poverty.
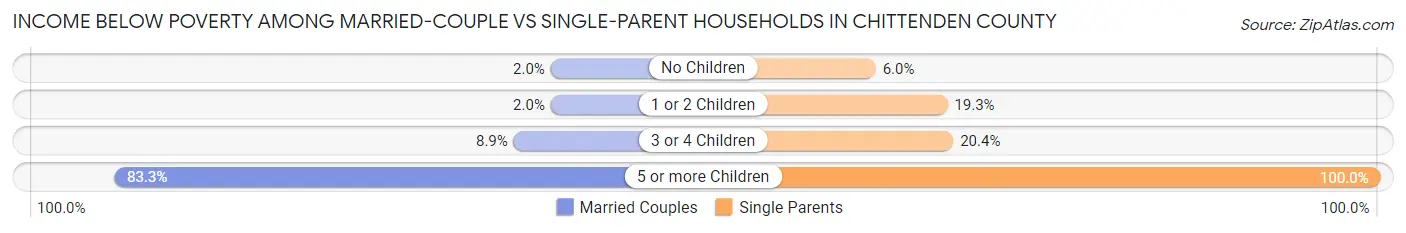
| Children | Married-Couple Families | Single-Parent Households |
| No Children | 377 (2.0%) | 175 (6.0%) |
| 1 or 2 Children | 218 (2.0%) | 857 (19.3%) |
| 3 or 4 Children | 119 (8.9%) | 80 (20.4%) |
| 5 or more Children | 20 (83.3%) | 26 (100.0%) |
| Total | 734 (2.4%) | 1,138 (14.6%) |
Employment Characteristics in Chittenden County
Employment by Class of Employer in Chittenden County
Among the 93,578 employed individuals in Chittenden County, private company employees (52,447 | 56.0%), not-for-profit organizations (16,851 | 18.0%), and local government employees (6,646 | 7.1%) make up the most common classes of employment.
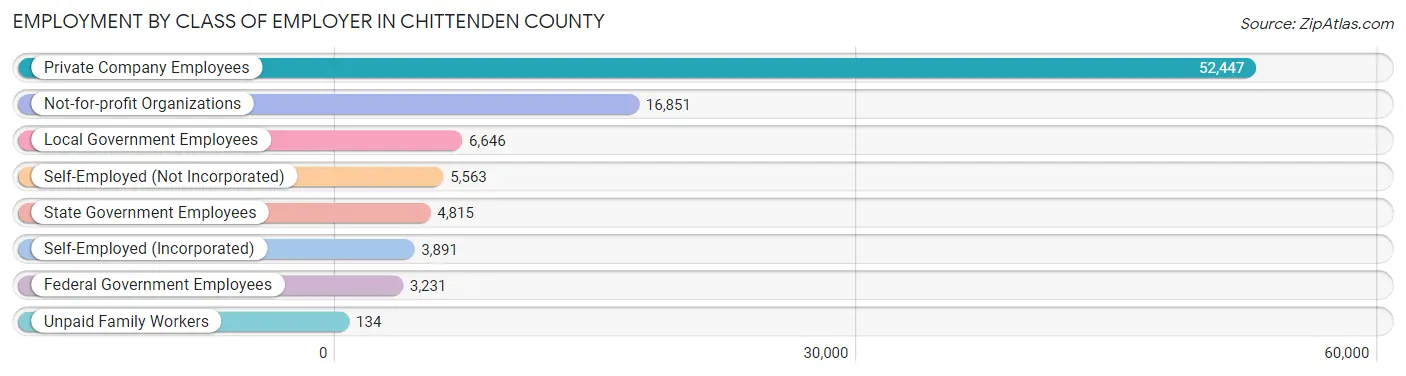
| Employer Class | # Employees | % Employees |
| Private Company Employees | 52,447 | 56.0% |
| Self-Employed (Incorporated) | 3,891 | 4.2% |
| Self-Employed (Not Incorporated) | 5,563 | 5.9% |
| Not-for-profit Organizations | 16,851 | 18.0% |
| Local Government Employees | 6,646 | 7.1% |
| State Government Employees | 4,815 | 5.1% |
| Federal Government Employees | 3,231 | 3.5% |
| Unpaid Family Workers | 134 | 0.1% |
| Total | 93,578 | 100.0% |
Employment Status by Age in Chittenden County
According to the labor force statistics for Chittenden County, out of the total population over 16 years of age (142,866), 69.7% or 99,578 individuals are in the labor force, with 3.9% or 3,884 of them unemployed. The age group with the highest labor force participation rate is 25 to 29 years, with 90.4% or 11,490 individuals in the labor force. Within the labor force, the 16 to 19 years age range has the highest percentage of unemployed individuals, with 11.4% or 576 of them being unemployed.
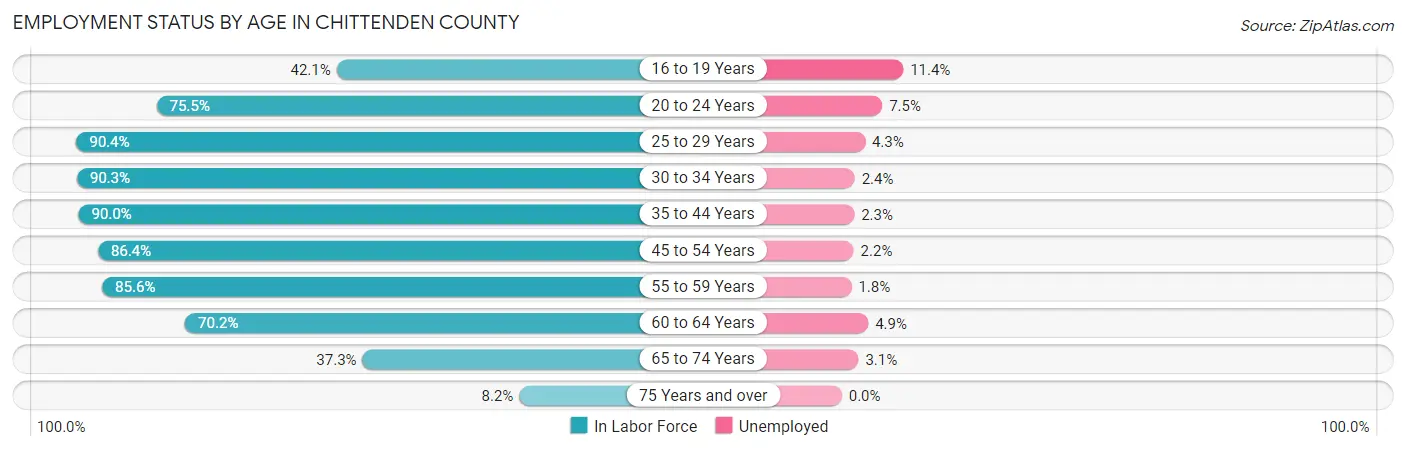
| Age Bracket | In Labor Force | Unemployed |
| 16 to 19 Years | 5,050 (42.1%) | 576 (11.4%) |
| 20 to 24 Years | 14,029 (75.5%) | 1,052 (7.5%) |
| 25 to 29 Years | 11,490 (90.4%) | 494 (4.3%) |
| 30 to 34 Years | 9,988 (90.3%) | 240 (2.4%) |
| 35 to 44 Years | 18,747 (90.0%) | 431 (2.3%) |
| 45 to 54 Years | 16,905 (86.4%) | 372 (2.2%) |
| 55 to 59 Years | 8,587 (85.6%) | 155 (1.8%) |
| 60 to 64 Years | 7,998 (70.2%) | 392 (4.9%) |
| 65 to 74 Years | 5,895 (37.3%) | 183 (3.1%) |
| 75 Years and over | 893 (8.2%) | 0 (0.0%) |
| Total | 99,578 (69.7%) | 3,884 (3.9%) |
Employment Status by Educational Attainment in Chittenden County
According to labor force statistics for Chittenden County, 86.1% of individuals (73,695) out of the total population between 25 and 64 years of age (85,592) are in the labor force, with 2.8% or 2,063 of them being unemployed. The group with the highest labor force participation rate are those with the educational attainment of bachelor's degree or higher, with 91.5% or 45,499 individuals in the labor force. Within the labor force, individuals with less than high school education have the highest percentage of unemployment, with 14.8% or 290 of them being unemployed.
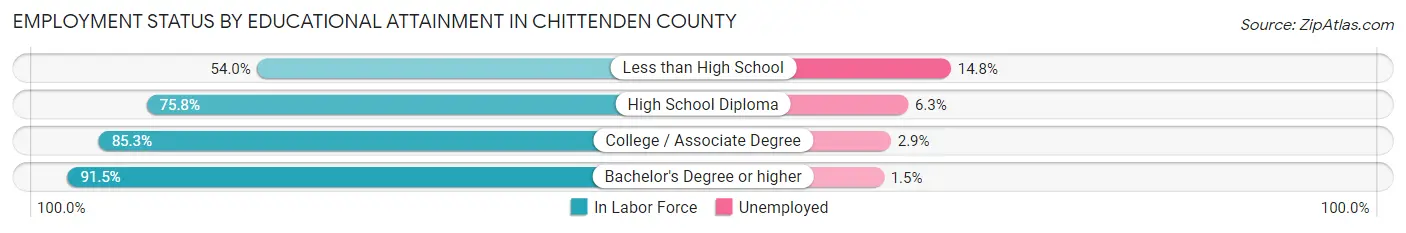
| Educational Attainment | In Labor Force | Unemployed |
| Less than High School | 1,958 (54.0%) | 536 (14.8%) |
| High School Diploma | 10,084 (75.8%) | 838 (6.3%) |
| College / Associate Degree | 16,154 (85.3%) | 549 (2.9%) |
| Bachelor's Degree or higher | 45,499 (91.5%) | 746 (1.5%) |
| Total | 73,695 (86.1%) | 2,397 (2.8%) |
Employment Occupations by Sex in Chittenden County
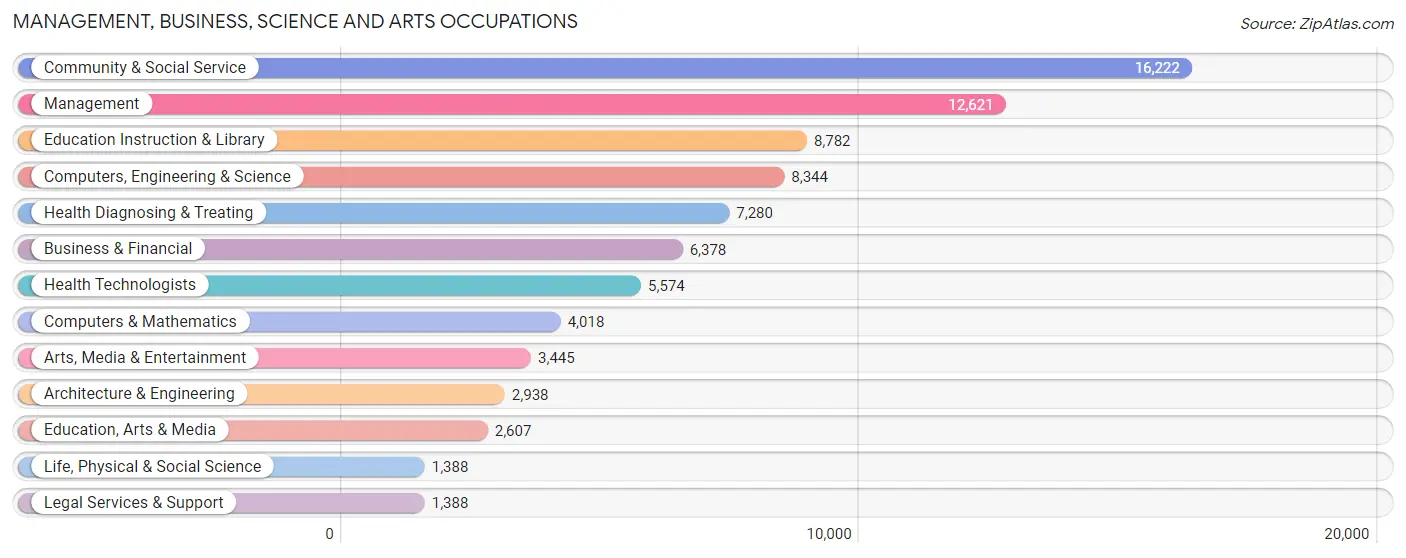
Management, Business, Science and Arts Occupations
The most common Management, Business, Science and Arts occupations in Chittenden County are Community & Social Service (16,222 | 17.0%), Management (12,621 | 13.3%), Education Instruction & Library (8,782 | 9.2%), Computers, Engineering & Science (8,344 | 8.8%), and Health Diagnosing & Treating (7,280 | 7.6%).
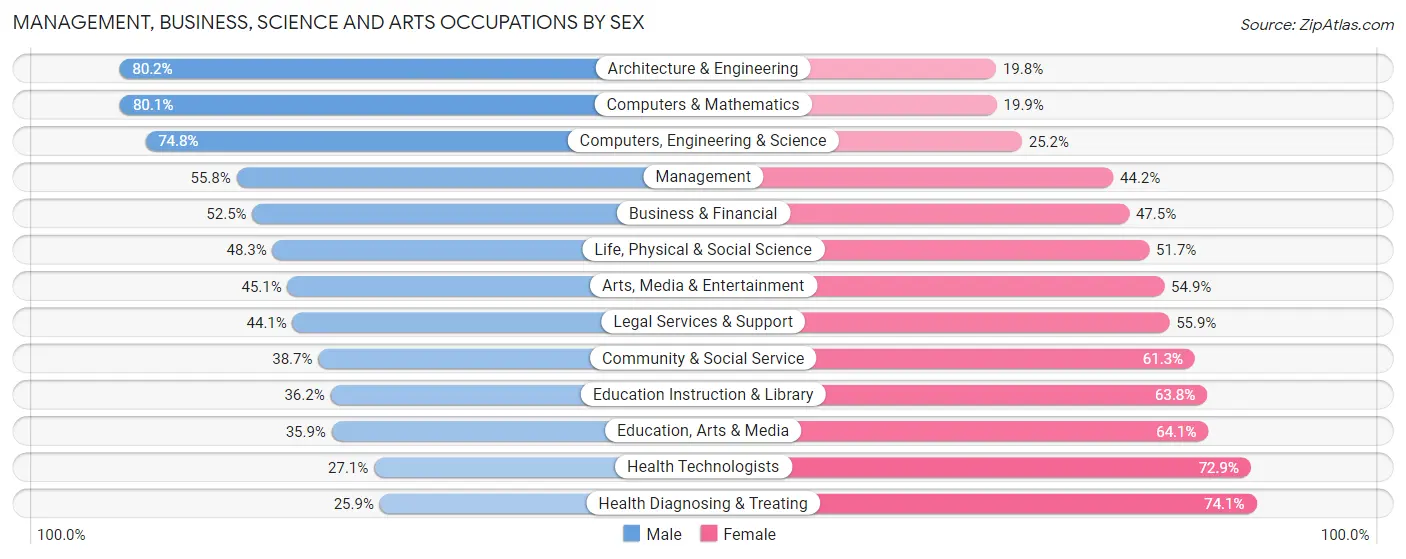
Management, Business, Science and Arts Occupations by Sex
Within the Management, Business, Science and Arts occupations in Chittenden County, the most male-oriented occupations are Architecture & Engineering (80.2%), Computers & Mathematics (80.1%), and Computers, Engineering & Science (74.8%), while the most female-oriented occupations are Health Diagnosing & Treating (74.1%), Health Technologists (72.9%), and Education, Arts & Media (64.1%).
| Occupation | Male | Female |
| Management | 7,041 (55.8%) | 5,580 (44.2%) |
| Business & Financial | 3,347 (52.5%) | 3,031 (47.5%) |
| Computers, Engineering & Science | 6,245 (74.8%) | 2,099 (25.2%) |
| Computers & Mathematics | 3,218 (80.1%) | 800 (19.9%) |
| Architecture & Engineering | 2,357 (80.2%) | 581 (19.8%) |
| Life, Physical & Social Science | 670 (48.3%) | 718 (51.7%) |
| Community & Social Service | 6,282 (38.7%) | 9,940 (61.3%) |
| Education, Arts & Media | 937 (35.9%) | 1,670 (64.1%) |
| Legal Services & Support | 612 (44.1%) | 776 (55.9%) |
| Education Instruction & Library | 3,178 (36.2%) | 5,604 (63.8%) |
| Arts, Media & Entertainment | 1,555 (45.1%) | 1,890 (54.9%) |
| Health Diagnosing & Treating | 1,887 (25.9%) | 5,393 (74.1%) |
| Health Technologists | 1,510 (27.1%) | 4,064 (72.9%) |
| Total (Category) | 24,802 (48.8%) | 26,043 (51.2%) |
| Total (Overall) | 48,608 (51.0%) | 46,665 (49.0%) |
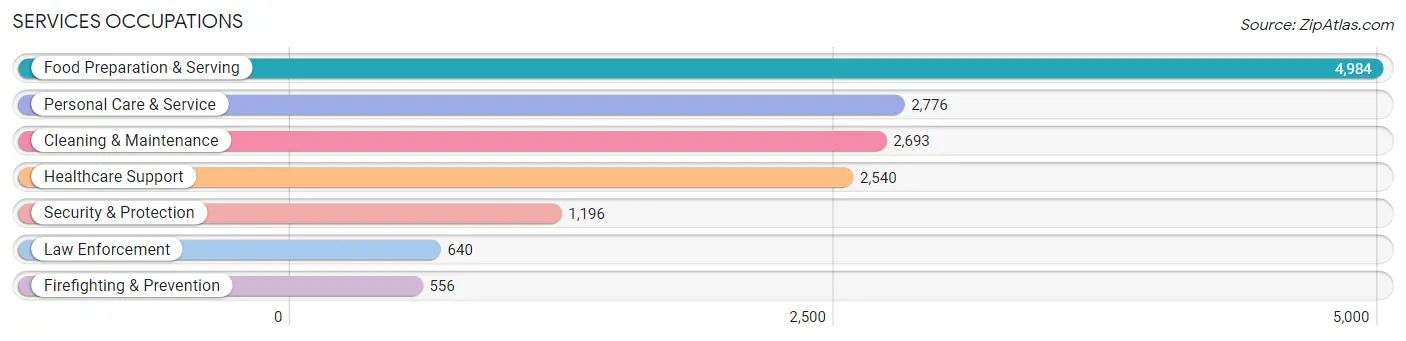
Services Occupations
The most common Services occupations in Chittenden County are Food Preparation & Serving (4,984 | 5.2%), Personal Care & Service (2,776 | 2.9%), Cleaning & Maintenance (2,693 | 2.8%), Healthcare Support (2,540 | 2.7%), and Security & Protection (1,196 | 1.3%).
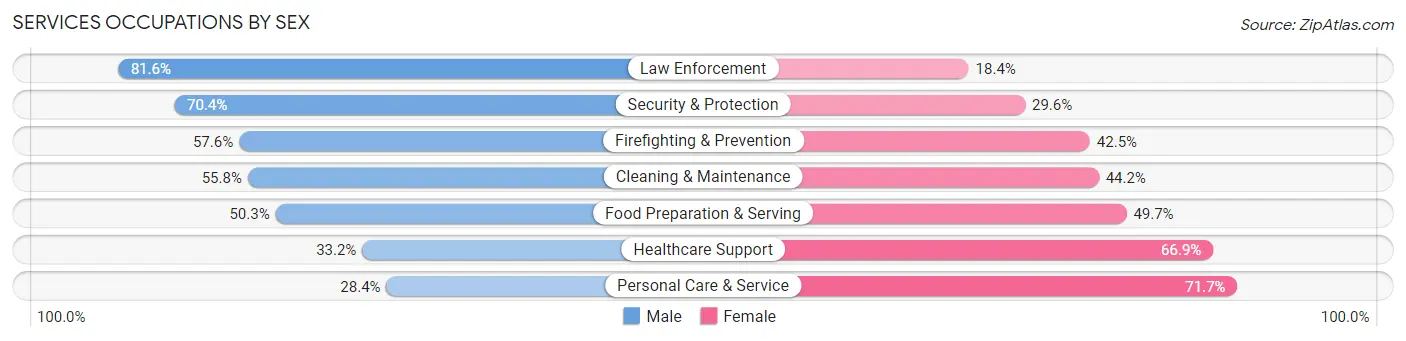
Services Occupations by Sex
Within the Services occupations in Chittenden County, the most male-oriented occupations are Law Enforcement (81.6%), Security & Protection (70.4%), and Firefighting & Prevention (57.6%), while the most female-oriented occupations are Personal Care & Service (71.7%), Healthcare Support (66.8%), and Food Preparation & Serving (49.7%).
| Occupation | Male | Female |
| Healthcare Support | 842 (33.2%) | 1,698 (66.8%) |
| Security & Protection | 842 (70.4%) | 354 (29.6%) |
| Firefighting & Prevention | 320 (57.6%) | 236 (42.4%) |
| Law Enforcement | 522 (81.6%) | 118 (18.4%) |
| Food Preparation & Serving | 2,508 (50.3%) | 2,476 (49.7%) |
| Cleaning & Maintenance | 1,503 (55.8%) | 1,190 (44.2%) |
| Personal Care & Service | 787 (28.3%) | 1,989 (71.7%) |
| Total (Category) | 6,482 (45.7%) | 7,707 (54.3%) |
| Total (Overall) | 48,608 (51.0%) | 46,665 (49.0%) |
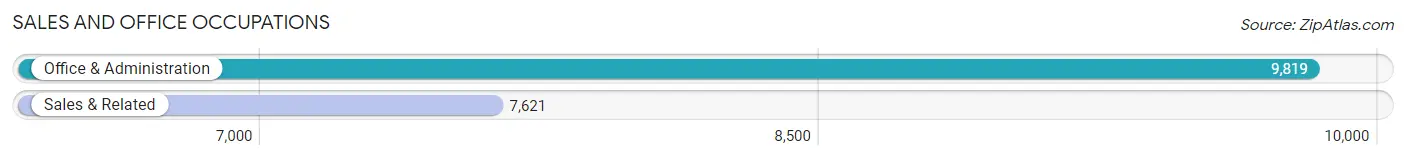
Sales and Office Occupations
The most common Sales and Office occupations in Chittenden County are Office & Administration (9,819 | 10.3%), and Sales & Related (7,621 | 8.0%).
Sales and Office Occupations by Sex
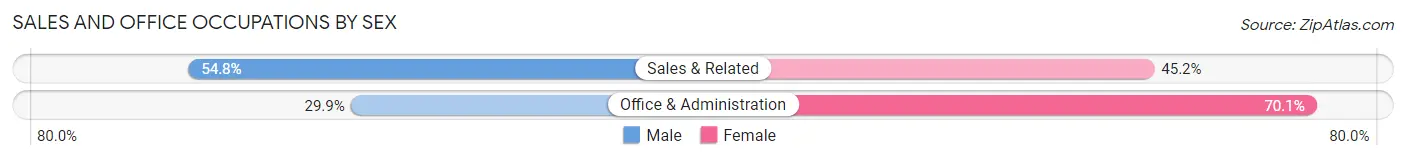
| Occupation | Male | Female |
| Sales & Related | 4,176 (54.8%) | 3,445 (45.2%) |
| Office & Administration | 2,932 (29.9%) | 6,887 (70.1%) |
| Total (Category) | 7,108 (40.8%) | 10,332 (59.2%) |
| Total (Overall) | 48,608 (51.0%) | 46,665 (49.0%) |
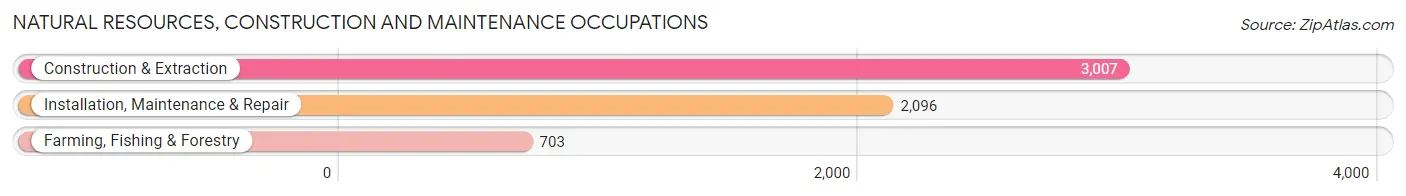
Natural Resources, Construction and Maintenance Occupations
The most common Natural Resources, Construction and Maintenance occupations in Chittenden County are Construction & Extraction (3,007 | 3.2%), Installation, Maintenance & Repair (2,096 | 2.2%), and Farming, Fishing & Forestry (703 | 0.7%).
Natural Resources, Construction and Maintenance Occupations by Sex
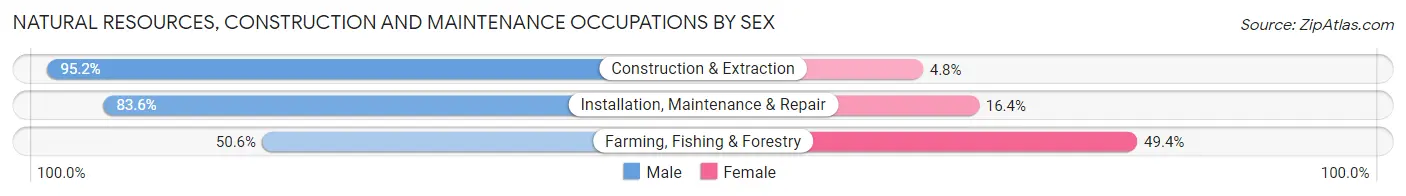
| Occupation | Male | Female |
| Farming, Fishing & Forestry | 356 (50.6%) | 347 (49.4%) |
| Construction & Extraction | 2,864 (95.2%) | 143 (4.8%) |
| Installation, Maintenance & Repair | 1,752 (83.6%) | 344 (16.4%) |
| Total (Category) | 4,972 (85.6%) | 834 (14.4%) |
| Total (Overall) | 48,608 (51.0%) | 46,665 (49.0%) |
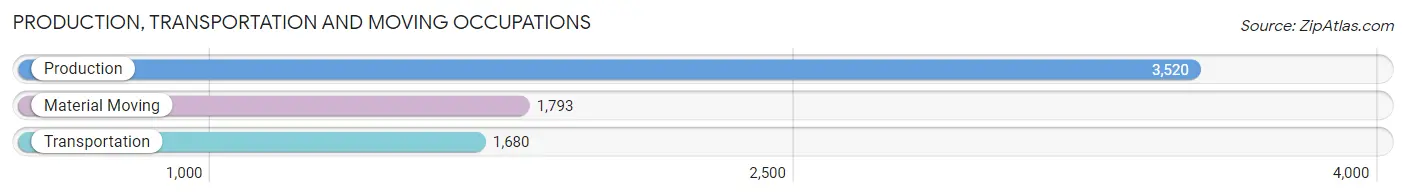
Production, Transportation and Moving Occupations
The most common Production, Transportation and Moving occupations in Chittenden County are Production (3,520 | 3.7%), Material Moving (1,793 | 1.9%), and Transportation (1,680 | 1.8%).
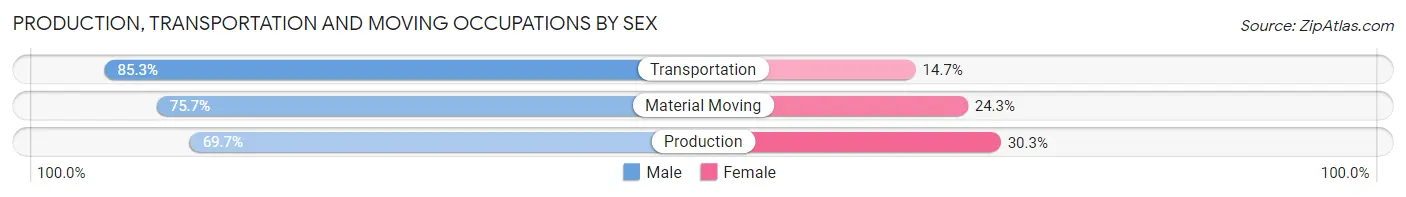
Production, Transportation and Moving Occupations by Sex
| Occupation | Male | Female |
| Production | 2,453 (69.7%) | 1,067 (30.3%) |
| Transportation | 1,433 (85.3%) | 247 (14.7%) |
| Material Moving | 1,358 (75.7%) | 435 (24.3%) |
| Total (Category) | 5,244 (75.0%) | 1,749 (25.0%) |
| Total (Overall) | 48,608 (51.0%) | 46,665 (49.0%) |
Employment Industries by Sex in Chittenden County
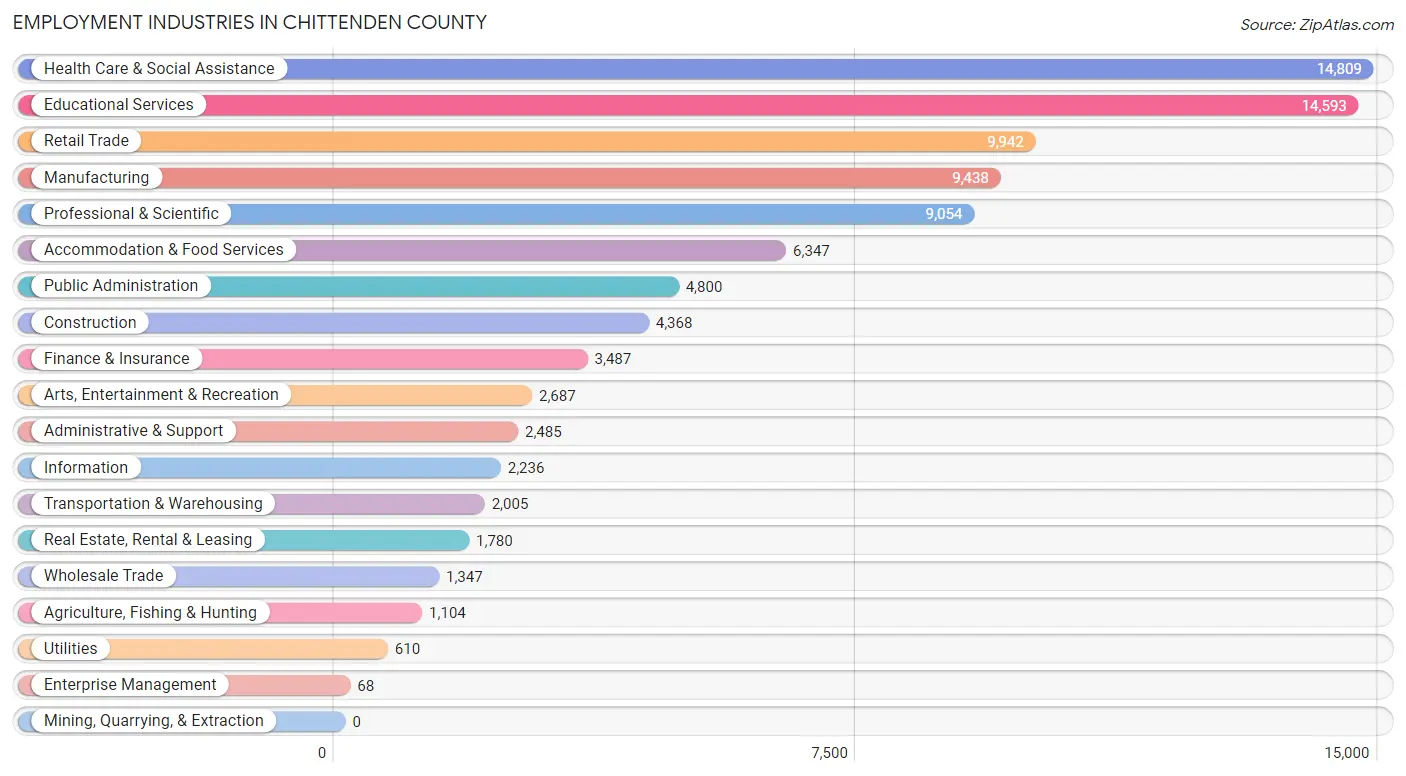
Employment Industries in Chittenden County
The major employment industries in Chittenden County include Health Care & Social Assistance (14,809 | 15.5%), Educational Services (14,593 | 15.3%), Retail Trade (9,942 | 10.4%), Manufacturing (9,438 | 9.9%), and Professional & Scientific (9,054 | 9.5%).
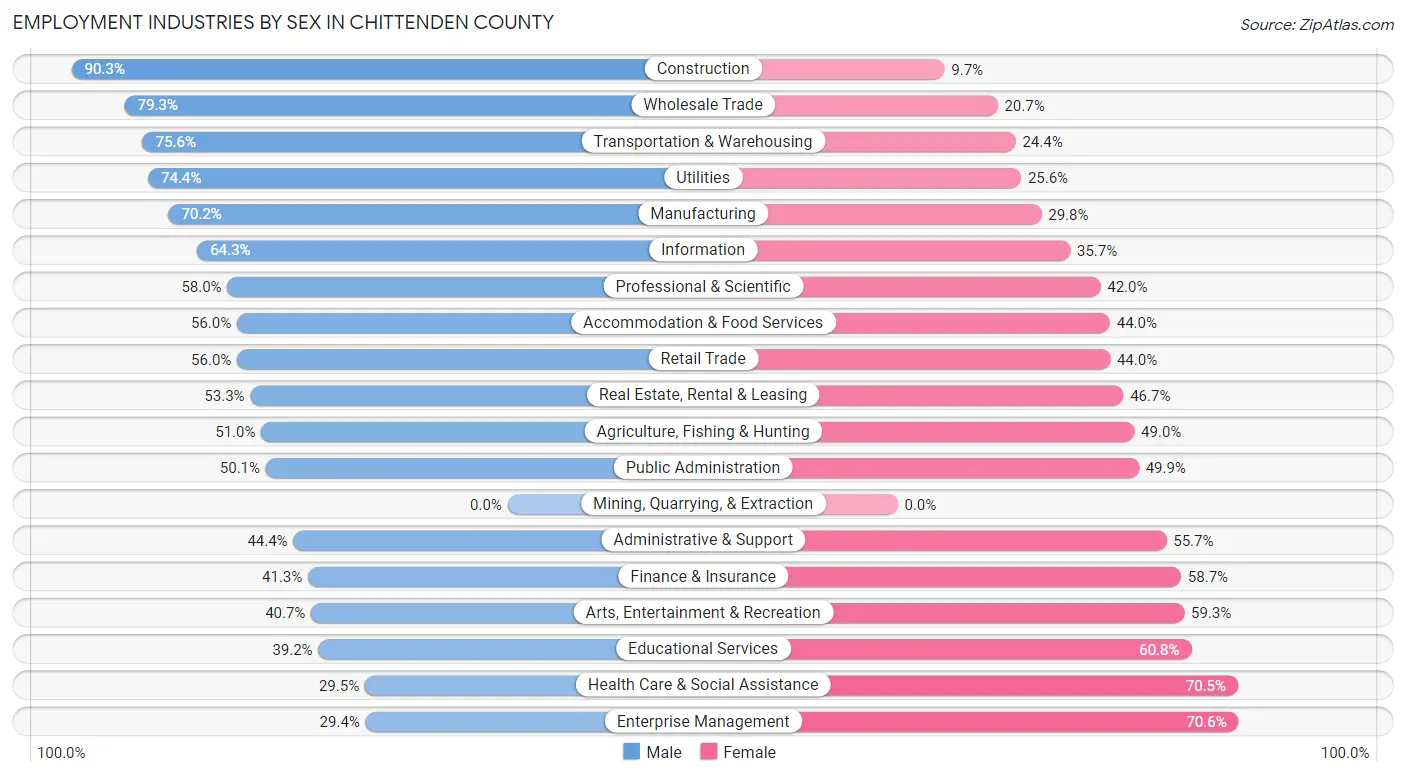
Employment Industries by Sex in Chittenden County
The Chittenden County industries that see more men than women are Construction (90.3%), Wholesale Trade (79.3%), and Transportation & Warehousing (75.6%), whereas the industries that tend to have a higher number of women are Enterprise Management (70.6%), Health Care & Social Assistance (70.5%), and Educational Services (60.8%).
| Industry | Male | Female |
| Agriculture, Fishing & Hunting | 563 (51.0%) | 541 (49.0%) |
| Mining, Quarrying, & Extraction | 0 (0.0%) | 0 (0.0%) |
| Construction | 3,944 (90.3%) | 424 (9.7%) |
| Manufacturing | 6,627 (70.2%) | 2,811 (29.8%) |
| Wholesale Trade | 1,068 (79.3%) | 279 (20.7%) |
| Retail Trade | 5,568 (56.0%) | 4,374 (44.0%) |
| Transportation & Warehousing | 1,515 (75.6%) | 490 (24.4%) |
| Utilities | 454 (74.4%) | 156 (25.6%) |
| Information | 1,437 (64.3%) | 799 (35.7%) |
| Finance & Insurance | 1,441 (41.3%) | 2,046 (58.7%) |
| Real Estate, Rental & Leasing | 948 (53.3%) | 832 (46.7%) |
| Professional & Scientific | 5,252 (58.0%) | 3,802 (42.0%) |
| Enterprise Management | 20 (29.4%) | 48 (70.6%) |
| Administrative & Support | 1,102 (44.4%) | 1,383 (55.6%) |
| Educational Services | 5,718 (39.2%) | 8,875 (60.8%) |
| Health Care & Social Assistance | 4,374 (29.5%) | 10,435 (70.5%) |
| Arts, Entertainment & Recreation | 1,093 (40.7%) | 1,594 (59.3%) |
| Accommodation & Food Services | 3,557 (56.0%) | 2,790 (44.0%) |
| Public Administration | 2,403 (50.1%) | 2,397 (49.9%) |
| Total | 48,608 (51.0%) | 46,665 (49.0%) |
Education in Chittenden County
School Enrollment in Chittenden County
The most common levels of schooling among the 46,194 students in Chittenden County are college / undergraduate (18,064 | 39.1%), high school (6,897 | 14.9%), and middle school (6,747 | 14.6%).
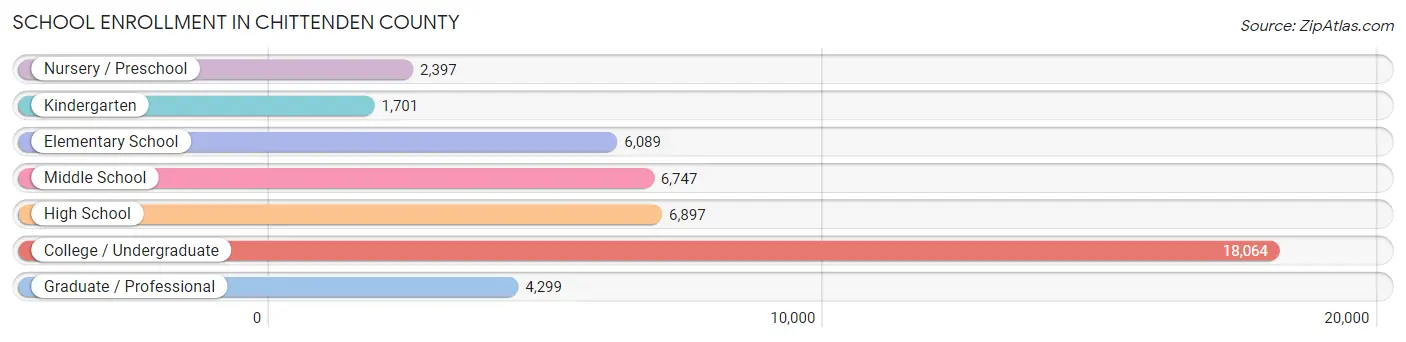
| School Level | # Students | % Students |
| Nursery / Preschool | 2,397 | 5.2% |
| Kindergarten | 1,701 | 3.7% |
| Elementary School | 6,089 | 13.2% |
| Middle School | 6,747 | 14.6% |
| High School | 6,897 | 14.9% |
| College / Undergraduate | 18,064 | 39.1% |
| Graduate / Professional | 4,299 | 9.3% |
| Total | 46,194 | 100.0% |
School Enrollment by Age by Funding Source in Chittenden County
Out of a total of 46,194 students who are enrolled in schools in Chittenden County, 7,853 (17.0%) attend a private institution, while the remaining 38,341 (83.0%) are enrolled in public schools. The age group of 3 to 4 year olds has the highest likelihood of being enrolled in private schools, with 796 (45.5% in the age bracket) enrolled. Conversely, the age group of 10 to 14 year olds has the lowest likelihood of being enrolled in a private school, with 7,965 (95.1% in the age bracket) attending a public institution.
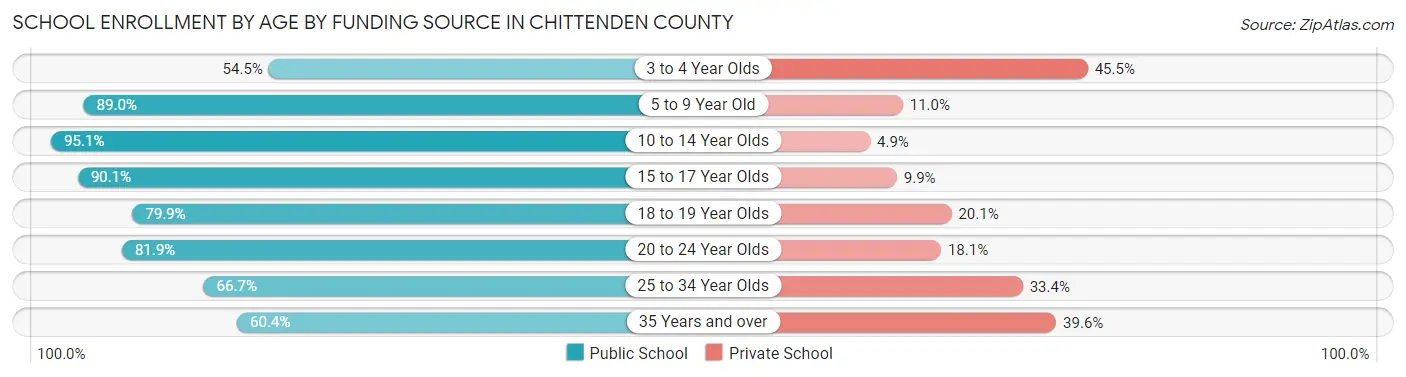
| Age Bracket | Public School | Private School |
| 3 to 4 Year Olds | 955 (54.5%) | 796 (45.5%) |
| 5 to 9 Year Old | 6,814 (89.0%) | 843 (11.0%) |
| 10 to 14 Year Olds | 7,965 (95.1%) | 412 (4.9%) |
| 15 to 17 Year Olds | 4,725 (90.1%) | 519 (9.9%) |
| 18 to 19 Year Olds | 5,779 (79.9%) | 1,452 (20.1%) |
| 20 to 24 Year Olds | 8,586 (81.9%) | 1,901 (18.1%) |
| 25 to 34 Year Olds | 2,194 (66.6%) | 1,098 (33.4%) |
| 35 Years and over | 1,302 (60.4%) | 853 (39.6%) |
| Total | 38,341 (83.0%) | 7,853 (17.0%) |
Educational Attainment by Field of Study in Chittenden County
Business (7,724 | 11.1%), social sciences (7,342 | 10.6%), education (6,866 | 9.9%), bio, nature & agricultural (6,409 | 9.2%), and science & technology (5,933 | 8.5%) are the most common fields of study among 69,464 individuals in Chittenden County who have obtained a bachelor's degree or higher.
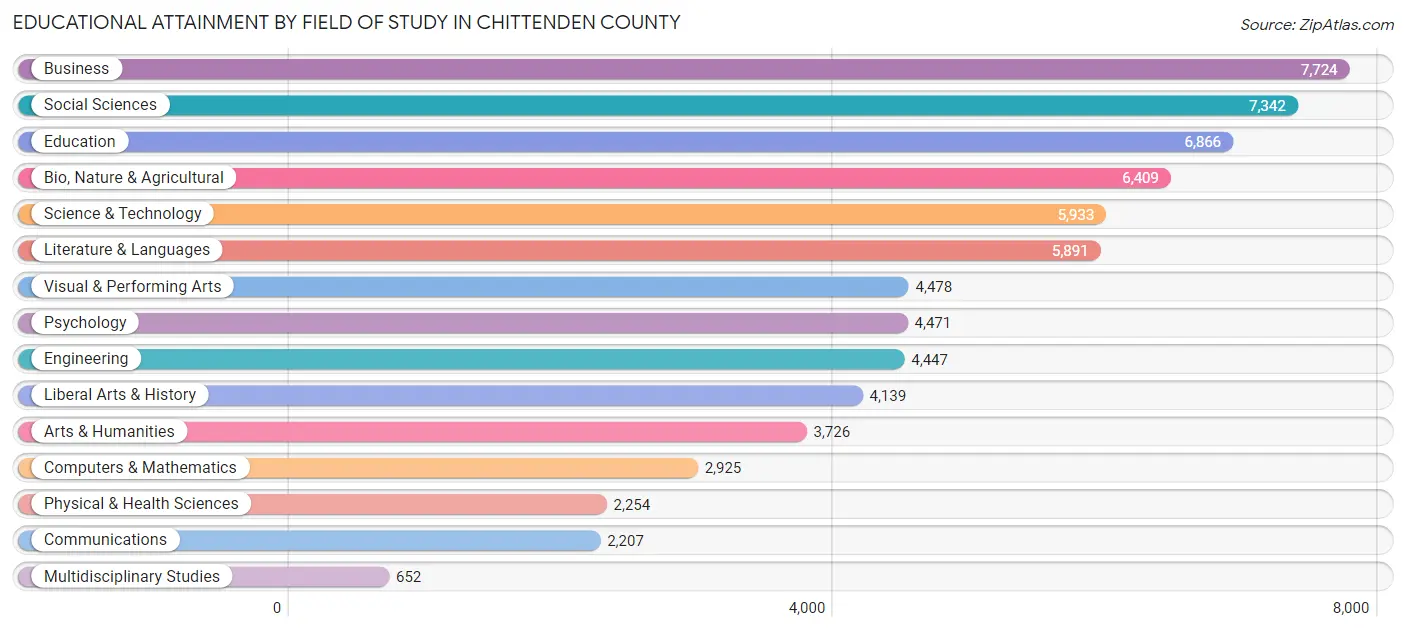
| Field of Study | # Graduates | % Graduates |
| Computers & Mathematics | 2,925 | 4.2% |
| Bio, Nature & Agricultural | 6,409 | 9.2% |
| Physical & Health Sciences | 2,254 | 3.2% |
| Psychology | 4,471 | 6.4% |
| Social Sciences | 7,342 | 10.6% |
| Engineering | 4,447 | 6.4% |
| Multidisciplinary Studies | 652 | 0.9% |
| Science & Technology | 5,933 | 8.5% |
| Business | 7,724 | 11.1% |
| Education | 6,866 | 9.9% |
| Literature & Languages | 5,891 | 8.5% |
| Liberal Arts & History | 4,139 | 6.0% |
| Visual & Performing Arts | 4,478 | 6.5% |
| Communications | 2,207 | 3.2% |
| Arts & Humanities | 3,726 | 5.4% |
| Total | 69,464 | 100.0% |
Transportation & Commute in Chittenden County
Vehicle Availability by Sex in Chittenden County
The most prevalent vehicle ownership categories in Chittenden County are males with 2 vehicles (23,085, accounting for 49.0%) and females with 2 vehicles (21,500, making up 52.7%).
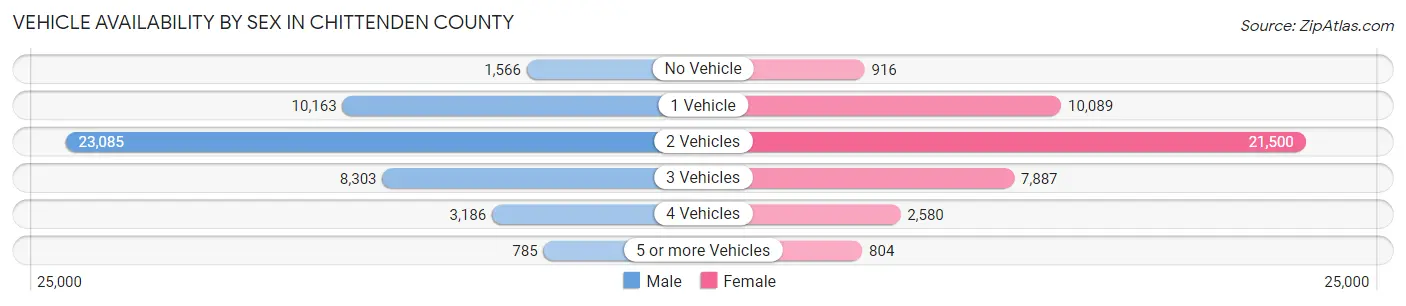
| Vehicles Available | Male | Female |
| No Vehicle | 1,566 (3.3%) | 916 (2.1%) |
| 1 Vehicle | 10,163 (21.6%) | 10,089 (23.1%) |
| 2 Vehicles | 23,085 (49.0%) | 21,500 (49.1%) |
| 3 Vehicles | 8,303 (17.6%) | 7,887 (18.0%) |
| 4 Vehicles | 3,186 (6.8%) | 2,580 (5.9%) |
| 5 or more Vehicles | 785 (1.7%) | 804 (1.8%) |
| Total | 47,088 (100.0%) | 43,776 (100.0%) |
Commute Time in Chittenden County
The most frequently occuring commute durations in Chittenden County are 15 to 19 minutes (14,606 commuters, 18.4%), 20 to 24 minutes (14,283 commuters, 18.0%), and 10 to 14 minutes (12,976 commuters, 16.3%).
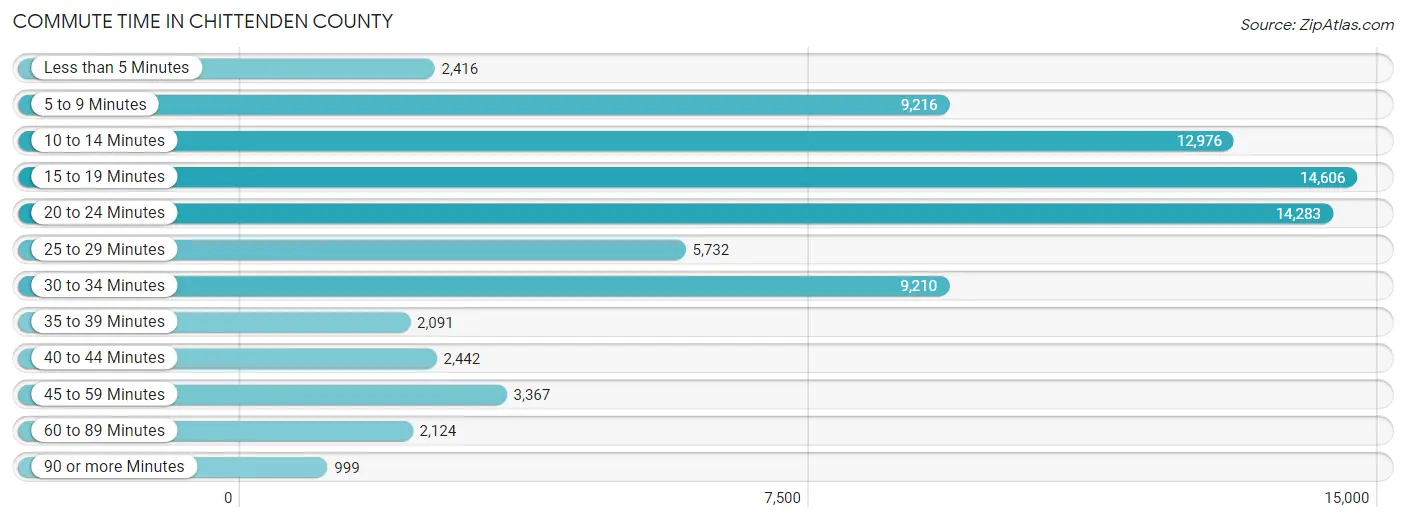
| Commute Time | # Commuters | % Commuters |
| Less than 5 Minutes | 2,416 | 3.0% |
| 5 to 9 Minutes | 9,216 | 11.6% |
| 10 to 14 Minutes | 12,976 | 16.3% |
| 15 to 19 Minutes | 14,606 | 18.4% |
| 20 to 24 Minutes | 14,283 | 18.0% |
| 25 to 29 Minutes | 5,732 | 7.2% |
| 30 to 34 Minutes | 9,210 | 11.6% |
| 35 to 39 Minutes | 2,091 | 2.6% |
| 40 to 44 Minutes | 2,442 | 3.1% |
| 45 to 59 Minutes | 3,367 | 4.2% |
| 60 to 89 Minutes | 2,124 | 2.7% |
| 90 or more Minutes | 999 | 1.3% |
Commute Time by Sex in Chittenden County
The most common commute times in Chittenden County are 20 to 24 minutes (8,260 commuters, 20.2%) for males and 15 to 19 minutes (6,866 commuters, 17.8%) for females.
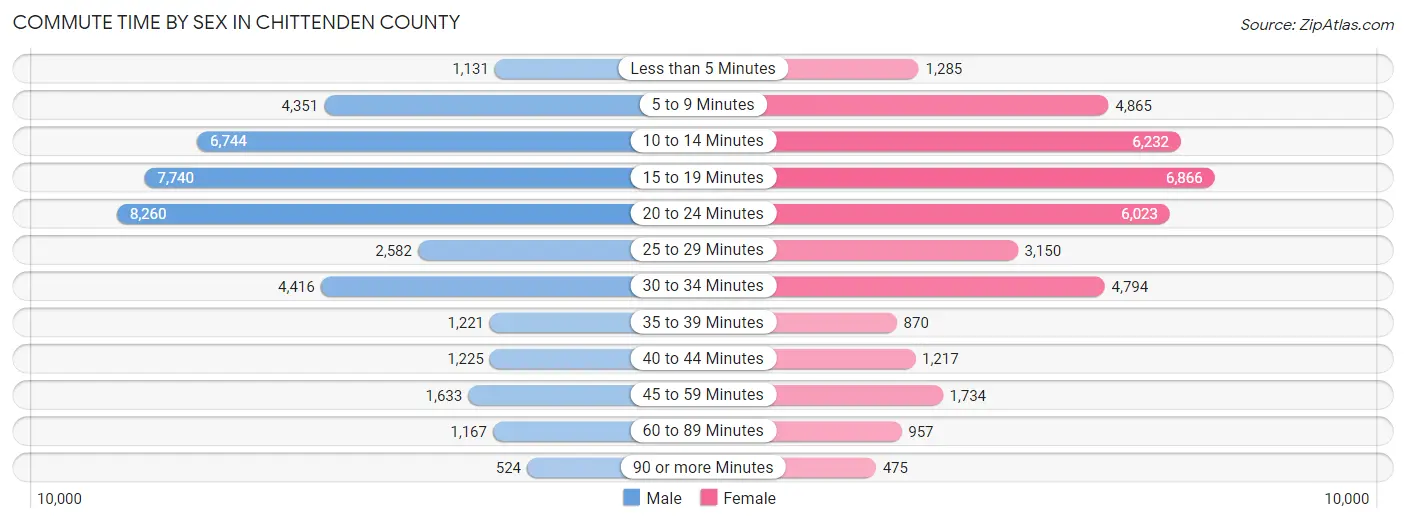
| Commute Time | Male | Female |
| Less than 5 Minutes | 1,131 (2.8%) | 1,285 (3.3%) |
| 5 to 9 Minutes | 4,351 (10.6%) | 4,865 (12.7%) |
| 10 to 14 Minutes | 6,744 (16.5%) | 6,232 (16.2%) |
| 15 to 19 Minutes | 7,740 (18.9%) | 6,866 (17.8%) |
| 20 to 24 Minutes | 8,260 (20.2%) | 6,023 (15.7%) |
| 25 to 29 Minutes | 2,582 (6.3%) | 3,150 (8.2%) |
| 30 to 34 Minutes | 4,416 (10.8%) | 4,794 (12.5%) |
| 35 to 39 Minutes | 1,221 (3.0%) | 870 (2.3%) |
| 40 to 44 Minutes | 1,225 (3.0%) | 1,217 (3.2%) |
| 45 to 59 Minutes | 1,633 (4.0%) | 1,734 (4.5%) |
| 60 to 89 Minutes | 1,167 (2.9%) | 957 (2.5%) |
| 90 or more Minutes | 524 (1.3%) | 475 (1.2%) |
Time of Departure to Work by Sex in Chittenden County
The most frequent times of departure to work in Chittenden County are 7:30 AM to 7:59 AM (6,623, 16.2%) for males and 7:30 AM to 7:59 AM (7,375, 19.2%) for females.
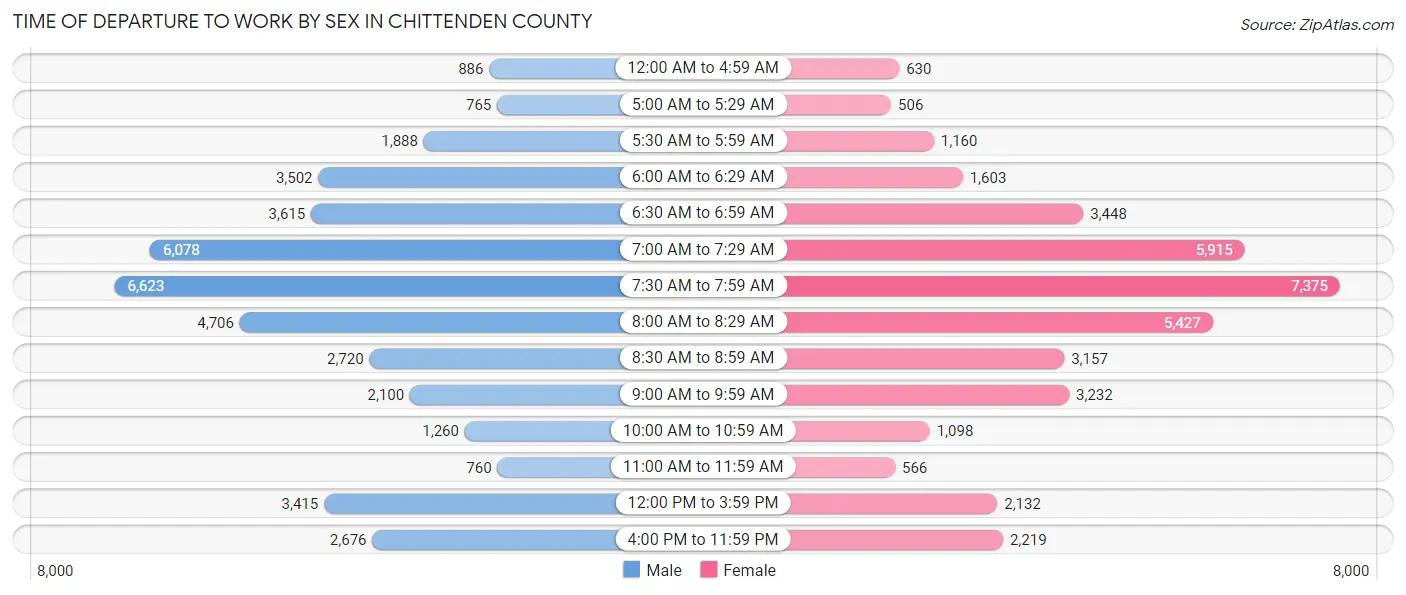
| Time of Departure | Male | Female |
| 12:00 AM to 4:59 AM | 886 (2.2%) | 630 (1.6%) |
| 5:00 AM to 5:29 AM | 765 (1.9%) | 506 (1.3%) |
| 5:30 AM to 5:59 AM | 1,888 (4.6%) | 1,160 (3.0%) |
| 6:00 AM to 6:29 AM | 3,502 (8.5%) | 1,603 (4.2%) |
| 6:30 AM to 6:59 AM | 3,615 (8.8%) | 3,448 (9.0%) |
| 7:00 AM to 7:29 AM | 6,078 (14.8%) | 5,915 (15.4%) |
| 7:30 AM to 7:59 AM | 6,623 (16.2%) | 7,375 (19.2%) |
| 8:00 AM to 8:29 AM | 4,706 (11.5%) | 5,427 (14.1%) |
| 8:30 AM to 8:59 AM | 2,720 (6.6%) | 3,157 (8.2%) |
| 9:00 AM to 9:59 AM | 2,100 (5.1%) | 3,232 (8.4%) |
| 10:00 AM to 10:59 AM | 1,260 (3.1%) | 1,098 (2.9%) |
| 11:00 AM to 11:59 AM | 760 (1.8%) | 566 (1.5%) |
| 12:00 PM to 3:59 PM | 3,415 (8.3%) | 2,132 (5.5%) |
| 4:00 PM to 11:59 PM | 2,676 (6.5%) | 2,219 (5.8%) |
| Total | 40,994 (100.0%) | 38,468 (100.0%) |
Housing Occupancy in Chittenden County
Occupancy by Ownership in Chittenden County
Of the total 69,318 dwellings in Chittenden County, owner-occupied units account for 43,933 (63.4%), while renter-occupied units make up 25,385 (36.6%).
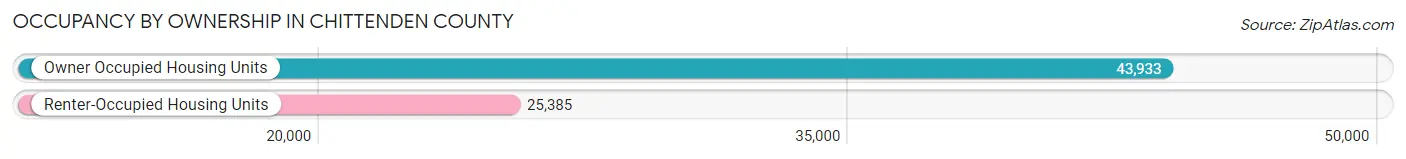
| Occupancy | # Housing Units | % Housing Units |
| Owner Occupied Housing Units | 43,933 | 63.4% |
| Renter-Occupied Housing Units | 25,385 | 36.6% |
| Total Occupied Housing Units | 69,318 | 100.0% |
Occupancy by Household Size in Chittenden County
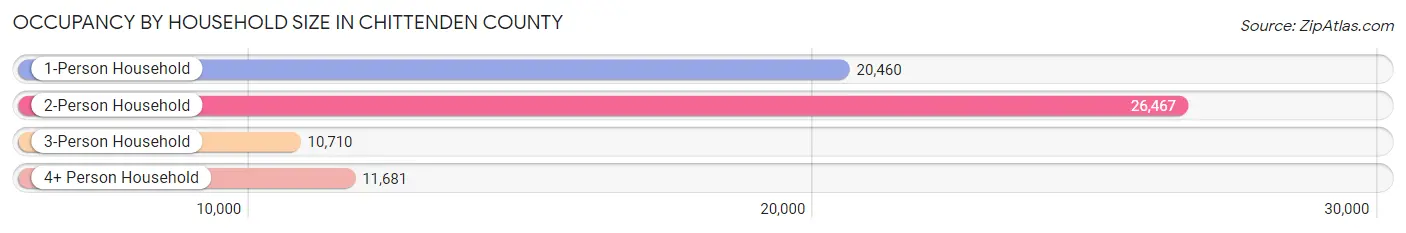
| Household Size | # Housing Units | % Housing Units |
| 1-Person Household | 20,460 | 29.5% |
| 2-Person Household | 26,467 | 38.2% |
| 3-Person Household | 10,710 | 15.4% |
| 4+ Person Household | 11,681 | 16.9% |
| Total Housing Units | 69,318 | 100.0% |
Occupancy by Ownership by Household Size in Chittenden County
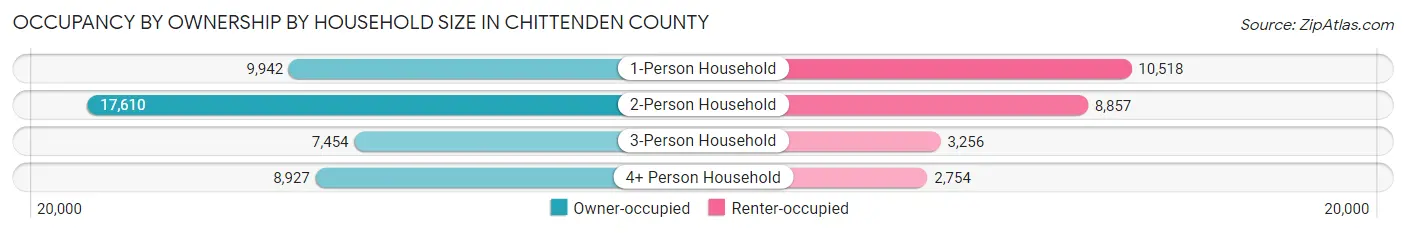
| Household Size | Owner-occupied | Renter-occupied |
| 1-Person Household | 9,942 (48.6%) | 10,518 (51.4%) |
| 2-Person Household | 17,610 (66.5%) | 8,857 (33.5%) |
| 3-Person Household | 7,454 (69.6%) | 3,256 (30.4%) |
| 4+ Person Household | 8,927 (76.4%) | 2,754 (23.6%) |
| Total Housing Units | 43,933 (63.4%) | 25,385 (36.6%) |
Occupancy by Educational Attainment in Chittenden County
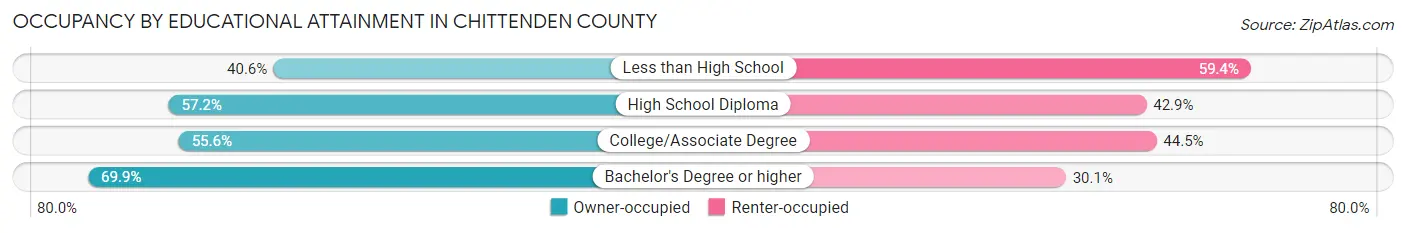
| Household Size | Owner-occupied | Renter-occupied |
| Less than High School | 1,000 (40.6%) | 1,464 (59.4%) |
| High School Diploma | 5,554 (57.2%) | 4,165 (42.8%) |
| College/Associate Degree | 9,951 (55.5%) | 7,962 (44.5%) |
| Bachelor's Degree or higher | 27,428 (69.9%) | 11,794 (30.1%) |
Occupancy by Age of Householder in Chittenden County
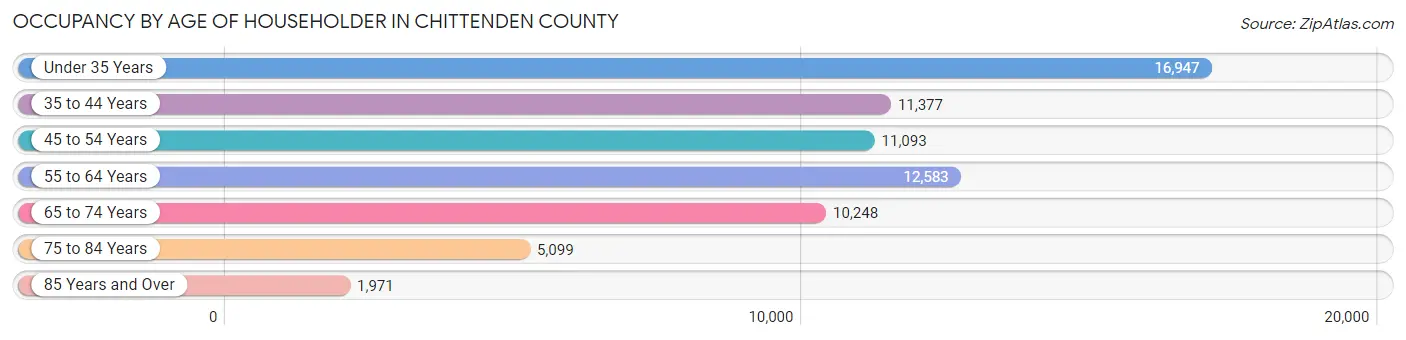
| Age Bracket | # Households | % Households |
| Under 35 Years | 16,947 | 24.4% |
| 35 to 44 Years | 11,377 | 16.4% |
| 45 to 54 Years | 11,093 | 16.0% |
| 55 to 64 Years | 12,583 | 18.1% |
| 65 to 74 Years | 10,248 | 14.8% |
| 75 to 84 Years | 5,099 | 7.4% |
| 85 Years and Over | 1,971 | 2.8% |
| Total | 69,318 | 100.0% |
Housing Finances in Chittenden County
Median Income by Occupancy in Chittenden County
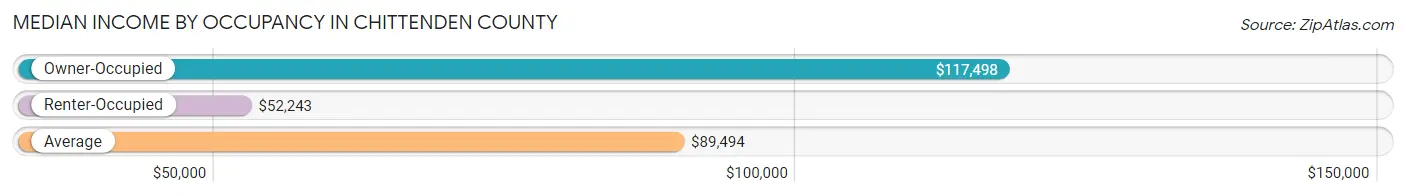
| Occupancy Type | # Households | Median Income |
| Owner-Occupied | 43,933 (63.4%) | $117,498 |
| Renter-Occupied | 25,385 (36.6%) | $52,243 |
| Average | 69,318 (100.0%) | $89,494 |
Occupancy by Householder Income Bracket in Chittenden County
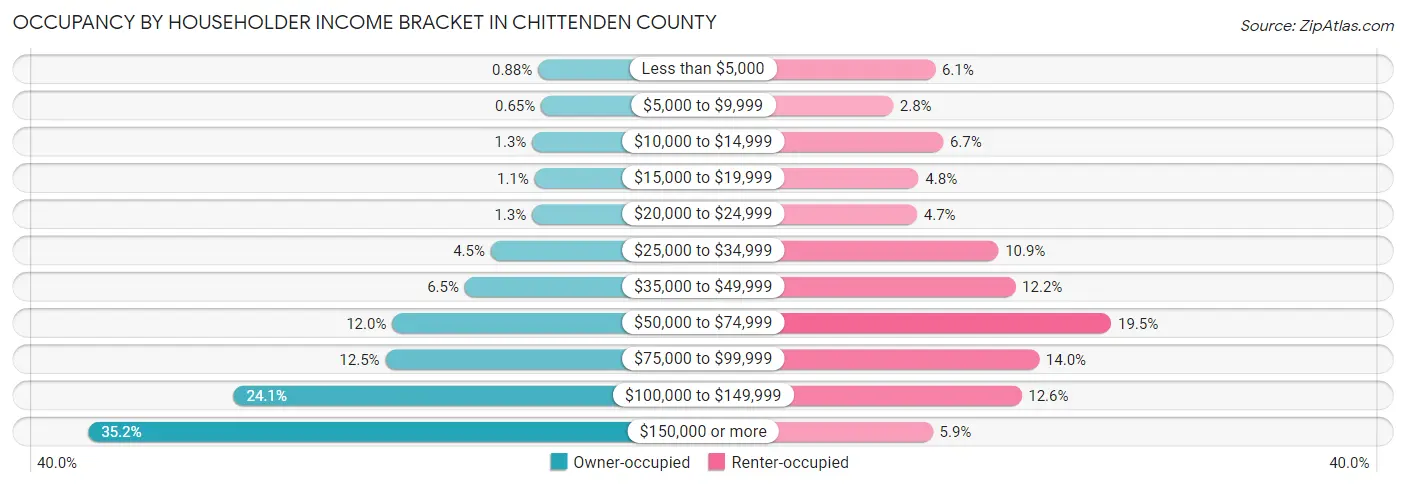
| Income Bracket | Owner-occupied | Renter-occupied |
| Less than $5,000 | 388 (0.9%) | 1,537 (6.0%) |
| $5,000 to $9,999 | 286 (0.6%) | 722 (2.8%) |
| $10,000 to $14,999 | 585 (1.3%) | 1,690 (6.7%) |
| $15,000 to $19,999 | 500 (1.1%) | 1,217 (4.8%) |
| $20,000 to $24,999 | 587 (1.3%) | 1,186 (4.7%) |
| $25,000 to $34,999 | 1,968 (4.5%) | 2,760 (10.9%) |
| $35,000 to $49,999 | 2,836 (6.5%) | 3,088 (12.2%) |
| $50,000 to $74,999 | 5,266 (12.0%) | 4,942 (19.5%) |
| $75,000 to $99,999 | 5,494 (12.5%) | 3,546 (14.0%) |
| $100,000 to $149,999 | 10,581 (24.1%) | 3,207 (12.6%) |
| $150,000 or more | 15,442 (35.1%) | 1,490 (5.9%) |
| Total | 43,933 (100.0%) | 25,385 (100.0%) |
Monthly Housing Cost Tiers in Chittenden County
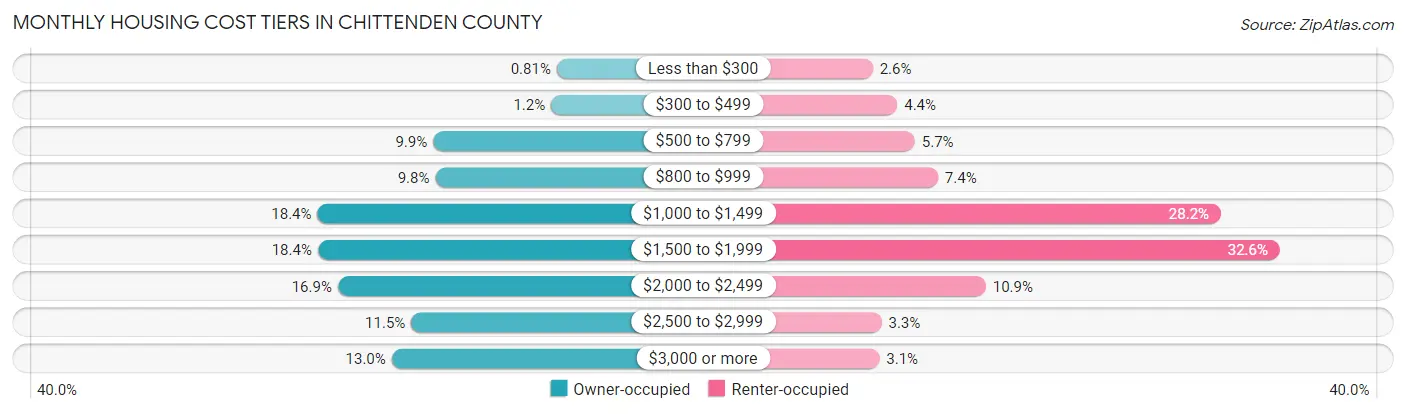
| Monthly Cost | Owner-occupied | Renter-occupied |
| Less than $300 | 357 (0.8%) | 661 (2.6%) |
| $300 to $499 | 542 (1.2%) | 1,120 (4.4%) |
| $500 to $799 | 4,360 (9.9%) | 1,448 (5.7%) |
| $800 to $999 | 4,285 (9.8%) | 1,879 (7.4%) |
| $1,000 to $1,499 | 8,101 (18.4%) | 7,168 (28.2%) |
| $1,500 to $1,999 | 8,087 (18.4%) | 8,271 (32.6%) |
| $2,000 to $2,499 | 7,441 (16.9%) | 2,774 (10.9%) |
| $2,500 to $2,999 | 5,064 (11.5%) | 824 (3.3%) |
| $3,000 or more | 5,696 (13.0%) | 785 (3.1%) |
| Total | 43,933 (100.0%) | 25,385 (100.0%) |
Physical Housing Characteristics in Chittenden County
Housing Structures in Chittenden County
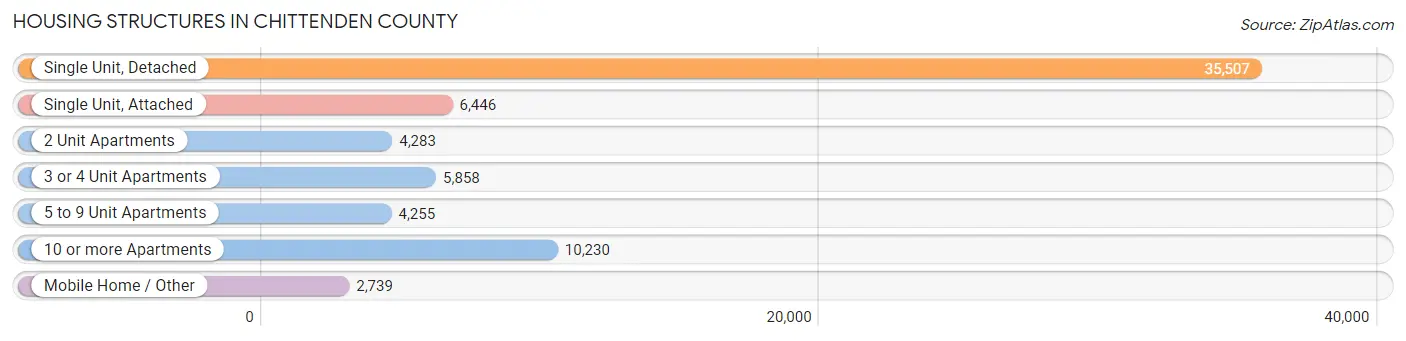
| Structure Type | # Housing Units | % Housing Units |
| Single Unit, Detached | 35,507 | 51.2% |
| Single Unit, Attached | 6,446 | 9.3% |
| 2 Unit Apartments | 4,283 | 6.2% |
| 3 or 4 Unit Apartments | 5,858 | 8.5% |
| 5 to 9 Unit Apartments | 4,255 | 6.1% |
| 10 or more Apartments | 10,230 | 14.8% |
| Mobile Home / Other | 2,739 | 4.0% |
| Total | 69,318 | 100.0% |
Housing Structures by Occupancy in Chittenden County
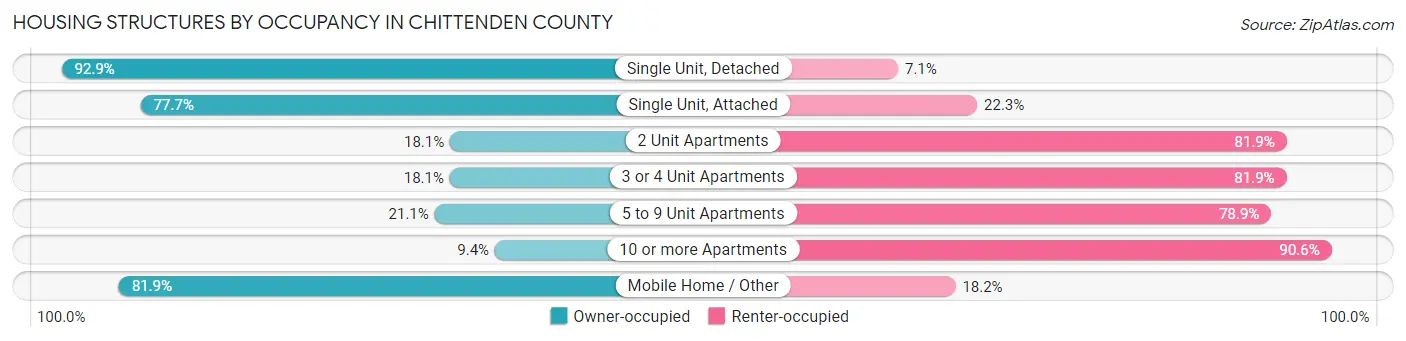
| Structure Type | Owner-occupied | Renter-occupied |
| Single Unit, Detached | 32,985 (92.9%) | 2,522 (7.1%) |
| Single Unit, Attached | 5,007 (77.7%) | 1,439 (22.3%) |
| 2 Unit Apartments | 775 (18.1%) | 3,508 (81.9%) |
| 3 or 4 Unit Apartments | 1,062 (18.1%) | 4,796 (81.9%) |
| 5 to 9 Unit Apartments | 896 (21.1%) | 3,359 (78.9%) |
| 10 or more Apartments | 966 (9.4%) | 9,264 (90.6%) |
| Mobile Home / Other | 2,242 (81.9%) | 497 (18.1%) |
| Total | 43,933 (63.4%) | 25,385 (36.6%) |
Housing Structures by Number of Rooms in Chittenden County
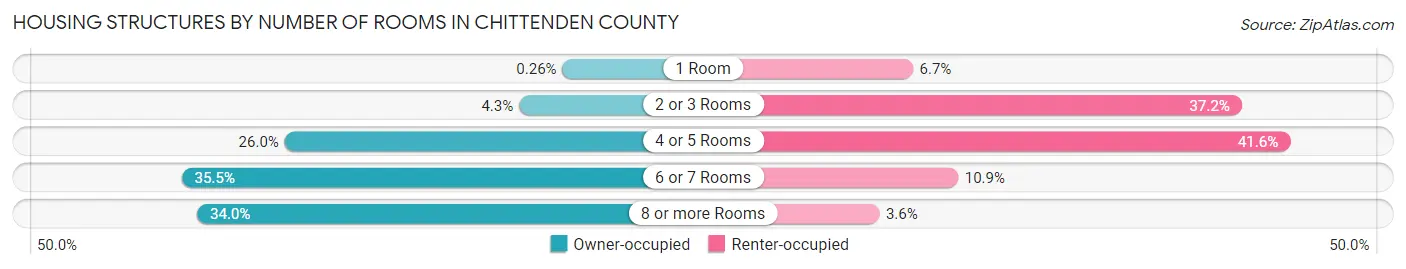
| Number of Rooms | Owner-occupied | Renter-occupied |
| 1 Room | 115 (0.3%) | 1,707 (6.7%) |
| 2 or 3 Rooms | 1,878 (4.3%) | 9,430 (37.1%) |
| 4 or 5 Rooms | 11,400 (26.0%) | 10,565 (41.6%) |
| 6 or 7 Rooms | 15,586 (35.5%) | 2,766 (10.9%) |
| 8 or more Rooms | 14,954 (34.0%) | 917 (3.6%) |
| Total | 43,933 (100.0%) | 25,385 (100.0%) |
Housing Structure by Heating Type in Chittenden County
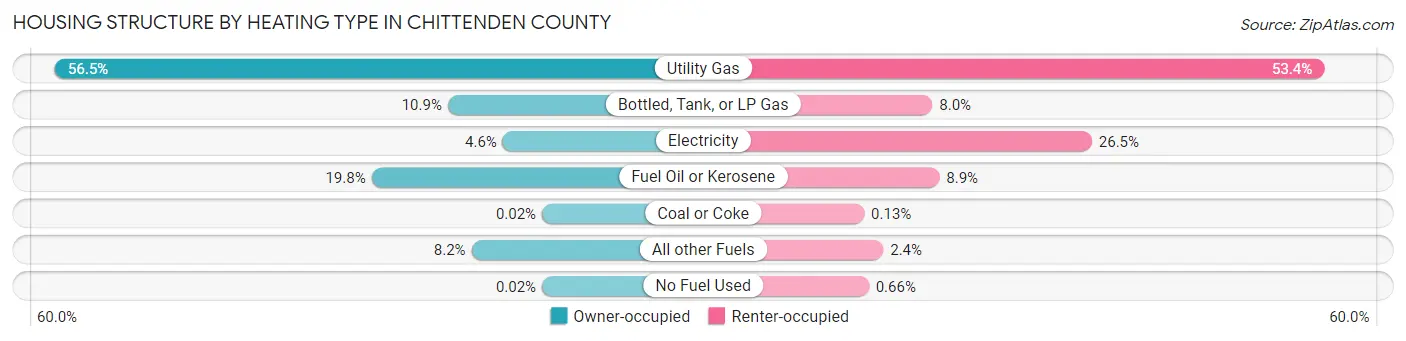
| Heating Type | Owner-occupied | Renter-occupied |
| Utility Gas | 24,815 (56.5%) | 13,566 (53.4%) |
| Bottled, Tank, or LP Gas | 4,806 (10.9%) | 2,039 (8.0%) |
| Electricity | 2,009 (4.6%) | 6,735 (26.5%) |
| Fuel Oil or Kerosene | 8,688 (19.8%) | 2,247 (8.8%) |
| Coal or Coke | 10 (0.0%) | 34 (0.1%) |
| All other Fuels | 3,598 (8.2%) | 596 (2.4%) |
| No Fuel Used | 7 (0.0%) | 168 (0.7%) |
| Total | 43,933 (100.0%) | 25,385 (100.0%) |
Household Vehicle Usage in Chittenden County
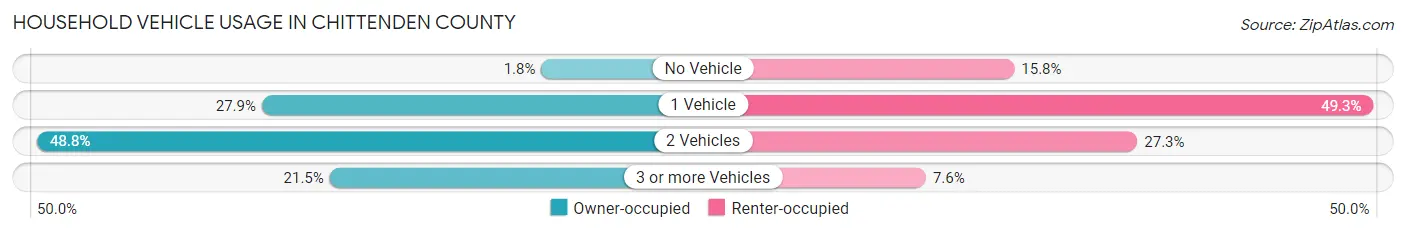
| Vehicles per Household | Owner-occupied | Renter-occupied |
| No Vehicle | 778 (1.8%) | 4,016 (15.8%) |
| 1 Vehicle | 12,238 (27.9%) | 12,519 (49.3%) |
| 2 Vehicles | 21,459 (48.8%) | 6,929 (27.3%) |
| 3 or more Vehicles | 9,458 (21.5%) | 1,921 (7.6%) |
| Total | 43,933 (100.0%) | 25,385 (100.0%) |
Real Estate & Mortgages in Chittenden County
Real Estate and Mortgage Overview in Chittenden County
| Characteristic | Without Mortgage | With Mortgage |
| Housing Units | 13,946 | 29,987 |
| Median Property Value | $368,400 | $382,700 |
| Median Household Income | $85,467 | $11,773 |
| Monthly Housing Costs | $928 | $5,604 |
| Real Estate Taxes | $6,311 | $187 |
Property Value by Mortgage Status in Chittenden County
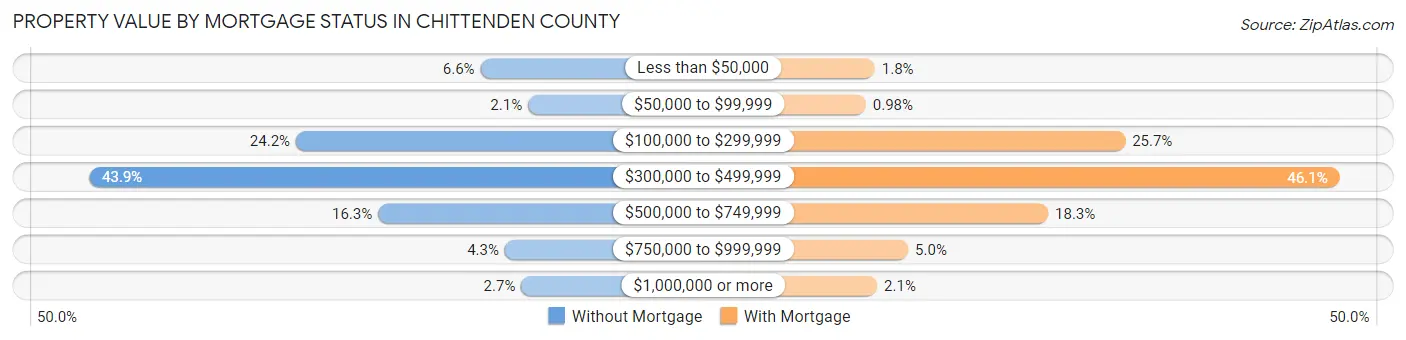
| Property Value | Without Mortgage | With Mortgage |
| Less than $50,000 | 919 (6.6%) | 552 (1.8%) |
| $50,000 to $99,999 | 287 (2.1%) | 293 (1.0%) |
| $100,000 to $299,999 | 3,370 (24.2%) | 7,701 (25.7%) |
| $300,000 to $499,999 | 6,118 (43.9%) | 13,821 (46.1%) |
| $500,000 to $749,999 | 2,279 (16.3%) | 5,501 (18.3%) |
| $750,000 to $999,999 | 596 (4.3%) | 1,502 (5.0%) |
| $1,000,000 or more | 377 (2.7%) | 617 (2.1%) |
| Total | 13,946 (100.0%) | 29,987 (100.0%) |
Household Income by Mortgage Status in Chittenden County
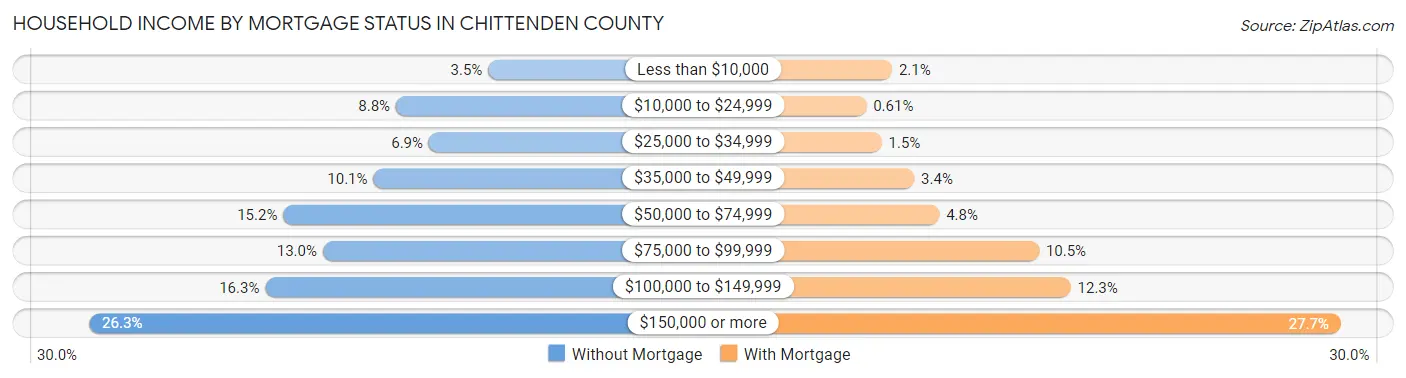
| Household Income | Without Mortgage | With Mortgage |
| Less than $10,000 | 490 (3.5%) | 624 (2.1%) |
| $10,000 to $24,999 | 1,225 (8.8%) | 184 (0.6%) |
| $25,000 to $34,999 | 962 (6.9%) | 447 (1.5%) |
| $35,000 to $49,999 | 1,404 (10.1%) | 1,006 (3.4%) |
| $50,000 to $74,999 | 2,122 (15.2%) | 1,432 (4.8%) |
| $75,000 to $99,999 | 1,808 (13.0%) | 3,144 (10.5%) |
| $100,000 to $149,999 | 2,266 (16.3%) | 3,686 (12.3%) |
| $150,000 or more | 3,669 (26.3%) | 8,315 (27.7%) |
| Total | 13,946 (100.0%) | 29,987 (100.0%) |
Property Value to Household Income Ratio in Chittenden County
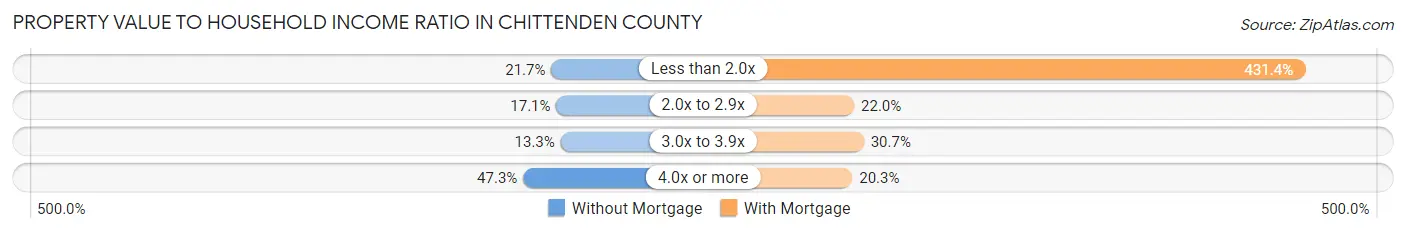
| Value-to-Income Ratio | Without Mortgage | With Mortgage |
| Less than 2.0x | 3,028 (21.7%) | 129,360 (431.4%) |
| 2.0x to 2.9x | 2,387 (17.1%) | 6,593 (22.0%) |
| 3.0x to 3.9x | 1,855 (13.3%) | 9,204 (30.7%) |
| 4.0x or more | 6,594 (47.3%) | 6,098 (20.3%) |
| Total | 13,946 (100.0%) | 29,987 (100.0%) |
Real Estate Taxes by Mortgage Status in Chittenden County
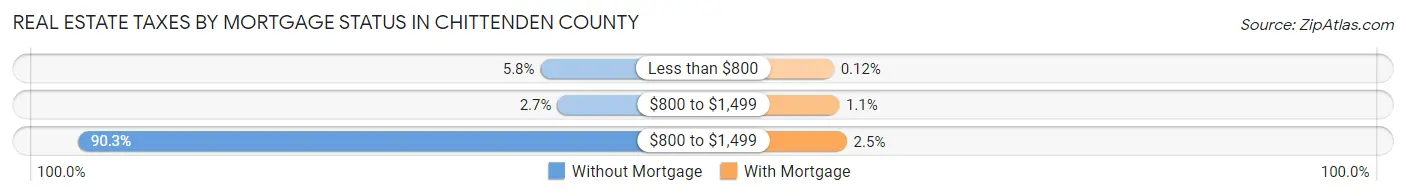
| Property Taxes | Without Mortgage | With Mortgage |
| Less than $800 | 808 (5.8%) | 37 (0.1%) |
| $800 to $1,499 | 377 (2.7%) | 324 (1.1%) |
| $800 to $1,499 | 12,589 (90.3%) | 746 (2.5%) |
| Total | 13,946 (100.0%) | 29,987 (100.0%) |
Health & Disability in Chittenden County
Health Insurance Coverage by Age in Chittenden County
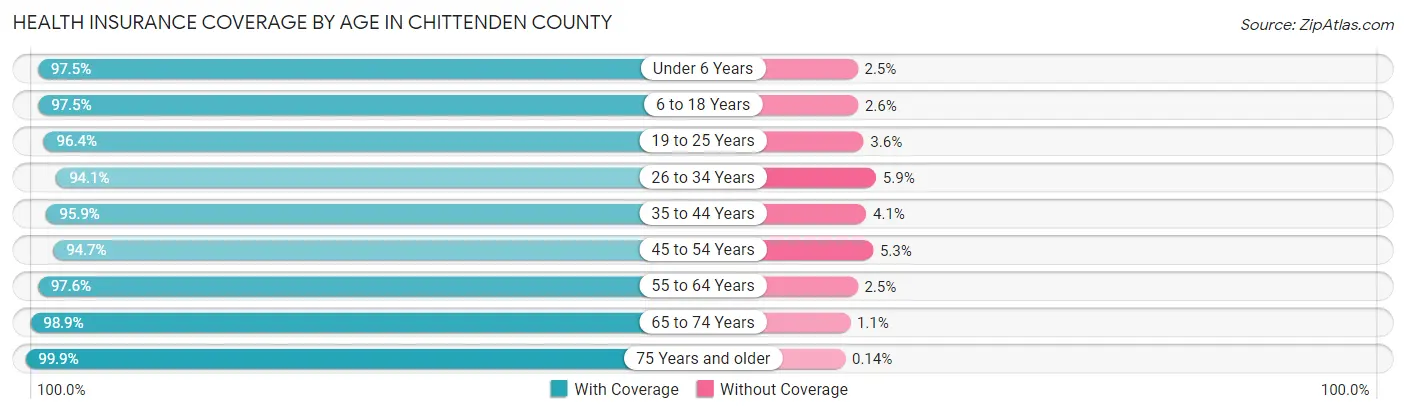
| Age Bracket | With Coverage | Without Coverage |
| Under 6 Years | 8,685 (97.5%) | 220 (2.5%) |
| 6 to 18 Years | 23,627 (97.5%) | 618 (2.5%) |
| 19 to 25 Years | 23,792 (96.4%) | 878 (3.6%) |
| 26 to 34 Years | 20,415 (94.1%) | 1,281 (5.9%) |
| 35 to 44 Years | 19,777 (95.9%) | 839 (4.1%) |
| 45 to 54 Years | 18,416 (94.7%) | 1,038 (5.3%) |
| 55 to 64 Years | 20,841 (97.6%) | 523 (2.5%) |
| 65 to 74 Years | 15,527 (98.9%) | 166 (1.1%) |
| 75 Years and older | 10,254 (99.9%) | 14 (0.1%) |
| Total | 161,334 (96.7%) | 5,577 (3.3%) |
Health Insurance Coverage by Citizenship Status in Chittenden County
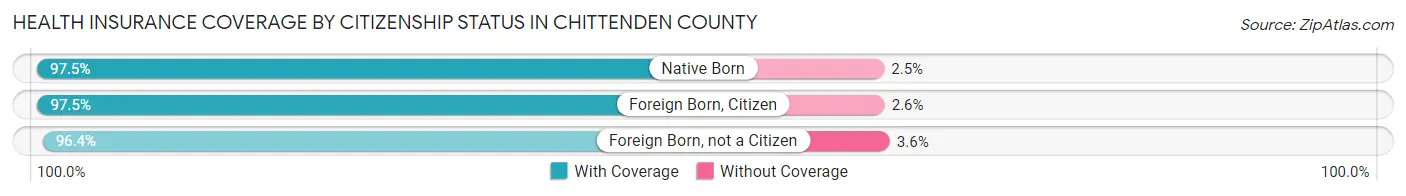
| Citizenship Status | With Coverage | Without Coverage |
| Native Born | 8,685 (97.5%) | 220 (2.5%) |
| Foreign Born, Citizen | 23,627 (97.5%) | 618 (2.5%) |
| Foreign Born, not a Citizen | 23,792 (96.4%) | 878 (3.6%) |
Health Insurance Coverage by Household Income in Chittenden County
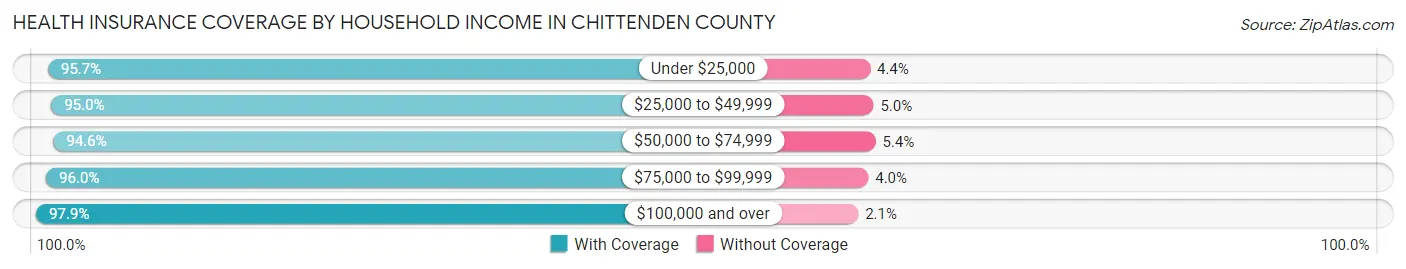
| Household Income | With Coverage | Without Coverage |
| Under $25,000 | 13,313 (95.7%) | 606 (4.3%) |
| $25,000 to $49,999 | 17,866 (95.0%) | 940 (5.0%) |
| $50,000 to $74,999 | 18,215 (94.6%) | 1,036 (5.4%) |
| $75,000 to $99,999 | 20,479 (96.0%) | 861 (4.0%) |
| $100,000 and over | 82,855 (97.9%) | 1,816 (2.1%) |
Public vs Private Health Insurance Coverage by Age in Chittenden County
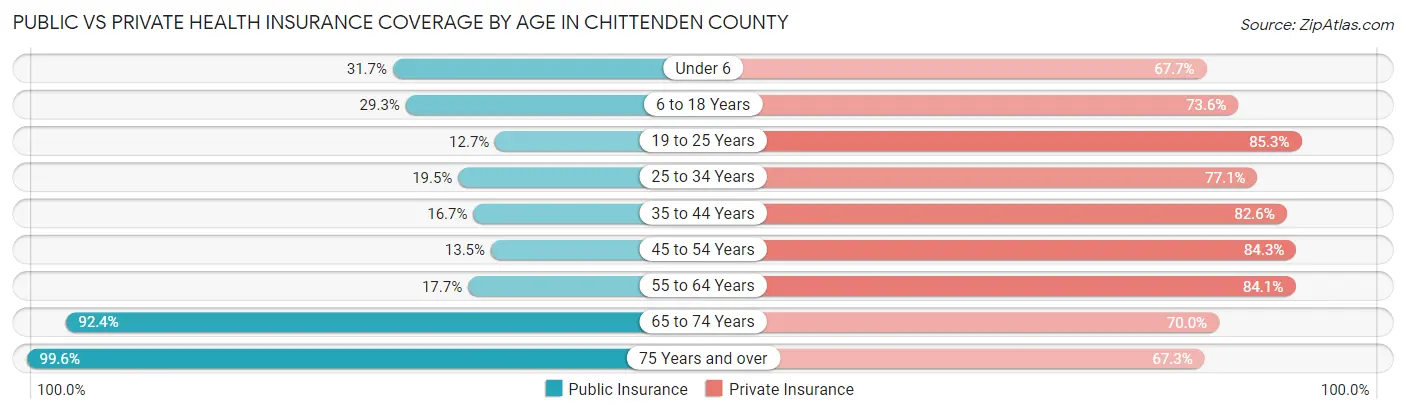
| Age Bracket | Public Insurance | Private Insurance |
| Under 6 | 2,819 (31.7%) | 6,027 (67.7%) |
| 6 to 18 Years | 7,097 (29.3%) | 17,838 (73.6%) |
| 19 to 25 Years | 3,123 (12.7%) | 21,037 (85.3%) |
| 25 to 34 Years | 4,235 (19.5%) | 16,736 (77.1%) |
| 35 to 44 Years | 3,447 (16.7%) | 17,018 (82.6%) |
| 45 to 54 Years | 2,616 (13.5%) | 16,405 (84.3%) |
| 55 to 64 Years | 3,781 (17.7%) | 17,973 (84.1%) |
| 65 to 74 Years | 14,505 (92.4%) | 10,985 (70.0%) |
| 75 Years and over | 10,230 (99.6%) | 6,914 (67.3%) |
| Total | 51,853 (31.1%) | 130,933 (78.4%) |
Disability Status by Sex by Age in Chittenden County
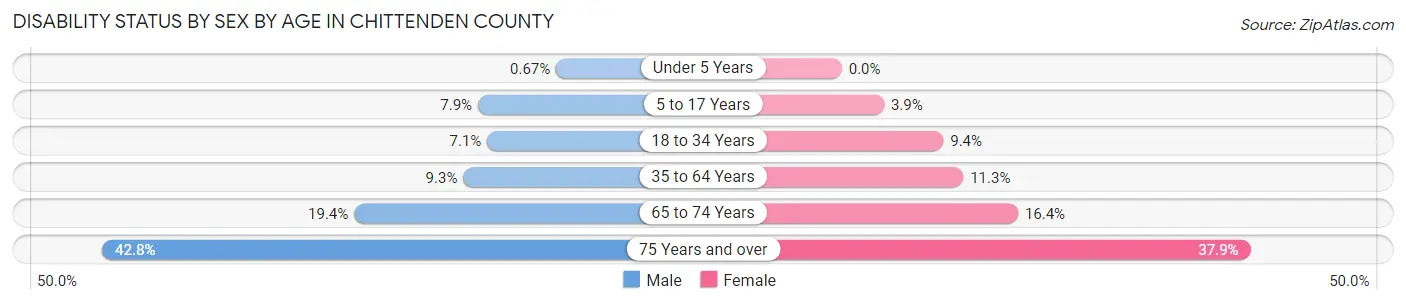
| Age Bracket | Male | Female |
| Under 5 Years | 25 (0.7%) | 0 (0.0%) |
| 5 to 17 Years | 913 (7.9%) | 410 (3.9%) |
| 18 to 34 Years | 1,775 (7.1%) | 2,362 (9.4%) |
| 35 to 64 Years | 2,834 (9.3%) | 3,487 (11.3%) |
| 65 to 74 Years | 1,443 (19.4%) | 1,351 (16.4%) |
| 75 Years and over | 1,763 (42.8%) | 2,332 (37.9%) |
Disability Class by Sex by Age in Chittenden County
Disability Class: Hearing Difficulty
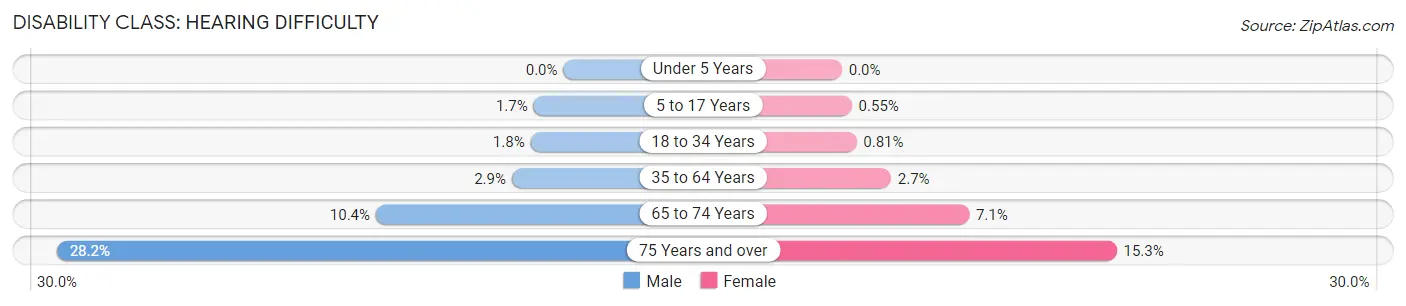
| Age Bracket | Male | Female |
| Under 5 Years | 0 (0.0%) | 0 (0.0%) |
| 5 to 17 Years | 191 (1.7%) | 58 (0.5%) |
| 18 to 34 Years | 460 (1.8%) | 204 (0.8%) |
| 35 to 64 Years | 874 (2.9%) | 844 (2.7%) |
| 65 to 74 Years | 776 (10.4%) | 585 (7.1%) |
| 75 Years and over | 1,162 (28.2%) | 941 (15.3%) |
Disability Class: Vision Difficulty
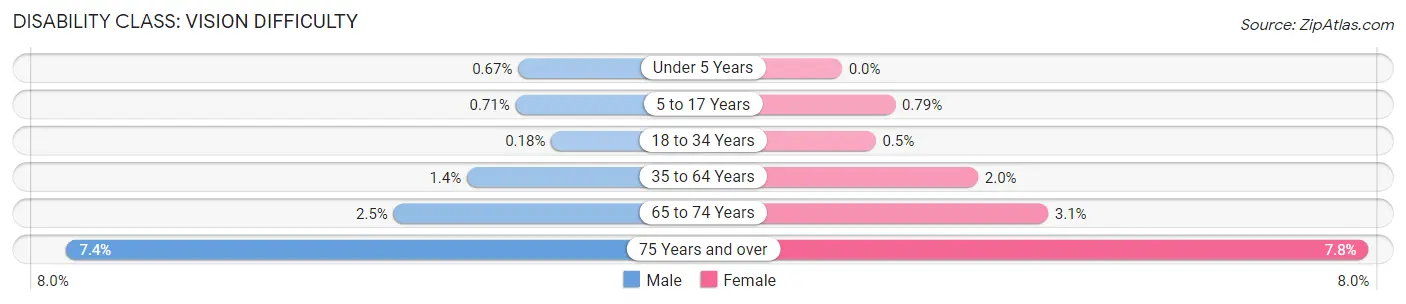
| Age Bracket | Male | Female |
| Under 5 Years | 25 (0.7%) | 0 (0.0%) |
| 5 to 17 Years | 82 (0.7%) | 83 (0.8%) |
| 18 to 34 Years | 46 (0.2%) | 126 (0.5%) |
| 35 to 64 Years | 436 (1.4%) | 626 (2.0%) |
| 65 to 74 Years | 187 (2.5%) | 253 (3.1%) |
| 75 Years and over | 304 (7.4%) | 481 (7.8%) |
Disability Class: Cognitive Difficulty
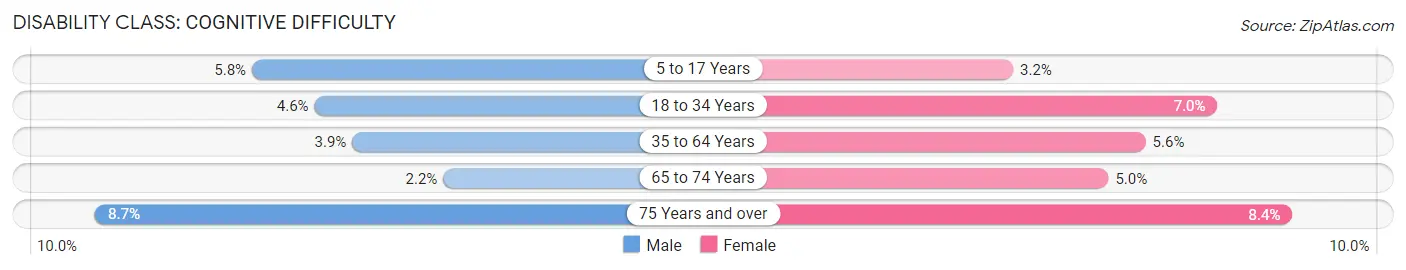
| Age Bracket | Male | Female |
| 5 to 17 Years | 666 (5.8%) | 334 (3.2%) |
| 18 to 34 Years | 1,160 (4.6%) | 1,749 (7.0%) |
| 35 to 64 Years | 1,197 (3.9%) | 1,744 (5.6%) |
| 65 to 74 Years | 166 (2.2%) | 409 (5.0%) |
| 75 Years and over | 358 (8.7%) | 514 (8.4%) |
Disability Class: Ambulatory Difficulty
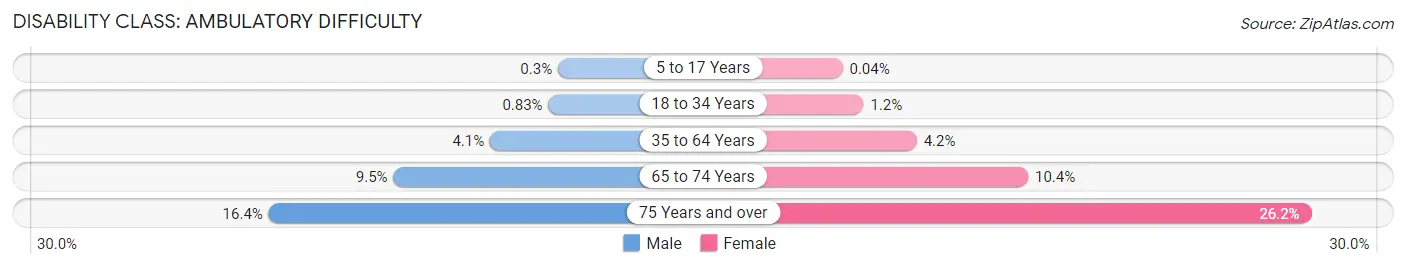
| Age Bracket | Male | Female |
| 5 to 17 Years | 35 (0.3%) | 4 (0.0%) |
| 18 to 34 Years | 208 (0.8%) | 303 (1.2%) |
| 35 to 64 Years | 1,245 (4.1%) | 1,291 (4.2%) |
| 65 to 74 Years | 703 (9.5%) | 857 (10.4%) |
| 75 Years and over | 676 (16.4%) | 1,608 (26.2%) |
Disability Class: Self-Care Difficulty
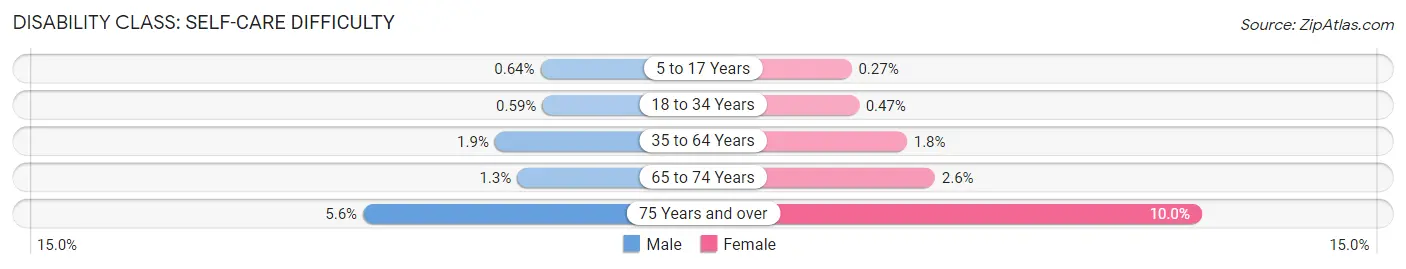
| Age Bracket | Male | Female |
| 5 to 17 Years | 74 (0.6%) | 28 (0.3%) |
| 18 to 34 Years | 148 (0.6%) | 118 (0.5%) |
| 35 to 64 Years | 583 (1.9%) | 561 (1.8%) |
| 65 to 74 Years | 96 (1.3%) | 214 (2.6%) |
| 75 Years and over | 230 (5.6%) | 616 (10.0%) |
Technology Access in Chittenden County
Computing Device Access in Chittenden County
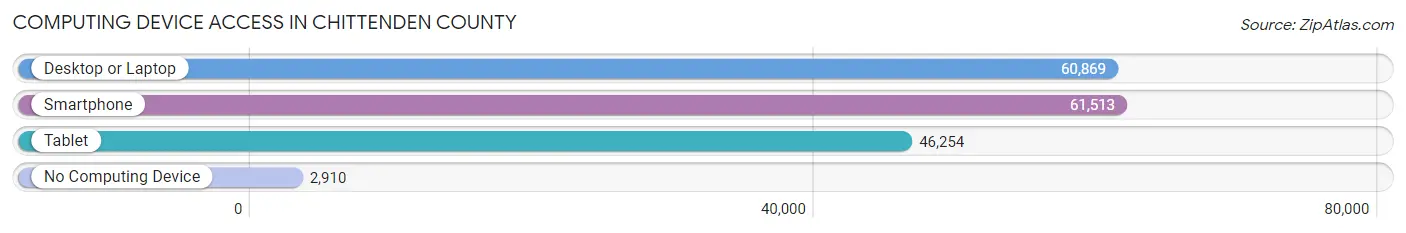
| Device Type | # Households | % Households |
| Desktop or Laptop | 60,869 | 87.8% |
| Smartphone | 61,513 | 88.7% |
| Tablet | 46,254 | 66.7% |
| No Computing Device | 2,910 | 4.2% |
| Total | 69,318 | 100.0% |
Internet Access in Chittenden County
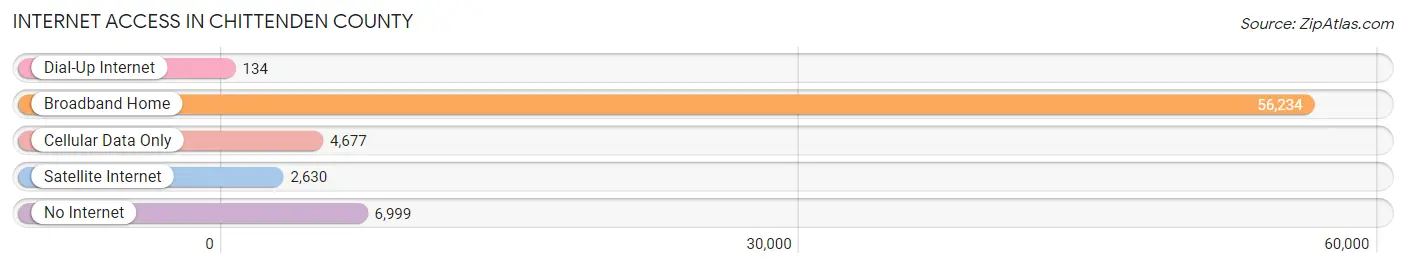
| Internet Type | # Households | % Households |
| Dial-Up Internet | 134 | 0.2% |
| Broadband Home | 56,234 | 81.1% |
| Cellular Data Only | 4,677 | 6.8% |
| Satellite Internet | 2,630 | 3.8% |
| No Internet | 6,999 | 10.1% |
| Total | 69,318 | 100.0% |
Chittenden County Summary
Chittenden County, Vermont is located in the northwestern corner of the state and is the most populous county in the state. It is bordered by the Adirondack Mountains to the west, Lake Champlain to the east, and the Green Mountains to the south. The county seat is Burlington, the largest city in the state.
History
Chittenden County was established in 1787 and was named after Thomas Chittenden, the first governor of Vermont. The county was originally part of the New Hampshire Grants, which were land grants given to settlers by the British government in the late 1700s. The area was first settled by the Abenaki people, who were later displaced by European settlers. The first permanent settlement in the county was established in 1763.
The county was an important center of the abolitionist movement in the early 1800s, and many of the county’s residents were involved in the Underground Railroad. The county was also home to the first African-American college in the United States, the University of Vermont.
Geography
Chittenden County covers an area of 845 square miles and is located in the northwestern corner of the state. The county is bordered by the Adirondack Mountains to the west, Lake Champlain to the east, and the Green Mountains to the south. The county is divided into two distinct regions: the Champlain Valley and the Green Mountains. The Champlain Valley is a flat, low-lying area that is home to the county’s largest city, Burlington. The Green Mountains are a rugged, mountainous region that is home to many of the county’s smaller towns and villages.
The county is home to several rivers, including the Winooski, Lamoille, and Missisquoi Rivers. The county is also home to several lakes, including Lake Champlain, Lake Iroquois, and Lake Carmi.
Economy
Chittenden County’s economy is largely based on agriculture, manufacturing, and tourism. The county is home to several large companies, including IBM, General Electric, and Burton Snowboards. The county is also home to several universities, including the University of Vermont and Champlain College.
The county is home to several tourist attractions, including the Shelburne Museum, the ECHO Lake Aquarium and Science Center, and the Vermont Teddy Bear Company. The county is also home to several ski resorts, including Stowe Mountain Resort and Smugglers’ Notch Resort.
Demographics
As of the 2010 census, Chittenden County had a population of 156,545. The population is largely white (94.3%), with small percentages of African-Americans (2.2%), Asians (1.7%), and Native Americans (0.5%). The median household income is $60,841, and the median home value is $250,000. The county has a poverty rate of 11.2%.
The county is home to several large cities, including Burlington (population 42,417), South Burlington (population 18,791), and Winooski (population 7,267). The county is also home to several smaller towns and villages, including Essex (population 8,593), Colchester (population 17,067), and Milton (population 6,968).
Common Questions
What is the Total Population of Chittenden County?
Total Population of Chittenden County is 168,309.
What is the Total Male Population of Chittenden County?
Total Male Population of Chittenden County is 83,053.
What is the Total Female Population of Chittenden County?
Total Female Population of Chittenden County is 85,256.
What is the Ratio of Males per 100 Females in Chittenden County?
There are 97.42 Males per 100 Females in Chittenden County.
What is the Ratio of Females per 100 Males in Chittenden County?
There are 102.65 Females per 100 Males in Chittenden County.
What is the Median Population Age in Chittenden County?
Median Population Age in Chittenden County is 36.7 Years.
What is the Average Family Size in Chittenden County
Average Family Size in Chittenden County is 2.9 People.
What is the Average Household Size in Chittenden County
Average Household Size in Chittenden County is 2.3 People.
What is Per Capita Income in Chittenden County?
Per Capita income in Chittenden County is $47,458.
What is the Median Family Income in Chittenden County?
Median Family Income in Chittenden County is $118,949.
What is the Median Household income in Chittenden County?
Median Household Income in Chittenden County is $89,494.
What is Income or Wage Gap in Chittenden County?
Income or Wage Gap in Chittenden County is 24.1%.
Women in Chittenden County earn 75.9 cents for every dollar earned by a man.
What is Family Income Deficit in Chittenden County?
Family Income Deficit in Chittenden County is $10,210.
Families that are below poverty line in Chittenden County earn $10,210 less on average than the poverty threshold level.
What is Inequality or Gini Index in Chittenden County?
Inequality or Gini Index in Chittenden County is 0.44.
How Large is the Labor Force in Chittenden County?
There are 99,578 People in the Labor Forcein in Chittenden County.
What is the Percentage of People in the Labor Force in Chittenden County?
69.7% of People are in the Labor Force in Chittenden County.
What is the Unemployment Rate in Chittenden County?
Unemployment Rate in Chittenden County is 3.9%.