Caledonia County, VT
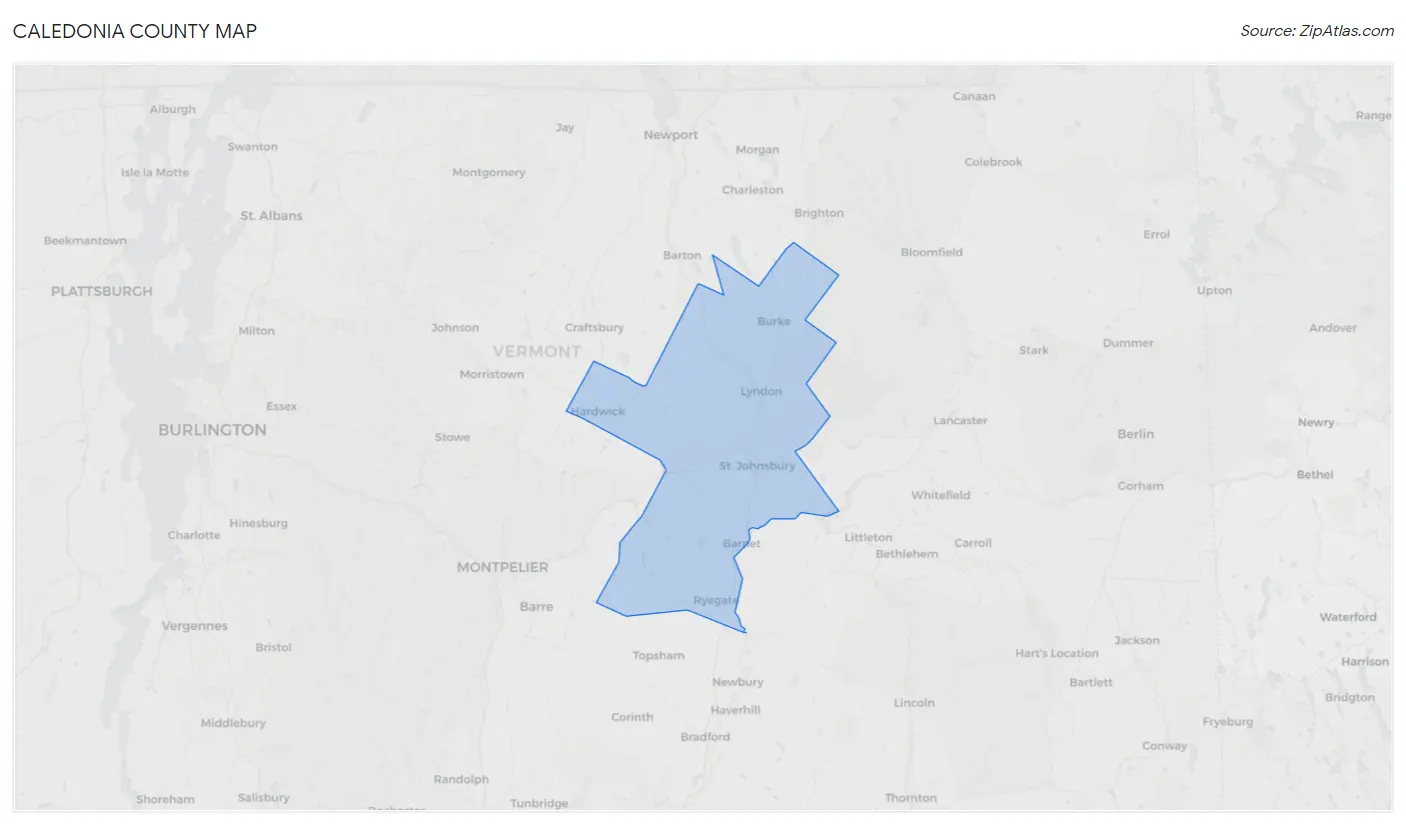
Caledonia County Map
Caledonia County Overview
30,418
TOTAL POPULATION
15,313
MALE POPULATION
15,105
FEMALE POPULATION
101.38
MALES / 100 FEMALES
98.64
FEMALES / 100 MALES
45.4
MEDIAN AGE
2.8
AVG FAMILY SIZE
2.3
AVG HOUSEHOLD SIZE
$36,604
PER CAPITA INCOME
$83,632
AVG FAMILY INCOME
$62,964
AVG HOUSEHOLD INCOME
19.4%
WAGE / INCOME GAP [ % ]
80.6¢/ $1
WAGE / INCOME GAP [ $ ]
$11,961
FAMILY INCOME DEFICIT
0.45
INEQUALITY / GINI INDEX
16,203
LABOR FORCE [ PEOPLE ]
63.7%
PERCENT IN LABOR FORCE
2.6%
UNEMPLOYMENT RATE
Caledonia County Area Codes
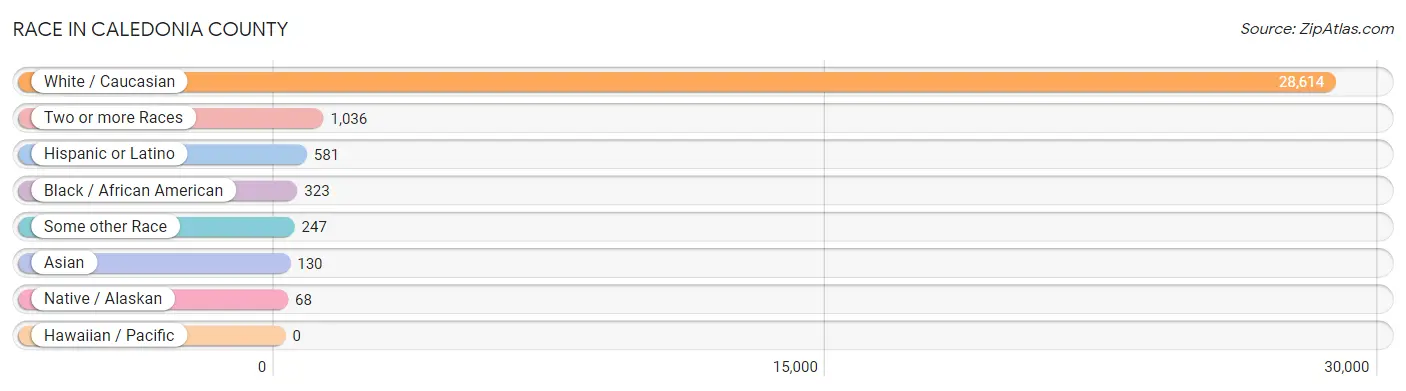
Race in Caledonia County
The most populous races in Caledonia County are White / Caucasian (28,614 | 94.1%), Two or more Races (1,036 | 3.4%), and Hispanic or Latino (581 | 1.9%).
| Race | # Population | % Population |
| Asian | 130 | 0.4% |
| Black / African American | 323 | 1.1% |
| Hawaiian / Pacific | 0 | 0.0% |
| Hispanic or Latino | 581 | 1.9% |
| Native / Alaskan | 68 | 0.2% |
| White / Caucasian | 28,614 | 94.1% |
| Two or more Races | 1,036 | 3.4% |
| Some other Race | 247 | 0.8% |
| Total | 30,418 | 100.0% |
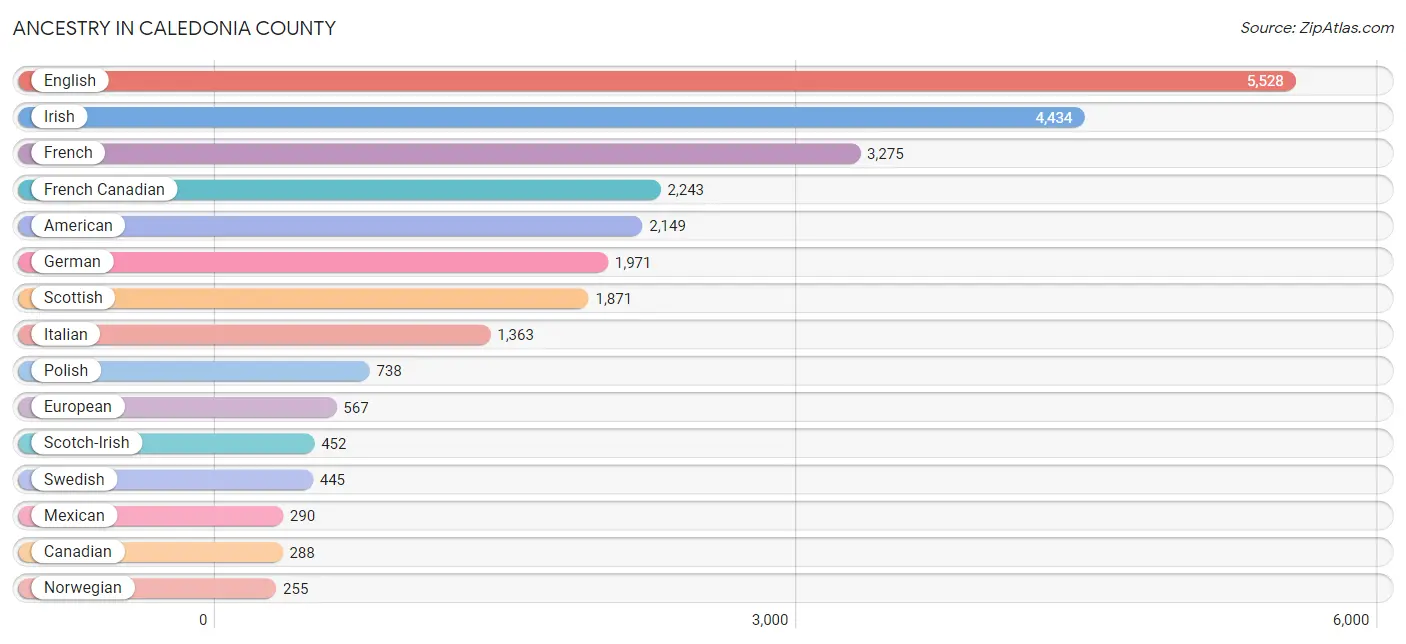
Ancestry in Caledonia County
The most populous ancestries reported in Caledonia County are English (5,528 | 18.2%), Irish (4,434 | 14.6%), French (3,275 | 10.8%), French Canadian (2,243 | 7.4%), and American (2,149 | 7.1%), together accounting for 58.0% of all Caledonia County residents.
| Ancestry | # Population | % Population |
| African | 27 | 0.1% |
| Albanian | 3 | 0.0% |
| Alsatian | 1 | 0.0% |
| American | 2,149 | 7.1% |
| Apache | 5 | 0.0% |
| Arab | 95 | 0.3% |
| Armenian | 15 | 0.1% |
| Australian | 4 | 0.0% |
| Austrian | 31 | 0.1% |
| Belgian | 43 | 0.1% |
| Bhutanese | 46 | 0.2% |
| Blackfeet | 2 | 0.0% |
| Brazilian | 17 | 0.1% |
| British | 167 | 0.5% |
| Burmese | 10 | 0.0% |
| Canadian | 288 | 0.9% |
| Celtic | 29 | 0.1% |
| Central American | 4 | 0.0% |
| Central American Indian | 16 | 0.1% |
| Cherokee | 50 | 0.2% |
| Choctaw | 9 | 0.0% |
| Colombian | 18 | 0.1% |
| Cree | 9 | 0.0% |
| Creek | 14 | 0.1% |
| Croatian | 21 | 0.1% |
| Cuban | 2 | 0.0% |
| Czech | 60 | 0.2% |
| Czechoslovakian | 15 | 0.1% |
| Danish | 54 | 0.2% |
| Dominican | 47 | 0.2% |
| Dutch | 245 | 0.8% |
| Eastern European | 44 | 0.1% |
| English | 5,528 | 18.2% |
| Ethiopian | 11 | 0.0% |
| European | 567 | 1.9% |
| Finnish | 109 | 0.4% |
| French | 3,275 | 10.8% |
| French American Indian | 53 | 0.2% |
| French Canadian | 2,243 | 7.4% |
| German | 1,971 | 6.5% |
| Greek | 48 | 0.2% |
| Guamanian / Chamorro | 12 | 0.0% |
| Guatemalan | 4 | 0.0% |
| Hungarian | 253 | 0.8% |
| Icelander | 8 | 0.0% |
| Indian (Asian) | 32 | 0.1% |
| Iranian | 17 | 0.1% |
| Irish | 4,434 | 14.6% |
| Israeli | 134 | 0.4% |
| Italian | 1,363 | 4.5% |
| Jamaican | 2 | 0.0% |
| Japanese | 12 | 0.0% |
| Korean | 181 | 0.6% |
| Lebanese | 56 | 0.2% |
| Lithuanian | 129 | 0.4% |
| Mexican | 290 | 0.9% |
| Moroccan | 3 | 0.0% |
| Native Hawaiian | 23 | 0.1% |
| Navajo | 34 | 0.1% |
| New Zealander | 24 | 0.1% |
| Nigerian | 4 | 0.0% |
| Northern European | 228 | 0.7% |
| Norwegian | 255 | 0.8% |
| Pennsylvania German | 19 | 0.1% |
| Polish | 738 | 2.4% |
| Portuguese | 220 | 0.7% |
| Potawatomi | 1 | 0.0% |
| Pueblo | 25 | 0.1% |
| Puerto Rican | 136 | 0.4% |
| Russian | 92 | 0.3% |
| Scandinavian | 104 | 0.3% |
| Scotch-Irish | 452 | 1.5% |
| Scottish | 1,871 | 6.1% |
| Serbian | 19 | 0.1% |
| Slovak | 104 | 0.3% |
| Slovene | 7 | 0.0% |
| South African | 14 | 0.1% |
| South American | 56 | 0.2% |
| Spaniard | 2 | 0.0% |
| Spanish | 35 | 0.1% |
| Subsaharan African | 56 | 0.2% |
| Swedish | 445 | 1.5% |
| Swiss | 31 | 0.1% |
| Syrian | 36 | 0.1% |
| Thai | 31 | 0.1% |
| Trinidadian and Tobagonian | 60 | 0.2% |
| Ukrainian | 43 | 0.1% |
| Uruguayan | 38 | 0.1% |
| Welsh | 203 | 0.7% |
| West Indian | 12 | 0.0% |
| Yugoslavian | 17 | 0.1% | View All 91 Rows |
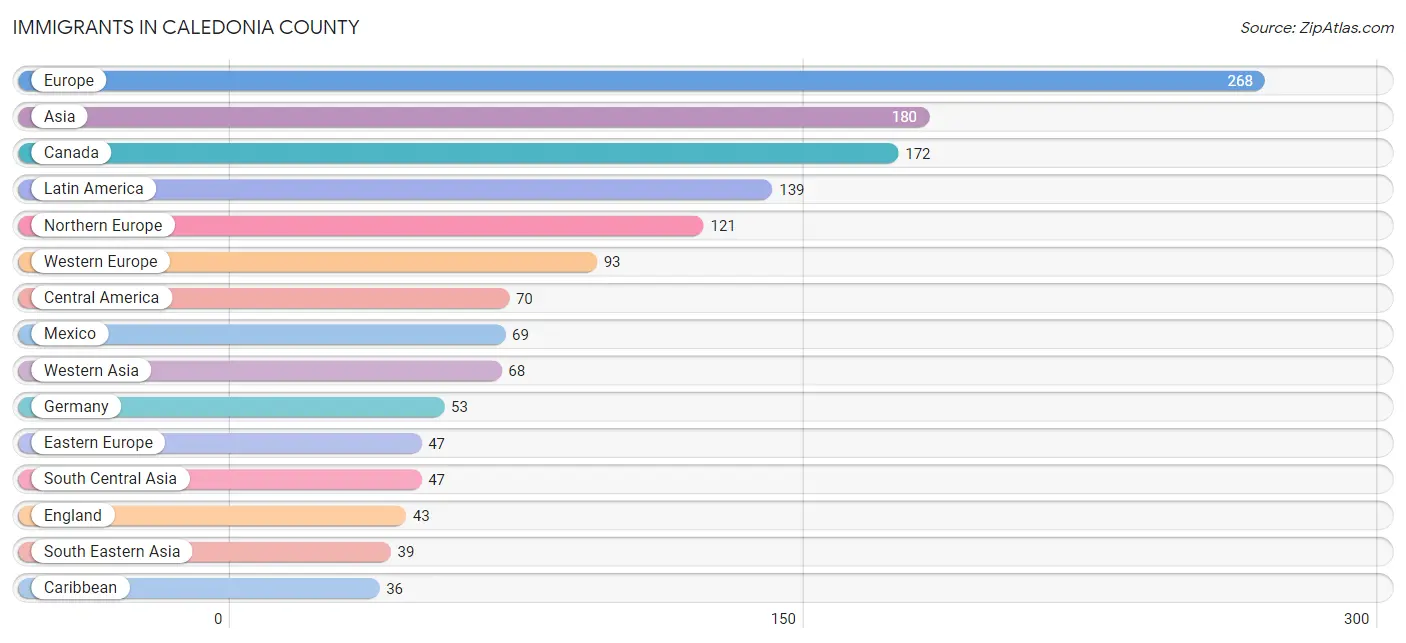
Immigrants in Caledonia County
The most numerous immigrant groups reported in Caledonia County came from Europe (268 | 0.9%), Asia (180 | 0.6%), Canada (172 | 0.6%), Latin America (139 | 0.5%), and Northern Europe (121 | 0.4%), together accounting for 2.9% of all Caledonia County residents.
| Immigration Origin | # Population | % Population |
| Africa | 35 | 0.1% |
| Asia | 180 | 0.6% |
| Australia | 3 | 0.0% |
| Austria | 2 | 0.0% |
| Belgium | 16 | 0.1% |
| Brazil | 16 | 0.1% |
| Cambodia | 12 | 0.0% |
| Canada | 172 | 0.6% |
| Caribbean | 36 | 0.1% |
| Central America | 70 | 0.2% |
| China | 4 | 0.0% |
| Colombia | 17 | 0.1% |
| Eastern Africa | 11 | 0.0% |
| Eastern Asia | 26 | 0.1% |
| Eastern Europe | 47 | 0.2% |
| England | 43 | 0.1% |
| Ethiopia | 11 | 0.0% |
| Europe | 268 | 0.9% |
| Germany | 53 | 0.2% |
| Guatemala | 1 | 0.0% |
| India | 8 | 0.0% |
| Iran | 13 | 0.0% |
| Israel | 32 | 0.1% |
| Italy | 7 | 0.0% |
| Jamaica | 11 | 0.0% |
| Japan | 12 | 0.0% |
| Korea | 10 | 0.0% |
| Latin America | 139 | 0.5% |
| Mexico | 69 | 0.2% |
| Nigeria | 4 | 0.0% |
| Northern Europe | 121 | 0.4% |
| Oceania | 3 | 0.0% |
| Pakistan | 26 | 0.1% |
| Philippines | 27 | 0.1% |
| Poland | 11 | 0.0% |
| Russia | 4 | 0.0% |
| South Africa | 20 | 0.1% |
| South America | 33 | 0.1% |
| South Central Asia | 47 | 0.2% |
| South Eastern Asia | 39 | 0.1% |
| Southern Europe | 7 | 0.0% |
| Switzerland | 22 | 0.1% |
| Trinidad and Tobago | 25 | 0.1% |
| Ukraine | 15 | 0.1% |
| Western Africa | 4 | 0.0% |
| Western Asia | 68 | 0.2% |
| Western Europe | 93 | 0.3% | View All 47 Rows |
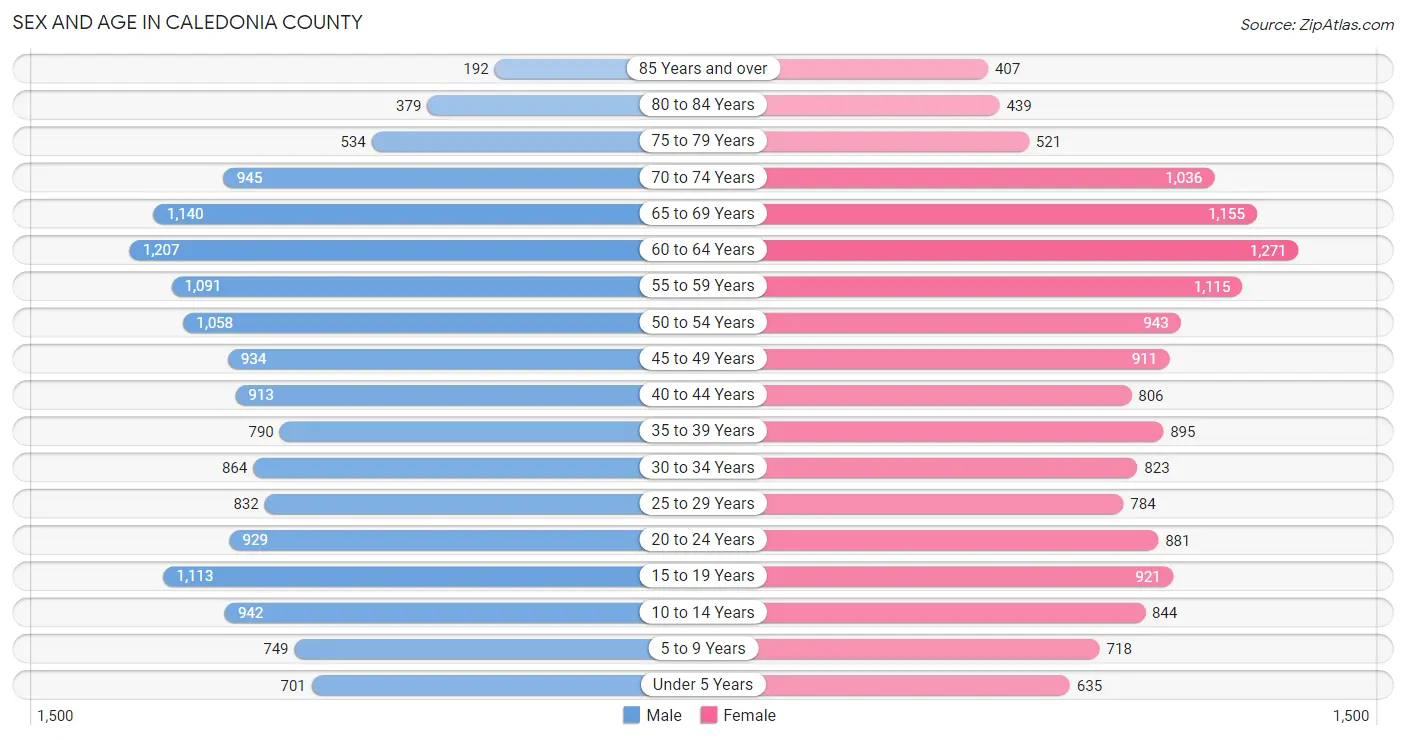
Sex and Age in Caledonia County
Sex and Age in Caledonia County
The most populous age groups in Caledonia County are 60 to 64 Years (1,207 | 7.9%) for men and 60 to 64 Years (1,271 | 8.4%) for women.
| Age Bracket | Male | Female |
| Under 5 Years | 701 (4.6%) | 635 (4.2%) |
| 5 to 9 Years | 749 (4.9%) | 718 (4.8%) |
| 10 to 14 Years | 942 (6.1%) | 844 (5.6%) |
| 15 to 19 Years | 1,113 (7.3%) | 921 (6.1%) |
| 20 to 24 Years | 929 (6.1%) | 881 (5.8%) |
| 25 to 29 Years | 832 (5.4%) | 784 (5.2%) |
| 30 to 34 Years | 864 (5.6%) | 823 (5.4%) |
| 35 to 39 Years | 790 (5.2%) | 895 (5.9%) |
| 40 to 44 Years | 913 (6.0%) | 806 (5.3%) |
| 45 to 49 Years | 934 (6.1%) | 911 (6.0%) |
| 50 to 54 Years | 1,058 (6.9%) | 943 (6.2%) |
| 55 to 59 Years | 1,091 (7.1%) | 1,115 (7.4%) |
| 60 to 64 Years | 1,207 (7.9%) | 1,271 (8.4%) |
| 65 to 69 Years | 1,140 (7.4%) | 1,155 (7.6%) |
| 70 to 74 Years | 945 (6.2%) | 1,036 (6.9%) |
| 75 to 79 Years | 534 (3.5%) | 521 (3.5%) |
| 80 to 84 Years | 379 (2.5%) | 439 (2.9%) |
| 85 Years and over | 192 (1.3%) | 407 (2.7%) |
| Total | 15,313 (100.0%) | 15,105 (100.0%) |
Families and Households in Caledonia County
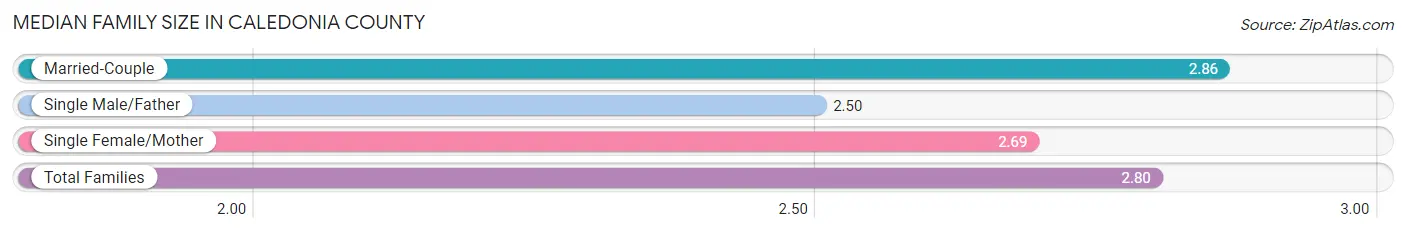
Median Family Size in Caledonia County
The median family size in Caledonia County is 2.80 persons per family, with married-couple families (5,991 | 76.1%) accounting for the largest median family size of 2.86 persons per family. On the other hand, single male/father families (599 | 7.6%) represent the smallest median family size with 2.50 persons per family.
| Family Type | # Families | Family Size |
| Married-Couple | 5,991 (76.1%) | 2.86 |
| Single Male/Father | 599 (7.6%) | 2.50 |
| Single Female/Mother | 1,279 (16.3%) | 2.69 |
| Total Families | 7,869 (100.0%) | 2.80 |
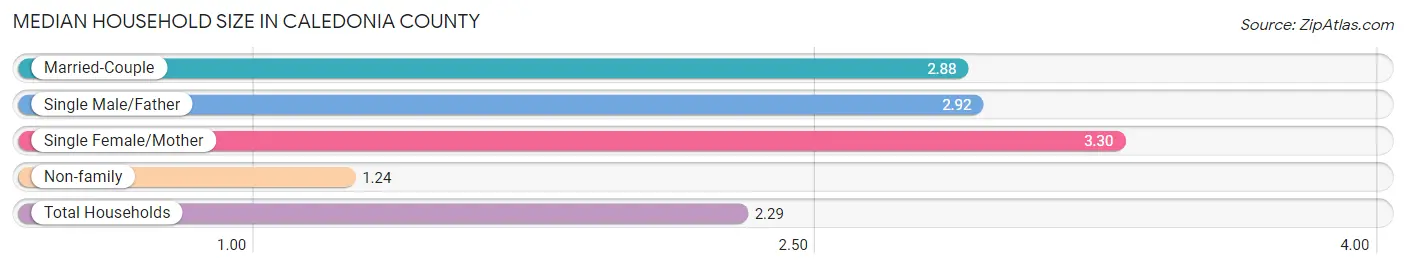
Median Household Size in Caledonia County
The median household size in Caledonia County is 2.29 persons per household, with single female/mother households (1,279 | 10.0%) accounting for the largest median household size of 3.3 persons per household. non-family households (4,950 | 38.6%) represent the smallest median household size with 1.24 persons per household.
| Household Type | # Households | Household Size |
| Married-Couple | 5,991 (46.7%) | 2.88 |
| Single Male/Father | 599 (4.7%) | 2.92 |
| Single Female/Mother | 1,279 (10.0%) | 3.30 |
| Non-family | 4,950 (38.6%) | 1.24 |
| Total Households | 12,819 (100.0%) | 2.29 |
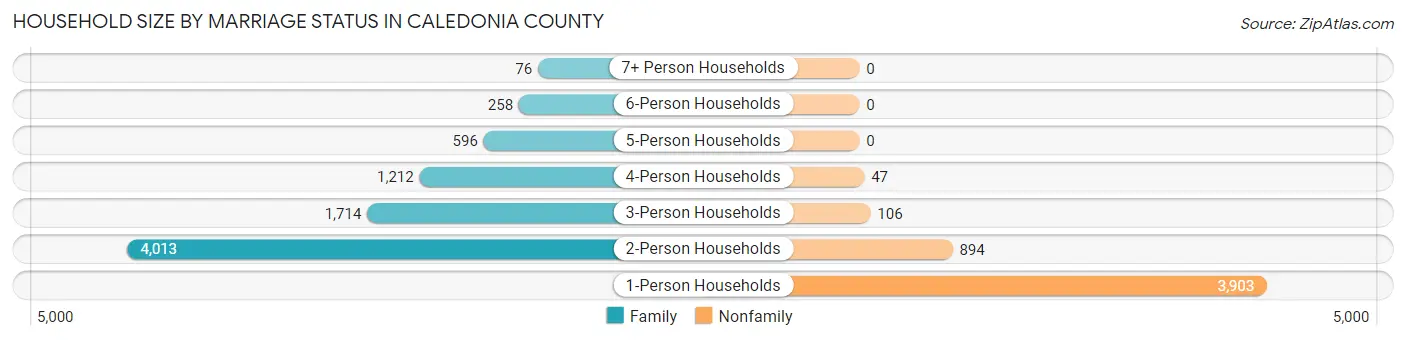
Household Size by Marriage Status in Caledonia County
Out of a total of 12,819 households in Caledonia County, 7,869 (61.4%) are family households, while 4,950 (38.6%) are nonfamily households. The most numerous type of family households are 2-person households, comprising 4,013, and the most common type of nonfamily households are 1-person households, comprising 3,903.
| Household Size | Family Households | Nonfamily Households |
| 1-Person Households | - | 3,903 (30.4%) |
| 2-Person Households | 4,013 (31.3%) | 894 (7.0%) |
| 3-Person Households | 1,714 (13.4%) | 106 (0.8%) |
| 4-Person Households | 1,212 (9.5%) | 47 (0.4%) |
| 5-Person Households | 596 (4.6%) | 0 (0.0%) |
| 6-Person Households | 258 (2.0%) | 0 (0.0%) |
| 7+ Person Households | 76 (0.6%) | 0 (0.0%) |
| Total | 7,869 (61.4%) | 4,950 (38.6%) |
Female Fertility in Caledonia County
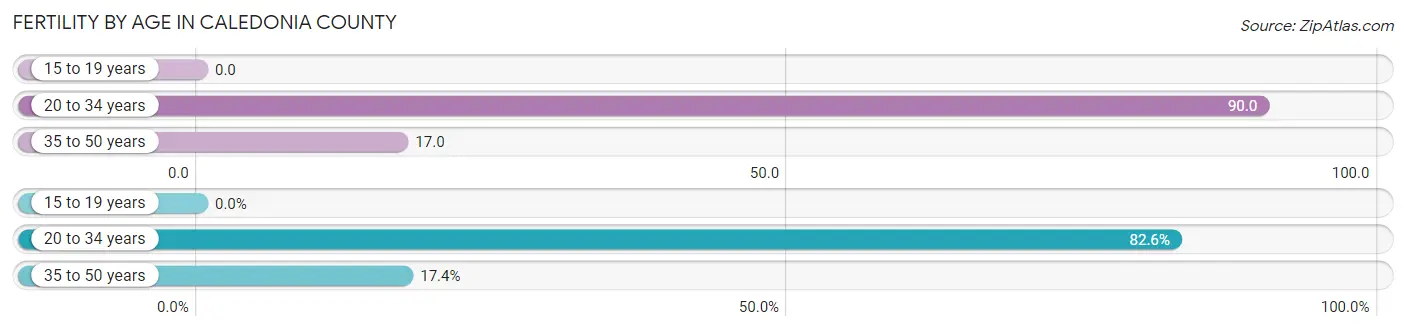
Fertility by Age in Caledonia County
Average fertility rate in Caledonia County is 44.0 births per 1,000 women. Women in the age bracket of 20 to 34 years have the highest fertility rate with 90.0 births per 1,000 women. Women in the age bracket of 20 to 34 years acount for 82.6% of all women with births.
| Age Bracket | Women with Births | Births / 1,000 Women |
| 15 to 19 years | 0 (0.0%) | 0.0 |
| 20 to 34 years | 223 (82.6%) | 90.0 |
| 35 to 50 years | 47 (17.4%) | 17.0 |
| Total | 270 (100.0%) | 44.0 |
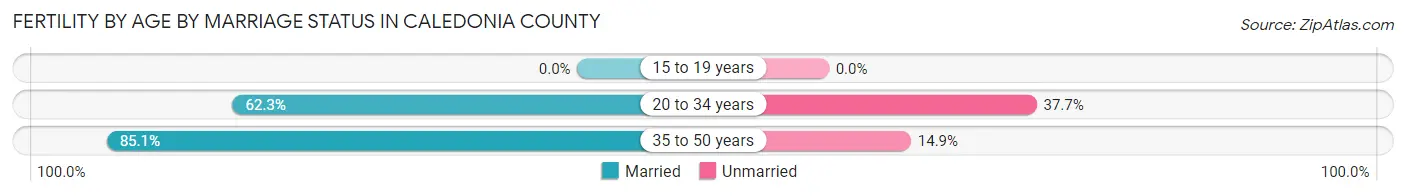
Fertility by Age by Marriage Status in Caledonia County
66.3% of women with births (270) in Caledonia County are married. The highest percentage of unmarried women with births falls into 20 to 34 years age bracket with 37.7% of them unmarried at the time of birth, while the lowest percentage of unmarried women with births belong to 35 to 50 years age bracket with 14.9% of them unmarried.
| Age Bracket | Married | Unmarried |
| 15 to 19 years | 0 (0.0%) | 0 (0.0%) |
| 20 to 34 years | 139 (62.3%) | 84 (37.7%) |
| 35 to 50 years | 40 (85.1%) | 7 (14.9%) |
| Total | 179 (66.3%) | 91 (33.7%) |
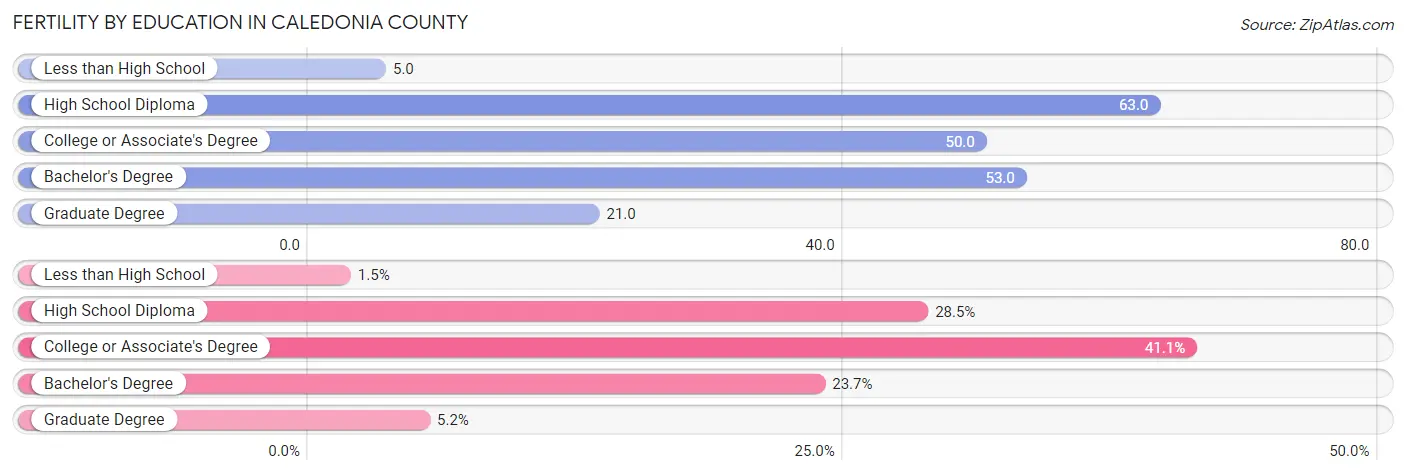
Fertility by Education in Caledonia County
Average fertility rate in Caledonia County is 44.0 births per 1,000 women. Women with the education attainment of high school diploma have the highest fertility rate of 63.0 births per 1,000 women, while women with the education attainment of less than high school have the lowest fertility at 5.0 births per 1,000 women. Women with the education attainment of college or associate's degree represent 41.1% of all women with births.
| Educational Attainment | Women with Births | Births / 1,000 Women |
| Less than High School | 4 (1.5%) | 5.0 |
| High School Diploma | 77 (28.5%) | 63.0 |
| College or Associate's Degree | 111 (41.1%) | 50.0 |
| Bachelor's Degree | 64 (23.7%) | 53.0 |
| Graduate Degree | 14 (5.2%) | 21.0 |
| Total | 270 (100.0%) | 44.0 |
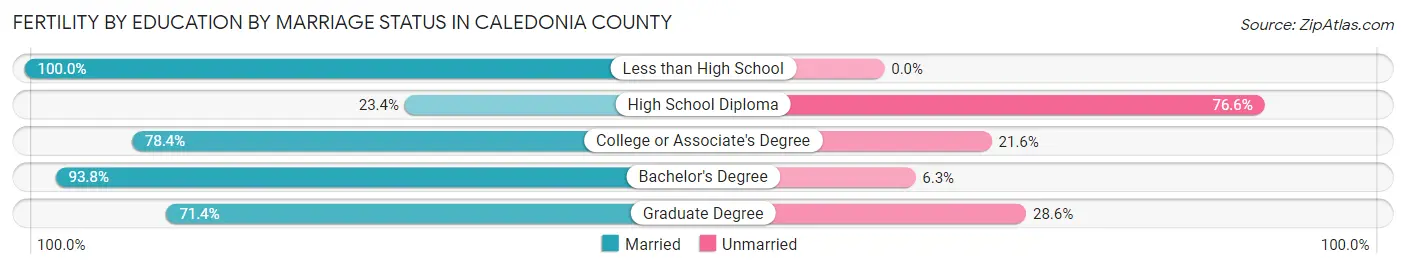
Fertility by Education by Marriage Status in Caledonia County
33.7% of women with births in Caledonia County are unmarried. Women with the educational attainment of less than high school are most likely to be married with 100.0% of them married at childbirth, while women with the educational attainment of high school diploma are least likely to be married with 76.6% of them unmarried at childbirth.
| Educational Attainment | Married | Unmarried |
| Less than High School | 4 (100.0%) | 0 (0.0%) |
| High School Diploma | 18 (23.4%) | 59 (76.6%) |
| College or Associate's Degree | 87 (78.4%) | 24 (21.6%) |
| Bachelor's Degree | 60 (93.8%) | 4 (6.2%) |
| Graduate Degree | 10 (71.4%) | 4 (28.6%) |
| Total | 179 (66.3%) | 91 (33.7%) |
Income in Caledonia County
Income Overview in Caledonia County
Per Capita Income in Caledonia County is $36,604, while median incomes of families and households are $83,632 and $62,964 respectively.
| Characteristic | Number | Measure |
| Per Capita Income | 30,418 | $36,604 |
| Median Family Income | 7,869 | $83,632 |
| Mean Family Income | 7,869 | $100,965 |
| Median Household Income | 12,819 | $62,964 |
| Mean Household Income | 12,819 | $84,309 |
| Income Deficit | 7,869 | $11,961 |
| Wage / Income Gap (%) | 30,418 | 19.39% |
| Wage / Income Gap ($) | 30,418 | 80.61¢ per $1 |
| Gini / Inequality Index | 30,418 | 0.45 |
Earnings by Sex in Caledonia County
Average Earnings in Caledonia County are $36,171, $40,245 for men and $32,440 for women, a difference of 19.4%.
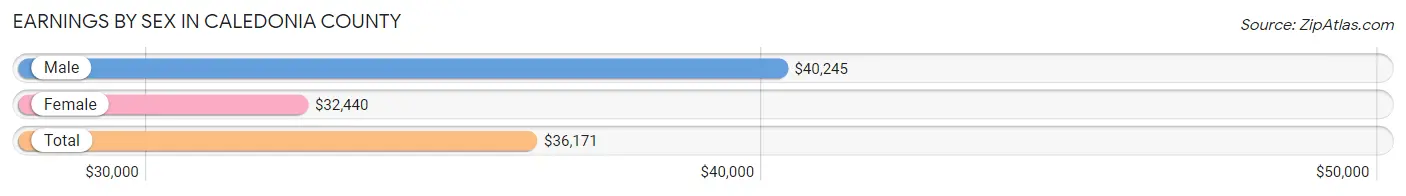
| Sex | Number | Average Earnings |
| Male | 9,159 (52.5%) | $40,245 |
| Female | 8,289 (47.5%) | $32,440 |
| Total | 17,448 (100.0%) | $36,171 |
Earnings by Sex by Income Bracket in Caledonia County
The most common earnings brackets in Caledonia County are $100,000+ for men (991 | 10.8%) and $30,000 to $34,999 for women (596 | 7.2%).
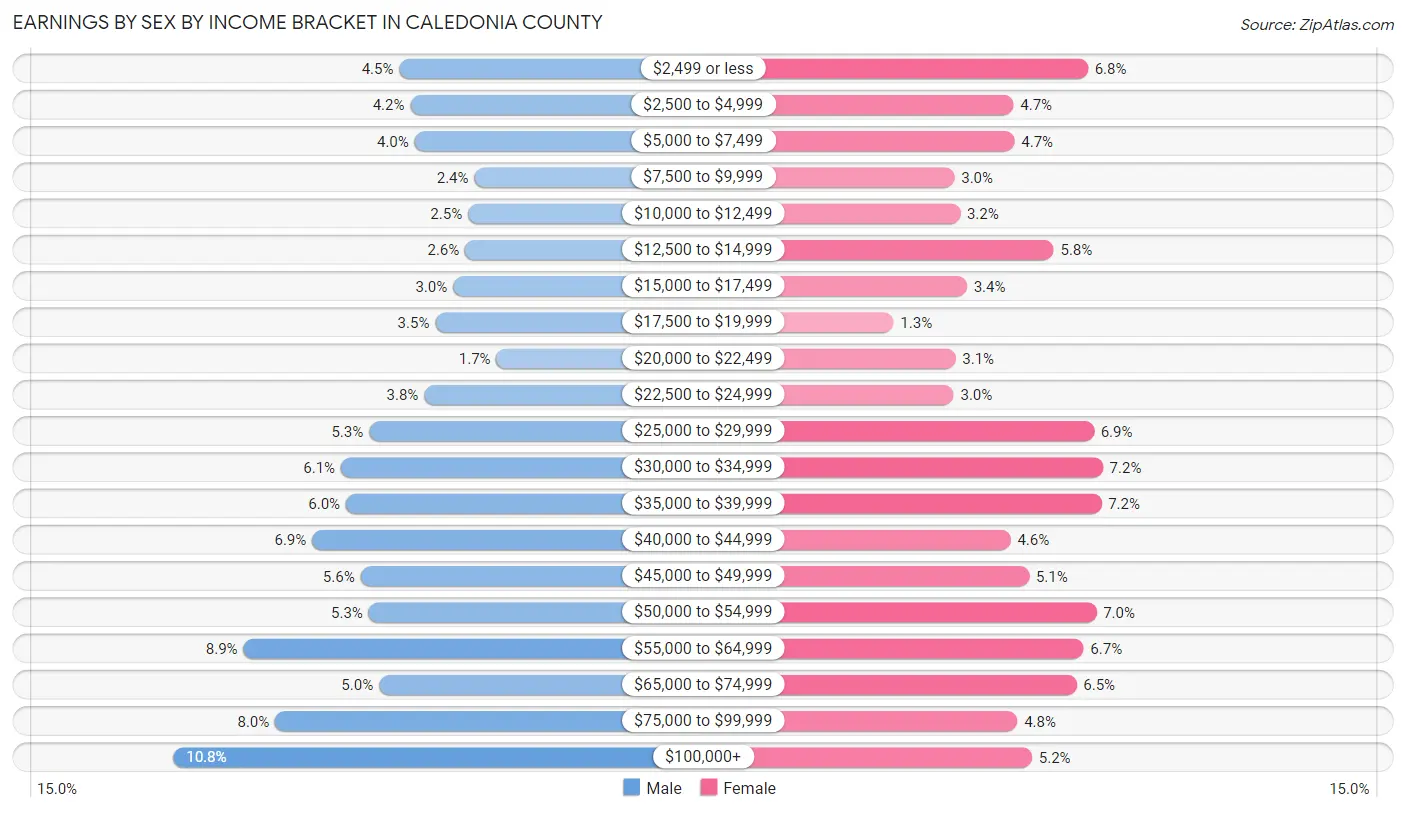
| Income | Male | Female |
| $2,499 or less | 409 (4.5%) | 561 (6.8%) |
| $2,500 to $4,999 | 381 (4.2%) | 388 (4.7%) |
| $5,000 to $7,499 | 370 (4.0%) | 390 (4.7%) |
| $7,500 to $9,999 | 216 (2.4%) | 250 (3.0%) |
| $10,000 to $12,499 | 233 (2.5%) | 264 (3.2%) |
| $12,500 to $14,999 | 240 (2.6%) | 482 (5.8%) |
| $15,000 to $17,499 | 271 (3.0%) | 279 (3.4%) |
| $17,500 to $19,999 | 317 (3.5%) | 109 (1.3%) |
| $20,000 to $22,499 | 159 (1.7%) | 253 (3.0%) |
| $22,500 to $24,999 | 345 (3.8%) | 249 (3.0%) |
| $25,000 to $29,999 | 487 (5.3%) | 575 (6.9%) |
| $30,000 to $34,999 | 560 (6.1%) | 596 (7.2%) |
| $35,000 to $39,999 | 547 (6.0%) | 593 (7.1%) |
| $40,000 to $44,999 | 634 (6.9%) | 381 (4.6%) |
| $45,000 to $49,999 | 509 (5.6%) | 424 (5.1%) |
| $50,000 to $54,999 | 488 (5.3%) | 581 (7.0%) |
| $55,000 to $64,999 | 811 (8.8%) | 551 (6.7%) |
| $65,000 to $74,999 | 462 (5.0%) | 535 (6.5%) |
| $75,000 to $99,999 | 729 (8.0%) | 397 (4.8%) |
| $100,000+ | 991 (10.8%) | 431 (5.2%) |
| Total | 9,159 (100.0%) | 8,289 (100.0%) |
Earnings by Sex by Educational Attainment in Caledonia County
Average earnings in Caledonia County are $45,204 for men and $37,315 for women, a difference of 17.4%. Men with an educational attainment of graduate degree enjoy the highest average annual earnings of $66,500, while those with less than high school education earn the least with $38,889. Women with an educational attainment of graduate degree earn the most with the average annual earnings of $63,507, while those with high school diploma education have the smallest earnings of $30,094.
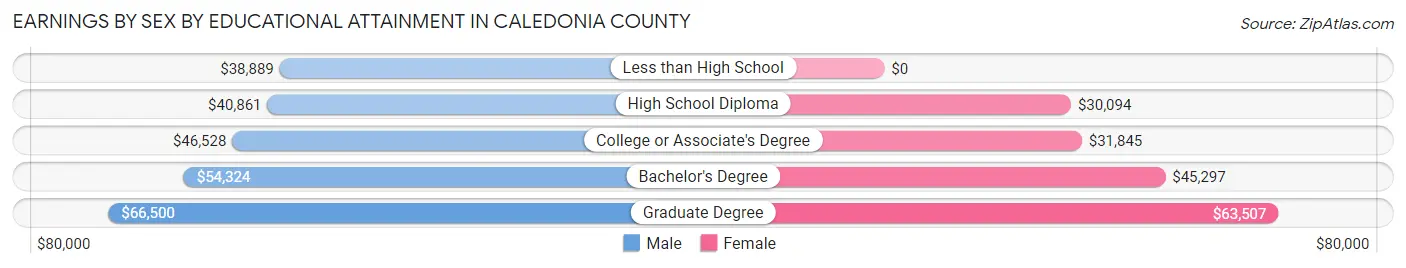
| Educational Attainment | Male Income | Female Income |
| Less than High School | $38,889 | $0 |
| High School Diploma | $40,861 | $30,094 |
| College or Associate's Degree | $46,528 | $31,845 |
| Bachelor's Degree | $54,324 | $45,297 |
| Graduate Degree | $66,500 | $63,507 |
| Total | $45,204 | $37,315 |
Family Income in Caledonia County
Family Income Brackets in Caledonia County
According to the Caledonia County family income data, there are 1,833 families falling into the $100,000 to $149,999 income range, which is the most common income bracket and makes up 23.3% of all families. Conversely, the $10,000 to $14,999 income bracket is the least frequent group with only 126 families (1.6%) belonging to this category.
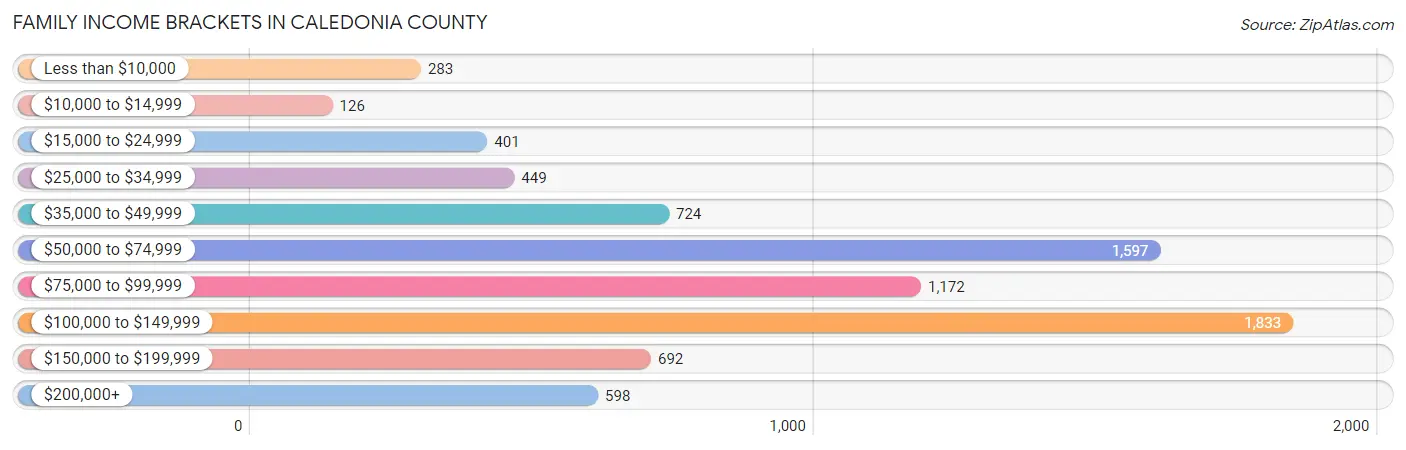
| Income Bracket | # Families | % Families |
| Less than $10,000 | 283 | 3.6% |
| $10,000 to $14,999 | 126 | 1.6% |
| $15,000 to $24,999 | 401 | 5.1% |
| $25,000 to $34,999 | 449 | 5.7% |
| $35,000 to $49,999 | 724 | 9.2% |
| $50,000 to $74,999 | 1,597 | 20.3% |
| $75,000 to $99,999 | 1,172 | 14.9% |
| $100,000 to $149,999 | 1,833 | 23.3% |
| $150,000 to $199,999 | 692 | 8.8% |
| $200,000+ | 598 | 7.6% |
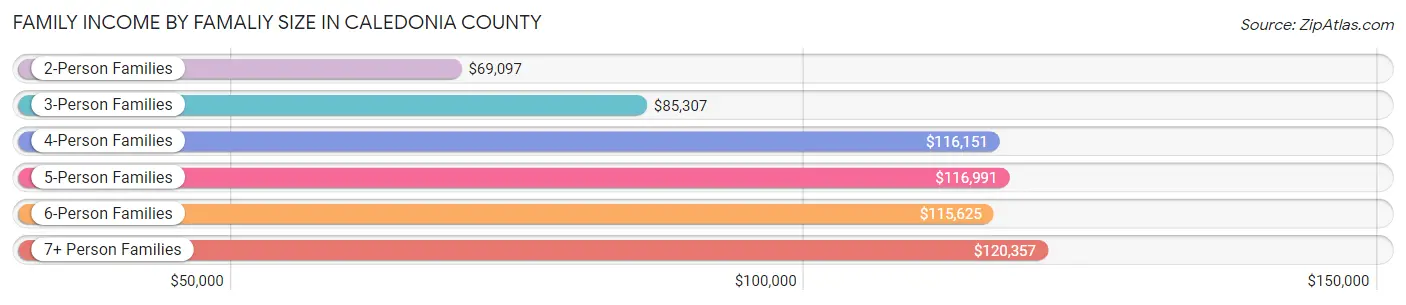
Family Income by Famaliy Size in Caledonia County
7+ person families (36 | 0.5%) account for the highest median family income in Caledonia County with $120,357 per family, while 2-person families (4,369 | 55.5%) have the highest median income of $34,548 per family member.
| Income Bracket | # Families | Median Income |
| 2-Person Families | 4,369 (55.5%) | $69,097 |
| 3-Person Families | 1,654 (21.0%) | $85,307 |
| 4-Person Families | 1,035 (13.2%) | $116,151 |
| 5-Person Families | 529 (6.7%) | $116,991 |
| 6-Person Families | 246 (3.1%) | $115,625 |
| 7+ Person Families | 36 (0.5%) | $120,357 |
| Total | 7,869 (100.0%) | $83,632 |
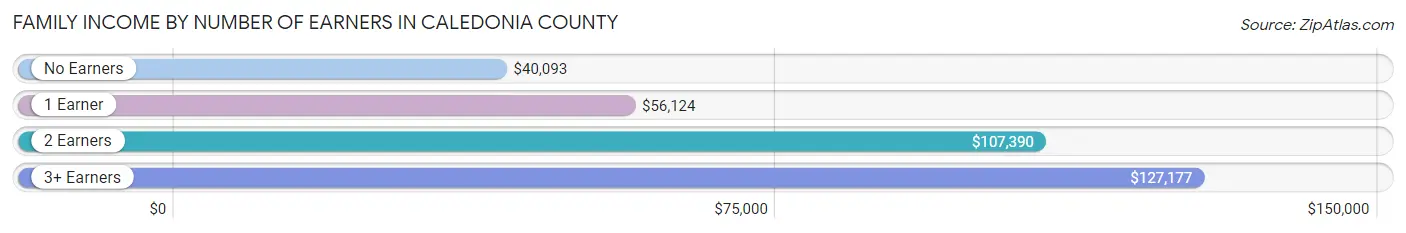
Family Income by Number of Earners in Caledonia County
The median family income in Caledonia County is $83,632, with families comprising 3+ earners (772) having the highest median family income of $127,177, while families with no earners (1,311) have the lowest median family income of $40,093, accounting for 9.8% and 16.7% of families, respectively.
| Number of Earners | # Families | Median Income |
| No Earners | 1,311 (16.7%) | $40,093 |
| 1 Earner | 2,245 (28.5%) | $56,124 |
| 2 Earners | 3,541 (45.0%) | $107,390 |
| 3+ Earners | 772 (9.8%) | $127,177 |
| Total | 7,869 (100.0%) | $83,632 |
Household Income in Caledonia County
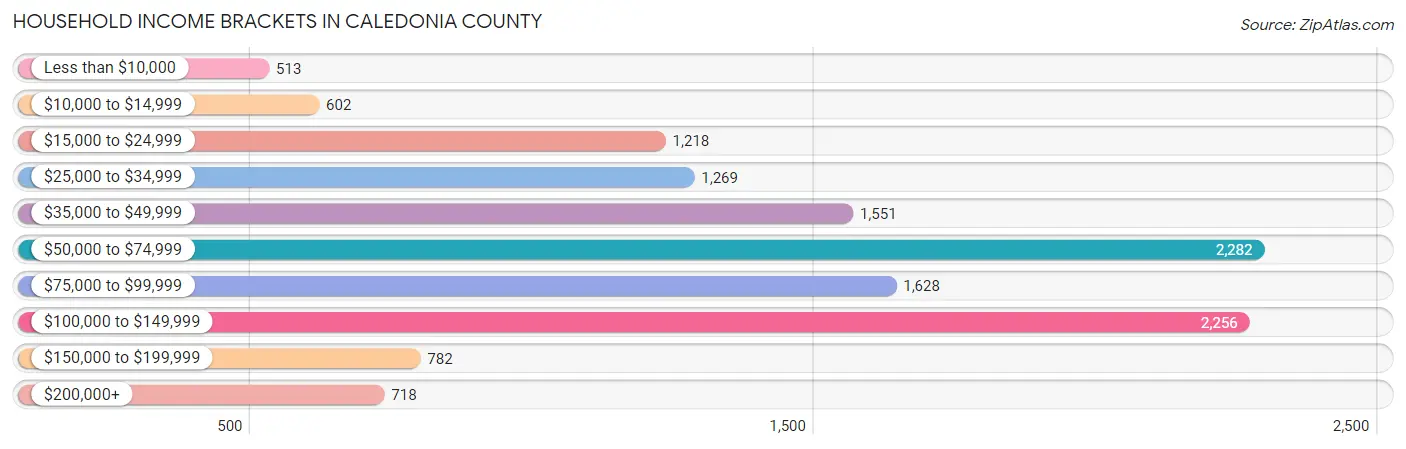
Household Income Brackets in Caledonia County
With 2,282 households falling in the category, the $50,000 to $74,999 income range is the most frequent in Caledonia County, accounting for 17.8% of all households. In contrast, only 513 households (4.0%) fall into the less than $10,000 income bracket, making it the least populous group.
| Income Bracket | # Households | % Households |
| Less than $10,000 | 513 | 4.0% |
| $10,000 to $14,999 | 602 | 4.7% |
| $15,000 to $24,999 | 1,218 | 9.5% |
| $25,000 to $34,999 | 1,269 | 9.9% |
| $35,000 to $49,999 | 1,551 | 12.1% |
| $50,000 to $74,999 | 2,282 | 17.8% |
| $75,000 to $99,999 | 1,628 | 12.7% |
| $100,000 to $149,999 | 2,256 | 17.6% |
| $150,000 to $199,999 | 782 | 6.1% |
| $200,000+ | 718 | 5.6% |
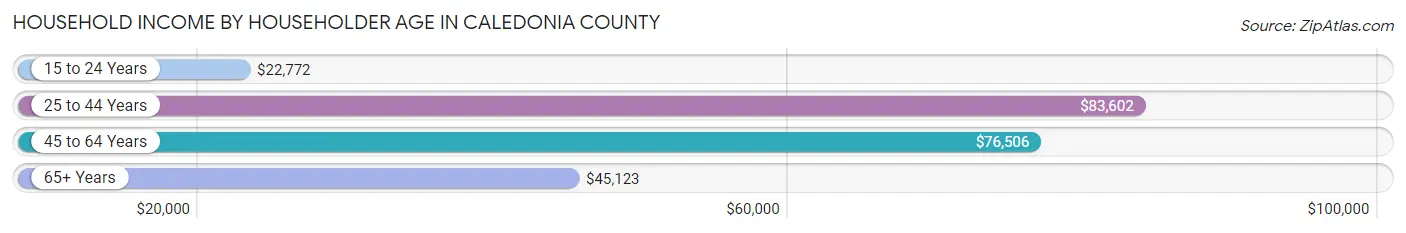
Household Income by Householder Age in Caledonia County
The median household income in Caledonia County is $62,964, with the highest median household income of $83,602 found in the 25 to 44 years age bracket for the primary householder. A total of 3,318 households (25.9%) fall into this category. Meanwhile, the 15 to 24 years age bracket for the primary householder has the lowest median household income of $22,772, with 461 households (3.6%) in this group.
| Income Bracket | # Households | Median Income |
| 15 to 24 Years | 461 (3.6%) | $22,772 |
| 25 to 44 Years | 3,318 (25.9%) | $83,602 |
| 45 to 64 Years | 4,854 (37.9%) | $76,506 |
| 65+ Years | 4,186 (32.7%) | $45,123 |
| Total | 12,819 (100.0%) | $62,964 |
Poverty in Caledonia County
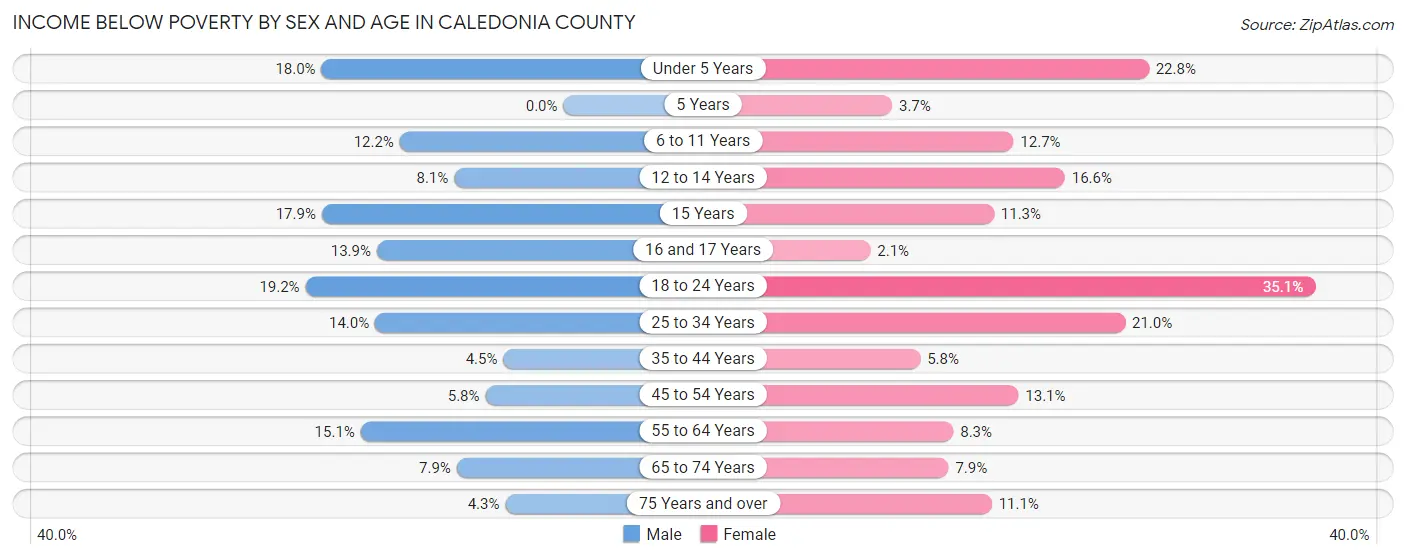
Income Below Poverty by Sex and Age in Caledonia County
With 10.6% poverty level for males and 13.0% for females among the residents of Caledonia County, 18 to 24 year old males and 18 to 24 year old females are the most vulnerable to poverty, with 240 males (19.2%) and 359 females (35.1%) in their respective age groups living below the poverty level.
| Age Bracket | Male | Female |
| Under 5 Years | 125 (18.0%) | 142 (22.8%) |
| 5 Years | 0 (0.0%) | 6 (3.7%) |
| 6 to 11 Years | 101 (12.1%) | 105 (12.7%) |
| 12 to 14 Years | 51 (8.1%) | 80 (16.6%) |
| 15 Years | 47 (17.9%) | 14 (11.3%) |
| 16 and 17 Years | 50 (13.9%) | 9 (2.1%) |
| 18 to 24 Years | 240 (19.2%) | 359 (35.1%) |
| 25 to 34 Years | 232 (14.0%) | 338 (21.0%) |
| 35 to 44 Years | 72 (4.5%) | 99 (5.8%) |
| 45 to 54 Years | 115 (5.8%) | 243 (13.1%) |
| 55 to 64 Years | 342 (15.0%) | 197 (8.3%) |
| 65 to 74 Years | 164 (7.9%) | 173 (7.9%) |
| 75 Years and over | 47 (4.3%) | 149 (11.1%) |
| Total | 1,586 (10.6%) | 1,914 (13.0%) |
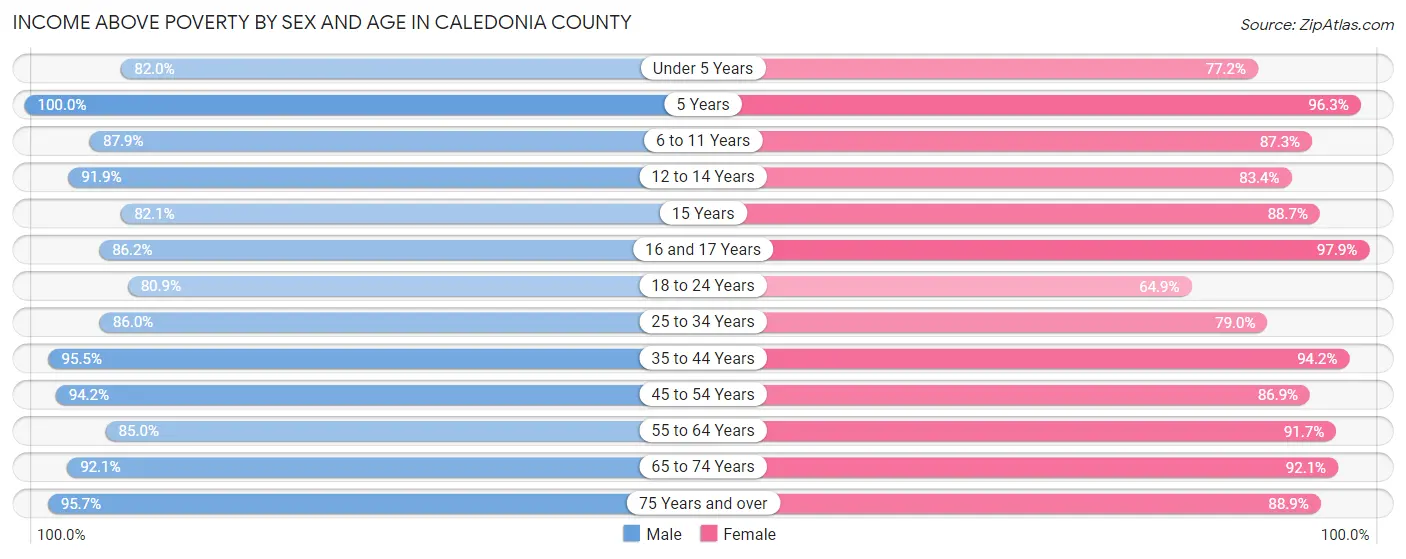
Income Above Poverty by Sex and Age in Caledonia County
According to the poverty statistics in Caledonia County, males aged 5 years and females aged 16 and 17 years are the age groups that are most secure financially, with 100.0% of males and 97.9% of females in these age groups living above the poverty line.
| Age Bracket | Male | Female |
| Under 5 Years | 571 (82.0%) | 481 (77.2%) |
| 5 Years | 182 (100.0%) | 155 (96.3%) |
| 6 to 11 Years | 730 (87.8%) | 719 (87.3%) |
| 12 to 14 Years | 578 (91.9%) | 403 (83.4%) |
| 15 Years | 215 (82.1%) | 110 (88.7%) |
| 16 and 17 Years | 311 (86.2%) | 416 (97.9%) |
| 18 to 24 Years | 1,013 (80.8%) | 663 (64.9%) |
| 25 to 34 Years | 1,427 (86.0%) | 1,269 (79.0%) |
| 35 to 44 Years | 1,543 (95.5%) | 1,602 (94.2%) |
| 45 to 54 Years | 1,871 (94.2%) | 1,611 (86.9%) |
| 55 to 64 Years | 1,931 (85.0%) | 2,181 (91.7%) |
| 65 to 74 Years | 1,908 (92.1%) | 2,012 (92.1%) |
| 75 Years and over | 1,044 (95.7%) | 1,190 (88.9%) |
| Total | 13,324 (89.4%) | 12,812 (87.0%) |
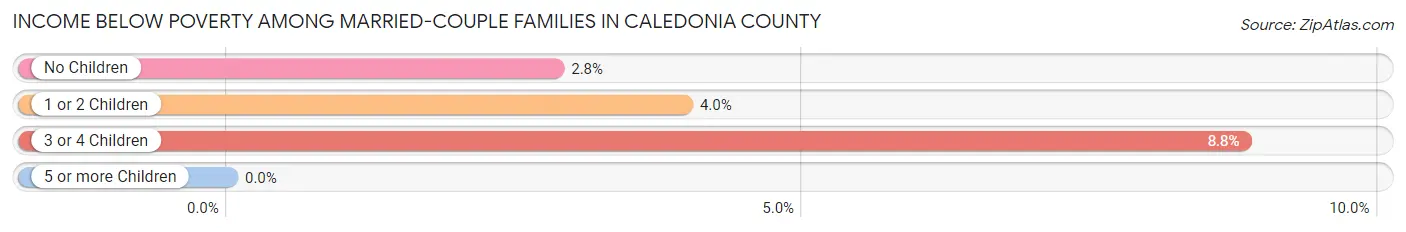
Income Below Poverty Among Married-Couple Families in Caledonia County
The poverty statistics for married-couple families in Caledonia County show that 3.7% or 221 of the total 5,991 families live below the poverty line. Families with 3 or 4 children have the highest poverty rate of 8.8%, comprising of 50 families. On the other hand, families with 5 or more children have the lowest poverty rate of 0.0%, which includes 0 families.
| Children | Above Poverty | Below Poverty |
| No Children | 3,725 (97.2%) | 109 (2.8%) |
| 1 or 2 Children | 1,503 (96.0%) | 62 (4.0%) |
| 3 or 4 Children | 517 (91.2%) | 50 (8.8%) |
| 5 or more Children | 25 (100.0%) | 0 (0.0%) |
| Total | 5,770 (96.3%) | 221 (3.7%) |
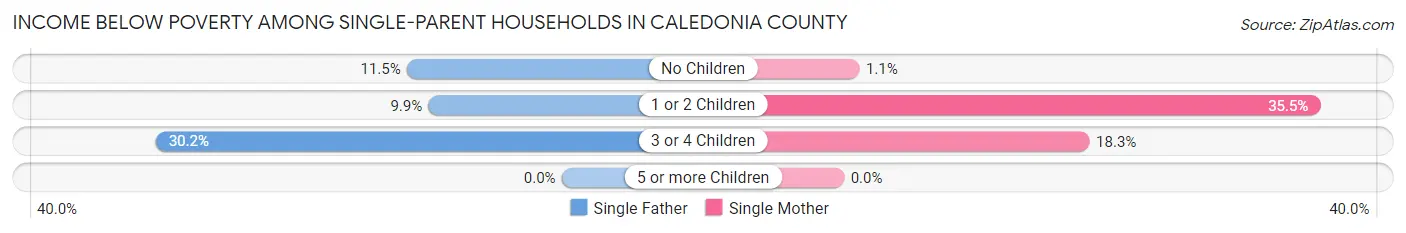
Income Below Poverty Among Single-Parent Households in Caledonia County
According to the poverty data in Caledonia County, 12.0% or 72 single-father households and 24.9% or 319 single-mother households are living below the poverty line. Among single-father households, those with 3 or 4 children have the highest poverty rate, with 13 households (30.2%) experiencing poverty. Likewise, among single-mother households, those with 1 or 2 children have the highest poverty rate, with 300 households (35.5%) falling below the poverty line.
| Children | Single Father | Single Mother |
| No Children | 27 (11.5%) | 4 (1.1%) |
| 1 or 2 Children | 32 (9.9%) | 300 (35.5%) |
| 3 or 4 Children | 13 (30.2%) | 15 (18.3%) |
| 5 or more Children | 0 (0.0%) | 0 (0.0%) |
| Total | 72 (12.0%) | 319 (24.9%) |
Income Below Poverty Among Married-Couple vs Single-Parent Households in Caledonia County
The poverty data for Caledonia County shows that 221 of the married-couple family households (3.7%) and 391 of the single-parent households (20.8%) are living below the poverty level. Within the married-couple family households, those with 3 or 4 children have the highest poverty rate, with 50 households (8.8%) falling below the poverty line. Among the single-parent households, those with 1 or 2 children have the highest poverty rate, with 332 household (28.4%) living below poverty.
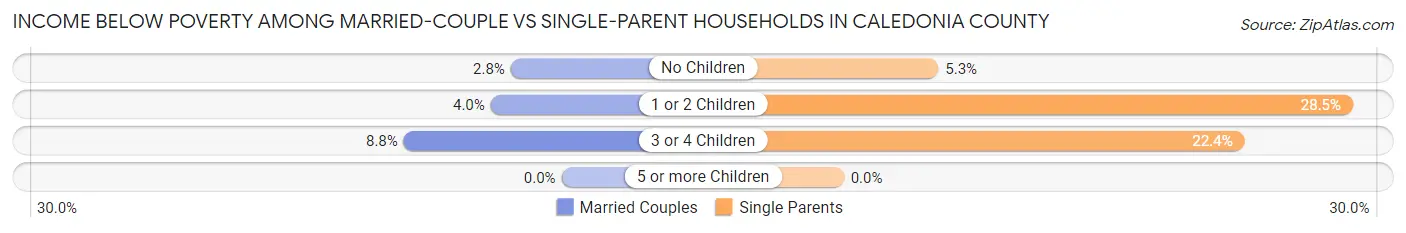
| Children | Married-Couple Families | Single-Parent Households |
| No Children | 109 (2.8%) | 31 (5.3%) |
| 1 or 2 Children | 62 (4.0%) | 332 (28.4%) |
| 3 or 4 Children | 50 (8.8%) | 28 (22.4%) |
| 5 or more Children | 0 (0.0%) | 0 (0.0%) |
| Total | 221 (3.7%) | 391 (20.8%) |
Employment Characteristics in Caledonia County
Employment by Class of Employer in Caledonia County
Among the 15,234 employed individuals in Caledonia County, private company employees (8,364 | 54.9%), not-for-profit organizations (2,479 | 16.3%), and local government employees (1,554 | 10.2%) make up the most common classes of employment.
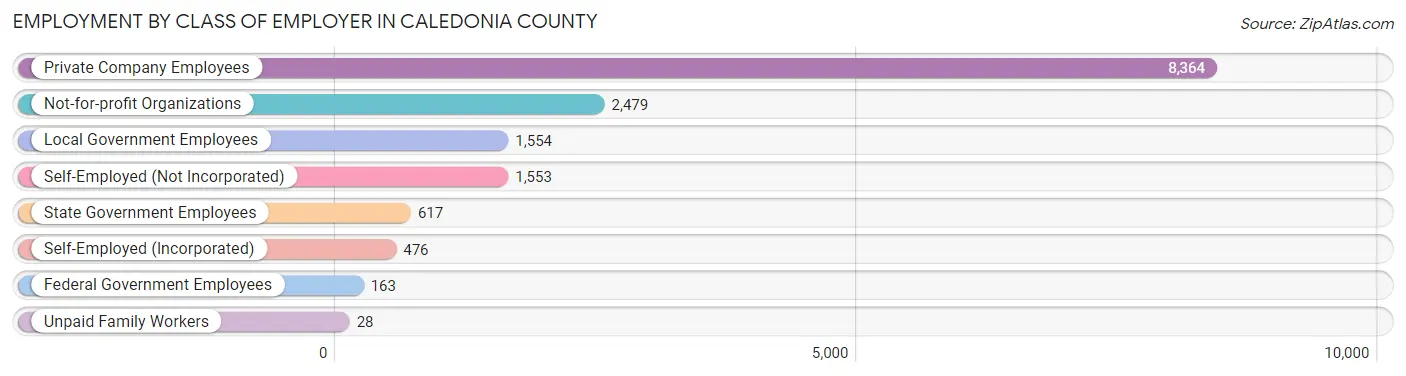
| Employer Class | # Employees | % Employees |
| Private Company Employees | 8,364 | 54.9% |
| Self-Employed (Incorporated) | 476 | 3.1% |
| Self-Employed (Not Incorporated) | 1,553 | 10.2% |
| Not-for-profit Organizations | 2,479 | 16.3% |
| Local Government Employees | 1,554 | 10.2% |
| State Government Employees | 617 | 4.1% |
| Federal Government Employees | 163 | 1.1% |
| Unpaid Family Workers | 28 | 0.2% |
| Total | 15,234 | 100.0% |
Employment Status by Age in Caledonia County
According to the labor force statistics for Caledonia County, out of the total population over 16 years of age (25,437), 63.7% or 16,203 individuals are in the labor force, with 2.6% or 421 of them unemployed. The age group with the highest labor force participation rate is 30 to 34 years, with 88.7% or 1,496 individuals in the labor force. Within the labor force, the 16 to 19 years age range has the highest percentage of unemployed individuals, with 9.9% or 90 of them being unemployed.
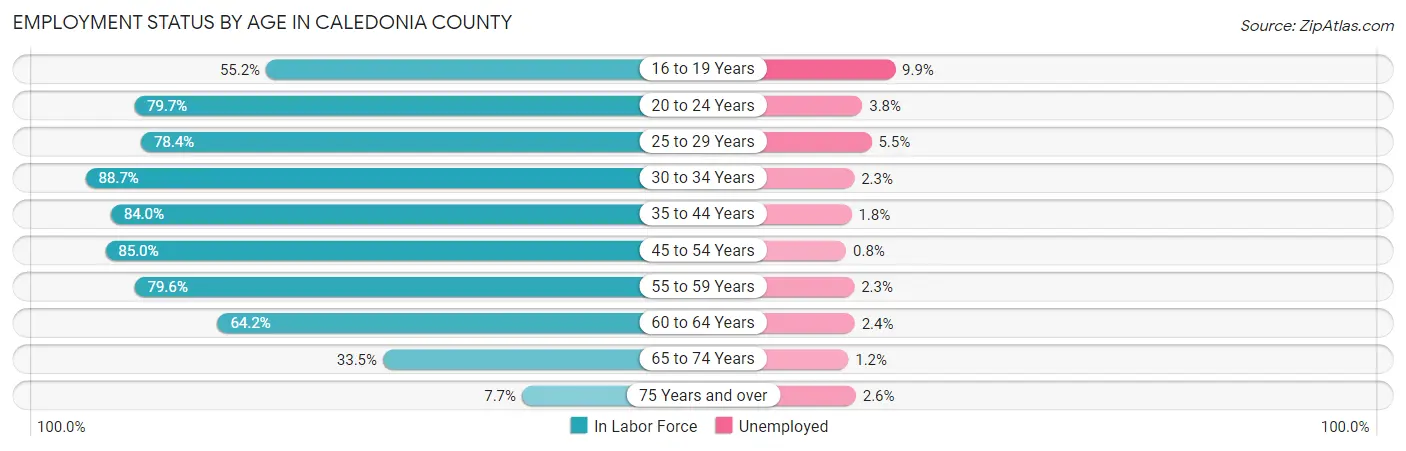
| Age Bracket | In Labor Force | Unemployed |
| 16 to 19 Years | 906 (55.2%) | 90 (9.9%) |
| 20 to 24 Years | 1,443 (79.7%) | 55 (3.8%) |
| 25 to 29 Years | 1,267 (78.4%) | 70 (5.5%) |
| 30 to 34 Years | 1,496 (88.7%) | 34 (2.3%) |
| 35 to 44 Years | 2,859 (84.0%) | 51 (1.8%) |
| 45 to 54 Years | 3,269 (85.0%) | 26 (0.8%) |
| 55 to 59 Years | 1,756 (79.6%) | 40 (2.3%) |
| 60 to 64 Years | 1,591 (64.2%) | 38 (2.4%) |
| 65 to 74 Years | 1,432 (33.5%) | 17 (1.2%) |
| 75 Years and over | 190 (7.7%) | 5 (2.6%) |
| Total | 16,203 (63.7%) | 421 (2.6%) |
Employment Status by Educational Attainment in Caledonia County
According to labor force statistics for Caledonia County, 80.3% of individuals (12,235) out of the total population between 25 and 64 years of age (15,237) are in the labor force, with 2.1% or 257 of them being unemployed. The group with the highest labor force participation rate are those with the educational attainment of bachelor's degree or higher, with 89.5% or 4,251 individuals in the labor force. Within the labor force, individuals with less than high school education have the highest percentage of unemployment, with 6.6% or 39 of them being unemployed.
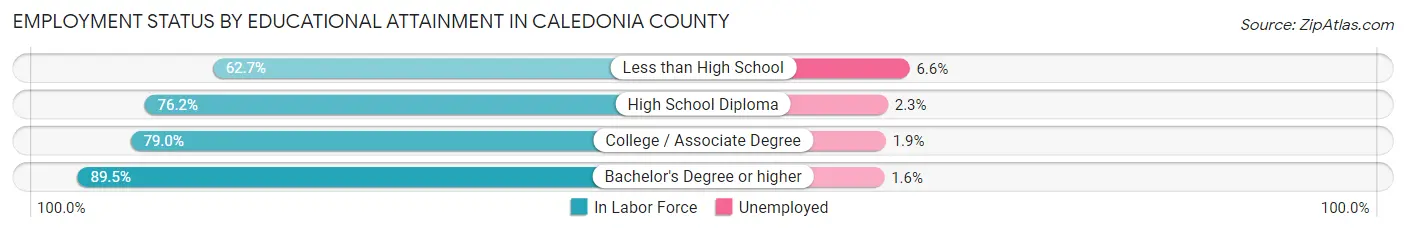
| Educational Attainment | In Labor Force | Unemployed |
| Less than High School | 589 (62.7%) | 62 (6.6%) |
| High School Diploma | 3,785 (76.2%) | 114 (2.3%) |
| College / Associate Degree | 3,618 (79.0%) | 87 (1.9%) |
| Bachelor's Degree or higher | 4,251 (89.5%) | 76 (1.6%) |
| Total | 12,235 (80.3%) | 320 (2.1%) |
Employment Occupations by Sex in Caledonia County
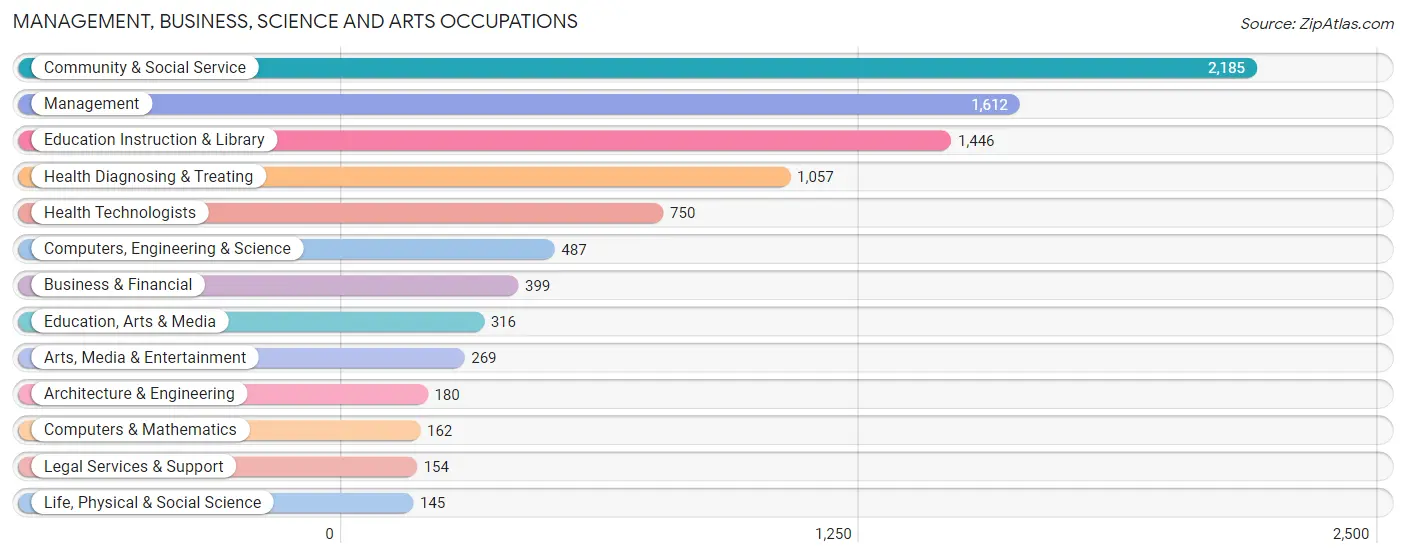
Management, Business, Science and Arts Occupations
The most common Management, Business, Science and Arts occupations in Caledonia County are Community & Social Service (2,185 | 13.8%), Management (1,612 | 10.2%), Education Instruction & Library (1,446 | 9.2%), Health Diagnosing & Treating (1,057 | 6.7%), and Health Technologists (750 | 4.8%).
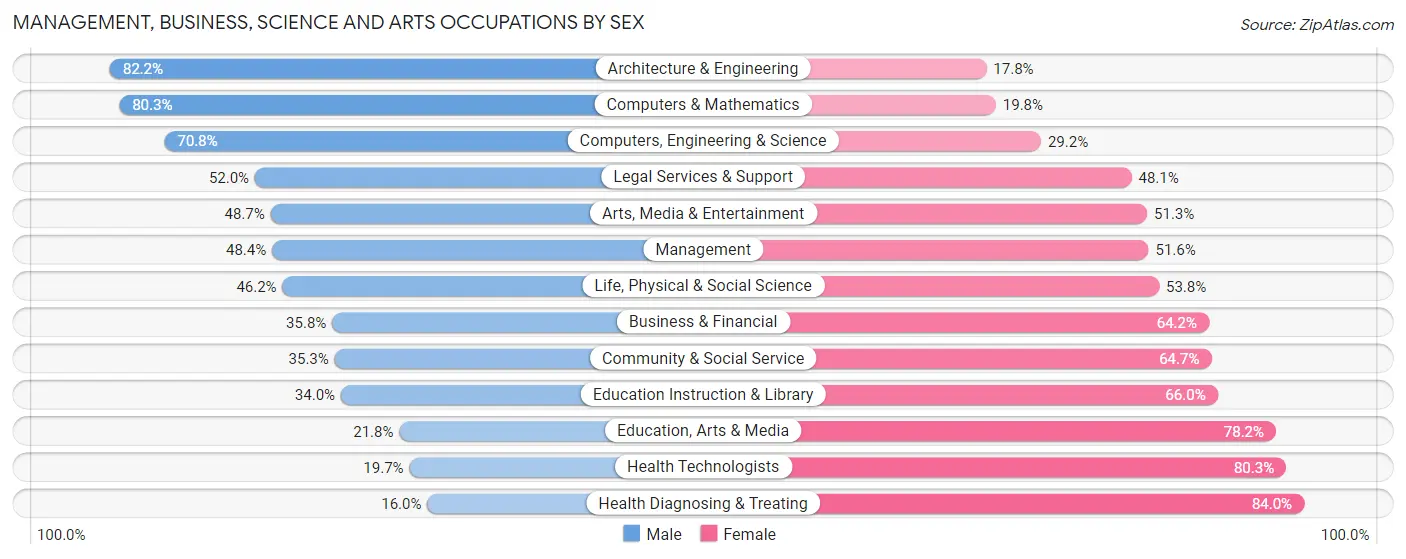
Management, Business, Science and Arts Occupations by Sex
Within the Management, Business, Science and Arts occupations in Caledonia County, the most male-oriented occupations are Architecture & Engineering (82.2%), Computers & Mathematics (80.2%), and Computers, Engineering & Science (70.8%), while the most female-oriented occupations are Health Diagnosing & Treating (84.0%), Health Technologists (80.3%), and Education, Arts & Media (78.2%).
| Occupation | Male | Female |
| Management | 780 (48.4%) | 832 (51.6%) |
| Business & Financial | 143 (35.8%) | 256 (64.2%) |
| Computers, Engineering & Science | 345 (70.8%) | 142 (29.2%) |
| Computers & Mathematics | 130 (80.2%) | 32 (19.8%) |
| Architecture & Engineering | 148 (82.2%) | 32 (17.8%) |
| Life, Physical & Social Science | 67 (46.2%) | 78 (53.8%) |
| Community & Social Service | 772 (35.3%) | 1,413 (64.7%) |
| Education, Arts & Media | 69 (21.8%) | 247 (78.2%) |
| Legal Services & Support | 80 (51.9%) | 74 (48.0%) |
| Education Instruction & Library | 492 (34.0%) | 954 (66.0%) |
| Arts, Media & Entertainment | 131 (48.7%) | 138 (51.3%) |
| Health Diagnosing & Treating | 169 (16.0%) | 888 (84.0%) |
| Health Technologists | 148 (19.7%) | 602 (80.3%) |
| Total (Category) | 2,209 (38.5%) | 3,531 (61.5%) |
| Total (Overall) | 8,293 (52.5%) | 7,493 (47.5%) |
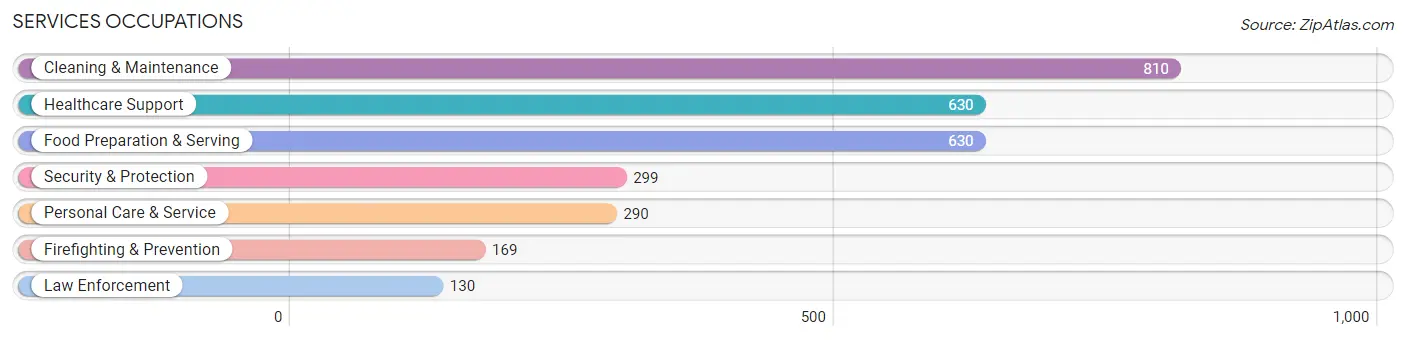
Services Occupations
The most common Services occupations in Caledonia County are Cleaning & Maintenance (810 | 5.1%), Healthcare Support (630 | 4.0%), Food Preparation & Serving (630 | 4.0%), Security & Protection (299 | 1.9%), and Personal Care & Service (290 | 1.8%).
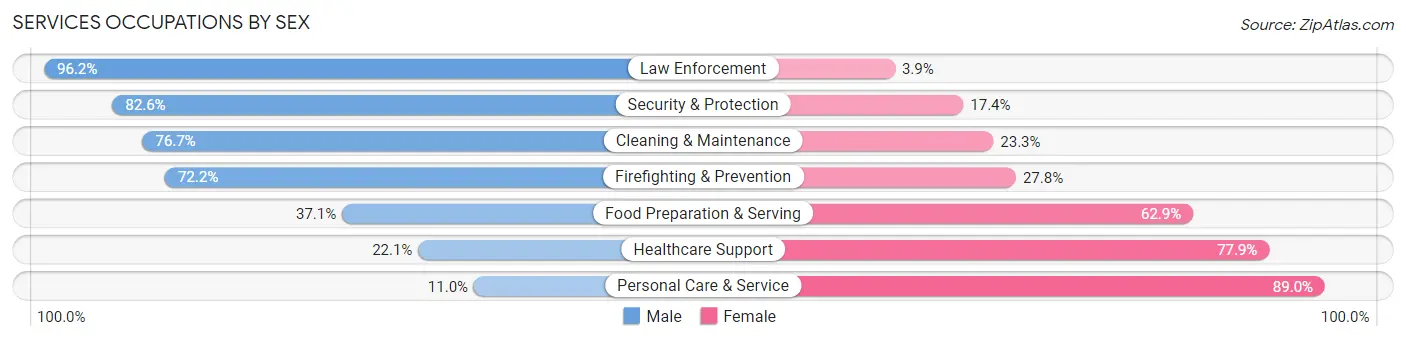
Services Occupations by Sex
Within the Services occupations in Caledonia County, the most male-oriented occupations are Law Enforcement (96.2%), Security & Protection (82.6%), and Cleaning & Maintenance (76.7%), while the most female-oriented occupations are Personal Care & Service (89.0%), Healthcare Support (77.9%), and Food Preparation & Serving (62.9%).
| Occupation | Male | Female |
| Healthcare Support | 139 (22.1%) | 491 (77.9%) |
| Security & Protection | 247 (82.6%) | 52 (17.4%) |
| Firefighting & Prevention | 122 (72.2%) | 47 (27.8%) |
| Law Enforcement | 125 (96.2%) | 5 (3.8%) |
| Food Preparation & Serving | 234 (37.1%) | 396 (62.9%) |
| Cleaning & Maintenance | 621 (76.7%) | 189 (23.3%) |
| Personal Care & Service | 32 (11.0%) | 258 (89.0%) |
| Total (Category) | 1,273 (47.9%) | 1,386 (52.1%) |
| Total (Overall) | 8,293 (52.5%) | 7,493 (47.5%) |
Sales and Office Occupations
The most common Sales and Office occupations in Caledonia County are Sales & Related (1,641 | 10.4%), and Office & Administration (1,379 | 8.7%).

Sales and Office Occupations by Sex

| Occupation | Male | Female |
| Sales & Related | 751 (45.8%) | 890 (54.2%) |
| Office & Administration | 271 (19.7%) | 1,108 (80.3%) |
| Total (Category) | 1,022 (33.8%) | 1,998 (66.2%) |
| Total (Overall) | 8,293 (52.5%) | 7,493 (47.5%) |
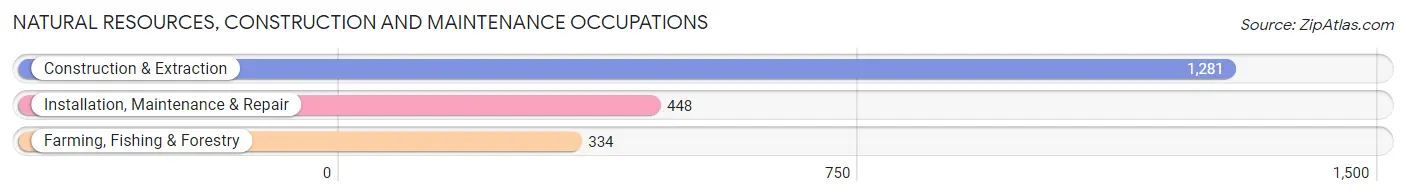
Natural Resources, Construction and Maintenance Occupations
The most common Natural Resources, Construction and Maintenance occupations in Caledonia County are Construction & Extraction (1,281 | 8.1%), Installation, Maintenance & Repair (448 | 2.8%), and Farming, Fishing & Forestry (334 | 2.1%).
Natural Resources, Construction and Maintenance Occupations by Sex
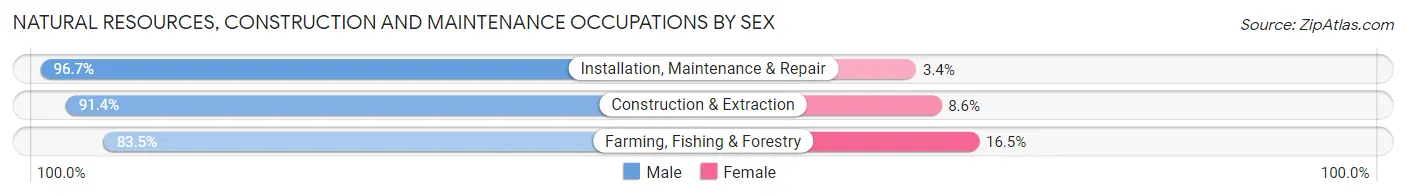
| Occupation | Male | Female |
| Farming, Fishing & Forestry | 279 (83.5%) | 55 (16.5%) |
| Construction & Extraction | 1,171 (91.4%) | 110 (8.6%) |
| Installation, Maintenance & Repair | 433 (96.7%) | 15 (3.4%) |
| Total (Category) | 1,883 (91.3%) | 180 (8.7%) |
| Total (Overall) | 8,293 (52.5%) | 7,493 (47.5%) |
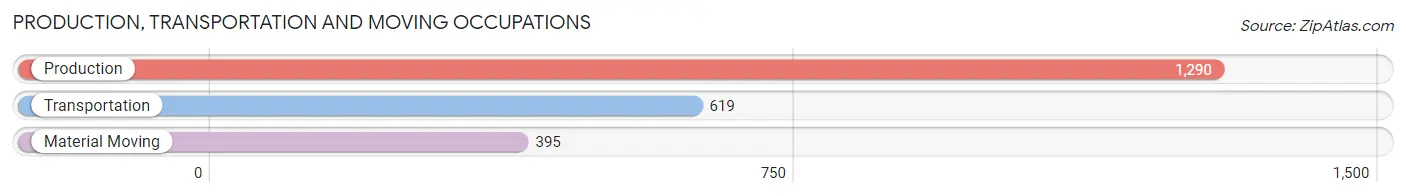
Production, Transportation and Moving Occupations
The most common Production, Transportation and Moving occupations in Caledonia County are Production (1,290 | 8.2%), Transportation (619 | 3.9%), and Material Moving (395 | 2.5%).
Production, Transportation and Moving Occupations by Sex
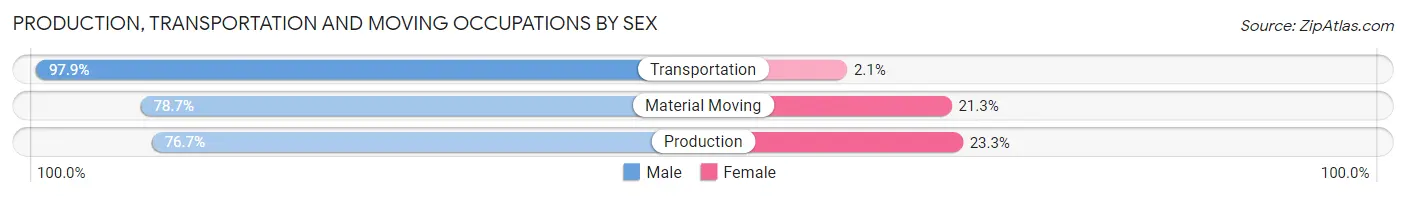
| Occupation | Male | Female |
| Production | 989 (76.7%) | 301 (23.3%) |
| Transportation | 606 (97.9%) | 13 (2.1%) |
| Material Moving | 311 (78.7%) | 84 (21.3%) |
| Total (Category) | 1,906 (82.7%) | 398 (17.3%) |
| Total (Overall) | 8,293 (52.5%) | 7,493 (47.5%) |
Employment Industries by Sex in Caledonia County
Employment Industries in Caledonia County
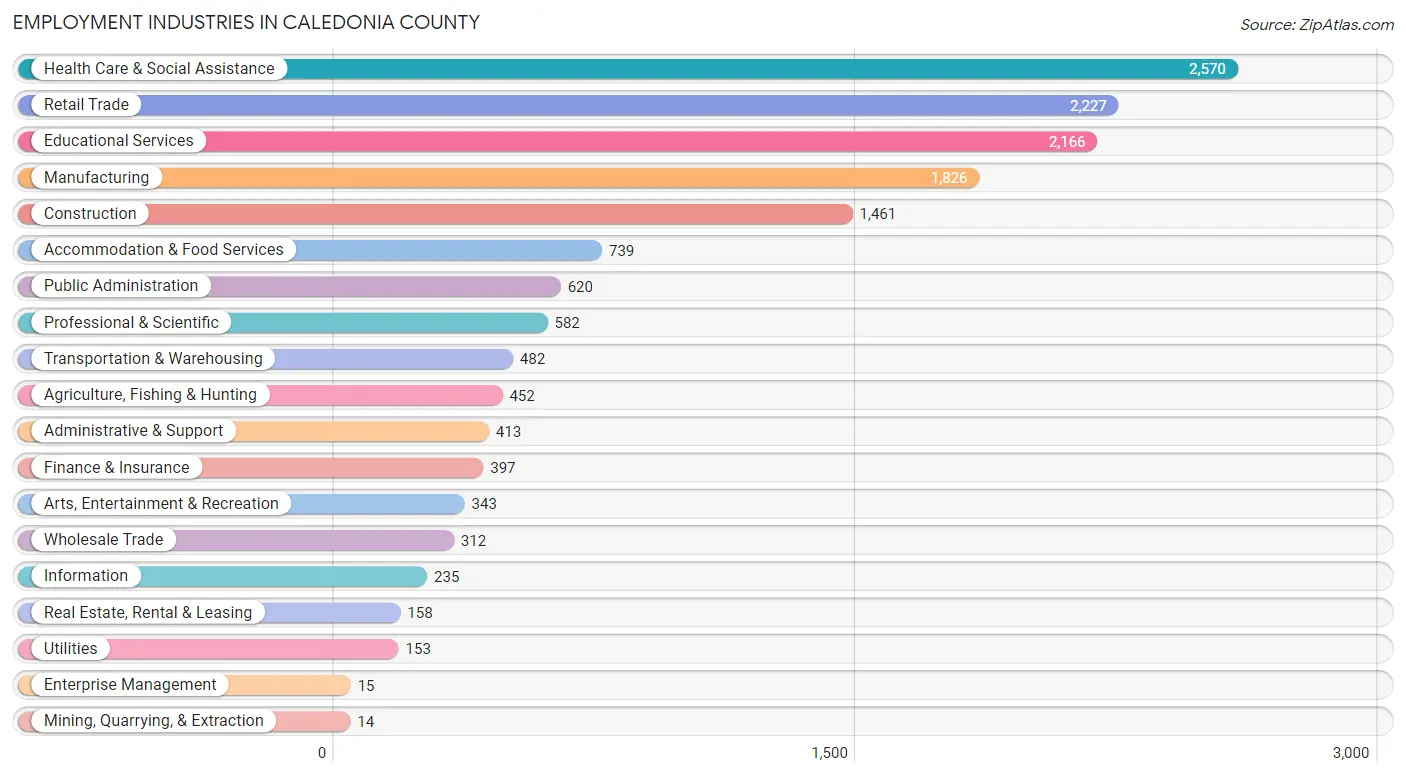
The major employment industries in Caledonia County include Health Care & Social Assistance (2,570 | 16.3%), Retail Trade (2,227 | 14.1%), Educational Services (2,166 | 13.7%), Manufacturing (1,826 | 11.6%), and Construction (1,461 | 9.3%).
Employment Industries by Sex in Caledonia County
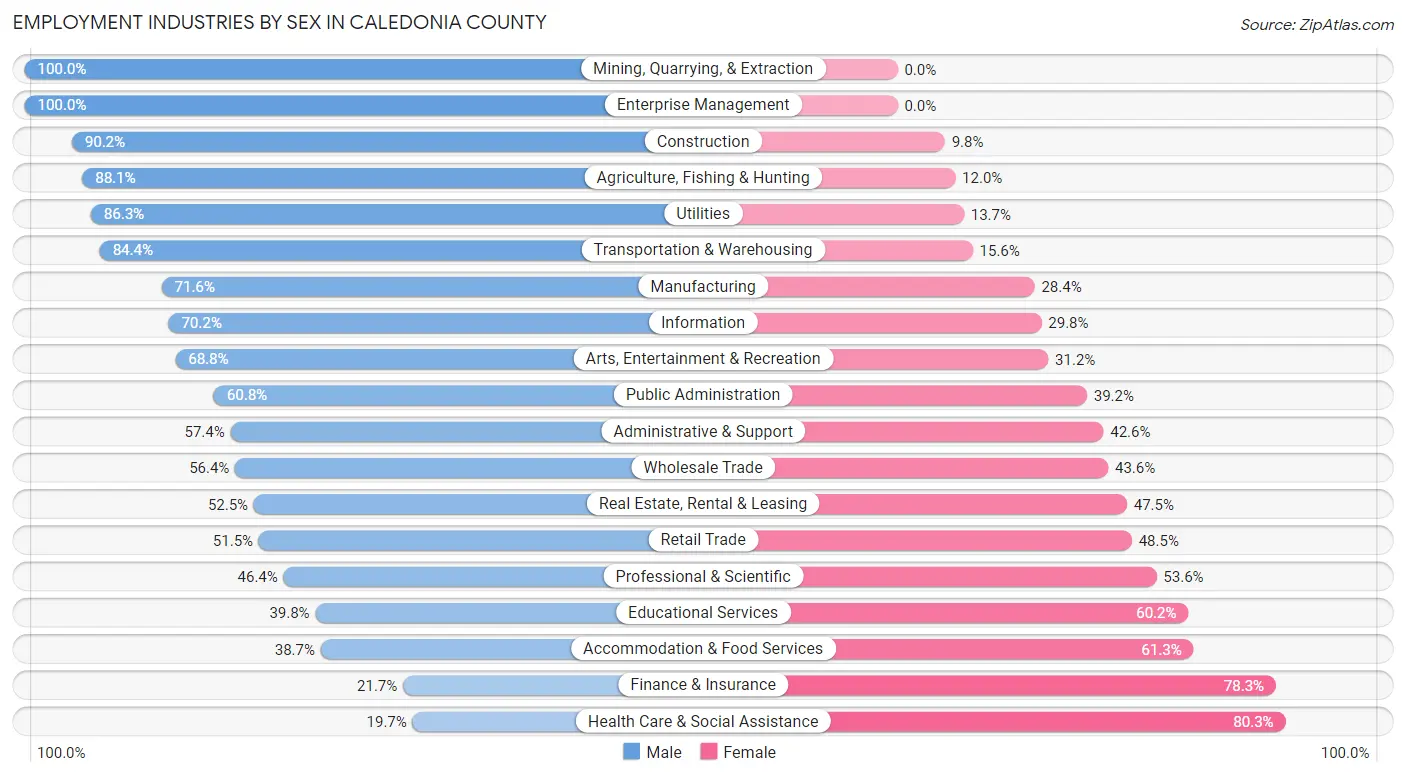
The Caledonia County industries that see more men than women are Mining, Quarrying, & Extraction (100.0%), Enterprise Management (100.0%), and Construction (90.2%), whereas the industries that tend to have a higher number of women are Health Care & Social Assistance (80.3%), Finance & Insurance (78.3%), and Accommodation & Food Services (61.3%).
| Industry | Male | Female |
| Agriculture, Fishing & Hunting | 398 (88.0%) | 54 (11.9%) |
| Mining, Quarrying, & Extraction | 14 (100.0%) | 0 (0.0%) |
| Construction | 1,318 (90.2%) | 143 (9.8%) |
| Manufacturing | 1,308 (71.6%) | 518 (28.4%) |
| Wholesale Trade | 176 (56.4%) | 136 (43.6%) |
| Retail Trade | 1,147 (51.5%) | 1,080 (48.5%) |
| Transportation & Warehousing | 407 (84.4%) | 75 (15.6%) |
| Utilities | 132 (86.3%) | 21 (13.7%) |
| Information | 165 (70.2%) | 70 (29.8%) |
| Finance & Insurance | 86 (21.7%) | 311 (78.3%) |
| Real Estate, Rental & Leasing | 83 (52.5%) | 75 (47.5%) |
| Professional & Scientific | 270 (46.4%) | 312 (53.6%) |
| Enterprise Management | 15 (100.0%) | 0 (0.0%) |
| Administrative & Support | 237 (57.4%) | 176 (42.6%) |
| Educational Services | 862 (39.8%) | 1,304 (60.2%) |
| Health Care & Social Assistance | 506 (19.7%) | 2,064 (80.3%) |
| Arts, Entertainment & Recreation | 236 (68.8%) | 107 (31.2%) |
| Accommodation & Food Services | 286 (38.7%) | 453 (61.3%) |
| Public Administration | 377 (60.8%) | 243 (39.2%) |
| Total | 8,293 (52.5%) | 7,493 (47.5%) |
Education in Caledonia County
School Enrollment in Caledonia County
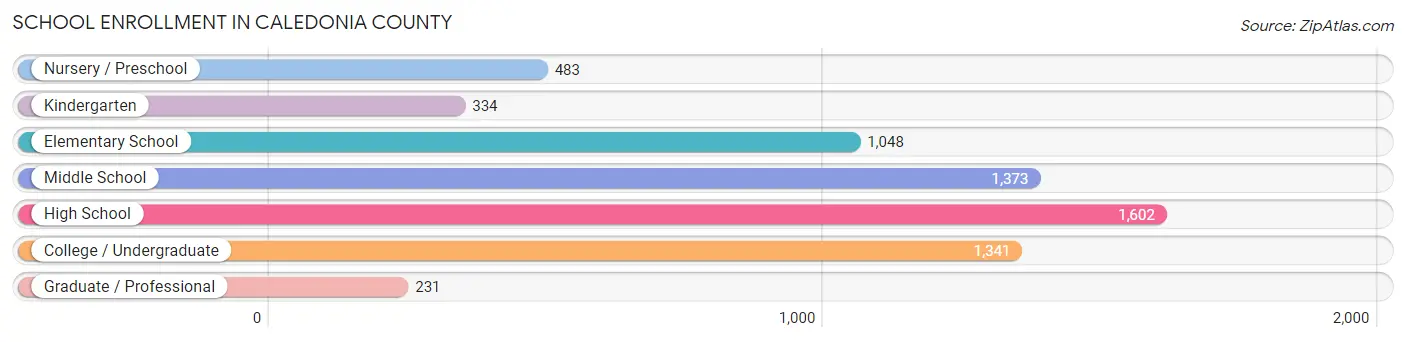
The most common levels of schooling among the 6,412 students in Caledonia County are high school (1,602 | 25.0%), middle school (1,373 | 21.4%), and college / undergraduate (1,341 | 20.9%).
| School Level | # Students | % Students |
| Nursery / Preschool | 483 | 7.5% |
| Kindergarten | 334 | 5.2% |
| Elementary School | 1,048 | 16.3% |
| Middle School | 1,373 | 21.4% |
| High School | 1,602 | 25.0% |
| College / Undergraduate | 1,341 | 20.9% |
| Graduate / Professional | 231 | 3.6% |
| Total | 6,412 | 100.0% |
School Enrollment by Age by Funding Source in Caledonia County
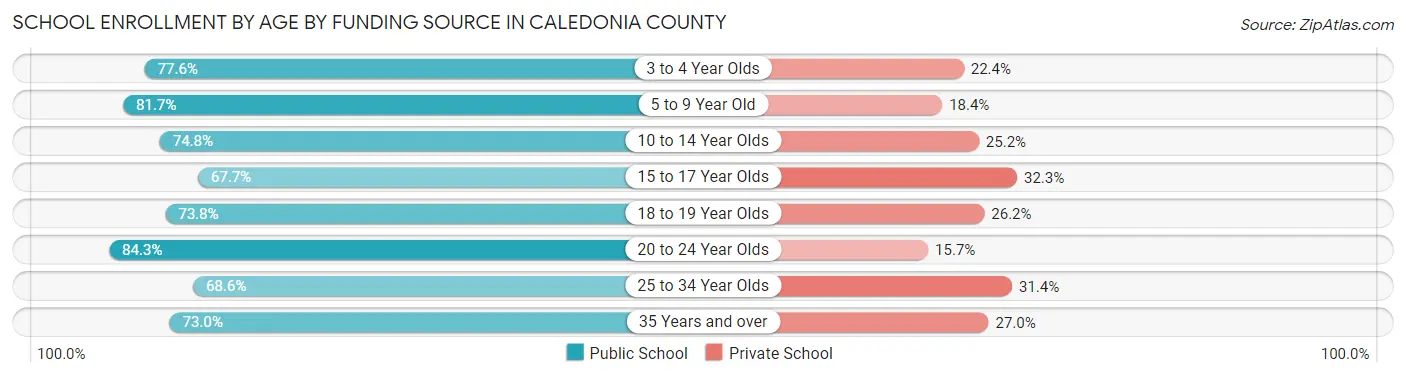
Out of a total of 6,412 students who are enrolled in schools in Caledonia County, 1,571 (24.5%) attend a private institution, while the remaining 4,841 (75.5%) are enrolled in public schools. The age group of 15 to 17 year olds has the highest likelihood of being enrolled in private schools, with 370 (32.3% in the age bracket) enrolled. Conversely, the age group of 20 to 24 year olds has the lowest likelihood of being enrolled in a private school, with 487 (84.3% in the age bracket) attending a public institution.
| Age Bracket | Public School | Private School |
| 3 to 4 Year Olds | 295 (77.6%) | 85 (22.4%) |
| 5 to 9 Year Old | 1,077 (81.7%) | 242 (18.3%) |
| 10 to 14 Year Olds | 1,289 (74.8%) | 434 (25.2%) |
| 15 to 17 Year Olds | 776 (67.7%) | 370 (32.3%) |
| 18 to 19 Year Olds | 459 (73.8%) | 163 (26.2%) |
| 20 to 24 Year Olds | 487 (84.3%) | 91 (15.7%) |
| 25 to 34 Year Olds | 175 (68.6%) | 80 (31.4%) |
| 35 Years and over | 284 (73.0%) | 105 (27.0%) |
| Total | 4,841 (75.5%) | 1,571 (24.5%) |
Educational Attainment by Field of Study in Caledonia County
Education (1,157 | 14.9%), business (900 | 11.6%), science & technology (763 | 9.9%), literature & languages (658 | 8.5%), and social sciences (629 | 8.1%) are the most common fields of study among 7,741 individuals in Caledonia County who have obtained a bachelor's degree or higher.
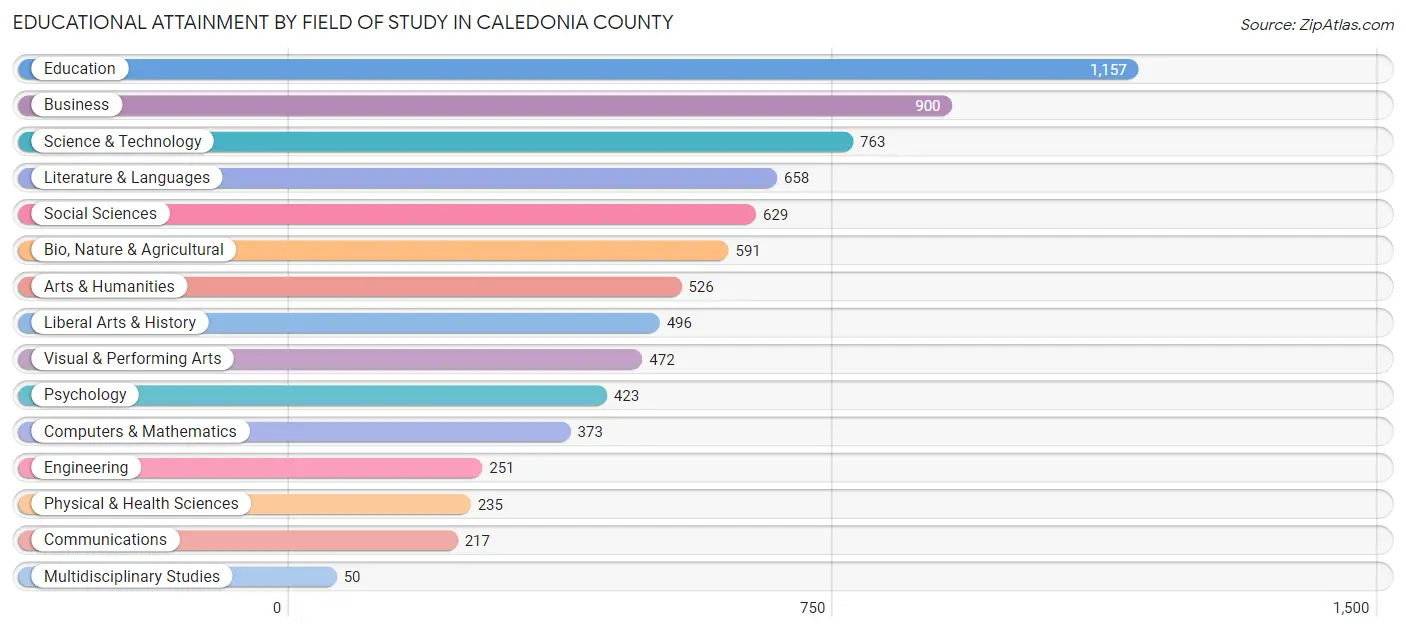
| Field of Study | # Graduates | % Graduates |
| Computers & Mathematics | 373 | 4.8% |
| Bio, Nature & Agricultural | 591 | 7.6% |
| Physical & Health Sciences | 235 | 3.0% |
| Psychology | 423 | 5.5% |
| Social Sciences | 629 | 8.1% |
| Engineering | 251 | 3.2% |
| Multidisciplinary Studies | 50 | 0.6% |
| Science & Technology | 763 | 9.9% |
| Business | 900 | 11.6% |
| Education | 1,157 | 14.9% |
| Literature & Languages | 658 | 8.5% |
| Liberal Arts & History | 496 | 6.4% |
| Visual & Performing Arts | 472 | 6.1% |
| Communications | 217 | 2.8% |
| Arts & Humanities | 526 | 6.8% |
| Total | 7,741 | 100.0% |
Transportation & Commute in Caledonia County
Vehicle Availability by Sex in Caledonia County
The most prevalent vehicle ownership categories in Caledonia County are males with 2 vehicles (3,712, accounting for 46.7%) and females with 2 vehicles (3,296, making up 52.7%).
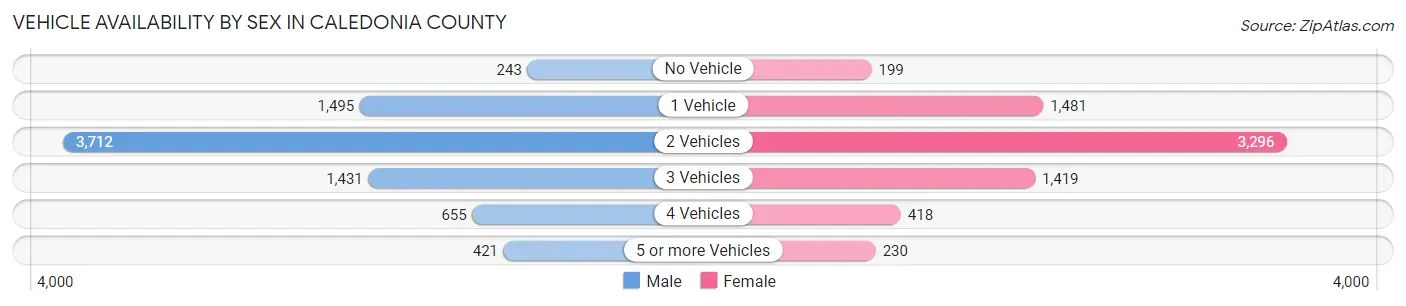
| Vehicles Available | Male | Female |
| No Vehicle | 243 (3.0%) | 199 (2.8%) |
| 1 Vehicle | 1,495 (18.8%) | 1,481 (21.0%) |
| 2 Vehicles | 3,712 (46.7%) | 3,296 (46.8%) |
| 3 Vehicles | 1,431 (18.0%) | 1,419 (20.2%) |
| 4 Vehicles | 655 (8.2%) | 418 (5.9%) |
| 5 or more Vehicles | 421 (5.3%) | 230 (3.3%) |
| Total | 7,957 (100.0%) | 7,043 (100.0%) |
Commute Time in Caledonia County
The most frequently occuring commute durations in Caledonia County are 15 to 19 minutes (2,282 commuters, 16.9%), 10 to 14 minutes (1,727 commuters, 12.8%), and 5 to 9 minutes (1,589 commuters, 11.8%).
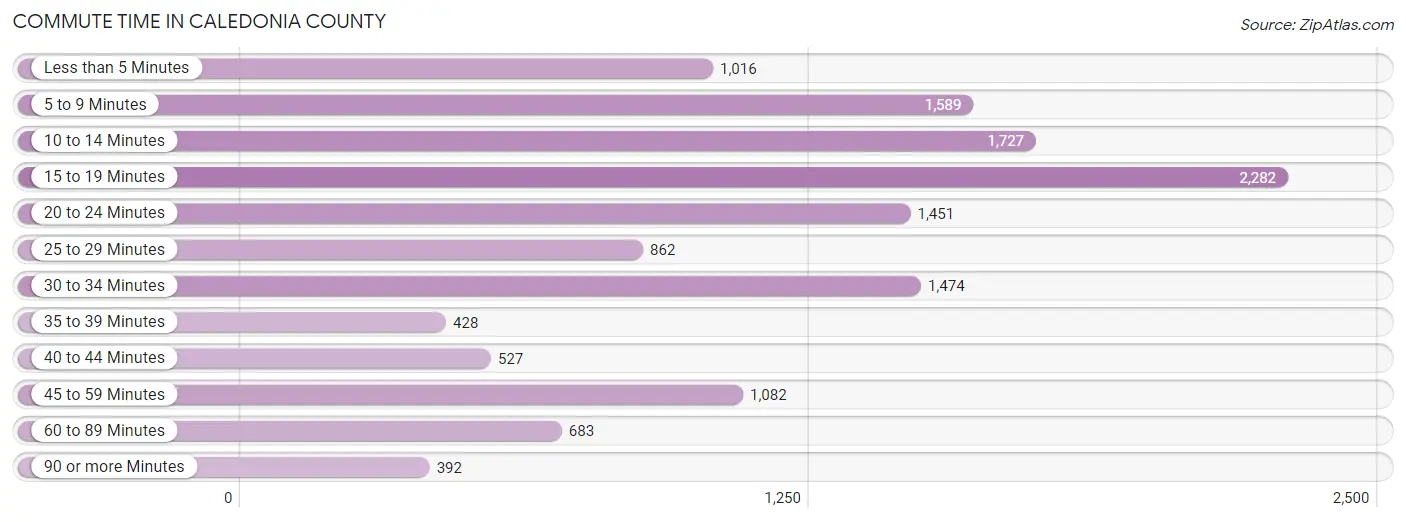
| Commute Time | # Commuters | % Commuters |
| Less than 5 Minutes | 1,016 | 7.5% |
| 5 to 9 Minutes | 1,589 | 11.8% |
| 10 to 14 Minutes | 1,727 | 12.8% |
| 15 to 19 Minutes | 2,282 | 16.9% |
| 20 to 24 Minutes | 1,451 | 10.7% |
| 25 to 29 Minutes | 862 | 6.4% |
| 30 to 34 Minutes | 1,474 | 10.9% |
| 35 to 39 Minutes | 428 | 3.2% |
| 40 to 44 Minutes | 527 | 3.9% |
| 45 to 59 Minutes | 1,082 | 8.0% |
| 60 to 89 Minutes | 683 | 5.1% |
| 90 or more Minutes | 392 | 2.9% |
Commute Time by Sex in Caledonia County
The most common commute times in Caledonia County are 15 to 19 minutes (1,202 commuters, 16.6%) for males and 15 to 19 minutes (1,080 commuters, 17.3%) for females.
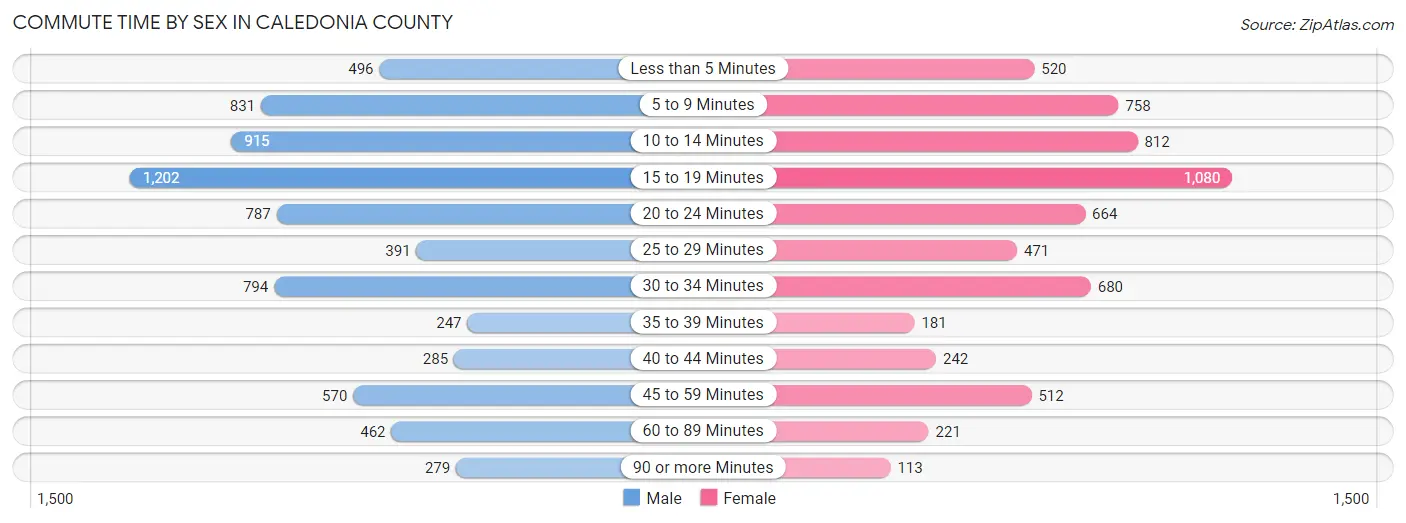
| Commute Time | Male | Female |
| Less than 5 Minutes | 496 (6.8%) | 520 (8.3%) |
| 5 to 9 Minutes | 831 (11.5%) | 758 (12.1%) |
| 10 to 14 Minutes | 915 (12.6%) | 812 (13.0%) |
| 15 to 19 Minutes | 1,202 (16.6%) | 1,080 (17.3%) |
| 20 to 24 Minutes | 787 (10.8%) | 664 (10.6%) |
| 25 to 29 Minutes | 391 (5.4%) | 471 (7.5%) |
| 30 to 34 Minutes | 794 (10.9%) | 680 (10.9%) |
| 35 to 39 Minutes | 247 (3.4%) | 181 (2.9%) |
| 40 to 44 Minutes | 285 (3.9%) | 242 (3.9%) |
| 45 to 59 Minutes | 570 (7.9%) | 512 (8.2%) |
| 60 to 89 Minutes | 462 (6.4%) | 221 (3.5%) |
| 90 or more Minutes | 279 (3.8%) | 113 (1.8%) |
Time of Departure to Work by Sex in Caledonia County
The most frequent times of departure to work in Caledonia County are 7:00 AM to 7:29 AM (1,104, 15.2%) for males and 7:30 AM to 7:59 AM (1,167, 18.7%) for females.
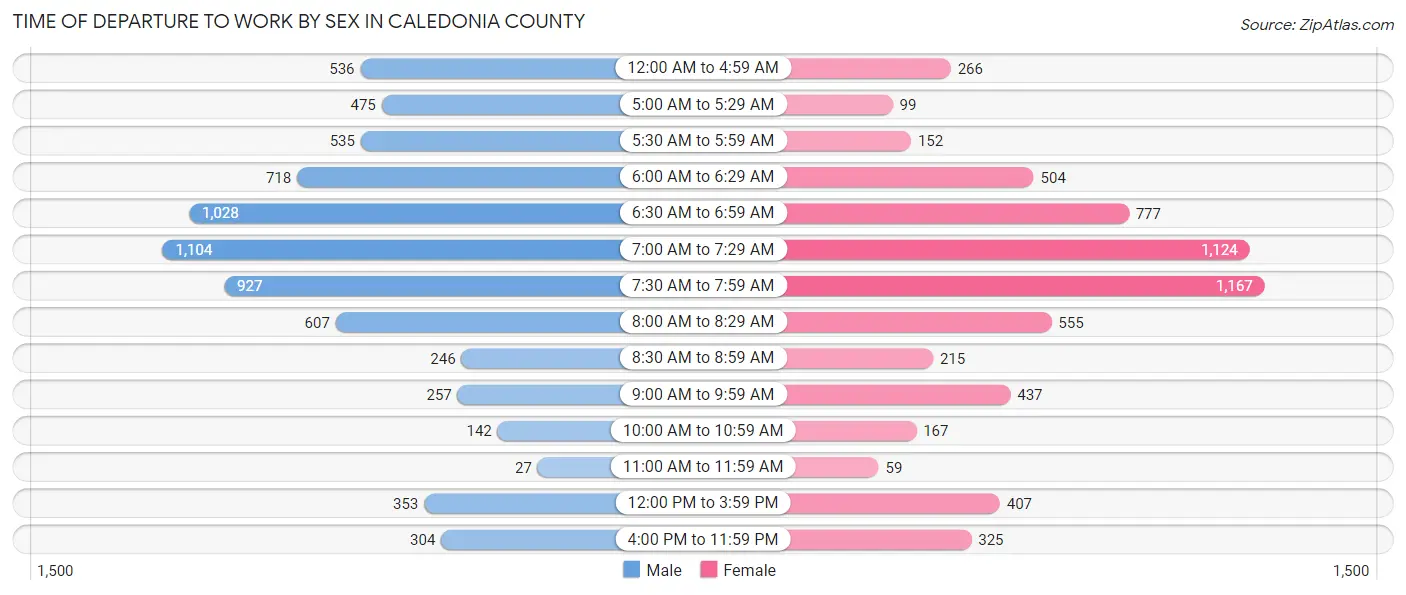
| Time of Departure | Male | Female |
| 12:00 AM to 4:59 AM | 536 (7.4%) | 266 (4.3%) |
| 5:00 AM to 5:29 AM | 475 (6.5%) | 99 (1.6%) |
| 5:30 AM to 5:59 AM | 535 (7.4%) | 152 (2.4%) |
| 6:00 AM to 6:29 AM | 718 (9.9%) | 504 (8.1%) |
| 6:30 AM to 6:59 AM | 1,028 (14.2%) | 777 (12.4%) |
| 7:00 AM to 7:29 AM | 1,104 (15.2%) | 1,124 (18.0%) |
| 7:30 AM to 7:59 AM | 927 (12.8%) | 1,167 (18.7%) |
| 8:00 AM to 8:29 AM | 607 (8.4%) | 555 (8.9%) |
| 8:30 AM to 8:59 AM | 246 (3.4%) | 215 (3.4%) |
| 9:00 AM to 9:59 AM | 257 (3.5%) | 437 (7.0%) |
| 10:00 AM to 10:59 AM | 142 (2.0%) | 167 (2.7%) |
| 11:00 AM to 11:59 AM | 27 (0.4%) | 59 (0.9%) |
| 12:00 PM to 3:59 PM | 353 (4.9%) | 407 (6.5%) |
| 4:00 PM to 11:59 PM | 304 (4.2%) | 325 (5.2%) |
| Total | 7,259 (100.0%) | 6,254 (100.0%) |
Housing Occupancy in Caledonia County
Occupancy by Ownership in Caledonia County
Of the total 12,819 dwellings in Caledonia County, owner-occupied units account for 9,891 (77.2%), while renter-occupied units make up 2,928 (22.8%).
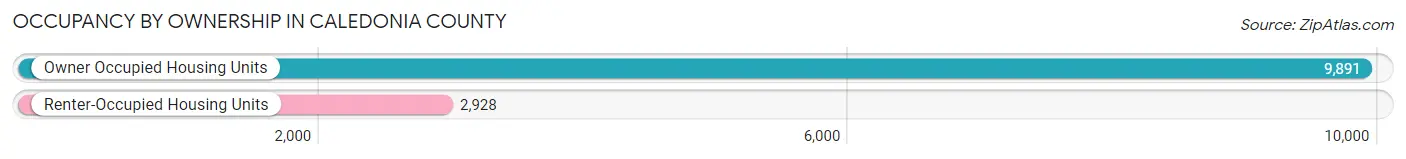
| Occupancy | # Housing Units | % Housing Units |
| Owner Occupied Housing Units | 9,891 | 77.2% |
| Renter-Occupied Housing Units | 2,928 | 22.8% |
| Total Occupied Housing Units | 12,819 | 100.0% |
Occupancy by Household Size in Caledonia County
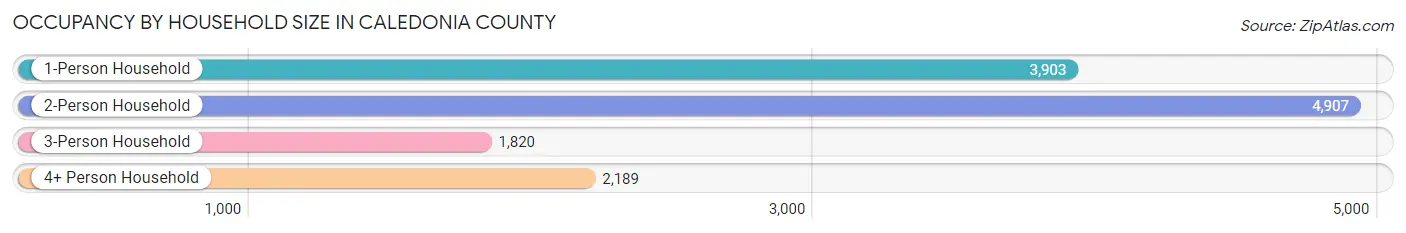
| Household Size | # Housing Units | % Housing Units |
| 1-Person Household | 3,903 | 30.4% |
| 2-Person Household | 4,907 | 38.3% |
| 3-Person Household | 1,820 | 14.2% |
| 4+ Person Household | 2,189 | 17.1% |
| Total Housing Units | 12,819 | 100.0% |
Occupancy by Ownership by Household Size in Caledonia County
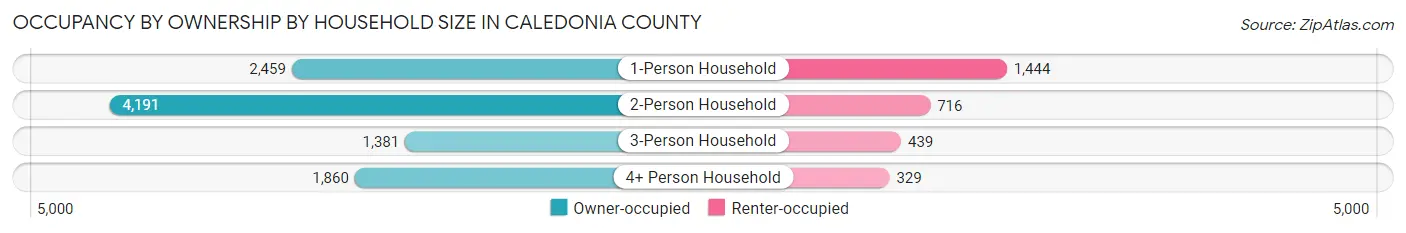
| Household Size | Owner-occupied | Renter-occupied |
| 1-Person Household | 2,459 (63.0%) | 1,444 (37.0%) |
| 2-Person Household | 4,191 (85.4%) | 716 (14.6%) |
| 3-Person Household | 1,381 (75.9%) | 439 (24.1%) |
| 4+ Person Household | 1,860 (85.0%) | 329 (15.0%) |
| Total Housing Units | 9,891 (77.2%) | 2,928 (22.8%) |
Occupancy by Educational Attainment in Caledonia County
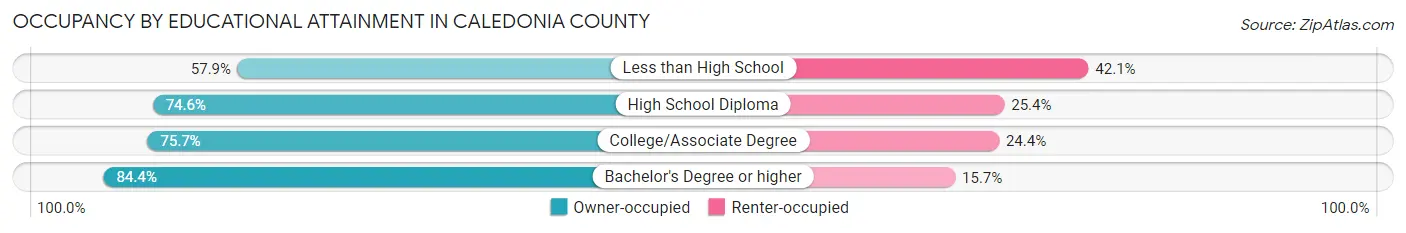
| Household Size | Owner-occupied | Renter-occupied |
| Less than High School | 468 (57.9%) | 340 (42.1%) |
| High School Diploma | 2,869 (74.6%) | 977 (25.4%) |
| College/Associate Degree | 2,895 (75.6%) | 932 (24.3%) |
| Bachelor's Degree or higher | 3,659 (84.4%) | 679 (15.7%) |
Occupancy by Age of Householder in Caledonia County
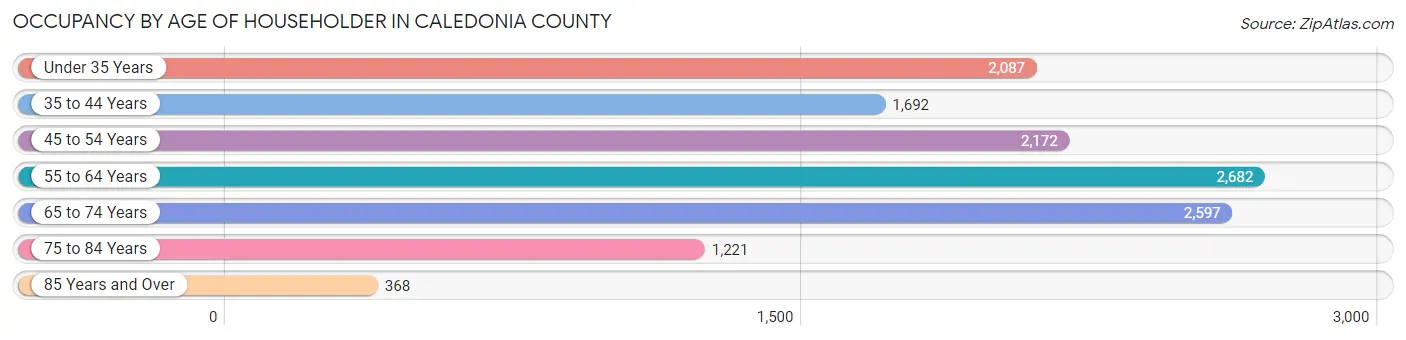
| Age Bracket | # Households | % Households |
| Under 35 Years | 2,087 | 16.3% |
| 35 to 44 Years | 1,692 | 13.2% |
| 45 to 54 Years | 2,172 | 16.9% |
| 55 to 64 Years | 2,682 | 20.9% |
| 65 to 74 Years | 2,597 | 20.3% |
| 75 to 84 Years | 1,221 | 9.5% |
| 85 Years and Over | 368 | 2.9% |
| Total | 12,819 | 100.0% |
Housing Finances in Caledonia County
Median Income by Occupancy in Caledonia County
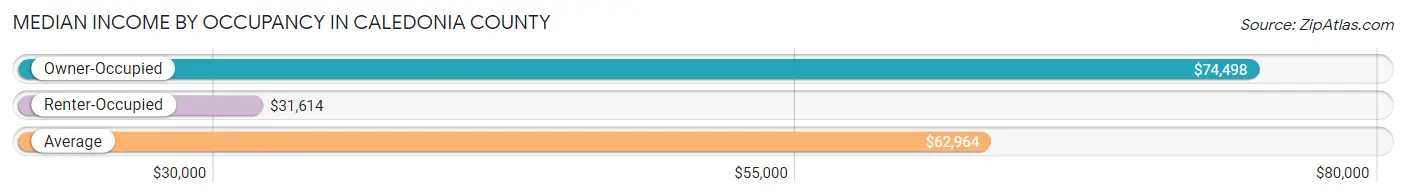
| Occupancy Type | # Households | Median Income |
| Owner-Occupied | 9,891 (77.2%) | $74,498 |
| Renter-Occupied | 2,928 (22.8%) | $31,614 |
| Average | 12,819 (100.0%) | $62,964 |
Occupancy by Householder Income Bracket in Caledonia County
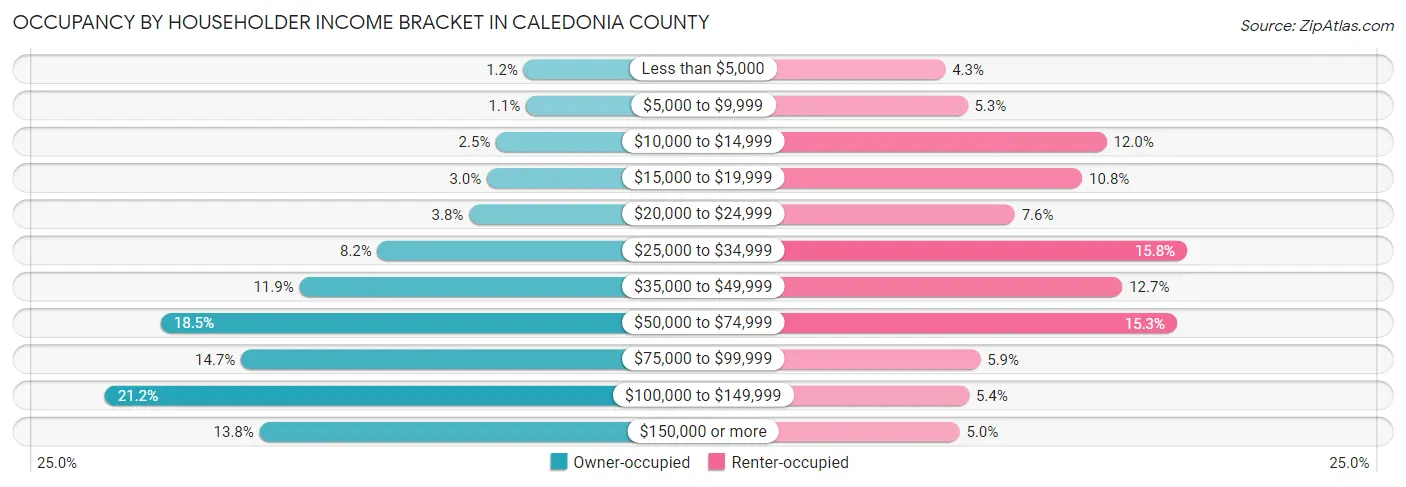
| Income Bracket | Owner-occupied | Renter-occupied |
| Less than $5,000 | 122 (1.2%) | 125 (4.3%) |
| $5,000 to $9,999 | 111 (1.1%) | 156 (5.3%) |
| $10,000 to $14,999 | 251 (2.5%) | 350 (11.9%) |
| $15,000 to $19,999 | 295 (3.0%) | 316 (10.8%) |
| $20,000 to $24,999 | 379 (3.8%) | 222 (7.6%) |
| $25,000 to $34,999 | 810 (8.2%) | 462 (15.8%) |
| $35,000 to $49,999 | 1,178 (11.9%) | 372 (12.7%) |
| $50,000 to $74,999 | 1,831 (18.5%) | 448 (15.3%) |
| $75,000 to $99,999 | 1,453 (14.7%) | 174 (5.9%) |
| $100,000 to $149,999 | 2,095 (21.2%) | 158 (5.4%) |
| $150,000 or more | 1,366 (13.8%) | 145 (5.0%) |
| Total | 9,891 (100.0%) | 2,928 (100.0%) |
Monthly Housing Cost Tiers in Caledonia County
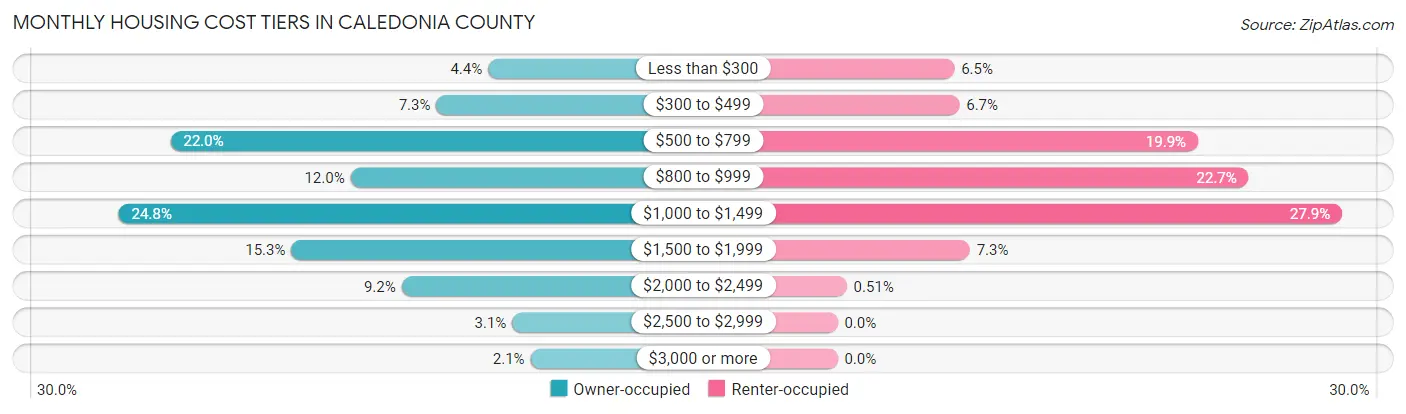
| Monthly Cost | Owner-occupied | Renter-occupied |
| Less than $300 | 435 (4.4%) | 189 (6.5%) |
| $300 to $499 | 718 (7.3%) | 197 (6.7%) |
| $500 to $799 | 2,171 (22.0%) | 583 (19.9%) |
| $800 to $999 | 1,187 (12.0%) | 665 (22.7%) |
| $1,000 to $1,499 | 2,454 (24.8%) | 816 (27.9%) |
| $1,500 to $1,999 | 1,510 (15.3%) | 214 (7.3%) |
| $2,000 to $2,499 | 908 (9.2%) | 15 (0.5%) |
| $2,500 to $2,999 | 304 (3.1%) | 0 (0.0%) |
| $3,000 or more | 204 (2.1%) | 0 (0.0%) |
| Total | 9,891 (100.0%) | 2,928 (100.0%) |
Physical Housing Characteristics in Caledonia County
Housing Structures in Caledonia County
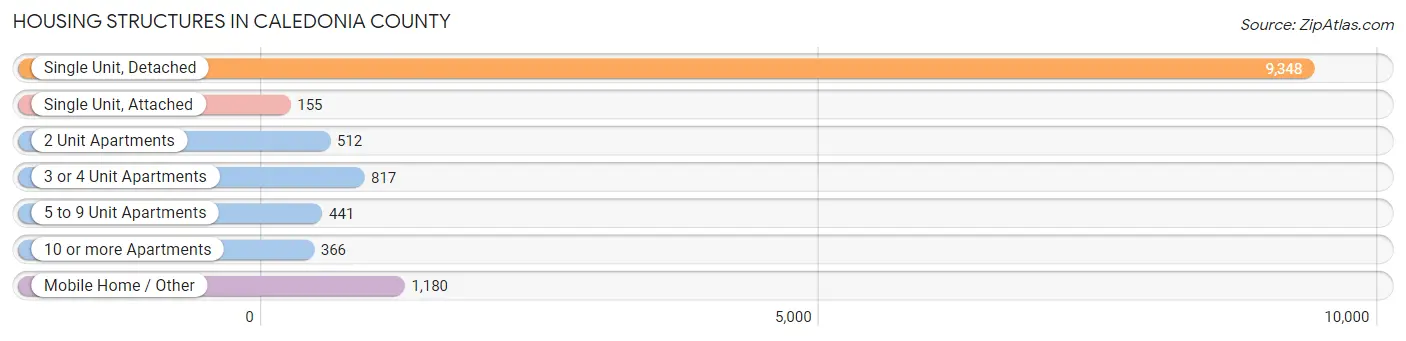
| Structure Type | # Housing Units | % Housing Units |
| Single Unit, Detached | 9,348 | 72.9% |
| Single Unit, Attached | 155 | 1.2% |
| 2 Unit Apartments | 512 | 4.0% |
| 3 or 4 Unit Apartments | 817 | 6.4% |
| 5 to 9 Unit Apartments | 441 | 3.4% |
| 10 or more Apartments | 366 | 2.9% |
| Mobile Home / Other | 1,180 | 9.2% |
| Total | 12,819 | 100.0% |
Housing Structures by Occupancy in Caledonia County
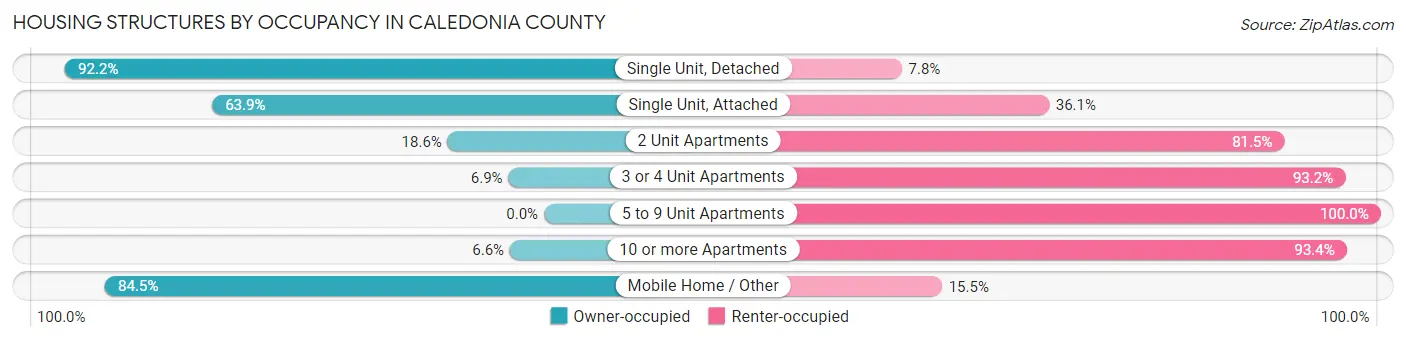
| Structure Type | Owner-occupied | Renter-occupied |
| Single Unit, Detached | 8,620 (92.2%) | 728 (7.8%) |
| Single Unit, Attached | 99 (63.9%) | 56 (36.1%) |
| 2 Unit Apartments | 95 (18.5%) | 417 (81.5%) |
| 3 or 4 Unit Apartments | 56 (6.9%) | 761 (93.1%) |
| 5 to 9 Unit Apartments | 0 (0.0%) | 441 (100.0%) |
| 10 or more Apartments | 24 (6.6%) | 342 (93.4%) |
| Mobile Home / Other | 997 (84.5%) | 183 (15.5%) |
| Total | 9,891 (77.2%) | 2,928 (22.8%) |
Housing Structures by Number of Rooms in Caledonia County
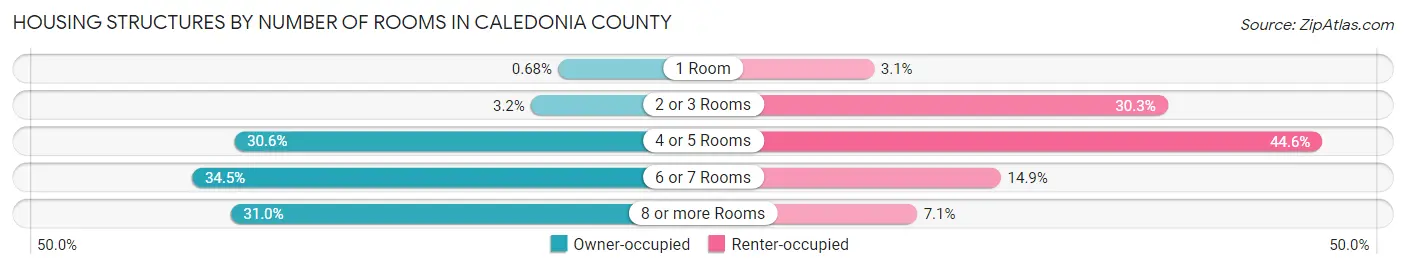
| Number of Rooms | Owner-occupied | Renter-occupied |
| 1 Room | 67 (0.7%) | 92 (3.1%) |
| 2 or 3 Rooms | 317 (3.2%) | 887 (30.3%) |
| 4 or 5 Rooms | 3,030 (30.6%) | 1,306 (44.6%) |
| 6 or 7 Rooms | 3,414 (34.5%) | 435 (14.9%) |
| 8 or more Rooms | 3,063 (31.0%) | 208 (7.1%) |
| Total | 9,891 (100.0%) | 2,928 (100.0%) |
Housing Structure by Heating Type in Caledonia County
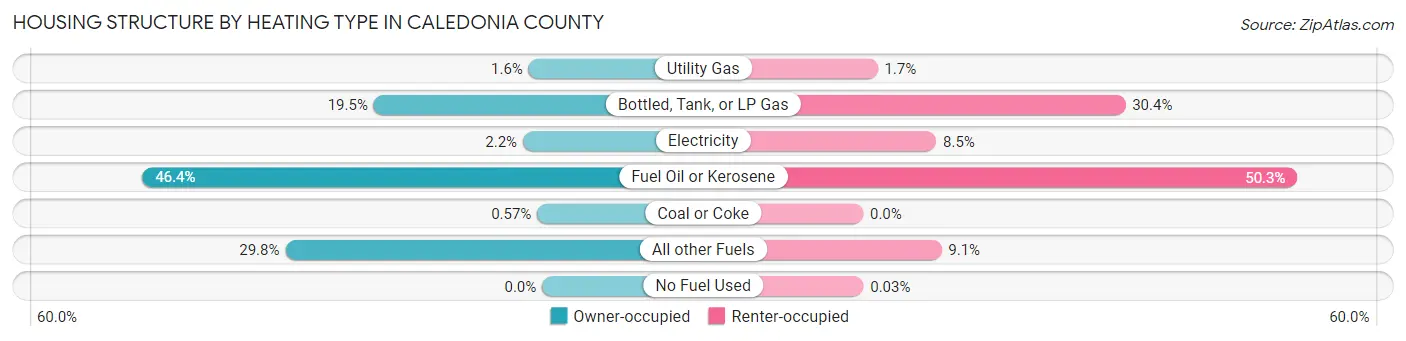
| Heating Type | Owner-occupied | Renter-occupied |
| Utility Gas | 154 (1.6%) | 49 (1.7%) |
| Bottled, Tank, or LP Gas | 1,931 (19.5%) | 890 (30.4%) |
| Electricity | 220 (2.2%) | 248 (8.5%) |
| Fuel Oil or Kerosene | 4,585 (46.4%) | 1,474 (50.3%) |
| Coal or Coke | 56 (0.6%) | 0 (0.0%) |
| All other Fuels | 2,945 (29.8%) | 266 (9.1%) |
| No Fuel Used | 0 (0.0%) | 1 (0.0%) |
| Total | 9,891 (100.0%) | 2,928 (100.0%) |
Household Vehicle Usage in Caledonia County
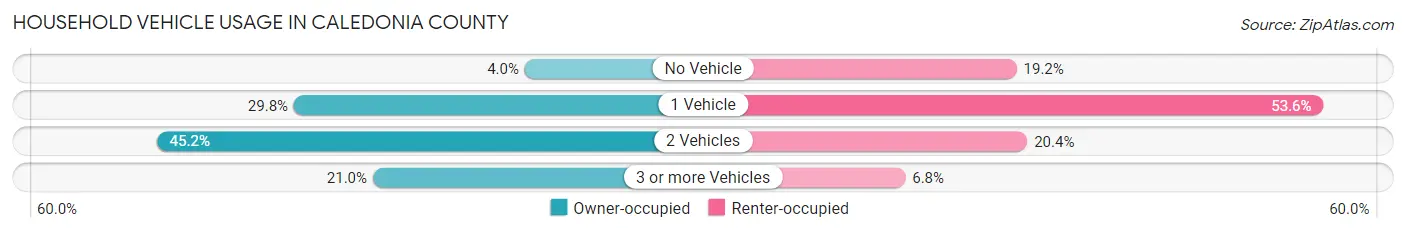
| Vehicles per Household | Owner-occupied | Renter-occupied |
| No Vehicle | 393 (4.0%) | 563 (19.2%) |
| 1 Vehicle | 2,950 (29.8%) | 1,569 (53.6%) |
| 2 Vehicles | 4,472 (45.2%) | 598 (20.4%) |
| 3 or more Vehicles | 2,076 (21.0%) | 198 (6.8%) |
| Total | 9,891 (100.0%) | 2,928 (100.0%) |
Real Estate & Mortgages in Caledonia County
Real Estate and Mortgage Overview in Caledonia County
| Characteristic | Without Mortgage | With Mortgage |
| Housing Units | 4,538 | 5,353 |
| Median Property Value | $181,800 | $210,400 |
| Median Household Income | $54,645 | $905 |
| Monthly Housing Costs | $639 | $193 |
| Real Estate Taxes | $3,399 | $137 |
Property Value by Mortgage Status in Caledonia County
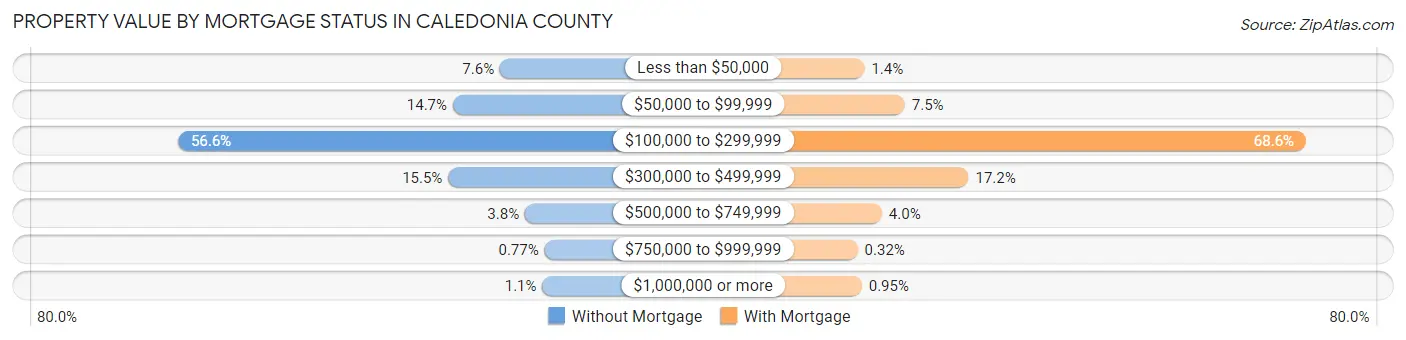
| Property Value | Without Mortgage | With Mortgage |
| Less than $50,000 | 343 (7.6%) | 73 (1.4%) |
| $50,000 to $99,999 | 669 (14.7%) | 402 (7.5%) |
| $100,000 to $299,999 | 2,570 (56.6%) | 3,673 (68.6%) |
| $300,000 to $499,999 | 701 (15.4%) | 922 (17.2%) |
| $500,000 to $749,999 | 170 (3.7%) | 215 (4.0%) |
| $750,000 to $999,999 | 35 (0.8%) | 17 (0.3%) |
| $1,000,000 or more | 50 (1.1%) | 51 (0.9%) |
| Total | 4,538 (100.0%) | 5,353 (100.0%) |
Household Income by Mortgage Status in Caledonia County
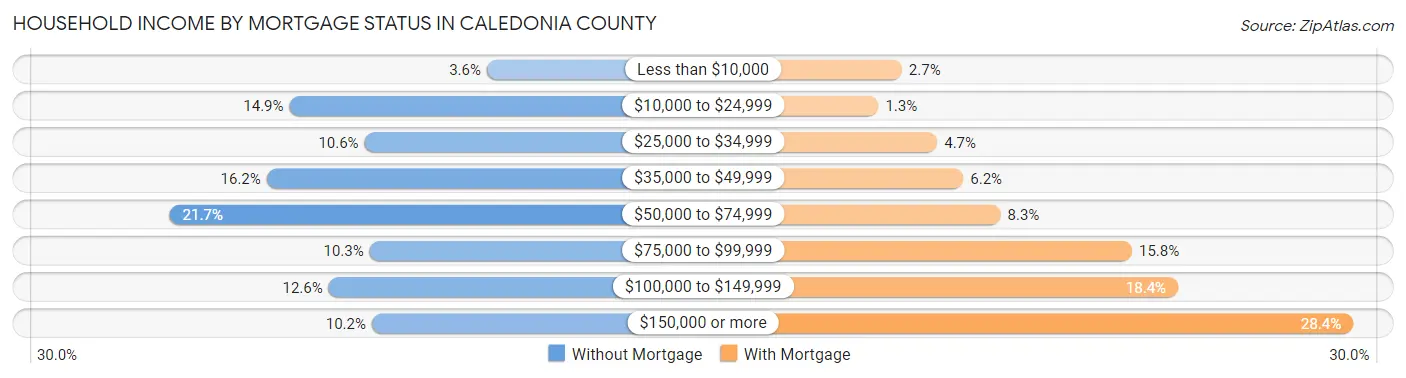
| Household Income | Without Mortgage | With Mortgage |
| Less than $10,000 | 163 (3.6%) | 142 (2.6%) |
| $10,000 to $24,999 | 675 (14.9%) | 70 (1.3%) |
| $25,000 to $34,999 | 480 (10.6%) | 250 (4.7%) |
| $35,000 to $49,999 | 734 (16.2%) | 330 (6.2%) |
| $50,000 to $74,999 | 985 (21.7%) | 444 (8.3%) |
| $75,000 to $99,999 | 467 (10.3%) | 846 (15.8%) |
| $100,000 to $149,999 | 573 (12.6%) | 986 (18.4%) |
| $150,000 or more | 461 (10.2%) | 1,522 (28.4%) |
| Total | 4,538 (100.0%) | 5,353 (100.0%) |
Property Value to Household Income Ratio in Caledonia County
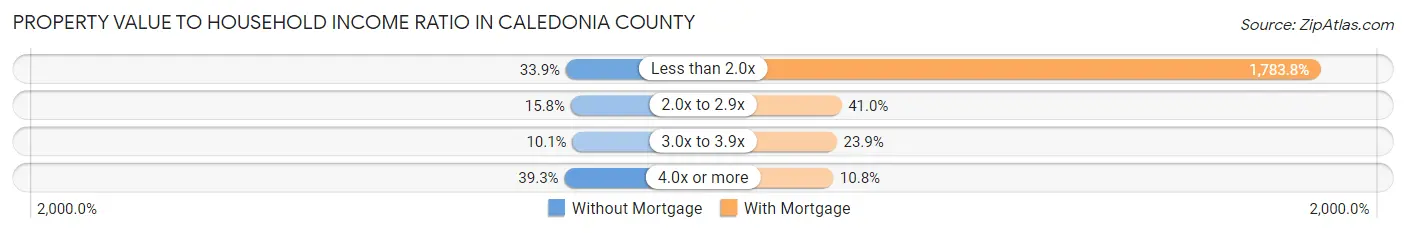
| Value-to-Income Ratio | Without Mortgage | With Mortgage |
| Less than 2.0x | 1,536 (33.9%) | 95,489 (1,783.8%) |
| 2.0x to 2.9x | 716 (15.8%) | 2,193 (41.0%) |
| 3.0x to 3.9x | 458 (10.1%) | 1,281 (23.9%) |
| 4.0x or more | 1,784 (39.3%) | 580 (10.8%) |
| Total | 4,538 (100.0%) | 5,353 (100.0%) |
Real Estate Taxes by Mortgage Status in Caledonia County

| Property Taxes | Without Mortgage | With Mortgage |
| Less than $800 | 290 (6.4%) | 0 (0.0%) |
| $800 to $1,499 | 405 (8.9%) | 66 (1.2%) |
| $800 to $1,499 | 3,718 (81.9%) | 153 (2.9%) |
| Total | 4,538 (100.0%) | 5,353 (100.0%) |
Health & Disability in Caledonia County
Health Insurance Coverage by Age in Caledonia County
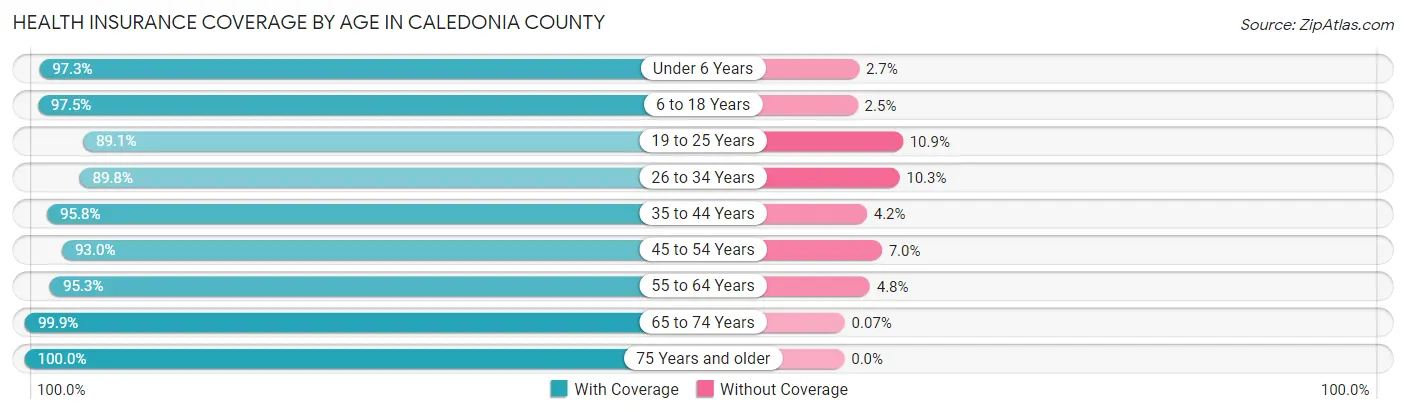
| Age Bracket | With Coverage | Without Coverage |
| Under 6 Years | 1,637 (97.3%) | 46 (2.7%) |
| 6 to 18 Years | 4,339 (97.5%) | 111 (2.5%) |
| 19 to 25 Years | 2,216 (89.1%) | 271 (10.9%) |
| 26 to 34 Years | 2,740 (89.7%) | 313 (10.2%) |
| 35 to 44 Years | 3,177 (95.8%) | 139 (4.2%) |
| 45 to 54 Years | 3,572 (93.0%) | 268 (7.0%) |
| 55 to 64 Years | 4,430 (95.3%) | 221 (4.8%) |
| 65 to 74 Years | 4,254 (99.9%) | 3 (0.1%) |
| 75 Years and older | 2,430 (100.0%) | 0 (0.0%) |
| Total | 28,795 (95.5%) | 1,372 (4.5%) |
Health Insurance Coverage by Citizenship Status in Caledonia County

| Citizenship Status | With Coverage | Without Coverage |
| Native Born | 1,637 (97.3%) | 46 (2.7%) |
| Foreign Born, Citizen | 4,339 (97.5%) | 111 (2.5%) |
| Foreign Born, not a Citizen | 2,216 (89.1%) | 271 (10.9%) |
Health Insurance Coverage by Household Income in Caledonia County
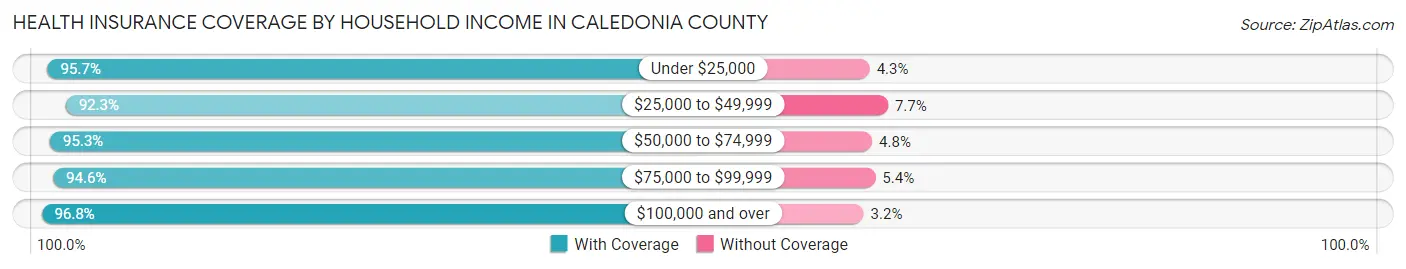
| Household Income | With Coverage | Without Coverage |
| Under $25,000 | 3,279 (95.7%) | 147 (4.3%) |
| $25,000 to $49,999 | 4,503 (92.3%) | 376 (7.7%) |
| $50,000 to $74,999 | 4,989 (95.3%) | 249 (4.8%) |
| $75,000 to $99,999 | 4,134 (94.6%) | 234 (5.4%) |
| $100,000 and over | 11,095 (96.8%) | 362 (3.2%) |
Public vs Private Health Insurance Coverage by Age in Caledonia County
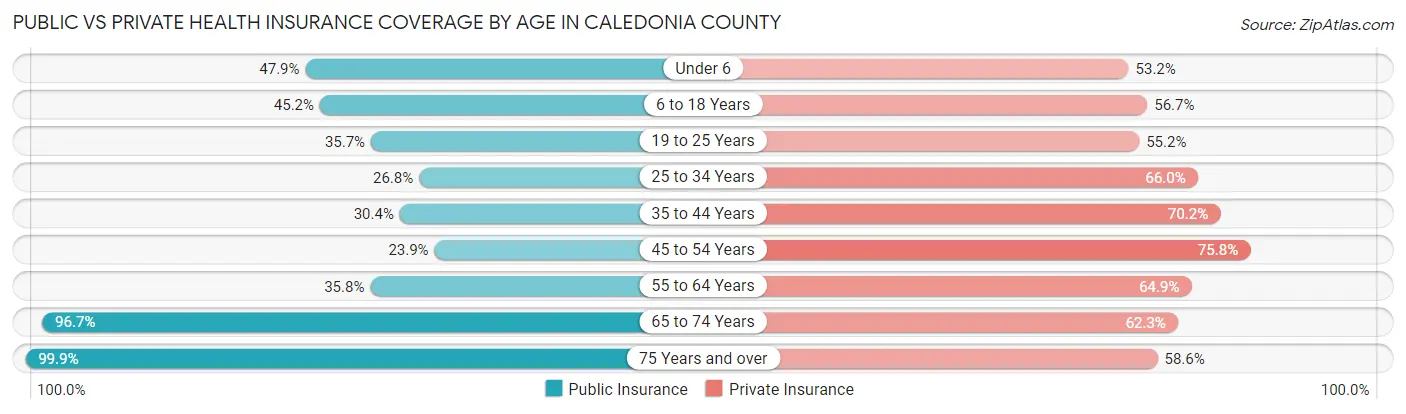
| Age Bracket | Public Insurance | Private Insurance |
| Under 6 | 806 (47.9%) | 896 (53.2%) |
| 6 to 18 Years | 2,011 (45.2%) | 2,523 (56.7%) |
| 19 to 25 Years | 888 (35.7%) | 1,373 (55.2%) |
| 25 to 34 Years | 818 (26.8%) | 2,016 (66.0%) |
| 35 to 44 Years | 1,007 (30.4%) | 2,328 (70.2%) |
| 45 to 54 Years | 919 (23.9%) | 2,909 (75.8%) |
| 55 to 64 Years | 1,667 (35.8%) | 3,016 (64.8%) |
| 65 to 74 Years | 4,118 (96.7%) | 2,654 (62.3%) |
| 75 Years and over | 2,427 (99.9%) | 1,424 (58.6%) |
| Total | 14,661 (48.6%) | 19,139 (63.4%) |
Disability Status by Sex by Age in Caledonia County
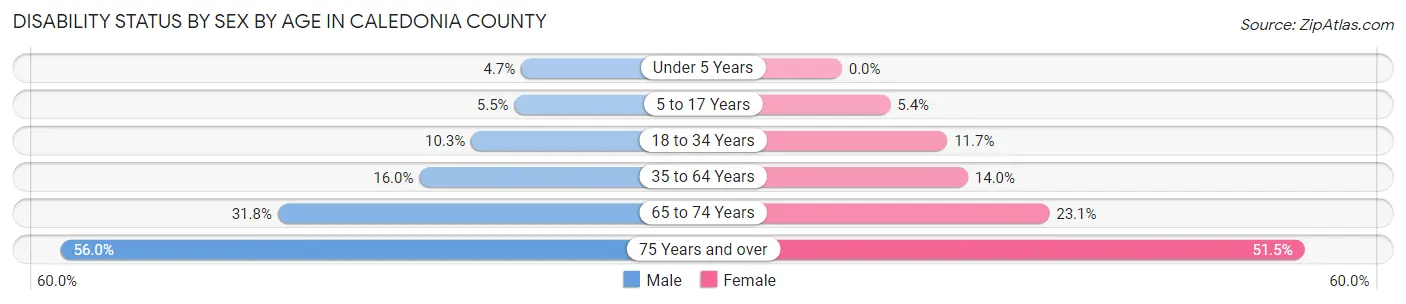
| Age Bracket | Male | Female |
| Under 5 Years | 33 (4.7%) | 0 (0.0%) |
| 5 to 17 Years | 126 (5.4%) | 114 (5.4%) |
| 18 to 34 Years | 315 (10.3%) | 335 (11.7%) |
| 35 to 64 Years | 942 (16.0%) | 833 (14.0%) |
| 65 to 74 Years | 659 (31.8%) | 505 (23.1%) |
| 75 Years and over | 611 (56.0%) | 690 (51.5%) |
Disability Class by Sex by Age in Caledonia County
Disability Class: Hearing Difficulty
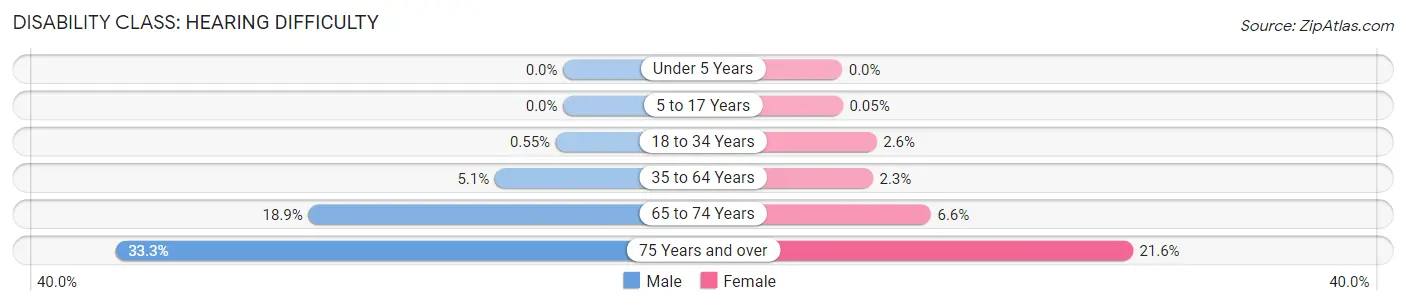
| Age Bracket | Male | Female |
| Under 5 Years | 0 (0.0%) | 0 (0.0%) |
| 5 to 17 Years | 0 (0.0%) | 1 (0.1%) |
| 18 to 34 Years | 17 (0.5%) | 73 (2.6%) |
| 35 to 64 Years | 298 (5.1%) | 135 (2.3%) |
| 65 to 74 Years | 392 (18.9%) | 144 (6.6%) |
| 75 Years and over | 363 (33.3%) | 289 (21.6%) |
Disability Class: Vision Difficulty
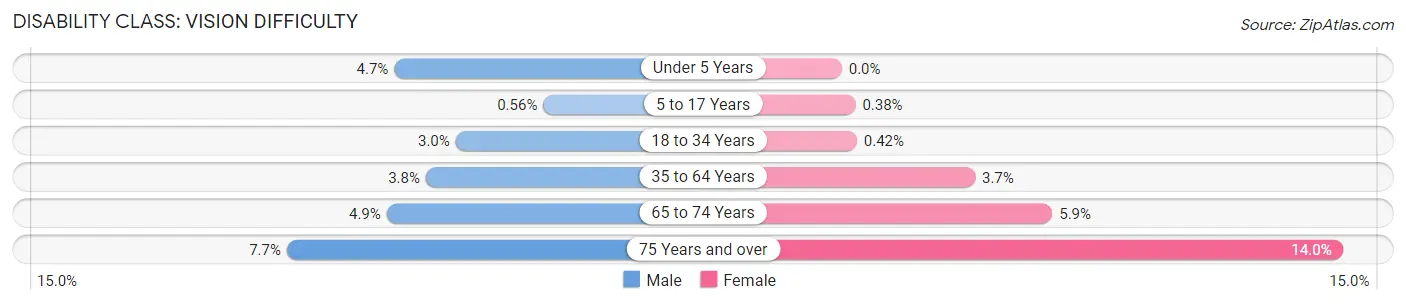
| Age Bracket | Male | Female |
| Under 5 Years | 33 (4.7%) | 0 (0.0%) |
| 5 to 17 Years | 13 (0.6%) | 8 (0.4%) |
| 18 to 34 Years | 92 (3.0%) | 12 (0.4%) |
| 35 to 64 Years | 225 (3.8%) | 220 (3.7%) |
| 65 to 74 Years | 102 (4.9%) | 128 (5.9%) |
| 75 Years and over | 84 (7.7%) | 187 (14.0%) |
Disability Class: Cognitive Difficulty
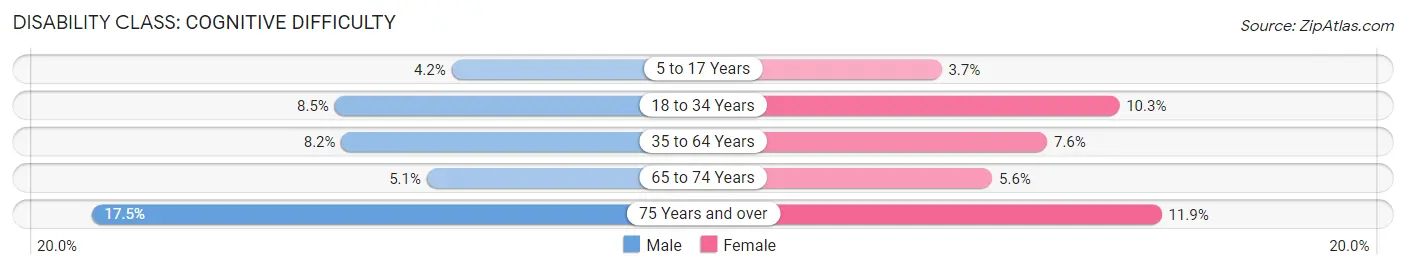
| Age Bracket | Male | Female |
| 5 to 17 Years | 96 (4.2%) | 78 (3.7%) |
| 18 to 34 Years | 260 (8.5%) | 294 (10.3%) |
| 35 to 64 Years | 484 (8.2%) | 452 (7.6%) |
| 65 to 74 Years | 105 (5.1%) | 122 (5.6%) |
| 75 Years and over | 191 (17.5%) | 159 (11.9%) |
Disability Class: Ambulatory Difficulty
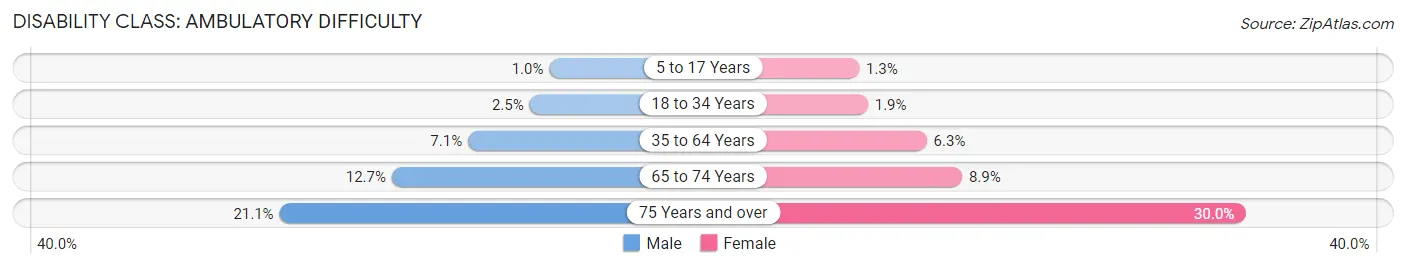
| Age Bracket | Male | Female |
| 5 to 17 Years | 24 (1.0%) | 27 (1.3%) |
| 18 to 34 Years | 77 (2.5%) | 55 (1.9%) |
| 35 to 64 Years | 416 (7.1%) | 374 (6.3%) |
| 65 to 74 Years | 264 (12.7%) | 195 (8.9%) |
| 75 Years and over | 230 (21.1%) | 402 (30.0%) |
Disability Class: Self-Care Difficulty
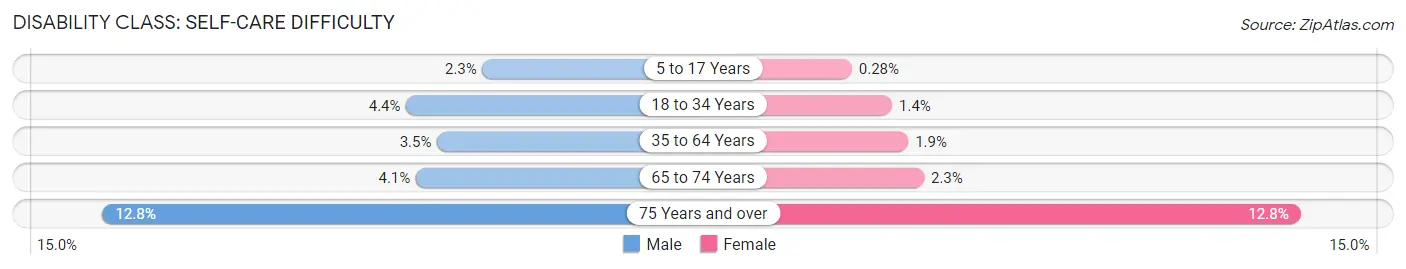
| Age Bracket | Male | Female |
| 5 to 17 Years | 52 (2.2%) | 6 (0.3%) |
| 18 to 34 Years | 134 (4.4%) | 40 (1.4%) |
| 35 to 64 Years | 206 (3.5%) | 110 (1.8%) |
| 65 to 74 Years | 85 (4.1%) | 50 (2.3%) |
| 75 Years and over | 140 (12.8%) | 171 (12.8%) |
Technology Access in Caledonia County
Computing Device Access in Caledonia County
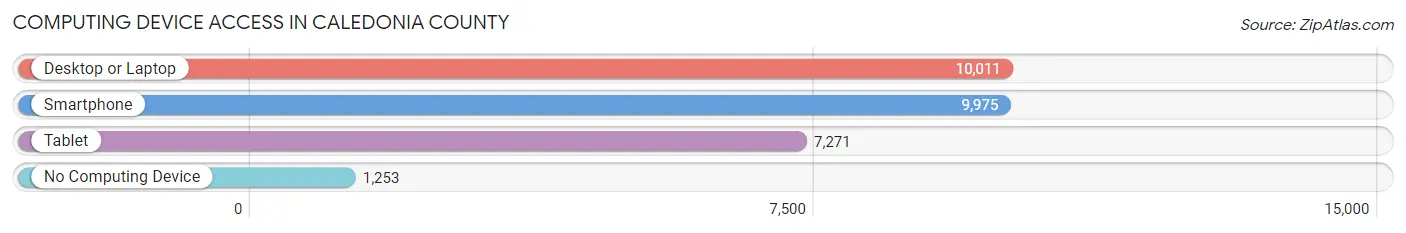
| Device Type | # Households | % Households |
| Desktop or Laptop | 10,011 | 78.1% |
| Smartphone | 9,975 | 77.8% |
| Tablet | 7,271 | 56.7% |
| No Computing Device | 1,253 | 9.8% |
| Total | 12,819 | 100.0% |
Internet Access in Caledonia County
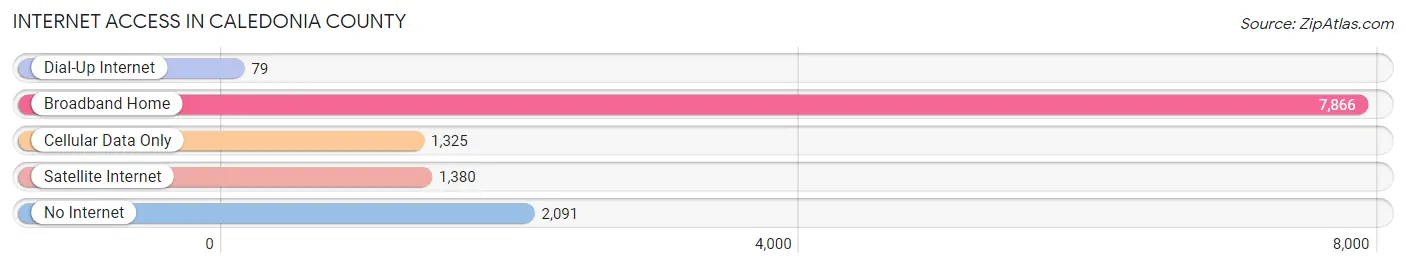
| Internet Type | # Households | % Households |
| Dial-Up Internet | 79 | 0.6% |
| Broadband Home | 7,866 | 61.4% |
| Cellular Data Only | 1,325 | 10.3% |
| Satellite Internet | 1,380 | 10.8% |
| No Internet | 2,091 | 16.3% |
| Total | 12,819 | 100.0% |
Caledonia County Summary
Caledonia County is located in the northeastern corner of Vermont, and is the second largest county in the state. It is bordered by the Connecticut River to the east, and the White Mountains of New Hampshire to the west. The county seat is St. Johnsbury, and the largest city is Lyndonville. The county was established in 1792 and named after the Roman name for Scotland.
Geography
Caledonia County covers an area of 1,082 square miles, making it the second largest county in Vermont. The terrain is mostly hilly and forested, with the highest point being Mount Hor in the town of Peacham at 3,624 feet. The county is drained by the Passumpsic, Nulhegan, and Moose Rivers, as well as several smaller streams. The county is home to several state parks, including Groton State Forest, Victory State Forest, and Willoughby State Forest.
Economy
Caledonia County has a diverse economy, with the largest industries being manufacturing, health care, and retail. The county is home to several large employers, including Cabot Creamery, Fairbanks Scales, and Northeastern Vermont Regional Hospital. Agriculture is also an important part of the economy, with dairy farming being the most common type of farming. The county is also home to several small businesses, including restaurants, shops, and art galleries.
Demographics
As of the 2010 census, Caledonia County had a population of 31,227. The population is mostly white (96.2%), with small percentages of African American (1.2%), Native American (0.7%), Asian (0.5%), and Hispanic or Latino (1.3%) residents. The median household income is $45,845, and the median age is 43.7 years.
Conclusion
Caledonia County is a rural county in the northeastern corner of Vermont. It is home to a diverse economy, with the largest industries being manufacturing, health care, and retail. The population is mostly white, with a median household income of $45,845 and a median age of 43.7 years. The county is home to several state parks, and is a popular destination for outdoor recreation.
Common Questions
What is the Total Population of Caledonia County?
Total Population of Caledonia County is 30,418.
What is the Total Male Population of Caledonia County?
Total Male Population of Caledonia County is 15,313.
What is the Total Female Population of Caledonia County?
Total Female Population of Caledonia County is 15,105.
What is the Ratio of Males per 100 Females in Caledonia County?
There are 101.38 Males per 100 Females in Caledonia County.
What is the Ratio of Females per 100 Males in Caledonia County?
There are 98.64 Females per 100 Males in Caledonia County.
What is the Median Population Age in Caledonia County?
Median Population Age in Caledonia County is 45.4 Years.
What is the Average Family Size in Caledonia County
Average Family Size in Caledonia County is 2.8 People.
What is the Average Household Size in Caledonia County
Average Household Size in Caledonia County is 2.3 People.
What is Per Capita Income in Caledonia County?
Per Capita income in Caledonia County is $36,604.
What is the Median Family Income in Caledonia County?
Median Family Income in Caledonia County is $83,632.
What is the Median Household income in Caledonia County?
Median Household Income in Caledonia County is $62,964.
What is Income or Wage Gap in Caledonia County?
Income or Wage Gap in Caledonia County is 19.4%.
Women in Caledonia County earn 80.6 cents for every dollar earned by a man.
What is Family Income Deficit in Caledonia County?
Family Income Deficit in Caledonia County is $11,961.
Families that are below poverty line in Caledonia County earn $11,961 less on average than the poverty threshold level.
What is Inequality or Gini Index in Caledonia County?
Inequality or Gini Index in Caledonia County is 0.45.
How Large is the Labor Force in Caledonia County?
There are 16,203 People in the Labor Forcein in Caledonia County.
What is the Percentage of People in the Labor Force in Caledonia County?
63.7% of People are in the Labor Force in Caledonia County.
What is the Unemployment Rate in Caledonia County?
Unemployment Rate in Caledonia County is 2.6%.