Bennington County, VT
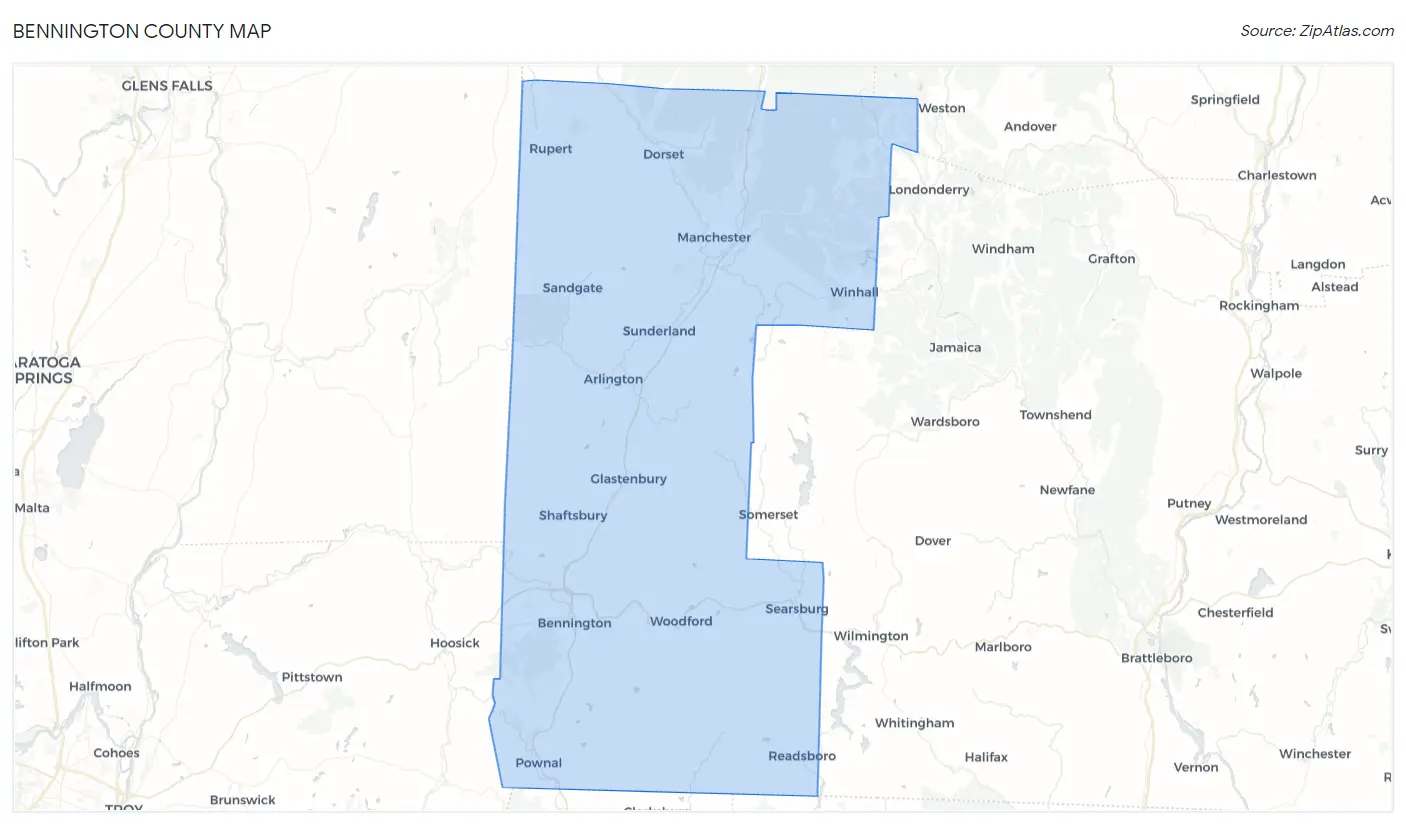
Bennington County Map
Bennington County Overview
37,326
TOTAL POPULATION
18,243
MALE POPULATION
19,083
FEMALE POPULATION
95.60
MALES / 100 FEMALES
104.60
FEMALES / 100 MALES
46.7
MEDIAN AGE
3.1
AVG FAMILY SIZE
2.5
AVG HOUSEHOLD SIZE
$39,717
PER CAPITA INCOME
$95,160
AVG FAMILY INCOME
$68,558
AVG HOUSEHOLD INCOME
15.6%
WAGE / INCOME GAP [ % ]
84.4¢/ $1
WAGE / INCOME GAP [ $ ]
$12,182
FAMILY INCOME DEFICIT
0.48
INEQUALITY / GINI INDEX
18,553
LABOR FORCE [ PEOPLE ]
59.5%
PERCENT IN LABOR FORCE
4.2%
UNEMPLOYMENT RATE
Bennington County Area Codes
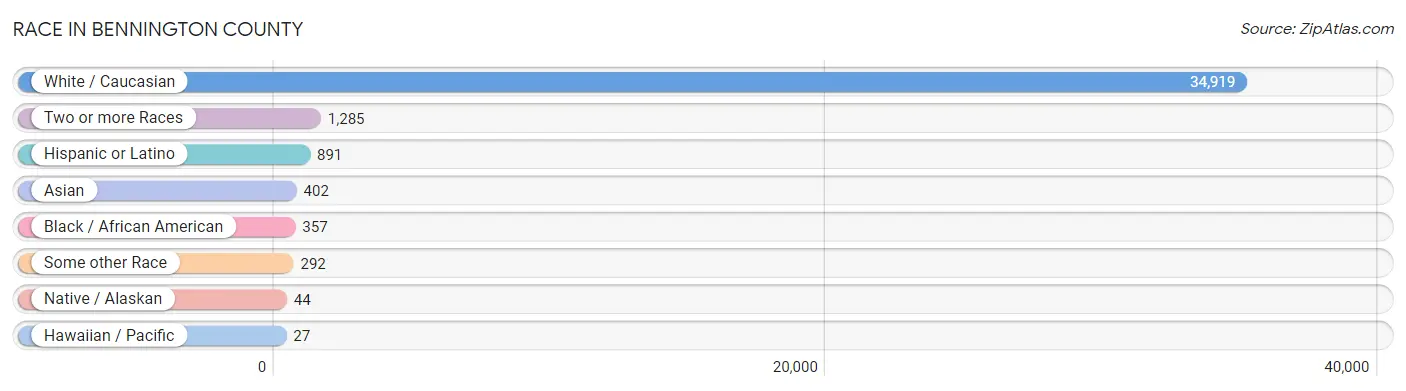
Race in Bennington County
The most populous races in Bennington County are White / Caucasian (34,919 | 93.5%), Two or more Races (1,285 | 3.4%), and Hispanic or Latino (891 | 2.4%).
| Race | # Population | % Population |
| Asian | 402 | 1.1% |
| Black / African American | 357 | 1.0% |
| Hawaiian / Pacific | 27 | 0.1% |
| Hispanic or Latino | 891 | 2.4% |
| Native / Alaskan | 44 | 0.1% |
| White / Caucasian | 34,919 | 93.5% |
| Two or more Races | 1,285 | 3.4% |
| Some other Race | 292 | 0.8% |
| Total | 37,326 | 100.0% |
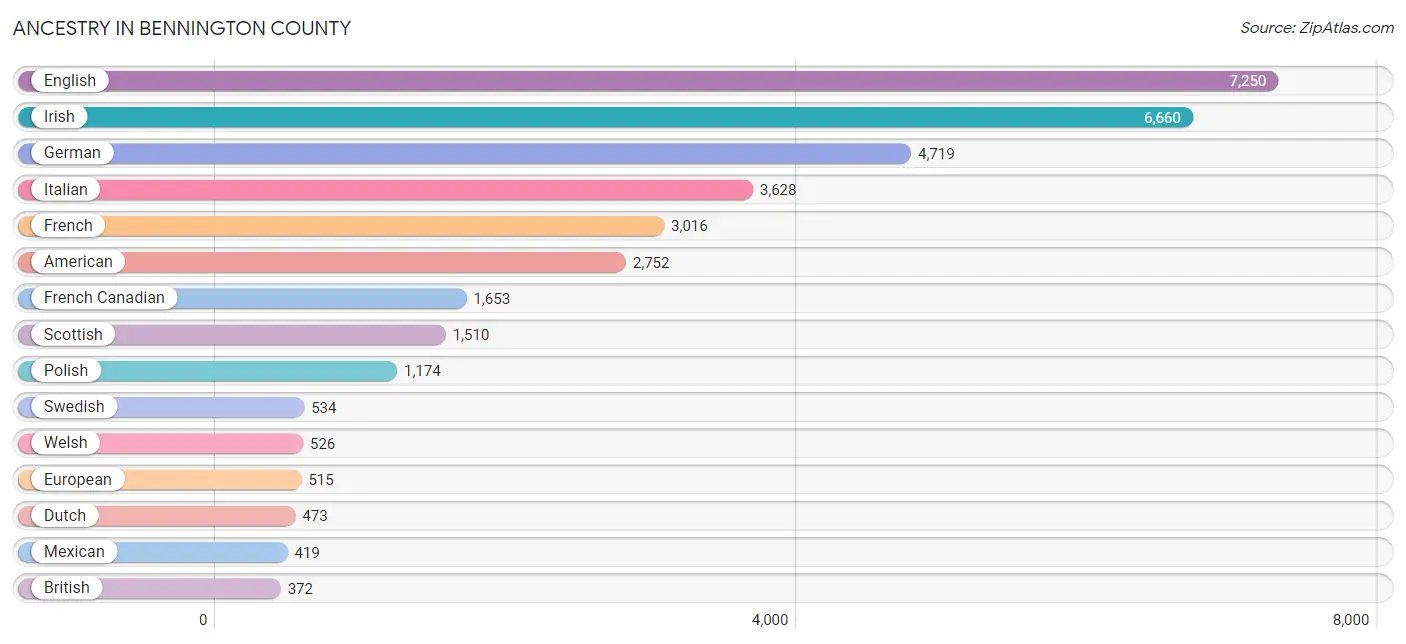
Ancestry in Bennington County
The most populous ancestries reported in Bennington County are English (7,250 | 19.4%), Irish (6,660 | 17.8%), German (4,719 | 12.6%), Italian (3,628 | 9.7%), and French (3,016 | 8.1%), together accounting for 67.7% of all Bennington County residents.
| Ancestry | # Population | % Population |
| African | 57 | 0.2% |
| Alsatian | 3 | 0.0% |
| American | 2,752 | 7.4% |
| Arab | 115 | 0.3% |
| Argentinean | 13 | 0.0% |
| Armenian | 24 | 0.1% |
| Austrian | 89 | 0.2% |
| Belgian | 16 | 0.0% |
| Bhutanese | 42 | 0.1% |
| Blackfeet | 5 | 0.0% |
| British | 372 | 1.0% |
| Burmese | 99 | 0.3% |
| Cajun | 11 | 0.0% |
| Cambodian | 1 | 0.0% |
| Canadian | 113 | 0.3% |
| Celtic | 15 | 0.0% |
| Central American | 26 | 0.1% |
| Central American Indian | 17 | 0.1% |
| Cherokee | 3 | 0.0% |
| Colombian | 52 | 0.1% |
| Creek | 4 | 0.0% |
| Croatian | 26 | 0.1% |
| Cuban | 64 | 0.2% |
| Czech | 123 | 0.3% |
| Czechoslovakian | 9 | 0.0% |
| Danish | 123 | 0.3% |
| Dutch | 473 | 1.3% |
| Eastern European | 130 | 0.4% |
| Ecuadorian | 61 | 0.2% |
| English | 7,250 | 19.4% |
| European | 515 | 1.4% |
| Filipino | 5 | 0.0% |
| Finnish | 118 | 0.3% |
| French | 3,016 | 8.1% |
| French American Indian | 48 | 0.1% |
| French Canadian | 1,653 | 4.4% |
| German | 4,719 | 12.6% |
| Greek | 133 | 0.4% |
| Guamanian / Chamorro | 100 | 0.3% |
| Guatemalan | 17 | 0.1% |
| Honduran | 9 | 0.0% |
| Hungarian | 210 | 0.6% |
| Indian (Asian) | 152 | 0.4% |
| Irish | 6,660 | 17.8% |
| Iroquois | 21 | 0.1% |
| Italian | 3,628 | 9.7% |
| Jamaican | 30 | 0.1% |
| Japanese | 1 | 0.0% |
| Korean | 32 | 0.1% |
| Latvian | 28 | 0.1% |
| Lebanese | 76 | 0.2% |
| Lithuanian | 99 | 0.3% |
| Malaysian | 5 | 0.0% |
| Mexican | 419 | 1.1% |
| Mexican American Indian | 3 | 0.0% |
| Native Hawaiian | 2 | 0.0% |
| Navajo | 2 | 0.0% |
| Nigerian | 8 | 0.0% |
| Northern European | 107 | 0.3% |
| Norwegian | 340 | 0.9% |
| Pakistani | 11 | 0.0% |
| Palestinian | 14 | 0.0% |
| Paraguayan | 33 | 0.1% |
| Pennsylvania German | 10 | 0.0% |
| Peruvian | 22 | 0.1% |
| Polish | 1,174 | 3.2% |
| Portuguese | 52 | 0.1% |
| Puerto Rican | 143 | 0.4% |
| Romanian | 8 | 0.0% |
| Russian | 322 | 0.9% |
| Samoan | 100 | 0.3% |
| Scandinavian | 65 | 0.2% |
| Scotch-Irish | 351 | 0.9% |
| Scottish | 1,510 | 4.1% |
| Serbian | 33 | 0.1% |
| Slovak | 214 | 0.6% |
| Slovene | 24 | 0.1% |
| South American | 181 | 0.5% |
| Spanish | 18 | 0.1% |
| Sri Lankan | 30 | 0.1% |
| Subsaharan African | 77 | 0.2% |
| Swedish | 534 | 1.4% |
| Swiss | 47 | 0.1% |
| Syrian | 25 | 0.1% |
| Thai | 157 | 0.4% |
| Turkish | 14 | 0.0% |
| Ukrainian | 88 | 0.2% |
| Welsh | 526 | 1.4% |
| Yugoslavian | 31 | 0.1% | View All 89 Rows |
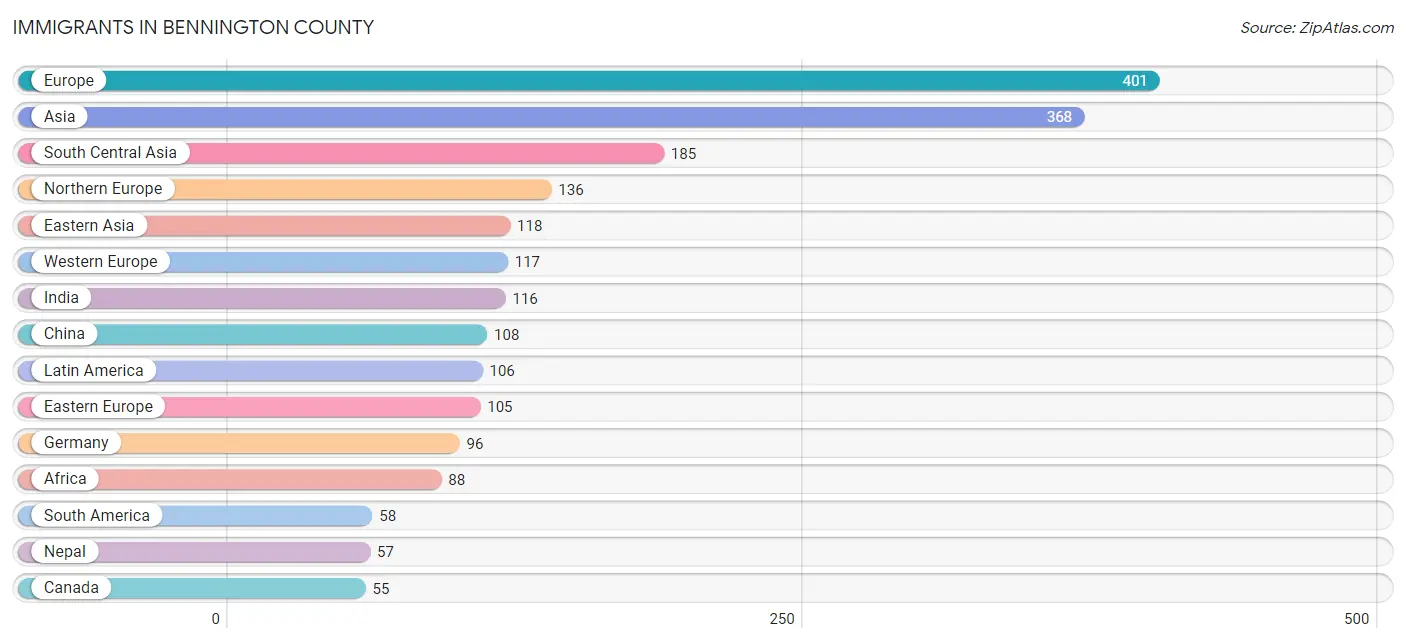
Immigrants in Bennington County
The most numerous immigrant groups reported in Bennington County came from Europe (401 | 1.1%), Asia (368 | 1.0%), South Central Asia (185 | 0.5%), Northern Europe (136 | 0.4%), and Eastern Asia (118 | 0.3%), together accounting for 3.2% of all Bennington County residents.
| Immigration Origin | # Population | % Population |
| Africa | 88 | 0.2% |
| Argentina | 10 | 0.0% |
| Asia | 368 | 1.0% |
| Austria | 7 | 0.0% |
| Bosnia and Herzegovina | 39 | 0.1% |
| Canada | 55 | 0.2% |
| Caribbean | 27 | 0.1% |
| Central America | 21 | 0.1% |
| China | 108 | 0.3% |
| Colombia | 6 | 0.0% |
| Czechoslovakia | 3 | 0.0% |
| Eastern Africa | 48 | 0.1% |
| Eastern Asia | 118 | 0.3% |
| Eastern Europe | 105 | 0.3% |
| Ecuador | 34 | 0.1% |
| England | 53 | 0.1% |
| Europe | 401 | 1.1% |
| France | 9 | 0.0% |
| Germany | 96 | 0.3% |
| Greece | 16 | 0.0% |
| Honduras | 9 | 0.0% |
| Hungary | 15 | 0.0% |
| India | 116 | 0.3% |
| Ireland | 15 | 0.0% |
| Italy | 15 | 0.0% |
| Jamaica | 15 | 0.0% |
| Japan | 5 | 0.0% |
| Kenya | 48 | 0.1% |
| Korea | 5 | 0.0% |
| Latin America | 106 | 0.3% |
| Lebanon | 11 | 0.0% |
| Lithuania | 6 | 0.0% |
| Malaysia | 4 | 0.0% |
| Mexico | 12 | 0.0% |
| Middle Africa | 12 | 0.0% |
| Nepal | 57 | 0.2% |
| Netherlands | 5 | 0.0% |
| Nigeria | 8 | 0.0% |
| Northern Europe | 136 | 0.4% |
| Peru | 3 | 0.0% |
| Philippines | 24 | 0.1% |
| Poland | 32 | 0.1% |
| Romania | 4 | 0.0% |
| Russia | 1 | 0.0% |
| Scotland | 1 | 0.0% |
| South Africa | 20 | 0.1% |
| South America | 58 | 0.2% |
| South Central Asia | 185 | 0.5% |
| South Eastern Asia | 52 | 0.1% |
| Southern Europe | 43 | 0.1% |
| Spain | 12 | 0.0% |
| Thailand | 8 | 0.0% |
| Turkey | 2 | 0.0% |
| Ukraine | 5 | 0.0% |
| Vietnam | 16 | 0.0% |
| Western Africa | 8 | 0.0% |
| Western Asia | 13 | 0.0% |
| Western Europe | 117 | 0.3% |
| Zaire | 12 | 0.0% | View All 59 Rows |
Sex and Age in Bennington County
Sex and Age in Bennington County
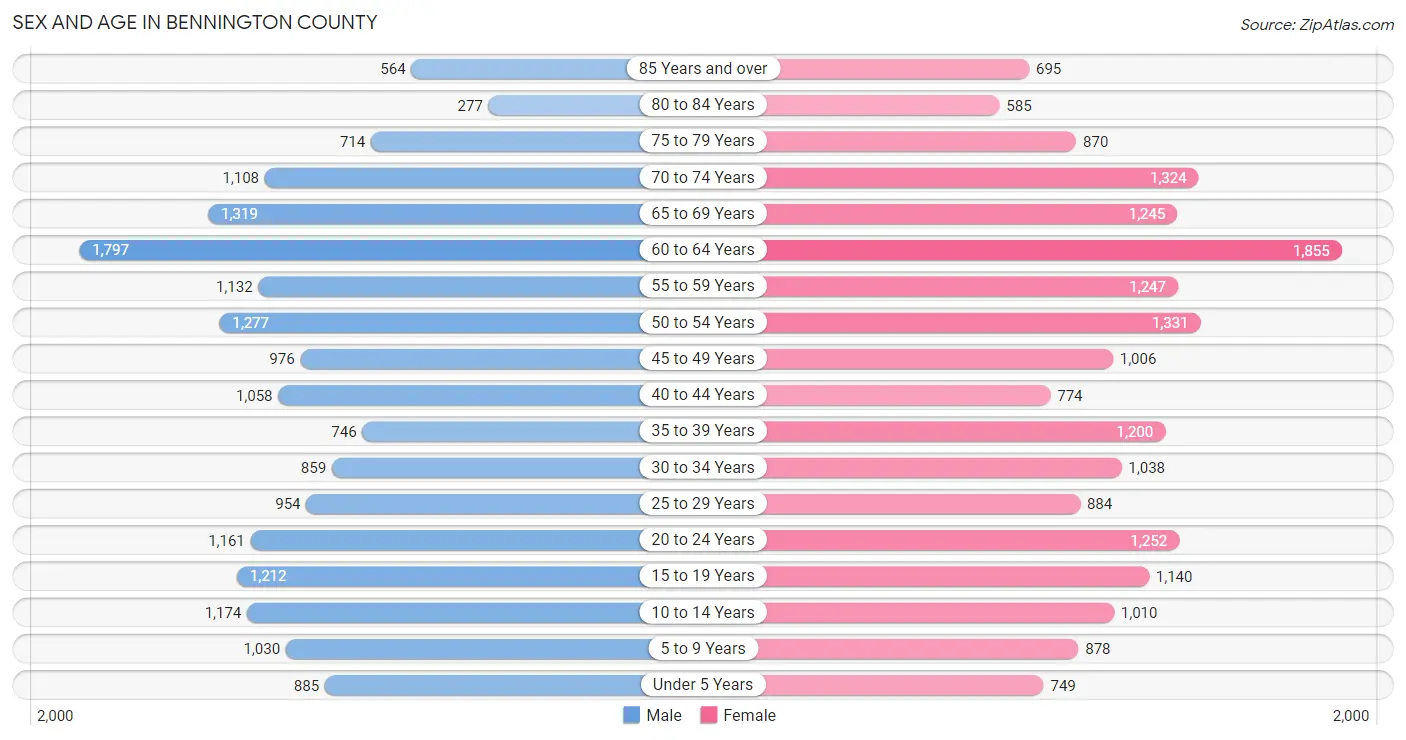
The most populous age groups in Bennington County are 60 to 64 Years (1,797 | 9.9%) for men and 60 to 64 Years (1,855 | 9.7%) for women.
| Age Bracket | Male | Female |
| Under 5 Years | 885 (4.9%) | 749 (3.9%) |
| 5 to 9 Years | 1,030 (5.7%) | 878 (4.6%) |
| 10 to 14 Years | 1,174 (6.4%) | 1,010 (5.3%) |
| 15 to 19 Years | 1,212 (6.6%) | 1,140 (6.0%) |
| 20 to 24 Years | 1,161 (6.4%) | 1,252 (6.6%) |
| 25 to 29 Years | 954 (5.2%) | 884 (4.6%) |
| 30 to 34 Years | 859 (4.7%) | 1,038 (5.4%) |
| 35 to 39 Years | 746 (4.1%) | 1,200 (6.3%) |
| 40 to 44 Years | 1,058 (5.8%) | 774 (4.1%) |
| 45 to 49 Years | 976 (5.3%) | 1,006 (5.3%) |
| 50 to 54 Years | 1,277 (7.0%) | 1,331 (7.0%) |
| 55 to 59 Years | 1,132 (6.2%) | 1,247 (6.5%) |
| 60 to 64 Years | 1,797 (9.9%) | 1,855 (9.7%) |
| 65 to 69 Years | 1,319 (7.2%) | 1,245 (6.5%) |
| 70 to 74 Years | 1,108 (6.1%) | 1,324 (6.9%) |
| 75 to 79 Years | 714 (3.9%) | 870 (4.6%) |
| 80 to 84 Years | 277 (1.5%) | 585 (3.1%) |
| 85 Years and over | 564 (3.1%) | 695 (3.6%) |
| Total | 18,243 (100.0%) | 19,083 (100.0%) |
Families and Households in Bennington County
Median Family Size in Bennington County
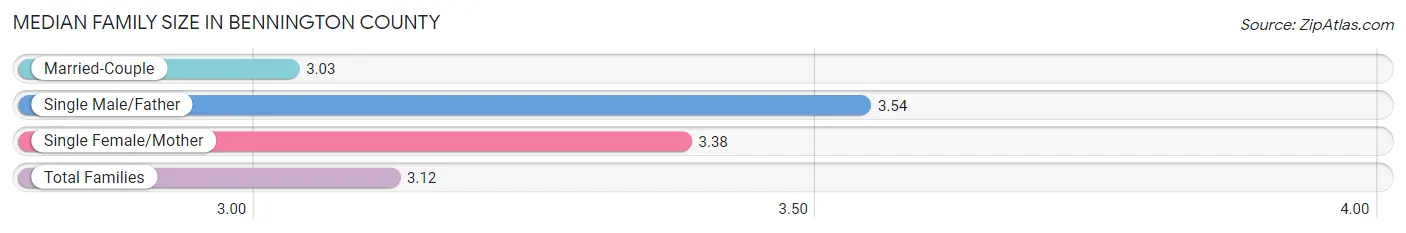
The median family size in Bennington County is 3.12 persons per family, with single male/father families (543 | 6.0%) accounting for the largest median family size of 3.54 persons per family. On the other hand, married-couple families (6,998 | 77.8%) represent the smallest median family size with 3.03 persons per family.
| Family Type | # Families | Family Size |
| Married-Couple | 6,998 (77.8%) | 3.03 |
| Single Male/Father | 543 (6.0%) | 3.54 |
| Single Female/Mother | 1,451 (16.1%) | 3.38 |
| Total Families | 8,992 (100.0%) | 3.12 |
Median Household Size in Bennington County
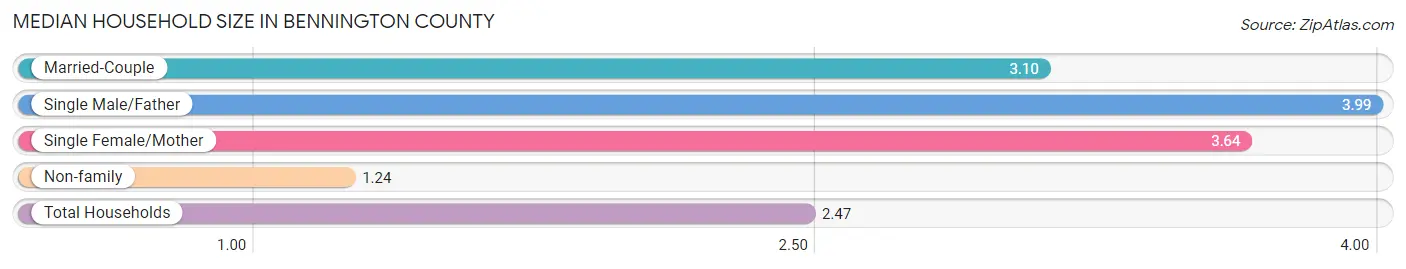
The median household size in Bennington County is 2.47 persons per household, with single male/father households (543 | 3.7%) accounting for the largest median household size of 3.99 persons per household. non-family households (5,574 | 38.3%) represent the smallest median household size with 1.24 persons per household.
| Household Type | # Households | Household Size |
| Married-Couple | 6,998 (48.0%) | 3.10 |
| Single Male/Father | 543 (3.7%) | 3.99 |
| Single Female/Mother | 1,451 (10.0%) | 3.64 |
| Non-family | 5,574 (38.3%) | 1.24 |
| Total Households | 14,566 (100.0%) | 2.47 |
Household Size by Marriage Status in Bennington County
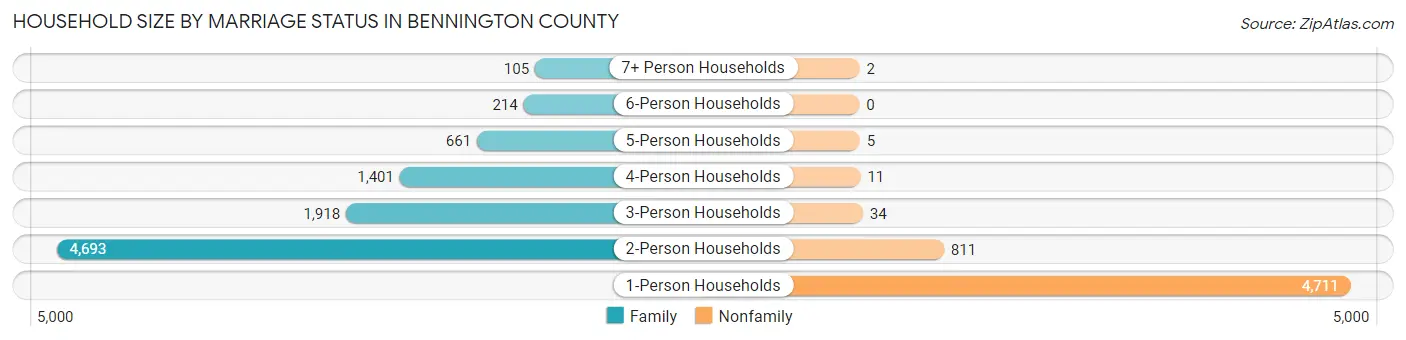
Out of a total of 14,566 households in Bennington County, 8,992 (61.7%) are family households, while 5,574 (38.3%) are nonfamily households. The most numerous type of family households are 2-person households, comprising 4,693, and the most common type of nonfamily households are 1-person households, comprising 4,711.
| Household Size | Family Households | Nonfamily Households |
| 1-Person Households | - | 4,711 (32.3%) |
| 2-Person Households | 4,693 (32.2%) | 811 (5.6%) |
| 3-Person Households | 1,918 (13.2%) | 34 (0.2%) |
| 4-Person Households | 1,401 (9.6%) | 11 (0.1%) |
| 5-Person Households | 661 (4.5%) | 5 (0.0%) |
| 6-Person Households | 214 (1.5%) | 0 (0.0%) |
| 7+ Person Households | 105 (0.7%) | 2 (0.0%) |
| Total | 8,992 (61.7%) | 5,574 (38.3%) |
Female Fertility in Bennington County
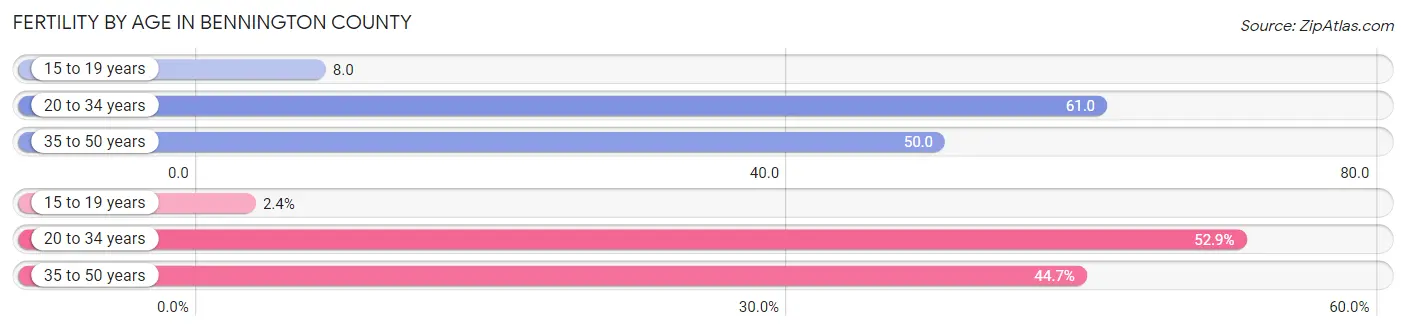
Fertility by Age in Bennington County
Average fertility rate in Bennington County is 48.0 births per 1,000 women. Women in the age bracket of 20 to 34 years have the highest fertility rate with 61.0 births per 1,000 women. Women in the age bracket of 20 to 34 years acount for 52.8% of all women with births.
| Age Bracket | Women with Births | Births / 1,000 Women |
| 15 to 19 years | 9 (2.4%) | 8.0 |
| 20 to 34 years | 195 (52.8%) | 61.0 |
| 35 to 50 years | 165 (44.7%) | 50.0 |
| Total | 369 (100.0%) | 48.0 |
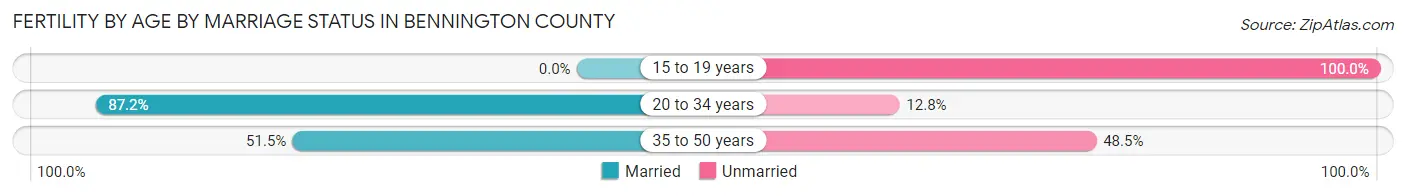
Fertility by Age by Marriage Status in Bennington County
69.1% of women with births (369) in Bennington County are married. The highest percentage of unmarried women with births falls into 15 to 19 years age bracket with 100.0% of them unmarried at the time of birth, while the lowest percentage of unmarried women with births belong to 20 to 34 years age bracket with 12.8% of them unmarried.
| Age Bracket | Married | Unmarried |
| 15 to 19 years | 0 (0.0%) | 9 (100.0%) |
| 20 to 34 years | 170 (87.2%) | 25 (12.8%) |
| 35 to 50 years | 85 (51.5%) | 80 (48.5%) |
| Total | 255 (69.1%) | 114 (30.9%) |
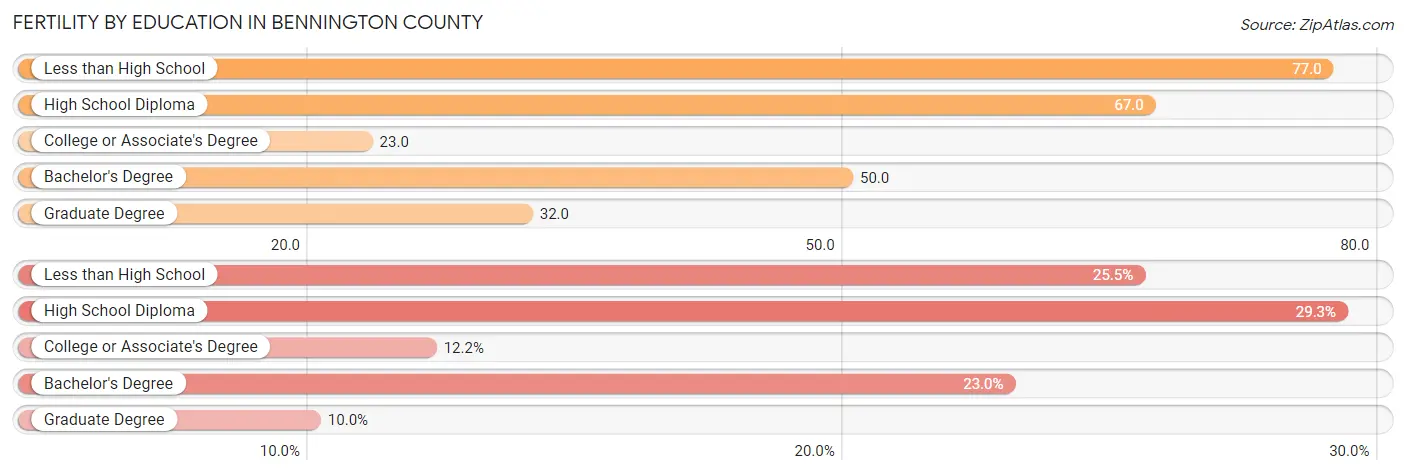
Fertility by Education in Bennington County
Average fertility rate in Bennington County is 48.0 births per 1,000 women. Women with the education attainment of less than high school have the highest fertility rate of 77.0 births per 1,000 women, while women with the education attainment of college or associate's degree have the lowest fertility at 23.0 births per 1,000 women. Women with the education attainment of high school diploma represent 29.3% of all women with births.
| Educational Attainment | Women with Births | Births / 1,000 Women |
| Less than High School | 94 (25.5%) | 77.0 |
| High School Diploma | 108 (29.3%) | 67.0 |
| College or Associate's Degree | 45 (12.2%) | 23.0 |
| Bachelor's Degree | 85 (23.0%) | 50.0 |
| Graduate Degree | 37 (10.0%) | 32.0 |
| Total | 369 (100.0%) | 48.0 |
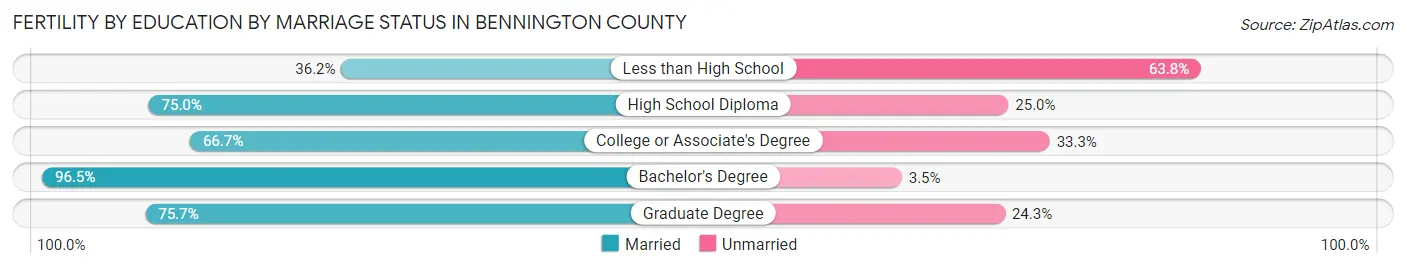
Fertility by Education by Marriage Status in Bennington County
30.9% of women with births in Bennington County are unmarried. Women with the educational attainment of bachelor's degree are most likely to be married with 96.5% of them married at childbirth, while women with the educational attainment of less than high school are least likely to be married with 63.8% of them unmarried at childbirth.
| Educational Attainment | Married | Unmarried |
| Less than High School | 34 (36.2%) | 60 (63.8%) |
| High School Diploma | 81 (75.0%) | 27 (25.0%) |
| College or Associate's Degree | 30 (66.7%) | 15 (33.3%) |
| Bachelor's Degree | 82 (96.5%) | 3 (3.5%) |
| Graduate Degree | 28 (75.7%) | 9 (24.3%) |
| Total | 255 (69.1%) | 114 (30.9%) |
Income in Bennington County
Income Overview in Bennington County
Per Capita Income in Bennington County is $39,717, while median incomes of families and households are $95,160 and $68,558 respectively.
| Characteristic | Number | Measure |
| Per Capita Income | 37,326 | $39,717 |
| Median Family Income | 8,992 | $95,160 |
| Mean Family Income | 8,992 | $117,973 |
| Median Household Income | 14,566 | $68,558 |
| Mean Household Income | 14,566 | $94,727 |
| Income Deficit | 8,992 | $12,182 |
| Wage / Income Gap (%) | 37,326 | 15.60% |
| Wage / Income Gap ($) | 37,326 | 84.40¢ per $1 |
| Gini / Inequality Index | 37,326 | 0.48 |
Earnings by Sex in Bennington County
Average Earnings in Bennington County are $38,505, $41,617 for men and $35,126 for women, a difference of 15.6%.
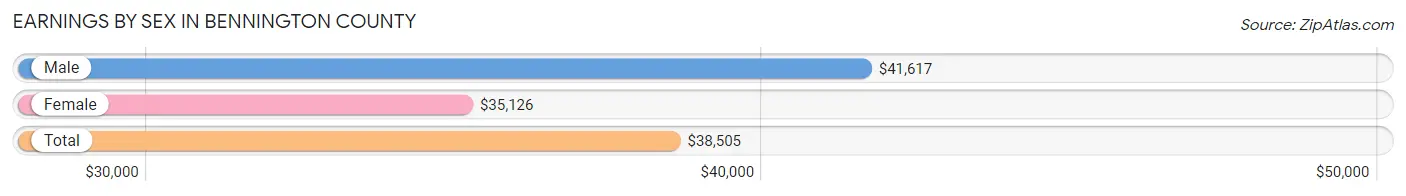
| Sex | Number | Average Earnings |
| Male | 9,482 (48.2%) | $41,617 |
| Female | 10,175 (51.8%) | $35,126 |
| Total | 19,657 (100.0%) | $38,505 |
Earnings by Sex by Income Bracket in Bennington County
The most common earnings brackets in Bennington County are $100,000+ for men (1,174 | 12.4%) and $75,000 to $99,999 for women (1,116 | 11.0%).
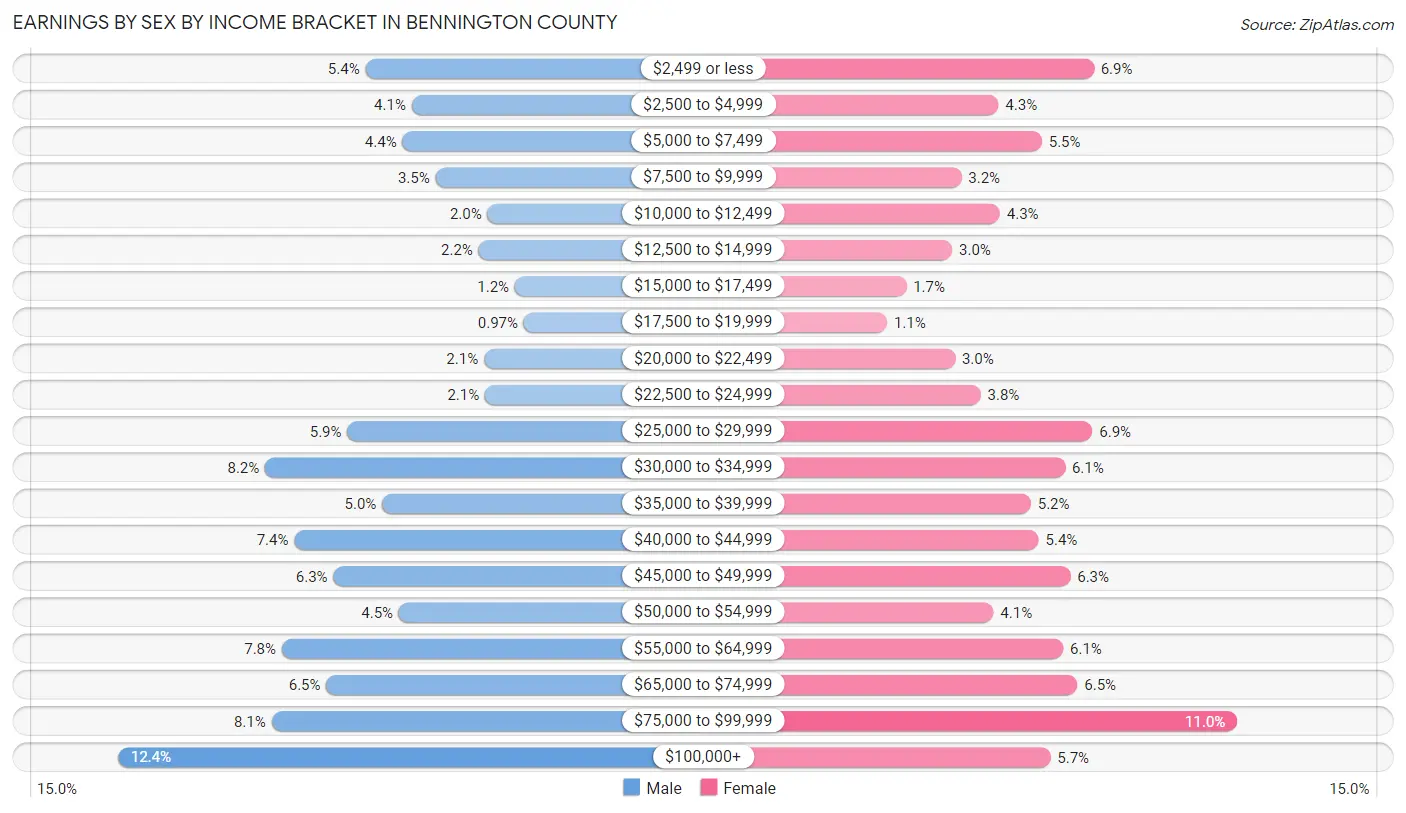
| Income | Male | Female |
| $2,499 or less | 514 (5.4%) | 706 (6.9%) |
| $2,500 to $4,999 | 391 (4.1%) | 433 (4.3%) |
| $5,000 to $7,499 | 415 (4.4%) | 558 (5.5%) |
| $7,500 to $9,999 | 327 (3.5%) | 328 (3.2%) |
| $10,000 to $12,499 | 189 (2.0%) | 438 (4.3%) |
| $12,500 to $14,999 | 212 (2.2%) | 301 (3.0%) |
| $15,000 to $17,499 | 116 (1.2%) | 170 (1.7%) |
| $17,500 to $19,999 | 92 (1.0%) | 115 (1.1%) |
| $20,000 to $22,499 | 198 (2.1%) | 309 (3.0%) |
| $22,500 to $24,999 | 195 (2.1%) | 383 (3.8%) |
| $25,000 to $29,999 | 562 (5.9%) | 702 (6.9%) |
| $30,000 to $34,999 | 781 (8.2%) | 624 (6.1%) |
| $35,000 to $39,999 | 469 (5.0%) | 526 (5.2%) |
| $40,000 to $44,999 | 704 (7.4%) | 548 (5.4%) |
| $45,000 to $49,999 | 599 (6.3%) | 639 (6.3%) |
| $50,000 to $54,999 | 425 (4.5%) | 419 (4.1%) |
| $55,000 to $64,999 | 737 (7.8%) | 619 (6.1%) |
| $65,000 to $74,999 | 618 (6.5%) | 659 (6.5%) |
| $75,000 to $99,999 | 764 (8.1%) | 1,116 (11.0%) |
| $100,000+ | 1,174 (12.4%) | 582 (5.7%) |
| Total | 9,482 (100.0%) | 10,175 (100.0%) |
Earnings by Sex by Educational Attainment in Bennington County
Average earnings in Bennington County are $46,791 for men and $43,084 for women, a difference of 7.9%. Men with an educational attainment of graduate degree enjoy the highest average annual earnings of $71,574, while those with less than high school education earn the least with $38,684. Women with an educational attainment of graduate degree earn the most with the average annual earnings of $60,777, while those with high school diploma education have the smallest earnings of $33,312.
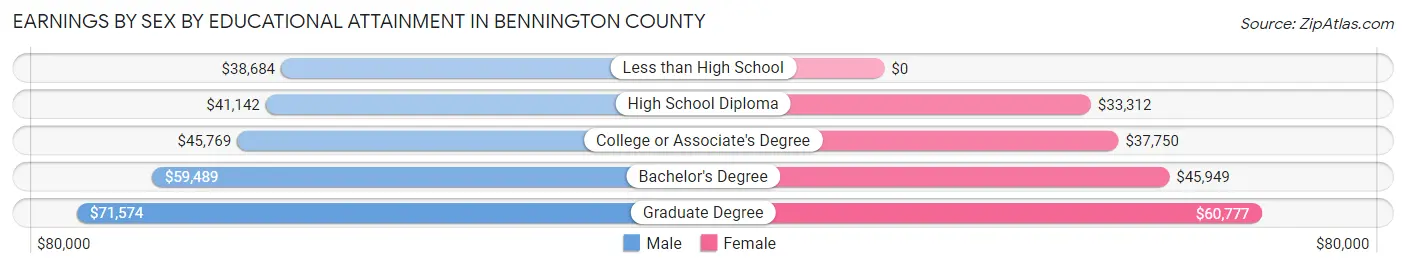
| Educational Attainment | Male Income | Female Income |
| Less than High School | $38,684 | $0 |
| High School Diploma | $41,142 | $33,312 |
| College or Associate's Degree | $45,769 | $37,750 |
| Bachelor's Degree | $59,489 | $45,949 |
| Graduate Degree | $71,574 | $60,777 |
| Total | $46,791 | $43,084 |
Family Income in Bennington County
Family Income Brackets in Bennington County
According to the Bennington County family income data, there are 1,942 families falling into the $100,000 to $149,999 income range, which is the most common income bracket and makes up 21.6% of all families. Conversely, the $10,000 to $14,999 income bracket is the least frequent group with only 171 families (1.9%) belonging to this category.
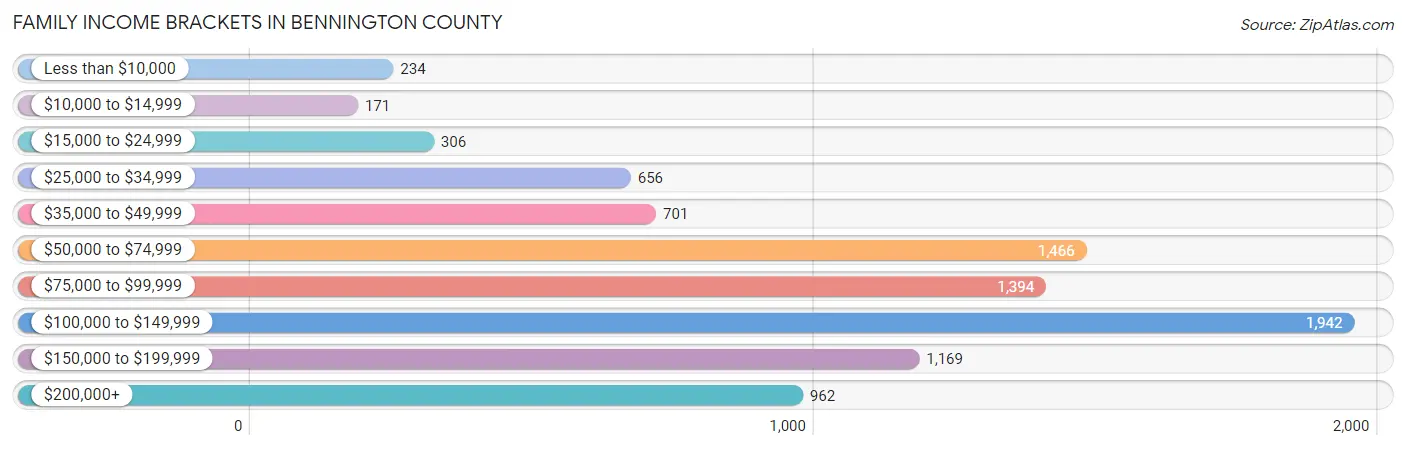
| Income Bracket | # Families | % Families |
| Less than $10,000 | 234 | 2.6% |
| $10,000 to $14,999 | 171 | 1.9% |
| $15,000 to $24,999 | 306 | 3.4% |
| $25,000 to $34,999 | 656 | 7.3% |
| $35,000 to $49,999 | 701 | 7.8% |
| $50,000 to $74,999 | 1,466 | 16.3% |
| $75,000 to $99,999 | 1,394 | 15.5% |
| $100,000 to $149,999 | 1,942 | 21.6% |
| $150,000 to $199,999 | 1,169 | 13.0% |
| $200,000+ | 962 | 10.7% |
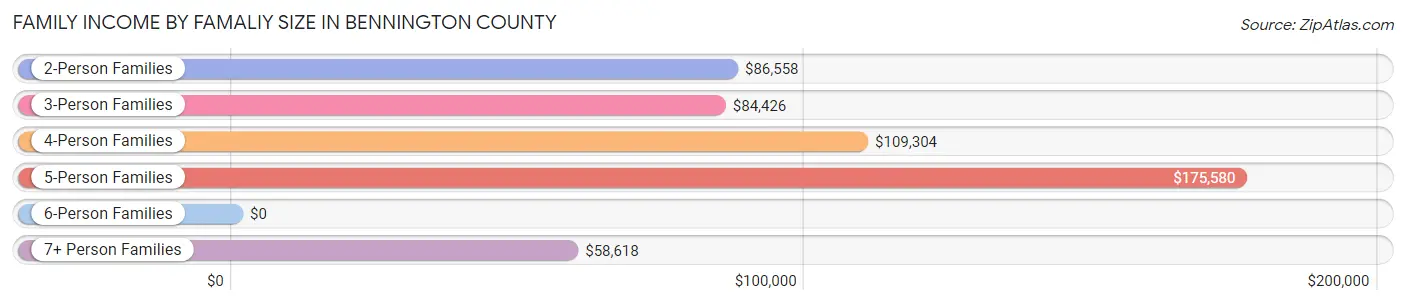
Family Income by Famaliy Size in Bennington County
5-person families (439 | 4.9%) account for the highest median family income in Bennington County with $175,580 per family, while 2-person families (4,883 | 54.3%) have the highest median income of $43,279 per family member.
| Income Bracket | # Families | Median Income |
| 2-Person Families | 4,883 (54.3%) | $86,558 |
| 3-Person Families | 1,940 (21.6%) | $84,426 |
| 4-Person Families | 1,457 (16.2%) | $109,304 |
| 5-Person Families | 439 (4.9%) | $175,580 |
| 6-Person Families | 216 (2.4%) | $0 |
| 7+ Person Families | 57 (0.6%) | $58,618 |
| Total | 8,992 (100.0%) | $95,160 |
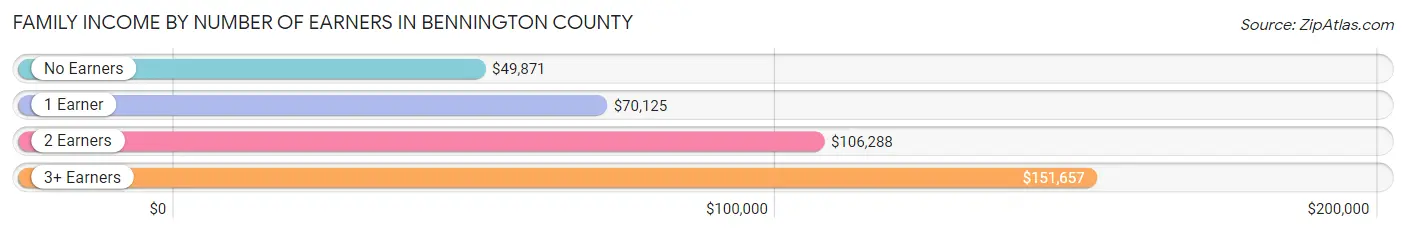
Family Income by Number of Earners in Bennington County
The median family income in Bennington County is $95,160, with families comprising 3+ earners (964) having the highest median family income of $151,657, while families with no earners (1,717) have the lowest median family income of $49,871, accounting for 10.7% and 19.1% of families, respectively.
| Number of Earners | # Families | Median Income |
| No Earners | 1,717 (19.1%) | $49,871 |
| 1 Earner | 2,724 (30.3%) | $70,125 |
| 2 Earners | 3,587 (39.9%) | $106,288 |
| 3+ Earners | 964 (10.7%) | $151,657 |
| Total | 8,992 (100.0%) | $95,160 |
Household Income in Bennington County
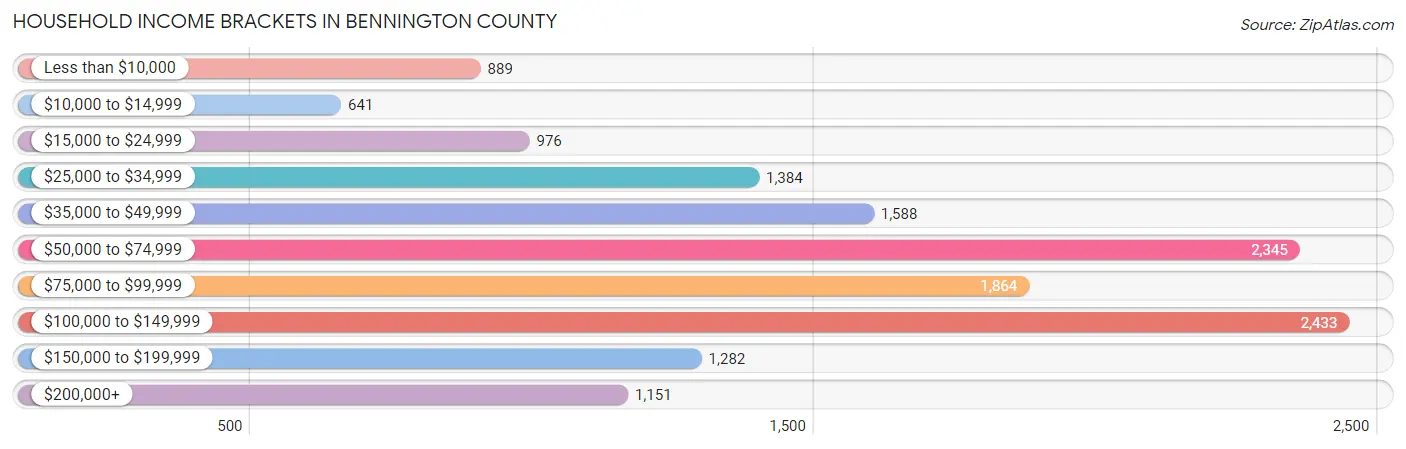
Household Income Brackets in Bennington County
With 2,433 households falling in the category, the $100,000 to $149,999 income range is the most frequent in Bennington County, accounting for 16.7% of all households. In contrast, only 641 households (4.4%) fall into the $10,000 to $14,999 income bracket, making it the least populous group.
| Income Bracket | # Households | % Households |
| Less than $10,000 | 889 | 6.1% |
| $10,000 to $14,999 | 641 | 4.4% |
| $15,000 to $24,999 | 976 | 6.7% |
| $25,000 to $34,999 | 1,384 | 9.5% |
| $35,000 to $49,999 | 1,588 | 10.9% |
| $50,000 to $74,999 | 2,345 | 16.1% |
| $75,000 to $99,999 | 1,864 | 12.8% |
| $100,000 to $149,999 | 2,433 | 16.7% |
| $150,000 to $199,999 | 1,282 | 8.8% |
| $200,000+ | 1,151 | 7.9% |
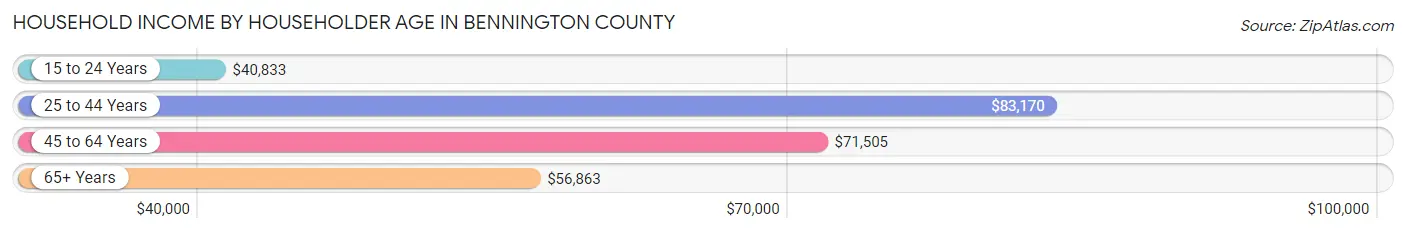
Household Income by Householder Age in Bennington County
The median household income in Bennington County is $68,558, with the highest median household income of $83,170 found in the 25 to 44 years age bracket for the primary householder. A total of 3,098 households (21.3%) fall into this category. Meanwhile, the 15 to 24 years age bracket for the primary householder has the lowest median household income of $40,833, with 228 households (1.6%) in this group.
| Income Bracket | # Households | Median Income |
| 15 to 24 Years | 228 (1.6%) | $40,833 |
| 25 to 44 Years | 3,098 (21.3%) | $83,170 |
| 45 to 64 Years | 5,874 (40.3%) | $71,505 |
| 65+ Years | 5,366 (36.8%) | $56,863 |
| Total | 14,566 (100.0%) | $68,558 |
Poverty in Bennington County
Income Below Poverty by Sex and Age in Bennington County
With 9.9% poverty level for males and 12.5% for females among the residents of Bennington County, under 5 year old males and 6 to 11 year old females are the most vulnerable to poverty, with 258 males (29.2%) and 266 females (25.9%) in their respective age groups living below the poverty level.
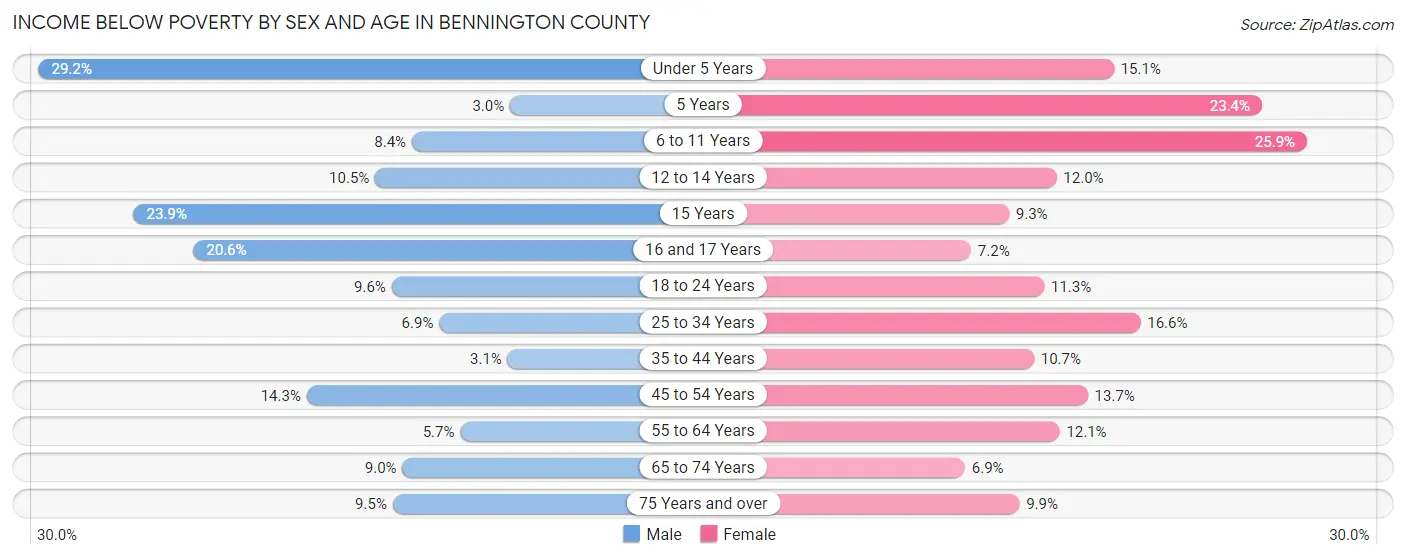
| Age Bracket | Male | Female |
| Under 5 Years | 258 (29.2%) | 111 (15.1%) |
| 5 Years | 3 (3.0%) | 51 (23.4%) |
| 6 to 11 Years | 125 (8.4%) | 266 (25.9%) |
| 12 to 14 Years | 63 (10.5%) | 73 (11.9%) |
| 15 Years | 67 (23.9%) | 12 (9.3%) |
| 16 and 17 Years | 89 (20.6%) | 32 (7.2%) |
| 18 to 24 Years | 138 (9.6%) | 161 (11.3%) |
| 25 to 34 Years | 125 (6.9%) | 318 (16.6%) |
| 35 to 44 Years | 56 (3.1%) | 211 (10.7%) |
| 45 to 54 Years | 320 (14.3%) | 320 (13.7%) |
| 55 to 64 Years | 167 (5.7%) | 372 (12.1%) |
| 65 to 74 Years | 214 (9.0%) | 175 (6.9%) |
| 75 Years and over | 136 (9.5%) | 196 (9.9%) |
| Total | 1,761 (9.9%) | 2,298 (12.5%) |
Income Above Poverty by Sex and Age in Bennington County
According to the poverty statistics in Bennington County, males aged 5 years and females aged 65 to 74 years are the age groups that are most secure financially, with 97.0% of males and 93.1% of females in these age groups living above the poverty line.
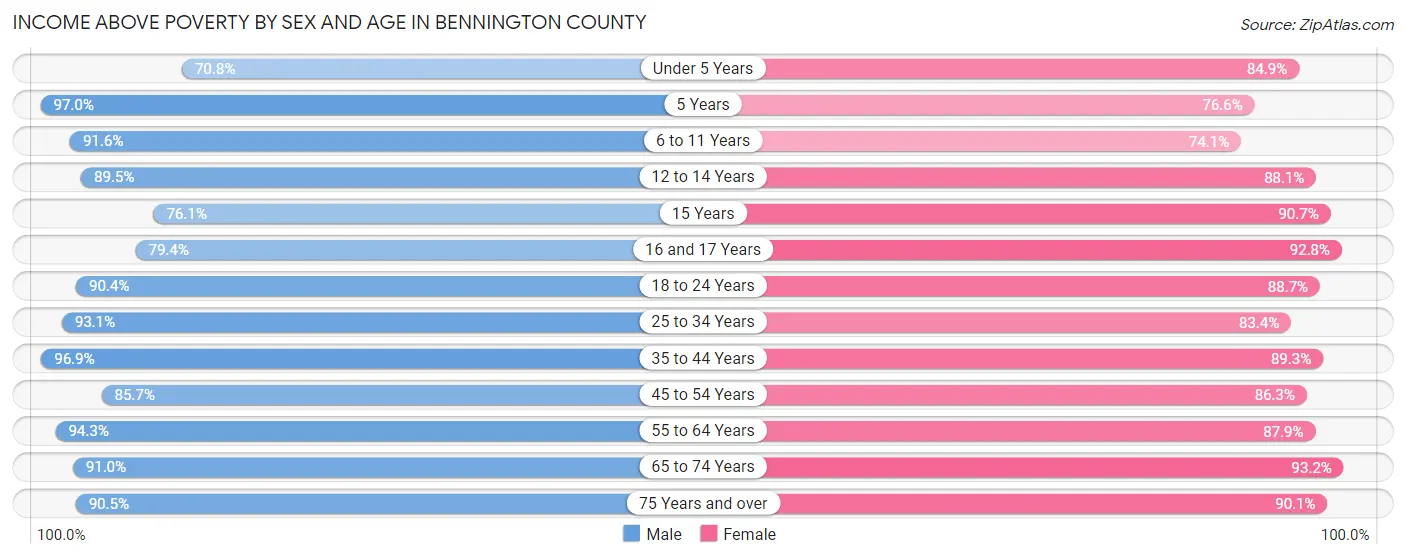
| Age Bracket | Male | Female |
| Under 5 Years | 625 (70.8%) | 622 (84.9%) |
| 5 Years | 98 (97.0%) | 167 (76.6%) |
| 6 to 11 Years | 1,357 (91.6%) | 761 (74.1%) |
| 12 to 14 Years | 538 (89.5%) | 538 (88.0%) |
| 15 Years | 213 (76.1%) | 117 (90.7%) |
| 16 and 17 Years | 343 (79.4%) | 413 (92.8%) |
| 18 to 24 Years | 1,305 (90.4%) | 1,269 (88.7%) |
| 25 to 34 Years | 1,684 (93.1%) | 1,595 (83.4%) |
| 35 to 44 Years | 1,748 (96.9%) | 1,763 (89.3%) |
| 45 to 54 Years | 1,920 (85.7%) | 2,017 (86.3%) |
| 55 to 64 Years | 2,742 (94.3%) | 2,698 (87.9%) |
| 65 to 74 Years | 2,174 (91.0%) | 2,378 (93.1%) |
| 75 Years and over | 1,296 (90.5%) | 1,787 (90.1%) |
| Total | 16,043 (90.1%) | 16,125 (87.5%) |
Income Below Poverty Among Married-Couple Families in Bennington County
The poverty statistics for married-couple families in Bennington County show that 2.8% or 199 of the total 6,998 families live below the poverty line. Families with 3 or 4 children have the highest poverty rate of 4.5%, comprising of 18 families. On the other hand, families with 5 or more children have the lowest poverty rate of 0.0%, which includes 0 families.
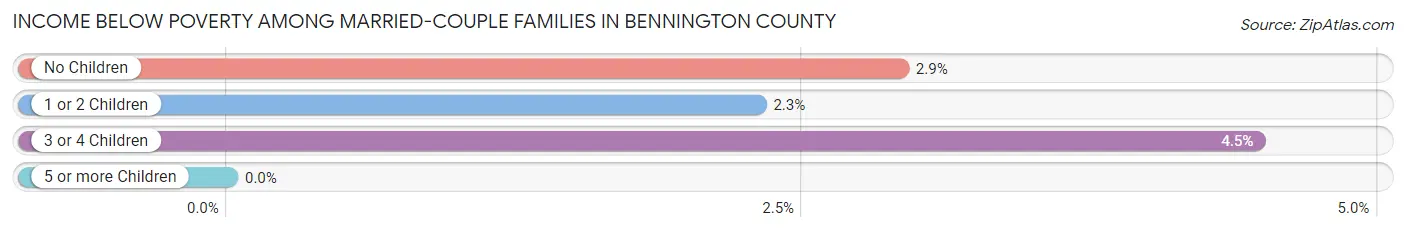
| Children | Above Poverty | Below Poverty |
| No Children | 4,727 (97.1%) | 142 (2.9%) |
| 1 or 2 Children | 1,654 (97.7%) | 39 (2.3%) |
| 3 or 4 Children | 385 (95.5%) | 18 (4.5%) |
| 5 or more Children | 33 (100.0%) | 0 (0.0%) |
| Total | 6,799 (97.2%) | 199 (2.8%) |
Income Below Poverty Among Single-Parent Households in Bennington County
According to the poverty data in Bennington County, 4.8% or 26 single-father households and 23.4% or 339 single-mother households are living below the poverty line. Among single-father households, those with 1 or 2 children have the highest poverty rate, with 26 households (10.4%) experiencing poverty. Likewise, among single-mother households, those with 3 or 4 children have the highest poverty rate, with 113 households (77.4%) falling below the poverty line.
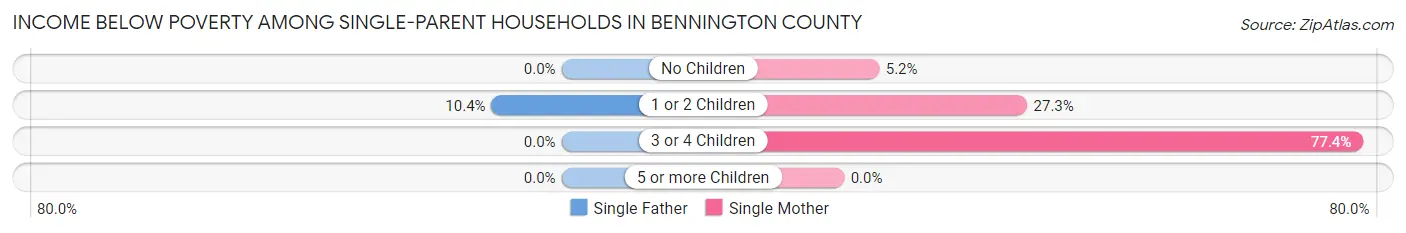
| Children | Single Father | Single Mother |
| No Children | 0 (0.0%) | 30 (5.2%) |
| 1 or 2 Children | 26 (10.4%) | 196 (27.3%) |
| 3 or 4 Children | 0 (0.0%) | 113 (77.4%) |
| 5 or more Children | 0 (0.0%) | 0 (0.0%) |
| Total | 26 (4.8%) | 339 (23.4%) |
Income Below Poverty Among Married-Couple vs Single-Parent Households in Bennington County
The poverty data for Bennington County shows that 199 of the married-couple family households (2.8%) and 365 of the single-parent households (18.3%) are living below the poverty level. Within the married-couple family households, those with 3 or 4 children have the highest poverty rate, with 18 households (4.5%) falling below the poverty line. Among the single-parent households, those with 3 or 4 children have the highest poverty rate, with 113 household (65.7%) living below poverty.
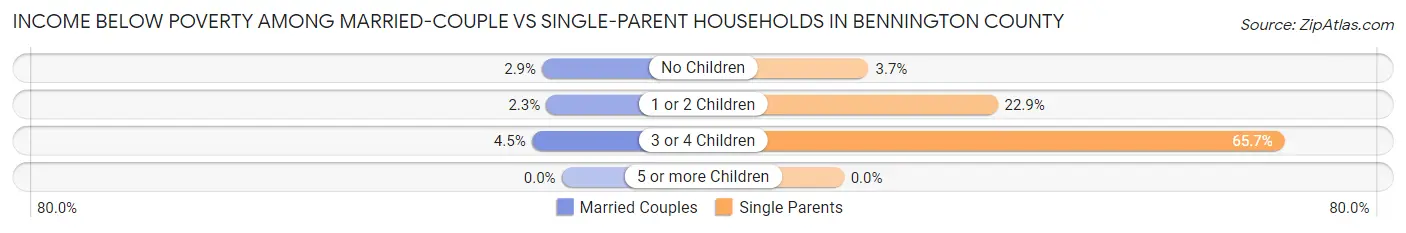
| Children | Married-Couple Families | Single-Parent Households |
| No Children | 142 (2.9%) | 30 (3.7%) |
| 1 or 2 Children | 39 (2.3%) | 222 (22.9%) |
| 3 or 4 Children | 18 (4.5%) | 113 (65.7%) |
| 5 or more Children | 0 (0.0%) | 0 (0.0%) |
| Total | 199 (2.8%) | 365 (18.3%) |
Employment Characteristics in Bennington County
Employment by Class of Employer in Bennington County
Among the 17,461 employed individuals in Bennington County, private company employees (9,887 | 56.6%), not-for-profit organizations (2,686 | 15.4%), and self-employed (not incorporated) (1,534 | 8.8%) make up the most common classes of employment.
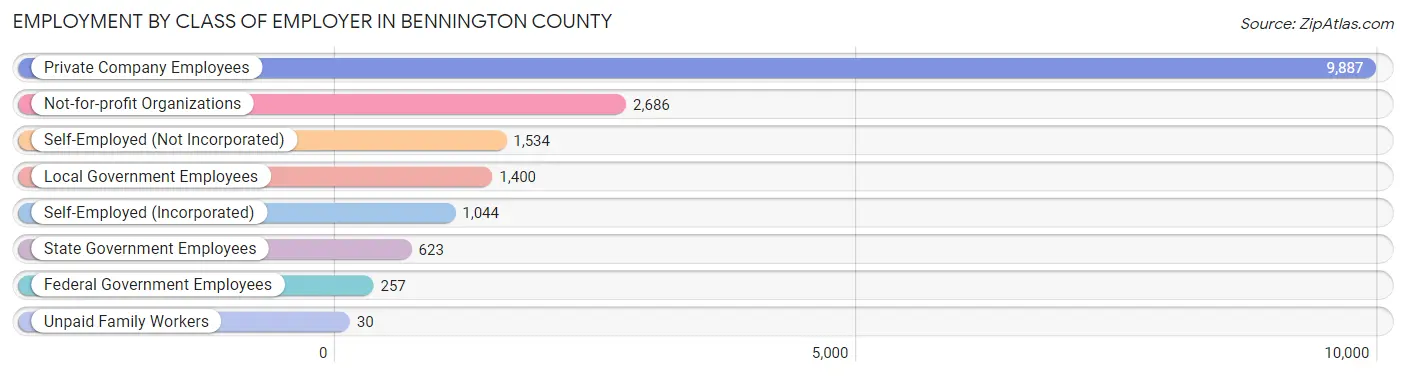
| Employer Class | # Employees | % Employees |
| Private Company Employees | 9,887 | 56.6% |
| Self-Employed (Incorporated) | 1,044 | 6.0% |
| Self-Employed (Not Incorporated) | 1,534 | 8.8% |
| Not-for-profit Organizations | 2,686 | 15.4% |
| Local Government Employees | 1,400 | 8.0% |
| State Government Employees | 623 | 3.6% |
| Federal Government Employees | 257 | 1.5% |
| Unpaid Family Workers | 30 | 0.2% |
| Total | 17,461 | 100.0% |
Employment Status by Age in Bennington County
According to the labor force statistics for Bennington County, out of the total population over 16 years of age (31,181), 59.5% or 18,553 individuals are in the labor force, with 4.2% or 779 of them unemployed. The age group with the highest labor force participation rate is 30 to 34 years, with 86.4% or 1,639 individuals in the labor force. Within the labor force, the 30 to 34 years age range has the highest percentage of unemployed individuals, with 9.5% or 156 of them being unemployed.
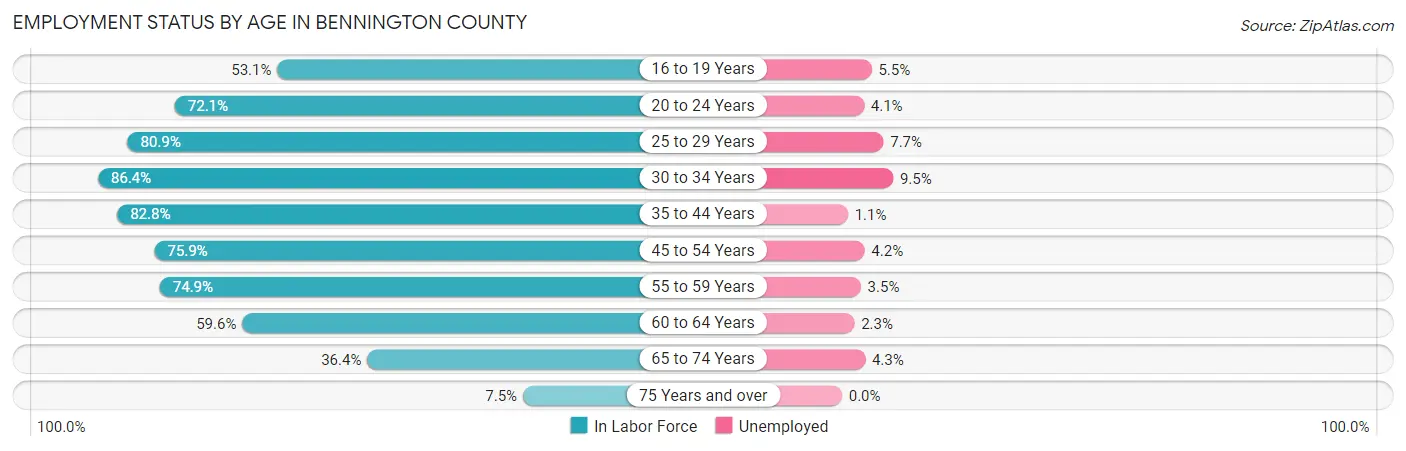
| Age Bracket | In Labor Force | Unemployed |
| 16 to 19 Years | 1,026 (53.1%) | 56 (5.5%) |
| 20 to 24 Years | 1,740 (72.1%) | 71 (4.1%) |
| 25 to 29 Years | 1,487 (80.9%) | 114 (7.7%) |
| 30 to 34 Years | 1,639 (86.4%) | 156 (9.5%) |
| 35 to 44 Years | 3,128 (82.8%) | 34 (1.1%) |
| 45 to 54 Years | 3,484 (75.9%) | 146 (4.2%) |
| 55 to 59 Years | 1,782 (74.9%) | 62 (3.5%) |
| 60 to 64 Years | 2,177 (59.6%) | 50 (2.3%) |
| 65 to 74 Years | 1,819 (36.4%) | 78 (4.3%) |
| 75 Years and over | 278 (7.5%) | 0 (0.0%) |
| Total | 18,553 (59.5%) | 779 (4.2%) |
Employment Status by Educational Attainment in Bennington County
According to labor force statistics for Bennington County, 75.5% of individuals (13,691) out of the total population between 25 and 64 years of age (18,134) are in the labor force, with 4.1% or 561 of them being unemployed. The group with the highest labor force participation rate are those with the educational attainment of bachelor's degree or higher, with 87.2% or 6,100 individuals in the labor force. Within the labor force, individuals with less than high school education have the highest percentage of unemployment, with 18.0% or 90 of them being unemployed.
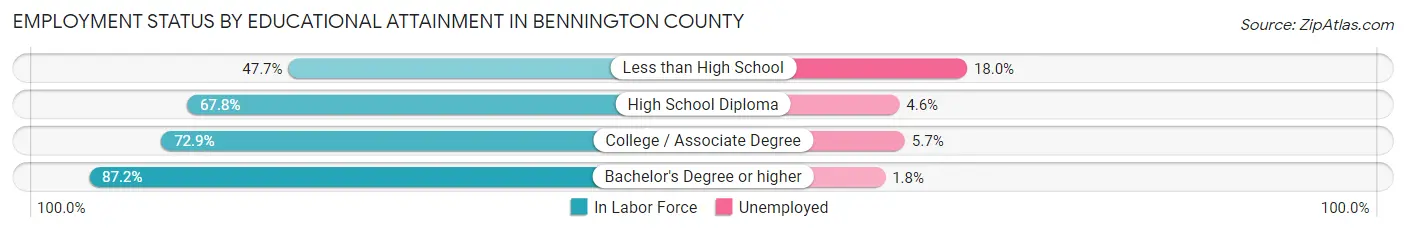
| Educational Attainment | In Labor Force | Unemployed |
| Less than High School | 499 (47.7%) | 188 (18.0%) |
| High School Diploma | 3,476 (67.8%) | 236 (4.6%) |
| College / Associate Degree | 3,620 (72.9%) | 283 (5.7%) |
| Bachelor's Degree or higher | 6,100 (87.2%) | 126 (1.8%) |
| Total | 13,691 (75.5%) | 743 (4.1%) |
Employment Occupations by Sex in Bennington County
Management, Business, Science and Arts Occupations
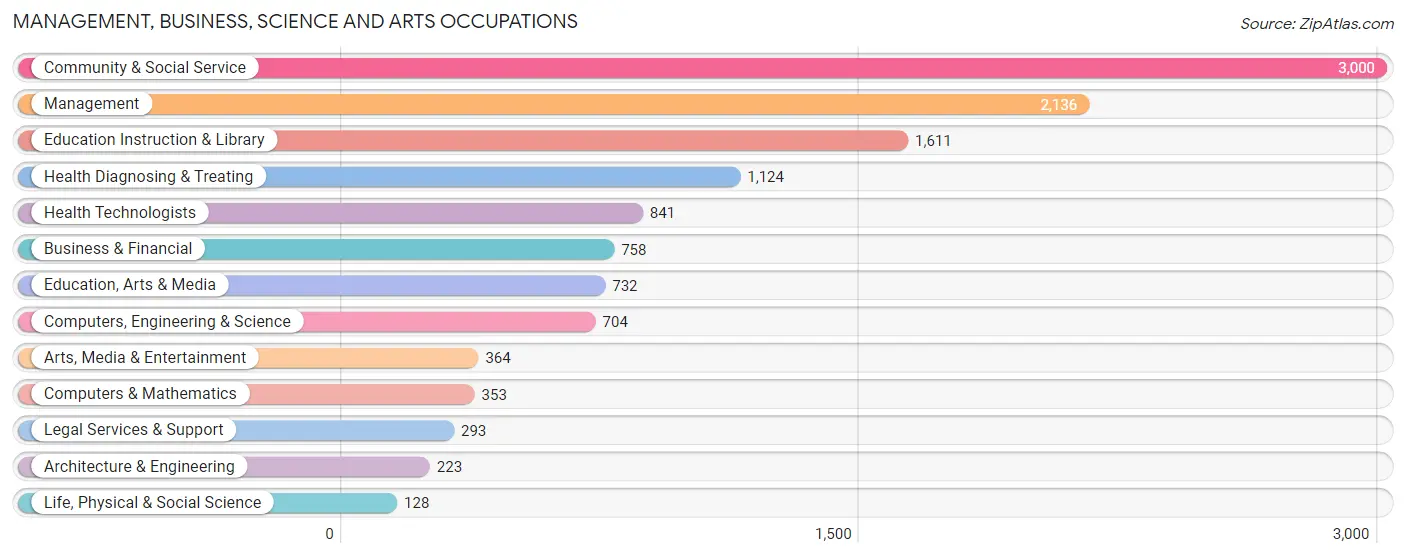
The most common Management, Business, Science and Arts occupations in Bennington County are Community & Social Service (3,000 | 17.0%), Management (2,136 | 12.1%), Education Instruction & Library (1,611 | 9.1%), Health Diagnosing & Treating (1,124 | 6.4%), and Health Technologists (841 | 4.8%).
Management, Business, Science and Arts Occupations by Sex
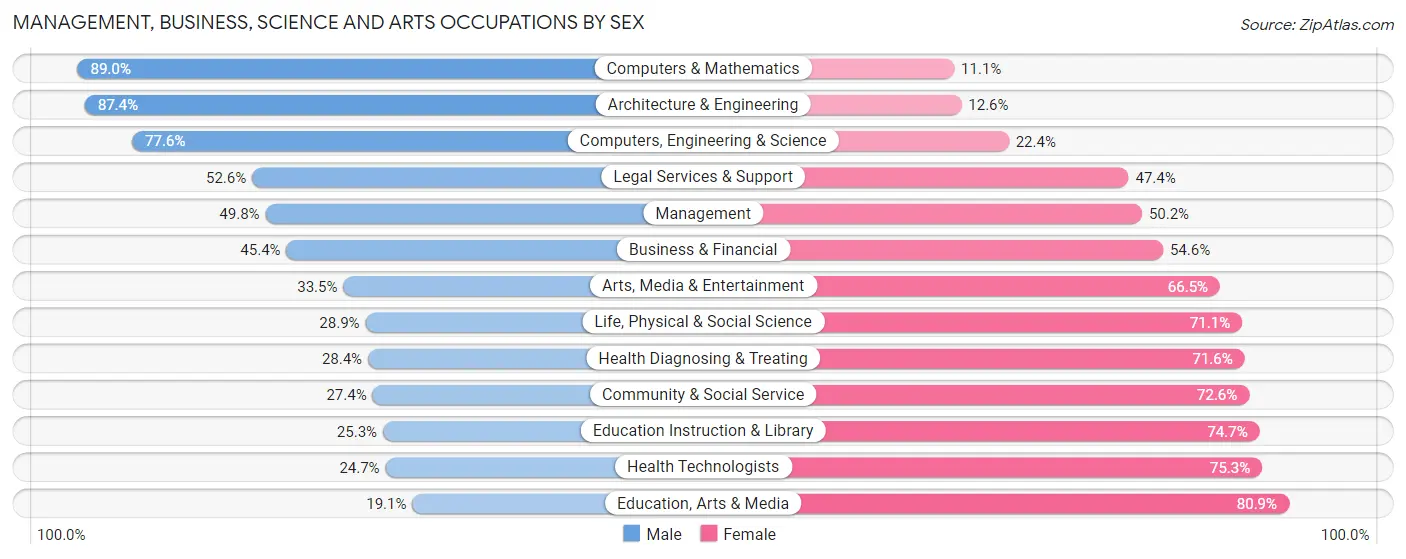
Within the Management, Business, Science and Arts occupations in Bennington County, the most male-oriented occupations are Computers & Mathematics (88.9%), Architecture & Engineering (87.4%), and Computers, Engineering & Science (77.6%), while the most female-oriented occupations are Education, Arts & Media (80.9%), Health Technologists (75.3%), and Education Instruction & Library (74.7%).
| Occupation | Male | Female |
| Management | 1,063 (49.8%) | 1,073 (50.2%) |
| Business & Financial | 344 (45.4%) | 414 (54.6%) |
| Computers, Engineering & Science | 546 (77.6%) | 158 (22.4%) |
| Computers & Mathematics | 314 (88.9%) | 39 (11.1%) |
| Architecture & Engineering | 195 (87.4%) | 28 (12.6%) |
| Life, Physical & Social Science | 37 (28.9%) | 91 (71.1%) |
| Community & Social Service | 823 (27.4%) | 2,177 (72.6%) |
| Education, Arts & Media | 140 (19.1%) | 592 (80.9%) |
| Legal Services & Support | 154 (52.6%) | 139 (47.4%) |
| Education Instruction & Library | 407 (25.3%) | 1,204 (74.7%) |
| Arts, Media & Entertainment | 122 (33.5%) | 242 (66.5%) |
| Health Diagnosing & Treating | 319 (28.4%) | 805 (71.6%) |
| Health Technologists | 208 (24.7%) | 633 (75.3%) |
| Total (Category) | 3,095 (40.1%) | 4,627 (59.9%) |
| Total (Overall) | 8,529 (48.3%) | 9,144 (51.7%) |
Services Occupations
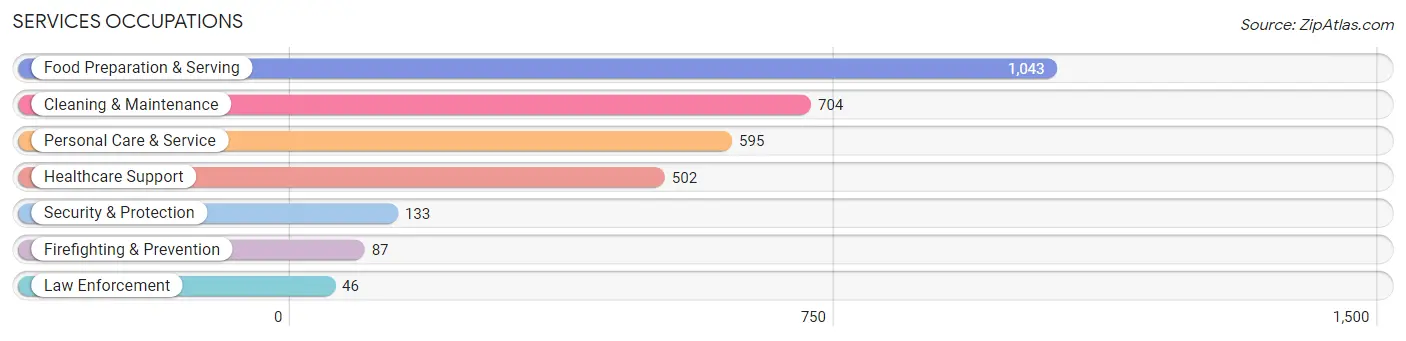
The most common Services occupations in Bennington County are Food Preparation & Serving (1,043 | 5.9%), Cleaning & Maintenance (704 | 4.0%), Personal Care & Service (595 | 3.4%), Healthcare Support (502 | 2.8%), and Security & Protection (133 | 0.7%).
Services Occupations by Sex
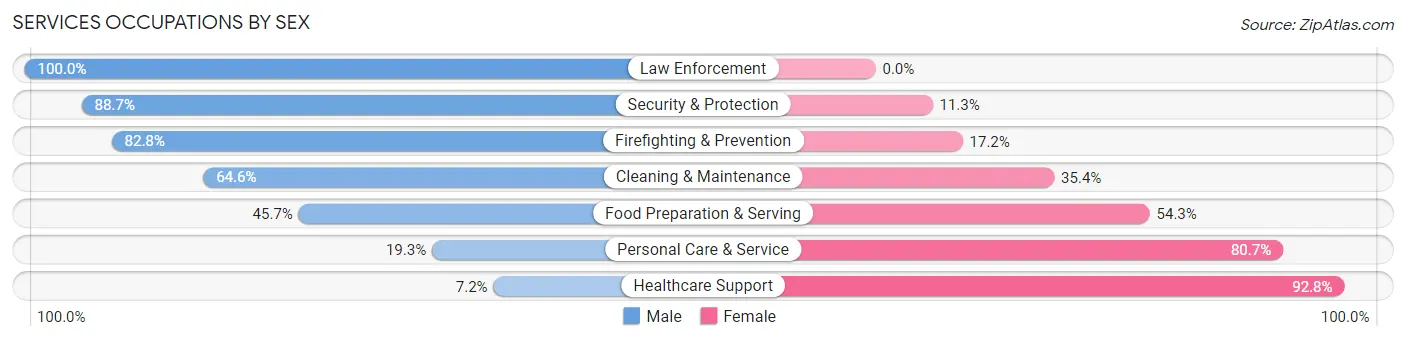
Within the Services occupations in Bennington County, the most male-oriented occupations are Law Enforcement (100.0%), Security & Protection (88.7%), and Firefighting & Prevention (82.8%), while the most female-oriented occupations are Healthcare Support (92.8%), Personal Care & Service (80.7%), and Food Preparation & Serving (54.3%).
| Occupation | Male | Female |
| Healthcare Support | 36 (7.2%) | 466 (92.8%) |
| Security & Protection | 118 (88.7%) | 15 (11.3%) |
| Firefighting & Prevention | 72 (82.8%) | 15 (17.2%) |
| Law Enforcement | 46 (100.0%) | 0 (0.0%) |
| Food Preparation & Serving | 477 (45.7%) | 566 (54.3%) |
| Cleaning & Maintenance | 455 (64.6%) | 249 (35.4%) |
| Personal Care & Service | 115 (19.3%) | 480 (80.7%) |
| Total (Category) | 1,201 (40.3%) | 1,776 (59.7%) |
| Total (Overall) | 8,529 (48.3%) | 9,144 (51.7%) |
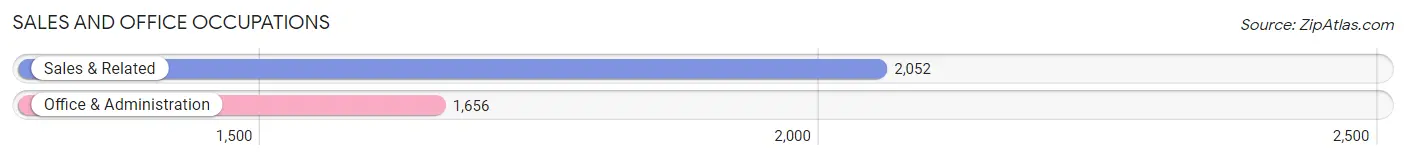
Sales and Office Occupations
The most common Sales and Office occupations in Bennington County are Sales & Related (2,052 | 11.6%), and Office & Administration (1,656 | 9.4%).
Sales and Office Occupations by Sex
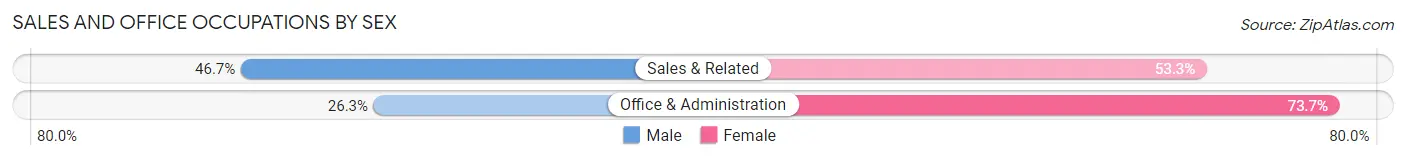
| Occupation | Male | Female |
| Sales & Related | 958 (46.7%) | 1,094 (53.3%) |
| Office & Administration | 435 (26.3%) | 1,221 (73.7%) |
| Total (Category) | 1,393 (37.6%) | 2,315 (62.4%) |
| Total (Overall) | 8,529 (48.3%) | 9,144 (51.7%) |
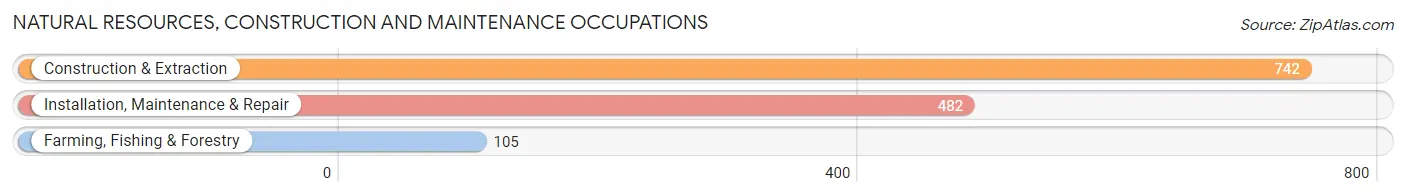
Natural Resources, Construction and Maintenance Occupations
The most common Natural Resources, Construction and Maintenance occupations in Bennington County are Construction & Extraction (742 | 4.2%), Installation, Maintenance & Repair (482 | 2.7%), and Farming, Fishing & Forestry (105 | 0.6%).
Natural Resources, Construction and Maintenance Occupations by Sex
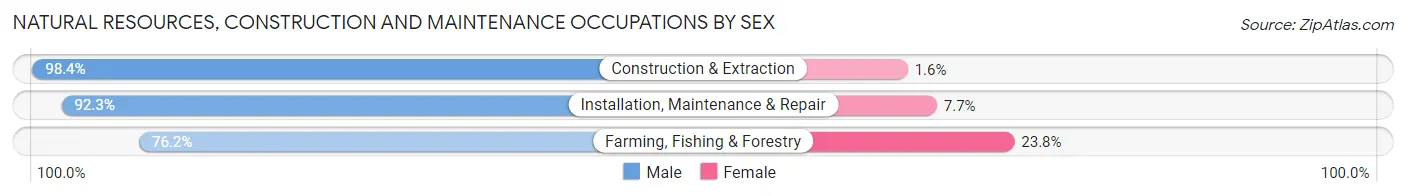
| Occupation | Male | Female |
| Farming, Fishing & Forestry | 80 (76.2%) | 25 (23.8%) |
| Construction & Extraction | 730 (98.4%) | 12 (1.6%) |
| Installation, Maintenance & Repair | 445 (92.3%) | 37 (7.7%) |
| Total (Category) | 1,255 (94.4%) | 74 (5.6%) |
| Total (Overall) | 8,529 (48.3%) | 9,144 (51.7%) |
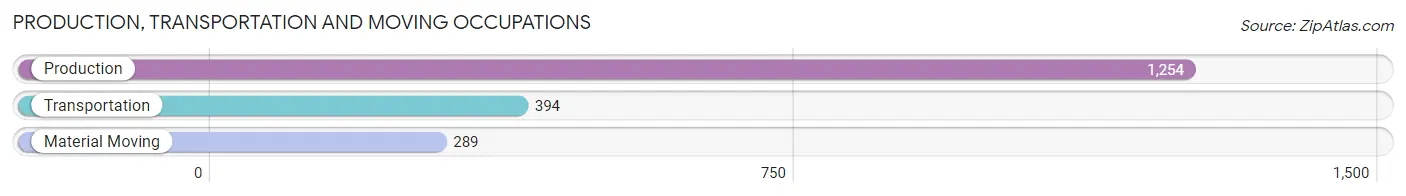
Production, Transportation and Moving Occupations
The most common Production, Transportation and Moving occupations in Bennington County are Production (1,254 | 7.1%), Transportation (394 | 2.2%), and Material Moving (289 | 1.6%).
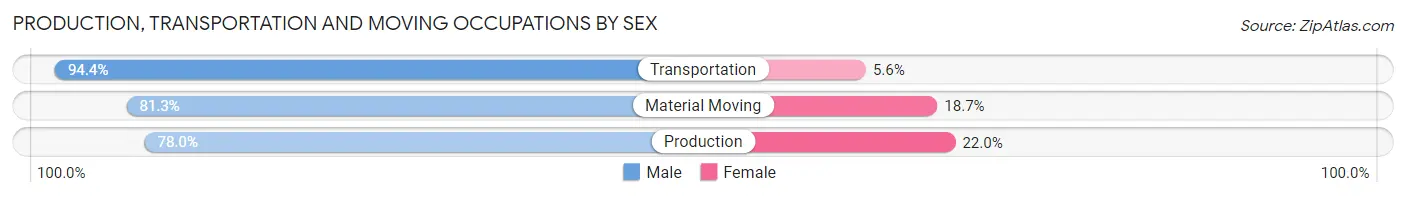
Production, Transportation and Moving Occupations by Sex
| Occupation | Male | Female |
| Production | 978 (78.0%) | 276 (22.0%) |
| Transportation | 372 (94.4%) | 22 (5.6%) |
| Material Moving | 235 (81.3%) | 54 (18.7%) |
| Total (Category) | 1,585 (81.8%) | 352 (18.2%) |
| Total (Overall) | 8,529 (48.3%) | 9,144 (51.7%) |
Employment Industries by Sex in Bennington County
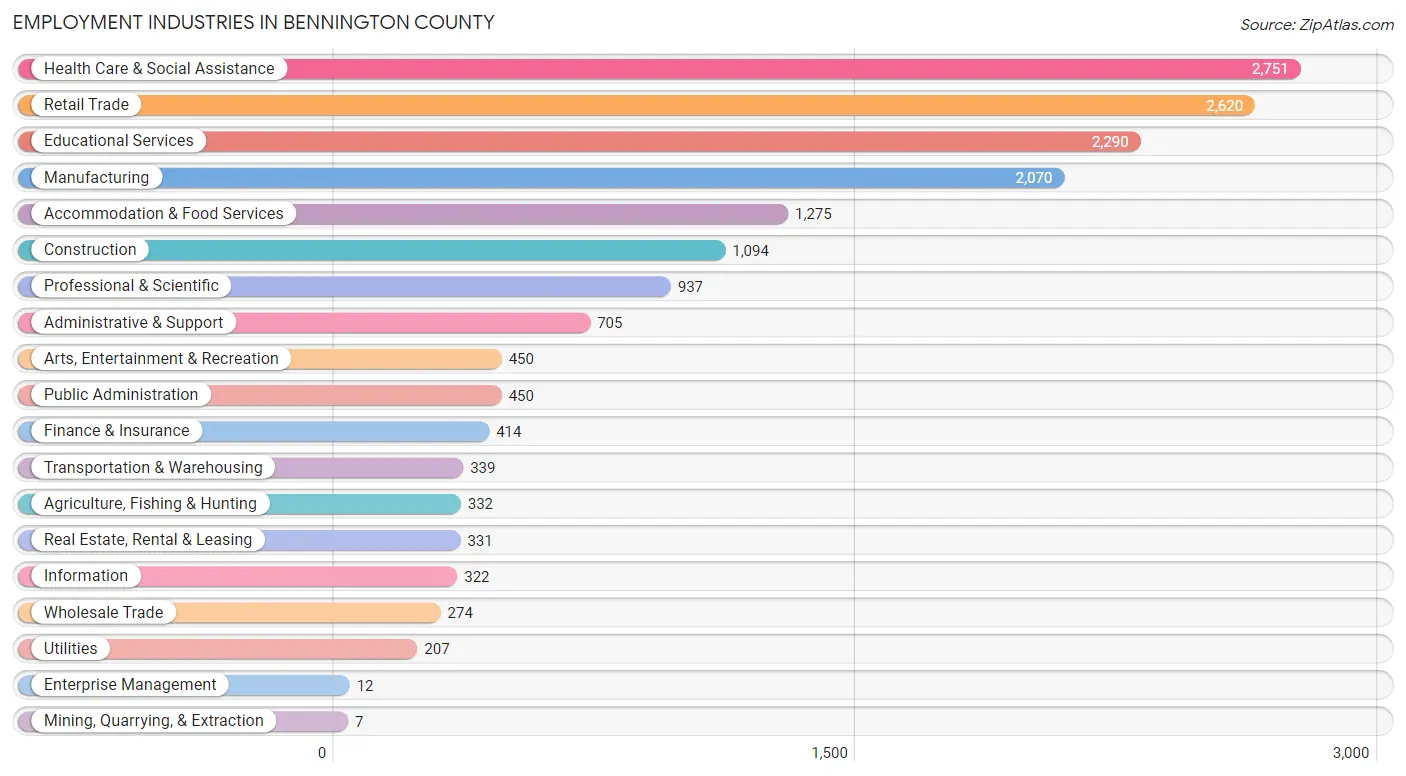
Employment Industries in Bennington County
The major employment industries in Bennington County include Health Care & Social Assistance (2,751 | 15.6%), Retail Trade (2,620 | 14.8%), Educational Services (2,290 | 13.0%), Manufacturing (2,070 | 11.7%), and Accommodation & Food Services (1,275 | 7.2%).
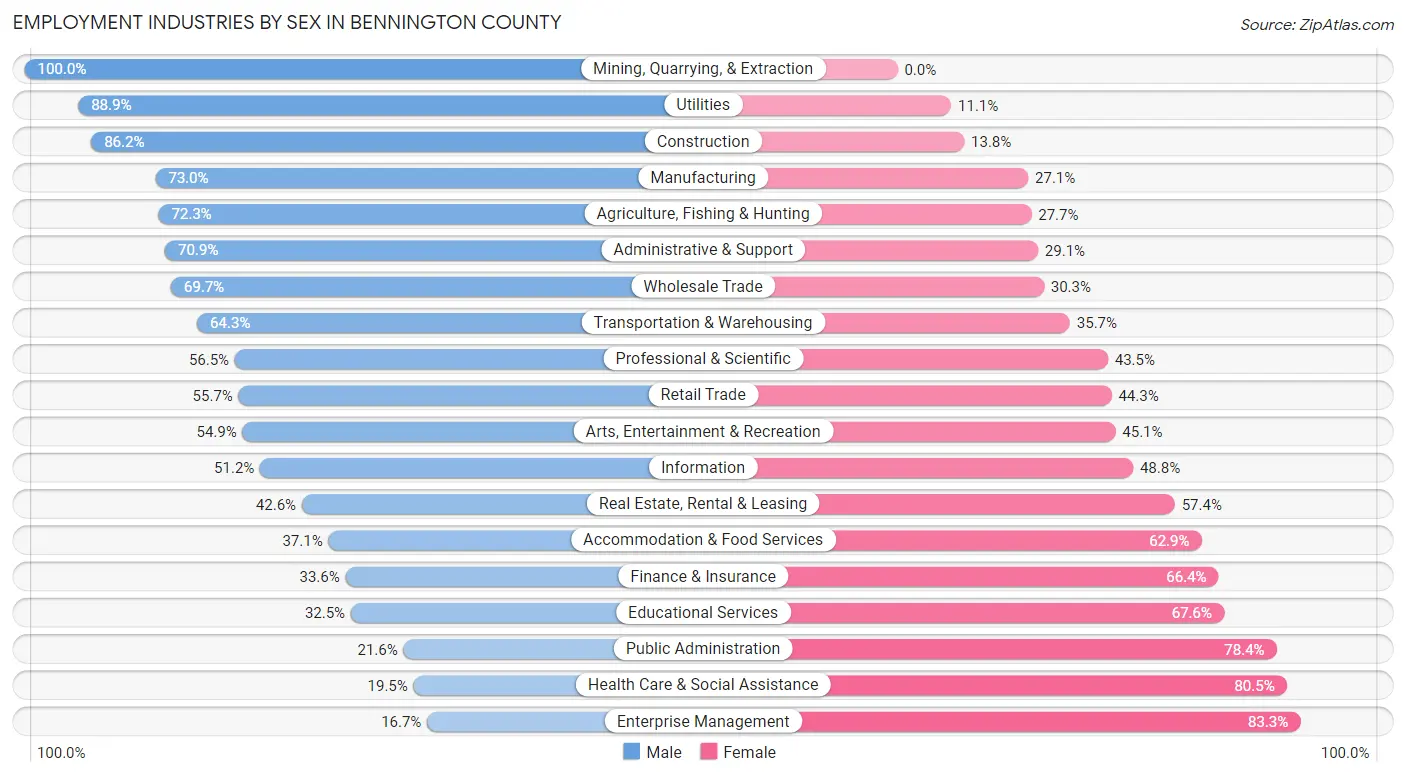
Employment Industries by Sex in Bennington County
The Bennington County industries that see more men than women are Mining, Quarrying, & Extraction (100.0%), Utilities (88.9%), and Construction (86.2%), whereas the industries that tend to have a higher number of women are Enterprise Management (83.3%), Health Care & Social Assistance (80.5%), and Public Administration (78.4%).
| Industry | Male | Female |
| Agriculture, Fishing & Hunting | 240 (72.3%) | 92 (27.7%) |
| Mining, Quarrying, & Extraction | 7 (100.0%) | 0 (0.0%) |
| Construction | 943 (86.2%) | 151 (13.8%) |
| Manufacturing | 1,510 (73.0%) | 560 (27.1%) |
| Wholesale Trade | 191 (69.7%) | 83 (30.3%) |
| Retail Trade | 1,459 (55.7%) | 1,161 (44.3%) |
| Transportation & Warehousing | 218 (64.3%) | 121 (35.7%) |
| Utilities | 184 (88.9%) | 23 (11.1%) |
| Information | 165 (51.2%) | 157 (48.8%) |
| Finance & Insurance | 139 (33.6%) | 275 (66.4%) |
| Real Estate, Rental & Leasing | 141 (42.6%) | 190 (57.4%) |
| Professional & Scientific | 529 (56.5%) | 408 (43.5%) |
| Enterprise Management | 2 (16.7%) | 10 (83.3%) |
| Administrative & Support | 500 (70.9%) | 205 (29.1%) |
| Educational Services | 743 (32.5%) | 1,547 (67.5%) |
| Health Care & Social Assistance | 536 (19.5%) | 2,215 (80.5%) |
| Arts, Entertainment & Recreation | 247 (54.9%) | 203 (45.1%) |
| Accommodation & Food Services | 473 (37.1%) | 802 (62.9%) |
| Public Administration | 97 (21.6%) | 353 (78.4%) |
| Total | 8,529 (48.3%) | 9,144 (51.7%) |
Education in Bennington County
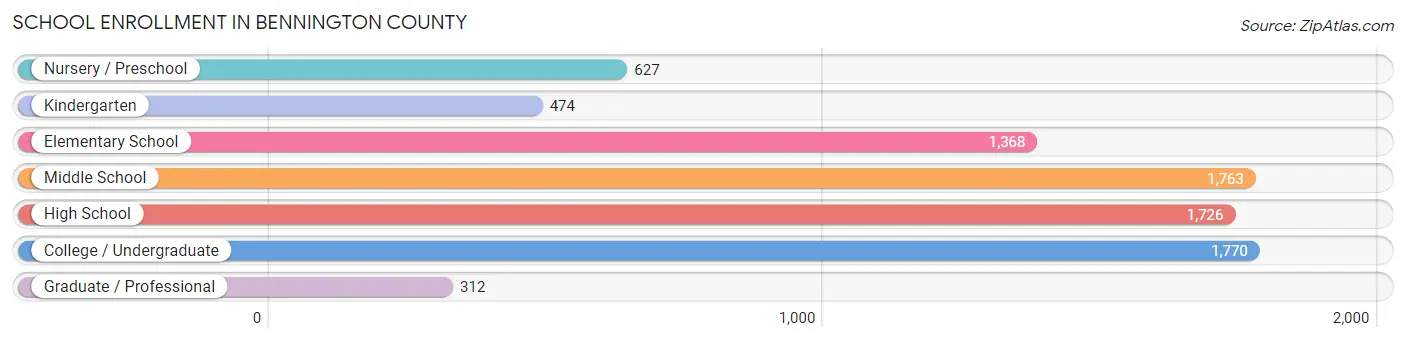
School Enrollment in Bennington County
The most common levels of schooling among the 8,040 students in Bennington County are college / undergraduate (1,770 | 22.0%), middle school (1,763 | 21.9%), and high school (1,726 | 21.5%).
| School Level | # Students | % Students |
| Nursery / Preschool | 627 | 7.8% |
| Kindergarten | 474 | 5.9% |
| Elementary School | 1,368 | 17.0% |
| Middle School | 1,763 | 21.9% |
| High School | 1,726 | 21.5% |
| College / Undergraduate | 1,770 | 22.0% |
| Graduate / Professional | 312 | 3.9% |
| Total | 8,040 | 100.0% |
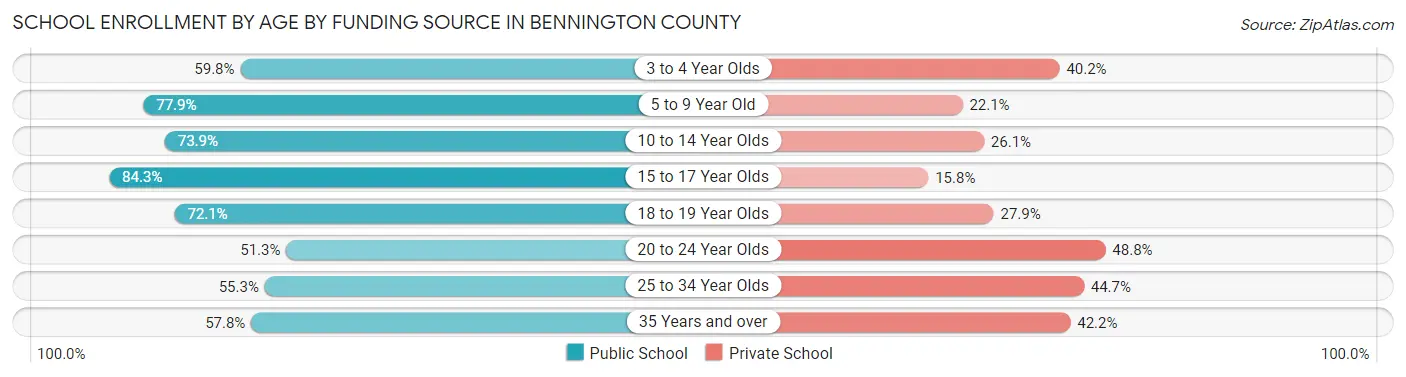
School Enrollment by Age by Funding Source in Bennington County
Out of a total of 8,040 students who are enrolled in schools in Bennington County, 2,332 (29.0%) attend a private institution, while the remaining 5,708 (71.0%) are enrolled in public schools. The age group of 20 to 24 year olds has the highest likelihood of being enrolled in private schools, with 487 (48.7% in the age bracket) enrolled. Conversely, the age group of 15 to 17 year olds has the lowest likelihood of being enrolled in a private school, with 1,000 (84.3% in the age bracket) attending a public institution.
| Age Bracket | Public School | Private School |
| 3 to 4 Year Olds | 323 (59.8%) | 217 (40.2%) |
| 5 to 9 Year Old | 1,384 (77.9%) | 393 (22.1%) |
| 10 to 14 Year Olds | 1,516 (73.9%) | 536 (26.1%) |
| 15 to 17 Year Olds | 1,000 (84.3%) | 187 (15.8%) |
| 18 to 19 Year Olds | 599 (72.1%) | 232 (27.9%) |
| 20 to 24 Year Olds | 512 (51.2%) | 487 (48.7%) |
| 25 to 34 Year Olds | 131 (55.3%) | 106 (44.7%) |
| 35 Years and over | 241 (57.8%) | 176 (42.2%) |
| Total | 5,708 (71.0%) | 2,332 (29.0%) |
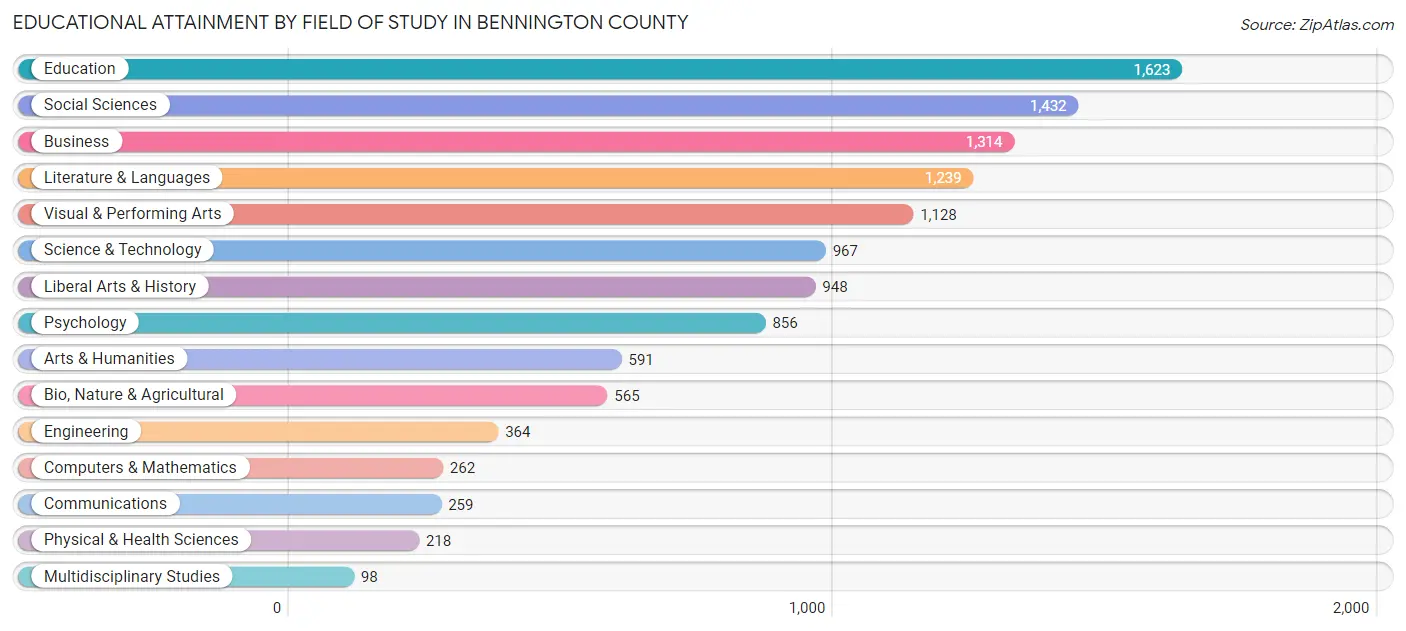
Educational Attainment by Field of Study in Bennington County
Education (1,623 | 13.7%), social sciences (1,432 | 12.1%), business (1,314 | 11.1%), literature & languages (1,239 | 10.4%), and visual & performing arts (1,128 | 9.5%) are the most common fields of study among 11,864 individuals in Bennington County who have obtained a bachelor's degree or higher.
| Field of Study | # Graduates | % Graduates |
| Computers & Mathematics | 262 | 2.2% |
| Bio, Nature & Agricultural | 565 | 4.8% |
| Physical & Health Sciences | 218 | 1.8% |
| Psychology | 856 | 7.2% |
| Social Sciences | 1,432 | 12.1% |
| Engineering | 364 | 3.1% |
| Multidisciplinary Studies | 98 | 0.8% |
| Science & Technology | 967 | 8.2% |
| Business | 1,314 | 11.1% |
| Education | 1,623 | 13.7% |
| Literature & Languages | 1,239 | 10.4% |
| Liberal Arts & History | 948 | 8.0% |
| Visual & Performing Arts | 1,128 | 9.5% |
| Communications | 259 | 2.2% |
| Arts & Humanities | 591 | 5.0% |
| Total | 11,864 | 100.0% |
Transportation & Commute in Bennington County
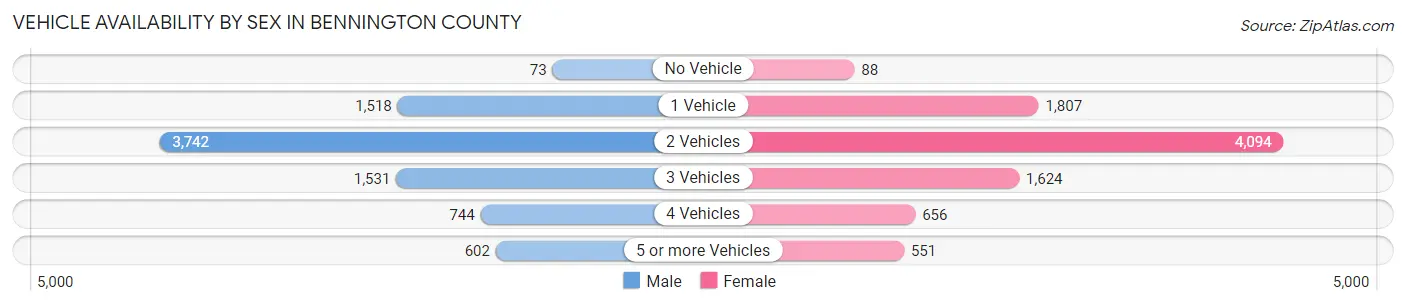
Vehicle Availability by Sex in Bennington County
The most prevalent vehicle ownership categories in Bennington County are males with 2 vehicles (3,742, accounting for 45.6%) and females with 2 vehicles (4,094, making up 42.4%).
| Vehicles Available | Male | Female |
| No Vehicle | 73 (0.9%) | 88 (1.0%) |
| 1 Vehicle | 1,518 (18.5%) | 1,807 (20.5%) |
| 2 Vehicles | 3,742 (45.6%) | 4,094 (46.4%) |
| 3 Vehicles | 1,531 (18.6%) | 1,624 (18.4%) |
| 4 Vehicles | 744 (9.1%) | 656 (7.4%) |
| 5 or more Vehicles | 602 (7.3%) | 551 (6.2%) |
| Total | 8,210 (100.0%) | 8,820 (100.0%) |
Commute Time in Bennington County
The most frequently occuring commute durations in Bennington County are 5 to 9 minutes (3,254 commuters, 21.8%), 15 to 19 minutes (2,606 commuters, 17.4%), and 10 to 14 minutes (2,462 commuters, 16.5%).
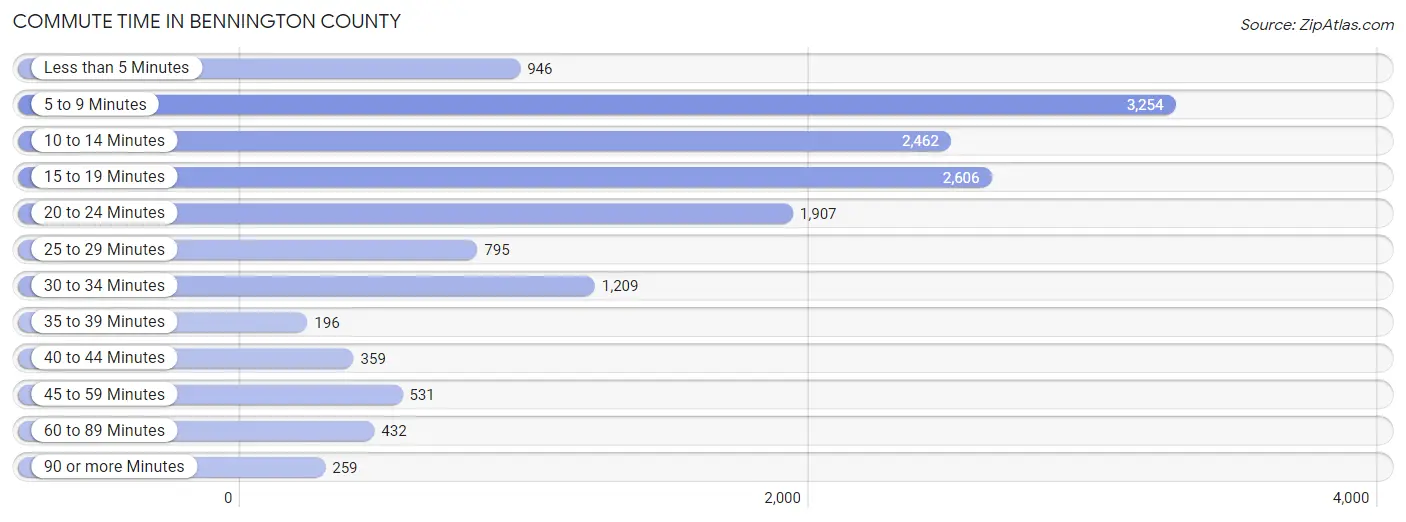
| Commute Time | # Commuters | % Commuters |
| Less than 5 Minutes | 946 | 6.3% |
| 5 to 9 Minutes | 3,254 | 21.8% |
| 10 to 14 Minutes | 2,462 | 16.5% |
| 15 to 19 Minutes | 2,606 | 17.4% |
| 20 to 24 Minutes | 1,907 | 12.8% |
| 25 to 29 Minutes | 795 | 5.3% |
| 30 to 34 Minutes | 1,209 | 8.1% |
| 35 to 39 Minutes | 196 | 1.3% |
| 40 to 44 Minutes | 359 | 2.4% |
| 45 to 59 Minutes | 531 | 3.5% |
| 60 to 89 Minutes | 432 | 2.9% |
| 90 or more Minutes | 259 | 1.7% |
Commute Time by Sex in Bennington County
The most common commute times in Bennington County are 5 to 9 minutes (1,395 commuters, 19.0%) for males and 5 to 9 minutes (1,859 commuters, 24.4%) for females.
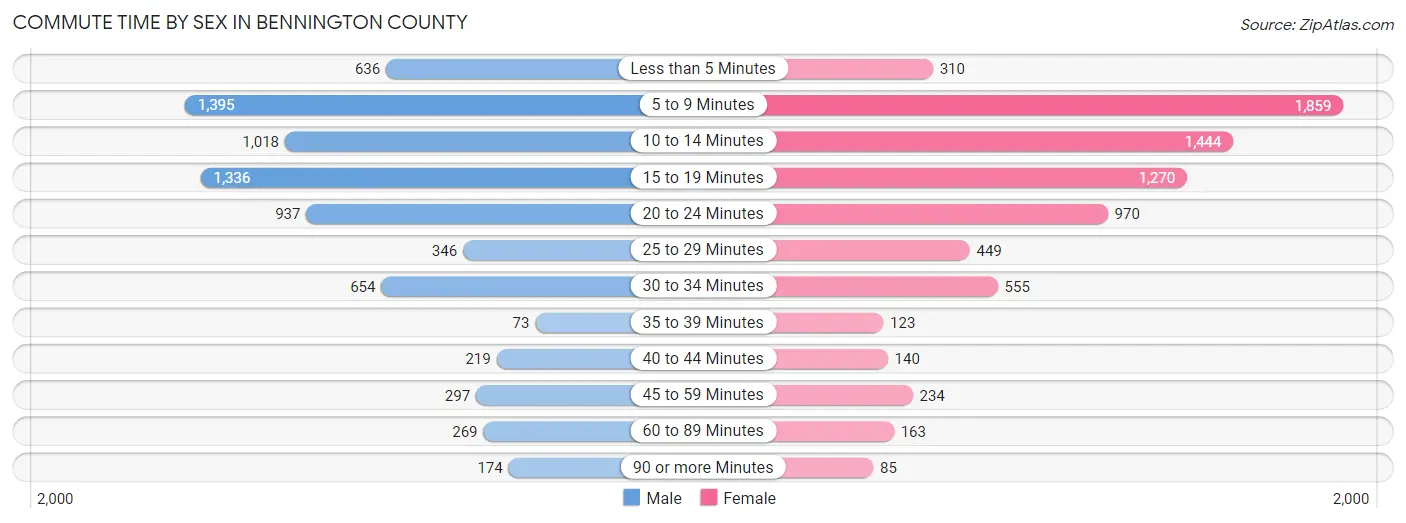
| Commute Time | Male | Female |
| Less than 5 Minutes | 636 (8.6%) | 310 (4.1%) |
| 5 to 9 Minutes | 1,395 (19.0%) | 1,859 (24.4%) |
| 10 to 14 Minutes | 1,018 (13.8%) | 1,444 (19.0%) |
| 15 to 19 Minutes | 1,336 (18.2%) | 1,270 (16.7%) |
| 20 to 24 Minutes | 937 (12.7%) | 970 (12.8%) |
| 25 to 29 Minutes | 346 (4.7%) | 449 (5.9%) |
| 30 to 34 Minutes | 654 (8.9%) | 555 (7.3%) |
| 35 to 39 Minutes | 73 (1.0%) | 123 (1.6%) |
| 40 to 44 Minutes | 219 (3.0%) | 140 (1.8%) |
| 45 to 59 Minutes | 297 (4.0%) | 234 (3.1%) |
| 60 to 89 Minutes | 269 (3.7%) | 163 (2.1%) |
| 90 or more Minutes | 174 (2.4%) | 85 (1.1%) |
Time of Departure to Work by Sex in Bennington County
The most frequent times of departure to work in Bennington County are 7:30 AM to 7:59 AM (1,036, 14.1%) for males and 7:30 AM to 7:59 AM (1,522, 20.0%) for females.
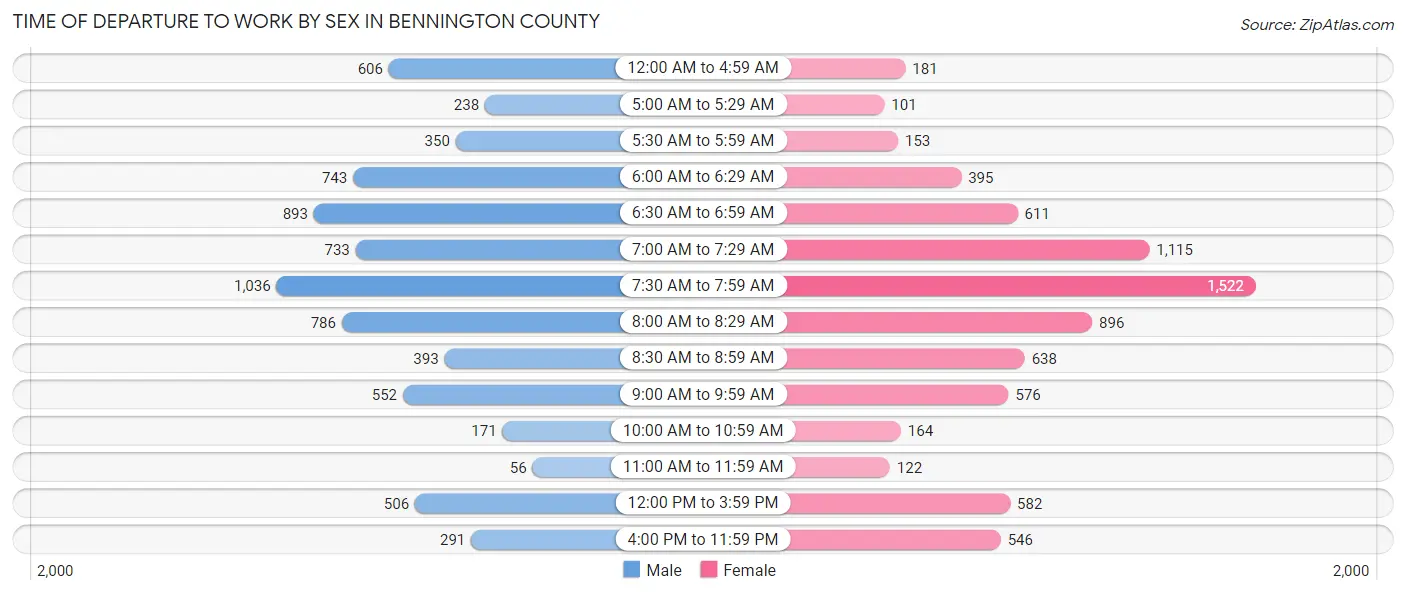
| Time of Departure | Male | Female |
| 12:00 AM to 4:59 AM | 606 (8.2%) | 181 (2.4%) |
| 5:00 AM to 5:29 AM | 238 (3.2%) | 101 (1.3%) |
| 5:30 AM to 5:59 AM | 350 (4.8%) | 153 (2.0%) |
| 6:00 AM to 6:29 AM | 743 (10.1%) | 395 (5.2%) |
| 6:30 AM to 6:59 AM | 893 (12.1%) | 611 (8.0%) |
| 7:00 AM to 7:29 AM | 733 (10.0%) | 1,115 (14.7%) |
| 7:30 AM to 7:59 AM | 1,036 (14.1%) | 1,522 (20.0%) |
| 8:00 AM to 8:29 AM | 786 (10.7%) | 896 (11.8%) |
| 8:30 AM to 8:59 AM | 393 (5.3%) | 638 (8.4%) |
| 9:00 AM to 9:59 AM | 552 (7.5%) | 576 (7.6%) |
| 10:00 AM to 10:59 AM | 171 (2.3%) | 164 (2.2%) |
| 11:00 AM to 11:59 AM | 56 (0.8%) | 122 (1.6%) |
| 12:00 PM to 3:59 PM | 506 (6.9%) | 582 (7.7%) |
| 4:00 PM to 11:59 PM | 291 (4.0%) | 546 (7.2%) |
| Total | 7,354 (100.0%) | 7,602 (100.0%) |
Housing Occupancy in Bennington County
Occupancy by Ownership in Bennington County
Of the total 14,566 dwellings in Bennington County, owner-occupied units account for 10,823 (74.3%), while renter-occupied units make up 3,743 (25.7%).
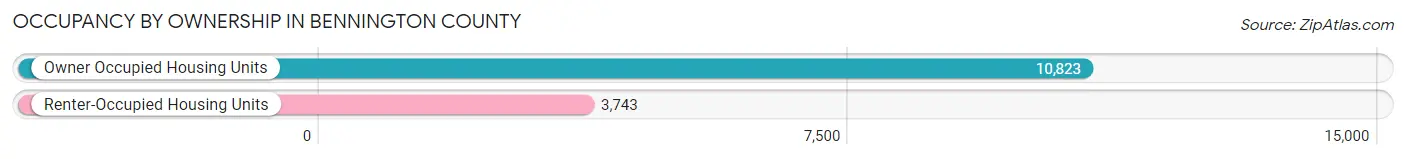
| Occupancy | # Housing Units | % Housing Units |
| Owner Occupied Housing Units | 10,823 | 74.3% |
| Renter-Occupied Housing Units | 3,743 | 25.7% |
| Total Occupied Housing Units | 14,566 | 100.0% |
Occupancy by Household Size in Bennington County
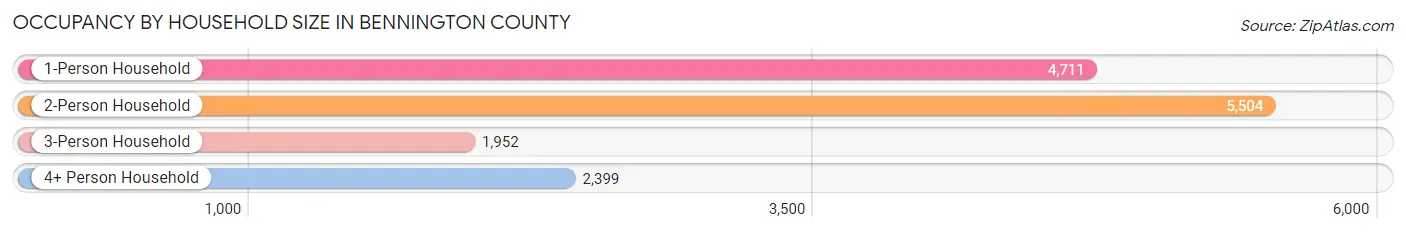
| Household Size | # Housing Units | % Housing Units |
| 1-Person Household | 4,711 | 32.3% |
| 2-Person Household | 5,504 | 37.8% |
| 3-Person Household | 1,952 | 13.4% |
| 4+ Person Household | 2,399 | 16.5% |
| Total Housing Units | 14,566 | 100.0% |
Occupancy by Ownership by Household Size in Bennington County
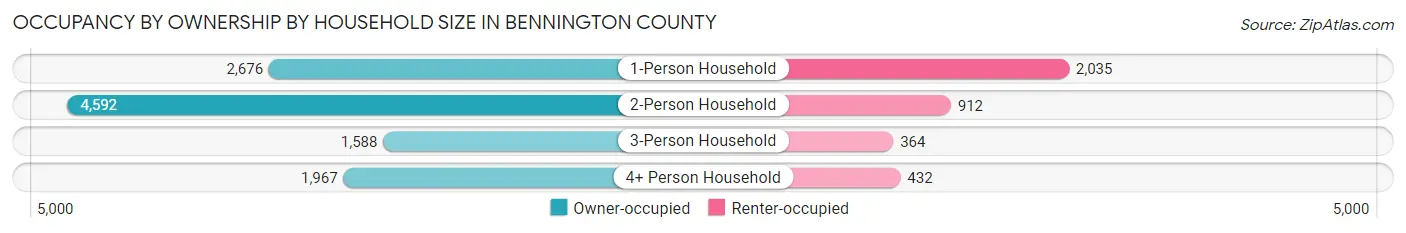
| Household Size | Owner-occupied | Renter-occupied |
| 1-Person Household | 2,676 (56.8%) | 2,035 (43.2%) |
| 2-Person Household | 4,592 (83.4%) | 912 (16.6%) |
| 3-Person Household | 1,588 (81.4%) | 364 (18.6%) |
| 4+ Person Household | 1,967 (82.0%) | 432 (18.0%) |
| Total Housing Units | 10,823 (74.3%) | 3,743 (25.7%) |
Occupancy by Educational Attainment in Bennington County
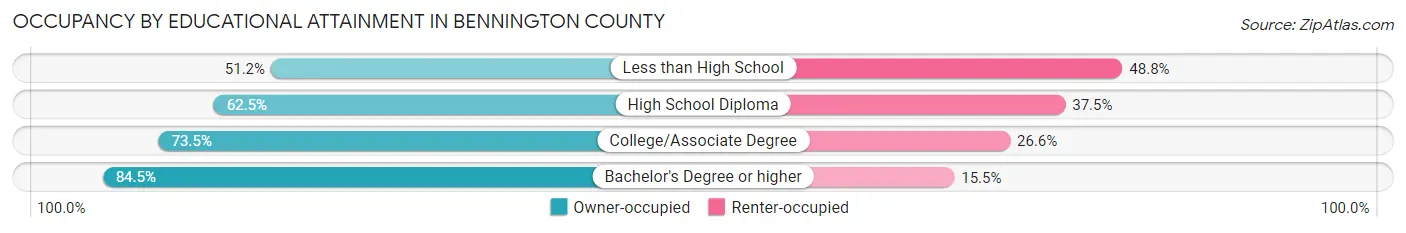
| Household Size | Owner-occupied | Renter-occupied |
| Less than High School | 346 (51.2%) | 330 (48.8%) |
| High School Diploma | 2,268 (62.5%) | 1,361 (37.5%) |
| College/Associate Degree | 3,071 (73.5%) | 1,110 (26.6%) |
| Bachelor's Degree or higher | 5,138 (84.5%) | 942 (15.5%) |
Occupancy by Age of Householder in Bennington County
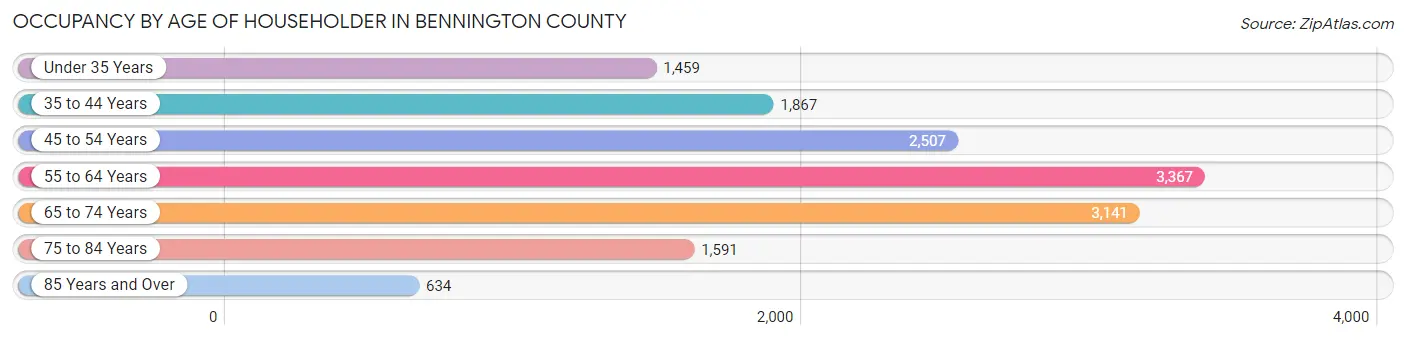
| Age Bracket | # Households | % Households |
| Under 35 Years | 1,459 | 10.0% |
| 35 to 44 Years | 1,867 | 12.8% |
| 45 to 54 Years | 2,507 | 17.2% |
| 55 to 64 Years | 3,367 | 23.1% |
| 65 to 74 Years | 3,141 | 21.6% |
| 75 to 84 Years | 1,591 | 10.9% |
| 85 Years and Over | 634 | 4.3% |
| Total | 14,566 | 100.0% |
Housing Finances in Bennington County
Median Income by Occupancy in Bennington County
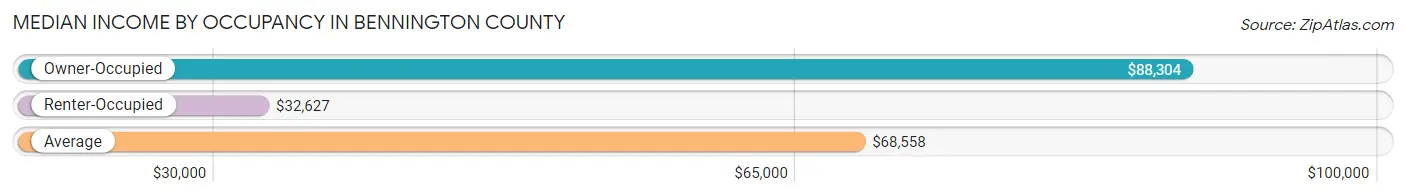
| Occupancy Type | # Households | Median Income |
| Owner-Occupied | 10,823 (74.3%) | $88,304 |
| Renter-Occupied | 3,743 (25.7%) | $32,627 |
| Average | 14,566 (100.0%) | $68,558 |
Occupancy by Householder Income Bracket in Bennington County
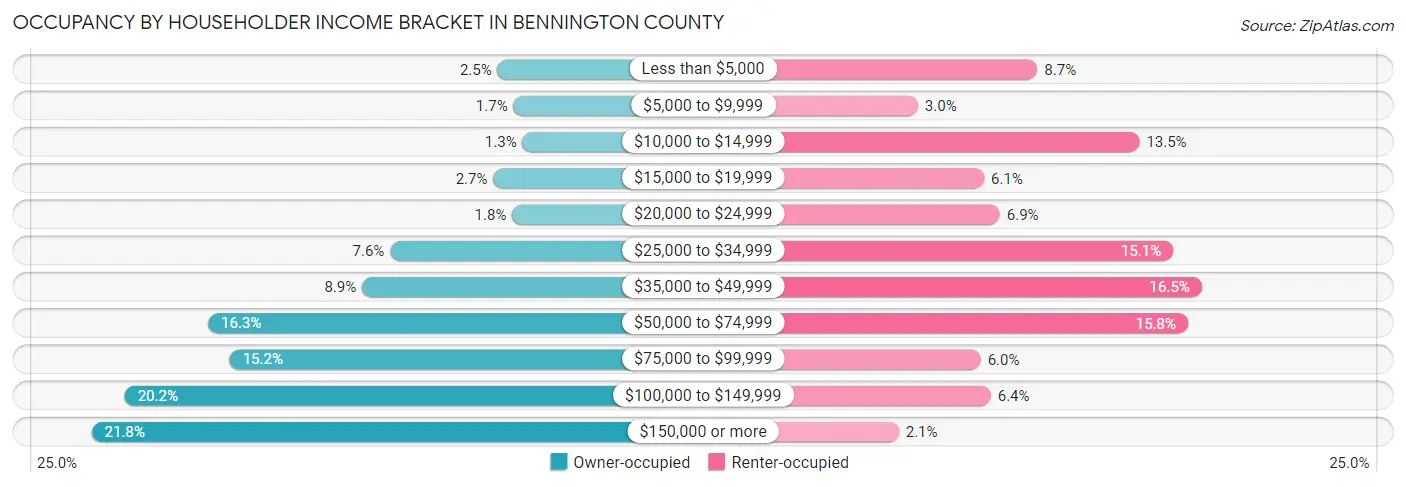
| Income Bracket | Owner-occupied | Renter-occupied |
| Less than $5,000 | 268 (2.5%) | 324 (8.7%) |
| $5,000 to $9,999 | 186 (1.7%) | 111 (3.0%) |
| $10,000 to $14,999 | 140 (1.3%) | 506 (13.5%) |
| $15,000 to $19,999 | 290 (2.7%) | 229 (6.1%) |
| $20,000 to $24,999 | 193 (1.8%) | 257 (6.9%) |
| $25,000 to $34,999 | 822 (7.6%) | 566 (15.1%) |
| $35,000 to $49,999 | 966 (8.9%) | 617 (16.5%) |
| $50,000 to $74,999 | 1,760 (16.3%) | 592 (15.8%) |
| $75,000 to $99,999 | 1,648 (15.2%) | 223 (6.0%) |
| $100,000 to $149,999 | 2,189 (20.2%) | 241 (6.4%) |
| $150,000 or more | 2,361 (21.8%) | 77 (2.1%) |
| Total | 10,823 (100.0%) | 3,743 (100.0%) |
Monthly Housing Cost Tiers in Bennington County
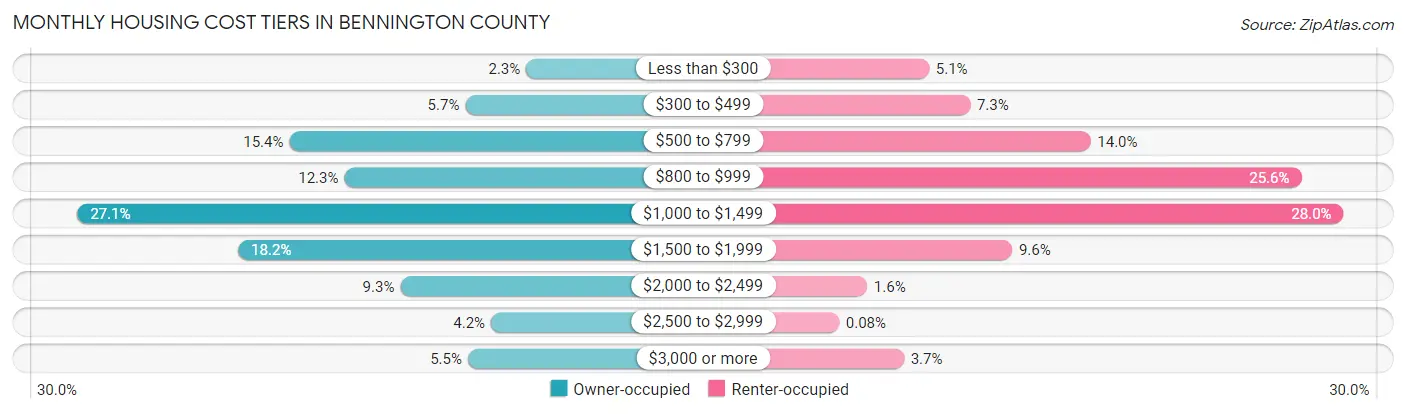
| Monthly Cost | Owner-occupied | Renter-occupied |
| Less than $300 | 249 (2.3%) | 189 (5.1%) |
| $300 to $499 | 613 (5.7%) | 274 (7.3%) |
| $500 to $799 | 1,665 (15.4%) | 523 (14.0%) |
| $800 to $999 | 1,336 (12.3%) | 959 (25.6%) |
| $1,000 to $1,499 | 2,932 (27.1%) | 1,046 (28.0%) |
| $1,500 to $1,999 | 1,971 (18.2%) | 361 (9.6%) |
| $2,000 to $2,499 | 1,001 (9.2%) | 61 (1.6%) |
| $2,500 to $2,999 | 459 (4.2%) | 3 (0.1%) |
| $3,000 or more | 597 (5.5%) | 137 (3.7%) |
| Total | 10,823 (100.0%) | 3,743 (100.0%) |
Physical Housing Characteristics in Bennington County
Housing Structures in Bennington County
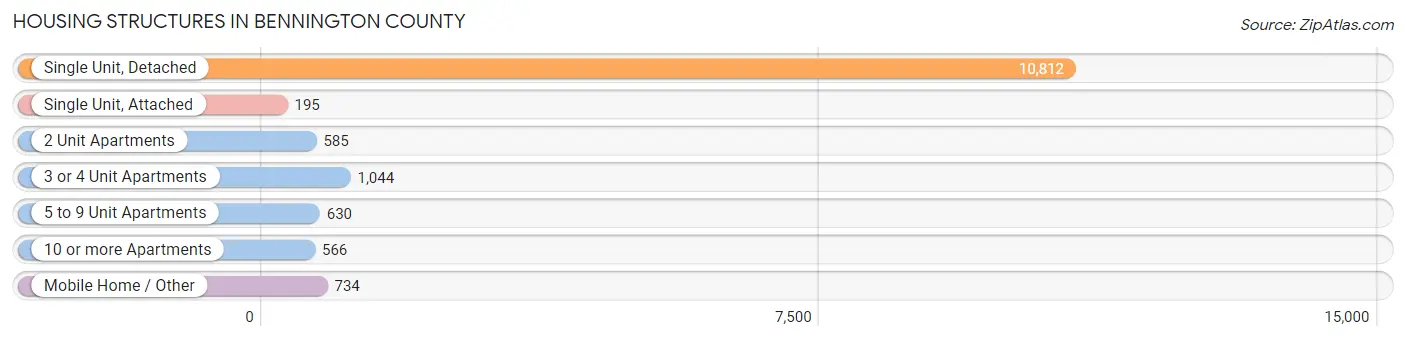
| Structure Type | # Housing Units | % Housing Units |
| Single Unit, Detached | 10,812 | 74.2% |
| Single Unit, Attached | 195 | 1.3% |
| 2 Unit Apartments | 585 | 4.0% |
| 3 or 4 Unit Apartments | 1,044 | 7.2% |
| 5 to 9 Unit Apartments | 630 | 4.3% |
| 10 or more Apartments | 566 | 3.9% |
| Mobile Home / Other | 734 | 5.0% |
| Total | 14,566 | 100.0% |
Housing Structures by Occupancy in Bennington County
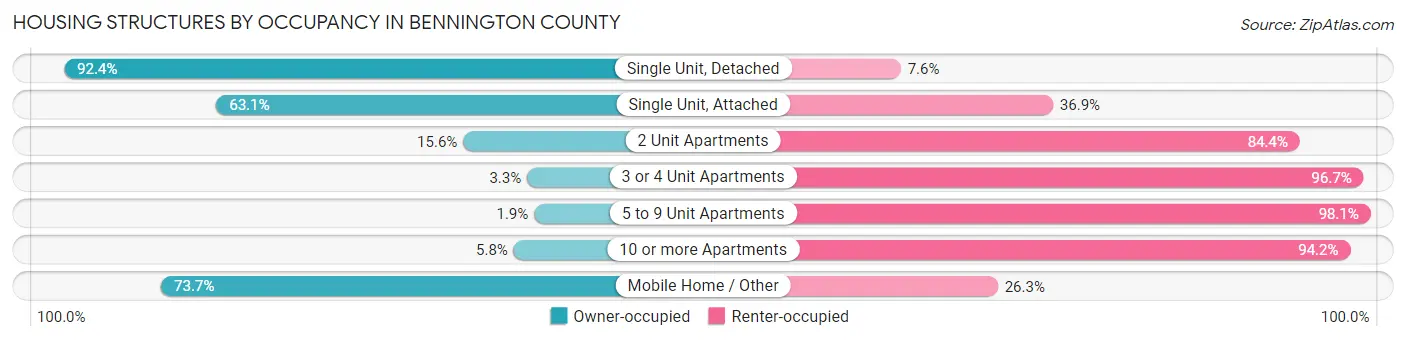
| Structure Type | Owner-occupied | Renter-occupied |
| Single Unit, Detached | 9,989 (92.4%) | 823 (7.6%) |
| Single Unit, Attached | 123 (63.1%) | 72 (36.9%) |
| 2 Unit Apartments | 91 (15.6%) | 494 (84.4%) |
| 3 or 4 Unit Apartments | 34 (3.3%) | 1,010 (96.7%) |
| 5 to 9 Unit Apartments | 12 (1.9%) | 618 (98.1%) |
| 10 or more Apartments | 33 (5.8%) | 533 (94.2%) |
| Mobile Home / Other | 541 (73.7%) | 193 (26.3%) |
| Total | 10,823 (74.3%) | 3,743 (25.7%) |
Housing Structures by Number of Rooms in Bennington County
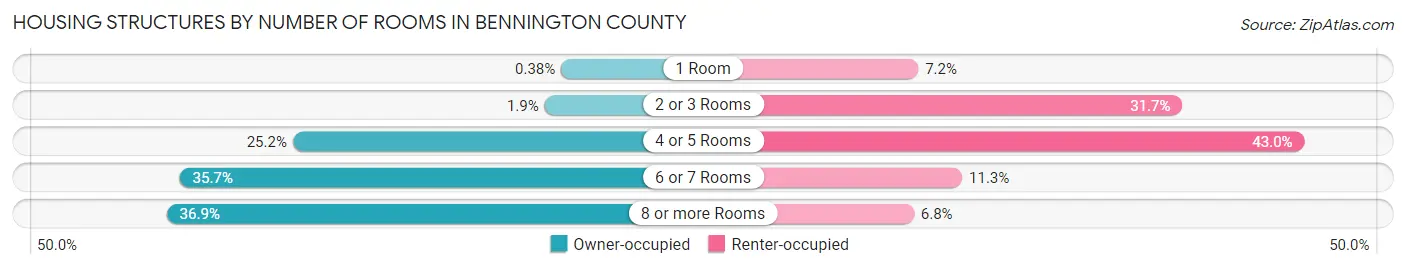
| Number of Rooms | Owner-occupied | Renter-occupied |
| 1 Room | 41 (0.4%) | 271 (7.2%) |
| 2 or 3 Rooms | 207 (1.9%) | 1,185 (31.7%) |
| 4 or 5 Rooms | 2,727 (25.2%) | 1,608 (43.0%) |
| 6 or 7 Rooms | 3,859 (35.7%) | 423 (11.3%) |
| 8 or more Rooms | 3,989 (36.9%) | 256 (6.8%) |
| Total | 10,823 (100.0%) | 3,743 (100.0%) |
Housing Structure by Heating Type in Bennington County
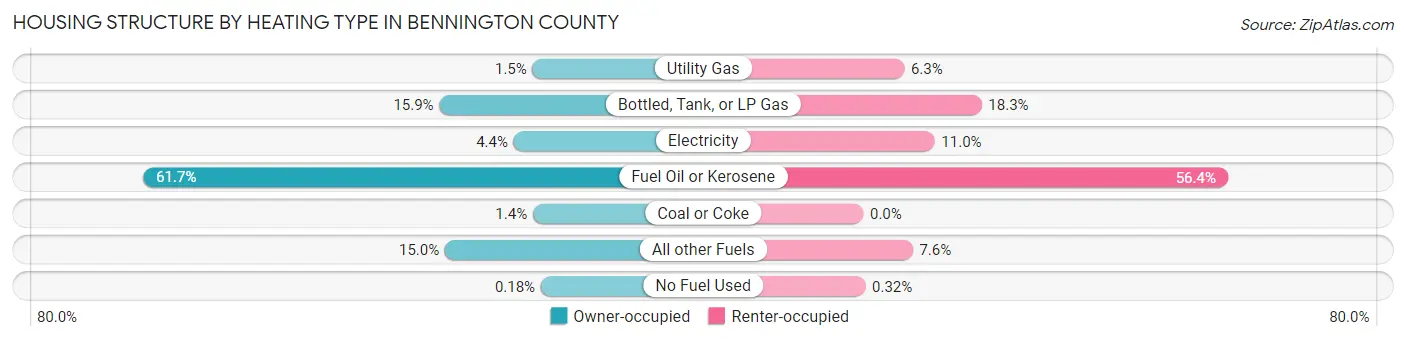
| Heating Type | Owner-occupied | Renter-occupied |
| Utility Gas | 159 (1.5%) | 237 (6.3%) |
| Bottled, Tank, or LP Gas | 1,718 (15.9%) | 685 (18.3%) |
| Electricity | 474 (4.4%) | 413 (11.0%) |
| Fuel Oil or Kerosene | 6,676 (61.7%) | 2,110 (56.4%) |
| Coal or Coke | 153 (1.4%) | 0 (0.0%) |
| All other Fuels | 1,623 (15.0%) | 286 (7.6%) |
| No Fuel Used | 20 (0.2%) | 12 (0.3%) |
| Total | 10,823 (100.0%) | 3,743 (100.0%) |
Household Vehicle Usage in Bennington County
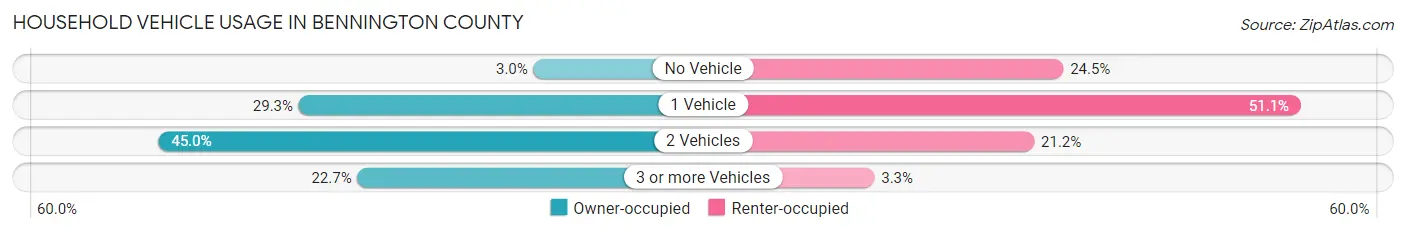
| Vehicles per Household | Owner-occupied | Renter-occupied |
| No Vehicle | 323 (3.0%) | 915 (24.4%) |
| 1 Vehicle | 3,169 (29.3%) | 1,912 (51.1%) |
| 2 Vehicles | 4,873 (45.0%) | 793 (21.2%) |
| 3 or more Vehicles | 2,458 (22.7%) | 123 (3.3%) |
| Total | 10,823 (100.0%) | 3,743 (100.0%) |
Real Estate & Mortgages in Bennington County
Real Estate and Mortgage Overview in Bennington County
| Characteristic | Without Mortgage | With Mortgage |
| Housing Units | 4,368 | 6,455 |
| Median Property Value | $245,600 | $241,700 |
| Median Household Income | $72,909 | $1,689 |
| Monthly Housing Costs | $786 | $583 |
| Real Estate Taxes | $4,220 | $99 |
Property Value by Mortgage Status in Bennington County
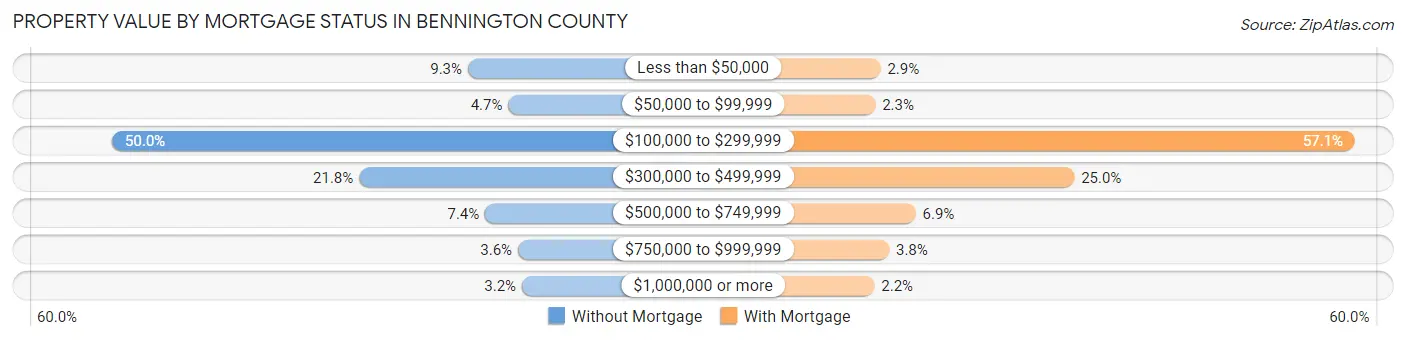
| Property Value | Without Mortgage | With Mortgage |
| Less than $50,000 | 408 (9.3%) | 184 (2.9%) |
| $50,000 to $99,999 | 206 (4.7%) | 145 (2.2%) |
| $100,000 to $299,999 | 2,185 (50.0%) | 3,684 (57.1%) |
| $300,000 to $499,999 | 951 (21.8%) | 1,613 (25.0%) |
| $500,000 to $749,999 | 322 (7.4%) | 443 (6.9%) |
| $750,000 to $999,999 | 158 (3.6%) | 247 (3.8%) |
| $1,000,000 or more | 138 (3.2%) | 139 (2.1%) |
| Total | 4,368 (100.0%) | 6,455 (100.0%) |
Household Income by Mortgage Status in Bennington County
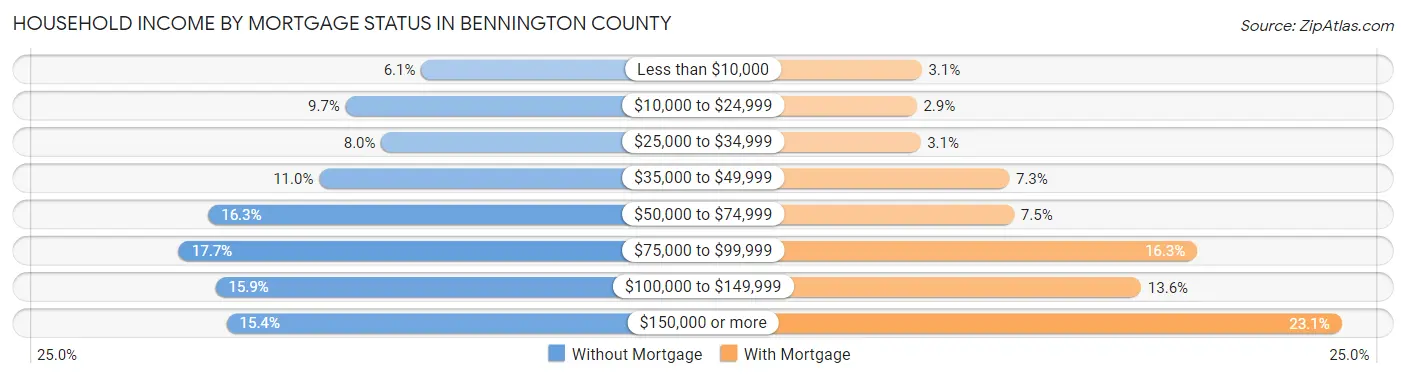
| Household Income | Without Mortgage | With Mortgage |
| Less than $10,000 | 267 (6.1%) | 203 (3.1%) |
| $10,000 to $24,999 | 424 (9.7%) | 187 (2.9%) |
| $25,000 to $34,999 | 350 (8.0%) | 199 (3.1%) |
| $35,000 to $49,999 | 479 (11.0%) | 472 (7.3%) |
| $50,000 to $74,999 | 710 (16.3%) | 487 (7.5%) |
| $75,000 to $99,999 | 771 (17.6%) | 1,050 (16.3%) |
| $100,000 to $149,999 | 695 (15.9%) | 877 (13.6%) |
| $150,000 or more | 672 (15.4%) | 1,494 (23.1%) |
| Total | 4,368 (100.0%) | 6,455 (100.0%) |
Property Value to Household Income Ratio in Bennington County
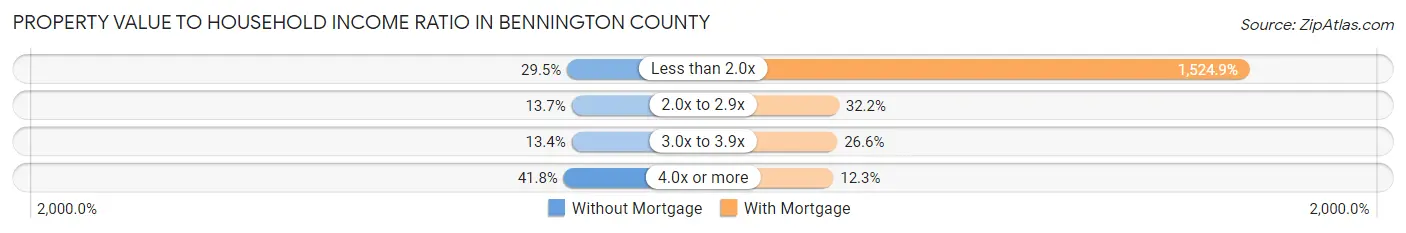
| Value-to-Income Ratio | Without Mortgage | With Mortgage |
| Less than 2.0x | 1,287 (29.5%) | 98,433 (1,524.9%) |
| 2.0x to 2.9x | 597 (13.7%) | 2,081 (32.2%) |
| 3.0x to 3.9x | 584 (13.4%) | 1,714 (26.6%) |
| 4.0x or more | 1,827 (41.8%) | 794 (12.3%) |
| Total | 4,368 (100.0%) | 6,455 (100.0%) |
Real Estate Taxes by Mortgage Status in Bennington County
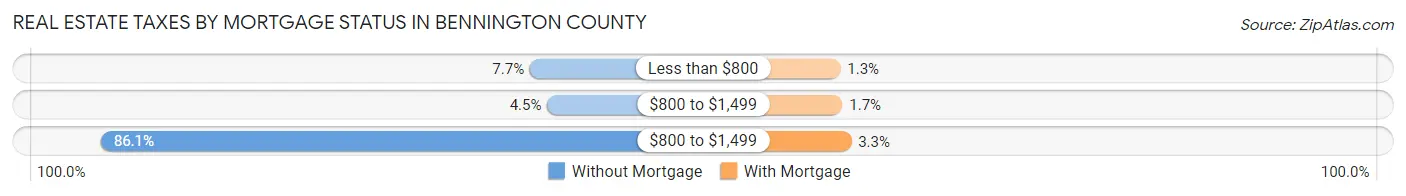
| Property Taxes | Without Mortgage | With Mortgage |
| Less than $800 | 336 (7.7%) | 86 (1.3%) |
| $800 to $1,499 | 198 (4.5%) | 110 (1.7%) |
| $800 to $1,499 | 3,760 (86.1%) | 214 (3.3%) |
| Total | 4,368 (100.0%) | 6,455 (100.0%) |
Health & Disability in Bennington County
Health Insurance Coverage by Age in Bennington County
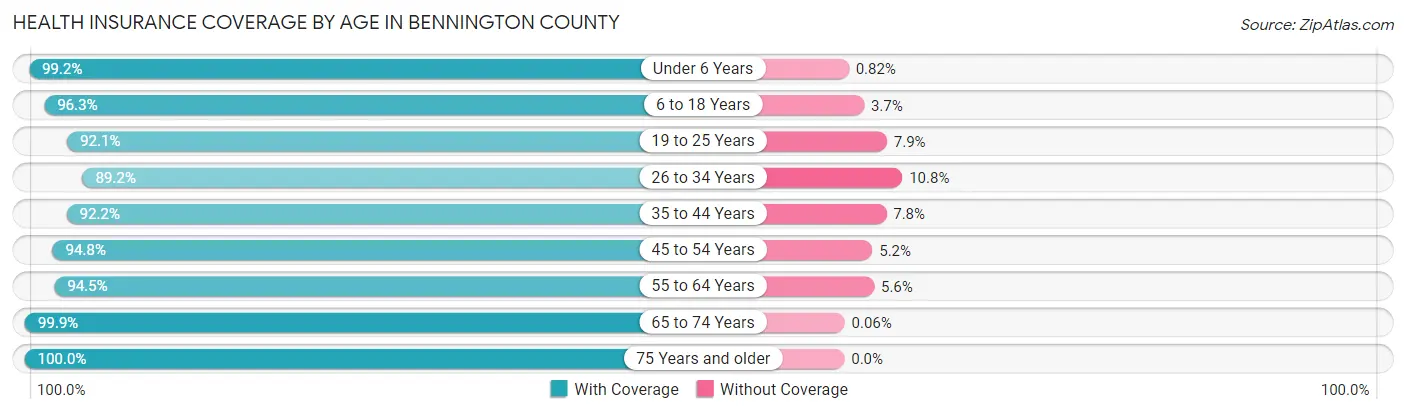
| Age Bracket | With Coverage | Without Coverage |
| Under 6 Years | 1,937 (99.2%) | 16 (0.8%) |
| 6 to 18 Years | 5,545 (96.3%) | 211 (3.7%) |
| 19 to 25 Years | 2,819 (92.1%) | 243 (7.9%) |
| 26 to 34 Years | 2,948 (89.2%) | 357 (10.8%) |
| 35 to 44 Years | 3,482 (92.2%) | 296 (7.8%) |
| 45 to 54 Years | 4,338 (94.8%) | 239 (5.2%) |
| 55 to 64 Years | 5,647 (94.5%) | 332 (5.6%) |
| 65 to 74 Years | 4,938 (99.9%) | 3 (0.1%) |
| 75 Years and older | 3,415 (100.0%) | 0 (0.0%) |
| Total | 35,069 (95.4%) | 1,697 (4.6%) |
Health Insurance Coverage by Citizenship Status in Bennington County
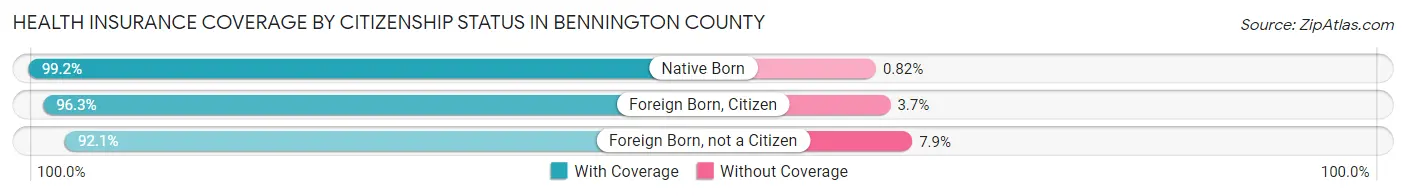
| Citizenship Status | With Coverage | Without Coverage |
| Native Born | 1,937 (99.2%) | 16 (0.8%) |
| Foreign Born, Citizen | 5,545 (96.3%) | 211 (3.7%) |
| Foreign Born, not a Citizen | 2,819 (92.1%) | 243 (7.9%) |
Health Insurance Coverage by Household Income in Bennington County
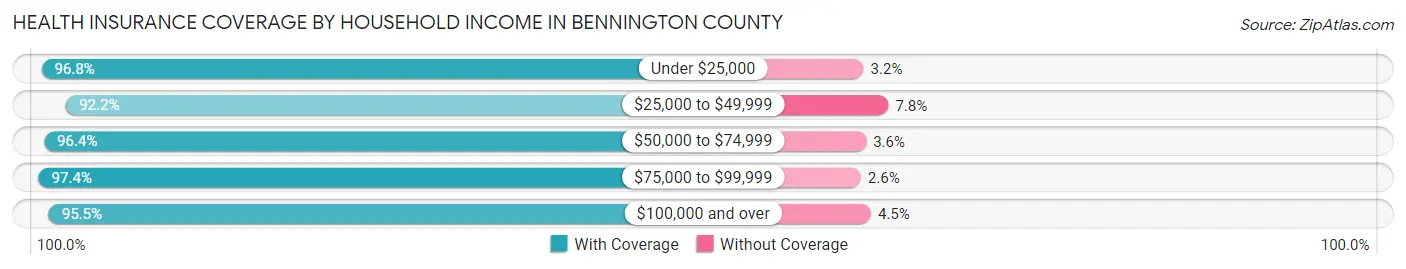
| Household Income | With Coverage | Without Coverage |
| Under $25,000 | 3,713 (96.8%) | 121 (3.2%) |
| $25,000 to $49,999 | 5,077 (92.2%) | 430 (7.8%) |
| $50,000 to $74,999 | 5,791 (96.4%) | 219 (3.6%) |
| $75,000 to $99,999 | 4,753 (97.4%) | 129 (2.6%) |
| $100,000 and over | 14,980 (95.5%) | 713 (4.5%) |
Public vs Private Health Insurance Coverage by Age in Bennington County
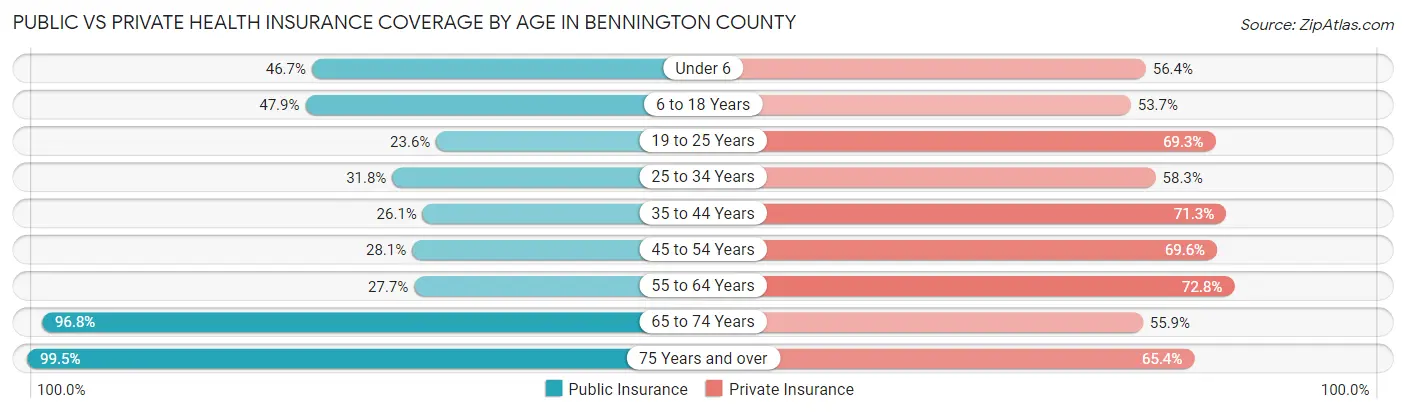
| Age Bracket | Public Insurance | Private Insurance |
| Under 6 | 912 (46.7%) | 1,102 (56.4%) |
| 6 to 18 Years | 2,757 (47.9%) | 3,088 (53.6%) |
| 19 to 25 Years | 723 (23.6%) | 2,122 (69.3%) |
| 25 to 34 Years | 1,050 (31.8%) | 1,925 (58.3%) |
| 35 to 44 Years | 987 (26.1%) | 2,694 (71.3%) |
| 45 to 54 Years | 1,285 (28.1%) | 3,187 (69.6%) |
| 55 to 64 Years | 1,656 (27.7%) | 4,354 (72.8%) |
| 65 to 74 Years | 4,782 (96.8%) | 2,761 (55.9%) |
| 75 Years and over | 3,399 (99.5%) | 2,233 (65.4%) |
| Total | 17,551 (47.7%) | 23,466 (63.8%) |
Disability Status by Sex by Age in Bennington County
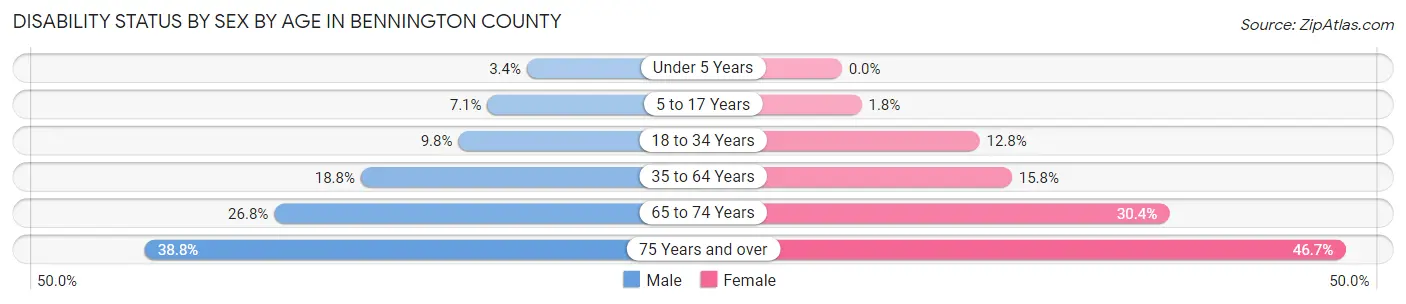
| Age Bracket | Male | Female |
| Under 5 Years | 30 (3.4%) | 0 (0.0%) |
| 5 to 17 Years | 206 (7.0%) | 45 (1.8%) |
| 18 to 34 Years | 326 (9.8%) | 475 (12.8%) |
| 35 to 64 Years | 1,307 (18.8%) | 1,165 (15.8%) |
| 65 to 74 Years | 641 (26.8%) | 775 (30.4%) |
| 75 Years and over | 556 (38.8%) | 926 (46.7%) |
Disability Class by Sex by Age in Bennington County
Disability Class: Hearing Difficulty
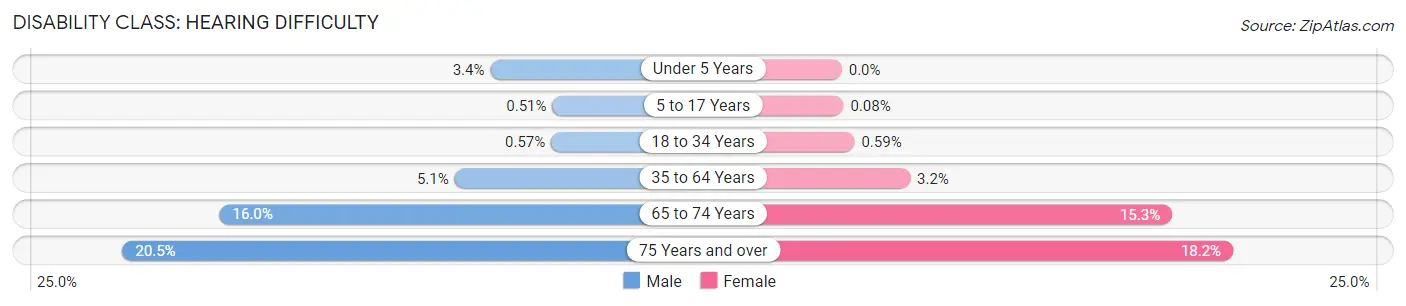
| Age Bracket | Male | Female |
| Under 5 Years | 30 (3.4%) | 0 (0.0%) |
| 5 to 17 Years | 15 (0.5%) | 2 (0.1%) |
| 18 to 34 Years | 19 (0.6%) | 22 (0.6%) |
| 35 to 64 Years | 351 (5.1%) | 234 (3.2%) |
| 65 to 74 Years | 381 (16.0%) | 391 (15.3%) |
| 75 Years and over | 293 (20.5%) | 360 (18.1%) |
Disability Class: Vision Difficulty
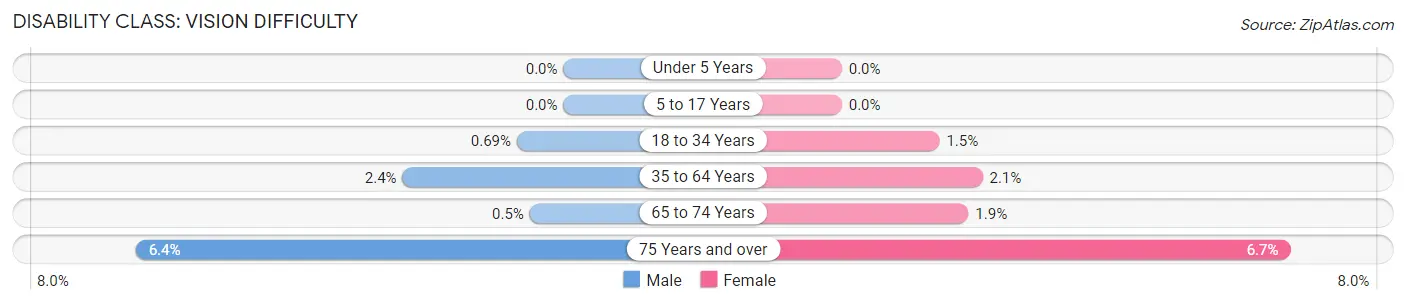
| Age Bracket | Male | Female |
| Under 5 Years | 0 (0.0%) | 0 (0.0%) |
| 5 to 17 Years | 0 (0.0%) | 0 (0.0%) |
| 18 to 34 Years | 23 (0.7%) | 54 (1.5%) |
| 35 to 64 Years | 166 (2.4%) | 154 (2.1%) |
| 65 to 74 Years | 12 (0.5%) | 48 (1.9%) |
| 75 Years and over | 91 (6.4%) | 132 (6.7%) |
Disability Class: Cognitive Difficulty
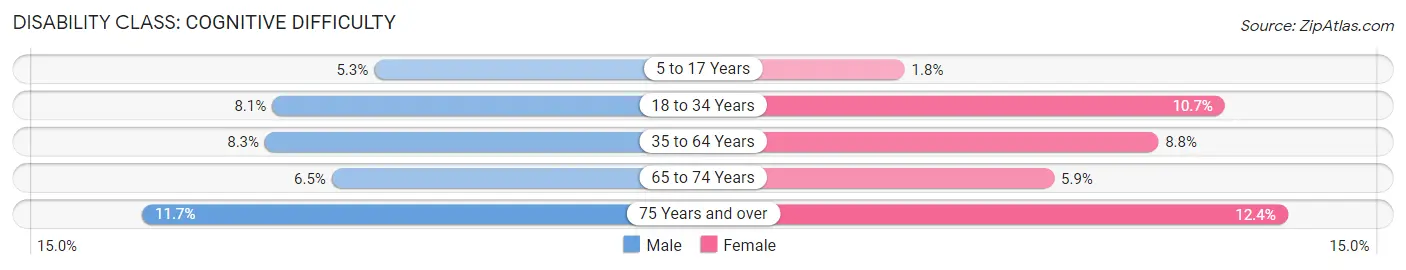
| Age Bracket | Male | Female |
| 5 to 17 Years | 154 (5.3%) | 43 (1.8%) |
| 18 to 34 Years | 271 (8.1%) | 396 (10.7%) |
| 35 to 64 Years | 578 (8.3%) | 650 (8.8%) |
| 65 to 74 Years | 154 (6.5%) | 151 (5.9%) |
| 75 Years and over | 168 (11.7%) | 246 (12.4%) |
Disability Class: Ambulatory Difficulty
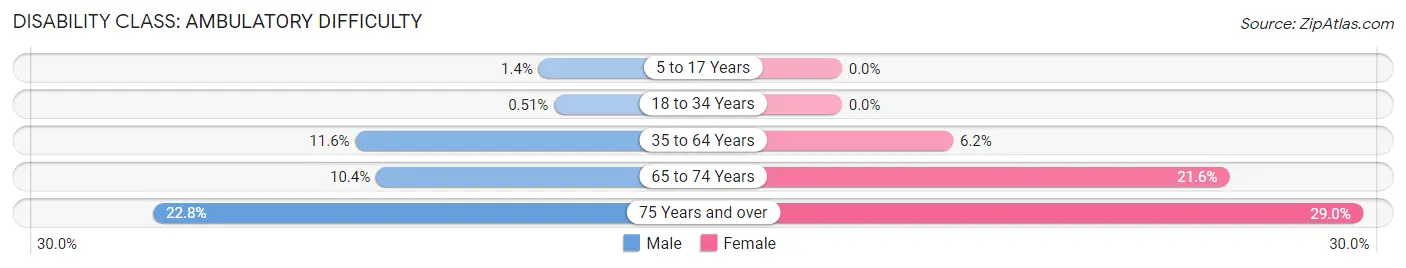
| Age Bracket | Male | Female |
| 5 to 17 Years | 40 (1.4%) | 0 (0.0%) |
| 18 to 34 Years | 17 (0.5%) | 0 (0.0%) |
| 35 to 64 Years | 805 (11.6%) | 457 (6.2%) |
| 65 to 74 Years | 249 (10.4%) | 551 (21.6%) |
| 75 Years and over | 327 (22.8%) | 575 (29.0%) |
Disability Class: Self-Care Difficulty
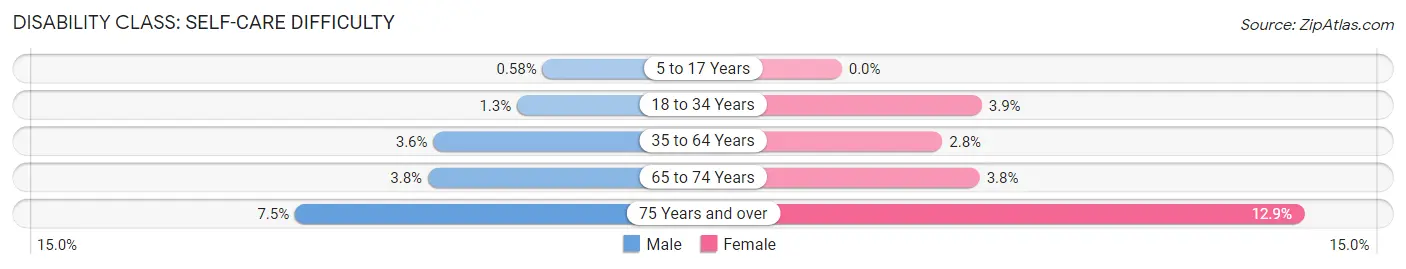
| Age Bracket | Male | Female |
| 5 to 17 Years | 17 (0.6%) | 0 (0.0%) |
| 18 to 34 Years | 43 (1.3%) | 145 (3.9%) |
| 35 to 64 Years | 252 (3.6%) | 207 (2.8%) |
| 65 to 74 Years | 90 (3.8%) | 98 (3.8%) |
| 75 Years and over | 107 (7.5%) | 255 (12.9%) |
Technology Access in Bennington County
Computing Device Access in Bennington County
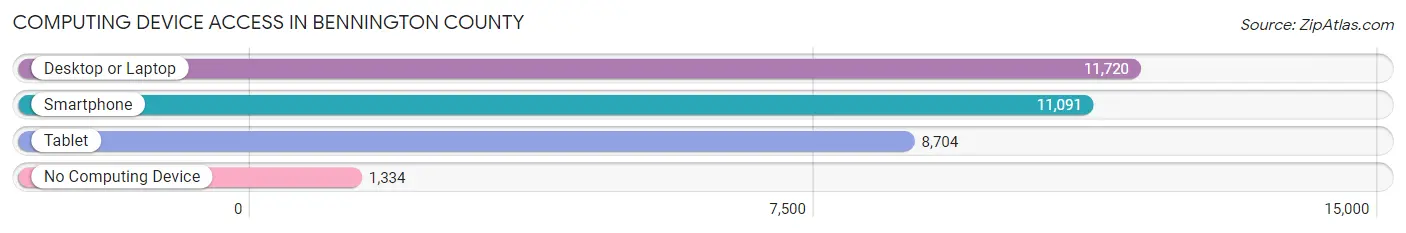
| Device Type | # Households | % Households |
| Desktop or Laptop | 11,720 | 80.5% |
| Smartphone | 11,091 | 76.1% |
| Tablet | 8,704 | 59.8% |
| No Computing Device | 1,334 | 9.2% |
| Total | 14,566 | 100.0% |
Internet Access in Bennington County
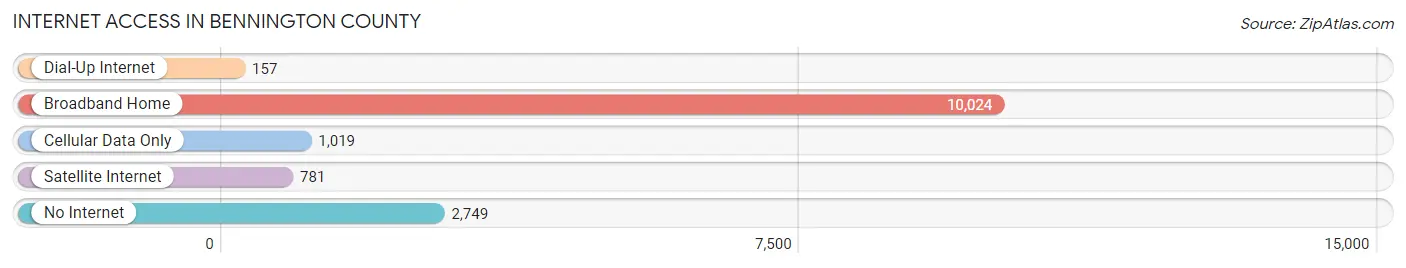
| Internet Type | # Households | % Households |
| Dial-Up Internet | 157 | 1.1% |
| Broadband Home | 10,024 | 68.8% |
| Cellular Data Only | 1,019 | 7.0% |
| Satellite Internet | 781 | 5.4% |
| No Internet | 2,749 | 18.9% |
| Total | 14,566 | 100.0% |
Bennington County Summary
Bennington County is located in the southwestern corner of Vermont, and is the second largest county in the state. It is bordered by New York to the west, Massachusetts to the south, and the Connecticut River to the east. The county seat is Bennington, and the largest city is Manchester. The county is home to a variety of landscapes, from the Green Mountains to the Taconic Mountains, and is known for its rural beauty and outdoor recreation opportunities.
History
Bennington County was established in 1778, and was named after the town of Bennington, which was the site of a Revolutionary War battle in 1777. The county was originally part of Albany County, New York, and was part of the Vermont Republic from 1777 to 1791. The county was then part of the state of Vermont from 1791 to present.
The county has a rich history of industry and agriculture. In the 19th century, the county was home to a thriving iron industry, and the town of Bennington was the site of the first marble quarry in the United States. The county was also home to a number of mills, including paper mills, sawmills, and gristmills. Agriculture has also been an important part of the county’s economy, with dairy farming and apple orchards being the main crops.
Geography
Bennington County is located in the southwestern corner of Vermont, and is bordered by New York to the west, Massachusetts to the south, and the Connecticut River to the east. The county is home to a variety of landscapes, from the Green Mountains to the Taconic Mountains. The highest point in the county is the summit of Mount Equinox, which is 3,848 feet above sea level. The county is also home to a number of rivers and streams, including the Batten Kill, Walloomsac River, and Hoosic River.
Economy
The economy of Bennington County is largely based on tourism, manufacturing, and agriculture. Tourism is a major industry in the county, with visitors coming to enjoy the rural beauty and outdoor recreation opportunities. Manufacturing is also an important part of the economy, with a number of companies located in the county, including Bennington Potters, Bennington Furniture, and Bennington Flag. Agriculture is also an important part of the economy, with dairy farming and apple orchards being the main crops.
Demographics
As of the 2010 census, Bennington County had a population of 37,125. The population is largely white (94.3%), with small percentages of African American (1.3%), Asian (1.2%), and Native American (0.5%) populations. The median household income is $50,945, and the median age is 43.7. The county is home to a number of colleges and universities, including Bennington College, Southern Vermont College, and the Community College of Vermont.
Bennington County is a beautiful and diverse county with a rich history and a vibrant economy. It is home to a variety of landscapes, from the Green Mountains to the Taconic Mountains, and is known for its rural beauty and outdoor recreation opportunities. The county is also home to a number of industries, including tourism, manufacturing, and agriculture, and is home to a number of colleges and universities. Bennington County is a great place to live, work, and play.
Common Questions
What is the Total Population of Bennington County?
Total Population of Bennington County is 37,326.
What is the Total Male Population of Bennington County?
Total Male Population of Bennington County is 18,243.
What is the Total Female Population of Bennington County?
Total Female Population of Bennington County is 19,083.
What is the Ratio of Males per 100 Females in Bennington County?
There are 95.60 Males per 100 Females in Bennington County.
What is the Ratio of Females per 100 Males in Bennington County?
There are 104.60 Females per 100 Males in Bennington County.
What is the Median Population Age in Bennington County?
Median Population Age in Bennington County is 46.7 Years.
What is the Average Family Size in Bennington County
Average Family Size in Bennington County is 3.1 People.
What is the Average Household Size in Bennington County
Average Household Size in Bennington County is 2.5 People.
What is Per Capita Income in Bennington County?
Per Capita income in Bennington County is $39,717.
What is the Median Family Income in Bennington County?
Median Family Income in Bennington County is $95,160.
What is the Median Household income in Bennington County?
Median Household Income in Bennington County is $68,558.
What is Income or Wage Gap in Bennington County?
Income or Wage Gap in Bennington County is 15.6%.
Women in Bennington County earn 84.4 cents for every dollar earned by a man.
What is Family Income Deficit in Bennington County?
Family Income Deficit in Bennington County is $12,182.
Families that are below poverty line in Bennington County earn $12,182 less on average than the poverty threshold level.
What is Inequality or Gini Index in Bennington County?
Inequality or Gini Index in Bennington County is 0.48.
How Large is the Labor Force in Bennington County?
There are 18,553 People in the Labor Forcein in Bennington County.
What is the Percentage of People in the Labor Force in Bennington County?
59.5% of People are in the Labor Force in Bennington County.
What is the Unemployment Rate in Bennington County?
Unemployment Rate in Bennington County is 4.2%.