Addison County, VT
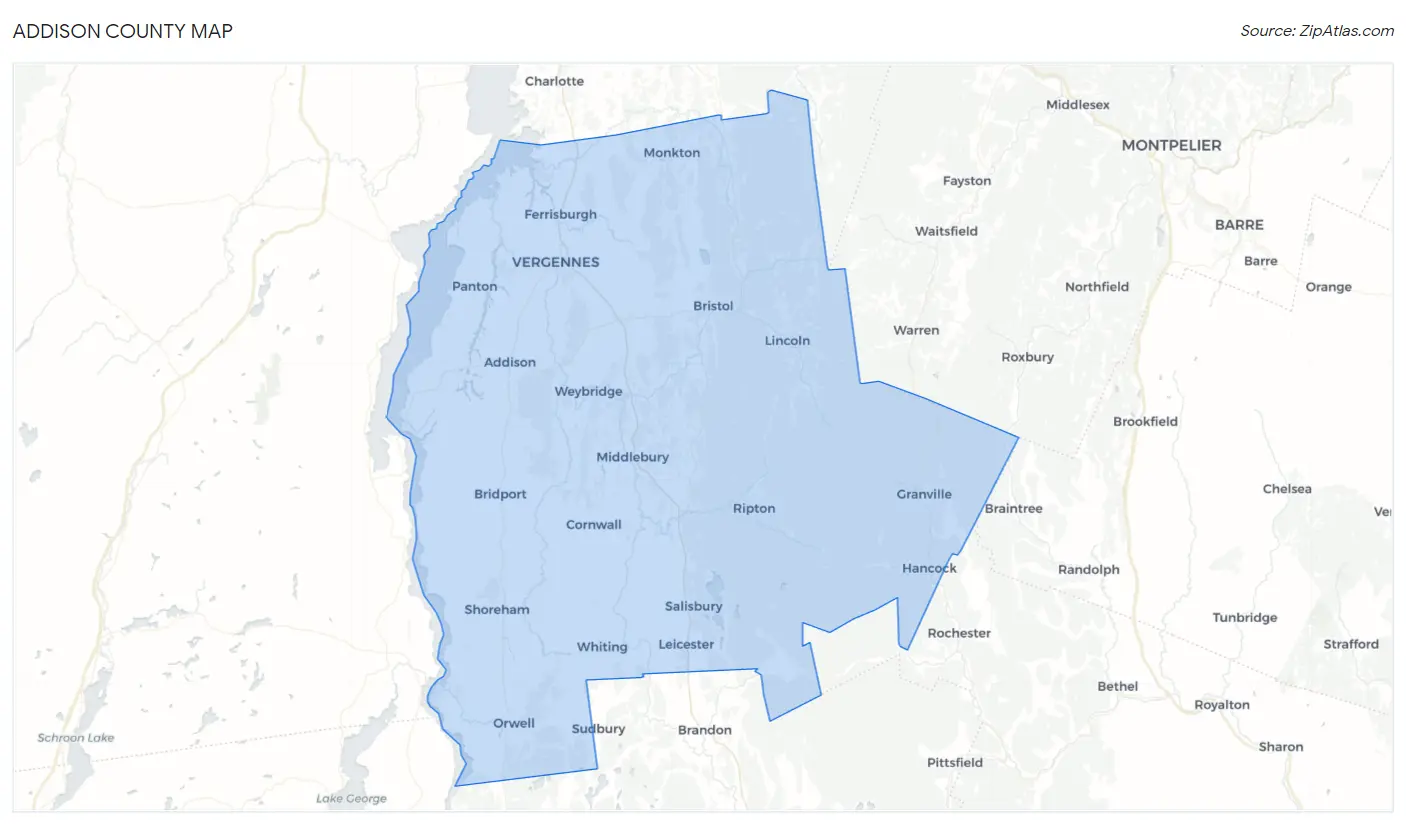
Addison County Map
Addison County Overview
37,434
TOTAL POPULATION
18,716
MALE POPULATION
18,718
FEMALE POPULATION
99.99
MALES / 100 FEMALES
100.01
FEMALES / 100 MALES
43.9
MEDIAN AGE
2.9
AVG FAMILY SIZE
2.4
AVG HOUSEHOLD SIZE
$42,271
PER CAPITA INCOME
$104,167
AVG FAMILY INCOME
$85,870
AVG HOUSEHOLD INCOME
25.4%
WAGE / INCOME GAP [ % ]
74.6¢/ $1
WAGE / INCOME GAP [ $ ]
$10,367
FAMILY INCOME DEFICIT
0.41
INEQUALITY / GINI INDEX
20,678
LABOR FORCE [ PEOPLE ]
64.5%
PERCENT IN LABOR FORCE
4.1%
UNEMPLOYMENT RATE
Addison County Area Codes
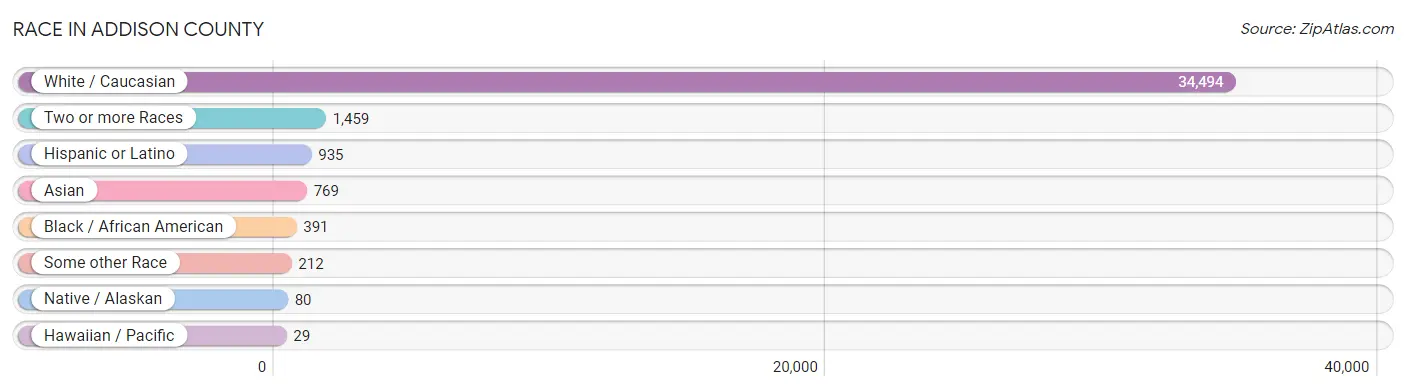
Race in Addison County
The most populous races in Addison County are White / Caucasian (34,494 | 92.1%), Two or more Races (1,459 | 3.9%), and Hispanic or Latino (935 | 2.5%).
| Race | # Population | % Population |
| Asian | 769 | 2.1% |
| Black / African American | 391 | 1.0% |
| Hawaiian / Pacific | 29 | 0.1% |
| Hispanic or Latino | 935 | 2.5% |
| Native / Alaskan | 80 | 0.2% |
| White / Caucasian | 34,494 | 92.1% |
| Two or more Races | 1,459 | 3.9% |
| Some other Race | 212 | 0.6% |
| Total | 37,434 | 100.0% |
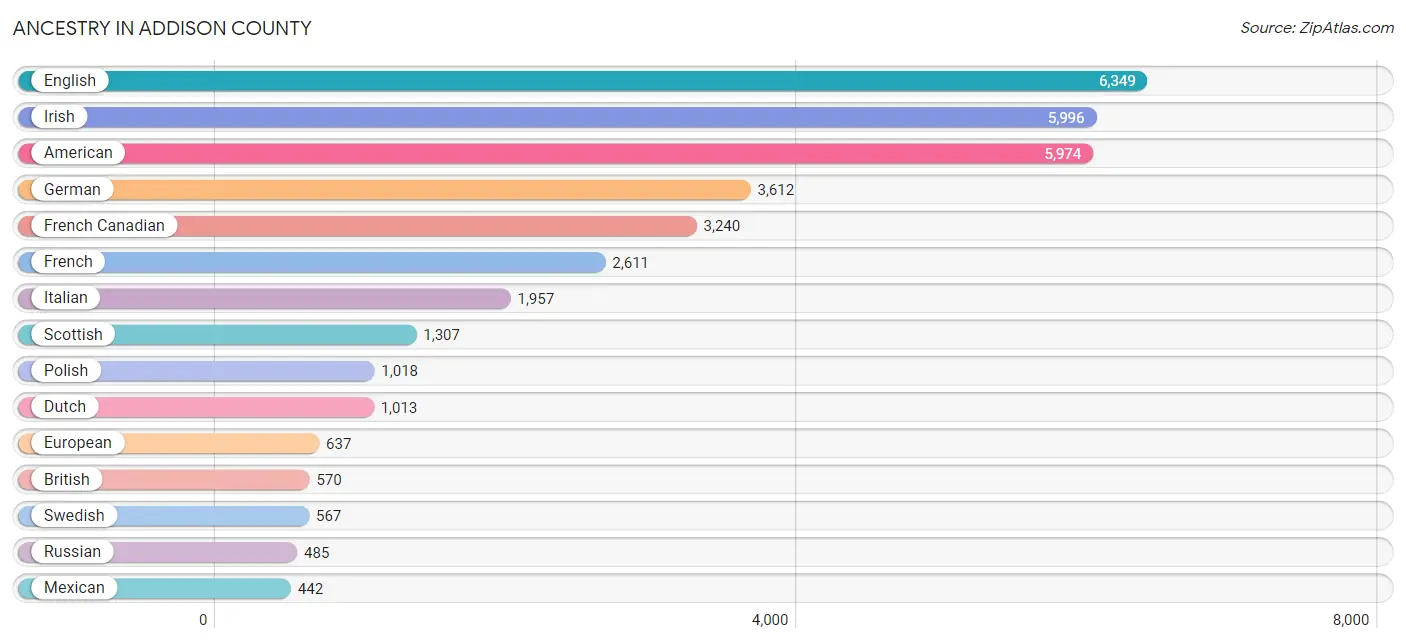
Ancestry in Addison County
The most populous ancestries reported in Addison County are English (6,349 | 17.0%), Irish (5,996 | 16.0%), American (5,974 | 16.0%), German (3,612 | 9.7%), and French Canadian (3,240 | 8.7%), together accounting for 67.2% of all Addison County residents.
| Ancestry | # Population | % Population |
| African | 21 | 0.1% |
| Albanian | 12 | 0.0% |
| Aleut | 11 | 0.0% |
| American | 5,974 | 16.0% |
| Apache | 4 | 0.0% |
| Arab | 71 | 0.2% |
| Argentinean | 5 | 0.0% |
| Armenian | 14 | 0.0% |
| Australian | 3 | 0.0% |
| Austrian | 122 | 0.3% |
| Belgian | 9 | 0.0% |
| Bhutanese | 144 | 0.4% |
| Blackfeet | 29 | 0.1% |
| Brazilian | 28 | 0.1% |
| British | 570 | 1.5% |
| Burmese | 140 | 0.4% |
| Canadian | 425 | 1.1% |
| Celtic | 26 | 0.1% |
| Central American | 68 | 0.2% |
| Central American Indian | 26 | 0.1% |
| Cherokee | 30 | 0.1% |
| Chilean | 8 | 0.0% |
| Colombian | 16 | 0.0% |
| Croatian | 27 | 0.1% |
| Cuban | 28 | 0.1% |
| Czech | 94 | 0.3% |
| Czechoslovakian | 33 | 0.1% |
| Danish | 380 | 1.0% |
| Delaware | 5 | 0.0% |
| Dominican | 48 | 0.1% |
| Dutch | 1,013 | 2.7% |
| Eastern European | 245 | 0.6% |
| Egyptian | 5 | 0.0% |
| English | 6,349 | 17.0% |
| Ethiopian | 18 | 0.1% |
| European | 637 | 1.7% |
| Filipino | 12 | 0.0% |
| Finnish | 61 | 0.2% |
| French | 2,611 | 7.0% |
| French American Indian | 14 | 0.0% |
| French Canadian | 3,240 | 8.7% |
| German | 3,612 | 9.7% |
| Ghanaian | 25 | 0.1% |
| Greek | 186 | 0.5% |
| Guatemalan | 28 | 0.1% |
| Guyanese | 13 | 0.0% |
| Haitian | 7 | 0.0% |
| Hungarian | 128 | 0.3% |
| Icelander | 19 | 0.1% |
| Indian (Asian) | 423 | 1.1% |
| Inupiat | 3 | 0.0% |
| Iranian | 36 | 0.1% |
| Irish | 5,996 | 16.0% |
| Iroquois | 15 | 0.0% |
| Italian | 1,957 | 5.2% |
| Jamaican | 170 | 0.4% |
| Kenyan | 9 | 0.0% |
| Korean | 120 | 0.3% |
| Lebanese | 32 | 0.1% |
| Lithuanian | 158 | 0.4% |
| Luxembourger | 28 | 0.1% |
| Mexican | 442 | 1.2% |
| Mexican American Indian | 9 | 0.0% |
| Native Hawaiian | 24 | 0.1% |
| Navajo | 2 | 0.0% |
| Nicaraguan | 1 | 0.0% |
| Nigerian | 21 | 0.1% |
| Northern European | 78 | 0.2% |
| Norwegian | 309 | 0.8% |
| Pakistani | 8 | 0.0% |
| Pennsylvania German | 9 | 0.0% |
| Peruvian | 33 | 0.1% |
| Polish | 1,018 | 2.7% |
| Portuguese | 191 | 0.5% |
| Potawatomi | 1 | 0.0% |
| Puerto Rican | 96 | 0.3% |
| Romanian | 21 | 0.1% |
| Russian | 485 | 1.3% |
| Salvadoran | 39 | 0.1% |
| Samoan | 13 | 0.0% |
| Scandinavian | 156 | 0.4% |
| Scotch-Irish | 391 | 1.0% |
| Scottish | 1,307 | 3.5% |
| Senegalese | 1 | 0.0% |
| Serbian | 17 | 0.1% |
| Slavic | 18 | 0.1% |
| Slovak | 56 | 0.2% |
| South American | 94 | 0.3% |
| Spaniard | 25 | 0.1% |
| Spanish | 42 | 0.1% |
| Sri Lankan | 125 | 0.3% |
| Subsaharan African | 105 | 0.3% |
| Swedish | 567 | 1.5% |
| Swiss | 220 | 0.6% |
| Syrian | 3 | 0.0% |
| Thai | 100 | 0.3% |
| Turkish | 28 | 0.1% |
| U.S. Virgin Islander | 2 | 0.0% |
| Ukrainian | 132 | 0.4% |
| Venezuelan | 32 | 0.1% |
| Welsh | 357 | 0.9% |
| West Indian | 13 | 0.0% |
| Yugoslavian | 9 | 0.0% | View All 103 Rows |
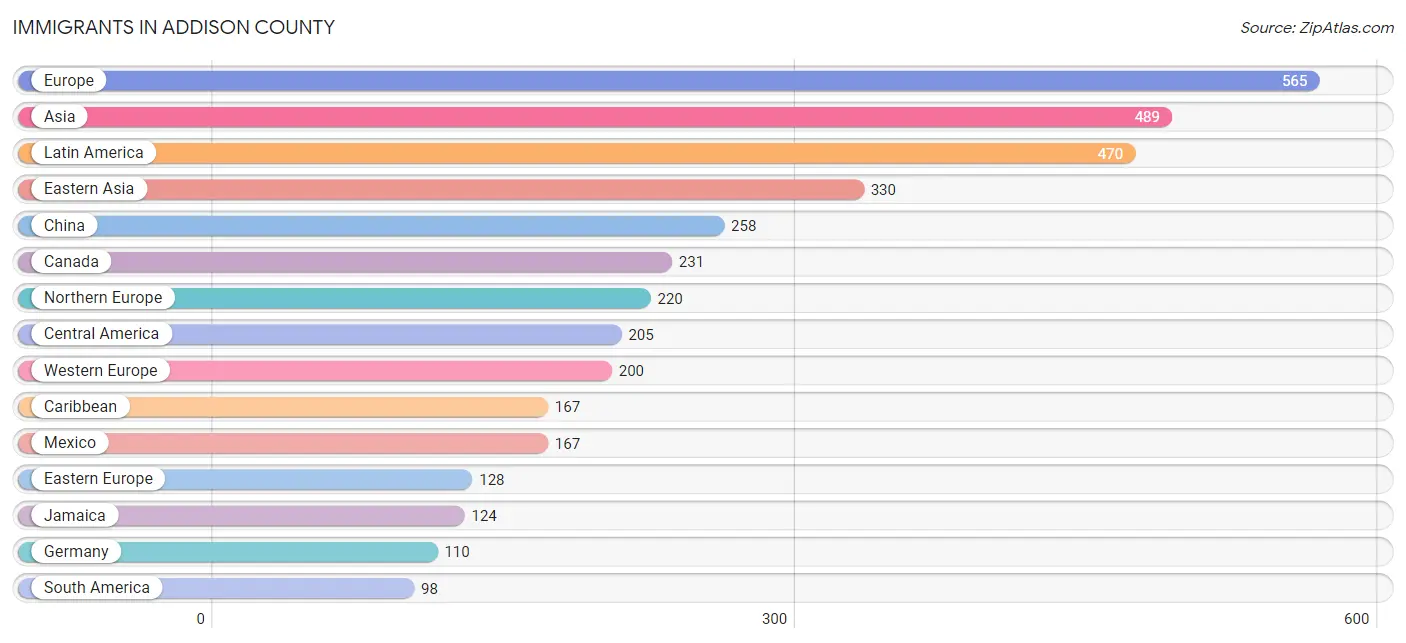
Immigrants in Addison County
The most numerous immigrant groups reported in Addison County came from Europe (565 | 1.5%), Asia (489 | 1.3%), Latin America (470 | 1.3%), Eastern Asia (330 | 0.9%), and China (258 | 0.7%), together accounting for 5.7% of all Addison County residents.
| Immigration Origin | # Population | % Population |
| Africa | 64 | 0.2% |
| Albania | 12 | 0.0% |
| Asia | 489 | 1.3% |
| Austria | 20 | 0.1% |
| Bosnia and Herzegovina | 14 | 0.0% |
| Brazil | 27 | 0.1% |
| Canada | 231 | 0.6% |
| Caribbean | 167 | 0.4% |
| Central America | 205 | 0.5% |
| Chile | 1 | 0.0% |
| China | 258 | 0.7% |
| Colombia | 5 | 0.0% |
| Czechoslovakia | 12 | 0.0% |
| Denmark | 3 | 0.0% |
| Dominica | 31 | 0.1% |
| Dominican Republic | 9 | 0.0% |
| Eastern Africa | 23 | 0.1% |
| Eastern Asia | 330 | 0.9% |
| Eastern Europe | 128 | 0.3% |
| El Salvador | 8 | 0.0% |
| England | 75 | 0.2% |
| Europe | 565 | 1.5% |
| France | 23 | 0.1% |
| Germany | 110 | 0.3% |
| Ghana | 19 | 0.1% |
| Greece | 1 | 0.0% |
| Guatemala | 30 | 0.1% |
| Haiti | 3 | 0.0% |
| Hong Kong | 11 | 0.0% |
| Hungary | 6 | 0.0% |
| India | 10 | 0.0% |
| Iran | 27 | 0.1% |
| Ireland | 54 | 0.1% |
| Italy | 1 | 0.0% |
| Jamaica | 124 | 0.3% |
| Japan | 11 | 0.0% |
| Kenya | 9 | 0.0% |
| Korea | 61 | 0.2% |
| Latin America | 470 | 1.3% |
| Lebanon | 2 | 0.0% |
| Mexico | 167 | 0.4% |
| Nepal | 4 | 0.0% |
| Netherlands | 28 | 0.1% |
| Nigeria | 6 | 0.0% |
| Northern Europe | 220 | 0.6% |
| Norway | 4 | 0.0% |
| Pakistan | 14 | 0.0% |
| Peru | 33 | 0.1% |
| Philippines | 59 | 0.2% |
| Poland | 11 | 0.0% |
| Portugal | 4 | 0.0% |
| Romania | 6 | 0.0% |
| Russia | 55 | 0.2% |
| Senegal | 1 | 0.0% |
| Serbia | 5 | 0.0% |
| Singapore | 3 | 0.0% |
| South Africa | 11 | 0.0% |
| South America | 98 | 0.3% |
| South Central Asia | 60 | 0.2% |
| South Eastern Asia | 79 | 0.2% |
| Southern Europe | 17 | 0.1% |
| Spain | 11 | 0.0% |
| Switzerland | 19 | 0.1% |
| Syria | 1 | 0.0% |
| Taiwan | 11 | 0.0% |
| Thailand | 4 | 0.0% |
| Turkey | 17 | 0.1% |
| Ukraine | 5 | 0.0% |
| Venezuela | 32 | 0.1% |
| Vietnam | 13 | 0.0% |
| Western Africa | 30 | 0.1% |
| Western Asia | 20 | 0.1% |
| Western Europe | 200 | 0.5% | View All 73 Rows |
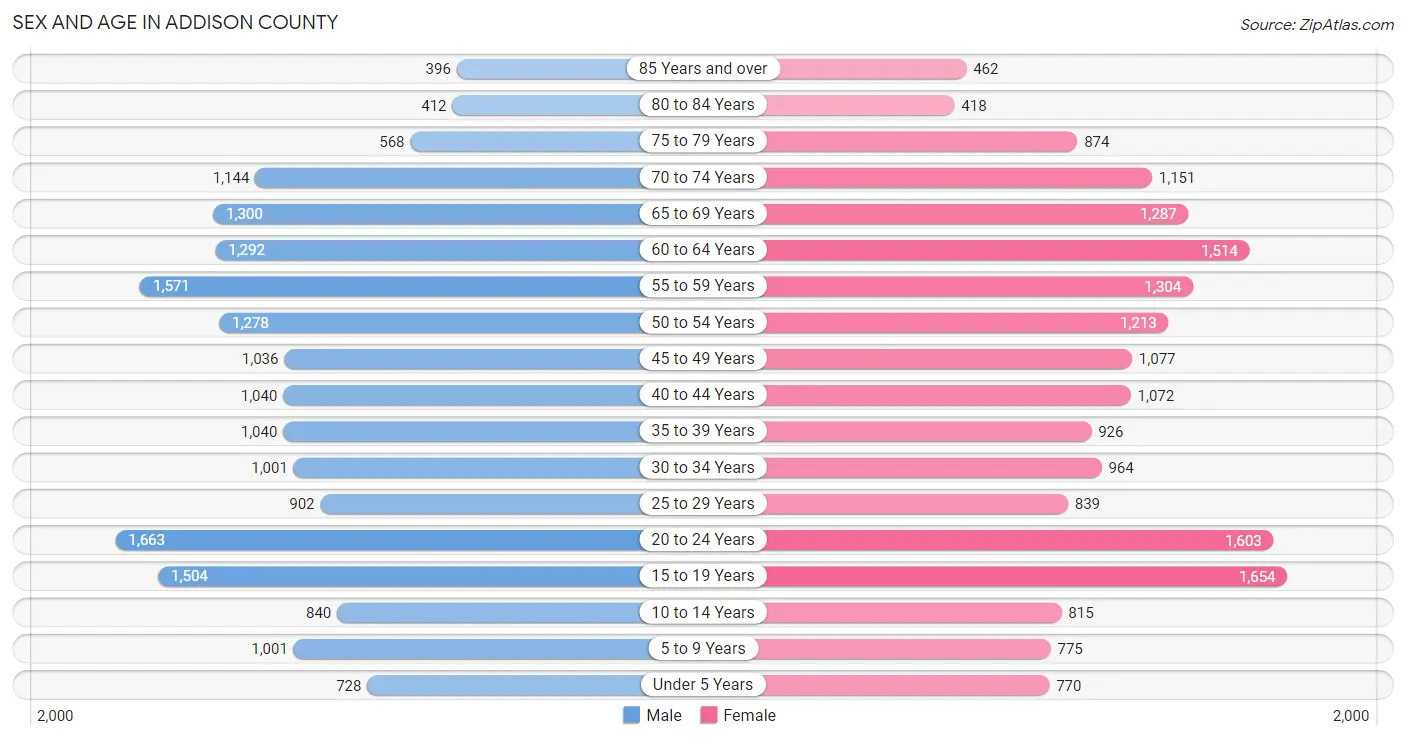
Sex and Age in Addison County
Sex and Age in Addison County
The most populous age groups in Addison County are 20 to 24 Years (1,663 | 8.9%) for men and 15 to 19 Years (1,654 | 8.8%) for women.
| Age Bracket | Male | Female |
| Under 5 Years | 728 (3.9%) | 770 (4.1%) |
| 5 to 9 Years | 1,001 (5.3%) | 775 (4.1%) |
| 10 to 14 Years | 840 (4.5%) | 815 (4.3%) |
| 15 to 19 Years | 1,504 (8.0%) | 1,654 (8.8%) |
| 20 to 24 Years | 1,663 (8.9%) | 1,603 (8.6%) |
| 25 to 29 Years | 902 (4.8%) | 839 (4.5%) |
| 30 to 34 Years | 1,001 (5.3%) | 964 (5.1%) |
| 35 to 39 Years | 1,040 (5.6%) | 926 (5.0%) |
| 40 to 44 Years | 1,040 (5.6%) | 1,072 (5.7%) |
| 45 to 49 Years | 1,036 (5.5%) | 1,077 (5.8%) |
| 50 to 54 Years | 1,278 (6.8%) | 1,213 (6.5%) |
| 55 to 59 Years | 1,571 (8.4%) | 1,304 (7.0%) |
| 60 to 64 Years | 1,292 (6.9%) | 1,514 (8.1%) |
| 65 to 69 Years | 1,300 (7.0%) | 1,287 (6.9%) |
| 70 to 74 Years | 1,144 (6.1%) | 1,151 (6.1%) |
| 75 to 79 Years | 568 (3.0%) | 874 (4.7%) |
| 80 to 84 Years | 412 (2.2%) | 418 (2.2%) |
| 85 Years and over | 396 (2.1%) | 462 (2.5%) |
| Total | 18,716 (100.0%) | 18,718 (100.0%) |
Families and Households in Addison County
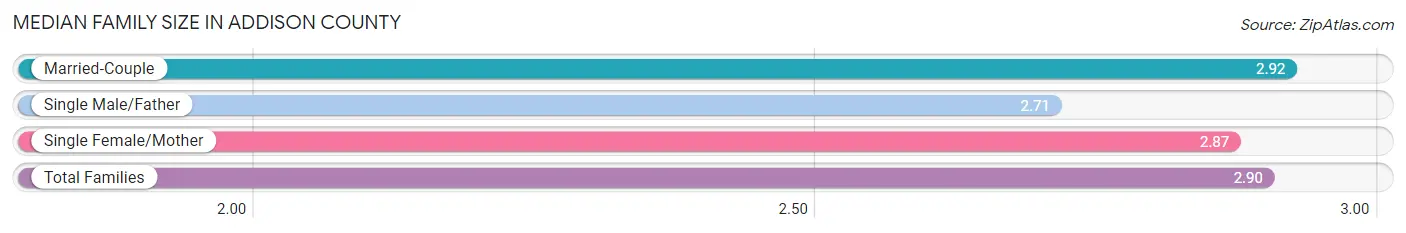
Median Family Size in Addison County
The median family size in Addison County is 2.90 persons per family, with married-couple families (7,533 | 82.9%) accounting for the largest median family size of 2.92 persons per family. On the other hand, single male/father families (519 | 5.7%) represent the smallest median family size with 2.71 persons per family.
| Family Type | # Families | Family Size |
| Married-Couple | 7,533 (82.9%) | 2.92 |
| Single Male/Father | 519 (5.7%) | 2.71 |
| Single Female/Mother | 1,032 (11.4%) | 2.87 |
| Total Families | 9,084 (100.0%) | 2.90 |
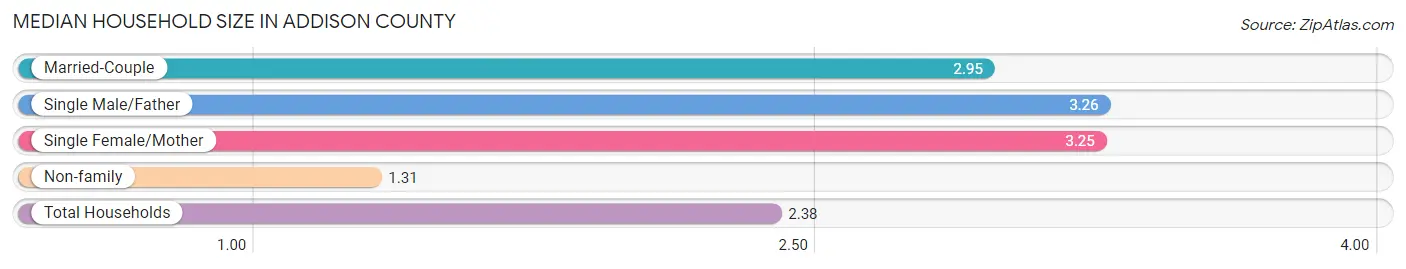
Median Household Size in Addison County
The median household size in Addison County is 2.38 persons per household, with single male/father households (519 | 3.6%) accounting for the largest median household size of 3.26 persons per household. non-family households (5,332 | 37.0%) represent the smallest median household size with 1.31 persons per household.
| Household Type | # Households | Household Size |
| Married-Couple | 7,533 (52.2%) | 2.95 |
| Single Male/Father | 519 (3.6%) | 3.26 |
| Single Female/Mother | 1,032 (7.2%) | 3.25 |
| Non-family | 5,332 (37.0%) | 1.31 |
| Total Households | 14,416 (100.0%) | 2.38 |
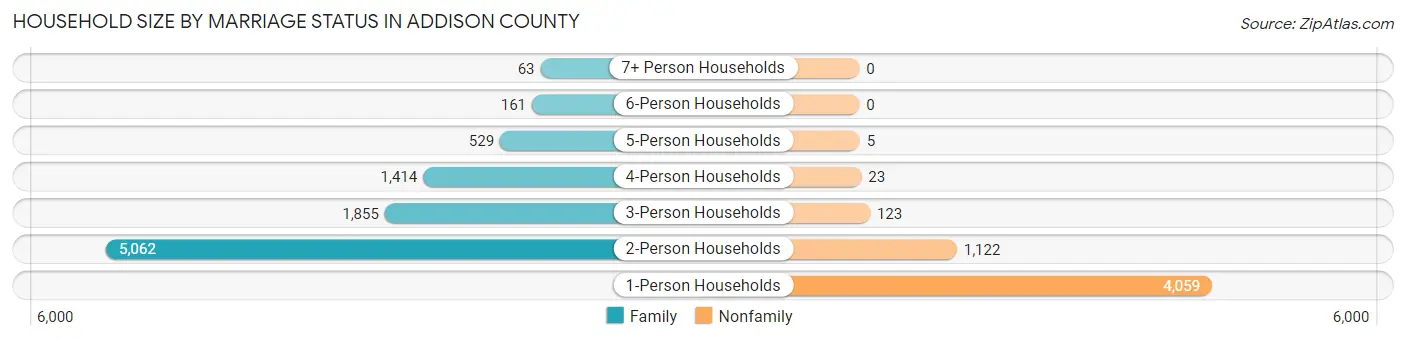
Household Size by Marriage Status in Addison County
Out of a total of 14,416 households in Addison County, 9,084 (63.0%) are family households, while 5,332 (37.0%) are nonfamily households. The most numerous type of family households are 2-person households, comprising 5,062, and the most common type of nonfamily households are 1-person households, comprising 4,059.
| Household Size | Family Households | Nonfamily Households |
| 1-Person Households | - | 4,059 (28.2%) |
| 2-Person Households | 5,062 (35.1%) | 1,122 (7.8%) |
| 3-Person Households | 1,855 (12.9%) | 123 (0.9%) |
| 4-Person Households | 1,414 (9.8%) | 23 (0.2%) |
| 5-Person Households | 529 (3.7%) | 5 (0.0%) |
| 6-Person Households | 161 (1.1%) | 0 (0.0%) |
| 7+ Person Households | 63 (0.4%) | 0 (0.0%) |
| Total | 9,084 (63.0%) | 5,332 (37.0%) |
Female Fertility in Addison County
Fertility by Age in Addison County
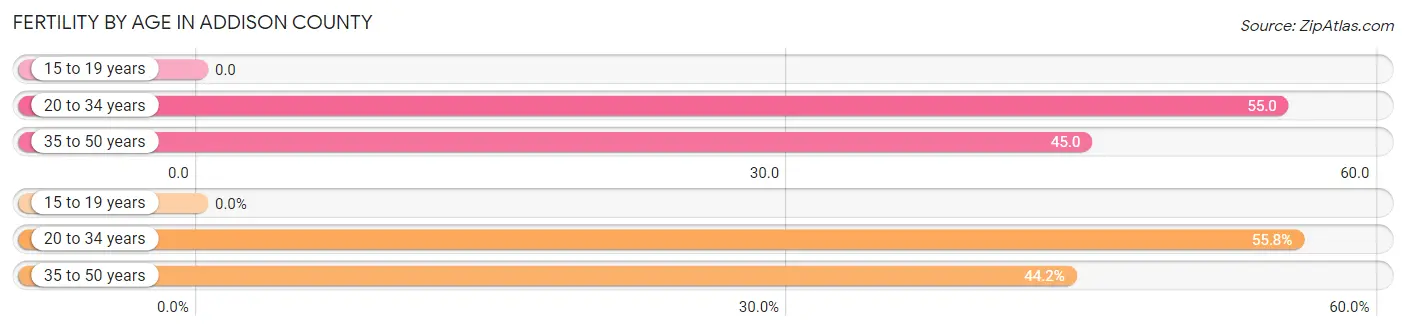
Average fertility rate in Addison County is 40.0 births per 1,000 women. Women in the age bracket of 20 to 34 years have the highest fertility rate with 55.0 births per 1,000 women. Women in the age bracket of 20 to 34 years acount for 55.8% of all women with births.
| Age Bracket | Women with Births | Births / 1,000 Women |
| 15 to 19 years | 0 (0.0%) | 0.0 |
| 20 to 34 years | 188 (55.8%) | 55.0 |
| 35 to 50 years | 149 (44.2%) | 45.0 |
| Total | 337 (100.0%) | 40.0 |
Fertility by Age by Marriage Status in Addison County
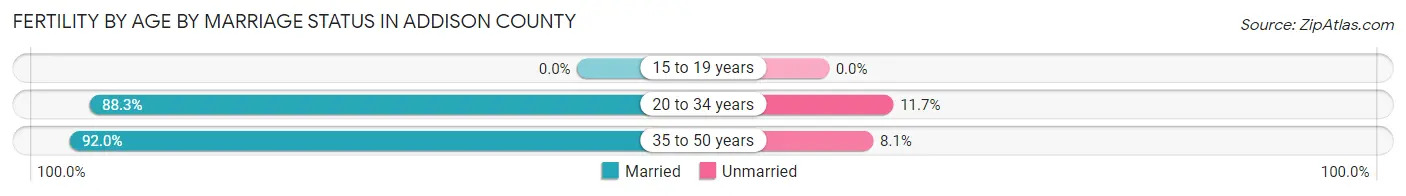
89.9% of women with births (337) in Addison County are married. The highest percentage of unmarried women with births falls into 20 to 34 years age bracket with 11.7% of them unmarried at the time of birth, while the lowest percentage of unmarried women with births belong to 35 to 50 years age bracket with 8.1% of them unmarried.
| Age Bracket | Married | Unmarried |
| 15 to 19 years | 0 (0.0%) | 0 (0.0%) |
| 20 to 34 years | 166 (88.3%) | 22 (11.7%) |
| 35 to 50 years | 137 (91.9%) | 12 (8.1%) |
| Total | 303 (89.9%) | 34 (10.1%) |
Fertility by Education in Addison County
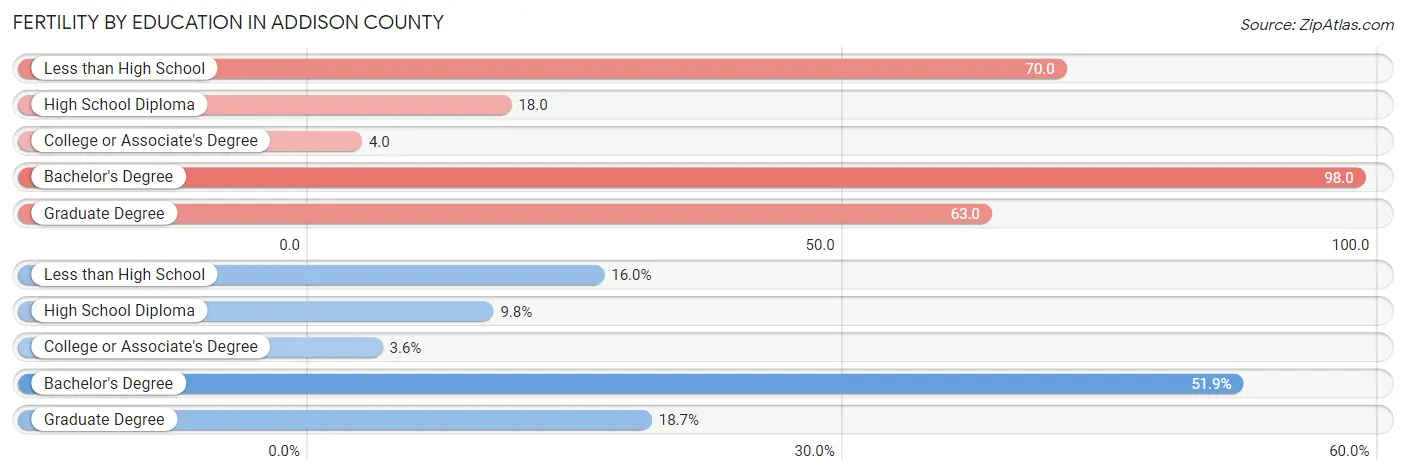
Average fertility rate in Addison County is 40.0 births per 1,000 women. Women with the education attainment of bachelor's degree have the highest fertility rate of 98.0 births per 1,000 women, while women with the education attainment of college or associate's degree have the lowest fertility at 4.0 births per 1,000 women. Women with the education attainment of bachelor's degree represent 51.9% of all women with births.
| Educational Attainment | Women with Births | Births / 1,000 Women |
| Less than High School | 54 (16.0%) | 70.0 |
| High School Diploma | 33 (9.8%) | 18.0 |
| College or Associate's Degree | 12 (3.6%) | 4.0 |
| Bachelor's Degree | 175 (51.9%) | 98.0 |
| Graduate Degree | 63 (18.7%) | 63.0 |
| Total | 337 (100.0%) | 40.0 |
Fertility by Education by Marriage Status in Addison County
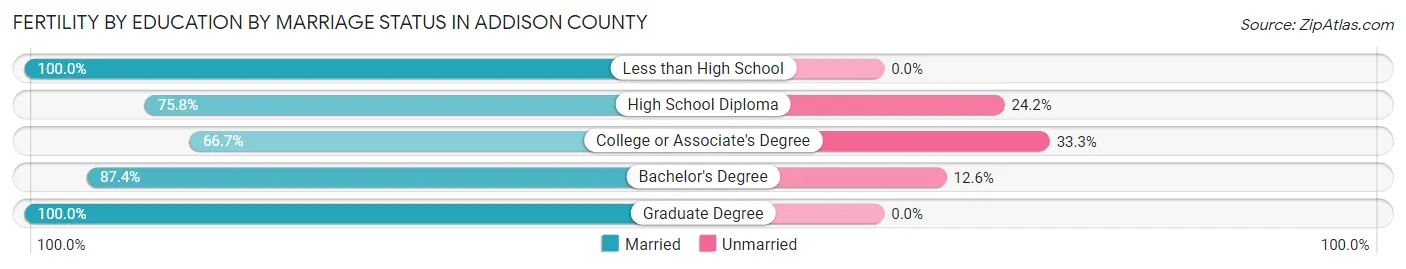
10.1% of women with births in Addison County are unmarried. Women with the educational attainment of less than high school are most likely to be married with 100.0% of them married at childbirth, while women with the educational attainment of college or associate's degree are least likely to be married with 33.3% of them unmarried at childbirth.
| Educational Attainment | Married | Unmarried |
| Less than High School | 54 (100.0%) | 0 (0.0%) |
| High School Diploma | 25 (75.8%) | 8 (24.2%) |
| College or Associate's Degree | 8 (66.7%) | 4 (33.3%) |
| Bachelor's Degree | 153 (87.4%) | 22 (12.6%) |
| Graduate Degree | 63 (100.0%) | 0 (0.0%) |
| Total | 303 (89.9%) | 34 (10.1%) |
Income in Addison County
Income Overview in Addison County
Per Capita Income in Addison County is $42,271, while median incomes of families and households are $104,167 and $85,870 respectively.
| Characteristic | Number | Measure |
| Per Capita Income | 37,434 | $42,271 |
| Median Family Income | 9,084 | $104,167 |
| Mean Family Income | 9,084 | $120,812 |
| Median Household Income | 14,416 | $85,870 |
| Mean Household Income | 14,416 | $103,237 |
| Income Deficit | 9,084 | $10,367 |
| Wage / Income Gap (%) | 37,434 | 25.41% |
| Wage / Income Gap ($) | 37,434 | 74.59¢ per $1 |
| Gini / Inequality Index | 37,434 | 0.41 |
Earnings by Sex in Addison County
Average Earnings in Addison County are $38,560, $45,234 for men and $33,740 for women, a difference of 25.4%.
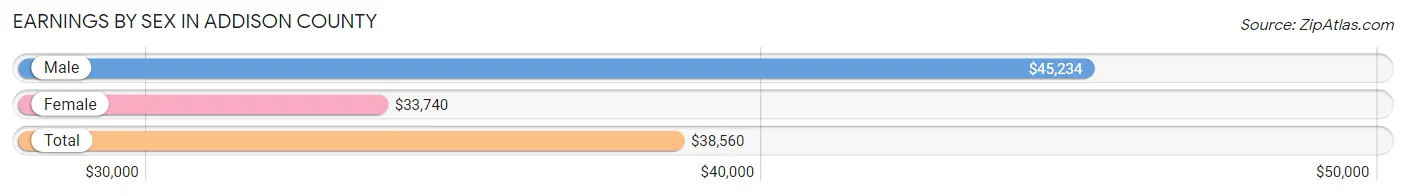
| Sex | Number | Average Earnings |
| Male | 12,001 (51.7%) | $45,234 |
| Female | 11,198 (48.3%) | $33,740 |
| Total | 23,199 (100.0%) | $38,560 |
Earnings by Sex by Income Bracket in Addison County
The most common earnings brackets in Addison County are $100,000+ for men (1,786 | 14.9%) and $2,499 or less for women (1,087 | 9.7%).
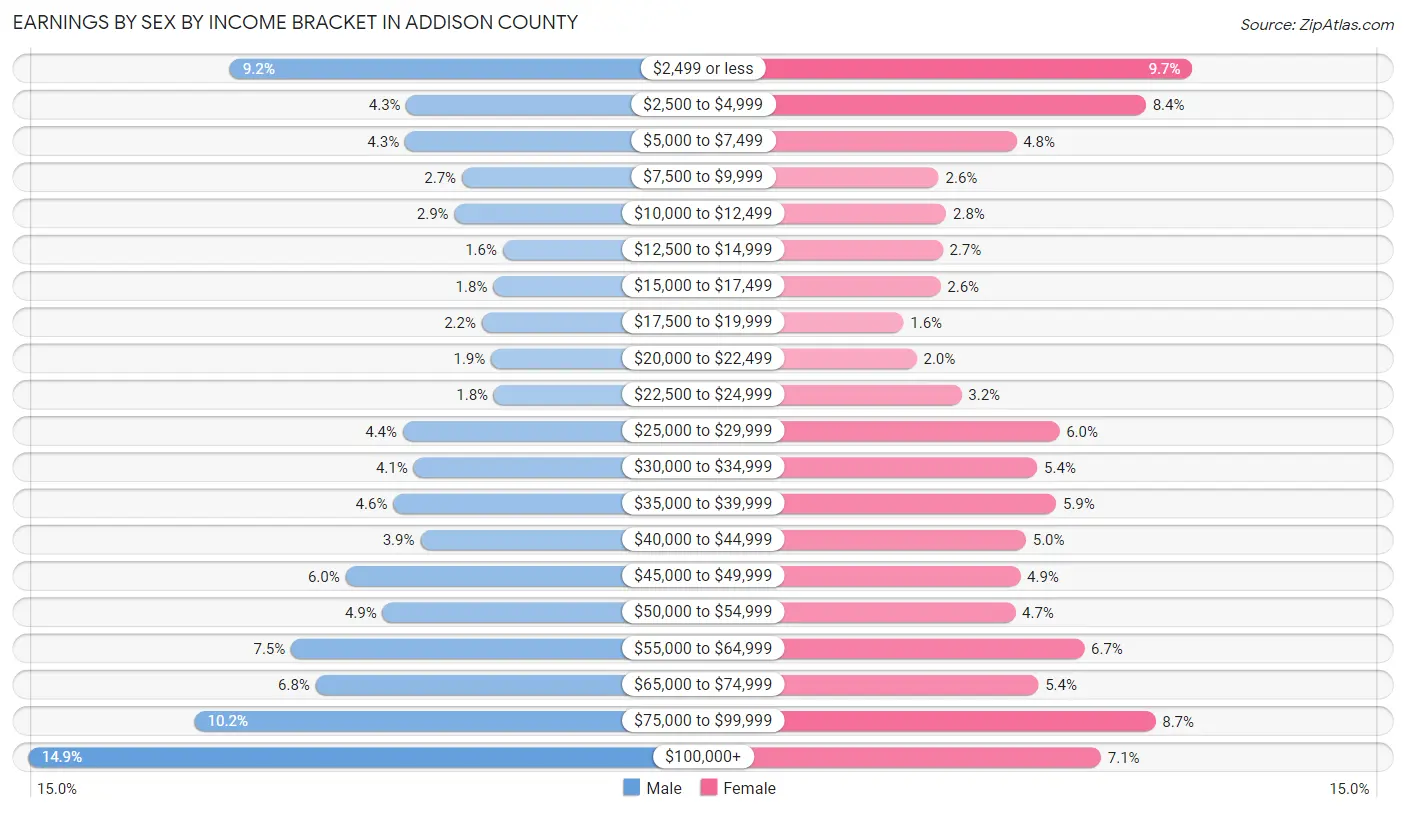
| Income | Male | Female |
| $2,499 or less | 1,108 (9.2%) | 1,087 (9.7%) |
| $2,500 to $4,999 | 513 (4.3%) | 941 (8.4%) |
| $5,000 to $7,499 | 517 (4.3%) | 533 (4.8%) |
| $7,500 to $9,999 | 325 (2.7%) | 289 (2.6%) |
| $10,000 to $12,499 | 351 (2.9%) | 312 (2.8%) |
| $12,500 to $14,999 | 187 (1.6%) | 301 (2.7%) |
| $15,000 to $17,499 | 220 (1.8%) | 294 (2.6%) |
| $17,500 to $19,999 | 258 (2.1%) | 178 (1.6%) |
| $20,000 to $22,499 | 227 (1.9%) | 219 (2.0%) |
| $22,500 to $24,999 | 217 (1.8%) | 361 (3.2%) |
| $25,000 to $29,999 | 524 (4.4%) | 668 (6.0%) |
| $30,000 to $34,999 | 488 (4.1%) | 599 (5.3%) |
| $35,000 to $39,999 | 557 (4.6%) | 659 (5.9%) |
| $40,000 to $44,999 | 466 (3.9%) | 563 (5.0%) |
| $45,000 to $49,999 | 718 (6.0%) | 545 (4.9%) |
| $50,000 to $54,999 | 593 (4.9%) | 530 (4.7%) |
| $55,000 to $64,999 | 901 (7.5%) | 747 (6.7%) |
| $65,000 to $74,999 | 819 (6.8%) | 602 (5.4%) |
| $75,000 to $99,999 | 1,226 (10.2%) | 971 (8.7%) |
| $100,000+ | 1,786 (14.9%) | 799 (7.1%) |
| Total | 12,001 (100.0%) | 11,198 (100.0%) |
Earnings by Sex by Educational Attainment in Addison County
Average earnings in Addison County are $53,552 for men and $43,445 for women, a difference of 18.9%. Men with an educational attainment of graduate degree enjoy the highest average annual earnings of $84,591, while those with less than high school education earn the least with $40,000. Women with an educational attainment of graduate degree earn the most with the average annual earnings of $66,019, while those with less than high school education have the smallest earnings of $27,880.
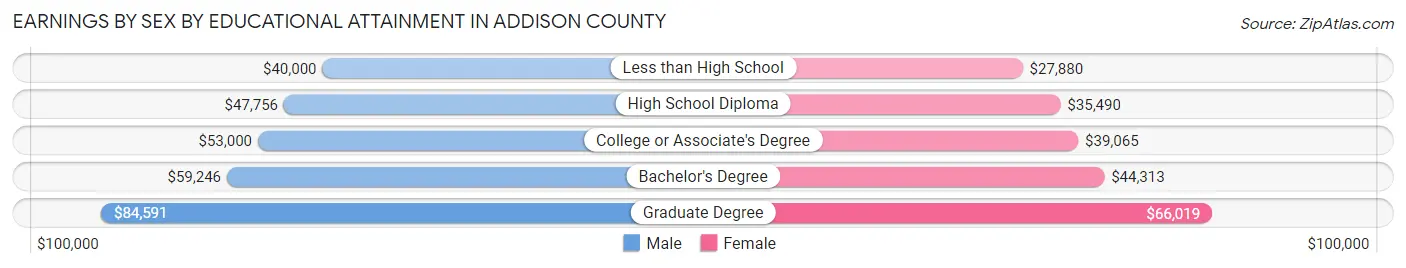
| Educational Attainment | Male Income | Female Income |
| Less than High School | $40,000 | $27,880 |
| High School Diploma | $47,756 | $35,490 |
| College or Associate's Degree | $53,000 | $39,065 |
| Bachelor's Degree | $59,246 | $44,313 |
| Graduate Degree | $84,591 | $66,019 |
| Total | $53,552 | $43,445 |
Family Income in Addison County
Family Income Brackets in Addison County
According to the Addison County family income data, there are 2,316 families falling into the $100,000 to $149,999 income range, which is the most common income bracket and makes up 25.5% of all families. Conversely, the $10,000 to $14,999 income bracket is the least frequent group with only 100 families (1.1%) belonging to this category.
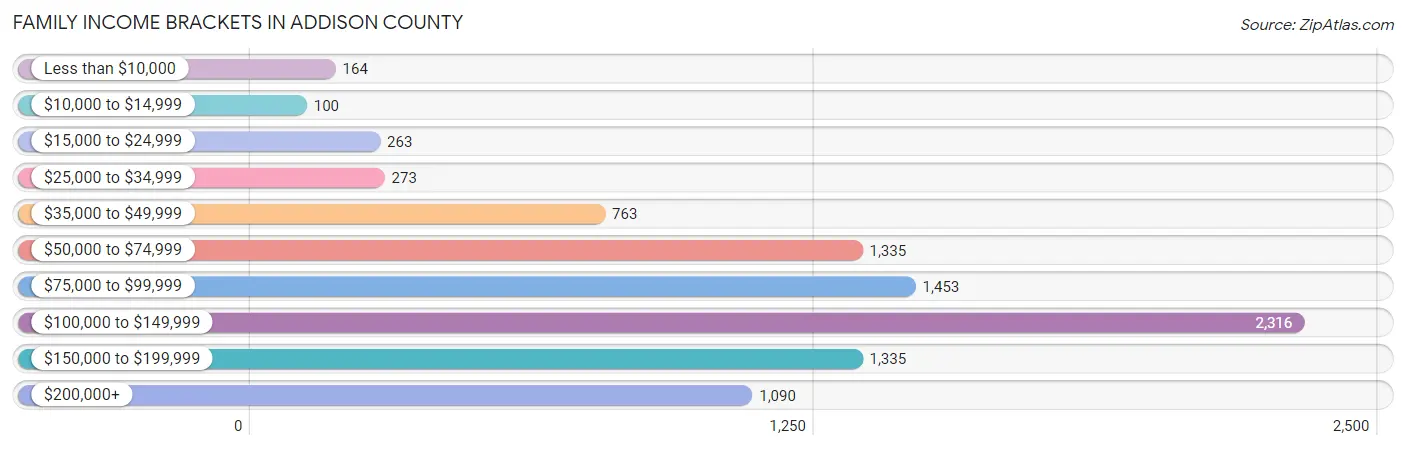
| Income Bracket | # Families | % Families |
| Less than $10,000 | 164 | 1.8% |
| $10,000 to $14,999 | 100 | 1.1% |
| $15,000 to $24,999 | 263 | 2.9% |
| $25,000 to $34,999 | 273 | 3.0% |
| $35,000 to $49,999 | 763 | 8.4% |
| $50,000 to $74,999 | 1,335 | 14.7% |
| $75,000 to $99,999 | 1,453 | 16.0% |
| $100,000 to $149,999 | 2,316 | 25.5% |
| $150,000 to $199,999 | 1,335 | 14.7% |
| $200,000+ | 1,090 | 12.0% |
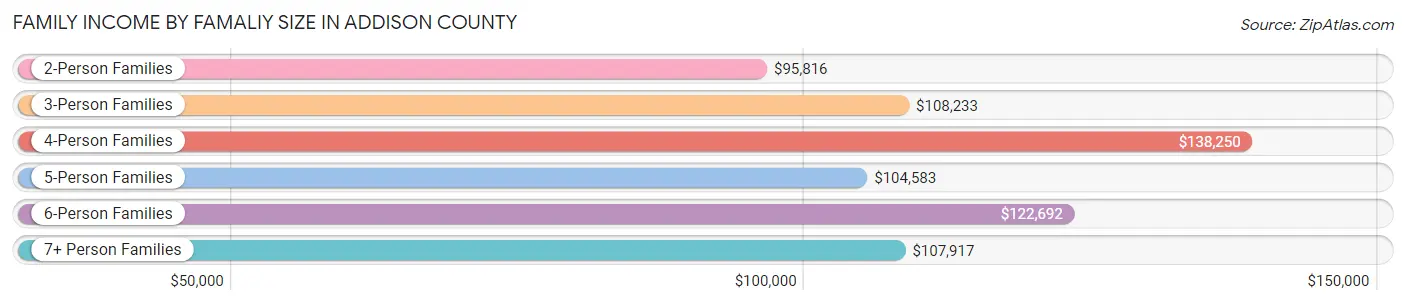
Family Income by Famaliy Size in Addison County
4-person families (1,205 | 13.3%) account for the highest median family income in Addison County with $138,250 per family, while 2-person families (5,421 | 59.7%) have the highest median income of $47,908 per family member.
| Income Bracket | # Families | Median Income |
| 2-Person Families | 5,421 (59.7%) | $95,816 |
| 3-Person Families | 1,801 (19.8%) | $108,233 |
| 4-Person Families | 1,205 (13.3%) | $138,250 |
| 5-Person Families | 469 (5.2%) | $104,583 |
| 6-Person Families | 142 (1.6%) | $122,692 |
| 7+ Person Families | 46 (0.5%) | $107,917 |
| Total | 9,084 (100.0%) | $104,167 |
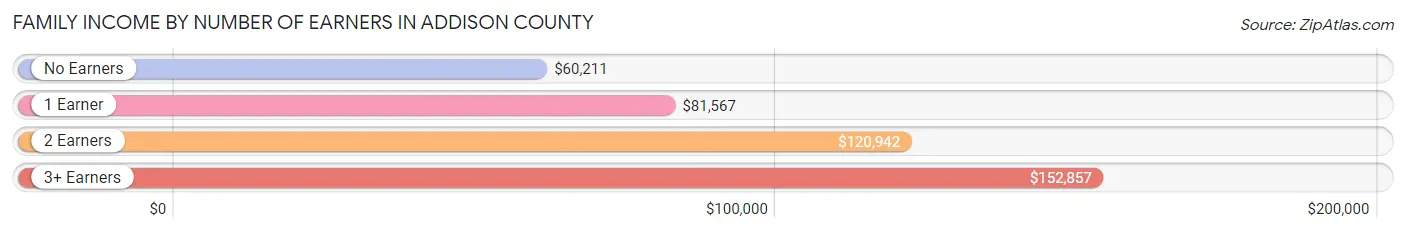
Family Income by Number of Earners in Addison County
The median family income in Addison County is $104,167, with families comprising 3+ earners (902) having the highest median family income of $152,857, while families with no earners (1,364) have the lowest median family income of $60,211, accounting for 9.9% and 15.0% of families, respectively.
| Number of Earners | # Families | Median Income |
| No Earners | 1,364 (15.0%) | $60,211 |
| 1 Earner | 2,410 (26.5%) | $81,567 |
| 2 Earners | 4,408 (48.5%) | $120,942 |
| 3+ Earners | 902 (9.9%) | $152,857 |
| Total | 9,084 (100.0%) | $104,167 |
Household Income in Addison County
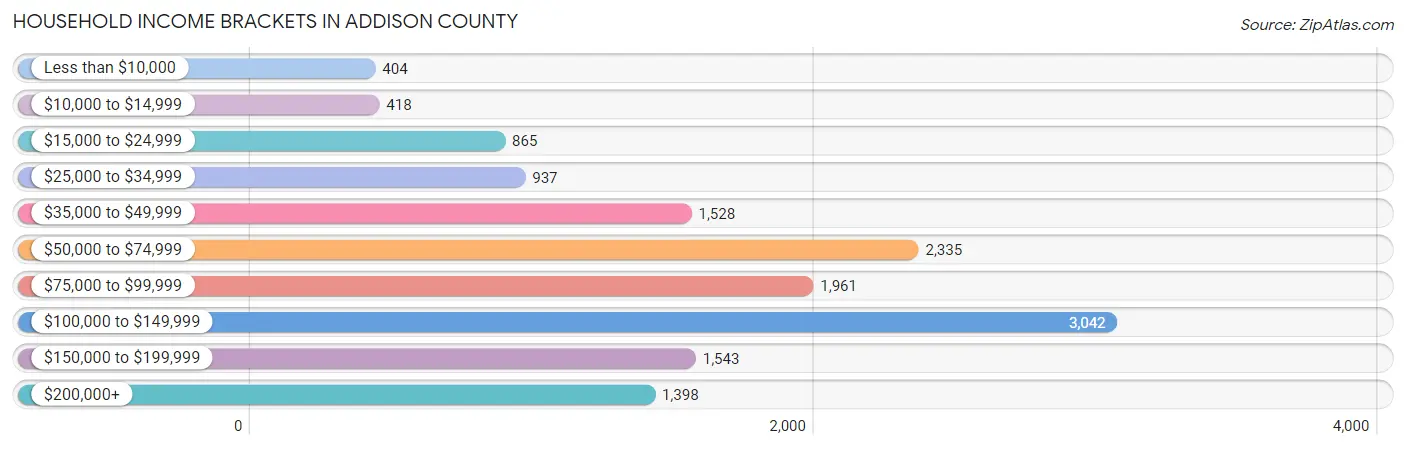
Household Income Brackets in Addison County
With 3,042 households falling in the category, the $100,000 to $149,999 income range is the most frequent in Addison County, accounting for 21.1% of all households. In contrast, only 404 households (2.8%) fall into the less than $10,000 income bracket, making it the least populous group.
| Income Bracket | # Households | % Households |
| Less than $10,000 | 404 | 2.8% |
| $10,000 to $14,999 | 418 | 2.9% |
| $15,000 to $24,999 | 865 | 6.0% |
| $25,000 to $34,999 | 937 | 6.5% |
| $35,000 to $49,999 | 1,528 | 10.6% |
| $50,000 to $74,999 | 2,335 | 16.2% |
| $75,000 to $99,999 | 1,961 | 13.6% |
| $100,000 to $149,999 | 3,042 | 21.1% |
| $150,000 to $199,999 | 1,543 | 10.7% |
| $200,000+ | 1,398 | 9.7% |
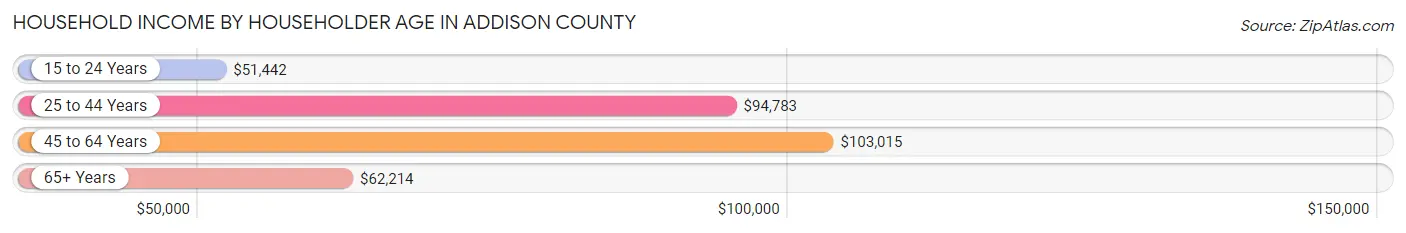
Household Income by Householder Age in Addison County
The median household income in Addison County is $85,870, with the highest median household income of $103,015 found in the 45 to 64 years age bracket for the primary householder. A total of 5,550 households (38.5%) fall into this category. Meanwhile, the 15 to 24 years age bracket for the primary householder has the lowest median household income of $51,442, with 428 households (3.0%) in this group.
| Income Bracket | # Households | Median Income |
| 15 to 24 Years | 428 (3.0%) | $51,442 |
| 25 to 44 Years | 3,590 (24.9%) | $94,783 |
| 45 to 64 Years | 5,550 (38.5%) | $103,015 |
| 65+ Years | 4,848 (33.6%) | $62,214 |
| Total | 14,416 (100.0%) | $85,870 |
Poverty in Addison County
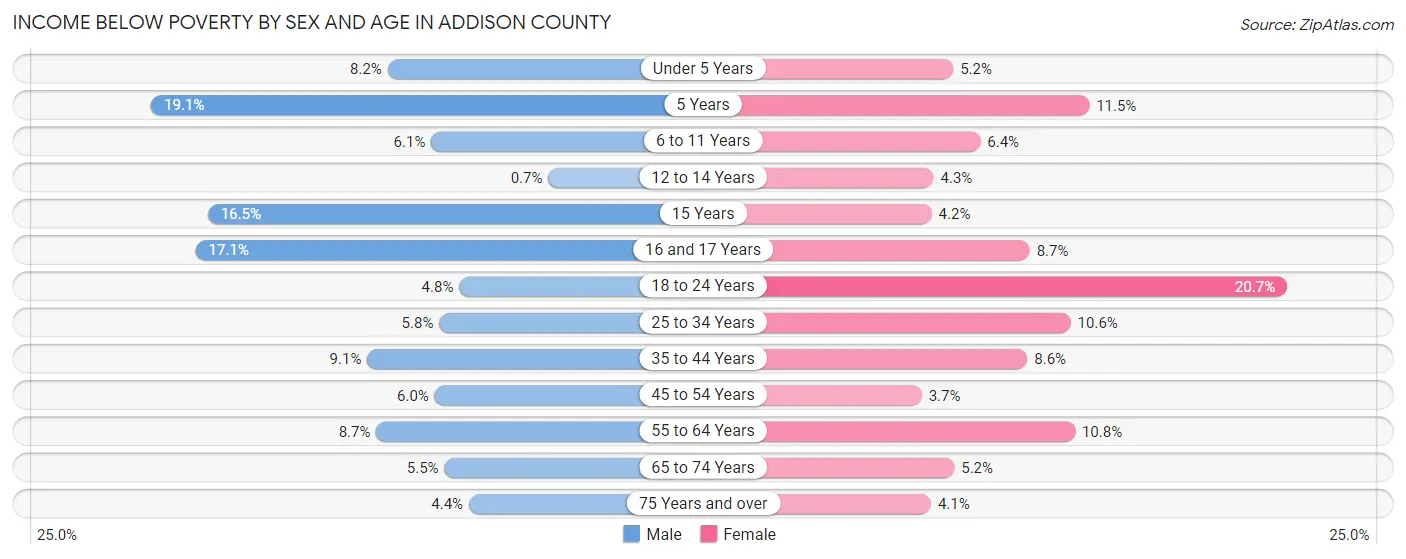
Income Below Poverty by Sex and Age in Addison County
With 7.0% poverty level for males and 8.1% for females among the residents of Addison County, 5 year old males and 18 to 24 year old females are the most vulnerable to poverty, with 35 males (19.1%) and 251 females (20.7%) in their respective age groups living below the poverty level.
| Age Bracket | Male | Female |
| Under 5 Years | 59 (8.2%) | 37 (5.2%) |
| 5 Years | 35 (19.1%) | 14 (11.5%) |
| 6 to 11 Years | 73 (6.1%) | 61 (6.4%) |
| 12 to 14 Years | 3 (0.7%) | 21 (4.3%) |
| 15 Years | 34 (16.5%) | 10 (4.2%) |
| 16 and 17 Years | 65 (17.1%) | 26 (8.7%) |
| 18 to 24 Years | 67 (4.8%) | 251 (20.7%) |
| 25 to 34 Years | 109 (5.8%) | 191 (10.6%) |
| 35 to 44 Years | 189 (9.1%) | 172 (8.6%) |
| 45 to 54 Years | 138 (6.0%) | 85 (3.7%) |
| 55 to 64 Years | 245 (8.7%) | 305 (10.8%) |
| 65 to 74 Years | 134 (5.5%) | 126 (5.2%) |
| 75 Years and over | 60 (4.4%) | 67 (4.1%) |
| Total | 1,211 (7.0%) | 1,366 (8.1%) |
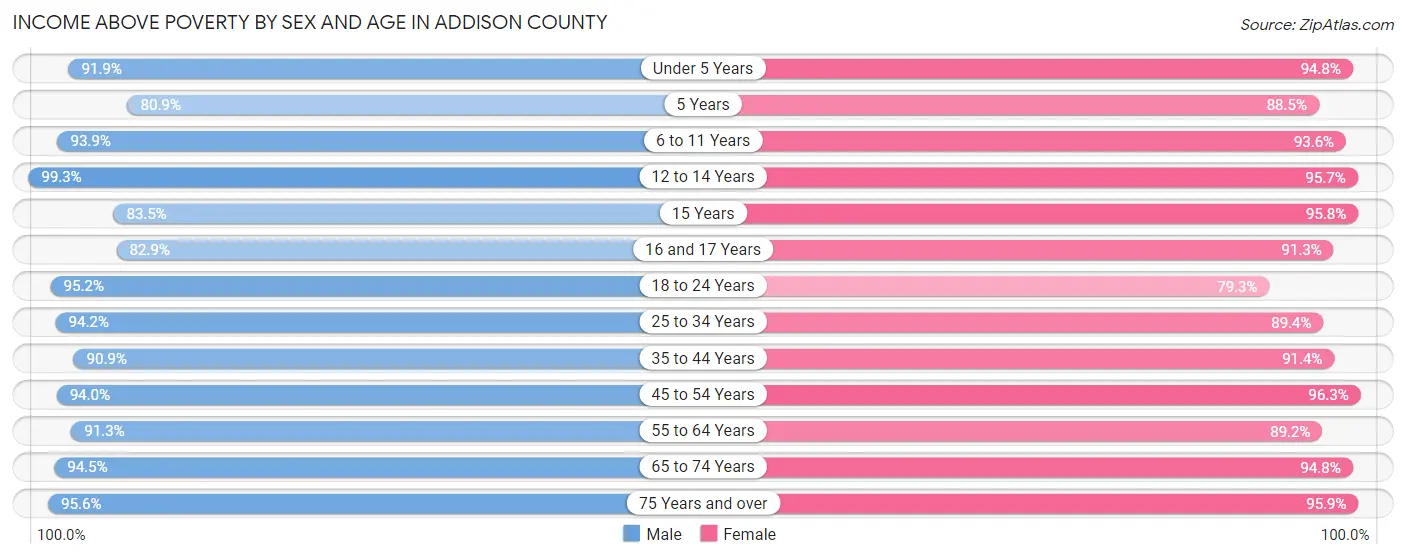
Income Above Poverty by Sex and Age in Addison County
According to the poverty statistics in Addison County, males aged 12 to 14 years and females aged 45 to 54 years are the age groups that are most secure financially, with 99.3% of males and 96.3% of females in these age groups living above the poverty line.
| Age Bracket | Male | Female |
| Under 5 Years | 665 (91.8%) | 678 (94.8%) |
| 5 Years | 148 (80.9%) | 108 (88.5%) |
| 6 to 11 Years | 1,118 (93.9%) | 888 (93.6%) |
| 12 to 14 Years | 427 (99.3%) | 472 (95.7%) |
| 15 Years | 172 (83.5%) | 230 (95.8%) |
| 16 and 17 Years | 316 (82.9%) | 272 (91.3%) |
| 18 to 24 Years | 1,319 (95.2%) | 964 (79.3%) |
| 25 to 34 Years | 1,783 (94.2%) | 1,607 (89.4%) |
| 35 to 44 Years | 1,889 (90.9%) | 1,826 (91.4%) |
| 45 to 54 Years | 2,174 (94.0%) | 2,205 (96.3%) |
| 55 to 64 Years | 2,577 (91.3%) | 2,513 (89.2%) |
| 65 to 74 Years | 2,294 (94.5%) | 2,288 (94.8%) |
| 75 Years and over | 1,311 (95.6%) | 1,553 (95.9%) |
| Total | 16,193 (93.0%) | 15,604 (91.9%) |
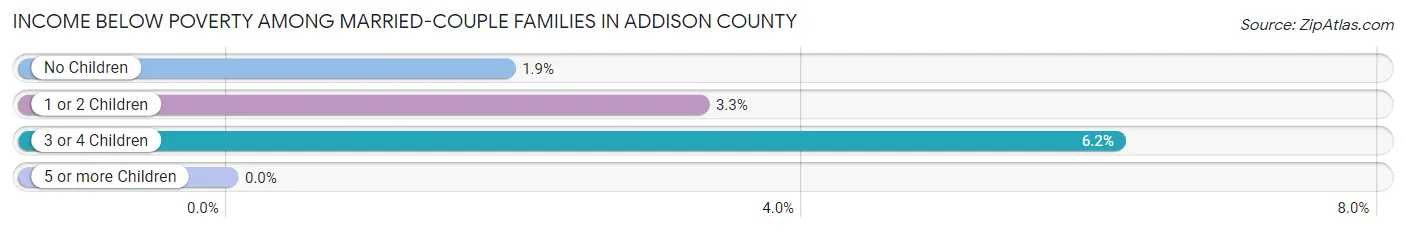
Income Below Poverty Among Married-Couple Families in Addison County
The poverty statistics for married-couple families in Addison County show that 2.5% or 190 of the total 7,533 families live below the poverty line. Families with 3 or 4 children have the highest poverty rate of 6.2%, comprising of 28 families. On the other hand, families with 5 or more children have the lowest poverty rate of 0.0%, which includes 0 families.
| Children | Above Poverty | Below Poverty |
| No Children | 5,078 (98.1%) | 100 (1.9%) |
| 1 or 2 Children | 1,827 (96.7%) | 62 (3.3%) |
| 3 or 4 Children | 425 (93.8%) | 28 (6.2%) |
| 5 or more Children | 13 (100.0%) | 0 (0.0%) |
| Total | 7,343 (97.5%) | 190 (2.5%) |
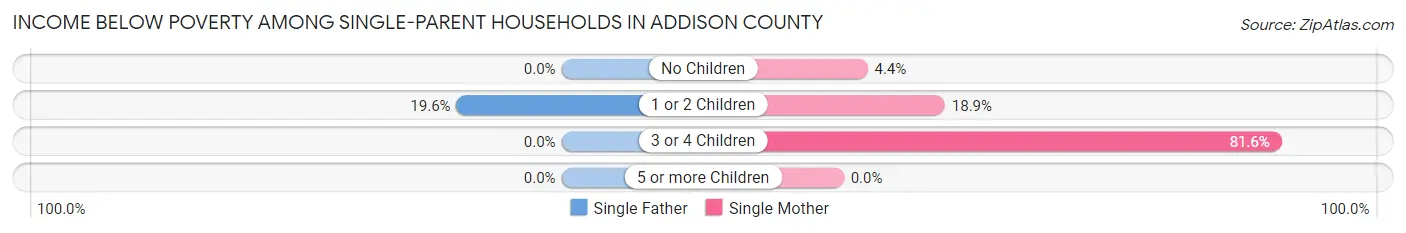
Income Below Poverty Among Single-Parent Households in Addison County
According to the poverty data in Addison County, 8.7% or 45 single-father households and 15.5% or 160 single-mother households are living below the poverty line. Among single-father households, those with 1 or 2 children have the highest poverty rate, with 45 households (19.6%) experiencing poverty. Likewise, among single-mother households, those with 3 or 4 children have the highest poverty rate, with 31 households (81.6%) falling below the poverty line.
| Children | Single Father | Single Mother |
| No Children | 0 (0.0%) | 18 (4.4%) |
| 1 or 2 Children | 45 (19.6%) | 111 (18.9%) |
| 3 or 4 Children | 0 (0.0%) | 31 (81.6%) |
| 5 or more Children | 0 (0.0%) | 0 (0.0%) |
| Total | 45 (8.7%) | 160 (15.5%) |
Income Below Poverty Among Married-Couple vs Single-Parent Households in Addison County
The poverty data for Addison County shows that 190 of the married-couple family households (2.5%) and 205 of the single-parent households (13.2%) are living below the poverty level. Within the married-couple family households, those with 3 or 4 children have the highest poverty rate, with 28 households (6.2%) falling below the poverty line. Among the single-parent households, those with 3 or 4 children have the highest poverty rate, with 31 household (55.4%) living below poverty.
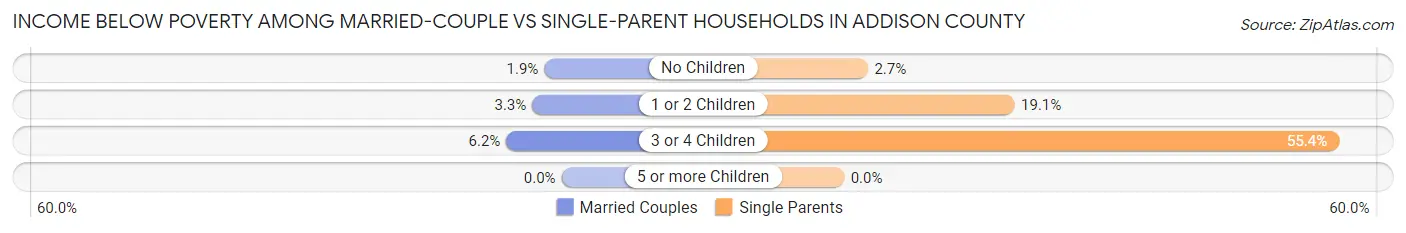
| Children | Married-Couple Families | Single-Parent Households |
| No Children | 100 (1.9%) | 18 (2.7%) |
| 1 or 2 Children | 62 (3.3%) | 156 (19.1%) |
| 3 or 4 Children | 28 (6.2%) | 31 (55.4%) |
| 5 or more Children | 0 (0.0%) | 0 (0.0%) |
| Total | 190 (2.5%) | 205 (13.2%) |
Employment Characteristics in Addison County
Employment by Class of Employer in Addison County
Among the 19,341 employed individuals in Addison County, private company employees (10,387 | 53.7%), not-for-profit organizations (3,928 | 20.3%), and self-employed (not incorporated) (1,559 | 8.1%) make up the most common classes of employment.
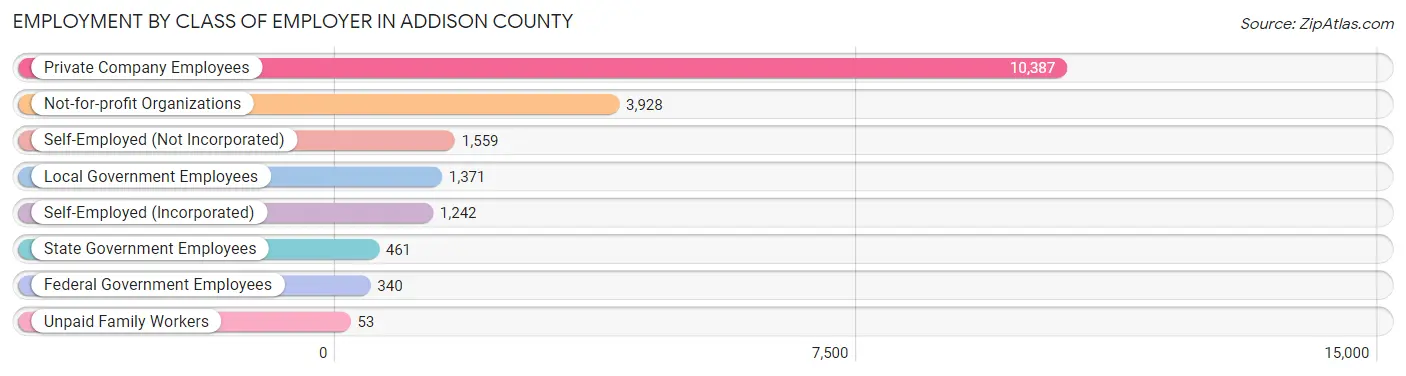
| Employer Class | # Employees | % Employees |
| Private Company Employees | 10,387 | 53.7% |
| Self-Employed (Incorporated) | 1,242 | 6.4% |
| Self-Employed (Not Incorporated) | 1,559 | 8.1% |
| Not-for-profit Organizations | 3,928 | 20.3% |
| Local Government Employees | 1,371 | 7.1% |
| State Government Employees | 461 | 2.4% |
| Federal Government Employees | 340 | 1.8% |
| Unpaid Family Workers | 53 | 0.3% |
| Total | 19,341 | 100.0% |
Employment Status by Age in Addison County
According to the labor force statistics for Addison County, out of the total population over 16 years of age (32,059), 64.5% or 20,678 individuals are in the labor force, with 4.1% or 848 of them unemployed. The age group with the highest labor force participation rate is 25 to 29 years, with 90.9% or 1,583 individuals in the labor force. Within the labor force, the 16 to 19 years age range has the highest percentage of unemployed individuals, with 11.6% or 127 of them being unemployed.
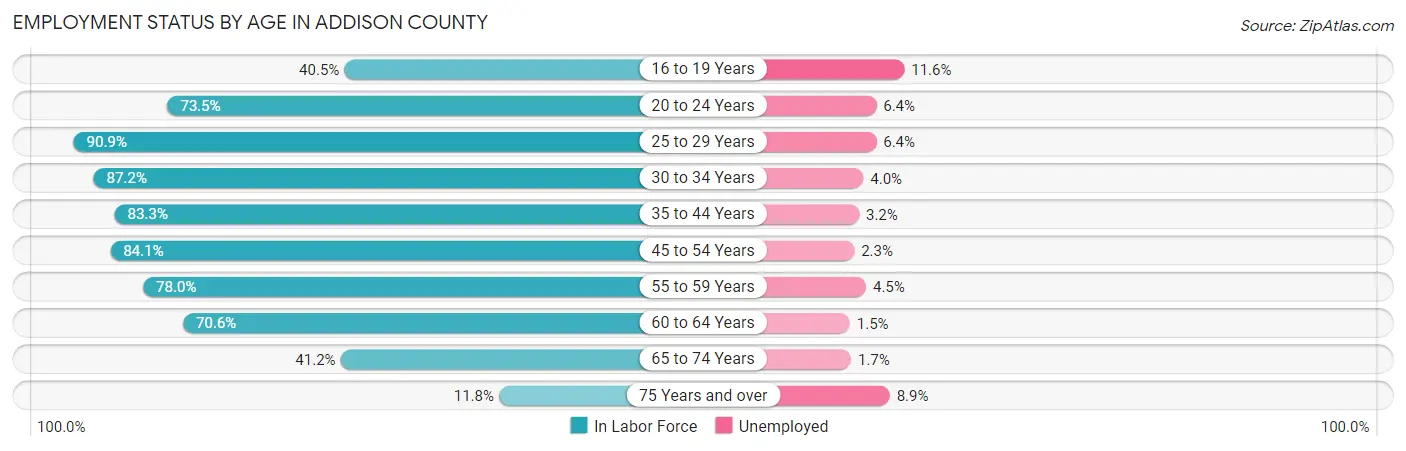
| Age Bracket | In Labor Force | Unemployed |
| 16 to 19 Years | 1,098 (40.5%) | 127 (11.6%) |
| 20 to 24 Years | 2,401 (73.5%) | 154 (6.4%) |
| 25 to 29 Years | 1,583 (90.9%) | 101 (6.4%) |
| 30 to 34 Years | 1,713 (87.2%) | 69 (4.0%) |
| 35 to 44 Years | 3,397 (83.3%) | 109 (3.2%) |
| 45 to 54 Years | 3,872 (84.1%) | 89 (2.3%) |
| 55 to 59 Years | 2,242 (78.0%) | 101 (4.5%) |
| 60 to 64 Years | 1,981 (70.6%) | 30 (1.5%) |
| 65 to 74 Years | 2,011 (41.2%) | 34 (1.7%) |
| 75 Years and over | 369 (11.8%) | 33 (8.9%) |
| Total | 20,678 (64.5%) | 848 (4.1%) |
Employment Status by Educational Attainment in Addison County
According to labor force statistics for Addison County, 81.8% of individuals (14,780) out of the total population between 25 and 64 years of age (18,069) are in the labor force, with 3.4% or 503 of them being unemployed. The group with the highest labor force participation rate are those with the educational attainment of bachelor's degree or higher, with 87.7% or 6,397 individuals in the labor force. Within the labor force, individuals with less than high school education have the highest percentage of unemployment, with 8.4% or 51 of them being unemployed.
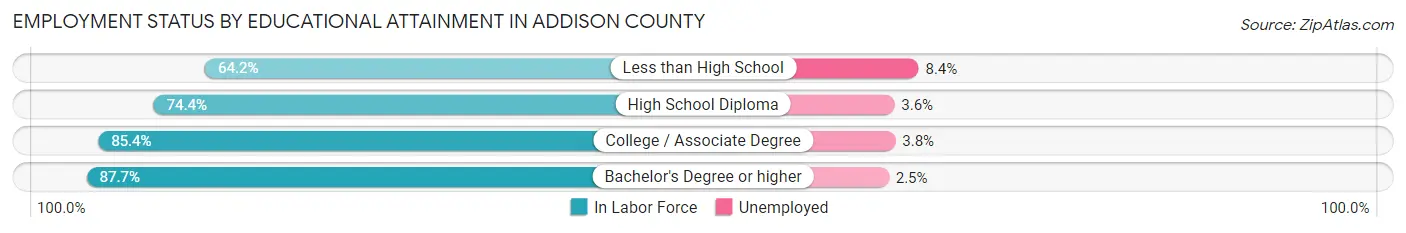
| Educational Attainment | In Labor Force | Unemployed |
| Less than High School | 607 (64.2%) | 79 (8.4%) |
| High School Diploma | 4,117 (74.4%) | 199 (3.6%) |
| College / Associate Degree | 3,669 (85.4%) | 163 (3.8%) |
| Bachelor's Degree or higher | 6,397 (87.7%) | 182 (2.5%) |
| Total | 14,780 (81.8%) | 614 (3.4%) |
Employment Occupations by Sex in Addison County
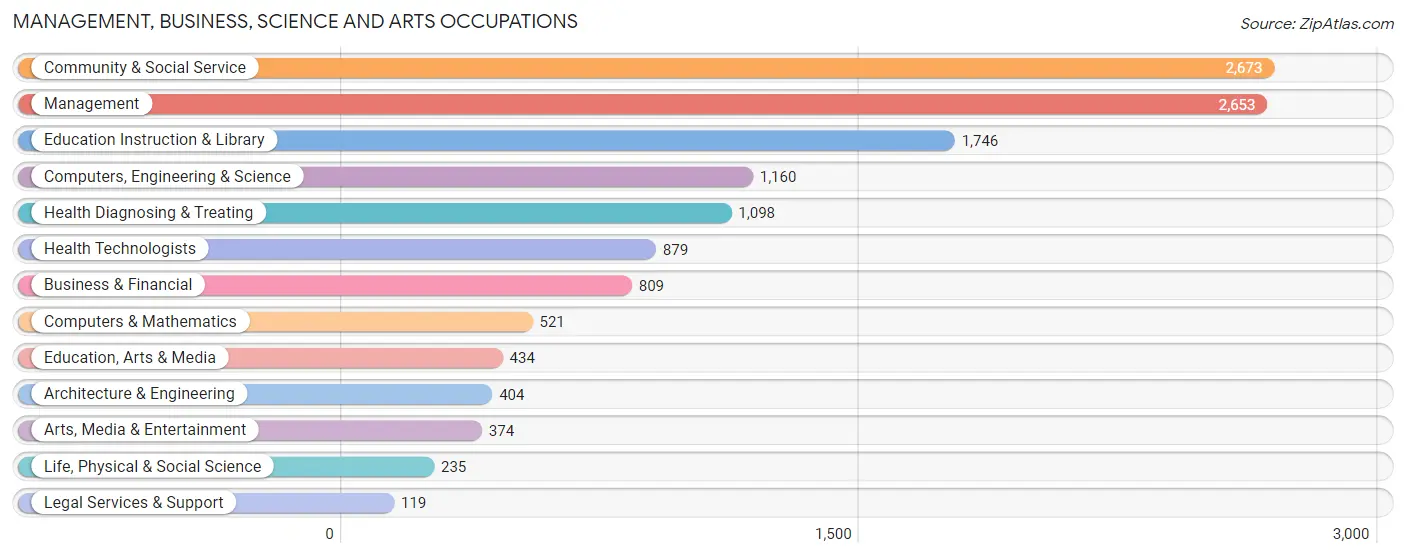
Management, Business, Science and Arts Occupations
The most common Management, Business, Science and Arts occupations in Addison County are Community & Social Service (2,673 | 13.5%), Management (2,653 | 13.4%), Education Instruction & Library (1,746 | 8.8%), Computers, Engineering & Science (1,160 | 5.9%), and Health Diagnosing & Treating (1,098 | 5.6%).
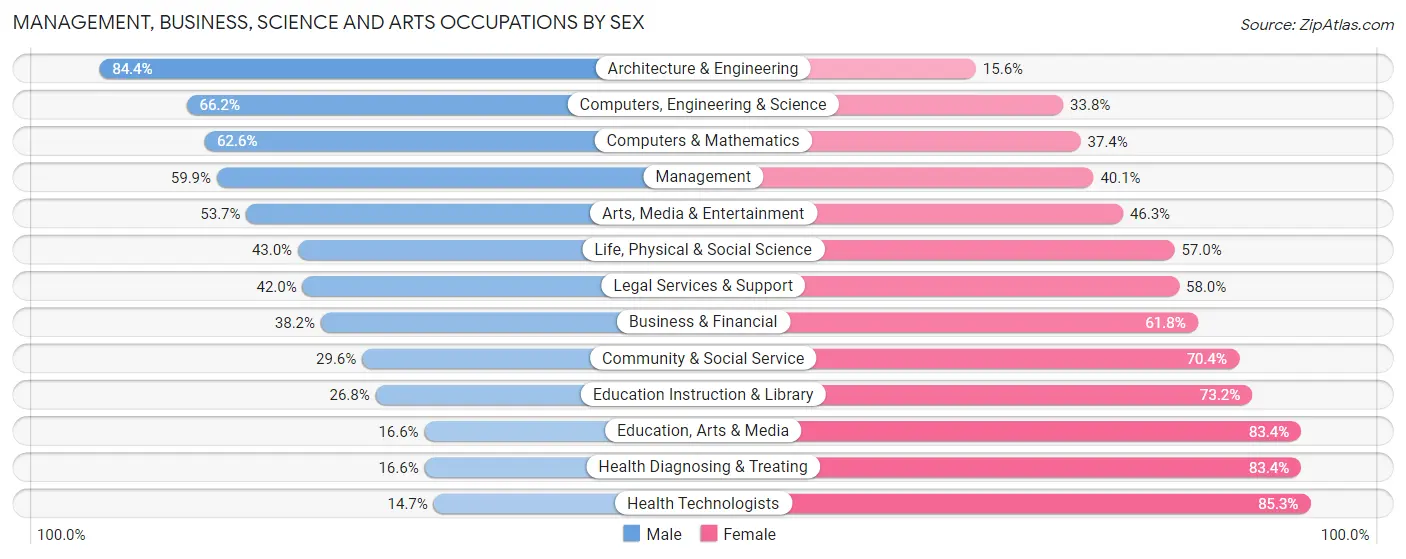
Management, Business, Science and Arts Occupations by Sex
Within the Management, Business, Science and Arts occupations in Addison County, the most male-oriented occupations are Architecture & Engineering (84.4%), Computers, Engineering & Science (66.2%), and Computers & Mathematics (62.6%), while the most female-oriented occupations are Health Technologists (85.3%), Health Diagnosing & Treating (83.4%), and Education, Arts & Media (83.4%).
| Occupation | Male | Female |
| Management | 1,589 (59.9%) | 1,064 (40.1%) |
| Business & Financial | 309 (38.2%) | 500 (61.8%) |
| Computers, Engineering & Science | 768 (66.2%) | 392 (33.8%) |
| Computers & Mathematics | 326 (62.6%) | 195 (37.4%) |
| Architecture & Engineering | 341 (84.4%) | 63 (15.6%) |
| Life, Physical & Social Science | 101 (43.0%) | 134 (57.0%) |
| Community & Social Service | 791 (29.6%) | 1,882 (70.4%) |
| Education, Arts & Media | 72 (16.6%) | 362 (83.4%) |
| Legal Services & Support | 50 (42.0%) | 69 (58.0%) |
| Education Instruction & Library | 468 (26.8%) | 1,278 (73.2%) |
| Arts, Media & Entertainment | 201 (53.7%) | 173 (46.3%) |
| Health Diagnosing & Treating | 182 (16.6%) | 916 (83.4%) |
| Health Technologists | 129 (14.7%) | 750 (85.3%) |
| Total (Category) | 3,639 (43.4%) | 4,754 (56.6%) |
| Total (Overall) | 10,128 (51.2%) | 9,660 (48.8%) |
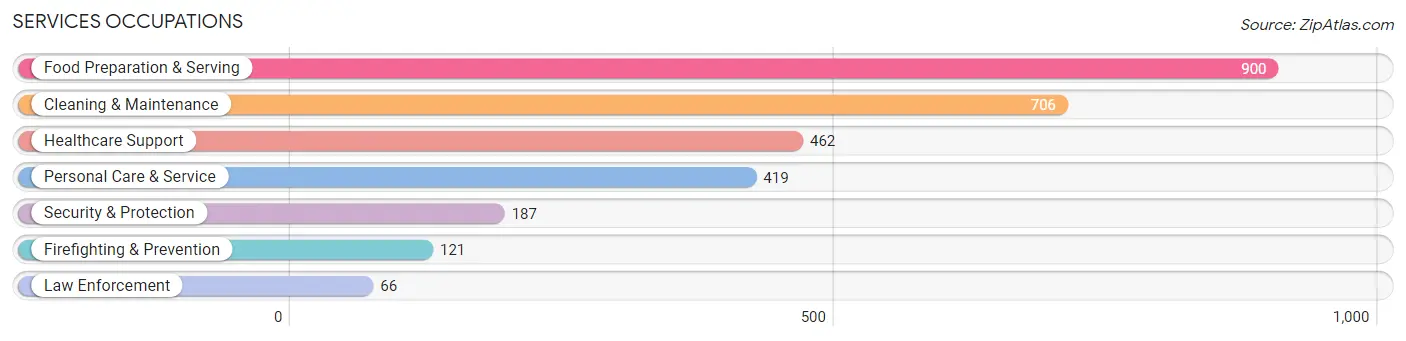
Services Occupations
The most common Services occupations in Addison County are Food Preparation & Serving (900 | 4.5%), Cleaning & Maintenance (706 | 3.6%), Healthcare Support (462 | 2.3%), Personal Care & Service (419 | 2.1%), and Security & Protection (187 | 0.9%).
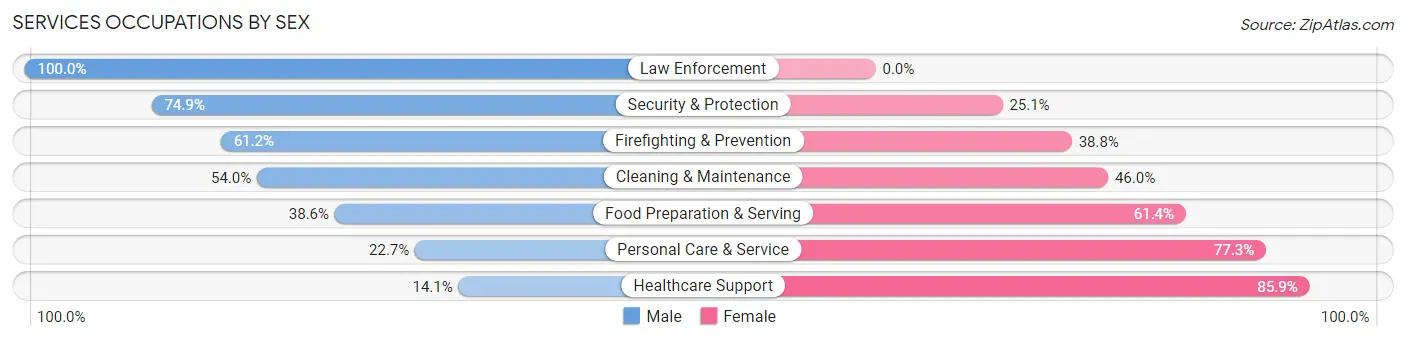
Services Occupations by Sex
Within the Services occupations in Addison County, the most male-oriented occupations are Law Enforcement (100.0%), Security & Protection (74.9%), and Firefighting & Prevention (61.2%), while the most female-oriented occupations are Healthcare Support (85.9%), Personal Care & Service (77.3%), and Food Preparation & Serving (61.4%).
| Occupation | Male | Female |
| Healthcare Support | 65 (14.1%) | 397 (85.9%) |
| Security & Protection | 140 (74.9%) | 47 (25.1%) |
| Firefighting & Prevention | 74 (61.2%) | 47 (38.8%) |
| Law Enforcement | 66 (100.0%) | 0 (0.0%) |
| Food Preparation & Serving | 347 (38.6%) | 553 (61.4%) |
| Cleaning & Maintenance | 381 (54.0%) | 325 (46.0%) |
| Personal Care & Service | 95 (22.7%) | 324 (77.3%) |
| Total (Category) | 1,028 (38.4%) | 1,646 (61.6%) |
| Total (Overall) | 10,128 (51.2%) | 9,660 (48.8%) |
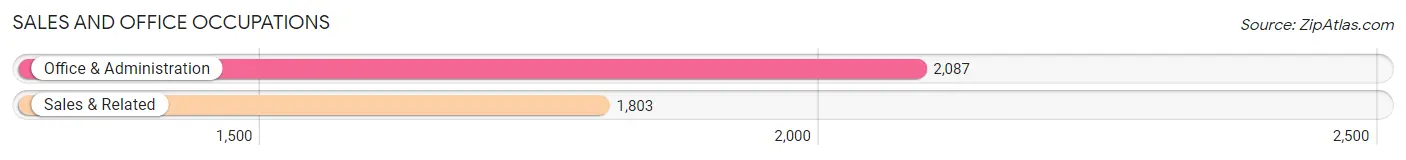
Sales and Office Occupations
The most common Sales and Office occupations in Addison County are Office & Administration (2,087 | 10.5%), and Sales & Related (1,803 | 9.1%).
Sales and Office Occupations by Sex
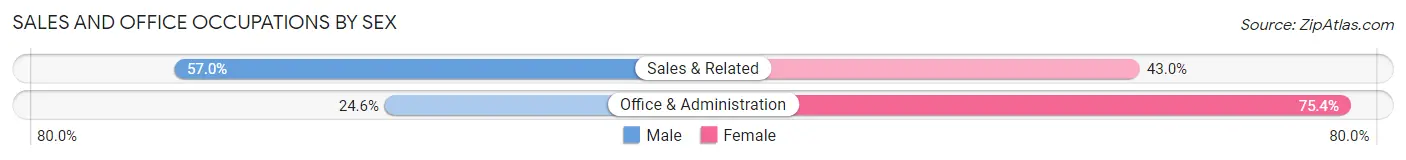
| Occupation | Male | Female |
| Sales & Related | 1,028 (57.0%) | 775 (43.0%) |
| Office & Administration | 513 (24.6%) | 1,574 (75.4%) |
| Total (Category) | 1,541 (39.6%) | 2,349 (60.4%) |
| Total (Overall) | 10,128 (51.2%) | 9,660 (48.8%) |
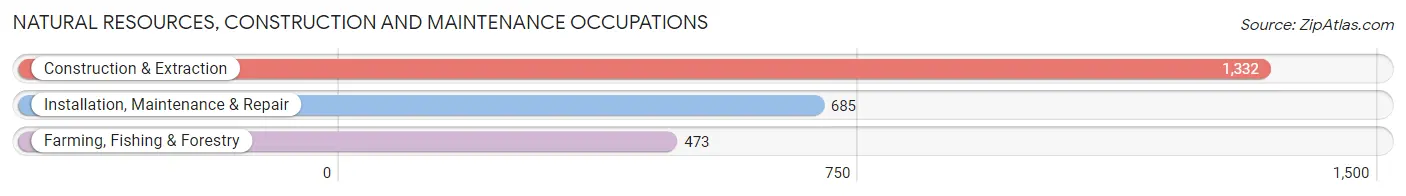
Natural Resources, Construction and Maintenance Occupations
The most common Natural Resources, Construction and Maintenance occupations in Addison County are Construction & Extraction (1,332 | 6.7%), Installation, Maintenance & Repair (685 | 3.5%), and Farming, Fishing & Forestry (473 | 2.4%).
Natural Resources, Construction and Maintenance Occupations by Sex
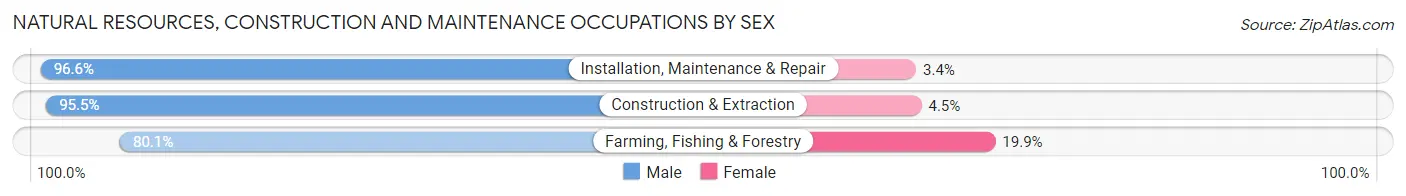
| Occupation | Male | Female |
| Farming, Fishing & Forestry | 379 (80.1%) | 94 (19.9%) |
| Construction & Extraction | 1,272 (95.5%) | 60 (4.5%) |
| Installation, Maintenance & Repair | 662 (96.6%) | 23 (3.4%) |
| Total (Category) | 2,313 (92.9%) | 177 (7.1%) |
| Total (Overall) | 10,128 (51.2%) | 9,660 (48.8%) |
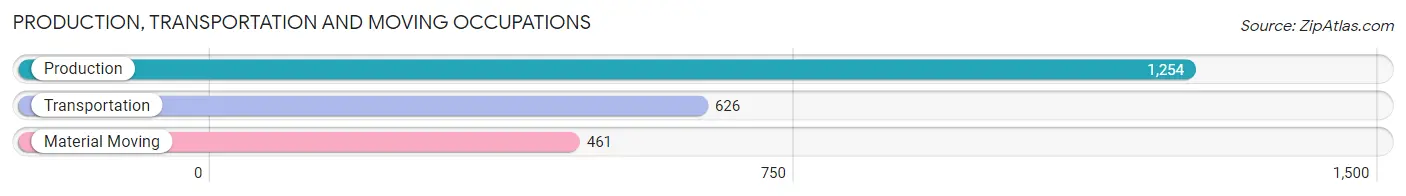
Production, Transportation and Moving Occupations
The most common Production, Transportation and Moving occupations in Addison County are Production (1,254 | 6.3%), Transportation (626 | 3.2%), and Material Moving (461 | 2.3%).
Production, Transportation and Moving Occupations by Sex
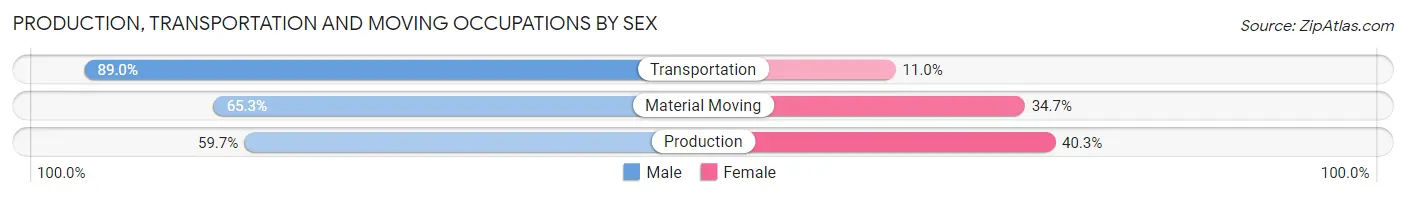
| Occupation | Male | Female |
| Production | 749 (59.7%) | 505 (40.3%) |
| Transportation | 557 (89.0%) | 69 (11.0%) |
| Material Moving | 301 (65.3%) | 160 (34.7%) |
| Total (Category) | 1,607 (68.6%) | 734 (31.4%) |
| Total (Overall) | 10,128 (51.2%) | 9,660 (48.8%) |
Employment Industries by Sex in Addison County
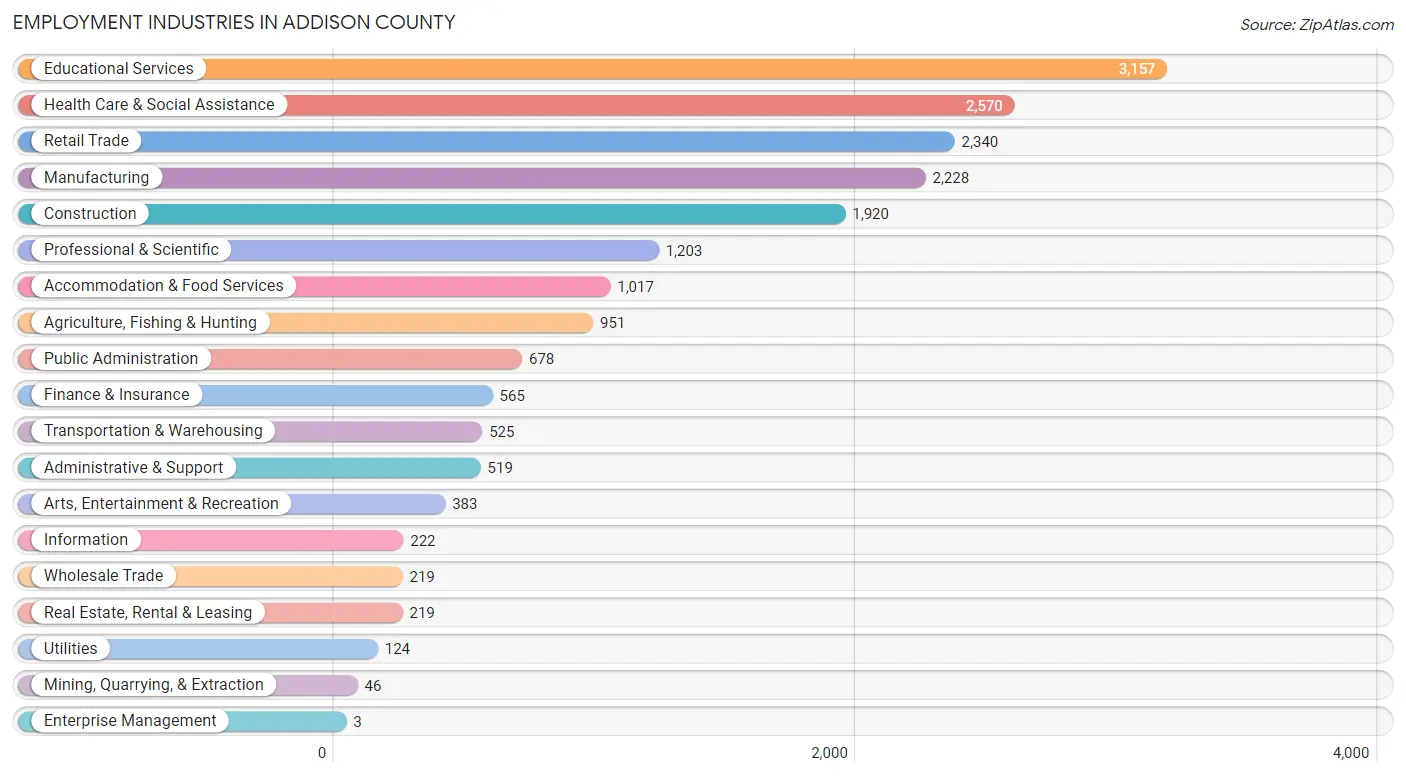
Employment Industries in Addison County
The major employment industries in Addison County include Educational Services (3,157 | 16.0%), Health Care & Social Assistance (2,570 | 13.0%), Retail Trade (2,340 | 11.8%), Manufacturing (2,228 | 11.3%), and Construction (1,920 | 9.7%).
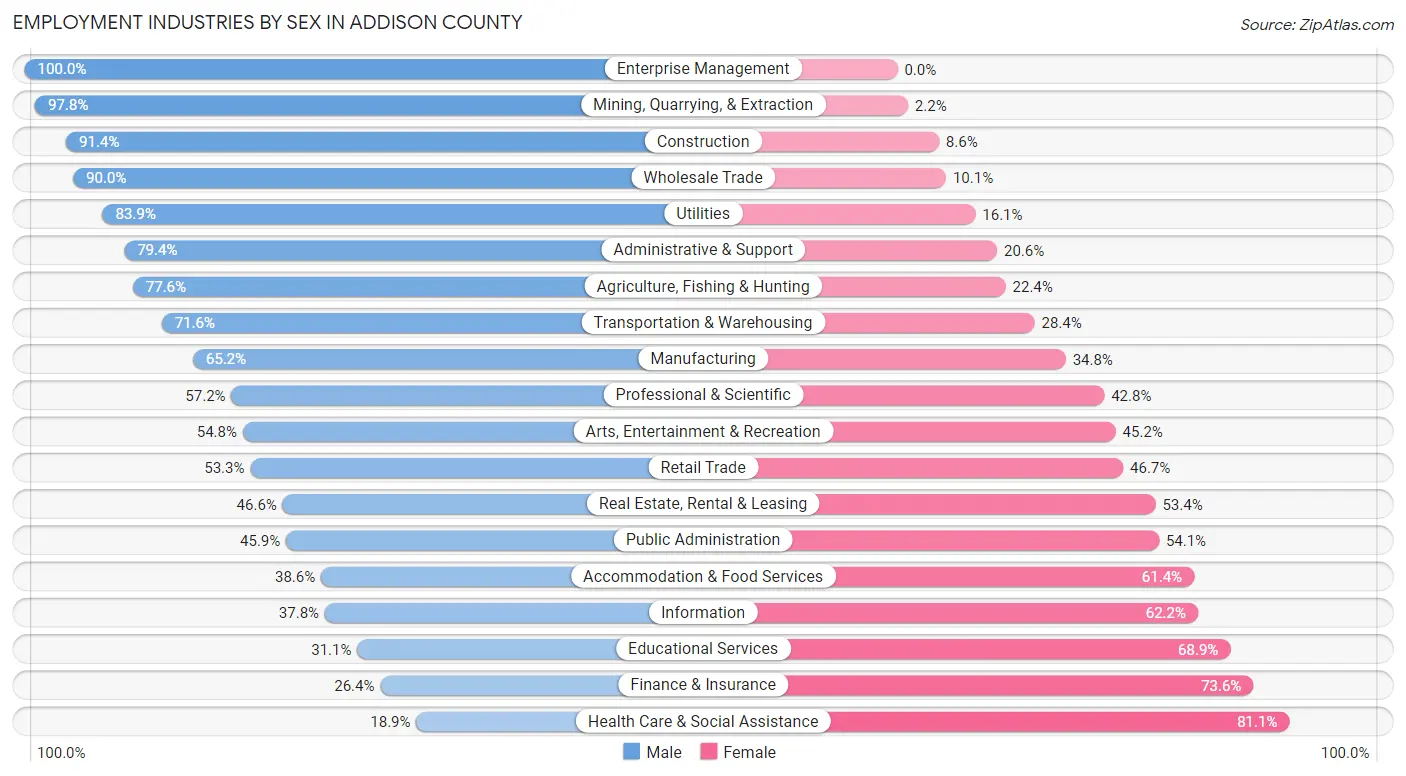
Employment Industries by Sex in Addison County
The Addison County industries that see more men than women are Enterprise Management (100.0%), Mining, Quarrying, & Extraction (97.8%), and Construction (91.4%), whereas the industries that tend to have a higher number of women are Health Care & Social Assistance (81.1%), Finance & Insurance (73.6%), and Educational Services (68.9%).
| Industry | Male | Female |
| Agriculture, Fishing & Hunting | 738 (77.6%) | 213 (22.4%) |
| Mining, Quarrying, & Extraction | 45 (97.8%) | 1 (2.2%) |
| Construction | 1,755 (91.4%) | 165 (8.6%) |
| Manufacturing | 1,452 (65.2%) | 776 (34.8%) |
| Wholesale Trade | 197 (89.9%) | 22 (10.1%) |
| Retail Trade | 1,247 (53.3%) | 1,093 (46.7%) |
| Transportation & Warehousing | 376 (71.6%) | 149 (28.4%) |
| Utilities | 104 (83.9%) | 20 (16.1%) |
| Information | 84 (37.8%) | 138 (62.2%) |
| Finance & Insurance | 149 (26.4%) | 416 (73.6%) |
| Real Estate, Rental & Leasing | 102 (46.6%) | 117 (53.4%) |
| Professional & Scientific | 688 (57.2%) | 515 (42.8%) |
| Enterprise Management | 3 (100.0%) | 0 (0.0%) |
| Administrative & Support | 412 (79.4%) | 107 (20.6%) |
| Educational Services | 983 (31.1%) | 2,174 (68.9%) |
| Health Care & Social Assistance | 486 (18.9%) | 2,084 (81.1%) |
| Arts, Entertainment & Recreation | 210 (54.8%) | 173 (45.2%) |
| Accommodation & Food Services | 393 (38.6%) | 624 (61.4%) |
| Public Administration | 311 (45.9%) | 367 (54.1%) |
| Total | 10,128 (51.2%) | 9,660 (48.8%) |
Education in Addison County
School Enrollment in Addison County
The most common levels of schooling among the 9,194 students in Addison County are college / undergraduate (3,844 | 41.8%), high school (1,505 | 16.4%), and elementary school (1,446 | 15.7%).
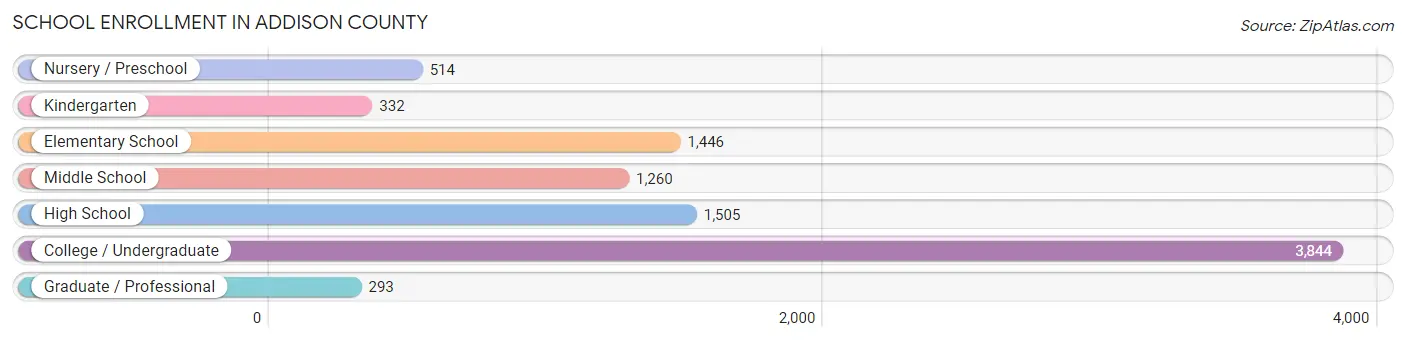
| School Level | # Students | % Students |
| Nursery / Preschool | 514 | 5.6% |
| Kindergarten | 332 | 3.6% |
| Elementary School | 1,446 | 15.7% |
| Middle School | 1,260 | 13.7% |
| High School | 1,505 | 16.4% |
| College / Undergraduate | 3,844 | 41.8% |
| Graduate / Professional | 293 | 3.2% |
| Total | 9,194 | 100.0% |
School Enrollment by Age by Funding Source in Addison County
Out of a total of 9,194 students who are enrolled in schools in Addison County, 3,816 (41.5%) attend a private institution, while the remaining 5,378 (58.5%) are enrolled in public schools. The age group of 20 to 24 year olds has the highest likelihood of being enrolled in private schools, with 1,506 (85.4% in the age bracket) enrolled. Conversely, the age group of 10 to 14 year olds has the lowest likelihood of being enrolled in a private school, with 1,466 (89.7% in the age bracket) attending a public institution.
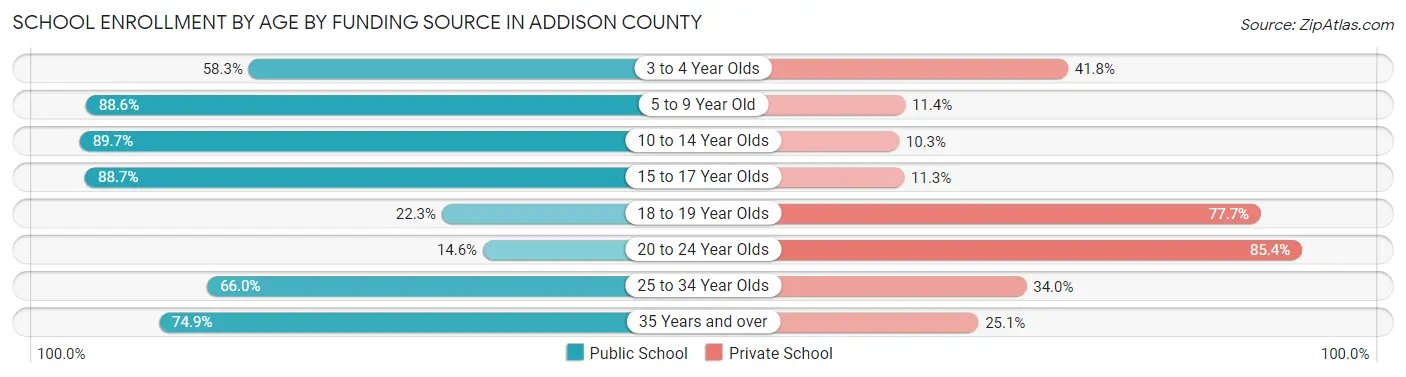
| Age Bracket | Public School | Private School |
| 3 to 4 Year Olds | 240 (58.3%) | 172 (41.7%) |
| 5 to 9 Year Old | 1,528 (88.6%) | 197 (11.4%) |
| 10 to 14 Year Olds | 1,466 (89.7%) | 168 (10.3%) |
| 15 to 17 Year Olds | 993 (88.7%) | 126 (11.3%) |
| 18 to 19 Year Olds | 419 (22.3%) | 1,462 (77.7%) |
| 20 to 24 Year Olds | 258 (14.6%) | 1,506 (85.4%) |
| 25 to 34 Year Olds | 161 (66.0%) | 83 (34.0%) |
| 35 Years and over | 311 (74.9%) | 104 (25.1%) |
| Total | 5,378 (58.5%) | 3,816 (41.5%) |
Educational Attainment by Field of Study in Addison County
Education (1,555 | 12.9%), social sciences (1,239 | 10.3%), business (1,140 | 9.5%), literature & languages (1,086 | 9.0%), and bio, nature & agricultural (1,000 | 8.3%) are the most common fields of study among 12,041 individuals in Addison County who have obtained a bachelor's degree or higher.
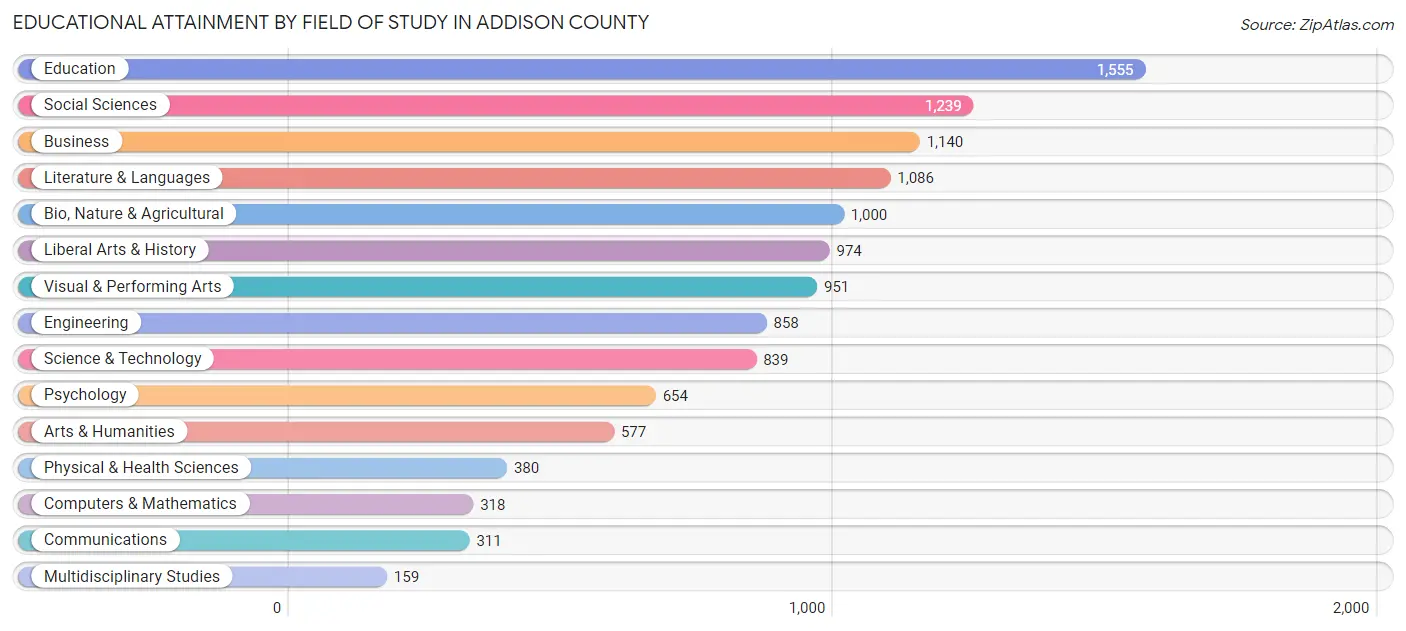
| Field of Study | # Graduates | % Graduates |
| Computers & Mathematics | 318 | 2.6% |
| Bio, Nature & Agricultural | 1,000 | 8.3% |
| Physical & Health Sciences | 380 | 3.2% |
| Psychology | 654 | 5.4% |
| Social Sciences | 1,239 | 10.3% |
| Engineering | 858 | 7.1% |
| Multidisciplinary Studies | 159 | 1.3% |
| Science & Technology | 839 | 7.0% |
| Business | 1,140 | 9.5% |
| Education | 1,555 | 12.9% |
| Literature & Languages | 1,086 | 9.0% |
| Liberal Arts & History | 974 | 8.1% |
| Visual & Performing Arts | 951 | 7.9% |
| Communications | 311 | 2.6% |
| Arts & Humanities | 577 | 4.8% |
| Total | 12,041 | 100.0% |
Transportation & Commute in Addison County
Vehicle Availability by Sex in Addison County
The most prevalent vehicle ownership categories in Addison County are males with 2 vehicles (4,403, accounting for 45.6%) and females with 2 vehicles (4,033, making up 50.3%).
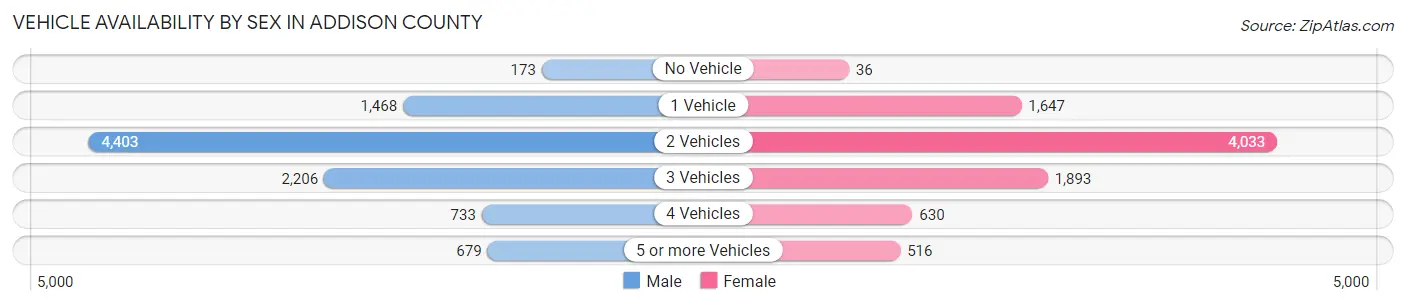
| Vehicles Available | Male | Female |
| No Vehicle | 173 (1.8%) | 36 (0.4%) |
| 1 Vehicle | 1,468 (15.2%) | 1,647 (18.8%) |
| 2 Vehicles | 4,403 (45.6%) | 4,033 (46.1%) |
| 3 Vehicles | 2,206 (22.8%) | 1,893 (21.6%) |
| 4 Vehicles | 733 (7.6%) | 630 (7.2%) |
| 5 or more Vehicles | 679 (7.0%) | 516 (5.9%) |
| Total | 9,662 (100.0%) | 8,755 (100.0%) |
Commute Time in Addison County
The most frequently occuring commute durations in Addison County are 15 to 19 minutes (2,453 commuters, 14.8%), 10 to 14 minutes (2,123 commuters, 12.8%), and 5 to 9 minutes (2,114 commuters, 12.8%).
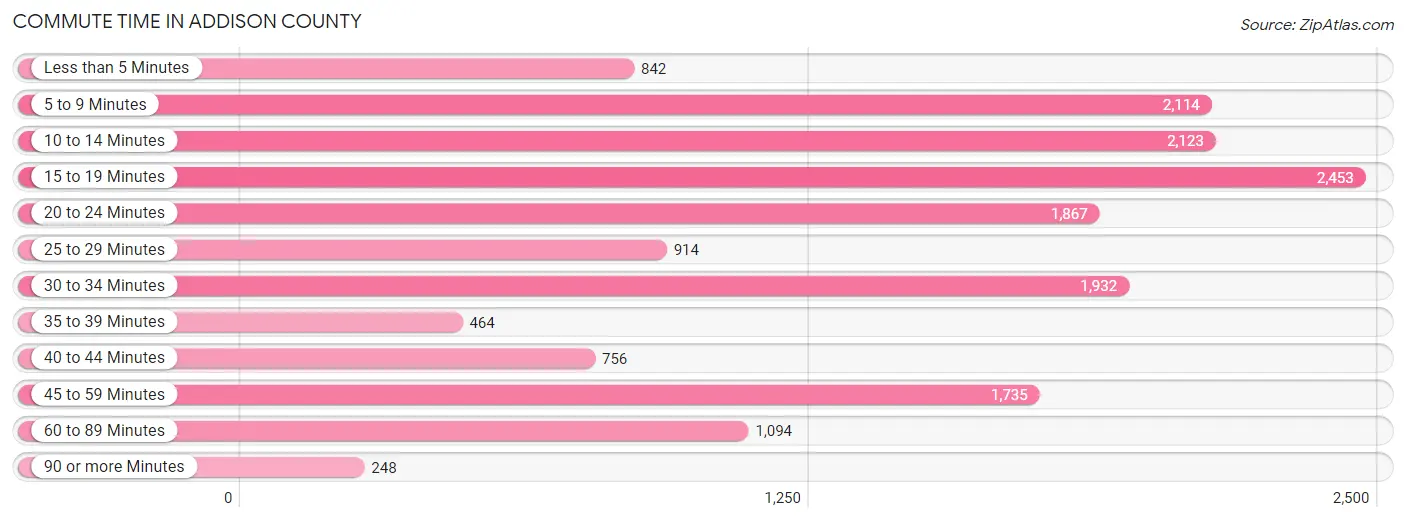
| Commute Time | # Commuters | % Commuters |
| Less than 5 Minutes | 842 | 5.1% |
| 5 to 9 Minutes | 2,114 | 12.8% |
| 10 to 14 Minutes | 2,123 | 12.8% |
| 15 to 19 Minutes | 2,453 | 14.8% |
| 20 to 24 Minutes | 1,867 | 11.3% |
| 25 to 29 Minutes | 914 | 5.5% |
| 30 to 34 Minutes | 1,932 | 11.7% |
| 35 to 39 Minutes | 464 | 2.8% |
| 40 to 44 Minutes | 756 | 4.6% |
| 45 to 59 Minutes | 1,735 | 10.5% |
| 60 to 89 Minutes | 1,094 | 6.6% |
| 90 or more Minutes | 248 | 1.5% |
Commute Time by Sex in Addison County
The most common commute times in Addison County are 15 to 19 minutes (1,265 commuters, 14.7%) for males and 10 to 14 minutes (1,209 commuters, 15.2%) for females.
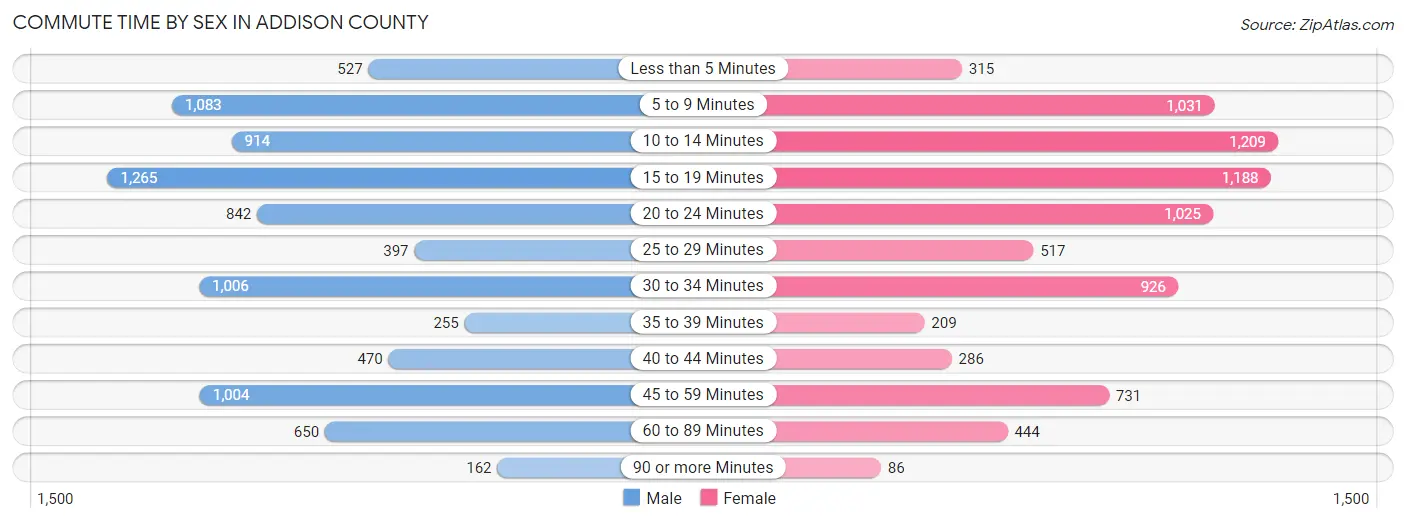
| Commute Time | Male | Female |
| Less than 5 Minutes | 527 (6.1%) | 315 (4.0%) |
| 5 to 9 Minutes | 1,083 (12.6%) | 1,031 (12.9%) |
| 10 to 14 Minutes | 914 (10.7%) | 1,209 (15.2%) |
| 15 to 19 Minutes | 1,265 (14.7%) | 1,188 (14.9%) |
| 20 to 24 Minutes | 842 (9.8%) | 1,025 (12.9%) |
| 25 to 29 Minutes | 397 (4.6%) | 517 (6.5%) |
| 30 to 34 Minutes | 1,006 (11.7%) | 926 (11.6%) |
| 35 to 39 Minutes | 255 (3.0%) | 209 (2.6%) |
| 40 to 44 Minutes | 470 (5.5%) | 286 (3.6%) |
| 45 to 59 Minutes | 1,004 (11.7%) | 731 (9.2%) |
| 60 to 89 Minutes | 650 (7.6%) | 444 (5.6%) |
| 90 or more Minutes | 162 (1.9%) | 86 (1.1%) |
Time of Departure to Work by Sex in Addison County
The most frequent times of departure to work in Addison County are 6:30 AM to 6:59 AM (1,312, 15.3%) for males and 7:00 AM to 7:29 AM (1,441, 18.1%) for females.
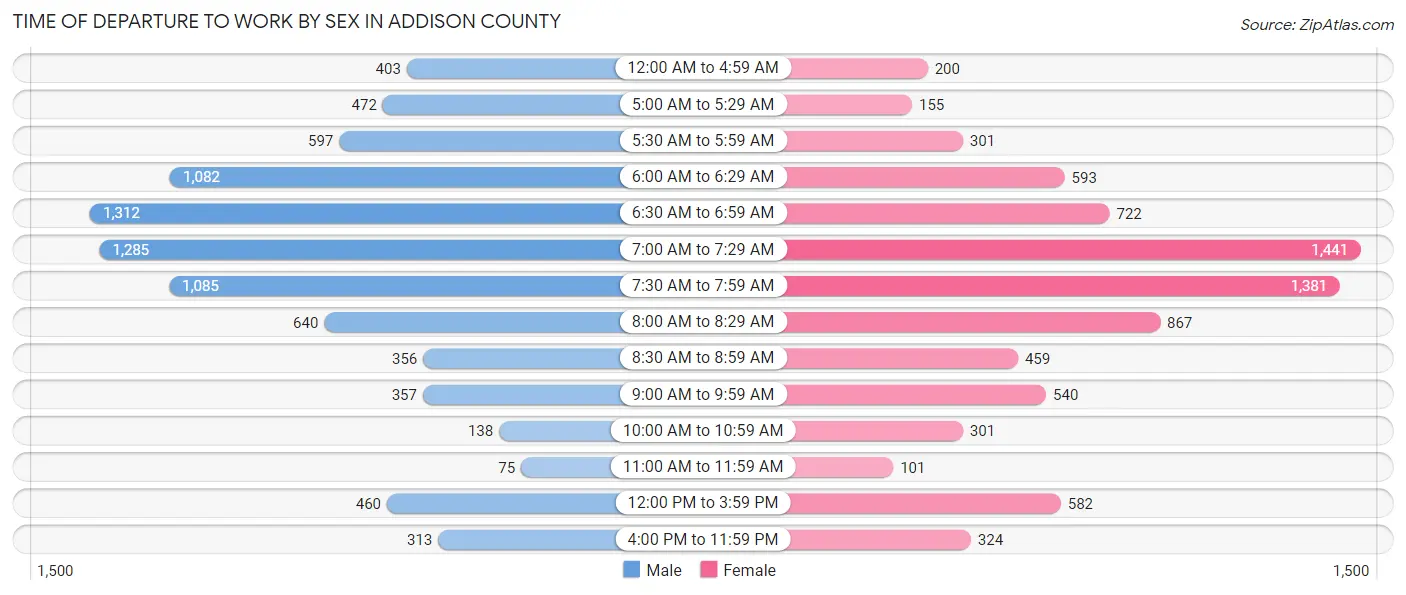
| Time of Departure | Male | Female |
| 12:00 AM to 4:59 AM | 403 (4.7%) | 200 (2.5%) |
| 5:00 AM to 5:29 AM | 472 (5.5%) | 155 (1.9%) |
| 5:30 AM to 5:59 AM | 597 (7.0%) | 301 (3.8%) |
| 6:00 AM to 6:29 AM | 1,082 (12.6%) | 593 (7.4%) |
| 6:30 AM to 6:59 AM | 1,312 (15.3%) | 722 (9.1%) |
| 7:00 AM to 7:29 AM | 1,285 (15.0%) | 1,441 (18.1%) |
| 7:30 AM to 7:59 AM | 1,085 (12.7%) | 1,381 (17.3%) |
| 8:00 AM to 8:29 AM | 640 (7.5%) | 867 (10.9%) |
| 8:30 AM to 8:59 AM | 356 (4.2%) | 459 (5.8%) |
| 9:00 AM to 9:59 AM | 357 (4.2%) | 540 (6.8%) |
| 10:00 AM to 10:59 AM | 138 (1.6%) | 301 (3.8%) |
| 11:00 AM to 11:59 AM | 75 (0.9%) | 101 (1.3%) |
| 12:00 PM to 3:59 PM | 460 (5.4%) | 582 (7.3%) |
| 4:00 PM to 11:59 PM | 313 (3.6%) | 324 (4.1%) |
| Total | 8,575 (100.0%) | 7,967 (100.0%) |
Housing Occupancy in Addison County
Occupancy by Ownership in Addison County
Of the total 14,416 dwellings in Addison County, owner-occupied units account for 11,455 (79.5%), while renter-occupied units make up 2,961 (20.5%).
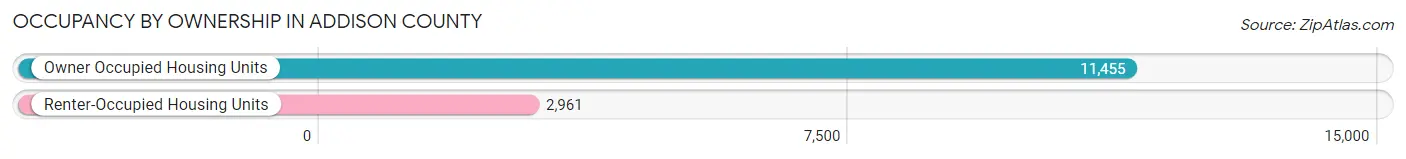
| Occupancy | # Housing Units | % Housing Units |
| Owner Occupied Housing Units | 11,455 | 79.5% |
| Renter-Occupied Housing Units | 2,961 | 20.5% |
| Total Occupied Housing Units | 14,416 | 100.0% |
Occupancy by Household Size in Addison County
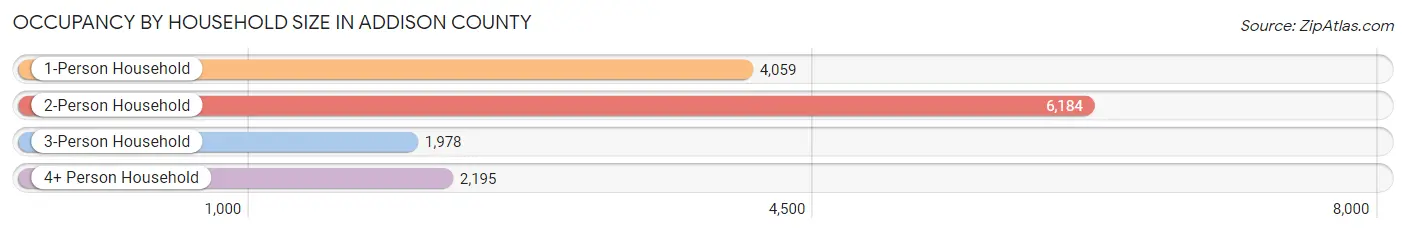
| Household Size | # Housing Units | % Housing Units |
| 1-Person Household | 4,059 | 28.2% |
| 2-Person Household | 6,184 | 42.9% |
| 3-Person Household | 1,978 | 13.7% |
| 4+ Person Household | 2,195 | 15.2% |
| Total Housing Units | 14,416 | 100.0% |
Occupancy by Ownership by Household Size in Addison County
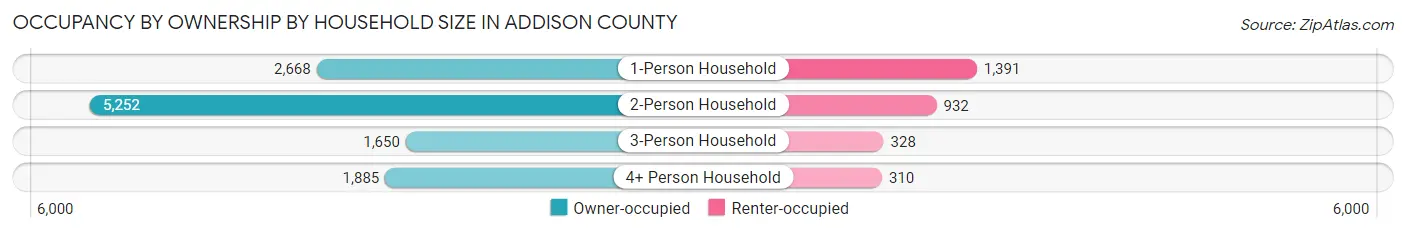
| Household Size | Owner-occupied | Renter-occupied |
| 1-Person Household | 2,668 (65.7%) | 1,391 (34.3%) |
| 2-Person Household | 5,252 (84.9%) | 932 (15.1%) |
| 3-Person Household | 1,650 (83.4%) | 328 (16.6%) |
| 4+ Person Household | 1,885 (85.9%) | 310 (14.1%) |
| Total Housing Units | 11,455 (79.5%) | 2,961 (20.5%) |
Occupancy by Educational Attainment in Addison County
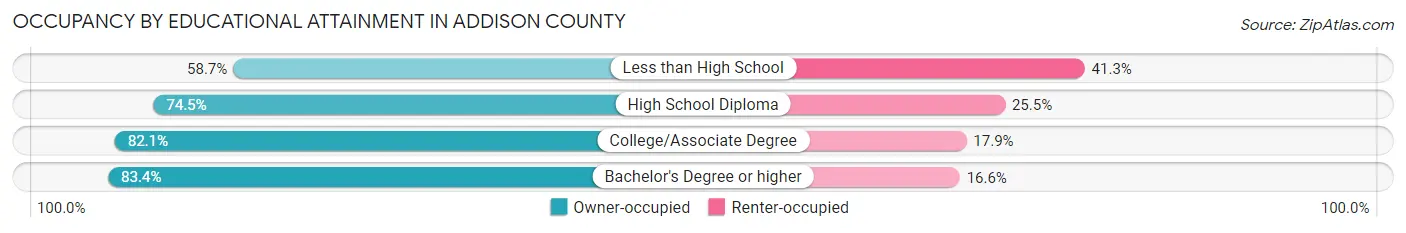
| Household Size | Owner-occupied | Renter-occupied |
| Less than High School | 457 (58.7%) | 322 (41.3%) |
| High School Diploma | 2,764 (74.5%) | 948 (25.5%) |
| College/Associate Degree | 2,938 (82.1%) | 640 (17.9%) |
| Bachelor's Degree or higher | 5,296 (83.4%) | 1,051 (16.6%) |
Occupancy by Age of Householder in Addison County
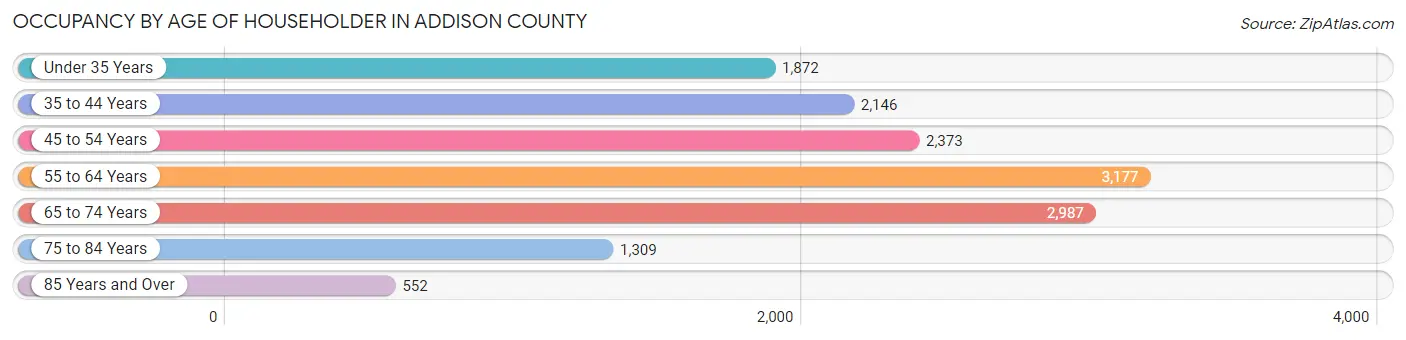
| Age Bracket | # Households | % Households |
| Under 35 Years | 1,872 | 13.0% |
| 35 to 44 Years | 2,146 | 14.9% |
| 45 to 54 Years | 2,373 | 16.5% |
| 55 to 64 Years | 3,177 | 22.0% |
| 65 to 74 Years | 2,987 | 20.7% |
| 75 to 84 Years | 1,309 | 9.1% |
| 85 Years and Over | 552 | 3.8% |
| Total | 14,416 | 100.0% |
Housing Finances in Addison County
Median Income by Occupancy in Addison County
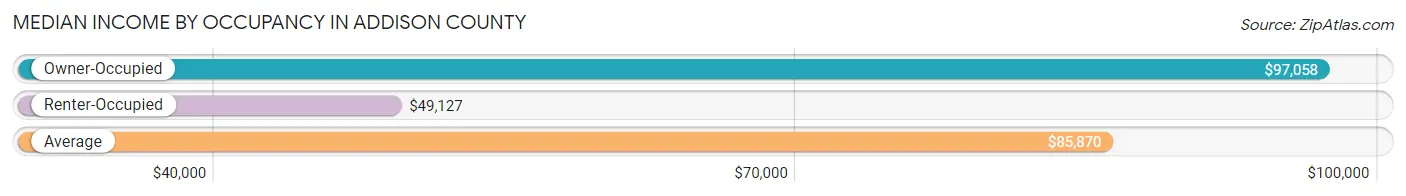
| Occupancy Type | # Households | Median Income |
| Owner-Occupied | 11,455 (79.5%) | $97,058 |
| Renter-Occupied | 2,961 (20.5%) | $49,127 |
| Average | 14,416 (100.0%) | $85,870 |
Occupancy by Householder Income Bracket in Addison County
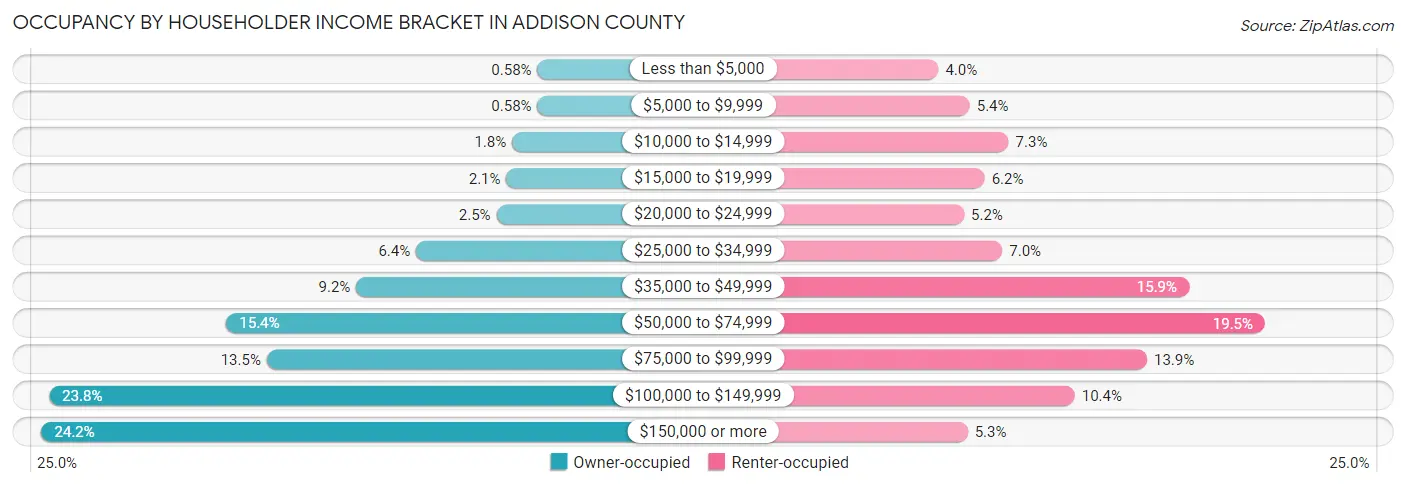
| Income Bracket | Owner-occupied | Renter-occupied |
| Less than $5,000 | 66 (0.6%) | 117 (4.0%) |
| $5,000 to $9,999 | 66 (0.6%) | 161 (5.4%) |
| $10,000 to $14,999 | 205 (1.8%) | 216 (7.3%) |
| $15,000 to $19,999 | 236 (2.1%) | 182 (6.1%) |
| $20,000 to $24,999 | 290 (2.5%) | 153 (5.2%) |
| $25,000 to $34,999 | 729 (6.4%) | 207 (7.0%) |
| $35,000 to $49,999 | 1,055 (9.2%) | 470 (15.9%) |
| $50,000 to $74,999 | 1,763 (15.4%) | 577 (19.5%) |
| $75,000 to $99,999 | 1,543 (13.5%) | 411 (13.9%) |
| $100,000 to $149,999 | 2,730 (23.8%) | 309 (10.4%) |
| $150,000 or more | 2,772 (24.2%) | 158 (5.3%) |
| Total | 11,455 (100.0%) | 2,961 (100.0%) |
Monthly Housing Cost Tiers in Addison County
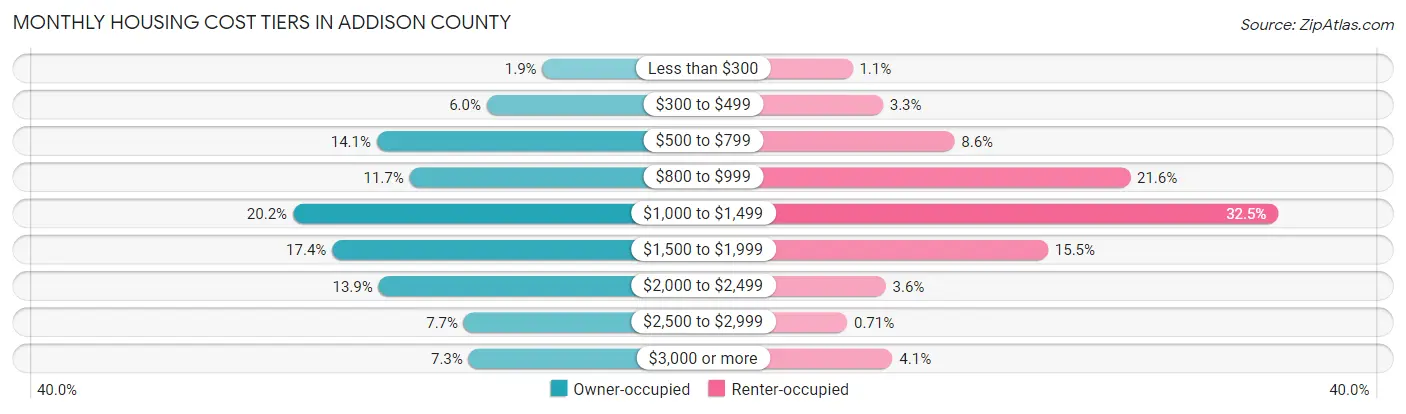
| Monthly Cost | Owner-occupied | Renter-occupied |
| Less than $300 | 213 (1.9%) | 33 (1.1%) |
| $300 to $499 | 683 (6.0%) | 99 (3.3%) |
| $500 to $799 | 1,611 (14.1%) | 255 (8.6%) |
| $800 to $999 | 1,335 (11.7%) | 638 (21.5%) |
| $1,000 to $1,499 | 2,318 (20.2%) | 961 (32.5%) |
| $1,500 to $1,999 | 1,987 (17.3%) | 459 (15.5%) |
| $2,000 to $2,499 | 1,596 (13.9%) | 105 (3.5%) |
| $2,500 to $2,999 | 876 (7.6%) | 21 (0.7%) |
| $3,000 or more | 836 (7.3%) | 120 (4.1%) |
| Total | 11,455 (100.0%) | 2,961 (100.0%) |
Physical Housing Characteristics in Addison County
Housing Structures in Addison County
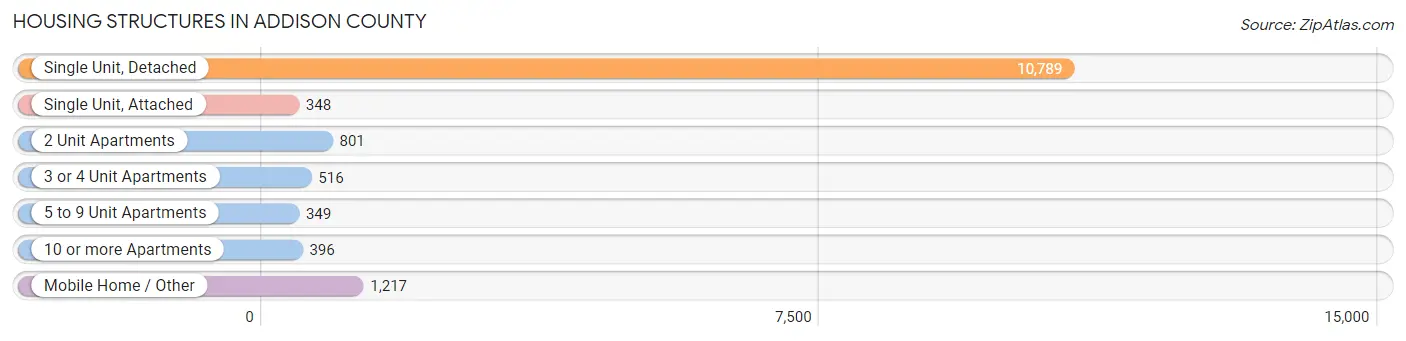
| Structure Type | # Housing Units | % Housing Units |
| Single Unit, Detached | 10,789 | 74.8% |
| Single Unit, Attached | 348 | 2.4% |
| 2 Unit Apartments | 801 | 5.6% |
| 3 or 4 Unit Apartments | 516 | 3.6% |
| 5 to 9 Unit Apartments | 349 | 2.4% |
| 10 or more Apartments | 396 | 2.8% |
| Mobile Home / Other | 1,217 | 8.4% |
| Total | 14,416 | 100.0% |
Housing Structures by Occupancy in Addison County
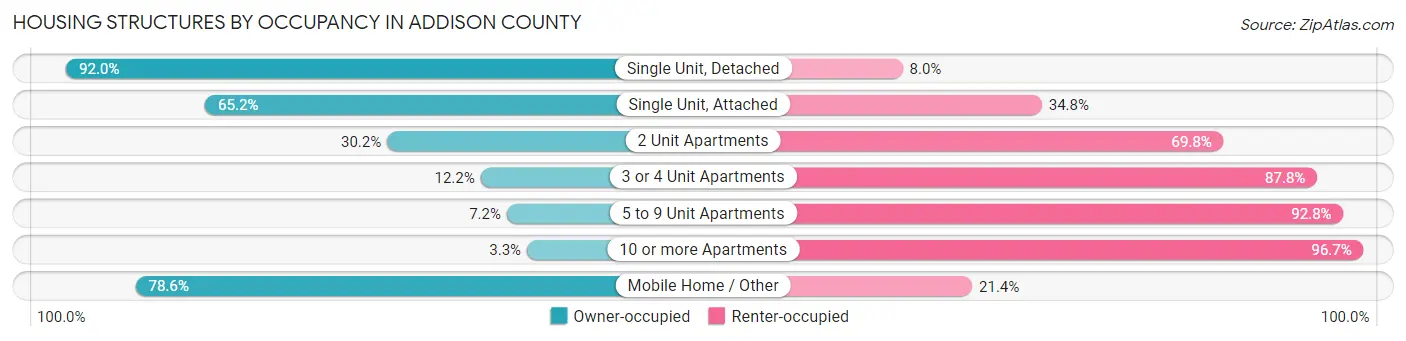
| Structure Type | Owner-occupied | Renter-occupied |
| Single Unit, Detached | 9,928 (92.0%) | 861 (8.0%) |
| Single Unit, Attached | 227 (65.2%) | 121 (34.8%) |
| 2 Unit Apartments | 242 (30.2%) | 559 (69.8%) |
| 3 or 4 Unit Apartments | 63 (12.2%) | 453 (87.8%) |
| 5 to 9 Unit Apartments | 25 (7.2%) | 324 (92.8%) |
| 10 or more Apartments | 13 (3.3%) | 383 (96.7%) |
| Mobile Home / Other | 957 (78.6%) | 260 (21.4%) |
| Total | 11,455 (79.5%) | 2,961 (20.5%) |
Housing Structures by Number of Rooms in Addison County
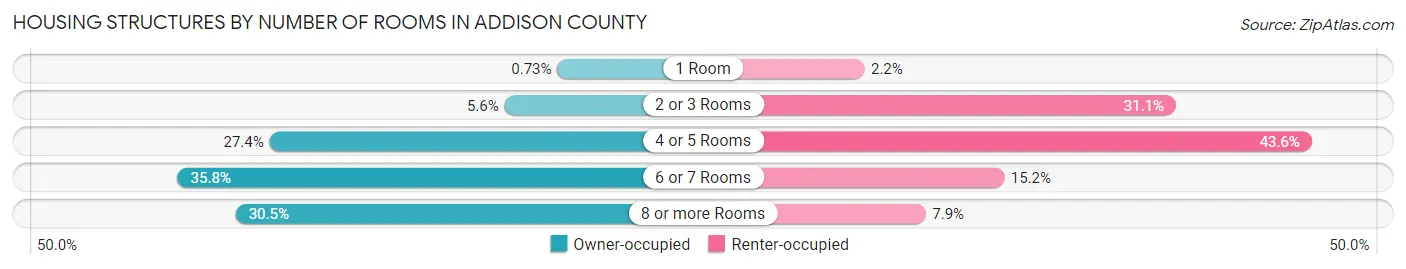
| Number of Rooms | Owner-occupied | Renter-occupied |
| 1 Room | 84 (0.7%) | 66 (2.2%) |
| 2 or 3 Rooms | 643 (5.6%) | 920 (31.1%) |
| 4 or 5 Rooms | 3,133 (27.4%) | 1,292 (43.6%) |
| 6 or 7 Rooms | 4,105 (35.8%) | 449 (15.2%) |
| 8 or more Rooms | 3,490 (30.5%) | 234 (7.9%) |
| Total | 11,455 (100.0%) | 2,961 (100.0%) |
Housing Structure by Heating Type in Addison County
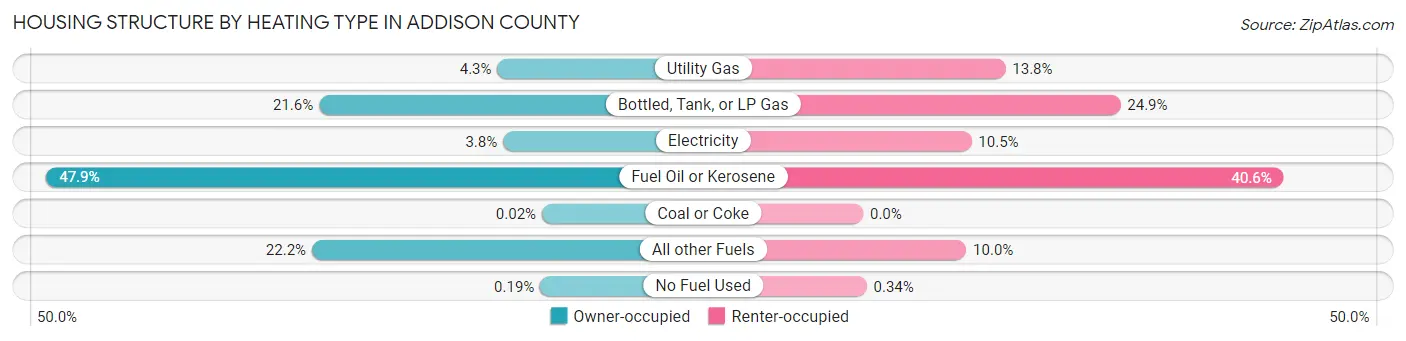
| Heating Type | Owner-occupied | Renter-occupied |
| Utility Gas | 495 (4.3%) | 407 (13.8%) |
| Bottled, Tank, or LP Gas | 2,469 (21.5%) | 736 (24.9%) |
| Electricity | 432 (3.8%) | 310 (10.5%) |
| Fuel Oil or Kerosene | 5,487 (47.9%) | 1,203 (40.6%) |
| Coal or Coke | 2 (0.0%) | 0 (0.0%) |
| All other Fuels | 2,548 (22.2%) | 295 (10.0%) |
| No Fuel Used | 22 (0.2%) | 10 (0.3%) |
| Total | 11,455 (100.0%) | 2,961 (100.0%) |
Household Vehicle Usage in Addison County
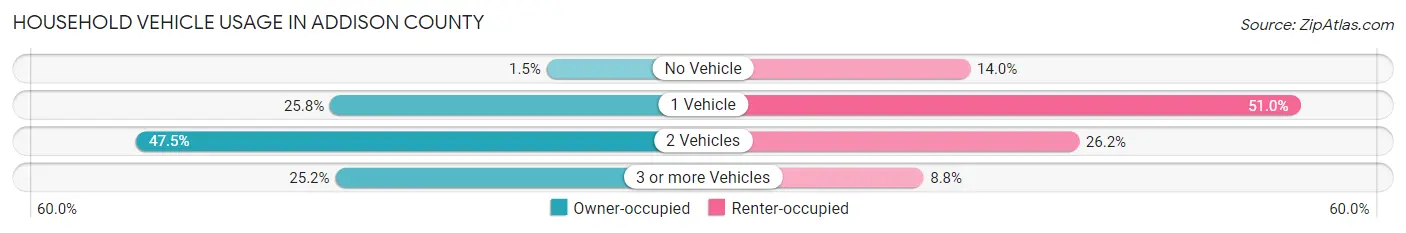
| Vehicles per Household | Owner-occupied | Renter-occupied |
| No Vehicle | 174 (1.5%) | 415 (14.0%) |
| 1 Vehicle | 2,954 (25.8%) | 1,510 (51.0%) |
| 2 Vehicles | 5,442 (47.5%) | 776 (26.2%) |
| 3 or more Vehicles | 2,885 (25.2%) | 260 (8.8%) |
| Total | 11,455 (100.0%) | 2,961 (100.0%) |
Real Estate & Mortgages in Addison County
Real Estate and Mortgage Overview in Addison County
| Characteristic | Without Mortgage | With Mortgage |
| Housing Units | 4,357 | 7,098 |
| Median Property Value | $288,500 | $322,600 |
| Median Household Income | $69,144 | $2,181 |
| Monthly Housing Costs | $774 | $820 |
| Real Estate Taxes | $4,973 | $63 |
Property Value by Mortgage Status in Addison County
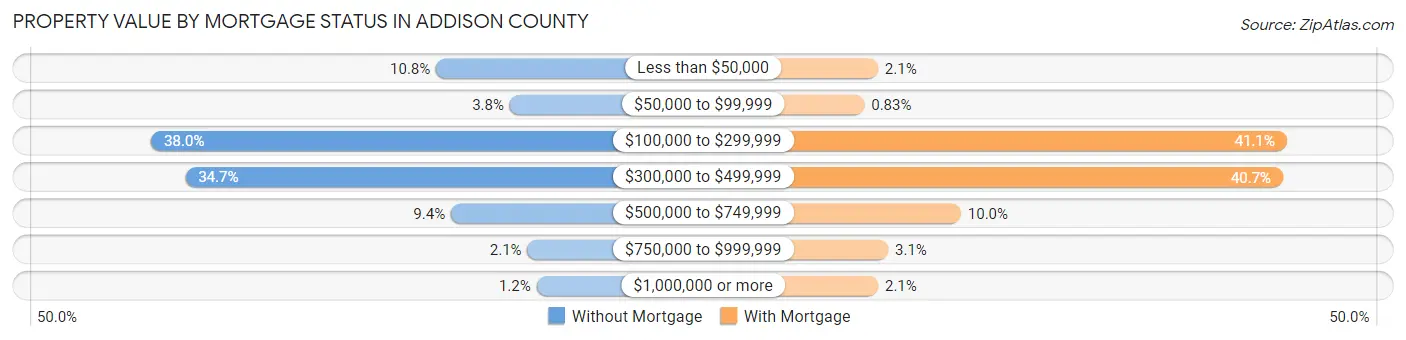
| Property Value | Without Mortgage | With Mortgage |
| Less than $50,000 | 471 (10.8%) | 151 (2.1%) |
| $50,000 to $99,999 | 165 (3.8%) | 59 (0.8%) |
| $100,000 to $299,999 | 1,654 (38.0%) | 2,915 (41.1%) |
| $300,000 to $499,999 | 1,512 (34.7%) | 2,889 (40.7%) |
| $500,000 to $749,999 | 409 (9.4%) | 712 (10.0%) |
| $750,000 to $999,999 | 92 (2.1%) | 220 (3.1%) |
| $1,000,000 or more | 54 (1.2%) | 152 (2.1%) |
| Total | 4,357 (100.0%) | 7,098 (100.0%) |
Household Income by Mortgage Status in Addison County
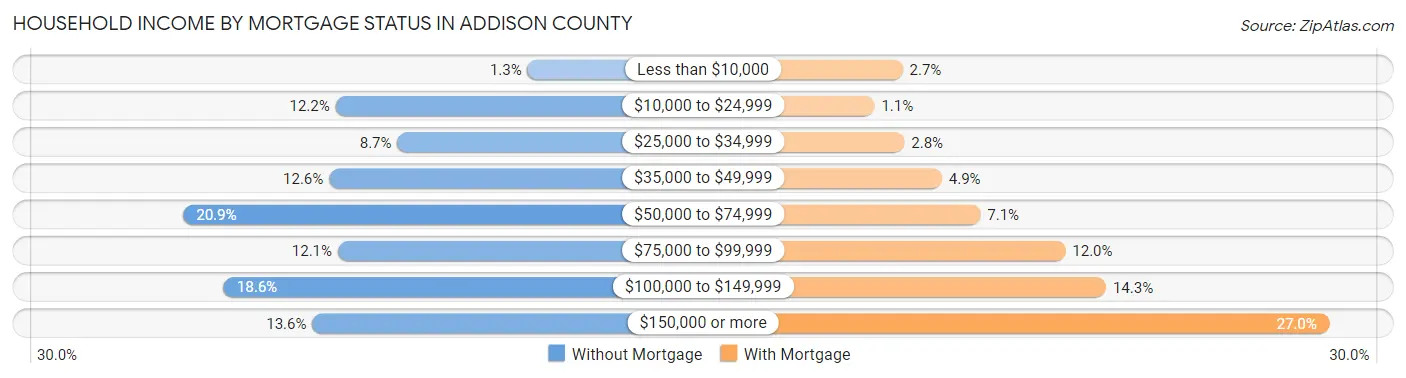
| Household Income | Without Mortgage | With Mortgage |
| Less than $10,000 | 55 (1.3%) | 191 (2.7%) |
| $10,000 to $24,999 | 533 (12.2%) | 77 (1.1%) |
| $25,000 to $34,999 | 379 (8.7%) | 198 (2.8%) |
| $35,000 to $49,999 | 549 (12.6%) | 350 (4.9%) |
| $50,000 to $74,999 | 912 (20.9%) | 506 (7.1%) |
| $75,000 to $99,999 | 527 (12.1%) | 851 (12.0%) |
| $100,000 to $149,999 | 811 (18.6%) | 1,016 (14.3%) |
| $150,000 or more | 591 (13.6%) | 1,919 (27.0%) |
| Total | 4,357 (100.0%) | 7,098 (100.0%) |
Property Value to Household Income Ratio in Addison County
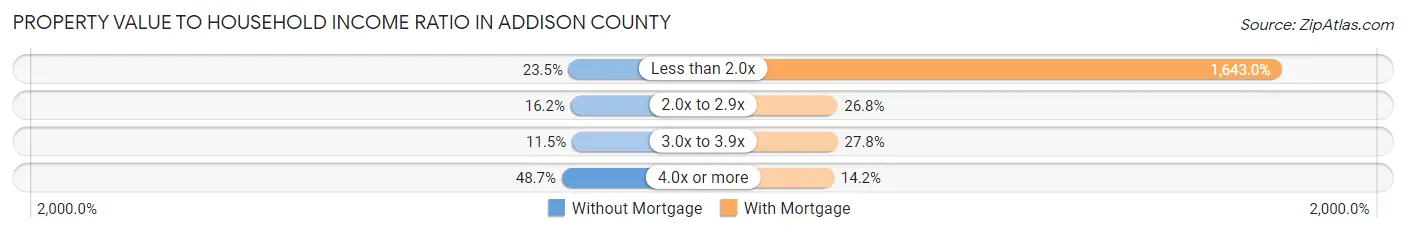
| Value-to-Income Ratio | Without Mortgage | With Mortgage |
| Less than 2.0x | 1,023 (23.5%) | 116,622 (1,643.0%) |
| 2.0x to 2.9x | 704 (16.2%) | 1,902 (26.8%) |
| 3.0x to 3.9x | 499 (11.5%) | 1,974 (27.8%) |
| 4.0x or more | 2,122 (48.7%) | 1,011 (14.2%) |
| Total | 4,357 (100.0%) | 7,098 (100.0%) |
Real Estate Taxes by Mortgage Status in Addison County
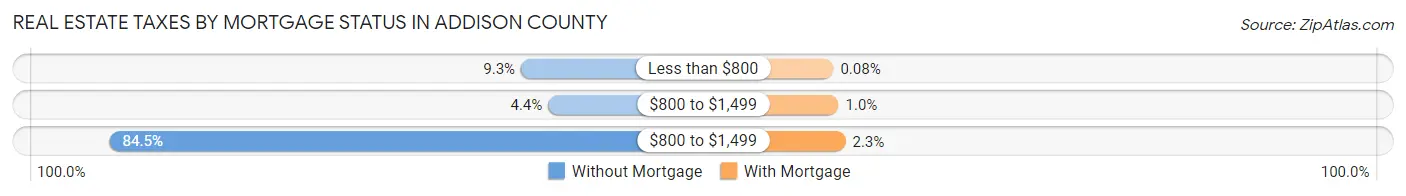
| Property Taxes | Without Mortgage | With Mortgage |
| Less than $800 | 407 (9.3%) | 6 (0.1%) |
| $800 to $1,499 | 191 (4.4%) | 72 (1.0%) |
| $800 to $1,499 | 3,680 (84.5%) | 162 (2.3%) |
| Total | 4,357 (100.0%) | 7,098 (100.0%) |
Health & Disability in Addison County
Health Insurance Coverage by Age in Addison County
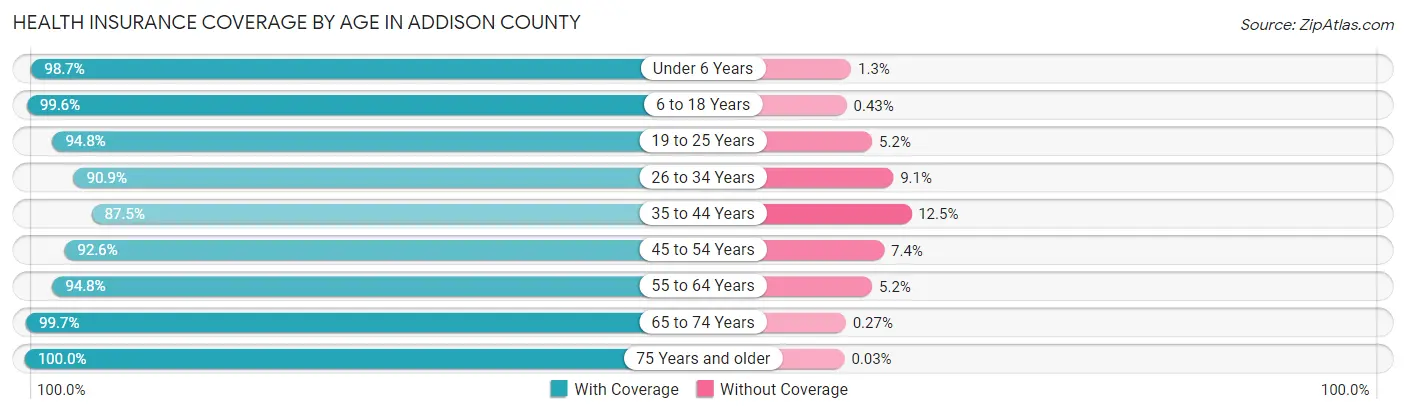
| Age Bracket | With Coverage | Without Coverage |
| Under 6 Years | 1,790 (98.7%) | 23 (1.3%) |
| 6 to 18 Years | 5,148 (99.6%) | 22 (0.4%) |
| 19 to 25 Years | 4,502 (94.8%) | 247 (5.2%) |
| 26 to 34 Years | 3,006 (90.9%) | 302 (9.1%) |
| 35 to 44 Years | 3,562 (87.5%) | 508 (12.5%) |
| 45 to 54 Years | 4,242 (92.6%) | 340 (7.4%) |
| 55 to 64 Years | 5,348 (94.8%) | 292 (5.2%) |
| 65 to 74 Years | 4,829 (99.7%) | 13 (0.3%) |
| 75 Years and older | 2,990 (100.0%) | 1 (0.0%) |
| Total | 35,417 (95.3%) | 1,748 (4.7%) |
Health Insurance Coverage by Citizenship Status in Addison County
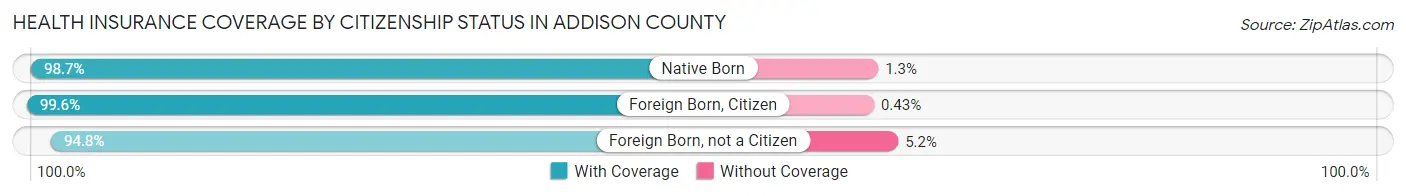
| Citizenship Status | With Coverage | Without Coverage |
| Native Born | 1,790 (98.7%) | 23 (1.3%) |
| Foreign Born, Citizen | 5,148 (99.6%) | 22 (0.4%) |
| Foreign Born, not a Citizen | 4,502 (94.8%) | 247 (5.2%) |
Health Insurance Coverage by Household Income in Addison County
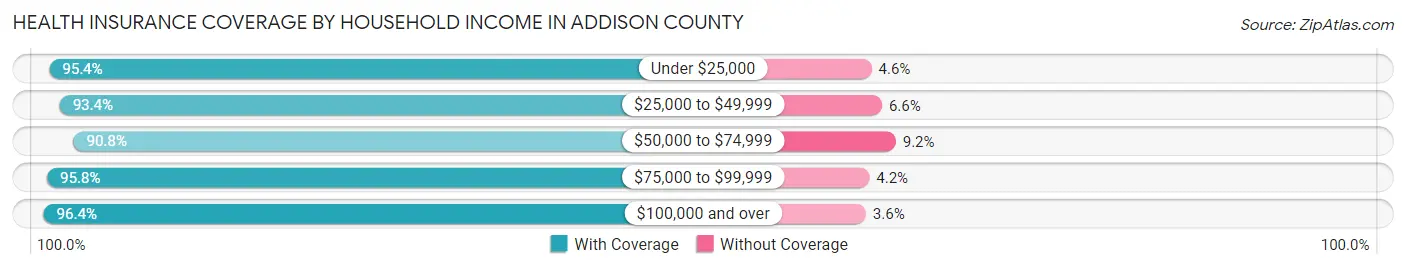
| Household Income | With Coverage | Without Coverage |
| Under $25,000 | 2,426 (95.4%) | 118 (4.6%) |
| $25,000 to $49,999 | 4,109 (93.4%) | 290 (6.6%) |
| $50,000 to $74,999 | 4,400 (90.8%) | 445 (9.2%) |
| $75,000 to $99,999 | 4,685 (95.8%) | 207 (4.2%) |
| $100,000 and over | 16,960 (96.4%) | 630 (3.6%) |
Public vs Private Health Insurance Coverage by Age in Addison County
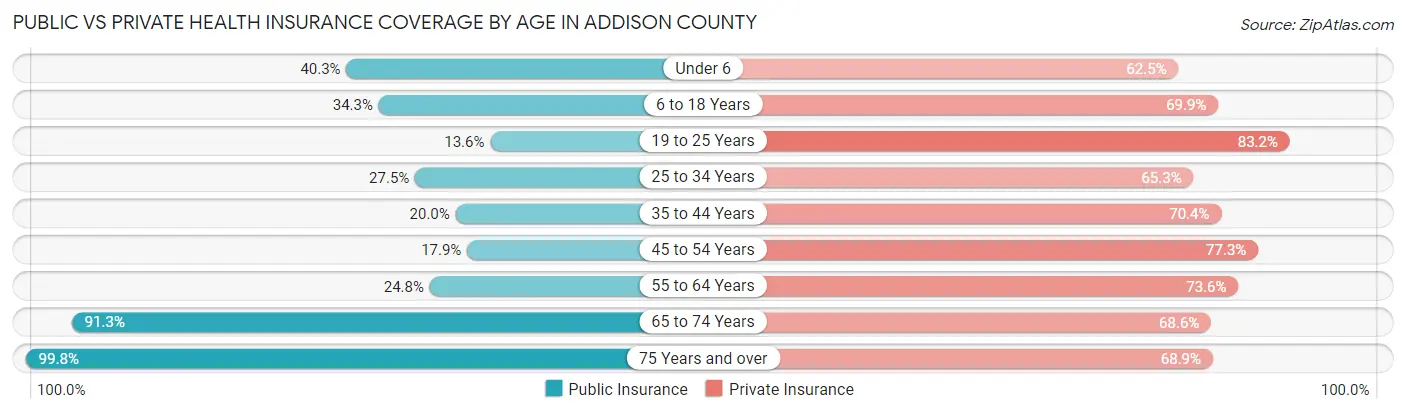
| Age Bracket | Public Insurance | Private Insurance |
| Under 6 | 730 (40.3%) | 1,133 (62.5%) |
| 6 to 18 Years | 1,771 (34.3%) | 3,612 (69.9%) |
| 19 to 25 Years | 644 (13.6%) | 3,949 (83.2%) |
| 25 to 34 Years | 910 (27.5%) | 2,159 (65.3%) |
| 35 to 44 Years | 814 (20.0%) | 2,867 (70.4%) |
| 45 to 54 Years | 818 (17.8%) | 3,541 (77.3%) |
| 55 to 64 Years | 1,398 (24.8%) | 4,151 (73.6%) |
| 65 to 74 Years | 4,420 (91.3%) | 3,319 (68.5%) |
| 75 Years and over | 2,985 (99.8%) | 2,060 (68.9%) |
| Total | 14,490 (39.0%) | 26,791 (72.1%) |
Disability Status by Sex by Age in Addison County
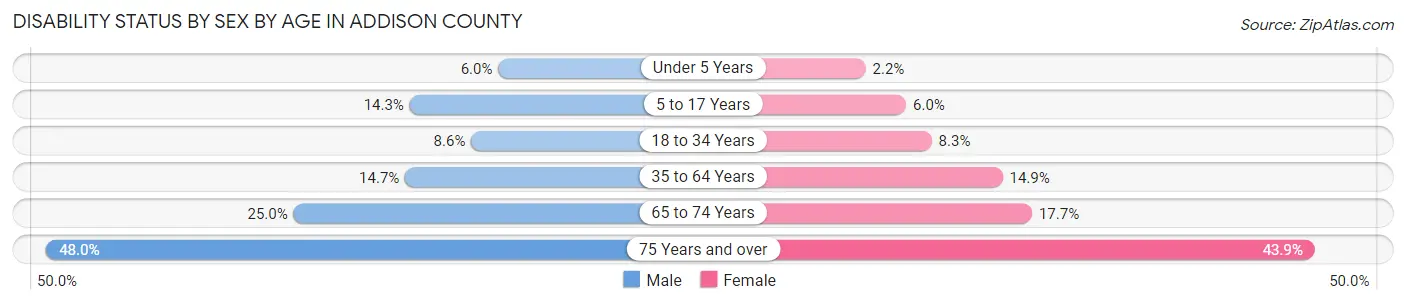
| Age Bracket | Male | Female |
| Under 5 Years | 44 (6.0%) | 17 (2.2%) |
| 5 to 17 Years | 347 (14.3%) | 127 (6.0%) |
| 18 to 34 Years | 381 (8.6%) | 377 (8.3%) |
| 35 to 64 Years | 1,055 (14.7%) | 1,060 (14.9%) |
| 65 to 74 Years | 608 (25.0%) | 426 (17.6%) |
| 75 Years and over | 658 (48.0%) | 711 (43.9%) |
Disability Class by Sex by Age in Addison County
Disability Class: Hearing Difficulty
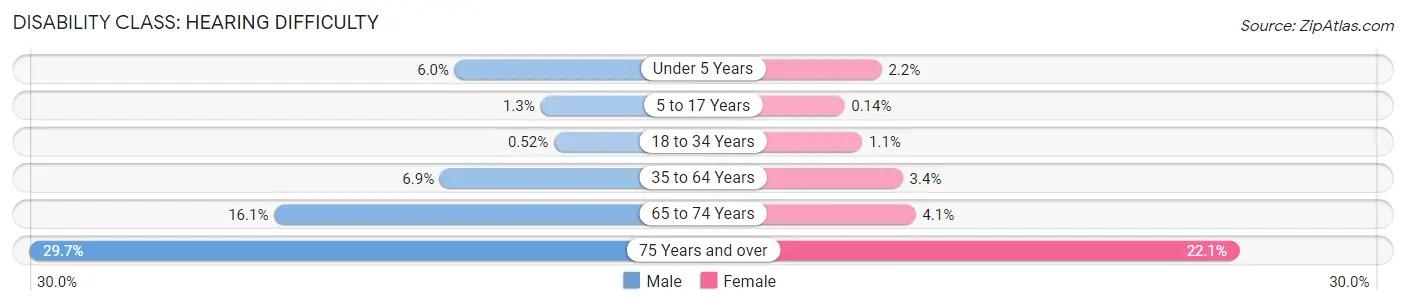
| Age Bracket | Male | Female |
| Under 5 Years | 44 (6.0%) | 17 (2.2%) |
| 5 to 17 Years | 31 (1.3%) | 3 (0.1%) |
| 18 to 34 Years | 23 (0.5%) | 51 (1.1%) |
| 35 to 64 Years | 494 (6.9%) | 241 (3.4%) |
| 65 to 74 Years | 391 (16.1%) | 99 (4.1%) |
| 75 Years and over | 407 (29.7%) | 358 (22.1%) |
Disability Class: Vision Difficulty
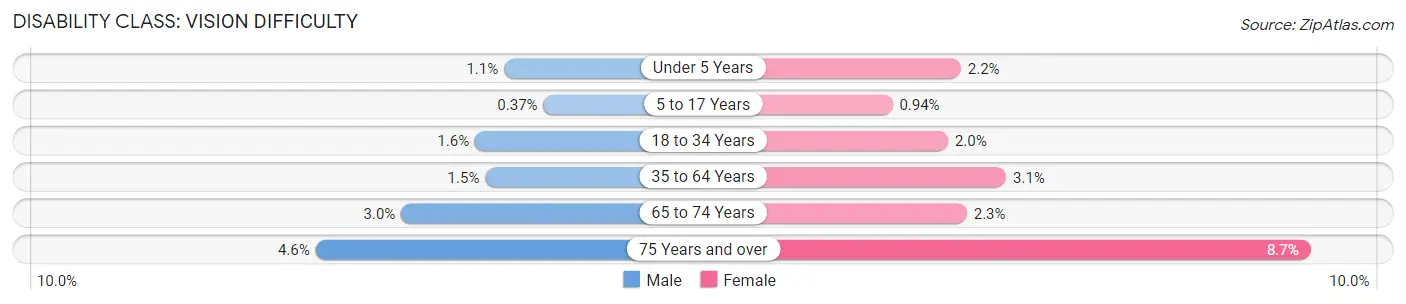
| Age Bracket | Male | Female |
| Under 5 Years | 8 (1.1%) | 17 (2.2%) |
| 5 to 17 Years | 9 (0.4%) | 20 (0.9%) |
| 18 to 34 Years | 73 (1.6%) | 89 (2.0%) |
| 35 to 64 Years | 104 (1.5%) | 217 (3.0%) |
| 65 to 74 Years | 73 (3.0%) | 56 (2.3%) |
| 75 Years and over | 63 (4.6%) | 141 (8.7%) |
Disability Class: Cognitive Difficulty
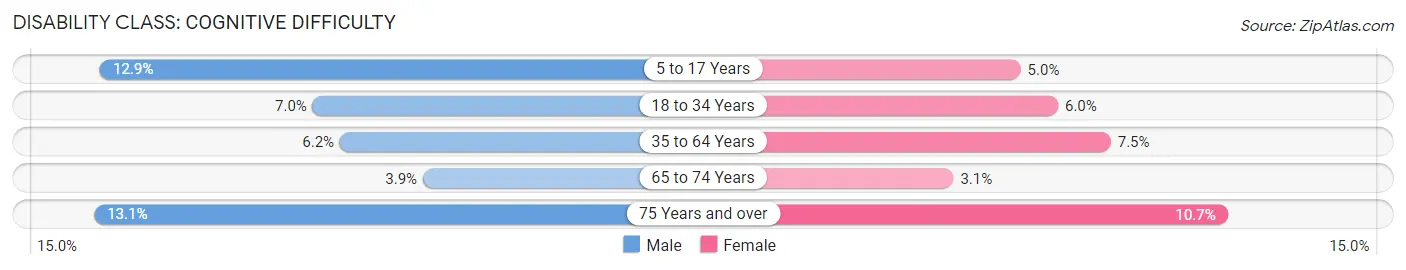
| Age Bracket | Male | Female |
| 5 to 17 Years | 314 (12.9%) | 106 (5.0%) |
| 18 to 34 Years | 311 (7.0%) | 272 (6.0%) |
| 35 to 64 Years | 447 (6.2%) | 532 (7.5%) |
| 65 to 74 Years | 95 (3.9%) | 75 (3.1%) |
| 75 Years and over | 179 (13.1%) | 174 (10.7%) |
Disability Class: Ambulatory Difficulty
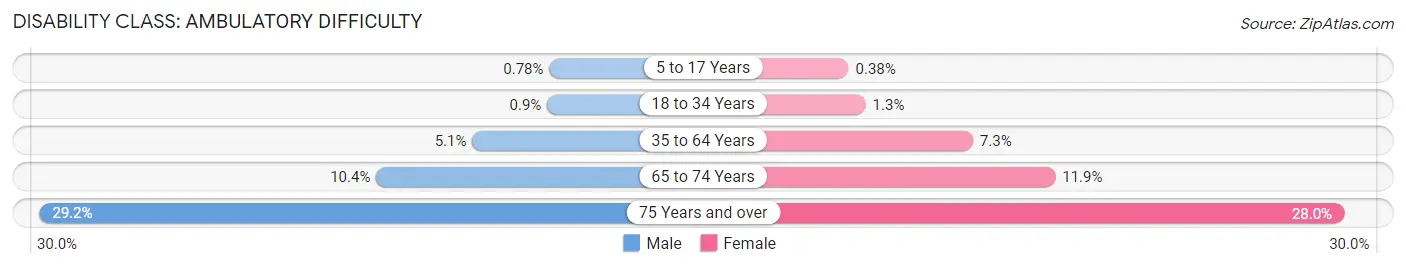
| Age Bracket | Male | Female |
| 5 to 17 Years | 19 (0.8%) | 8 (0.4%) |
| 18 to 34 Years | 40 (0.9%) | 60 (1.3%) |
| 35 to 64 Years | 364 (5.1%) | 519 (7.3%) |
| 65 to 74 Years | 253 (10.4%) | 287 (11.9%) |
| 75 Years and over | 400 (29.2%) | 453 (28.0%) |
Disability Class: Self-Care Difficulty
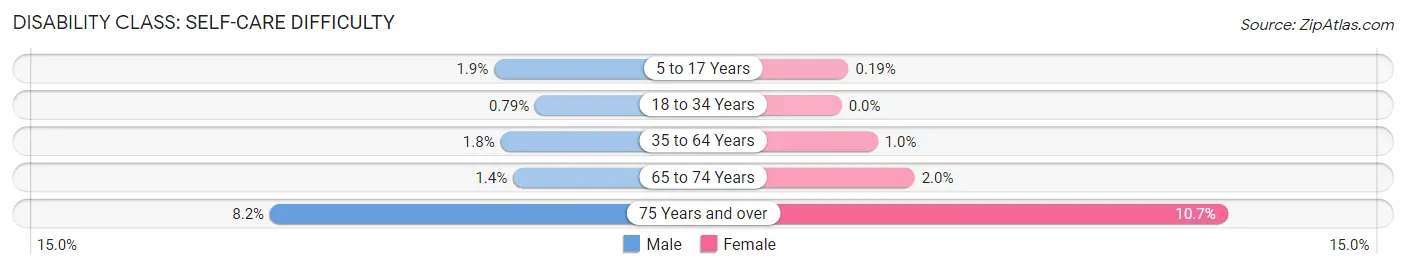
| Age Bracket | Male | Female |
| 5 to 17 Years | 47 (1.9%) | 4 (0.2%) |
| 18 to 34 Years | 35 (0.8%) | 0 (0.0%) |
| 35 to 64 Years | 126 (1.8%) | 71 (1.0%) |
| 65 to 74 Years | 34 (1.4%) | 49 (2.0%) |
| 75 Years and over | 112 (8.2%) | 174 (10.7%) |
Technology Access in Addison County
Computing Device Access in Addison County
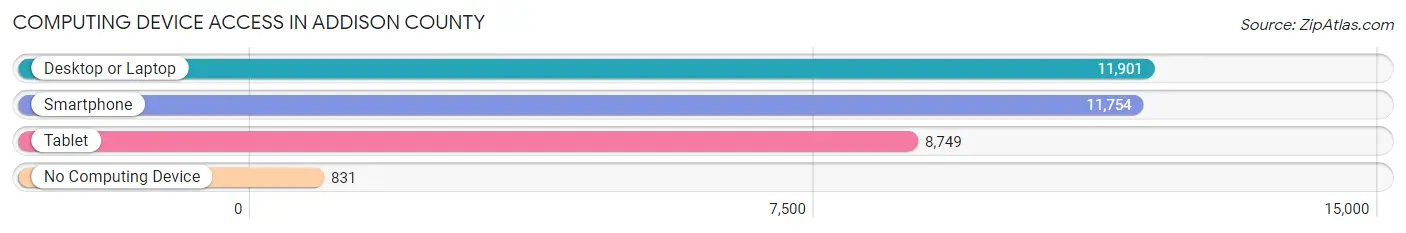
| Device Type | # Households | % Households |
| Desktop or Laptop | 11,901 | 82.6% |
| Smartphone | 11,754 | 81.5% |
| Tablet | 8,749 | 60.7% |
| No Computing Device | 831 | 5.8% |
| Total | 14,416 | 100.0% |
Internet Access in Addison County
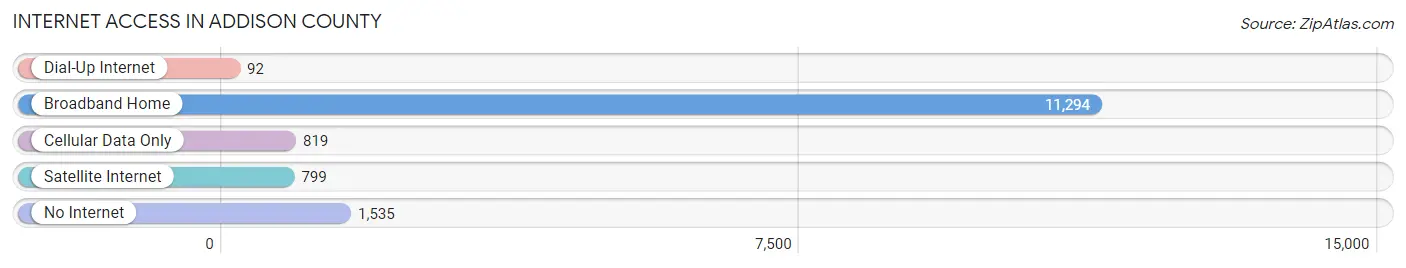
| Internet Type | # Households | % Households |
| Dial-Up Internet | 92 | 0.6% |
| Broadband Home | 11,294 | 78.3% |
| Cellular Data Only | 819 | 5.7% |
| Satellite Internet | 799 | 5.5% |
| No Internet | 1,535 | 10.6% |
| Total | 14,416 | 100.0% |
Addison County Summary
Addison County is located in the state of Vermont, in the United States of America. It is the second-smallest county in the state, with a total area of 622 square miles. The county is bordered by Chittenden County to the north, Rutland County to the east, Washington County to the south, and New York to the west. The county seat is Middlebury, and the largest city is Vergennes.
History
Addison County was created in 1785, and was named after Joseph Addison, an English essayist and poet. The county was originally part of Rutland County, and was later divided into its own county. The first settlers in the area were mostly from Connecticut, and they began arriving in the late 1700s. The first town in the county was Middlebury, which was founded in 1787.
Geography
Addison County is located in the western part of Vermont, and is bordered by Chittenden County to the north, Rutland County to the east, Washington County to the south, and New York to the west. The county is mostly rural, with rolling hills and valleys. The highest point in the county is Mount Abraham, which has an elevation of 4,083 feet. The county is home to several rivers, including the Otter Creek, the Winooski River, and the Lamoille River.
Economy
The economy of Addison County is largely based on agriculture and tourism. The county is home to several dairy farms, as well as apple orchards and other fruit farms. The county is also home to several wineries, breweries, and distilleries. Tourism is also an important part of the economy, with many visitors coming to the area to enjoy the natural beauty of the county.
Demographics
As of the 2010 census, the population of Addison County was 36,821. The population is mostly white (94.3%), with small percentages of African American (1.2%), Asian (1.2%), and Native American (0.5%) residents. The median household income in the county is $50,945, and the median age is 43.7 years.
Conclusion
Addison County is a rural county located in the western part of Vermont. It is home to rolling hills, rivers, and farms, and is an important part of the state’s economy. The population of the county is mostly white, with small percentages of African American, Asian, and Native American residents. The county is home to several dairy farms, wineries, breweries, and distilleries, and is a popular destination for tourists.
Common Questions
What is the Total Population of Addison County?
Total Population of Addison County is 37,434.
What is the Total Male Population of Addison County?
Total Male Population of Addison County is 18,716.
What is the Total Female Population of Addison County?
Total Female Population of Addison County is 18,718.
What is the Ratio of Males per 100 Females in Addison County?
There are 99.99 Males per 100 Females in Addison County.
What is the Ratio of Females per 100 Males in Addison County?
There are 100.01 Females per 100 Males in Addison County.
What is the Median Population Age in Addison County?
Median Population Age in Addison County is 43.9 Years.
What is the Average Family Size in Addison County
Average Family Size in Addison County is 2.9 People.
What is the Average Household Size in Addison County
Average Household Size in Addison County is 2.4 People.
What is Per Capita Income in Addison County?
Per Capita income in Addison County is $42,271.
What is the Median Family Income in Addison County?
Median Family Income in Addison County is $104,167.
What is the Median Household income in Addison County?
Median Household Income in Addison County is $85,870.
What is Income or Wage Gap in Addison County?
Income or Wage Gap in Addison County is 25.4%.
Women in Addison County earn 74.6 cents for every dollar earned by a man.
What is Family Income Deficit in Addison County?
Family Income Deficit in Addison County is $10,367.
Families that are below poverty line in Addison County earn $10,367 less on average than the poverty threshold level.
What is Inequality or Gini Index in Addison County?
Inequality or Gini Index in Addison County is 0.41.
How Large is the Labor Force in Addison County?
There are 20,678 People in the Labor Forcein in Addison County.
What is the Percentage of People in the Labor Force in Addison County?
64.5% of People are in the Labor Force in Addison County.
What is the Unemployment Rate in Addison County?
Unemployment Rate in Addison County is 4.1%.