Albany, VT
Albany Map
Albany Overview
201
TOTAL POPULATION
113
MALE POPULATION
88
FEMALE POPULATION
128.41
MALES / 100 FEMALES
77.88
FEMALES / 100 MALES
41.4
MEDIAN AGE
3.1
AVG FAMILY SIZE
3.1
AVG HOUSEHOLD SIZE
$33,612
PER CAPITA INCOME
$96,250
AVG FAMILY INCOME
$88,125
AVG HOUSEHOLD INCOME
0.35
INEQUALITY / GINI INDEX
98
LABOR FORCE [ PEOPLE ]
64.1%
PERCENT IN LABOR FORCE
Albany Zip Codes
Albany Area Codes
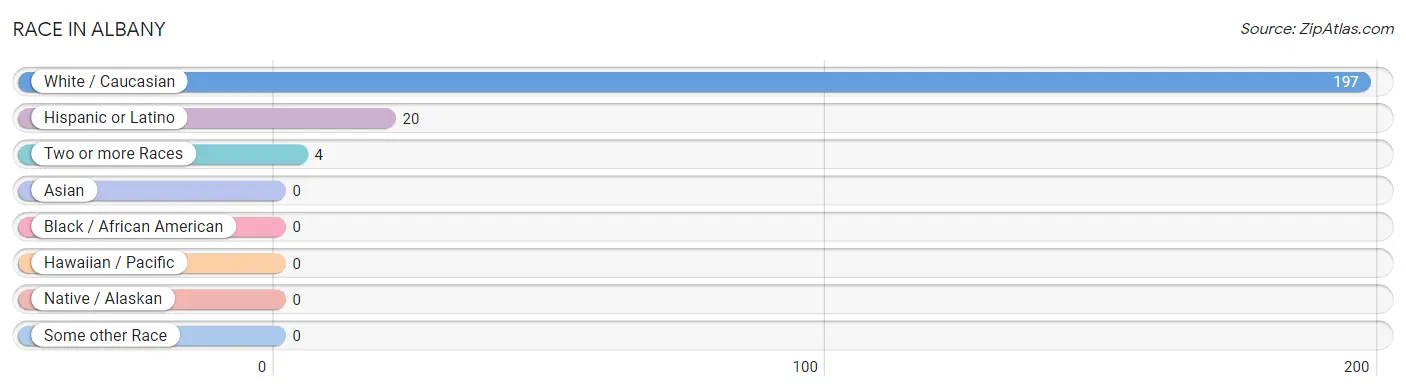
Race in Albany
The most populous races in Albany are White / Caucasian (197 | 98.0%), Hispanic or Latino (20 | 10.0%), and Two or more Races (4 | 2.0%).
| Race | # Population | % Population |
| Asian | 0 | 0.0% |
| Black / African American | 0 | 0.0% |
| Hawaiian / Pacific | 0 | 0.0% |
| Hispanic or Latino | 20 | 10.0% |
| Native / Alaskan | 0 | 0.0% |
| White / Caucasian | 197 | 98.0% |
| Two or more Races | 4 | 2.0% |
| Some other Race | 0 | 0.0% |
| Total | 201 | 100.0% |
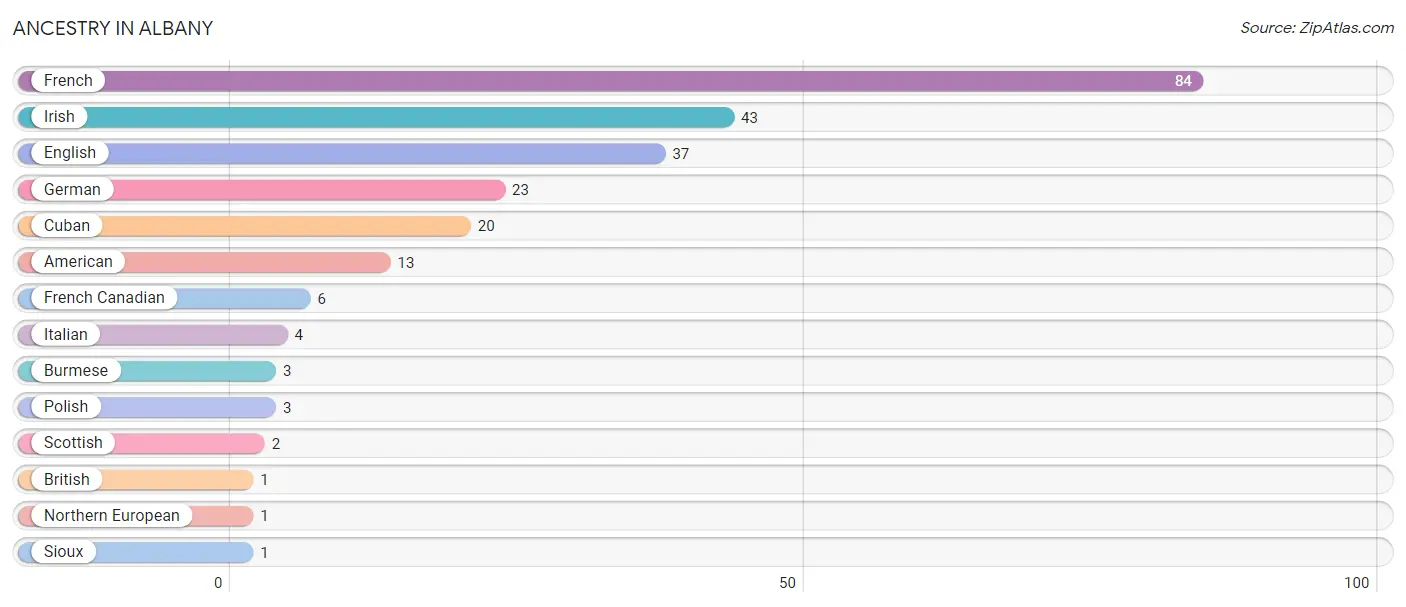
Ancestry in Albany
The most populous ancestries reported in Albany are French (84 | 41.8%), Irish (43 | 21.4%), English (37 | 18.4%), German (23 | 11.4%), and Cuban (20 | 10.0%), together accounting for 103.0% of all Albany residents.
| Ancestry | # Population | % Population |
| American | 13 | 6.5% |
| British | 1 | 0.5% |
| Burmese | 3 | 1.5% |
| Cuban | 20 | 10.0% |
| English | 37 | 18.4% |
| French | 84 | 41.8% |
| French Canadian | 6 | 3.0% |
| German | 23 | 11.4% |
| Irish | 43 | 21.4% |
| Italian | 4 | 2.0% |
| Northern European | 1 | 0.5% |
| Polish | 3 | 1.5% |
| Scottish | 2 | 1.0% |
| Sioux | 1 | 0.5% | View All 14 Rows |
Immigrants in Albany

| Immigration Origin | # Population | % Population | View All 0 Rows |
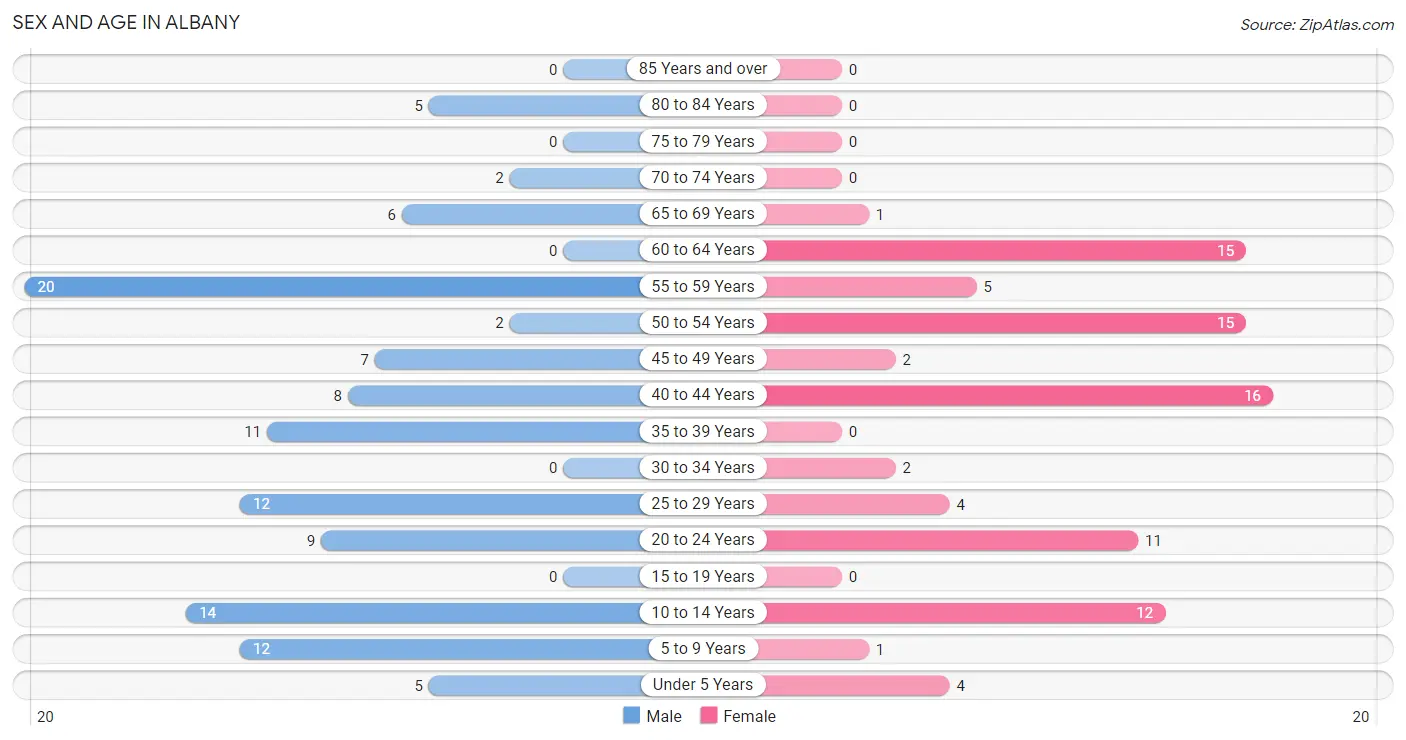
Sex and Age in Albany
Sex and Age in Albany
The most populous age groups in Albany are 55 to 59 Years (20 | 17.7%) for men and 40 to 44 Years (16 | 18.2%) for women.
| Age Bracket | Male | Female |
| Under 5 Years | 5 (4.4%) | 4 (4.5%) |
| 5 to 9 Years | 12 (10.6%) | 1 (1.1%) |
| 10 to 14 Years | 14 (12.4%) | 12 (13.6%) |
| 15 to 19 Years | 0 (0.0%) | 0 (0.0%) |
| 20 to 24 Years | 9 (8.0%) | 11 (12.5%) |
| 25 to 29 Years | 12 (10.6%) | 4 (4.5%) |
| 30 to 34 Years | 0 (0.0%) | 2 (2.3%) |
| 35 to 39 Years | 11 (9.7%) | 0 (0.0%) |
| 40 to 44 Years | 8 (7.1%) | 16 (18.2%) |
| 45 to 49 Years | 7 (6.2%) | 2 (2.3%) |
| 50 to 54 Years | 2 (1.8%) | 15 (17.1%) |
| 55 to 59 Years | 20 (17.7%) | 5 (5.7%) |
| 60 to 64 Years | 0 (0.0%) | 15 (17.1%) |
| 65 to 69 Years | 6 (5.3%) | 1 (1.1%) |
| 70 to 74 Years | 2 (1.8%) | 0 (0.0%) |
| 75 to 79 Years | 0 (0.0%) | 0 (0.0%) |
| 80 to 84 Years | 5 (4.4%) | 0 (0.0%) |
| 85 Years and over | 0 (0.0%) | 0 (0.0%) |
| Total | 113 (100.0%) | 88 (100.0%) |
Families and Households in Albany
Median Family Size in Albany
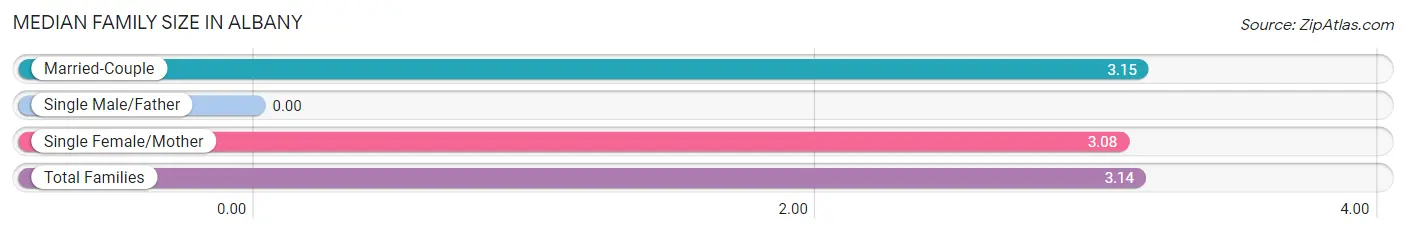
| Family Type | # Families | Family Size |
| Married-Couple | 46 (79.3%) | 3.15 |
| Single Male/Father | 0 (0.0%) | - |
| Single Female/Mother | 12 (20.7%) | 3.08 |
| Total Families | 58 (100.0%) | 3.14 |
Median Household Size in Albany
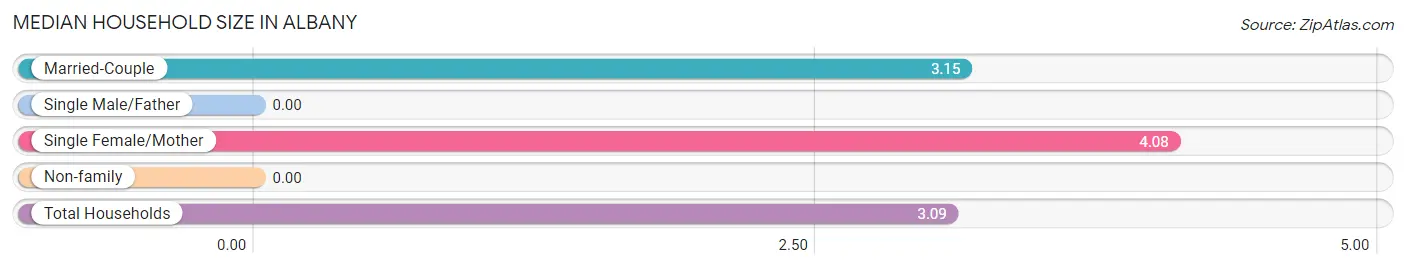
| Household Type | # Households | Household Size |
| Married-Couple | 46 (70.8%) | 3.15 |
| Single Male/Father | 0 (0.0%) | - |
| Single Female/Mother | 12 (18.5%) | 4.08 |
| Non-family | 7 (10.8%) | - |
| Total Households | 65 (100.0%) | 3.09 |
Household Size by Marriage Status in Albany
Out of a total of 65 households in Albany, 58 (89.2%) are family households, while 7 (10.8%) are nonfamily households. The most numerous type of family households are 2-person households, comprising 22, and the most common type of nonfamily households are 1-person households, comprising 7.
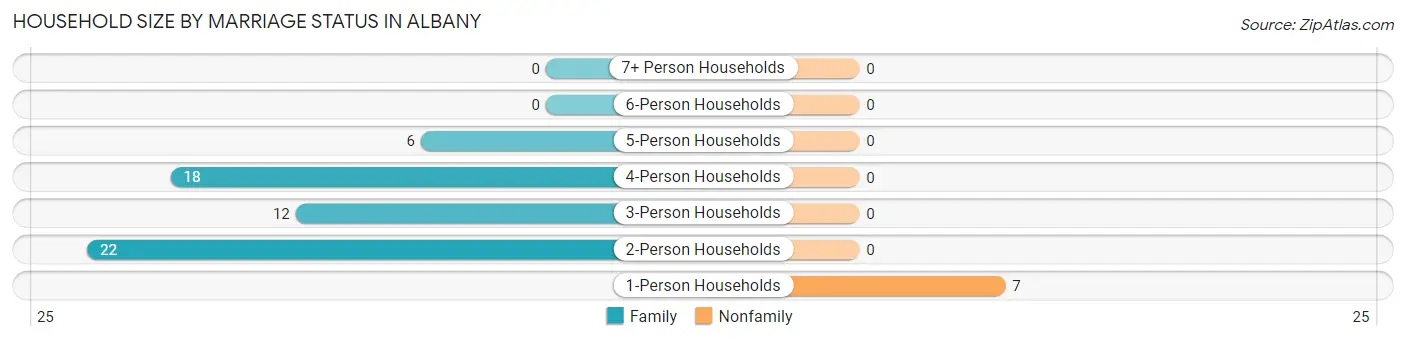
| Household Size | Family Households | Nonfamily Households |
| 1-Person Households | - | 7 (10.8%) |
| 2-Person Households | 22 (33.9%) | 0 (0.0%) |
| 3-Person Households | 12 (18.5%) | 0 (0.0%) |
| 4-Person Households | 18 (27.7%) | 0 (0.0%) |
| 5-Person Households | 6 (9.2%) | 0 (0.0%) |
| 6-Person Households | 0 (0.0%) | 0 (0.0%) |
| 7+ Person Households | 0 (0.0%) | 0 (0.0%) |
| Total | 58 (89.2%) | 7 (10.8%) |
Female Fertility in Albany
Fertility by Age in Albany
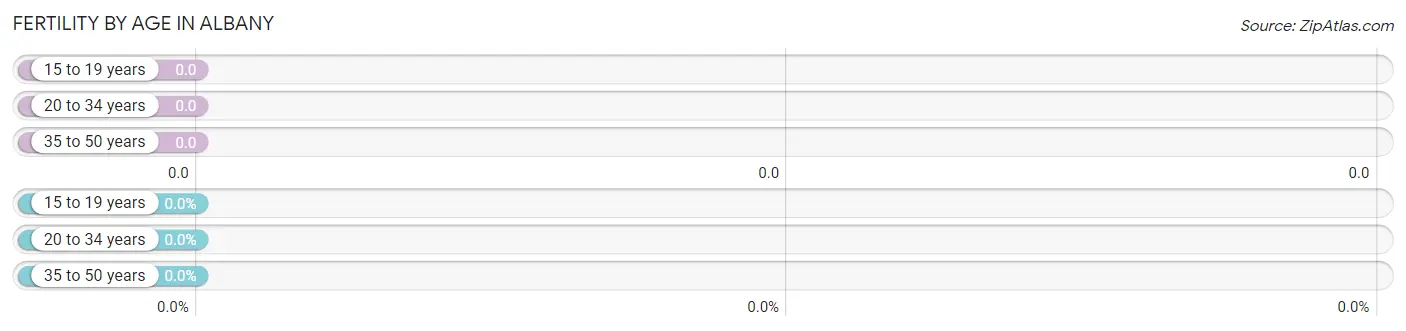
| Age Bracket | Women with Births | Births / 1,000 Women |
| 15 to 19 years | 0 (0.0%) | 0.0 |
| 20 to 34 years | 0 (0.0%) | 0.0 |
| 35 to 50 years | 0 (0.0%) | 0.0 |
| Total | 0 (0.0%) | 0.0 |
Fertility by Age by Marriage Status in Albany
| Age Bracket | Married | Unmarried |
| 15 to 19 years | 0 (0.0%) | 0 (0.0%) |
| 20 to 34 years | 0 (0.0%) | 0 (0.0%) |
| 35 to 50 years | 0 (0.0%) | 0 (0.0%) |
| Total | 0 (0.0%) | 0 (0.0%) |
Fertility by Education in Albany
| Educational Attainment | Women with Births | Births / 1,000 Women |
| Less than High School | 0 (0.0%) | 0.0 |
| High School Diploma | 0 (0.0%) | 0.0 |
| College or Associate's Degree | 0 (0.0%) | 0.0 |
| Bachelor's Degree | 0 (0.0%) | 0.0 |
| Graduate Degree | 0 (0.0%) | 0.0 |
| Total | 0 (0.0%) | 0.0 |
Fertility by Education by Marriage Status in Albany
| Educational Attainment | Married | Unmarried |
| Less than High School | 0 (0.0%) | 0 (0.0%) |
| High School Diploma | 0 (0.0%) | 0 (0.0%) |
| College or Associate's Degree | 0 (0.0%) | 0 (0.0%) |
| Bachelor's Degree | 0 (0.0%) | 0 (0.0%) |
| Graduate Degree | 0 (0.0%) | 0 (0.0%) |
| Total | 0 (0.0%) | 0 (0.0%) |
Income in Albany
Income Overview in Albany
Per Capita Income in Albany is $33,612, while median incomes of families and households are $96,250 and $88,125 respectively.
| Characteristic | Number | Measure |
| Per Capita Income | 201 | $33,612 |
| Median Family Income | 58 | $96,250 |
| Mean Family Income | 58 | $99,086 |
| Median Household Income | 65 | $88,125 |
| Mean Household Income | 65 | $100,732 |
| Income Deficit | 58 | $0 |
| Wage / Income Gap (%) | 201 | 0.00% |
| Wage / Income Gap ($) | 201 | 100.00¢ per $1 |
| Gini / Inequality Index | 201 | 0.35 |
Earnings by Sex in Albany
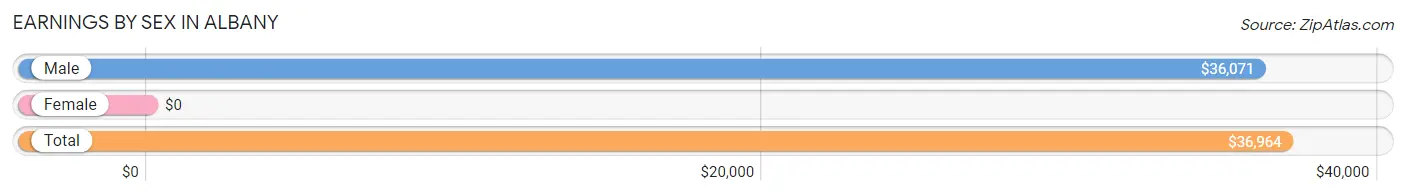
| Sex | Number | Average Earnings |
| Male | 62 (53.0%) | $36,071 |
| Female | 55 (47.0%) | $0 |
| Total | 117 (100.0%) | $36,964 |
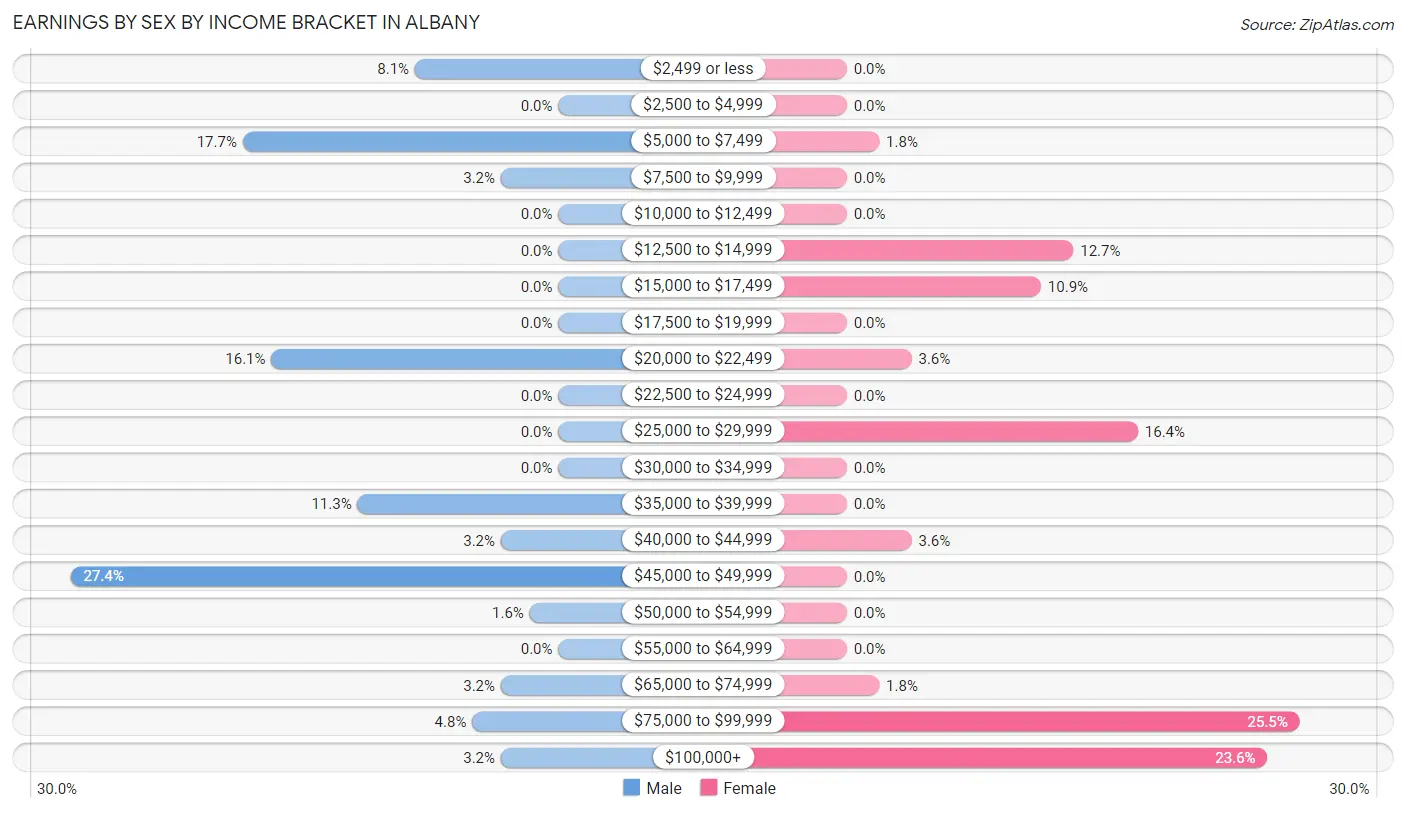
Earnings by Sex by Income Bracket in Albany
The most common earnings brackets in Albany are $45,000 to $49,999 for men (17 | 27.4%) and $75,000 to $99,999 for women (14 | 25.5%).
| Income | Male | Female |
| $2,499 or less | 5 (8.1%) | 0 (0.0%) |
| $2,500 to $4,999 | 0 (0.0%) | 0 (0.0%) |
| $5,000 to $7,499 | 11 (17.7%) | 1 (1.8%) |
| $7,500 to $9,999 | 2 (3.2%) | 0 (0.0%) |
| $10,000 to $12,499 | 0 (0.0%) | 0 (0.0%) |
| $12,500 to $14,999 | 0 (0.0%) | 7 (12.7%) |
| $15,000 to $17,499 | 0 (0.0%) | 6 (10.9%) |
| $17,500 to $19,999 | 0 (0.0%) | 0 (0.0%) |
| $20,000 to $22,499 | 10 (16.1%) | 2 (3.6%) |
| $22,500 to $24,999 | 0 (0.0%) | 0 (0.0%) |
| $25,000 to $29,999 | 0 (0.0%) | 9 (16.4%) |
| $30,000 to $34,999 | 0 (0.0%) | 0 (0.0%) |
| $35,000 to $39,999 | 7 (11.3%) | 0 (0.0%) |
| $40,000 to $44,999 | 2 (3.2%) | 2 (3.6%) |
| $45,000 to $49,999 | 17 (27.4%) | 0 (0.0%) |
| $50,000 to $54,999 | 1 (1.6%) | 0 (0.0%) |
| $55,000 to $64,999 | 0 (0.0%) | 0 (0.0%) |
| $65,000 to $74,999 | 2 (3.2%) | 1 (1.8%) |
| $75,000 to $99,999 | 3 (4.8%) | 14 (25.5%) |
| $100,000+ | 2 (3.2%) | 13 (23.6%) |
| Total | 62 (100.0%) | 55 (100.0%) |
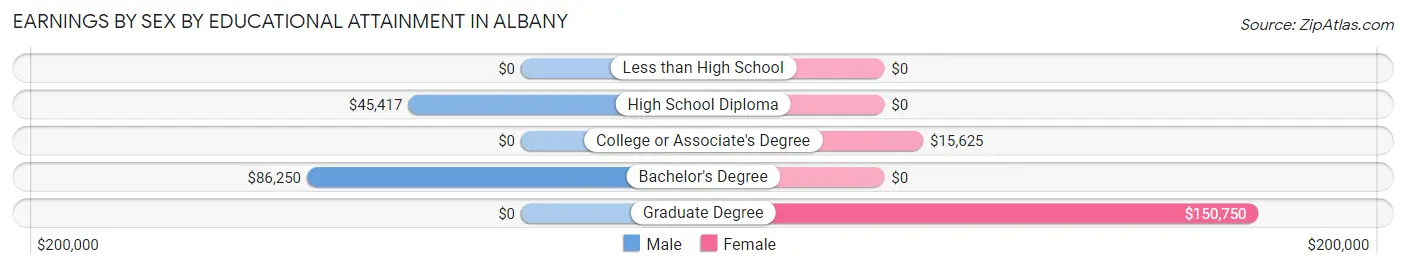
Earnings by Sex by Educational Attainment in Albany
Average earnings in Albany are $40,625 for men and $81,389 for women, a difference of 50.1%. Men with an educational attainment of bachelor's degree enjoy the highest average annual earnings of $86,250, while those with high school diploma education earn the least with $45,417. Women with an educational attainment of graduate degree earn the most with the average annual earnings of $150,750, while those with college or associate's degree education have the smallest earnings of $15,625.
| Educational Attainment | Male Income | Female Income |
| Less than High School | - | - |
| High School Diploma | $45,417 | $0 |
| College or Associate's Degree | - | - |
| Bachelor's Degree | $86,250 | $0 |
| Graduate Degree | - | - |
| Total | $40,625 | $81,389 |
Family Income in Albany
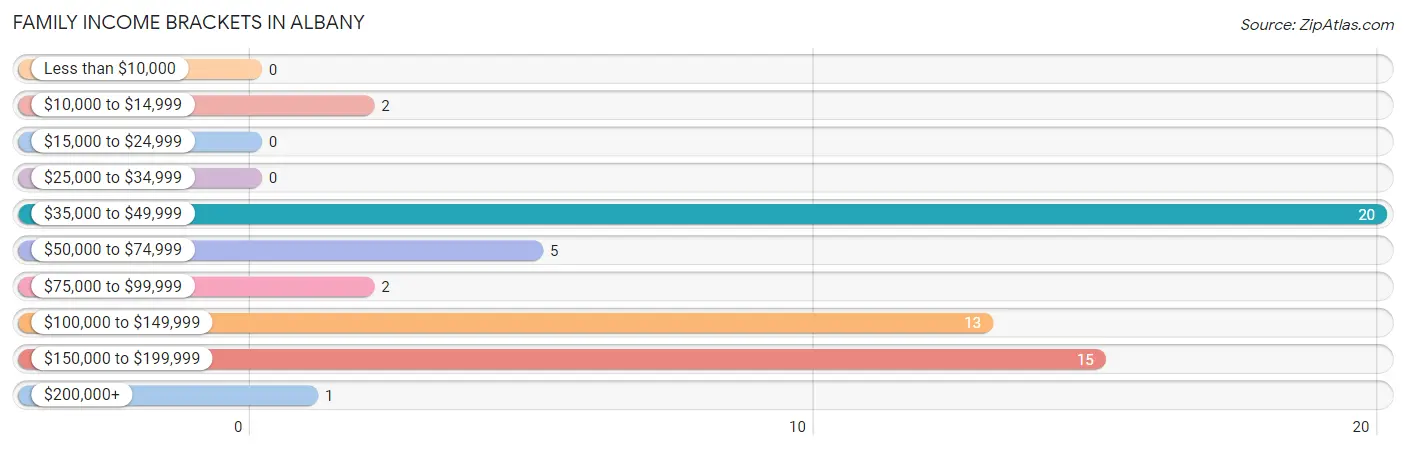
Family Income Brackets in Albany
According to the Albany family income data, there are 20 families falling into the $35,000 to $49,999 income range, which is the most common income bracket and makes up 34.5% of all families.
| Income Bracket | # Families | % Families |
| Less than $10,000 | 0 | 0.0% |
| $10,000 to $14,999 | 2 | 3.4% |
| $15,000 to $24,999 | 0 | 0.0% |
| $25,000 to $34,999 | 0 | 0.0% |
| $35,000 to $49,999 | 20 | 34.5% |
| $50,000 to $74,999 | 5 | 8.6% |
| $75,000 to $99,999 | 2 | 3.4% |
| $100,000 to $149,999 | 13 | 22.4% |
| $150,000 to $199,999 | 15 | 25.9% |
| $200,000+ | 1 | 1.7% |
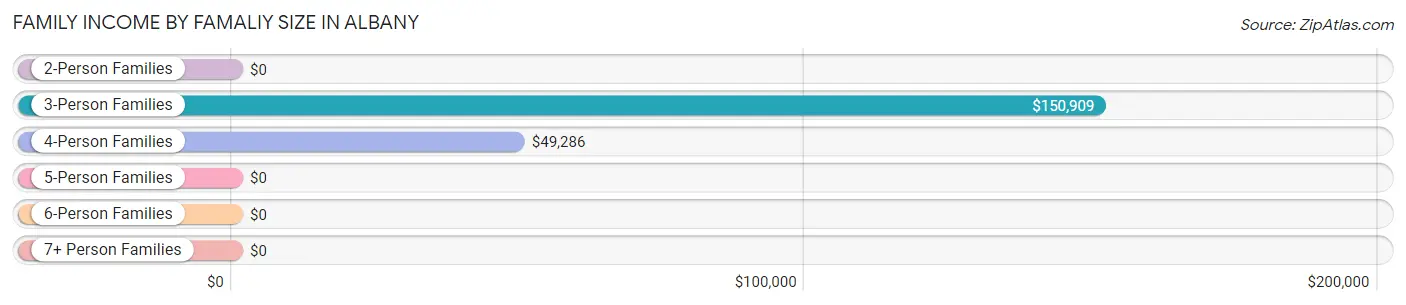
Family Income by Famaliy Size in Albany
3-person families (22 | 37.9%) account for the highest median family income in Albany with $150,909 per family, while 3-person families (22 | 37.9%) have the highest median income of $50,303 per family member.
| Income Bracket | # Families | Median Income |
| 2-Person Families | 22 (37.9%) | $0 |
| 3-Person Families | 22 (37.9%) | $150,909 |
| 4-Person Families | 10 (17.2%) | $49,286 |
| 5-Person Families | 4 (6.9%) | $0 |
| 6-Person Families | 0 (0.0%) | $0 |
| 7+ Person Families | 0 (0.0%) | $0 |
| Total | 58 (100.0%) | $96,250 |
Family Income by Number of Earners in Albany
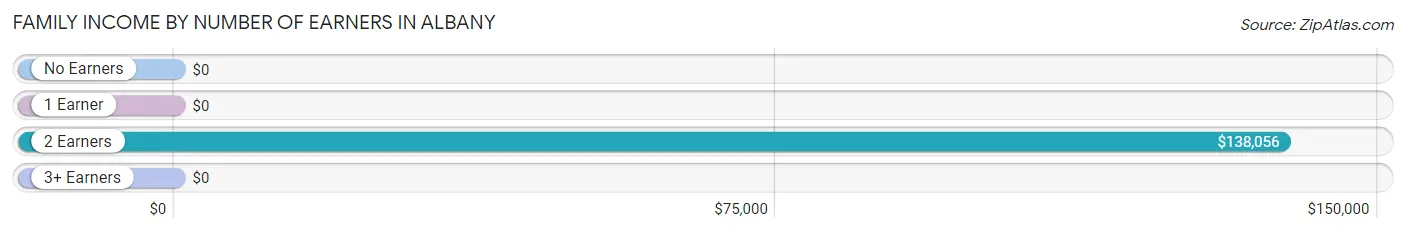
| Number of Earners | # Families | Median Income |
| No Earners | 2 (3.5%) | $0 |
| 1 Earner | 26 (44.8%) | $0 |
| 2 Earners | 22 (37.9%) | $138,056 |
| 3+ Earners | 8 (13.8%) | $0 |
| Total | 58 (100.0%) | $96,250 |
Household Income in Albany
Household Income Brackets in Albany
With 20 households falling in the category, the $35,000 to $49,999 income range is the most frequent in Albany, accounting for 30.8% of all households.
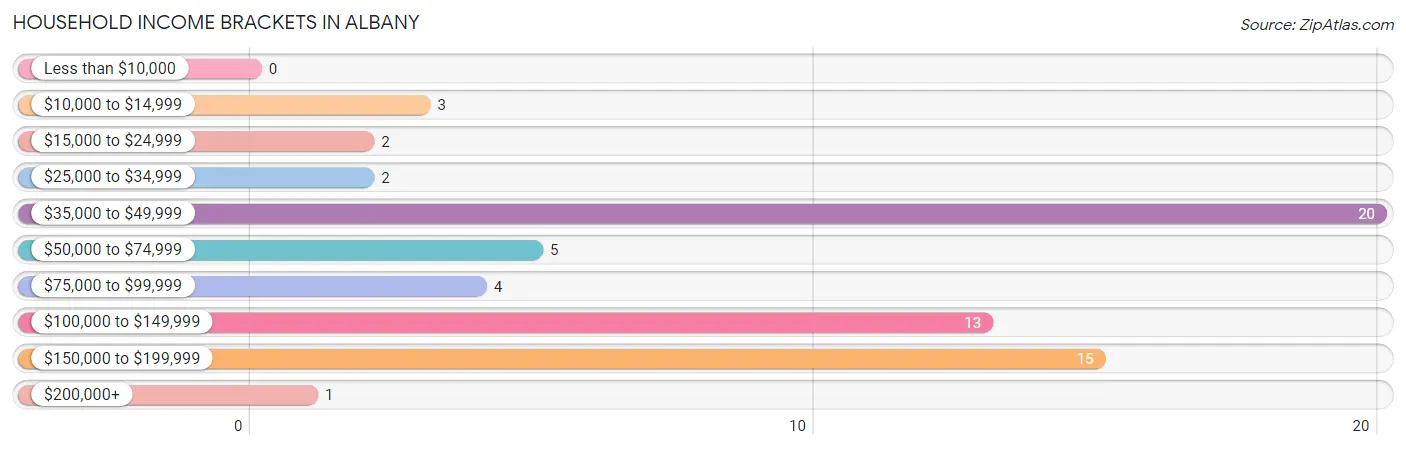
| Income Bracket | # Households | % Households |
| Less than $10,000 | 0 | 0.0% |
| $10,000 to $14,999 | 3 | 4.6% |
| $15,000 to $24,999 | 2 | 3.1% |
| $25,000 to $34,999 | 2 | 3.1% |
| $35,000 to $49,999 | 20 | 30.8% |
| $50,000 to $74,999 | 5 | 7.7% |
| $75,000 to $99,999 | 4 | 6.2% |
| $100,000 to $149,999 | 13 | 20.0% |
| $150,000 to $199,999 | 15 | 23.1% |
| $200,000+ | 1 | 1.5% |
Household Income by Householder Age in Albany
The median household income in Albany is $88,125, with the highest median household income of $186,250 found in the 25 to 44 years age bracket for the primary householder. A total of 20 households (30.8%) fall into this category.
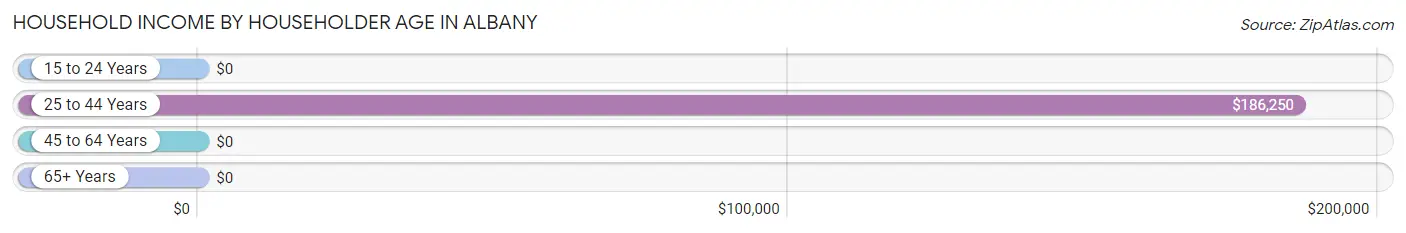
| Income Bracket | # Households | Median Income |
| 15 to 24 Years | 0 (0.0%) | $0 |
| 25 to 44 Years | 20 (30.8%) | $186,250 |
| 45 to 64 Years | 37 (56.9%) | $0 |
| 65+ Years | 8 (12.3%) | $0 |
| Total | 65 (100.0%) | $88,125 |
Poverty in Albany
Income Below Poverty by Sex and Age in Albany
With 1.8% poverty level for males and 2.3% for females among the residents of Albany, 55 to 64 year old males and 55 to 64 year old females are the most vulnerable to poverty, with 2 males (10.0%) and 2 females (10.0%) in their respective age groups living below the poverty level.
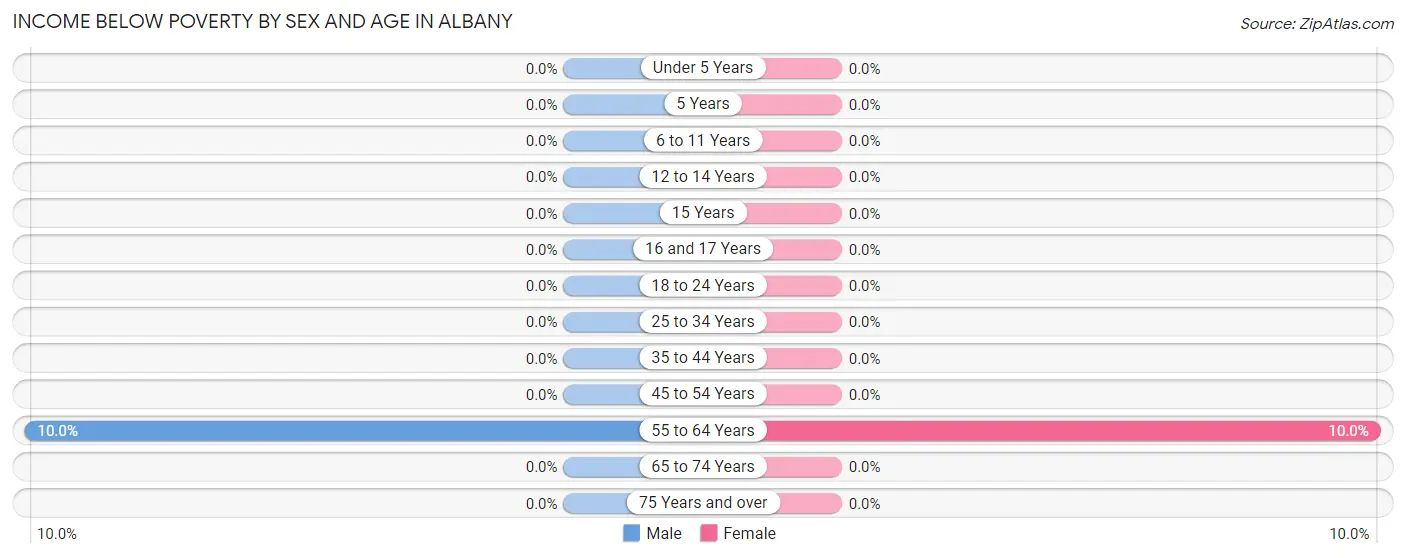
| Age Bracket | Male | Female |
| Under 5 Years | 0 (0.0%) | 0 (0.0%) |
| 5 Years | 0 (0.0%) | 0 (0.0%) |
| 6 to 11 Years | 0 (0.0%) | 0 (0.0%) |
| 12 to 14 Years | 0 (0.0%) | 0 (0.0%) |
| 15 Years | 0 (0.0%) | 0 (0.0%) |
| 16 and 17 Years | 0 (0.0%) | 0 (0.0%) |
| 18 to 24 Years | 0 (0.0%) | 0 (0.0%) |
| 25 to 34 Years | 0 (0.0%) | 0 (0.0%) |
| 35 to 44 Years | 0 (0.0%) | 0 (0.0%) |
| 45 to 54 Years | 0 (0.0%) | 0 (0.0%) |
| 55 to 64 Years | 2 (10.0%) | 2 (10.0%) |
| 65 to 74 Years | 0 (0.0%) | 0 (0.0%) |
| 75 Years and over | 0 (0.0%) | 0 (0.0%) |
| Total | 2 (1.8%) | 2 (2.3%) |
Income Above Poverty by Sex and Age in Albany
According to the poverty statistics in Albany, males aged under 5 years and females aged under 5 years are the age groups that are most secure financially, with 100.0% of males and 100.0% of females in these age groups living above the poverty line.
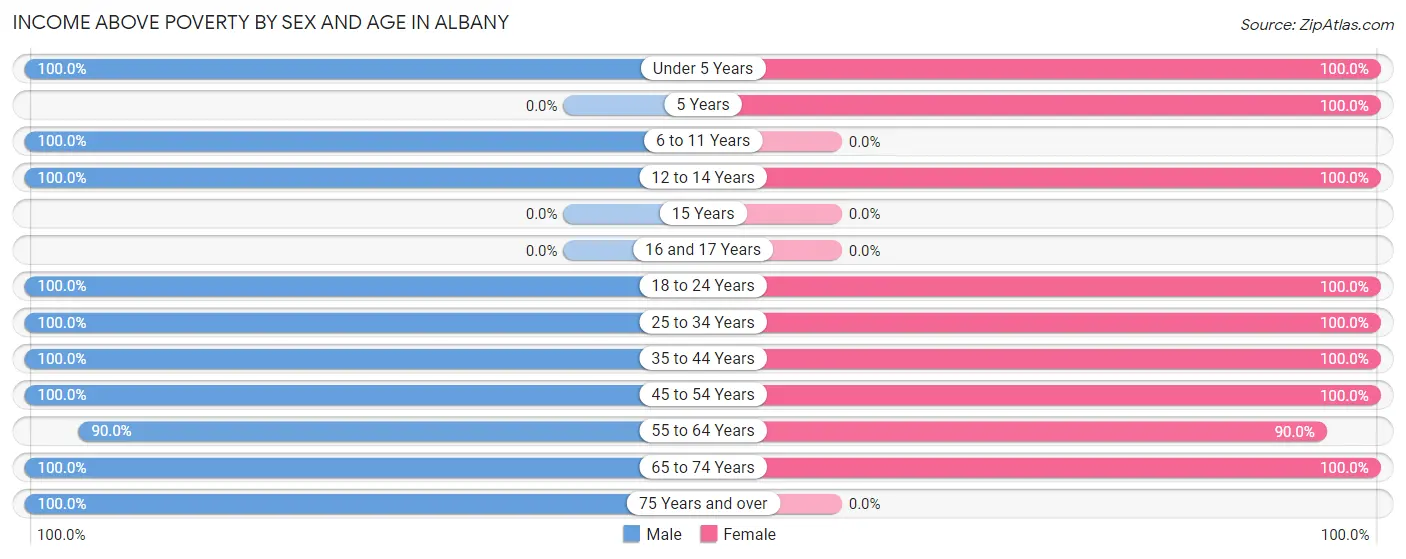
| Age Bracket | Male | Female |
| Under 5 Years | 5 (100.0%) | 4 (100.0%) |
| 5 Years | 0 (0.0%) | 1 (100.0%) |
| 6 to 11 Years | 21 (100.0%) | 0 (0.0%) |
| 12 to 14 Years | 5 (100.0%) | 12 (100.0%) |
| 15 Years | 0 (0.0%) | 0 (0.0%) |
| 16 and 17 Years | 0 (0.0%) | 0 (0.0%) |
| 18 to 24 Years | 9 (100.0%) | 11 (100.0%) |
| 25 to 34 Years | 12 (100.0%) | 6 (100.0%) |
| 35 to 44 Years | 19 (100.0%) | 16 (100.0%) |
| 45 to 54 Years | 9 (100.0%) | 17 (100.0%) |
| 55 to 64 Years | 18 (90.0%) | 18 (90.0%) |
| 65 to 74 Years | 8 (100.0%) | 1 (100.0%) |
| 75 Years and over | 5 (100.0%) | 0 (0.0%) |
| Total | 111 (98.2%) | 86 (97.7%) |
Income Below Poverty Among Married-Couple Families in Albany
The poverty statistics for married-couple families in Albany show that 4.3% or 2 of the total 46 families live below the poverty line. Families with no children have the highest poverty rate of 5.4%, comprising of 2 families. On the other hand, families with 1 or 2 children have the lowest poverty rate of 0.0%, which includes 0 families.
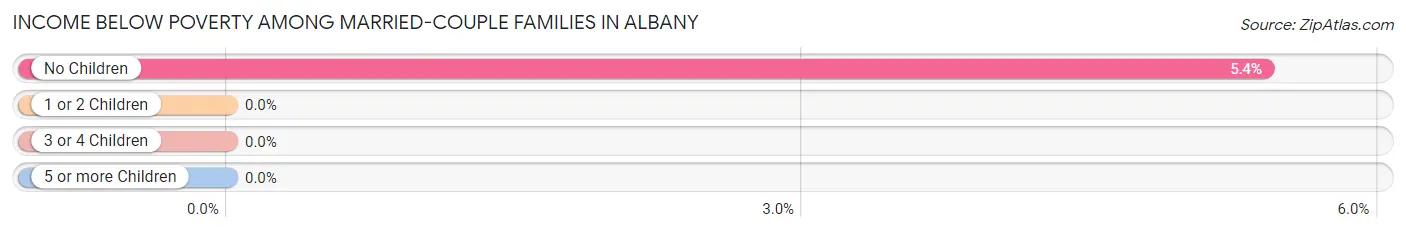
| Children | Above Poverty | Below Poverty |
| No Children | 35 (94.6%) | 2 (5.4%) |
| 1 or 2 Children | 5 (100.0%) | 0 (0.0%) |
| 3 or 4 Children | 4 (100.0%) | 0 (0.0%) |
| 5 or more Children | 0 (0.0%) | 0 (0.0%) |
| Total | 44 (95.7%) | 2 (4.3%) |
Income Below Poverty Among Single-Parent Households in Albany
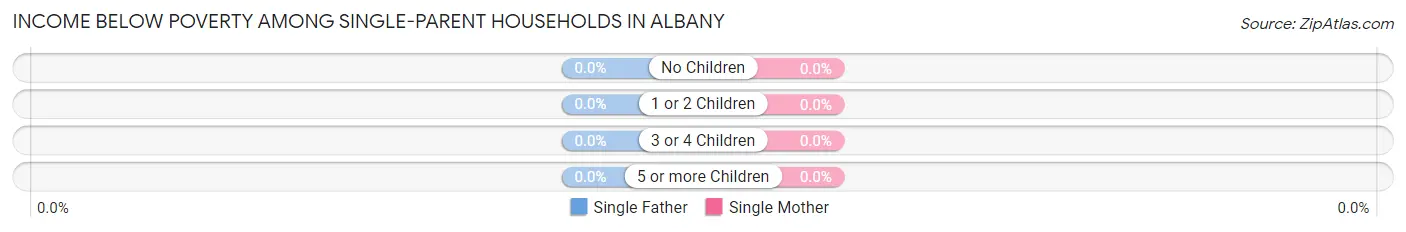
| Children | Single Father | Single Mother |
| No Children | 0 (0.0%) | 0 (0.0%) |
| 1 or 2 Children | 0 (0.0%) | 0 (0.0%) |
| 3 or 4 Children | 0 (0.0%) | 0 (0.0%) |
| 5 or more Children | 0 (0.0%) | 0 (0.0%) |
| Total | 0 (0.0%) | 0 (0.0%) |
Income Below Poverty Among Married-Couple vs Single-Parent Households in Albany
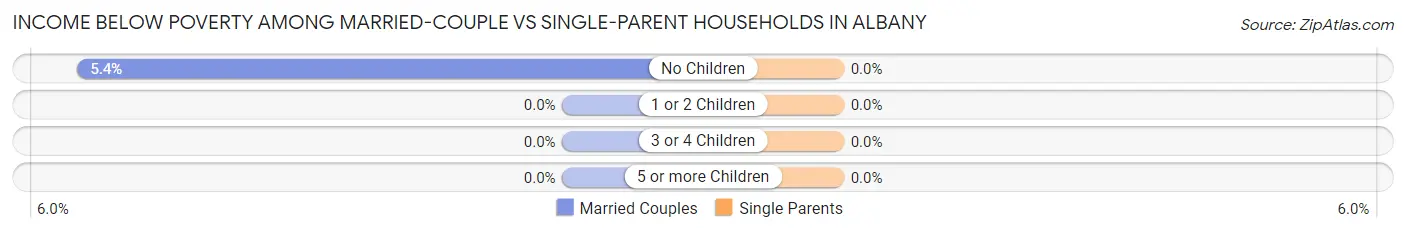
| Children | Married-Couple Families | Single-Parent Households |
| No Children | 2 (5.4%) | 0 (0.0%) |
| 1 or 2 Children | 0 (0.0%) | 0 (0.0%) |
| 3 or 4 Children | 0 (0.0%) | 0 (0.0%) |
| 5 or more Children | 0 (0.0%) | 0 (0.0%) |
| Total | 2 (4.3%) | 0 (0.0%) |
Employment Characteristics in Albany
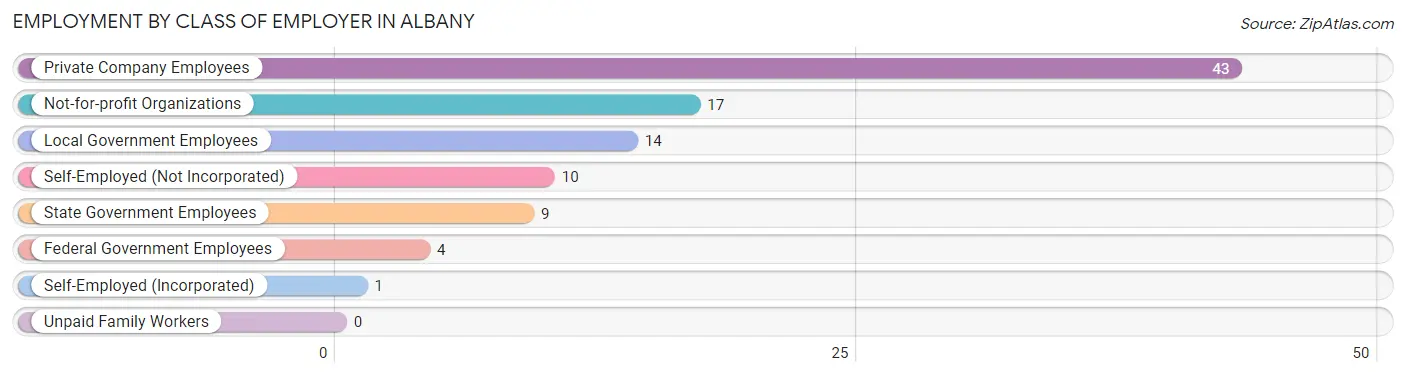
Employment by Class of Employer in Albany
Among the 98 employed individuals in Albany, private company employees (43 | 43.9%), not-for-profit organizations (17 | 17.3%), and local government employees (14 | 14.3%) make up the most common classes of employment.
| Employer Class | # Employees | % Employees |
| Private Company Employees | 43 | 43.9% |
| Self-Employed (Incorporated) | 1 | 1.0% |
| Self-Employed (Not Incorporated) | 10 | 10.2% |
| Not-for-profit Organizations | 17 | 17.3% |
| Local Government Employees | 14 | 14.3% |
| State Government Employees | 9 | 9.2% |
| Federal Government Employees | 4 | 4.1% |
| Unpaid Family Workers | 0 | 0.0% |
| Total | 98 | 100.0% |
Employment Status by Age in Albany
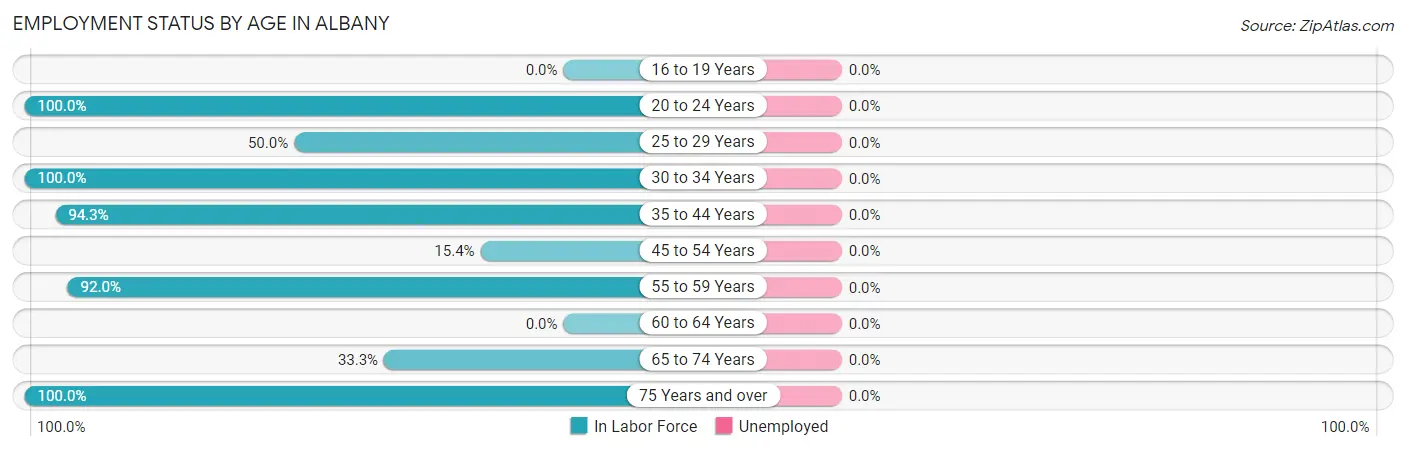
| Age Bracket | In Labor Force | Unemployed |
| 16 to 19 Years | 0 (0.0%) | 0 (0.0%) |
| 20 to 24 Years | 20 (100.0%) | 0 (0.0%) |
| 25 to 29 Years | 8 (50.0%) | 0 (0.0%) |
| 30 to 34 Years | 2 (100.0%) | 0 (0.0%) |
| 35 to 44 Years | 33 (94.3%) | 0 (0.0%) |
| 45 to 54 Years | 4 (15.4%) | 0 (0.0%) |
| 55 to 59 Years | 23 (92.0%) | 0 (0.0%) |
| 60 to 64 Years | 0 (0.0%) | 0 (0.0%) |
| 65 to 74 Years | 3 (33.3%) | 0 (0.0%) |
| 75 Years and over | 5 (100.0%) | 0 (0.0%) |
| Total | 98 (64.1%) | 0 (0.0%) |
Employment Status by Educational Attainment in Albany
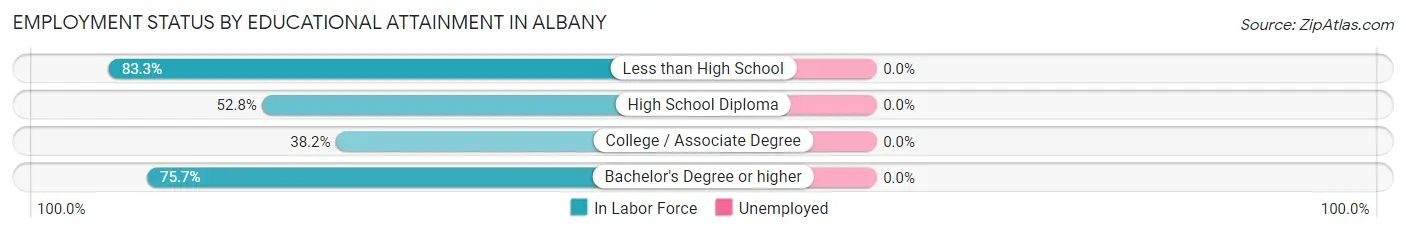
| Educational Attainment | In Labor Force | Unemployed |
| Less than High School | 10 (83.3%) | 0 (0.0%) |
| High School Diploma | 19 (52.8%) | 0 (0.0%) |
| College / Associate Degree | 13 (38.2%) | 0 (0.0%) |
| Bachelor's Degree or higher | 28 (75.7%) | 0 (0.0%) |
| Total | 70 (58.8%) | 0 (0.0%) |
Employment Occupations by Sex in Albany
Management, Business, Science and Arts Occupations
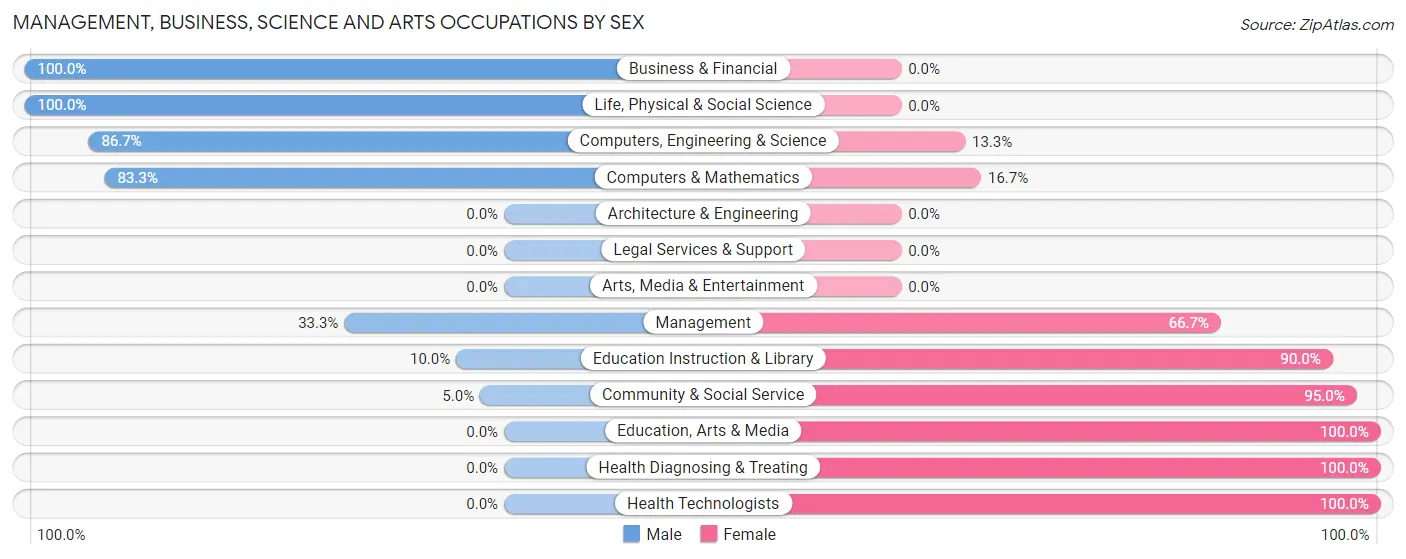
The most common Management, Business, Science and Arts occupations in Albany are Community & Social Service (20 | 20.4%), Computers, Engineering & Science (15 | 15.3%), Computers & Mathematics (12 | 12.2%), Education, Arts & Media (10 | 10.2%), and Education Instruction & Library (10 | 10.2%).
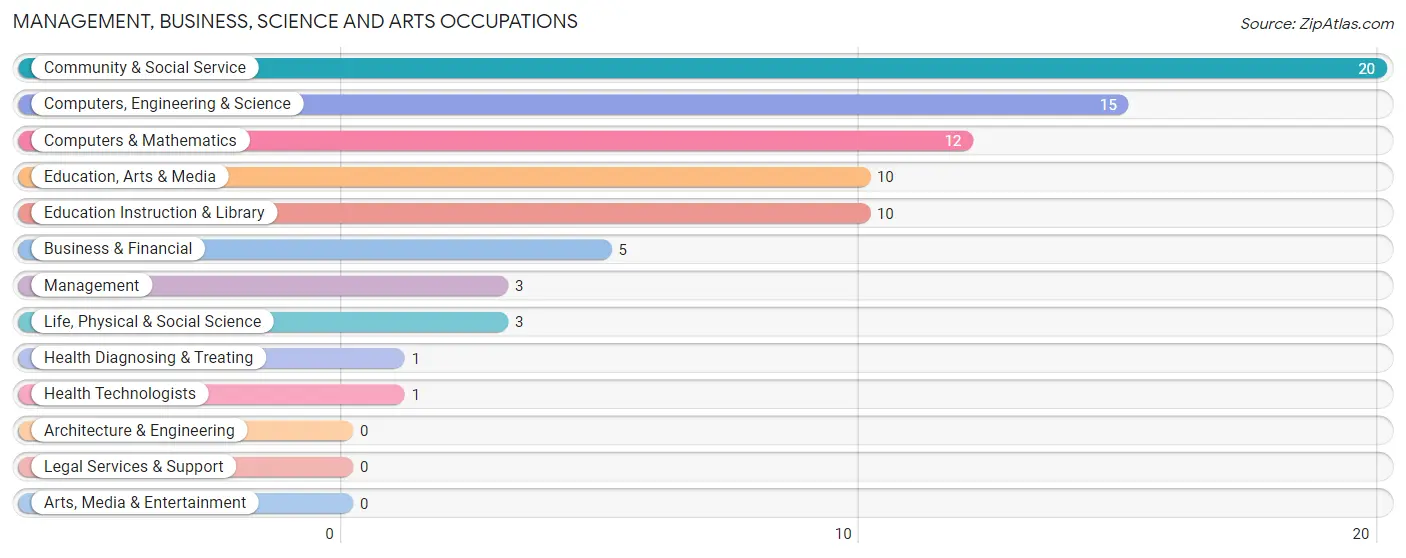
Management, Business, Science and Arts Occupations by Sex
Within the Management, Business, Science and Arts occupations in Albany, the most male-oriented occupations are Business & Financial (100.0%), Life, Physical & Social Science (100.0%), and Computers, Engineering & Science (86.7%), while the most female-oriented occupations are Education, Arts & Media (100.0%), Health Diagnosing & Treating (100.0%), and Health Technologists (100.0%).
| Occupation | Male | Female |
| Management | 1 (33.3%) | 2 (66.7%) |
| Business & Financial | 5 (100.0%) | 0 (0.0%) |
| Computers, Engineering & Science | 13 (86.7%) | 2 (13.3%) |
| Computers & Mathematics | 10 (83.3%) | 2 (16.7%) |
| Architecture & Engineering | 0 (0.0%) | 0 (0.0%) |
| Life, Physical & Social Science | 3 (100.0%) | 0 (0.0%) |
| Community & Social Service | 1 (5.0%) | 19 (95.0%) |
| Education, Arts & Media | 0 (0.0%) | 10 (100.0%) |
| Legal Services & Support | 0 (0.0%) | 0 (0.0%) |
| Education Instruction & Library | 1 (10.0%) | 9 (90.0%) |
| Arts, Media & Entertainment | 0 (0.0%) | 0 (0.0%) |
| Health Diagnosing & Treating | 0 (0.0%) | 1 (100.0%) |
| Health Technologists | 0 (0.0%) | 1 (100.0%) |
| Total (Category) | 20 (45.5%) | 24 (54.5%) |
| Total (Overall) | 58 (59.2%) | 40 (40.8%) |
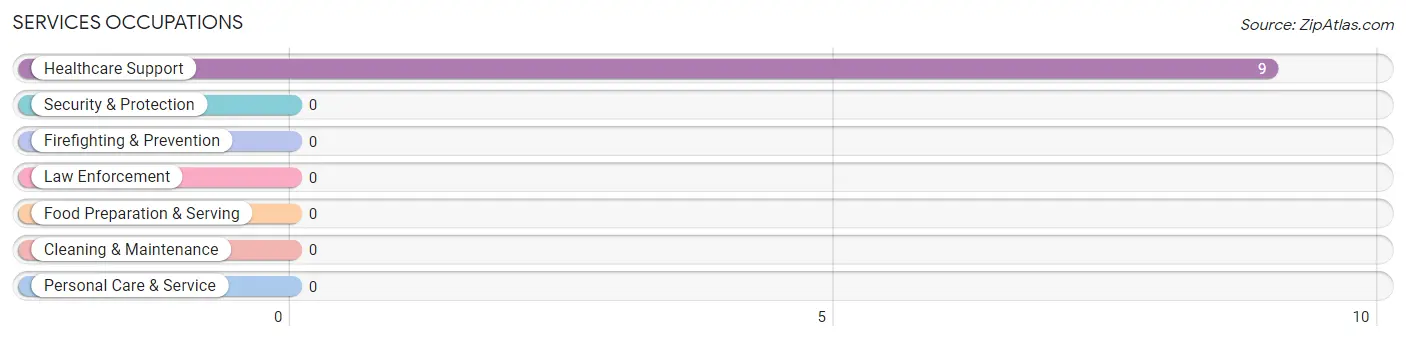
Services Occupations
The most common Services occupations in Albany are , and Healthcare Support (9 | 9.2%).
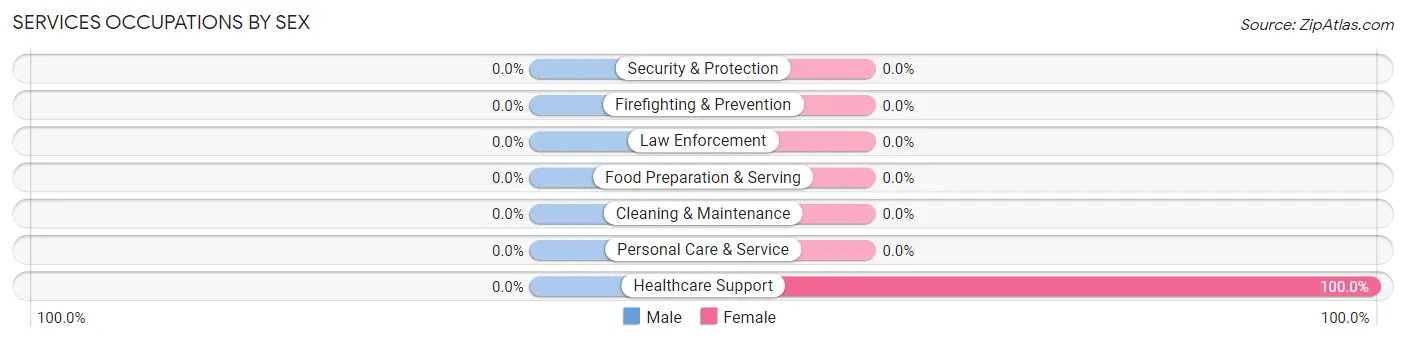
Services Occupations by Sex
| Occupation | Male | Female |
| Healthcare Support | 0 (0.0%) | 9 (100.0%) |
| Security & Protection | 0 (0.0%) | 0 (0.0%) |
| Firefighting & Prevention | 0 (0.0%) | 0 (0.0%) |
| Law Enforcement | 0 (0.0%) | 0 (0.0%) |
| Food Preparation & Serving | 0 (0.0%) | 0 (0.0%) |
| Cleaning & Maintenance | 0 (0.0%) | 0 (0.0%) |
| Personal Care & Service | 0 (0.0%) | 0 (0.0%) |
| Total (Category) | 0 (0.0%) | 9 (100.0%) |
| Total (Overall) | 58 (59.2%) | 40 (40.8%) |
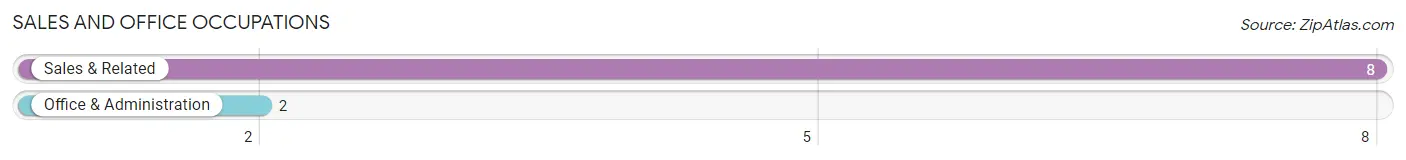
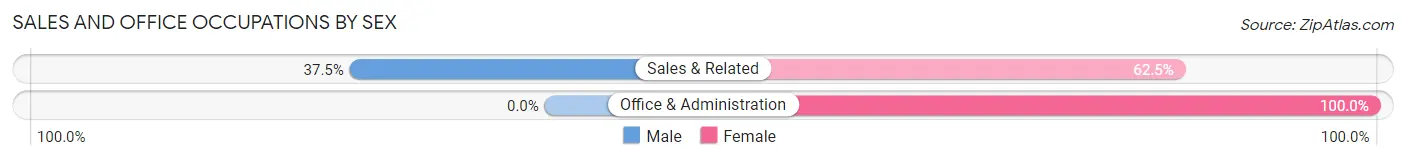
Sales and Office Occupations
The most common Sales and Office occupations in Albany are Sales & Related (8 | 8.2%), and Office & Administration (2 | 2.0%).
Sales and Office Occupations by Sex
| Occupation | Male | Female |
| Sales & Related | 3 (37.5%) | 5 (62.5%) |
| Office & Administration | 0 (0.0%) | 2 (100.0%) |
| Total (Category) | 3 (30.0%) | 7 (70.0%) |
| Total (Overall) | 58 (59.2%) | 40 (40.8%) |
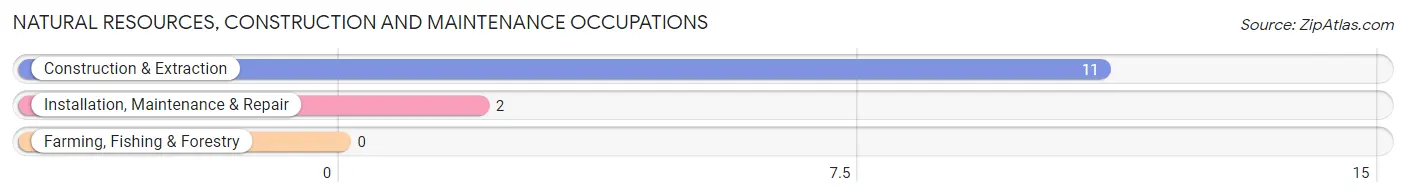
Natural Resources, Construction and Maintenance Occupations
The most common Natural Resources, Construction and Maintenance occupations in Albany are Construction & Extraction (11 | 11.2%), and Installation, Maintenance & Repair (2 | 2.0%).
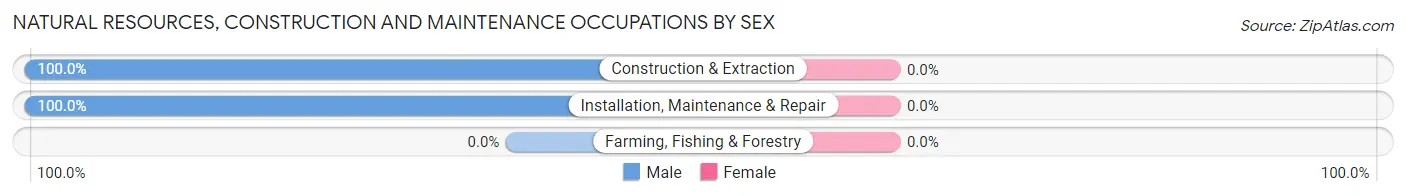
Natural Resources, Construction and Maintenance Occupations by Sex
| Occupation | Male | Female |
| Farming, Fishing & Forestry | 0 (0.0%) | 0 (0.0%) |
| Construction & Extraction | 11 (100.0%) | 0 (0.0%) |
| Installation, Maintenance & Repair | 2 (100.0%) | 0 (0.0%) |
| Total (Category) | 13 (100.0%) | 0 (0.0%) |
| Total (Overall) | 58 (59.2%) | 40 (40.8%) |
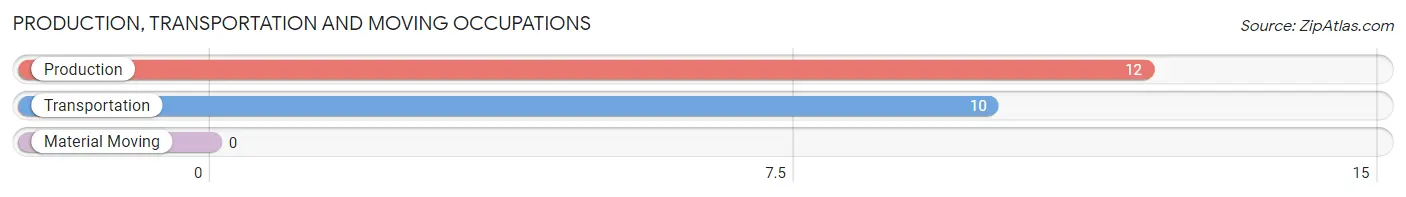
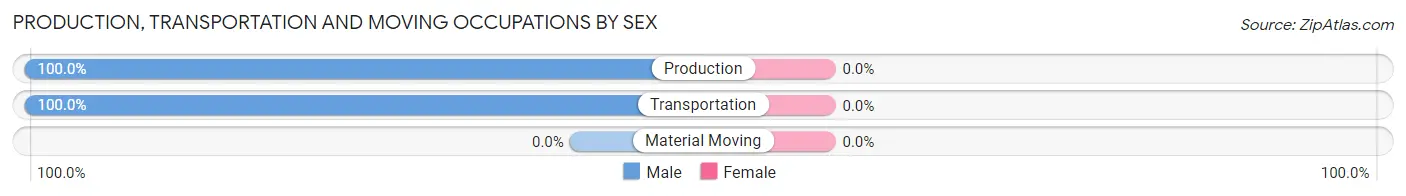
Production, Transportation and Moving Occupations
The most common Production, Transportation and Moving occupations in Albany are Production (12 | 12.2%), and Transportation (10 | 10.2%).
Production, Transportation and Moving Occupations by Sex
| Occupation | Male | Female |
| Production | 12 (100.0%) | 0 (0.0%) |
| Transportation | 10 (100.0%) | 0 (0.0%) |
| Material Moving | 0 (0.0%) | 0 (0.0%) |
| Total (Category) | 22 (100.0%) | 0 (0.0%) |
| Total (Overall) | 58 (59.2%) | 40 (40.8%) |
Employment Industries by Sex in Albany
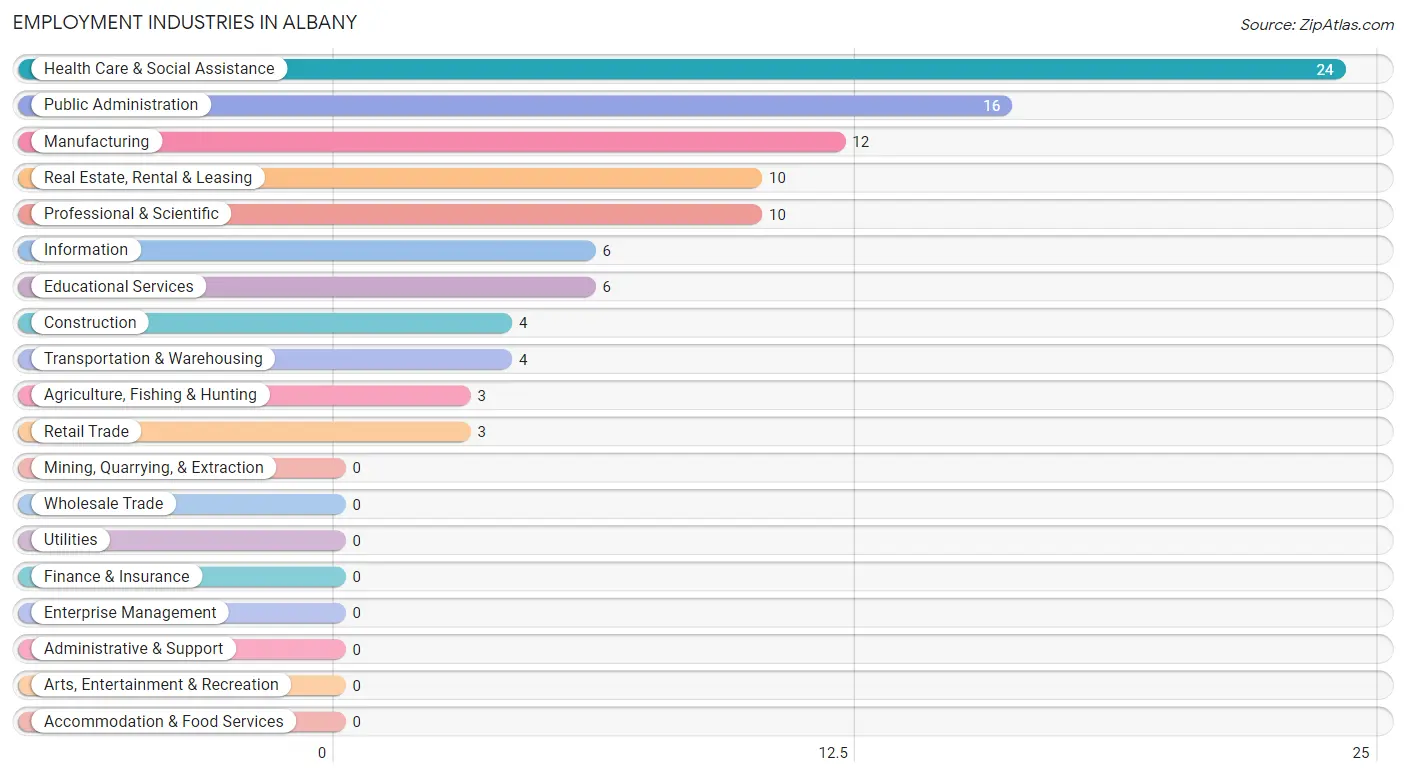
Employment Industries in Albany
The major employment industries in Albany include Health Care & Social Assistance (24 | 24.5%), Public Administration (16 | 16.3%), Manufacturing (12 | 12.2%), Real Estate, Rental & Leasing (10 | 10.2%), and Professional & Scientific (10 | 10.2%).
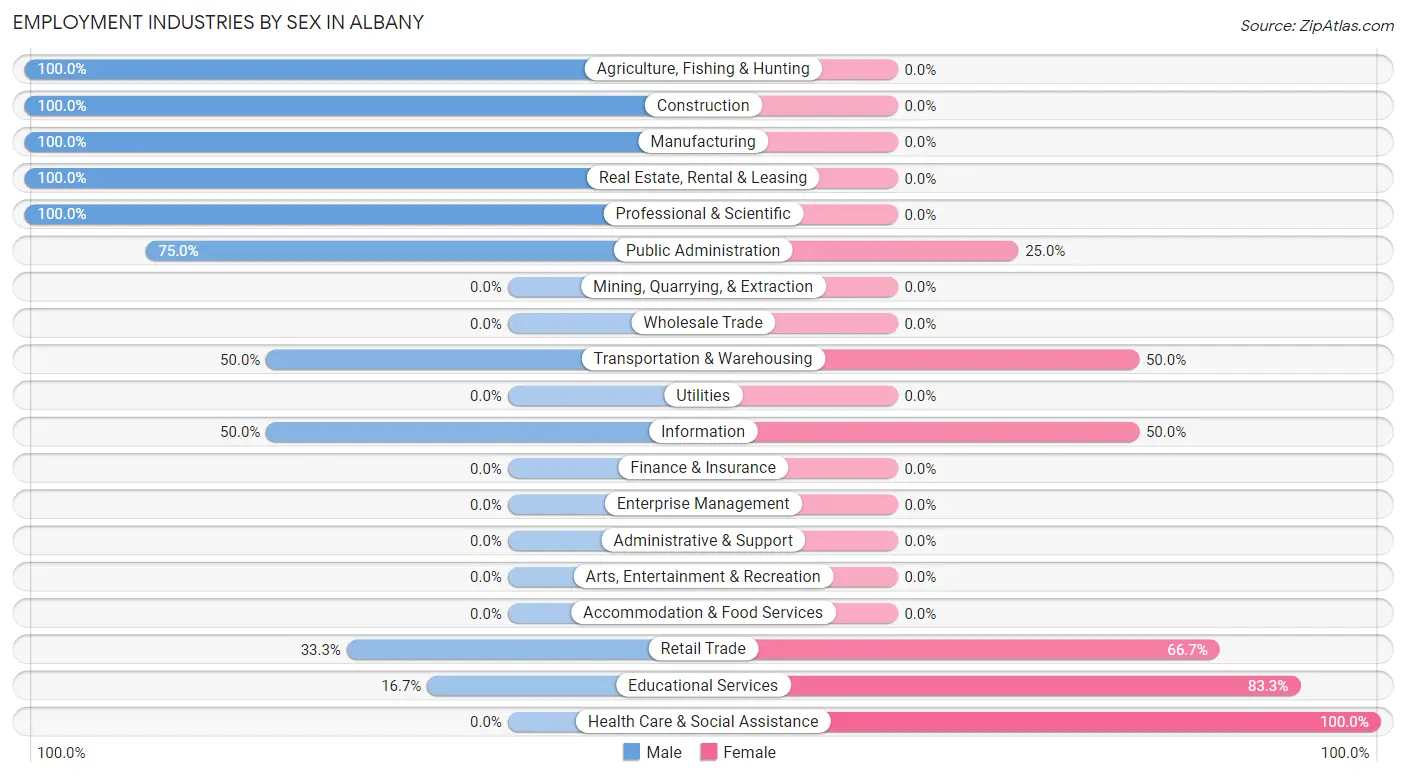
Employment Industries by Sex in Albany
The Albany industries that see more men than women are Agriculture, Fishing & Hunting (100.0%), Construction (100.0%), and Manufacturing (100.0%), whereas the industries that tend to have a higher number of women are Health Care & Social Assistance (100.0%), Educational Services (83.3%), and Retail Trade (66.7%).
| Industry | Male | Female |
| Agriculture, Fishing & Hunting | 3 (100.0%) | 0 (0.0%) |
| Mining, Quarrying, & Extraction | 0 (0.0%) | 0 (0.0%) |
| Construction | 4 (100.0%) | 0 (0.0%) |
| Manufacturing | 12 (100.0%) | 0 (0.0%) |
| Wholesale Trade | 0 (0.0%) | 0 (0.0%) |
| Retail Trade | 1 (33.3%) | 2 (66.7%) |
| Transportation & Warehousing | 2 (50.0%) | 2 (50.0%) |
| Utilities | 0 (0.0%) | 0 (0.0%) |
| Information | 3 (50.0%) | 3 (50.0%) |
| Finance & Insurance | 0 (0.0%) | 0 (0.0%) |
| Real Estate, Rental & Leasing | 10 (100.0%) | 0 (0.0%) |
| Professional & Scientific | 10 (100.0%) | 0 (0.0%) |
| Enterprise Management | 0 (0.0%) | 0 (0.0%) |
| Administrative & Support | 0 (0.0%) | 0 (0.0%) |
| Educational Services | 1 (16.7%) | 5 (83.3%) |
| Health Care & Social Assistance | 0 (0.0%) | 24 (100.0%) |
| Arts, Entertainment & Recreation | 0 (0.0%) | 0 (0.0%) |
| Accommodation & Food Services | 0 (0.0%) | 0 (0.0%) |
| Public Administration | 12 (75.0%) | 4 (25.0%) |
| Total | 58 (59.2%) | 40 (40.8%) |
Education in Albany
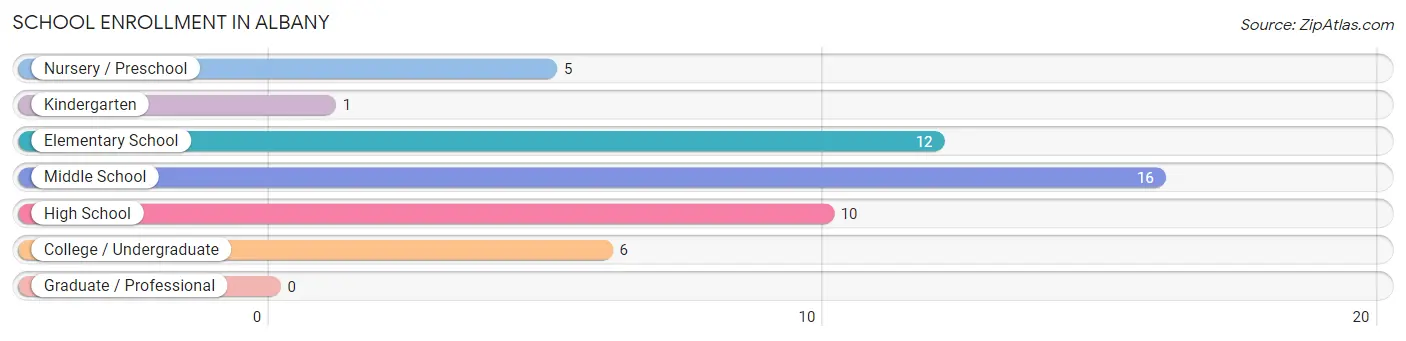
School Enrollment in Albany
The most common levels of schooling among the 50 students in Albany are middle school (16 | 32.0%), elementary school (12 | 24.0%), and high school (10 | 20.0%).
| School Level | # Students | % Students |
| Nursery / Preschool | 5 | 10.0% |
| Kindergarten | 1 | 2.0% |
| Elementary School | 12 | 24.0% |
| Middle School | 16 | 32.0% |
| High School | 10 | 20.0% |
| College / Undergraduate | 6 | 12.0% |
| Graduate / Professional | 0 | 0.0% |
| Total | 50 | 100.0% |
School Enrollment by Age by Funding Source in Albany
Out of a total of 50 students who are enrolled in schools in Albany, 22 (44.0%) attend a private institution, while the remaining 28 (56.0%) are enrolled in public schools. The age group of 10 to 14 year olds has the highest likelihood of being enrolled in private schools, with 19 (73.1% in the age bracket) enrolled. Conversely, the age group of 5 to 9 year old has the lowest likelihood of being enrolled in a private school, with 13 (100.0% in the age bracket) attending a public institution.
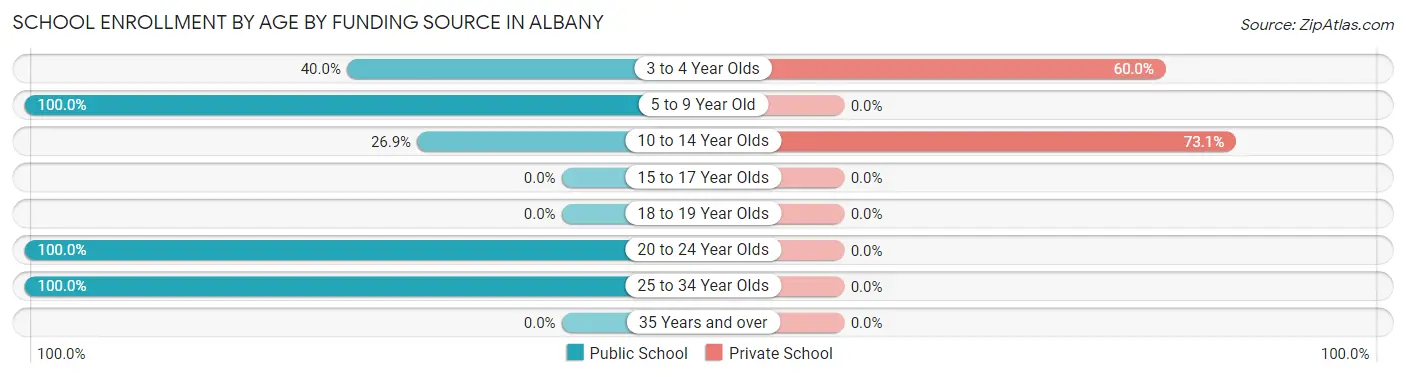
| Age Bracket | Public School | Private School |
| 3 to 4 Year Olds | 2 (40.0%) | 3 (60.0%) |
| 5 to 9 Year Old | 13 (100.0%) | 0 (0.0%) |
| 10 to 14 Year Olds | 7 (26.9%) | 19 (73.1%) |
| 15 to 17 Year Olds | 0 (0.0%) | 0 (0.0%) |
| 18 to 19 Year Olds | 0 (0.0%) | 0 (0.0%) |
| 20 to 24 Year Olds | 2 (100.0%) | 0 (0.0%) |
| 25 to 34 Year Olds | 4 (100.0%) | 0 (0.0%) |
| 35 Years and over | 0 (0.0%) | 0 (0.0%) |
| Total | 28 (56.0%) | 22 (44.0%) |
Educational Attainment by Field of Study in Albany
Business (15 | 38.5%), psychology (11 | 28.2%), science & technology (10 | 25.6%), bio, nature & agricultural (1 | 2.6%), and education (1 | 2.6%) are the most common fields of study among 39 individuals in Albany who have obtained a bachelor's degree or higher.
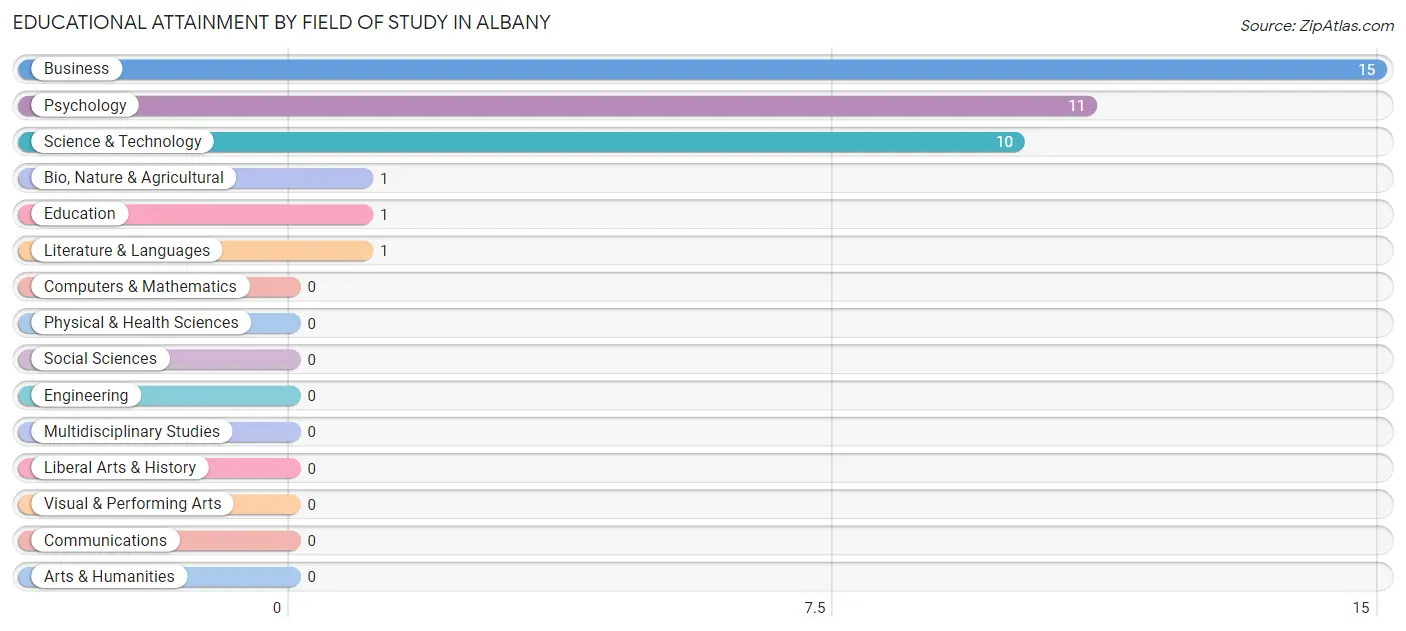
| Field of Study | # Graduates | % Graduates |
| Computers & Mathematics | 0 | 0.0% |
| Bio, Nature & Agricultural | 1 | 2.6% |
| Physical & Health Sciences | 0 | 0.0% |
| Psychology | 11 | 28.2% |
| Social Sciences | 0 | 0.0% |
| Engineering | 0 | 0.0% |
| Multidisciplinary Studies | 0 | 0.0% |
| Science & Technology | 10 | 25.6% |
| Business | 15 | 38.5% |
| Education | 1 | 2.6% |
| Literature & Languages | 1 | 2.6% |
| Liberal Arts & History | 0 | 0.0% |
| Visual & Performing Arts | 0 | 0.0% |
| Communications | 0 | 0.0% |
| Arts & Humanities | 0 | 0.0% |
| Total | 39 | 100.0% |
Transportation & Commute in Albany
Vehicle Availability by Sex in Albany
The most prevalent vehicle ownership categories in Albany are males with 2 vehicles (32, accounting for 55.2%) and females with 2 vehicles (13, making up 80.0%).
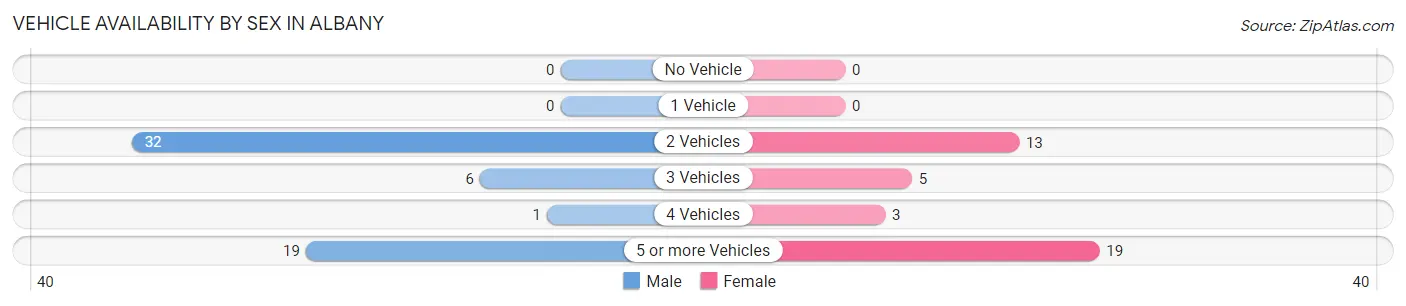
| Vehicles Available | Male | Female |
| No Vehicle | 0 (0.0%) | 0 (0.0%) |
| 1 Vehicle | 0 (0.0%) | 0 (0.0%) |
| 2 Vehicles | 32 (55.2%) | 13 (32.5%) |
| 3 Vehicles | 6 (10.3%) | 5 (12.5%) |
| 4 Vehicles | 1 (1.7%) | 3 (7.5%) |
| 5 or more Vehicles | 19 (32.8%) | 19 (47.5%) |
| Total | 58 (100.0%) | 40 (100.0%) |
Commute Time in Albany
The most frequently occuring commute durations in Albany are 30 to 34 minutes (35 commuters, 36.1%), less than 5 minutes (20 commuters, 20.6%), and 10 to 14 minutes (13 commuters, 13.4%).
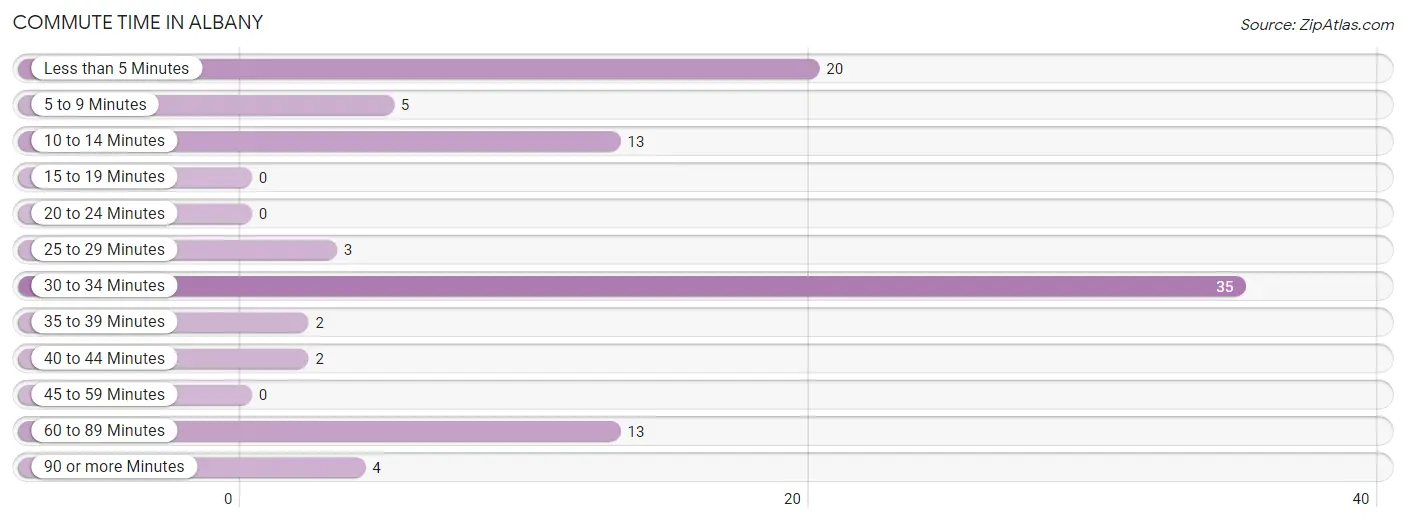
| Commute Time | # Commuters | % Commuters |
| Less than 5 Minutes | 20 | 20.6% |
| 5 to 9 Minutes | 5 | 5.1% |
| 10 to 14 Minutes | 13 | 13.4% |
| 15 to 19 Minutes | 0 | 0.0% |
| 20 to 24 Minutes | 0 | 0.0% |
| 25 to 29 Minutes | 3 | 3.1% |
| 30 to 34 Minutes | 35 | 36.1% |
| 35 to 39 Minutes | 2 | 2.1% |
| 40 to 44 Minutes | 2 | 2.1% |
| 45 to 59 Minutes | 0 | 0.0% |
| 60 to 89 Minutes | 13 | 13.4% |
| 90 or more Minutes | 4 | 4.1% |
Commute Time by Sex in Albany
The most common commute times in Albany are 30 to 34 minutes (21 commuters, 36.8%) for males and 30 to 34 minutes (14 commuters, 35.0%) for females.
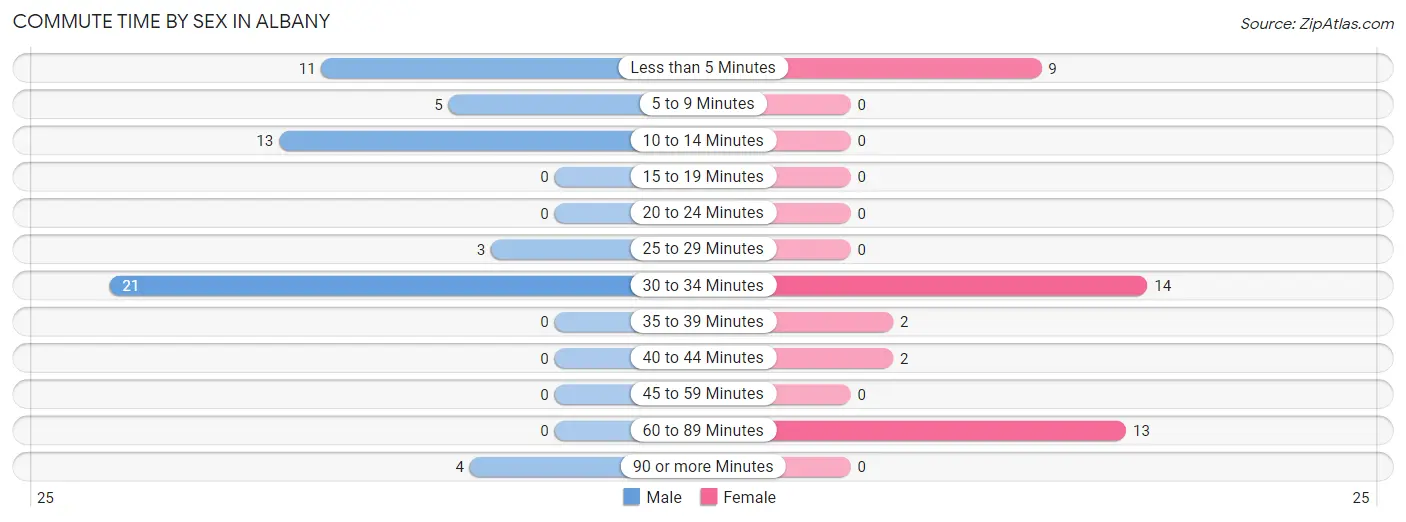
| Commute Time | Male | Female |
| Less than 5 Minutes | 11 (19.3%) | 9 (22.5%) |
| 5 to 9 Minutes | 5 (8.8%) | 0 (0.0%) |
| 10 to 14 Minutes | 13 (22.8%) | 0 (0.0%) |
| 15 to 19 Minutes | 0 (0.0%) | 0 (0.0%) |
| 20 to 24 Minutes | 0 (0.0%) | 0 (0.0%) |
| 25 to 29 Minutes | 3 (5.3%) | 0 (0.0%) |
| 30 to 34 Minutes | 21 (36.8%) | 14 (35.0%) |
| 35 to 39 Minutes | 0 (0.0%) | 2 (5.0%) |
| 40 to 44 Minutes | 0 (0.0%) | 2 (5.0%) |
| 45 to 59 Minutes | 0 (0.0%) | 0 (0.0%) |
| 60 to 89 Minutes | 0 (0.0%) | 13 (32.5%) |
| 90 or more Minutes | 4 (7.0%) | 0 (0.0%) |
Time of Departure to Work by Sex in Albany
The most frequent times of departure to work in Albany are 4:00 PM to 11:59 PM (11, 19.3%) for males and 7:00 AM to 7:29 AM (20, 50.0%) for females.
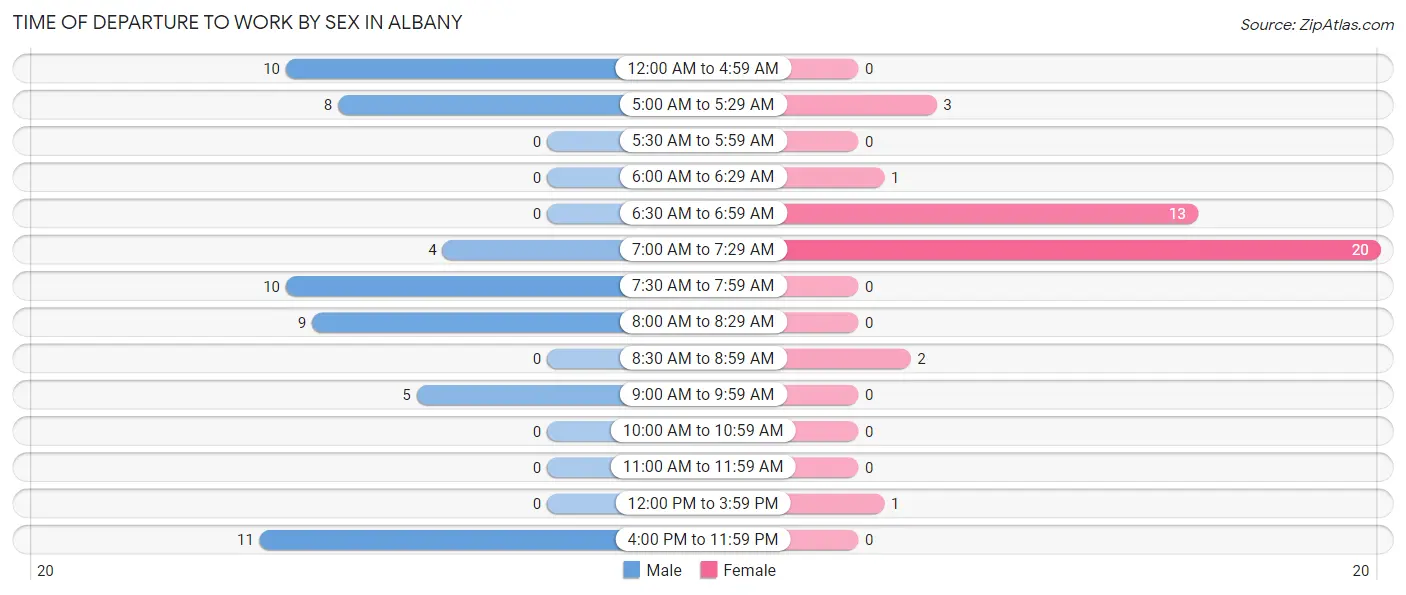
| Time of Departure | Male | Female |
| 12:00 AM to 4:59 AM | 10 (17.5%) | 0 (0.0%) |
| 5:00 AM to 5:29 AM | 8 (14.0%) | 3 (7.5%) |
| 5:30 AM to 5:59 AM | 0 (0.0%) | 0 (0.0%) |
| 6:00 AM to 6:29 AM | 0 (0.0%) | 1 (2.5%) |
| 6:30 AM to 6:59 AM | 0 (0.0%) | 13 (32.5%) |
| 7:00 AM to 7:29 AM | 4 (7.0%) | 20 (50.0%) |
| 7:30 AM to 7:59 AM | 10 (17.5%) | 0 (0.0%) |
| 8:00 AM to 8:29 AM | 9 (15.8%) | 0 (0.0%) |
| 8:30 AM to 8:59 AM | 0 (0.0%) | 2 (5.0%) |
| 9:00 AM to 9:59 AM | 5 (8.8%) | 0 (0.0%) |
| 10:00 AM to 10:59 AM | 0 (0.0%) | 0 (0.0%) |
| 11:00 AM to 11:59 AM | 0 (0.0%) | 0 (0.0%) |
| 12:00 PM to 3:59 PM | 0 (0.0%) | 1 (2.5%) |
| 4:00 PM to 11:59 PM | 11 (19.3%) | 0 (0.0%) |
| Total | 57 (100.0%) | 40 (100.0%) |
Housing Occupancy in Albany
Occupancy by Ownership in Albany
Of the total 65 dwellings in Albany, owner-occupied units account for 65 (100.0%), while renter-occupied units make up 0 (0.0%).
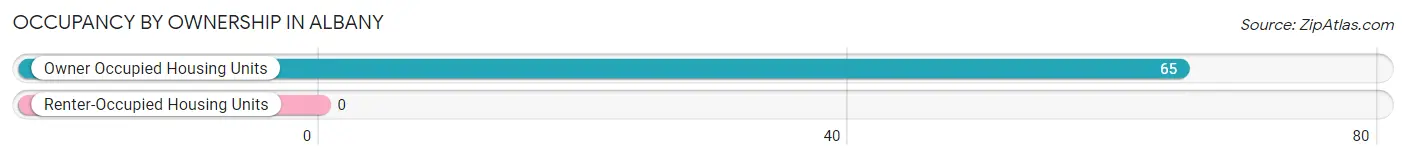
| Occupancy | # Housing Units | % Housing Units |
| Owner Occupied Housing Units | 65 | 100.0% |
| Renter-Occupied Housing Units | 0 | 0.0% |
| Total Occupied Housing Units | 65 | 100.0% |
Occupancy by Household Size in Albany
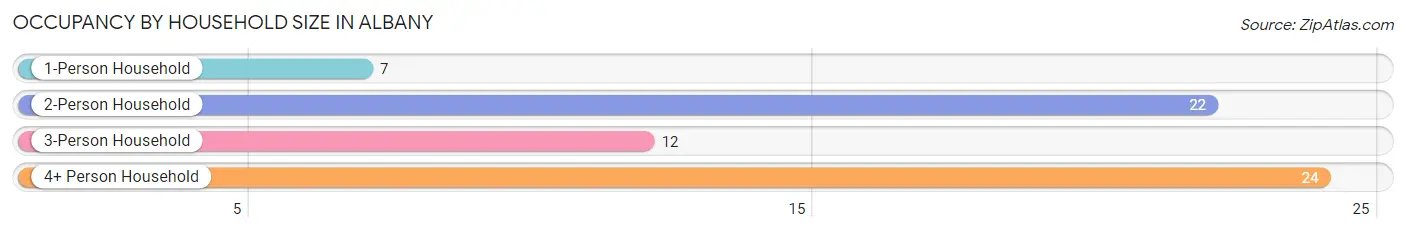
| Household Size | # Housing Units | % Housing Units |
| 1-Person Household | 7 | 10.8% |
| 2-Person Household | 22 | 33.9% |
| 3-Person Household | 12 | 18.5% |
| 4+ Person Household | 24 | 36.9% |
| Total Housing Units | 65 | 100.0% |
Occupancy by Ownership by Household Size in Albany
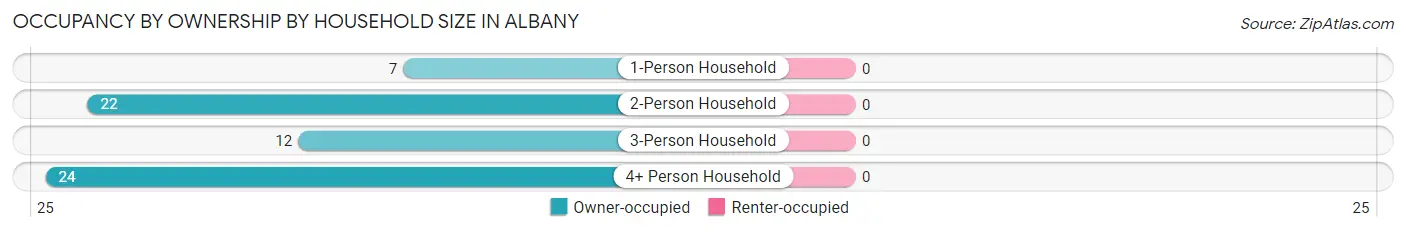
| Household Size | Owner-occupied | Renter-occupied |
| 1-Person Household | 7 (100.0%) | 0 (0.0%) |
| 2-Person Household | 22 (100.0%) | 0 (0.0%) |
| 3-Person Household | 12 (100.0%) | 0 (0.0%) |
| 4+ Person Household | 24 (100.0%) | 0 (0.0%) |
| Total Housing Units | 65 (100.0%) | 0 (0.0%) |
Occupancy by Educational Attainment in Albany
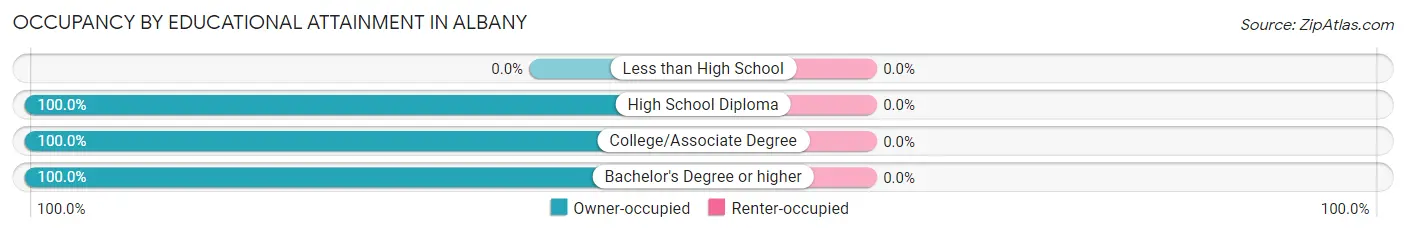
| Household Size | Owner-occupied | Renter-occupied |
| Less than High School | 0 (0.0%) | 0 (0.0%) |
| High School Diploma | 15 (100.0%) | 0 (0.0%) |
| College/Associate Degree | 22 (100.0%) | 0 (0.0%) |
| Bachelor's Degree or higher | 28 (100.0%) | 0 (0.0%) |
Occupancy by Age of Householder in Albany
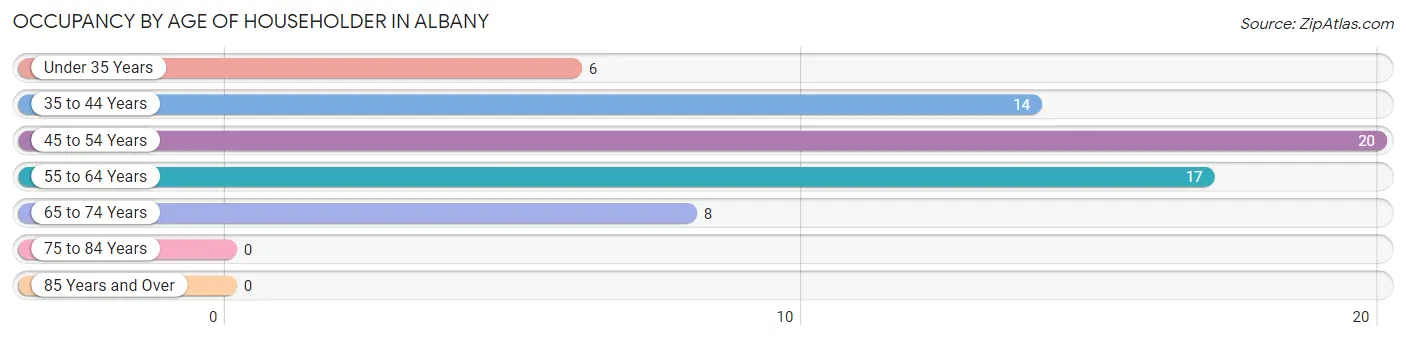
| Age Bracket | # Households | % Households |
| Under 35 Years | 6 | 9.2% |
| 35 to 44 Years | 14 | 21.5% |
| 45 to 54 Years | 20 | 30.8% |
| 55 to 64 Years | 17 | 26.2% |
| 65 to 74 Years | 8 | 12.3% |
| 75 to 84 Years | 0 | 0.0% |
| 85 Years and Over | 0 | 0.0% |
| Total | 65 | 100.0% |
Housing Finances in Albany
Median Income by Occupancy in Albany
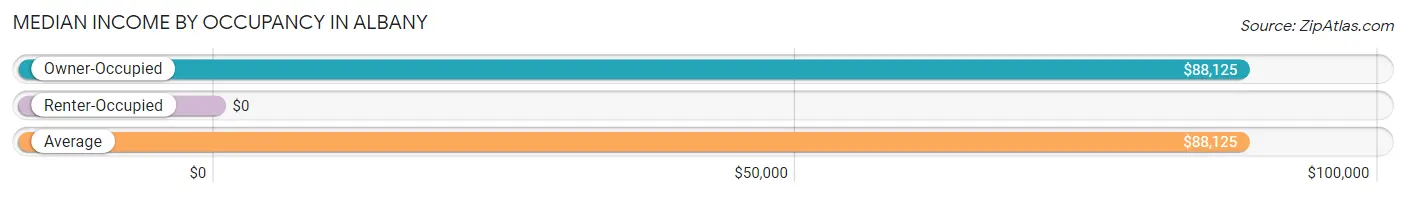
| Occupancy Type | # Households | Median Income |
| Owner-Occupied | 65 (100.0%) | $88,125 |
| Renter-Occupied | 0 (0.0%) | $0 |
| Average | 65 (100.0%) | $88,125 |
Occupancy by Householder Income Bracket in Albany
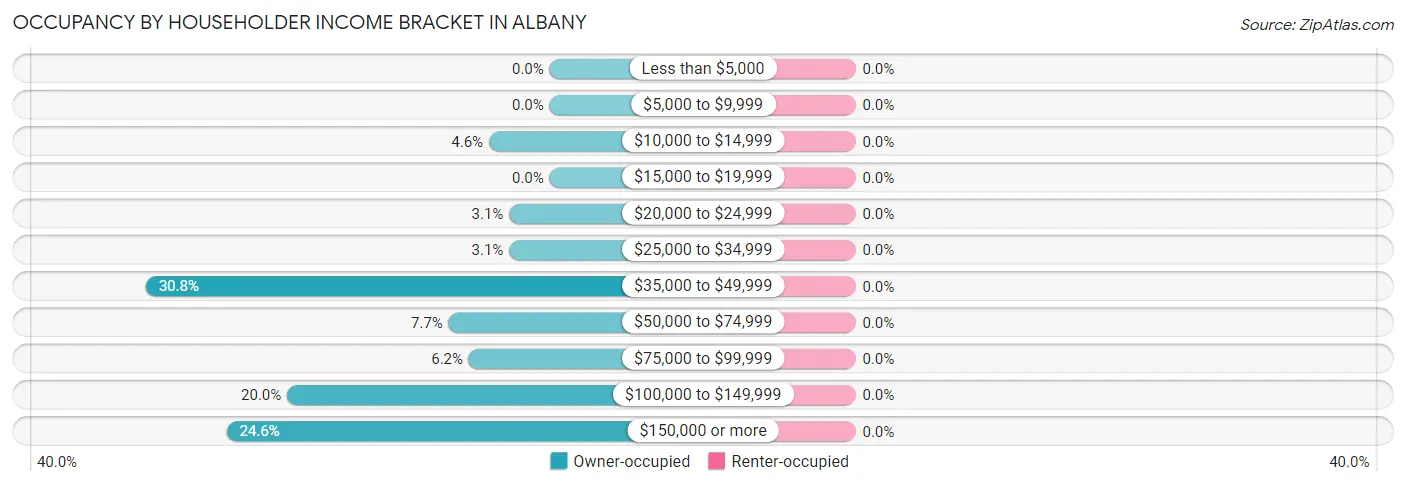
| Income Bracket | Owner-occupied | Renter-occupied |
| Less than $5,000 | 0 (0.0%) | 0 (0.0%) |
| $5,000 to $9,999 | 0 (0.0%) | 0 (0.0%) |
| $10,000 to $14,999 | 3 (4.6%) | 0 (0.0%) |
| $15,000 to $19,999 | 0 (0.0%) | 0 (0.0%) |
| $20,000 to $24,999 | 2 (3.1%) | 0 (0.0%) |
| $25,000 to $34,999 | 2 (3.1%) | 0 (0.0%) |
| $35,000 to $49,999 | 20 (30.8%) | 0 (0.0%) |
| $50,000 to $74,999 | 5 (7.7%) | 0 (0.0%) |
| $75,000 to $99,999 | 4 (6.1%) | 0 (0.0%) |
| $100,000 to $149,999 | 13 (20.0%) | 0 (0.0%) |
| $150,000 or more | 16 (24.6%) | 0 (0.0%) |
| Total | 65 (100.0%) | 0 (0.0%) |
Monthly Housing Cost Tiers in Albany
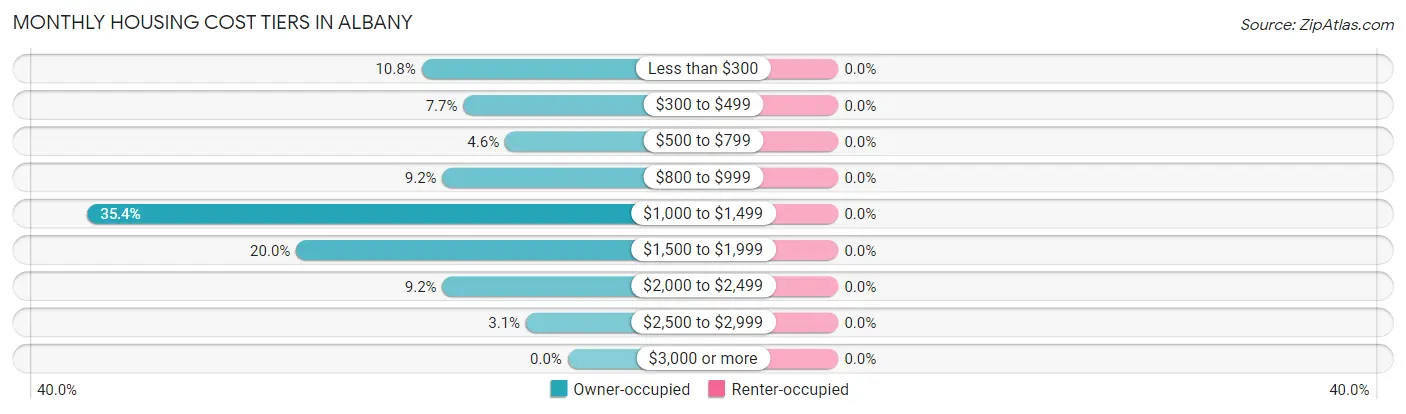
| Monthly Cost | Owner-occupied | Renter-occupied |
| Less than $300 | 7 (10.8%) | 0 (0.0%) |
| $300 to $499 | 5 (7.7%) | 0 (0.0%) |
| $500 to $799 | 3 (4.6%) | 0 (0.0%) |
| $800 to $999 | 6 (9.2%) | 0 (0.0%) |
| $1,000 to $1,499 | 23 (35.4%) | 0 (0.0%) |
| $1,500 to $1,999 | 13 (20.0%) | 0 (0.0%) |
| $2,000 to $2,499 | 6 (9.2%) | 0 (0.0%) |
| $2,500 to $2,999 | 2 (3.1%) | 0 (0.0%) |
| $3,000 or more | 0 (0.0%) | 0 (0.0%) |
| Total | 65 (100.0%) | 0 (0.0%) |
Physical Housing Characteristics in Albany
Housing Structures in Albany
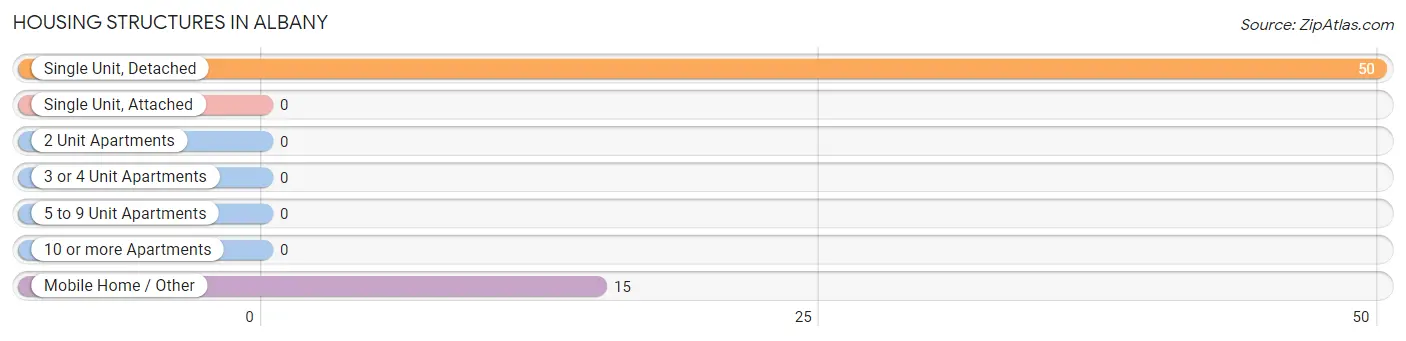
| Structure Type | # Housing Units | % Housing Units |
| Single Unit, Detached | 50 | 76.9% |
| Single Unit, Attached | 0 | 0.0% |
| 2 Unit Apartments | 0 | 0.0% |
| 3 or 4 Unit Apartments | 0 | 0.0% |
| 5 to 9 Unit Apartments | 0 | 0.0% |
| 10 or more Apartments | 0 | 0.0% |
| Mobile Home / Other | 15 | 23.1% |
| Total | 65 | 100.0% |
Housing Structures by Occupancy in Albany
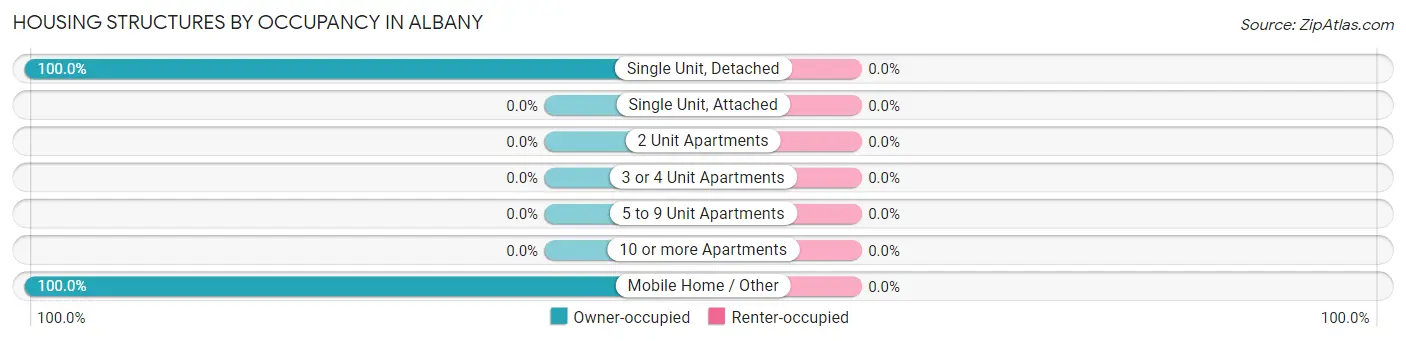
| Structure Type | Owner-occupied | Renter-occupied |
| Single Unit, Detached | 50 (100.0%) | 0 (0.0%) |
| Single Unit, Attached | 0 (0.0%) | 0 (0.0%) |
| 2 Unit Apartments | 0 (0.0%) | 0 (0.0%) |
| 3 or 4 Unit Apartments | 0 (0.0%) | 0 (0.0%) |
| 5 to 9 Unit Apartments | 0 (0.0%) | 0 (0.0%) |
| 10 or more Apartments | 0 (0.0%) | 0 (0.0%) |
| Mobile Home / Other | 15 (100.0%) | 0 (0.0%) |
| Total | 65 (100.0%) | 0 (0.0%) |
Housing Structures by Number of Rooms in Albany
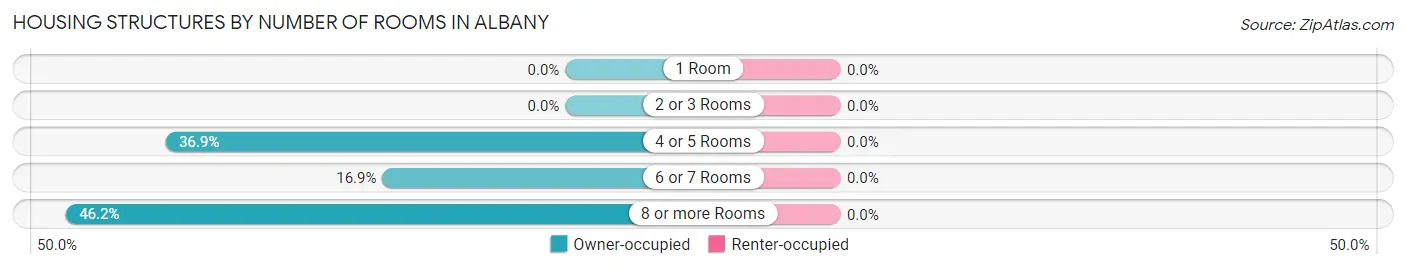
| Number of Rooms | Owner-occupied | Renter-occupied |
| 1 Room | 0 (0.0%) | 0 (0.0%) |
| 2 or 3 Rooms | 0 (0.0%) | 0 (0.0%) |
| 4 or 5 Rooms | 24 (36.9%) | 0 (0.0%) |
| 6 or 7 Rooms | 11 (16.9%) | 0 (0.0%) |
| 8 or more Rooms | 30 (46.2%) | 0 (0.0%) |
| Total | 65 (100.0%) | 0 (0.0%) |
Housing Structure by Heating Type in Albany
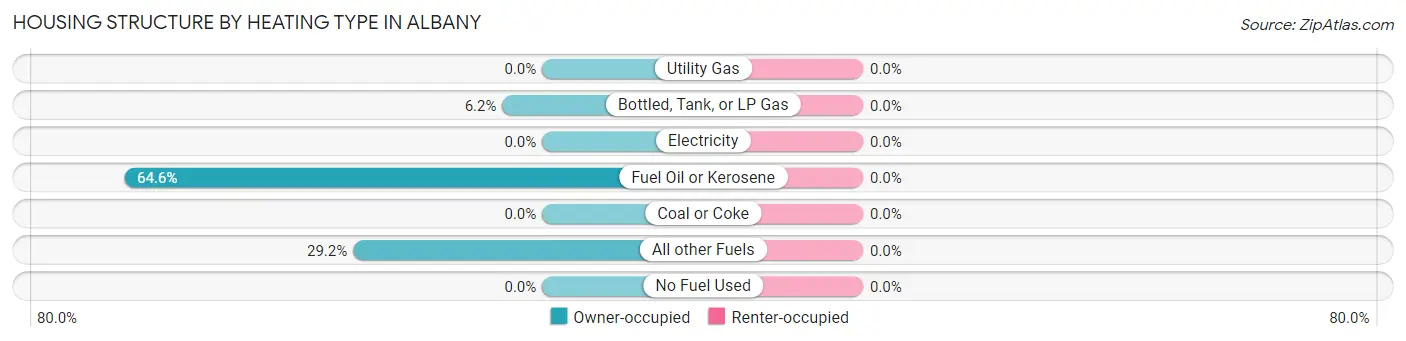
| Heating Type | Owner-occupied | Renter-occupied |
| Utility Gas | 0 (0.0%) | 0 (0.0%) |
| Bottled, Tank, or LP Gas | 4 (6.1%) | 0 (0.0%) |
| Electricity | 0 (0.0%) | 0 (0.0%) |
| Fuel Oil or Kerosene | 42 (64.6%) | 0 (0.0%) |
| Coal or Coke | 0 (0.0%) | 0 (0.0%) |
| All other Fuels | 19 (29.2%) | 0 (0.0%) |
| No Fuel Used | 0 (0.0%) | 0 (0.0%) |
| Total | 65 (100.0%) | 0 (0.0%) |
Household Vehicle Usage in Albany
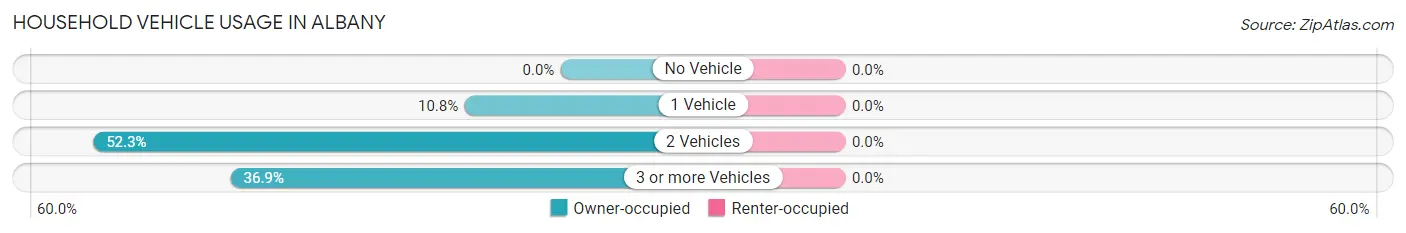
| Vehicles per Household | Owner-occupied | Renter-occupied |
| No Vehicle | 0 (0.0%) | 0 (0.0%) |
| 1 Vehicle | 7 (10.8%) | 0 (0.0%) |
| 2 Vehicles | 34 (52.3%) | 0 (0.0%) |
| 3 or more Vehicles | 24 (36.9%) | 0 (0.0%) |
| Total | 65 (100.0%) | 0 (0.0%) |
Real Estate & Mortgages in Albany
Real Estate and Mortgage Overview in Albany
| Characteristic | Without Mortgage | With Mortgage |
| Housing Units | 14 | 51 |
| Median Property Value | - | - |
| Median Household Income | $45,714 | $14 |
| Monthly Housing Costs | $325 | $0 |
| Real Estate Taxes | - | - |
Property Value by Mortgage Status in Albany
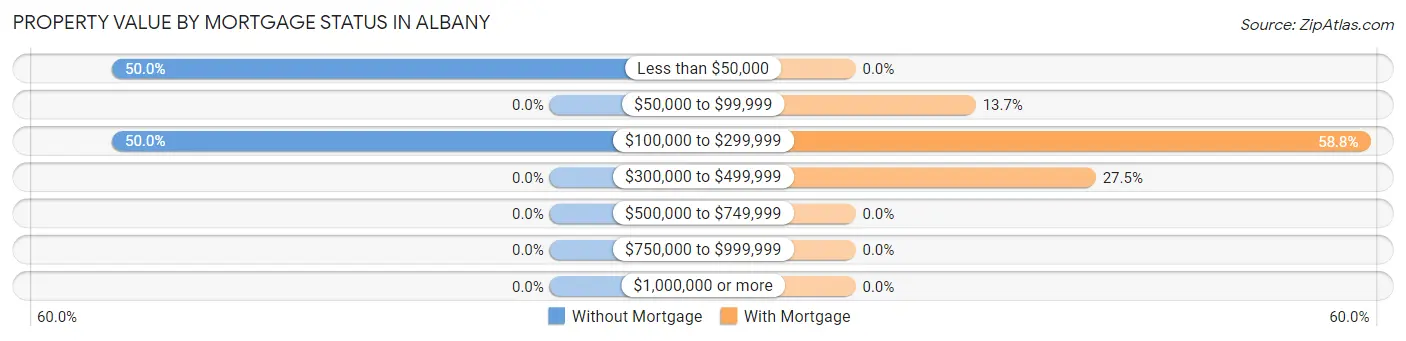
| Property Value | Without Mortgage | With Mortgage |
| Less than $50,000 | 7 (50.0%) | 0 (0.0%) |
| $50,000 to $99,999 | 0 (0.0%) | 7 (13.7%) |
| $100,000 to $299,999 | 7 (50.0%) | 30 (58.8%) |
| $300,000 to $499,999 | 0 (0.0%) | 14 (27.5%) |
| $500,000 to $749,999 | 0 (0.0%) | 0 (0.0%) |
| $750,000 to $999,999 | 0 (0.0%) | 0 (0.0%) |
| $1,000,000 or more | 0 (0.0%) | 0 (0.0%) |
| Total | 14 (100.0%) | 51 (100.0%) |
Household Income by Mortgage Status in Albany
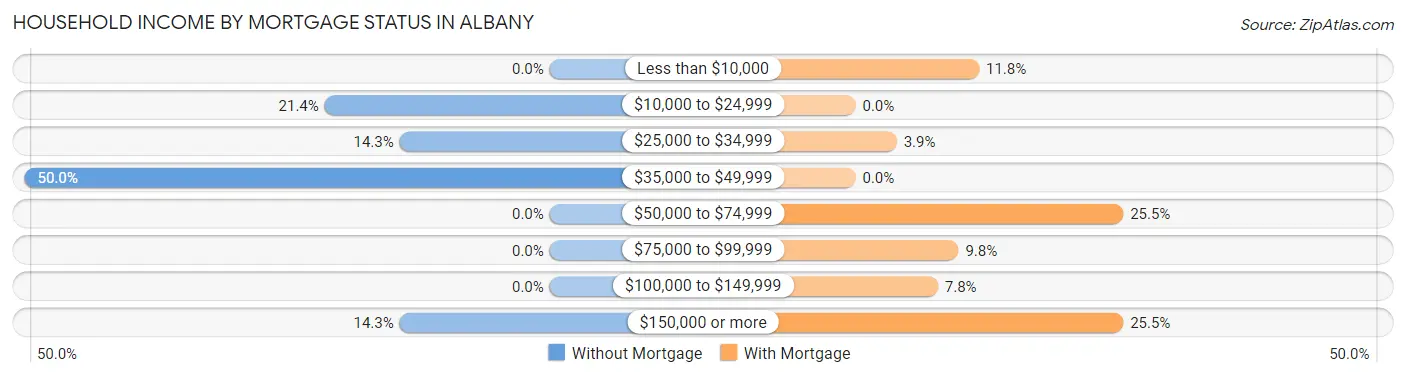
| Household Income | Without Mortgage | With Mortgage |
| Less than $10,000 | 0 (0.0%) | 6 (11.8%) |
| $10,000 to $24,999 | 3 (21.4%) | 0 (0.0%) |
| $25,000 to $34,999 | 2 (14.3%) | 2 (3.9%) |
| $35,000 to $49,999 | 7 (50.0%) | 0 (0.0%) |
| $50,000 to $74,999 | 0 (0.0%) | 13 (25.5%) |
| $75,000 to $99,999 | 0 (0.0%) | 5 (9.8%) |
| $100,000 to $149,999 | 0 (0.0%) | 4 (7.8%) |
| $150,000 or more | 2 (14.3%) | 13 (25.5%) |
| Total | 14 (100.0%) | 51 (100.0%) |
Property Value to Household Income Ratio in Albany
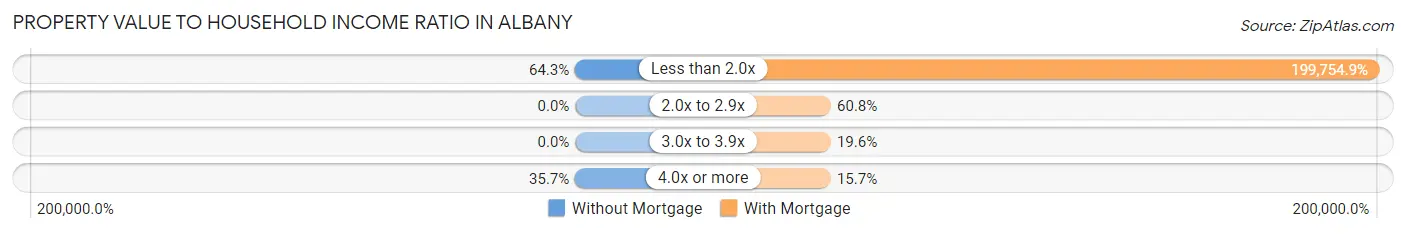
| Value-to-Income Ratio | Without Mortgage | With Mortgage |
| Less than 2.0x | 9 (64.3%) | 101,875 (199,754.9%) |
| 2.0x to 2.9x | 0 (0.0%) | 31 (60.8%) |
| 3.0x to 3.9x | 0 (0.0%) | 10 (19.6%) |
| 4.0x or more | 5 (35.7%) | 8 (15.7%) |
| Total | 14 (100.0%) | 51 (100.0%) |
Real Estate Taxes by Mortgage Status in Albany
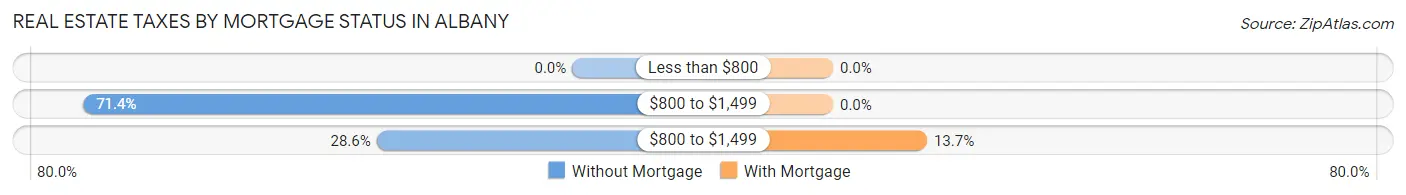
| Property Taxes | Without Mortgage | With Mortgage |
| Less than $800 | 0 (0.0%) | 0 (0.0%) |
| $800 to $1,499 | 10 (71.4%) | 0 (0.0%) |
| $800 to $1,499 | 4 (28.6%) | 7 (13.7%) |
| Total | 14 (100.0%) | 51 (100.0%) |
Health & Disability in Albany
Health Insurance Coverage by Age in Albany
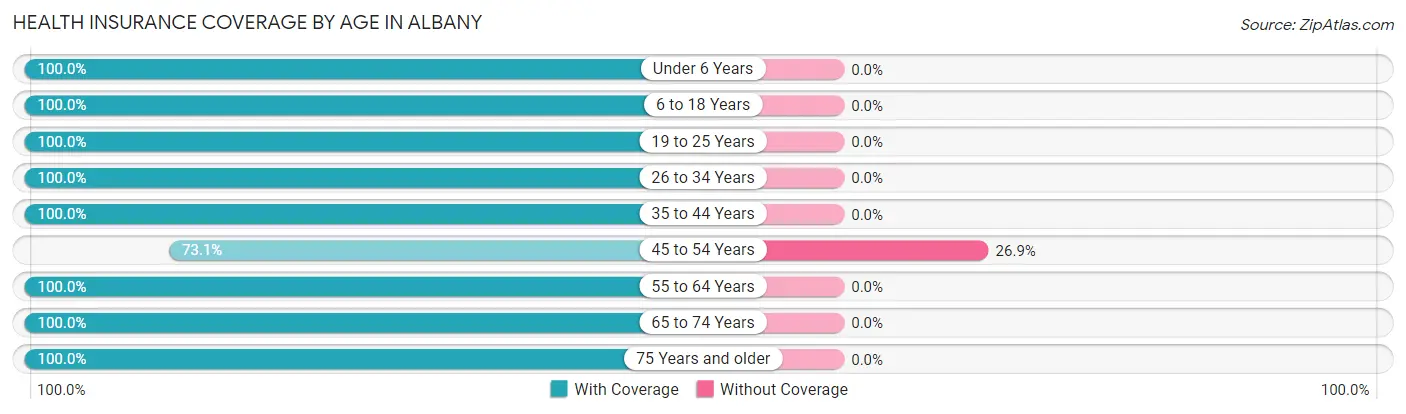
| Age Bracket | With Coverage | Without Coverage |
| Under 6 Years | 10 (100.0%) | 0 (0.0%) |
| 6 to 18 Years | 38 (100.0%) | 0 (0.0%) |
| 19 to 25 Years | 20 (100.0%) | 0 (0.0%) |
| 26 to 34 Years | 18 (100.0%) | 0 (0.0%) |
| 35 to 44 Years | 35 (100.0%) | 0 (0.0%) |
| 45 to 54 Years | 19 (73.1%) | 7 (26.9%) |
| 55 to 64 Years | 40 (100.0%) | 0 (0.0%) |
| 65 to 74 Years | 9 (100.0%) | 0 (0.0%) |
| 75 Years and older | 5 (100.0%) | 0 (0.0%) |
| Total | 194 (96.5%) | 7 (3.5%) |
Health Insurance Coverage by Citizenship Status in Albany
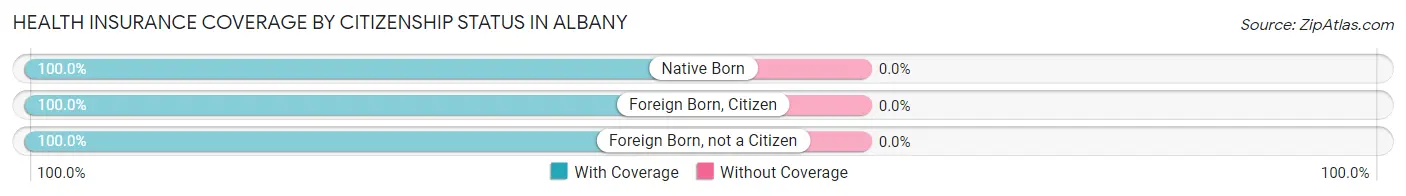
| Citizenship Status | With Coverage | Without Coverage |
| Native Born | 10 (100.0%) | 0 (0.0%) |
| Foreign Born, Citizen | 38 (100.0%) | 0 (0.0%) |
| Foreign Born, not a Citizen | 20 (100.0%) | 0 (0.0%) |
Health Insurance Coverage by Household Income in Albany
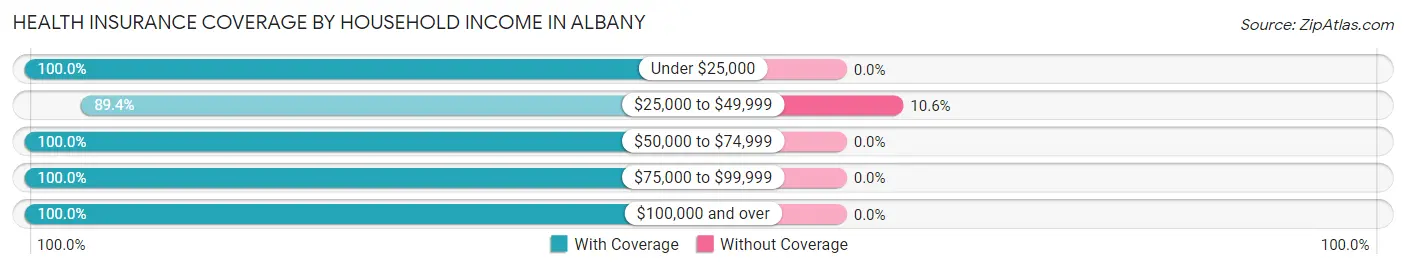
| Household Income | With Coverage | Without Coverage |
| Under $25,000 | 7 (100.0%) | 0 (0.0%) |
| $25,000 to $49,999 | 59 (89.4%) | 7 (10.6%) |
| $50,000 to $74,999 | 30 (100.0%) | 0 (0.0%) |
| $75,000 to $99,999 | 6 (100.0%) | 0 (0.0%) |
| $100,000 and over | 92 (100.0%) | 0 (0.0%) |
Public vs Private Health Insurance Coverage by Age in Albany
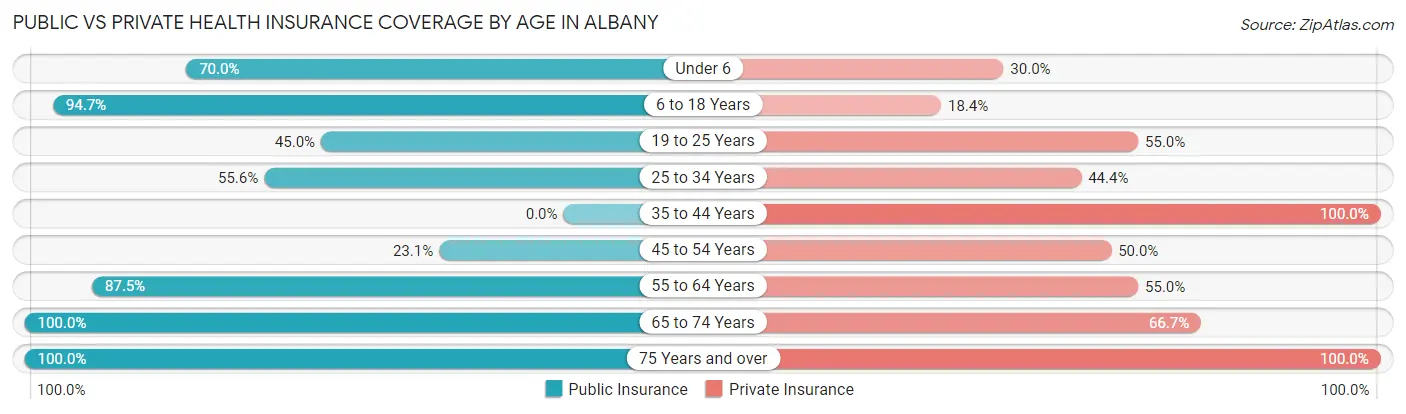
| Age Bracket | Public Insurance | Private Insurance |
| Under 6 | 7 (70.0%) | 3 (30.0%) |
| 6 to 18 Years | 36 (94.7%) | 7 (18.4%) |
| 19 to 25 Years | 9 (45.0%) | 11 (55.0%) |
| 25 to 34 Years | 10 (55.6%) | 8 (44.4%) |
| 35 to 44 Years | 0 (0.0%) | 35 (100.0%) |
| 45 to 54 Years | 6 (23.1%) | 13 (50.0%) |
| 55 to 64 Years | 35 (87.5%) | 22 (55.0%) |
| 65 to 74 Years | 9 (100.0%) | 6 (66.7%) |
| 75 Years and over | 5 (100.0%) | 5 (100.0%) |
| Total | 117 (58.2%) | 110 (54.7%) |
Disability Status by Sex by Age in Albany
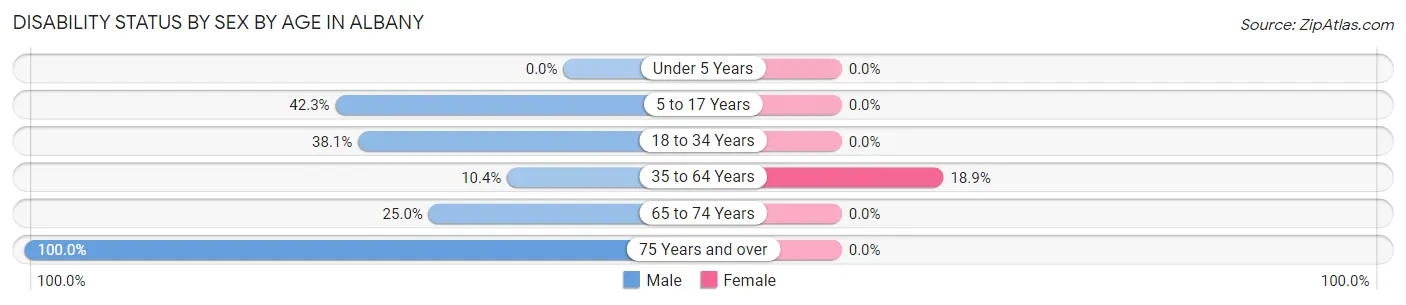
| Age Bracket | Male | Female |
| Under 5 Years | 0 (0.0%) | 0 (0.0%) |
| 5 to 17 Years | 11 (42.3%) | 0 (0.0%) |
| 18 to 34 Years | 8 (38.1%) | 0 (0.0%) |
| 35 to 64 Years | 5 (10.4%) | 10 (18.9%) |
| 65 to 74 Years | 2 (25.0%) | 0 (0.0%) |
| 75 Years and over | 5 (100.0%) | 0 (0.0%) |
Disability Class by Sex by Age in Albany
Disability Class: Hearing Difficulty
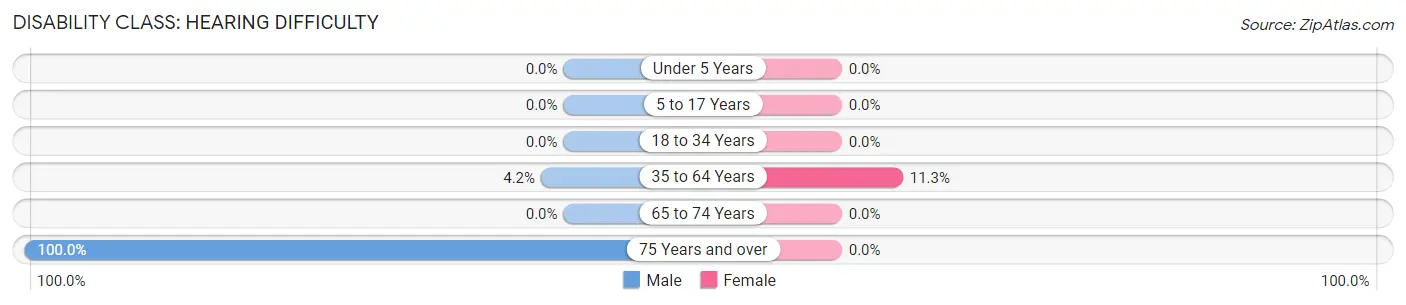
| Age Bracket | Male | Female |
| Under 5 Years | 0 (0.0%) | 0 (0.0%) |
| 5 to 17 Years | 0 (0.0%) | 0 (0.0%) |
| 18 to 34 Years | 0 (0.0%) | 0 (0.0%) |
| 35 to 64 Years | 2 (4.2%) | 6 (11.3%) |
| 65 to 74 Years | 0 (0.0%) | 0 (0.0%) |
| 75 Years and over | 5 (100.0%) | 0 (0.0%) |
Disability Class: Vision Difficulty
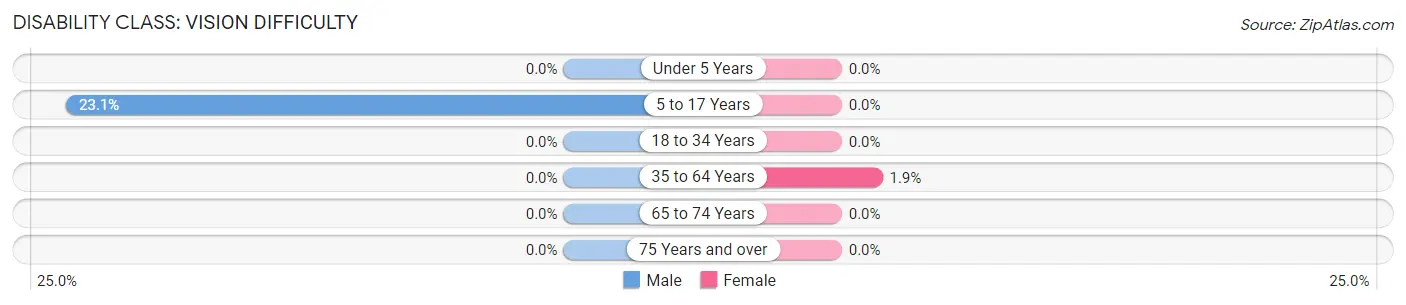
| Age Bracket | Male | Female |
| Under 5 Years | 0 (0.0%) | 0 (0.0%) |
| 5 to 17 Years | 6 (23.1%) | 0 (0.0%) |
| 18 to 34 Years | 0 (0.0%) | 0 (0.0%) |
| 35 to 64 Years | 0 (0.0%) | 1 (1.9%) |
| 65 to 74 Years | 0 (0.0%) | 0 (0.0%) |
| 75 Years and over | 0 (0.0%) | 0 (0.0%) |
Disability Class: Cognitive Difficulty
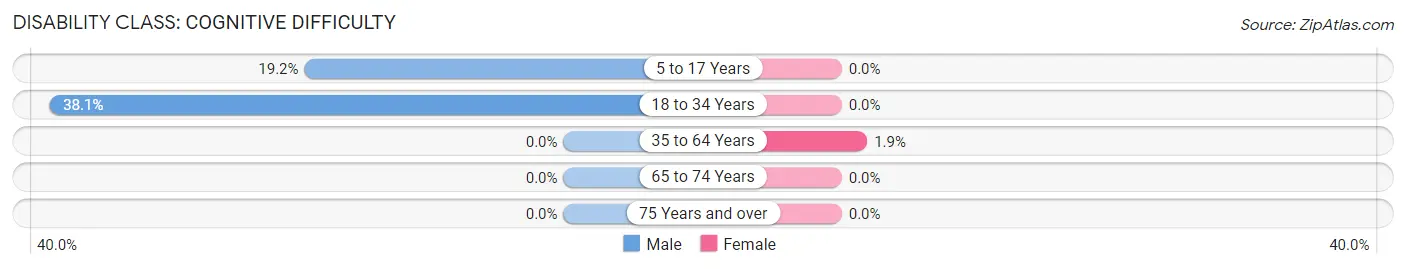
| Age Bracket | Male | Female |
| 5 to 17 Years | 5 (19.2%) | 0 (0.0%) |
| 18 to 34 Years | 8 (38.1%) | 0 (0.0%) |
| 35 to 64 Years | 0 (0.0%) | 1 (1.9%) |
| 65 to 74 Years | 0 (0.0%) | 0 (0.0%) |
| 75 Years and over | 0 (0.0%) | 0 (0.0%) |
Disability Class: Ambulatory Difficulty
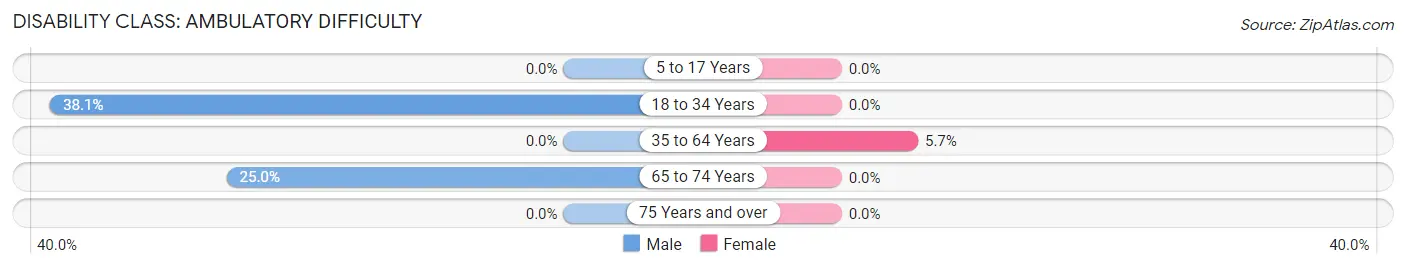
| Age Bracket | Male | Female |
| 5 to 17 Years | 0 (0.0%) | 0 (0.0%) |
| 18 to 34 Years | 8 (38.1%) | 0 (0.0%) |
| 35 to 64 Years | 0 (0.0%) | 3 (5.7%) |
| 65 to 74 Years | 2 (25.0%) | 0 (0.0%) |
| 75 Years and over | 0 (0.0%) | 0 (0.0%) |
Disability Class: Self-Care Difficulty
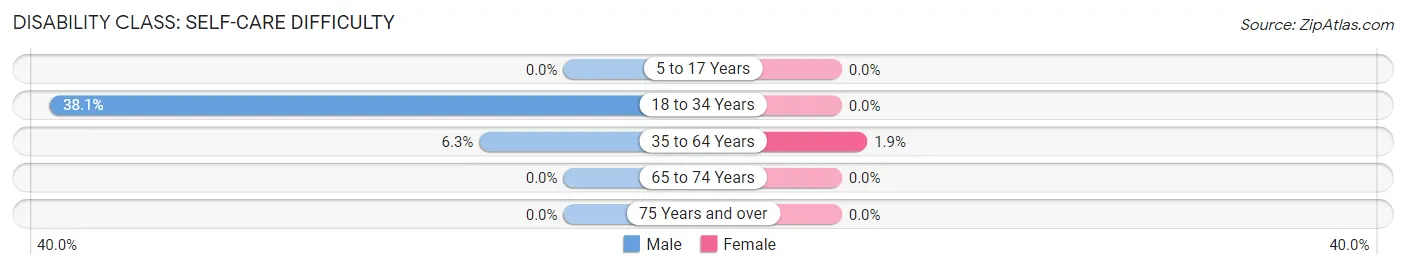
| Age Bracket | Male | Female |
| 5 to 17 Years | 0 (0.0%) | 0 (0.0%) |
| 18 to 34 Years | 8 (38.1%) | 0 (0.0%) |
| 35 to 64 Years | 3 (6.2%) | 1 (1.9%) |
| 65 to 74 Years | 0 (0.0%) | 0 (0.0%) |
| 75 Years and over | 0 (0.0%) | 0 (0.0%) |
Technology Access in Albany
Computing Device Access in Albany
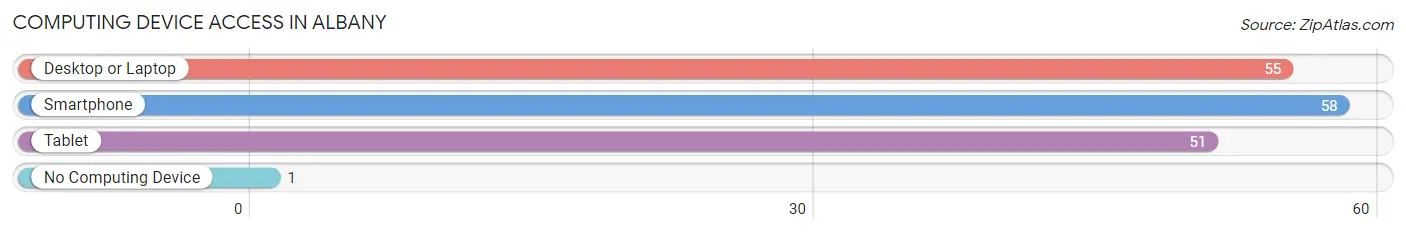
| Device Type | # Households | % Households |
| Desktop or Laptop | 55 | 84.6% |
| Smartphone | 58 | 89.2% |
| Tablet | 51 | 78.5% |
| No Computing Device | 1 | 1.5% |
| Total | 65 | 100.0% |
Internet Access in Albany
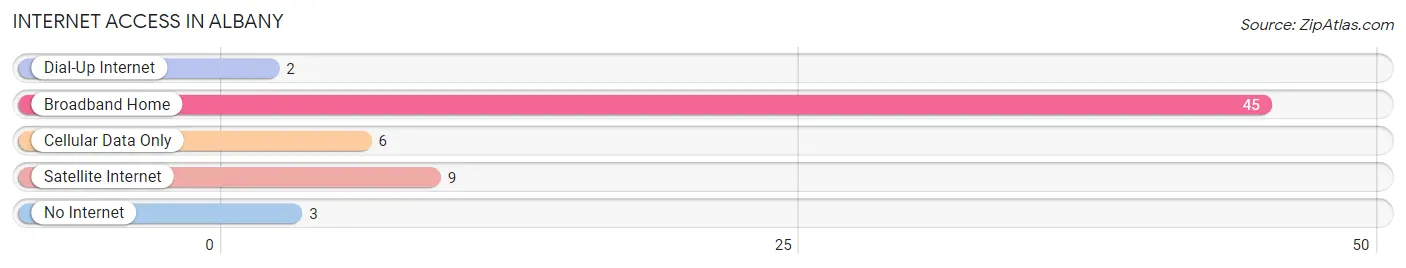
| Internet Type | # Households | % Households |
| Dial-Up Internet | 2 | 3.1% |
| Broadband Home | 45 | 69.2% |
| Cellular Data Only | 6 | 9.2% |
| Satellite Internet | 9 | 13.9% |
| No Internet | 3 | 4.6% |
| Total | 65 | 100.0% |
Albany Summary
Albany is a town located in the state of Vermont, in the United States of America. It is situated in the northwestern corner of the state, in the county of Orleans. The town is bordered by the towns of Irasburg to the north, Barton to the east, Craftsbury to the south, and Glover to the west. The town has a total area of 40.2 square miles, of which 39.9 square miles is land and 0.3 square miles is water.
History
Albany was first settled in 1790 by a group of settlers from Massachusetts. The town was named after Albany, New York, and was incorporated in 1792. The town was originally a farming community, and the main crops grown were wheat, corn, and potatoes. In the early 19th century, the town was home to several sawmills, gristmills, and a tannery.
In the late 19th century, Albany began to experience a period of growth and development. The town was home to several factories, including a woolen mill, a paper mill, and a furniture factory. The town also had a railroad station, which connected it to the rest of the state.
Geography
Albany is located in the northwestern corner of Vermont, in the county of Orleans. The town is bordered by the towns of Irasburg to the north, Barton to the east, Craftsbury to the south, and Glover to the west. The town has a total area of 40.2 square miles, of which 39.9 square miles is land and 0.3 square miles is water.
The town is located in the Green Mountains, and is home to several mountains, including Mount Pisgah, Mount Hor, and Mount Abraham. The town is also home to several rivers and streams, including the Barton River, the Black River, and the Barton Brook.
Economy
Albany’s economy is largely based on agriculture and tourism. The town is home to several farms, which produce a variety of crops, including corn, potatoes, hay, and apples. The town is also home to several tourist attractions, including the Barton River, the Black River, and the Barton Brook.
The town is also home to several small businesses, including restaurants, stores, and a variety of services. The town is also home to several manufacturing companies, including a furniture factory and a paper mill.
Demographics
As of the 2010 census, the town of Albany had a population of 1,717 people. The racial makeup of the town was 97.2% White, 0.5% African American, 0.3% Native American, 0.2% Asian, 0.1% Pacific Islander, 0.2% from other races, and 1.5% from two or more races. Hispanic or Latino of any race were 0.9% of the population.
The median household income in the town was $41,250, and the median family income was $48,750. The per capita income for the town was $20,945. About 8.2% of families and 11.2% of the population were below the poverty line, including 15.2% of those under age 18 and 8.3% of those age 65 or over.
Common Questions
What is the Total Population of Albany?
Total Population of Albany is 201.
What is the Total Male Population of Albany?
Total Male Population of Albany is 113.
What is the Total Female Population of Albany?
Total Female Population of Albany is 88.
What is the Ratio of Males per 100 Females in Albany?
There are 128.41 Males per 100 Females in Albany.
What is the Ratio of Females per 100 Males in Albany?
There are 77.88 Females per 100 Males in Albany.
What is the Median Population Age in Albany?
Median Population Age in Albany is 41.4 Years.
What is the Average Family Size in Albany
Average Family Size in Albany is 3.1 People.
What is the Average Household Size in Albany
Average Household Size in Albany is 3.1 People.
What is Per Capita Income in Albany?
Per Capita income in Albany is $33,612.
What is the Median Family Income in Albany?
Median Family Income in Albany is $96,250.
What is the Median Household income in Albany?
Median Household Income in Albany is $88,125.
What is Inequality or Gini Index in Albany?
Inequality or Gini Index in Albany is 0.35.
How Large is the Labor Force in Albany?
There are 98 People in the Labor Forcein in Albany.
What is the Percentage of People in the Labor Force in Albany?
64.1% of People are in the Labor Force in Albany.