Yugoslavian vs Russian 2 or more Vehicles in Household
COMPARE
Yugoslavian
Russian
2 or more Vehicles in Household
2 or more Vehicles in Household Comparison
Yugoslavians
Russians
56.6%
2 OR MORE VEHICLES IN HOUSEHOLD
90.0/ 100
METRIC RATING
130th/ 347
METRIC RANK
54.8%
2 OR MORE VEHICLES IN HOUSEHOLD
26.3/ 100
METRIC RATING
190th/ 347
METRIC RANK
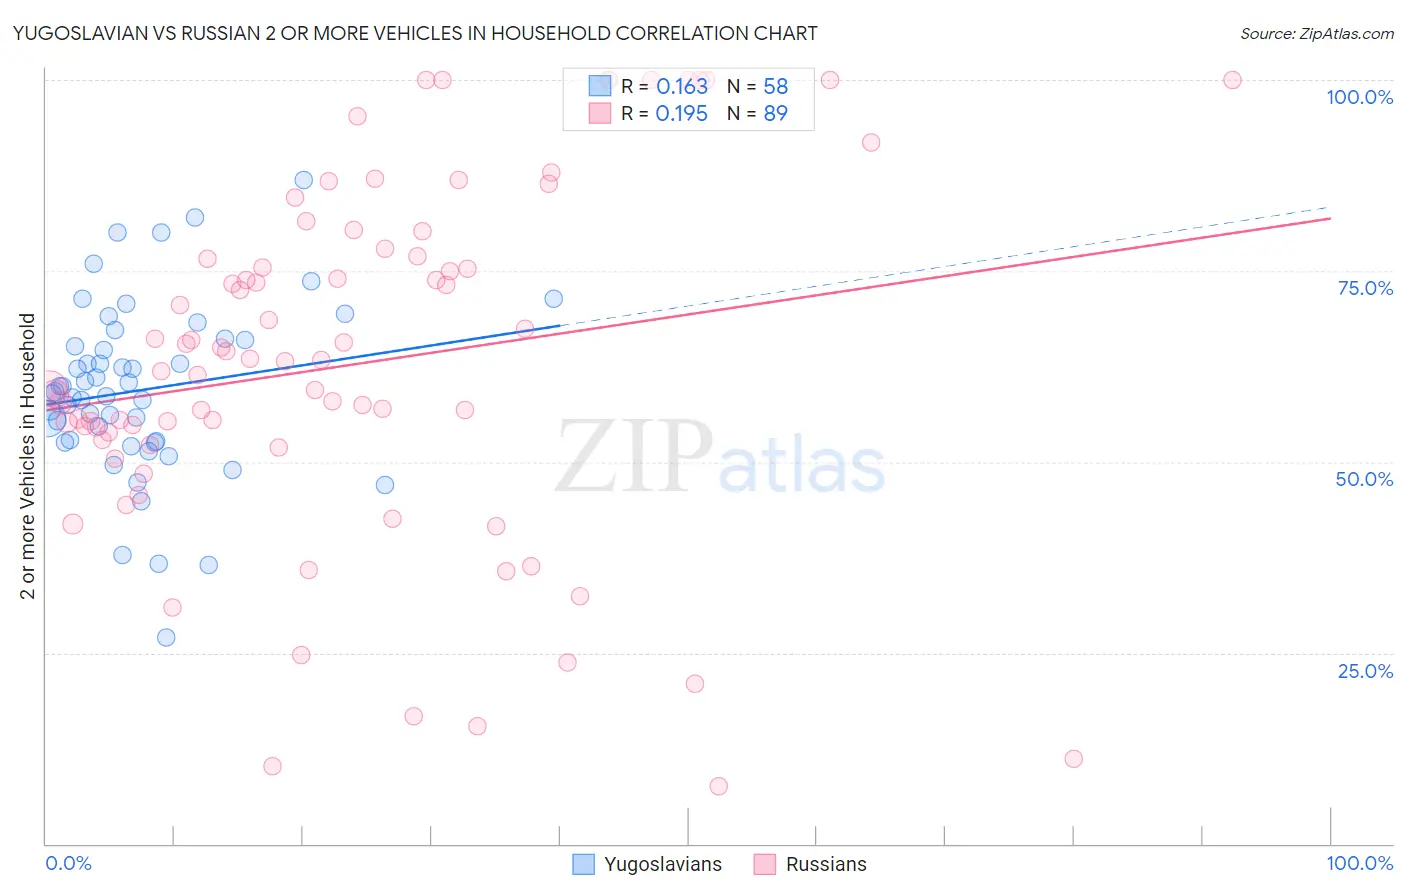
Yugoslavian vs Russian 2 or more Vehicles in Household Correlation Chart
The statistical analysis conducted on geographies consisting of 285,645,335 people shows a poor positive correlation between the proportion of Yugoslavians and percentage of households with 2 or more vehicles available in the United States with a correlation coefficient (R) of 0.163 and weighted average of 56.6%. Similarly, the statistical analysis conducted on geographies consisting of 511,789,622 people shows a poor positive correlation between the proportion of Russians and percentage of households with 2 or more vehicles available in the United States with a correlation coefficient (R) of 0.195 and weighted average of 54.8%, a difference of 3.2%.
2 or more Vehicles in Household Correlation Summary
| Measurement | Yugoslavian | Russian |
| Minimum | 27.0% | 7.6% |
| Maximum | 87.0% | 100.0% |
| Range | 59.9% | 92.4% |
| Mean | 59.4% | 62.7% |
| Median | 59.1% | 63.1% |
| Interquartile 25% (IQ1) | 52.7% | 52.5% |
| Interquartile 75% (IQ3) | 66.0% | 76.7% |
| Interquartile Range (IQR) | 13.3% | 24.2% |
| Standard Deviation (Sample) | 11.3% | 22.8% |
| Standard Deviation (Population) | 11.2% | 22.7% |
Similar Demographics by 2 or more Vehicles in Household
Demographics Similar to Yugoslavians by 2 or more Vehicles in Household
In terms of 2 or more vehicles in household, the demographic groups most similar to Yugoslavians are Bulgarian (56.5%, a difference of 0.030%), Ute (56.6%, a difference of 0.040%), Immigrants from South Central Asia (56.6%, a difference of 0.060%), Immigrants from Thailand (56.6%, a difference of 0.070%), and Hungarian (56.5%, a difference of 0.090%).
| Demographics | Rating | Rank | 2 or more Vehicles in Household |
| Australians | 91.8 /100 | #123 | Exceptional 56.7% |
| New Zealanders | 91.8 /100 | #124 | Exceptional 56.7% |
| Tsimshian | 91.6 /100 | #125 | Exceptional 56.7% |
| Estonians | 90.9 /100 | #126 | Exceptional 56.6% |
| Immigrants | Thailand | 90.7 /100 | #127 | Exceptional 56.6% |
| Immigrants | South Central Asia | 90.5 /100 | #128 | Exceptional 56.6% |
| Ute | 90.4 /100 | #129 | Exceptional 56.6% |
| Yugoslavians | 90.0 /100 | #130 | Exceptional 56.6% |
| Bulgarians | 89.7 /100 | #131 | Excellent 56.5% |
| Hungarians | 89.1 /100 | #132 | Excellent 56.5% |
| Comanche | 88.4 /100 | #133 | Excellent 56.5% |
| Immigrants | Azores | 86.6 /100 | #134 | Excellent 56.4% |
| Blackfeet | 86.5 /100 | #135 | Excellent 56.4% |
| Immigrants | Asia | 86.0 /100 | #136 | Excellent 56.3% |
| Cubans | 84.8 /100 | #137 | Excellent 56.3% |
Demographics Similar to Russians by 2 or more Vehicles in Household
In terms of 2 or more vehicles in household, the demographic groups most similar to Russians are Eastern European (54.8%, a difference of 0.060%), Immigrants (54.7%, a difference of 0.070%), Immigrants from Romania (54.7%, a difference of 0.13%), Immigrants from Japan (54.7%, a difference of 0.16%), and Central American (54.7%, a difference of 0.18%).
| Demographics | Rating | Rank | 2 or more Vehicles in Household |
| Immigrants | Cameroon | 37.3 /100 | #183 | Fair 55.1% |
| Apache | 36.7 /100 | #184 | Fair 55.1% |
| Arabs | 35.9 /100 | #185 | Fair 55.0% |
| Peruvians | 33.7 /100 | #186 | Fair 55.0% |
| Immigrants | Uganda | 33.4 /100 | #187 | Fair 55.0% |
| Marshallese | 30.5 /100 | #188 | Fair 54.9% |
| Eastern Europeans | 27.5 /100 | #189 | Fair 54.8% |
| Russians | 26.3 /100 | #190 | Fair 54.8% |
| Immigrants | Immigrants | 25.0 /100 | #191 | Fair 54.7% |
| Immigrants | Romania | 23.8 /100 | #192 | Fair 54.7% |
| Immigrants | Japan | 23.4 /100 | #193 | Fair 54.7% |
| Central Americans | 23.0 /100 | #194 | Fair 54.7% |
| Iroquois | 22.6 /100 | #195 | Fair 54.7% |
| Immigrants | Poland | 19.3 /100 | #196 | Poor 54.6% |
| Argentineans | 17.5 /100 | #197 | Poor 54.5% |