Ukrainian vs Immigrants from Dominica 3 or more Vehicles in Household
COMPARE
Ukrainian
Immigrants from Dominica
3 or more Vehicles in Household
3 or more Vehicles in Household Comparison
Ukrainians
Immigrants from Dominica
19.6%
3 OR MORE VEHICLES IN HOUSEHOLD
58.9/ 100
METRIC RATING
167th/ 347
METRIC RANK
13.7%
3 OR MORE VEHICLES IN HOUSEHOLD
0.0/ 100
METRIC RATING
331st/ 347
METRIC RANK
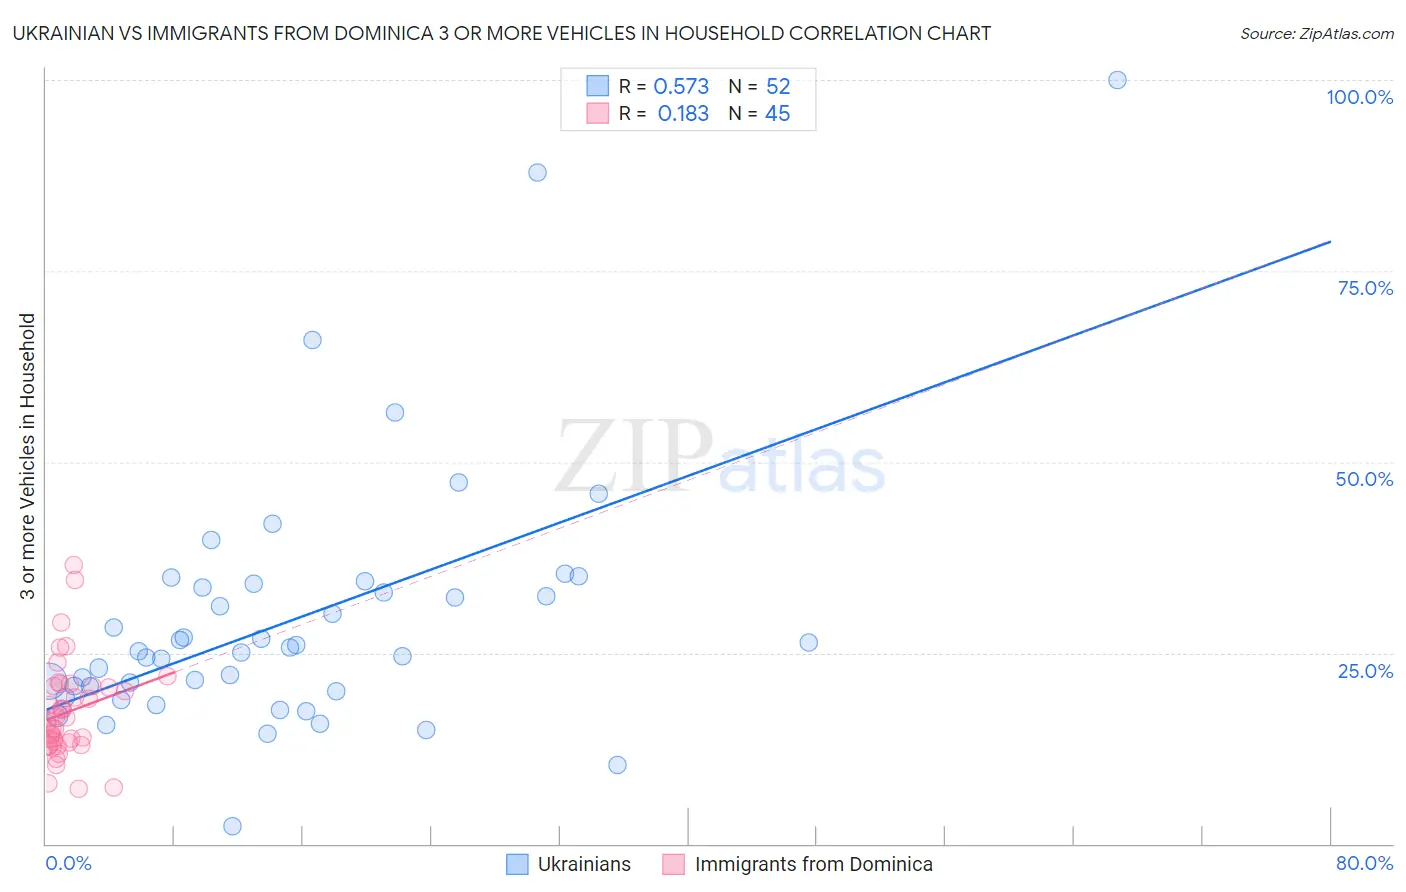
Ukrainian vs Immigrants from Dominica 3 or more Vehicles in Household Correlation Chart
The statistical analysis conducted on geographies consisting of 448,145,260 people shows a substantial positive correlation between the proportion of Ukrainians and percentage of households with 3 or more vehicles available in the United States with a correlation coefficient (R) of 0.573 and weighted average of 19.6%. Similarly, the statistical analysis conducted on geographies consisting of 83,774,399 people shows a poor positive correlation between the proportion of Immigrants from Dominica and percentage of households with 3 or more vehicles available in the United States with a correlation coefficient (R) of 0.183 and weighted average of 13.7%, a difference of 43.1%.
3 or more Vehicles in Household Correlation Summary
| Measurement | Ukrainian | Immigrants from Dominica |
| Minimum | 2.3% | 7.2% |
| Maximum | 100.0% | 36.4% |
| Range | 97.7% | 29.3% |
| Mean | 29.5% | 17.2% |
| Median | 25.5% | 16.0% |
| Interquartile 25% (IQ1) | 20.3% | 13.0% |
| Interquartile 75% (IQ3) | 33.8% | 20.6% |
| Interquartile Range (IQR) | 13.5% | 7.6% |
| Standard Deviation (Sample) | 17.1% | 6.2% |
| Standard Deviation (Population) | 17.0% | 6.2% |
Similar Demographics by 3 or more Vehicles in Household
Demographics Similar to Ukrainians by 3 or more Vehicles in Household
In terms of 3 or more vehicles in household, the demographic groups most similar to Ukrainians are Peruvian (19.6%, a difference of 0.010%), Immigrants from Denmark (19.6%, a difference of 0.10%), Immigrants from Cameroon (19.7%, a difference of 0.16%), Iraqi (19.6%, a difference of 0.22%), and Immigrants from Costa Rica (19.7%, a difference of 0.24%).
| Demographics | Rating | Rank | 3 or more Vehicles in Household |
| Immigrants | Lebanon | 67.6 /100 | #160 | Good 19.8% |
| Immigrants | Guatemala | 65.6 /100 | #161 | Good 19.7% |
| Estonians | 63.2 /100 | #162 | Good 19.7% |
| Chileans | 63.0 /100 | #163 | Good 19.7% |
| Yugoslavians | 62.9 /100 | #164 | Good 19.7% |
| Immigrants | Costa Rica | 61.9 /100 | #165 | Good 19.7% |
| Immigrants | Cameroon | 60.9 /100 | #166 | Good 19.7% |
| Ukrainians | 58.9 /100 | #167 | Average 19.6% |
| Peruvians | 58.8 /100 | #168 | Average 19.6% |
| Immigrants | Denmark | 57.6 /100 | #169 | Average 19.6% |
| Iraqis | 56.0 /100 | #170 | Average 19.6% |
| Immigrants | Western Europe | 53.2 /100 | #171 | Average 19.5% |
| Kiowa | 50.9 /100 | #172 | Average 19.5% |
| Immigrants | Northern Europe | 50.2 /100 | #173 | Average 19.5% |
| Immigrants | South Africa | 50.0 /100 | #174 | Average 19.5% |
Demographics Similar to Immigrants from Dominica by 3 or more Vehicles in Household
In terms of 3 or more vehicles in household, the demographic groups most similar to Immigrants from Dominica are West Indian (13.7%, a difference of 0.21%), Immigrants from Senegal (13.8%, a difference of 0.55%), Trinidadian and Tobagonian (13.6%, a difference of 0.71%), Immigrants from Cabo Verde (13.6%, a difference of 1.1%), and Immigrants from Albania (14.0%, a difference of 1.7%).
| Demographics | Rating | Rank | 3 or more Vehicles in Household |
| Immigrants | Yemen | 0.0 /100 | #324 | Tragic 14.2% |
| Senegalese | 0.0 /100 | #325 | Tragic 14.2% |
| Soviet Union | 0.0 /100 | #326 | Tragic 14.2% |
| Ecuadorians | 0.0 /100 | #327 | Tragic 14.1% |
| Immigrants | Albania | 0.0 /100 | #328 | Tragic 14.0% |
| Immigrants | Senegal | 0.0 /100 | #329 | Tragic 13.8% |
| West Indians | 0.0 /100 | #330 | Tragic 13.7% |
| Immigrants | Dominica | 0.0 /100 | #331 | Tragic 13.7% |
| Trinidadians and Tobagonians | 0.0 /100 | #332 | Tragic 13.6% |
| Immigrants | Cabo Verde | 0.0 /100 | #333 | Tragic 13.6% |
| Immigrants | Ecuador | 0.0 /100 | #334 | Tragic 13.4% |
| Immigrants | Trinidad and Tobago | 0.0 /100 | #335 | Tragic 13.3% |
| Barbadians | 0.0 /100 | #336 | Tragic 12.6% |
| Immigrants | Bangladesh | 0.0 /100 | #337 | Tragic 12.5% |
| Vietnamese | 0.0 /100 | #338 | Tragic 12.5% |