Immigrants from Korea vs Black/African American 1 or more Vehicles in Household
COMPARE
Immigrants from Korea
Black/African American
1 or more Vehicles in Household
1 or more Vehicles in Household Comparison
Immigrants from Korea
Blacks/African Americans
90.5%
1 OR MORE VEHICLES IN HOUSEHOLD
90.5/ 100
METRIC RATING
125th/ 347
METRIC RANK
88.2%
1 OR MORE VEHICLES IN HOUSEHOLD
1.4/ 100
METRIC RATING
249th/ 347
METRIC RANK
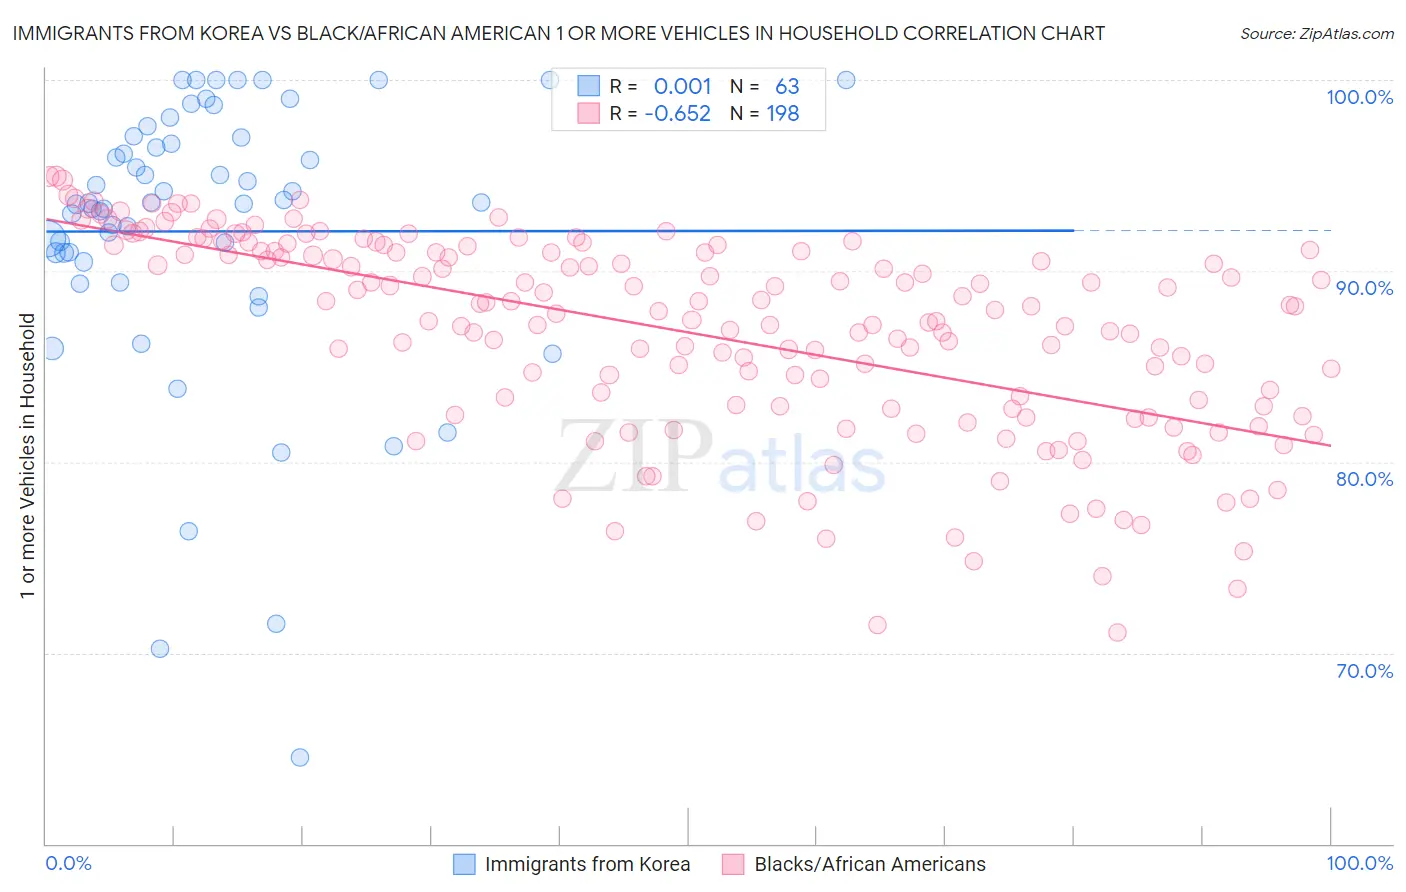
Immigrants from Korea vs Black/African American 1 or more Vehicles in Household Correlation Chart
The statistical analysis conducted on geographies consisting of 416,017,081 people shows no correlation between the proportion of Immigrants from Korea and percentage of households with 1 or more vehicles available in the United States with a correlation coefficient (R) of 0.001 and weighted average of 90.5%. Similarly, the statistical analysis conducted on geographies consisting of 553,575,215 people shows a significant negative correlation between the proportion of Blacks/African Americans and percentage of households with 1 or more vehicles available in the United States with a correlation coefficient (R) of -0.652 and weighted average of 88.2%, a difference of 2.6%.
1 or more Vehicles in Household Correlation Summary
| Measurement | Immigrants from Korea | Black/African American |
| Minimum | 64.5% | 71.0% |
| Maximum | 100.0% | 95.0% |
| Range | 35.5% | 23.9% |
| Mean | 92.1% | 86.8% |
| Median | 93.6% | 87.9% |
| Interquartile 25% (IQ1) | 90.5% | 82.9% |
| Interquartile 75% (IQ3) | 97.0% | 91.1% |
| Interquartile Range (IQR) | 6.5% | 8.1% |
| Standard Deviation (Sample) | 7.5% | 5.3% |
| Standard Deviation (Population) | 7.4% | 5.3% |
Similar Demographics by 1 or more Vehicles in Household
Demographics Similar to Immigrants from Korea by 1 or more Vehicles in Household
In terms of 1 or more vehicles in household, the demographic groups most similar to Immigrants from Korea are Puget Sound Salish (90.5%, a difference of 0.040%), Immigrants from Cameroon (90.4%, a difference of 0.050%), Fijian (90.5%, a difference of 0.060%), Immigrants from the Azores (90.4%, a difference of 0.060%), and Burmese (90.4%, a difference of 0.060%).
| Demographics | Rating | Rank | 1 or more Vehicles in Household |
| Japanese | 93.4 /100 | #118 | Exceptional 90.6% |
| Blackfeet | 92.6 /100 | #119 | Exceptional 90.6% |
| Immigrants | Thailand | 92.3 /100 | #120 | Exceptional 90.6% |
| Icelanders | 92.1 /100 | #121 | Exceptional 90.5% |
| Costa Ricans | 92.0 /100 | #122 | Exceptional 90.5% |
| Fijians | 91.8 /100 | #123 | Exceptional 90.5% |
| Puget Sound Salish | 91.5 /100 | #124 | Exceptional 90.5% |
| Immigrants | Korea | 90.5 /100 | #125 | Exceptional 90.5% |
| Immigrants | Cameroon | 89.4 /100 | #126 | Excellent 90.4% |
| Immigrants | Azores | 89.1 /100 | #127 | Excellent 90.4% |
| Burmese | 89.0 /100 | #128 | Excellent 90.4% |
| Marshallese | 88.9 /100 | #129 | Excellent 90.4% |
| Nicaraguans | 88.8 /100 | #130 | Excellent 90.4% |
| Immigrants | Kenya | 88.5 /100 | #131 | Excellent 90.4% |
| Immigrants | South Africa | 88.1 /100 | #132 | Excellent 90.4% |
Demographics Similar to Blacks/African Americans by 1 or more Vehicles in Household
In terms of 1 or more vehicles in household, the demographic groups most similar to Blacks/African Americans are Egyptian (88.2%, a difference of 0.040%), Immigrants from Nigeria (88.2%, a difference of 0.050%), Immigrants from Serbia (88.2%, a difference of 0.050%), Immigrants from Honduras (88.3%, a difference of 0.090%), and Immigrants from Uruguay (88.1%, a difference of 0.11%).
| Demographics | Rating | Rank | 1 or more Vehicles in Household |
| Turks | 2.5 /100 | #242 | Tragic 88.4% |
| Immigrants | Belgium | 2.1 /100 | #243 | Tragic 88.4% |
| Immigrants | Portugal | 2.0 /100 | #244 | Tragic 88.3% |
| Immigrants | Czechoslovakia | 1.9 /100 | #245 | Tragic 88.3% |
| Menominee | 1.9 /100 | #246 | Tragic 88.3% |
| Immigrants | Honduras | 1.7 /100 | #247 | Tragic 88.3% |
| Immigrants | Nigeria | 1.5 /100 | #248 | Tragic 88.2% |
| Blacks/African Americans | 1.4 /100 | #249 | Tragic 88.2% |
| Egyptians | 1.2 /100 | #250 | Tragic 88.2% |
| Immigrants | Serbia | 1.2 /100 | #251 | Tragic 88.2% |
| Immigrants | Uruguay | 1.1 /100 | #252 | Tragic 88.1% |
| Hondurans | 1.0 /100 | #253 | Tragic 88.1% |
| Haitians | 0.9 /100 | #254 | Tragic 88.1% |
| Immigrants | Latvia | 0.9 /100 | #255 | Tragic 88.1% |
| Colombians | 0.9 /100 | #256 | Tragic 88.0% |