Immigrants from Austria vs Trinidadian and Tobagonian 3 or more Vehicles in Household

COMPARE

Immigrants from Austria
Race
Ancestry
AfghanAfricanAlaska NativeAlaskan AthabascanAlbanianAleutAlsatianAmericanApacheArabArapahoArgentineanArmenianAssyrian/Chaldean/SyriacAustralianAustrianBahamianBangladeshiBarbadianBasqueBelgianBelizeanBermudanBhutaneseBlackfeetBolivianBrazilianBritishBritish West IndianBulgarianBurmeseCajunCambodianCanadianCape VerdeanCarpatho RusynCelticCentral AmericanCentral American IndianCherokeeCheyenneChickasawChileanChineseChippewaChoctawColombianColvilleComancheCosta RicanCreeCreekCroatianCrowCubanCypriotCzechCzechoslovakianDanishDelawareDominicanDutchDutch West IndianEastern EuropeanEcuadorianEgyptianEnglishEstonianEthiopianEuropeanFijianFilipinoFinnishFrenchFrench American IndianFrench CanadianGermanGerman RussianGhanaianGreekGuamanian/ChamorroGuatemalanGuyaneseHaitianHmongHonduranHopiHoumaHungarianIcelanderIndian (Asian)IndonesianInupiatIranianIraqiIrishIroquoisIsraeliItalianJamaicanJapaneseJordanianKenyanKiowaKoreanLaotianLatvianLebaneseLiberianLithuanianLumbeeLuxembourgerMacedonianMalaysianMalteseMarshalleseMenomineeMexicanMexican American IndianMongolianMoroccanNative HawaiianNavajoNepaleseNew ZealanderNicaraguanNigerianNorthern EuropeanNorwegianOkinawanOsageOttawaPaiutePakistaniPalestinianPanamanianParaguayanPennsylvania GermanPeruvianPimaPolishPortuguesePotawatomiPuebloPuerto RicanPuget Sound SalishRomanianRussianSalvadoranSamoanScandinavianScotch-IrishScottishSeminoleSenegaleseSerbianShoshoneSierra LeoneanSiouxSlavicSlovakSloveneSomaliSouth AfricanSouth AmericanSouth American IndianSoviet UnionSpaniardSpanishSpanish AmericanSpanish American IndianSri LankanSubsaharan AfricanSudaneseSwedishSwissSyrianTaiwaneseThaiTlingit-HaidaTohono O'OdhamTonganTsimshianTurkishU.S. Virgin IslanderUgandanUkrainianUruguayanUteVenezuelanVietnameseWelshWest IndianYakamaYaquiYugoslavianYumanYup'ikZimbabwean
Immigration
NonimmigrantsImmigrantsAfghanistanAfricaAlbaniaArgentinaArmeniaAsiaAustraliaAustriaBahamasBangladeshBarbadosBelarusBelgiumBelizeBoliviaBosnia and HerzegovinaBrazilBulgariaBurma/MyanmarCabo VerdeCambodiaCameroonCanadaCaribbeanCentral AmericaChileChinaColombiaCongoCosta RicaCroatiaCubaCzechoslovakiaDenmarkDominicaDominican RepublicEastern AfricaEastern AsiaEastern EuropeEcuadorEgyptEl SalvadorEnglandEritreaEthiopiaEuropeFijiFranceGermanyGhanaGreeceGrenadaGuatemalaGuyanaHaitiHondurasHong KongHungaryIndiaIndonesiaIranIraqIrelandIsraelItalyJamaicaJapanJordanKazakhstanKenyaKoreaKuwaitLaosLatin AmericaLatviaLebanonLiberiaLithuaniaMalaysiaMexicoMicronesiaMiddle AfricaMoldovaMoroccoNepalNetherlandsNicaraguaNigeriaNorth AmericaNorth MacedoniaNorthern AfricaNorthern EuropeNorwayOceaniaPakistanPanamaPeruPhilippinesPolandPortugalRomaniaRussiaSaudi ArabiaScotlandSenegalSerbiaSierra LeoneSingaporeSomaliaSouth AfricaSouth AmericaSouth Central AsiaSouth Eastern AsiaSouthern EuropeSpainSri LankaSt. Vincent and the GrenadinesSudanSwedenSwitzerlandSyriaTaiwanThailandTrinidad and TobagoTurkeyUgandaUkraineUruguayUzbekistanVenezuelaVietnamWest IndiesWestern AfricaWestern AsiaWestern EuropeYemenZaireZimbabweAzores
Trinidadian and Tobagonian
Race
Ancestry
AfghanAfricanAlaska NativeAlaskan AthabascanAlbanianAleutAlsatianAmericanApacheArabArapahoArgentineanArmenianAssyrian/Chaldean/SyriacAustralianAustrianBahamianBangladeshiBarbadianBasqueBelgianBelizeanBermudanBhutaneseBlackfeetBolivianBrazilianBritishBritish West IndianBulgarianBurmeseCajunCambodianCanadianCape VerdeanCarpatho RusynCelticCentral AmericanCentral American IndianCherokeeCheyenneChickasawChileanChineseChippewaChoctawColombianColvilleComancheCosta RicanCreeCreekCroatianCrowCubanCypriotCzechCzechoslovakianDanishDelawareDominicanDutchDutch West IndianEastern EuropeanEcuadorianEgyptianEnglishEstonianEthiopianEuropeanFijianFilipinoFinnishFrenchFrench American IndianFrench CanadianGermanGerman RussianGhanaianGreekGuamanian/ChamorroGuatemalanGuyaneseHaitianHmongHonduranHopiHoumaHungarianIcelanderIndian (Asian)IndonesianInupiatIranianIraqiIrishIroquoisIsraeliItalianJamaicanJapaneseJordanianKenyanKiowaKoreanLaotianLatvianLebaneseLiberianLithuanianLumbeeLuxembourgerMacedonianMalaysianMalteseMarshalleseMenomineeMexicanMexican American IndianMongolianMoroccanNative HawaiianNavajoNepaleseNew ZealanderNicaraguanNigerianNorthern EuropeanNorwegianOkinawanOsageOttawaPaiutePakistaniPalestinianPanamanianParaguayanPennsylvania GermanPeruvianPimaPolishPortuguesePotawatomiPuebloPuerto RicanPuget Sound SalishRomanianRussianSalvadoranSamoanScandinavianScotch-IrishScottishSeminoleSenegaleseSerbianShoshoneSierra LeoneanSiouxSlavicSlovakSloveneSomaliSouth AfricanSouth AmericanSouth American IndianSoviet UnionSpaniardSpanishSpanish AmericanSpanish American IndianSri LankanSubsaharan AfricanSudaneseSwedishSwissSyrianTaiwaneseThaiTlingit-HaidaTohono O'OdhamTonganTrinidadian and TobagonianTsimshianTurkishU.S. Virgin IslanderUgandanUkrainianUruguayanUteVenezuelanVietnameseWelshWest IndianYakamaYaquiYugoslavianYumanYup'ikZimbabwean
Immigration
NonimmigrantsImmigrantsAfghanistanAfricaAlbaniaArgentinaArmeniaAsiaAustraliaBahamasBangladeshBarbadosBelarusBelgiumBelizeBoliviaBosnia and HerzegovinaBrazilBulgariaBurma/MyanmarCabo VerdeCambodiaCameroonCanadaCaribbeanCentral AmericaChileChinaColombiaCongoCosta RicaCroatiaCubaCzechoslovakiaDenmarkDominicaDominican RepublicEastern AfricaEastern AsiaEastern EuropeEcuadorEgyptEl SalvadorEnglandEritreaEthiopiaEuropeFijiFranceGermanyGhanaGreeceGrenadaGuatemalaGuyanaHaitiHondurasHong KongHungaryIndiaIndonesiaIranIraqIrelandIsraelItalyJamaicaJapanJordanKazakhstanKenyaKoreaKuwaitLaosLatin AmericaLatviaLebanonLiberiaLithuaniaMalaysiaMexicoMicronesiaMiddle AfricaMoldovaMoroccoNepalNetherlandsNicaraguaNigeriaNorth AmericaNorth MacedoniaNorthern AfricaNorthern EuropeNorwayOceaniaPakistanPanamaPeruPhilippinesPolandPortugalRomaniaRussiaSaudi ArabiaScotlandSenegalSerbiaSierra LeoneSingaporeSomaliaSouth AfricaSouth AmericaSouth Central AsiaSouth Eastern AsiaSouthern EuropeSpainSri LankaSt. Vincent and the GrenadinesSudanSwedenSwitzerlandSyriaTaiwanThailandTrinidad and TobagoTurkeyUgandaUkraineUruguayUzbekistanVenezuelaVietnamWest IndiesWestern AfricaWestern AsiaWestern EuropeYemenZaireZimbabweAzores
3 or more Vehicles in Household
Income
Poverty
Unemployment
Labor Participation
Family Structure
Vehicle Availability
Education Level
Disability

3 or more Vehicles in Household Comparison

Immigrants from Austria

Trinidadians and Tobagonians

Poor
Tragic
18.9%
3 OR MORE VEHICLES IN HOUSEHOLD
15.4/ 100
METRIC RATING
202nd/ 347
METRIC RANK
13.6%
3 OR MORE VEHICLES IN HOUSEHOLD
0.0/ 100
METRIC RATING
332nd/ 347
METRIC RANK

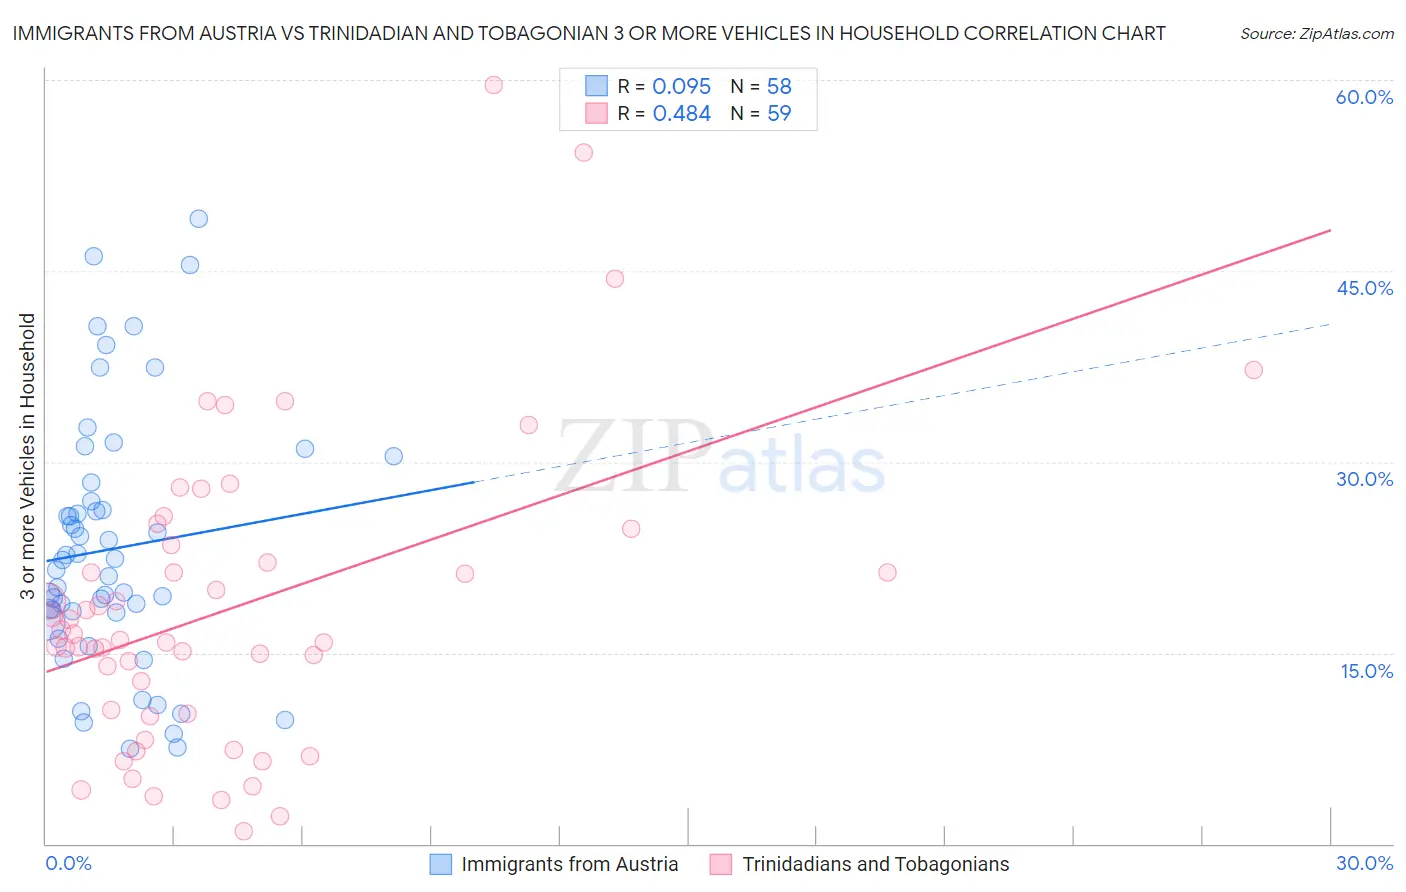
Immigrants from Austria vs Trinidadian and Tobagonian 3 or more Vehicles in Household Correlation Chart

The statistical analysis conducted on geographies consisting of 167,924,568 people shows a slight positive correlation between the proportion of Immigrants from Austria and percentage of households with 3 or more vehicles available in the United States with a correlation coefficient (R) of 0.095 and weighted average of 18.9%. Similarly, the statistical analysis conducted on geographies consisting of 219,661,129 people shows a moderate positive correlation between the proportion of Trinidadians and Tobagonians and percentage of households with 3 or more vehicles available in the United States with a correlation coefficient (R) of 0.484 and weighted average of 13.6%, a difference of 38.6%.
Immigrants from Austria vs Trinidadian and Tobagonian 3 or more Vehicles in Household

3 or more Vehicles in Household Correlation Summary

MeasurementImmigrants from AustriaTrinidadian and Tobagonian
Minimum7.4%1.0%
Maximum49.1%59.6%
Range41.7%58.6%
Mean23.2%18.6%
Median21.9%16.0%
Interquartile 25% (IQ1)18.2%10.2%
Interquartile 75% (IQ3)26.9%23.5%
Interquartile Range (IQR)8.7%13.3%
Standard Deviation (Sample)9.9%11.9%
Standard Deviation (Population)9.8%11.8%

Similar Demographics by 3 or more Vehicles in Household

Demographics Similar to Immigrants from Austria by 3 or more Vehicles in Household

In terms of 3 or more vehicles in household, the demographic groups most similar to Immigrants from Austria are Tohono O'odham (18.9%, a difference of 0.090%), Immigrants from Romania (18.9%, a difference of 0.12%), Russian (18.8%, a difference of 0.19%), Immigrants from Eastern Asia (18.8%, a difference of 0.20%), and Immigrants from Chile (18.8%, a difference of 0.28%).
DemographicsRating | Rank3 or more Vehicles in Household
Immigrants | Moldova
23.6
/100
|
#195
Fair
19.1%
Central American Indians
22.2
/100
|
#196
Fair
19.0%
Immigrants | Japan
22.0
/100
|
#197
Fair
19.0%
Egyptians
19.5
/100
|
#198
Poor
19.0%
Immigrants | Norway
19.0
/100
|
#199
Poor
19.0%
Argentineans
18.2
/100
|
#200
Poor
18.9%
Arabs
17.7
/100
|
#201
Poor
18.9%
Immigrants | Austria
15.4
/100
|
#202
Poor
18.9%
Tohono O'odham
14.8
/100
|
#203
Poor
18.9%
Immigrants | Romania
14.6
/100
|
#204
Poor
18.9%
Russians
14.2
/100
|
#205
Poor
18.8%
Immigrants | Eastern Asia
14.1
/100
|
#206
Poor
18.8%
Immigrants | Chile
13.6
/100
|
#207
Poor
18.8%
Immigrants | Burma/Myanmar
13.6
/100
|
#208
Poor
18.8%
Immigrants | Egypt
13.5
/100
|
#209
Poor
18.8%

Demographics Similar to Trinidadians and Tobagonians by 3 or more Vehicles in Household

In terms of 3 or more vehicles in household, the demographic groups most similar to Trinidadians and Tobagonians are Immigrants from Cabo Verde (13.6%, a difference of 0.36%), Immigrants from Dominica (13.7%, a difference of 0.71%), West Indian (13.7%, a difference of 0.93%), Immigrants from Senegal (13.8%, a difference of 1.3%), and Immigrants from Ecuador (13.4%, a difference of 1.6%).
DemographicsRating | Rank3 or more Vehicles in Household
Senegalese
0.0
/100
|
#325
Tragic
14.2%
Soviet Union
0.0
/100
|
#326
Tragic
14.2%
Ecuadorians
0.0
/100
|
#327
Tragic
14.1%
Immigrants | Albania
0.0
/100
|
#328
Tragic
14.0%
Immigrants | Senegal
0.0
/100
|
#329
Tragic
13.8%
West Indians
0.0
/100
|
#330
Tragic
13.7%
Immigrants | Dominica
0.0
/100
|
#331
Tragic
13.7%
Trinidadians and Tobagonians
0.0
/100
|
#332
Tragic
13.6%
Immigrants | Cabo Verde
0.0
/100
|
#333
Tragic
13.6%
Immigrants | Ecuador
0.0
/100
|
#334
Tragic
13.4%
Immigrants | Trinidad and Tobago
0.0
/100
|
#335
Tragic
13.3%
Barbadians
0.0
/100
|
#336
Tragic
12.6%
Immigrants | Bangladesh
0.0
/100
|
#337
Tragic
12.5%
Vietnamese
0.0
/100
|
#338
Tragic
12.5%
Immigrants | Uzbekistan
0.0
/100
|
#339
Tragic
12.0%