Albanian vs Australian 2 or more Vehicles in Household
COMPARE
Albanian
Australian
2 or more Vehicles in Household
2 or more Vehicles in Household Comparison
Albanians
Australians
49.0%
2 OR MORE VEHICLES IN HOUSEHOLD
0.0/ 100
METRIC RATING
308th/ 347
METRIC RANK
56.7%
2 OR MORE VEHICLES IN HOUSEHOLD
91.8/ 100
METRIC RATING
123rd/ 347
METRIC RANK
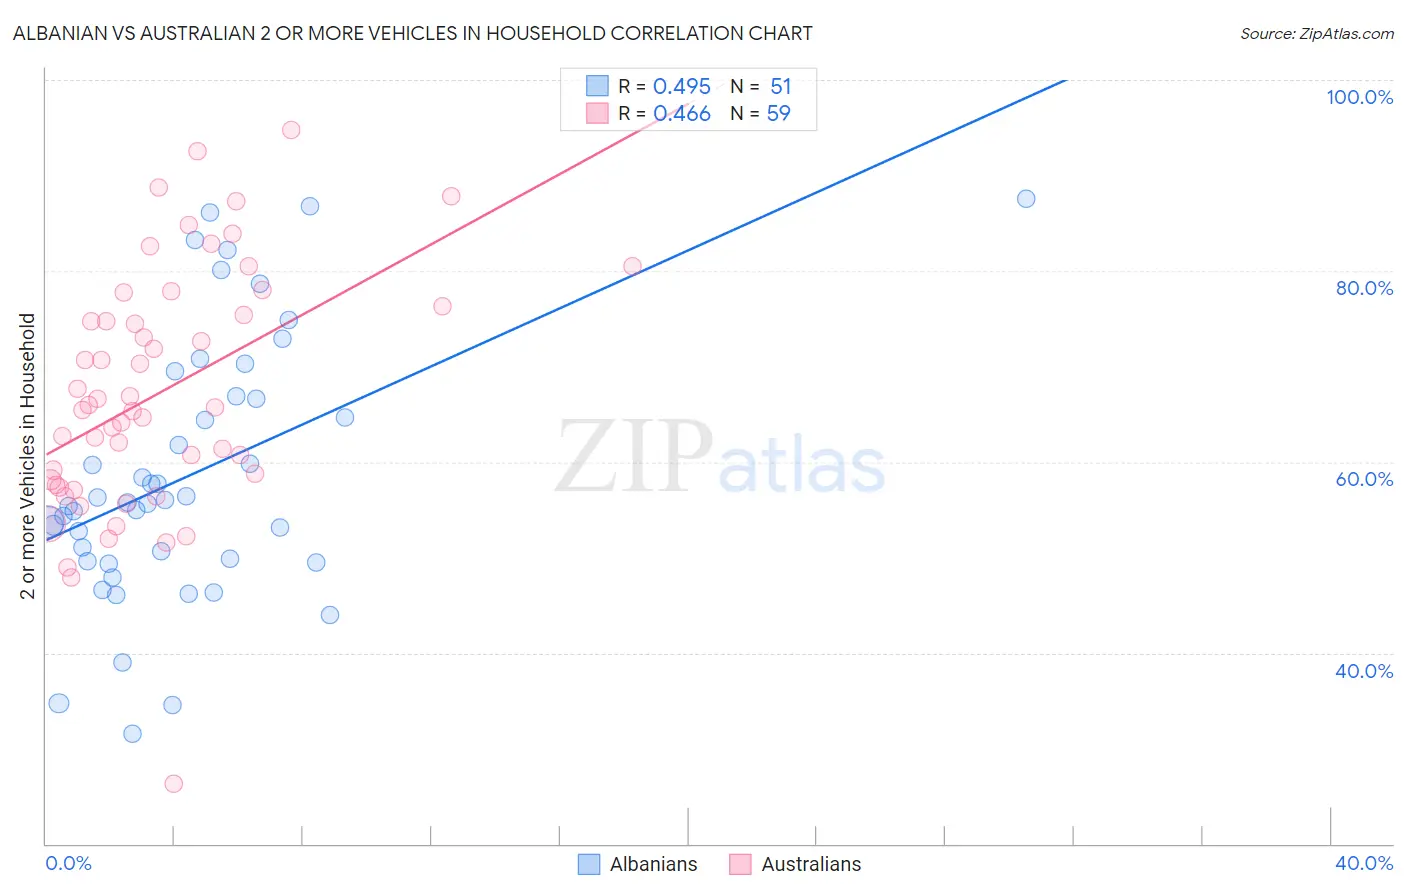
Albanian vs Australian 2 or more Vehicles in Household Correlation Chart
The statistical analysis conducted on geographies consisting of 193,189,951 people shows a moderate positive correlation between the proportion of Albanians and percentage of households with 2 or more vehicles available in the United States with a correlation coefficient (R) of 0.495 and weighted average of 49.0%. Similarly, the statistical analysis conducted on geographies consisting of 223,999,190 people shows a moderate positive correlation between the proportion of Australians and percentage of households with 2 or more vehicles available in the United States with a correlation coefficient (R) of 0.466 and weighted average of 56.7%, a difference of 15.7%.
2 or more Vehicles in Household Correlation Summary
| Measurement | Albanian | Australian |
| Minimum | 31.6% | 26.3% |
| Maximum | 87.5% | 94.7% |
| Range | 55.9% | 68.4% |
| Mean | 58.6% | 67.3% |
| Median | 55.7% | 65.7% |
| Interquartile 25% (IQ1) | 49.6% | 57.6% |
| Interquartile 75% (IQ3) | 66.8% | 76.3% |
| Interquartile Range (IQR) | 17.2% | 18.7% |
| Standard Deviation (Sample) | 13.7% | 12.9% |
| Standard Deviation (Population) | 13.5% | 12.8% |
Similar Demographics by 2 or more Vehicles in Household
Demographics Similar to Albanians by 2 or more Vehicles in Household
In terms of 2 or more vehicles in household, the demographic groups most similar to Albanians are Hopi (49.0%, a difference of 0.070%), Moroccan (48.8%, a difference of 0.35%), Immigrants from Israel (49.2%, a difference of 0.50%), Immigrants from Western Africa (49.4%, a difference of 0.76%), and Immigrants from Belize (49.9%, a difference of 1.8%).
| Demographics | Rating | Rank | 2 or more Vehicles in Household |
| Immigrants | Greece | 0.0 /100 | #301 | Tragic 50.2% |
| Immigrants | South America | 0.0 /100 | #302 | Tragic 50.2% |
| Tohono O'odham | 0.0 /100 | #303 | Tragic 50.0% |
| Immigrants | Belize | 0.0 /100 | #304 | Tragic 49.9% |
| Immigrants | Western Africa | 0.0 /100 | #305 | Tragic 49.4% |
| Immigrants | Israel | 0.0 /100 | #306 | Tragic 49.2% |
| Hopi | 0.0 /100 | #307 | Tragic 49.0% |
| Albanians | 0.0 /100 | #308 | Tragic 49.0% |
| Moroccans | 0.0 /100 | #309 | Tragic 48.8% |
| Ghanaians | 0.0 /100 | #310 | Tragic 48.0% |
| Immigrants | Belarus | 0.0 /100 | #311 | Tragic 47.9% |
| Haitians | 0.0 /100 | #312 | Tragic 47.6% |
| U.S. Virgin Islanders | 0.0 /100 | #313 | Tragic 47.5% |
| Immigrants | Ghana | 0.0 /100 | #314 | Tragic 47.4% |
| Puerto Ricans | 0.0 /100 | #315 | Tragic 47.1% |
Demographics Similar to Australians by 2 or more Vehicles in Household
In terms of 2 or more vehicles in household, the demographic groups most similar to Australians are New Zealander (56.7%, a difference of 0.0%), Tsimshian (56.7%, a difference of 0.030%), Immigrants from South Africa (56.7%, a difference of 0.090%), Estonian (56.6%, a difference of 0.11%), and Immigrants from Thailand (56.6%, a difference of 0.14%).
| Demographics | Rating | Rank | 2 or more Vehicles in Household |
| Immigrants | Jordan | 96.6 /100 | #116 | Exceptional 57.2% |
| Iraqis | 95.8 /100 | #117 | Exceptional 57.1% |
| Asians | 95.1 /100 | #118 | Exceptional 57.0% |
| Natives/Alaskans | 95.0 /100 | #119 | Exceptional 57.0% |
| Costa Ricans | 94.7 /100 | #120 | Exceptional 56.9% |
| Sioux | 93.8 /100 | #121 | Exceptional 56.8% |
| Immigrants | South Africa | 92.5 /100 | #122 | Exceptional 56.7% |
| Australians | 91.8 /100 | #123 | Exceptional 56.7% |
| New Zealanders | 91.8 /100 | #124 | Exceptional 56.7% |
| Tsimshian | 91.6 /100 | #125 | Exceptional 56.7% |
| Estonians | 90.9 /100 | #126 | Exceptional 56.6% |
| Immigrants | Thailand | 90.7 /100 | #127 | Exceptional 56.6% |
| Immigrants | South Central Asia | 90.5 /100 | #128 | Exceptional 56.6% |
| Ute | 90.4 /100 | #129 | Exceptional 56.6% |
| Yugoslavians | 90.0 /100 | #130 | Exceptional 56.6% |