Zip Codes with the Highest Percentage of Population Employed in Life, Physical & Social Science in Chantilly, VA
RELATED REPORTS & OPTIONS
Life, Physical & Social Science
Chantilly
Compare Zip Codes
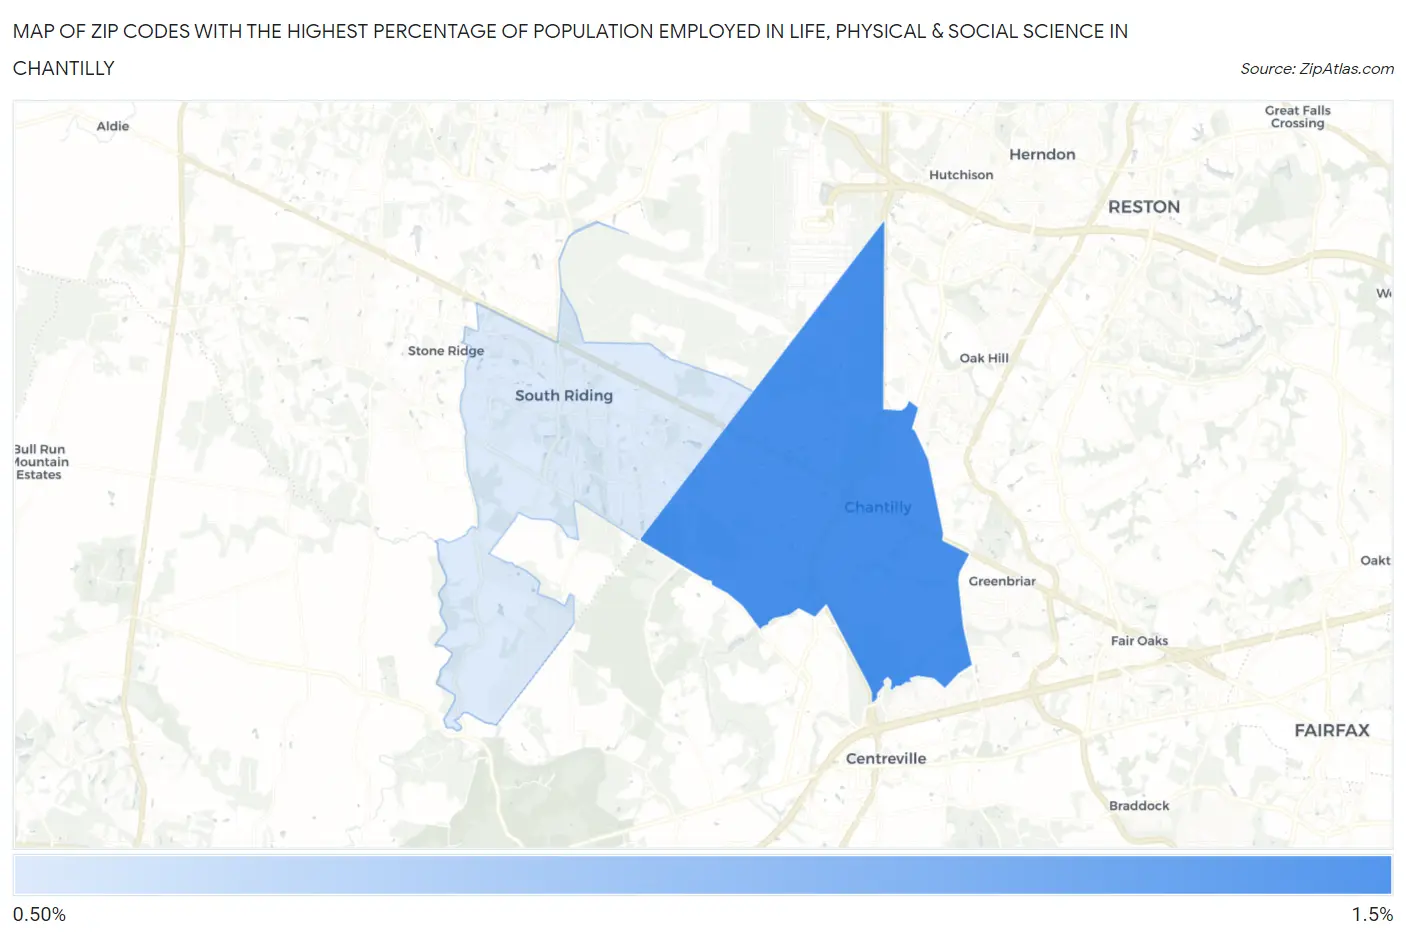
Map of Zip Codes with the Highest Percentage of Population Employed in Life, Physical & Social Science in Chantilly
0.0%
1.5%
Zip Codes with the Highest Percentage of Population Employed in Life, Physical & Social Science in Chantilly, VA
| Zip Code | % Employed | vs State | vs National | |
| 1. | 20151 | 1.3% | 1.3%(+0.058)#191 | 1.1%(+0.244)#6,562 |
| 2. | 20152 | 1.3% | 1.3%(+0.032)#194 | 1.1%(+0.218)#6,753 |
1
Common Questions
What are the Top Zip Codes with the Highest Percentage of Population Employed in Life, Physical & Social Science in Chantilly, VA?
Top Zip Codes with the Highest Percentage of Population Employed in Life, Physical & Social Science in Chantilly, VA are:
What zip code has the Highest Percentage of Population Employed in Life, Physical & Social Science in Chantilly, VA?
20151 has the Highest Percentage of Population Employed in Life, Physical & Social Science in Chantilly, VA with 1.3%.
What is the Percentage of Population Employed in Life, Physical & Social Science in Chantilly, VA?
Percentage of Population Employed in Life, Physical & Social Science in Chantilly is 1.1%.
What is the Percentage of Population Employed in Life, Physical & Social Science in Virginia?
Percentage of Population Employed in Life, Physical & Social Science in Virginia is 1.3%.
What is the Percentage of Population Employed in Life, Physical & Social Science in the United States?
Percentage of Population Employed in Life, Physical & Social Science in the United States is 1.1%.